the Creative Commons Attribution 4.0 License.
the Creative Commons Attribution 4.0 License.
 | 05 Nov 2020
Rivers in the sky, flooding on the ground: the role of atmospheric rivers in inland flooding in central Europe
Viorica Nagavciuc
Bin Guan
The role of large-scale atmospheric circulation and atmospheric rivers (ARs) in producing extreme flooding and heavy rainfall events in the lower part of the Rhine catchment area is examined in this study. Analysis of the largest 10 floods in the lower Rhine, between 1817 and 2015, shows that all these extreme flood peaks have been preceded up to 7 d in advance by intense moisture transport from the tropical North Atlantic basin in the form of narrow bands also known as atmospheric rivers. Most of the ARs associated with these flood events are embedded in the trailing fronts of the extratropical cyclones. The typical large-scale atmospheric circulation leading to heavy rainfall and flooding in the lower Rhine is characterized by a low pressure center south of Greenland, which migrates toward Europe, and a stable high pressure center over the northern part of Africa and the southern part of Europe and projects on the positive phase of the North Atlantic Oscillation. On the days preceding the flood peaks, lower (upper) level convergence (divergence) is observed over the analyzed region, which indicates strong vertical motions and heavy rainfall. Vertically integrated water vapor transport (IVT) exceeds 600 kg m−1 s−1 for the largest floods, marking these as very strong ARs. The results presented in this study offer new insights regarding the importance of moisture transport as a driver of extreme flooding in the lower part of the Rhine catchment area, and we show, for the first time, that ARs are a useful tool for the identification of potentially damaging floods in inland Europe.
- Article
(41566 KB) - Full-text XML
-
Supplement
(10685 KB) - BibTeX
- EndNote


The intensity and frequency of precipitation extremes and floods have increased over the last few decades in many parts of the world (Blöschl et al., 2015; Stadtherr et al., 2016). As a result, an increase in flood hazards and their associated damages have become a major concern both for society and the economy. In terms of economic losses, floods are the most widespread hazard in Europe (Barredo, 2009; Paprotny et al., 2018). Throughout the last few decades, Europe has been affected by numerous heavy rainfall events followed by damaging floods. Among the most costliest and damaging floods in Europe, we have the 1993 and 1995 winter floods in France, Germany, the Netherlands and Belgium (Chbab, 1995; Disse and Engel, 2001; Engel, 1997; Fink et al., 1996); the 2000, 2007 and 2014 floods in the UK (Kelman, 2001; Muchan et al., 2015; Posthumus et al., 2009; Stevens et al., 2016); the 2002 and 2013 damaging floods in the Elbe river catchment area (Ulbrich et al., 2003a, b; Ionita et al., 2015); the 2005 floods in the eastern part of Europe (Barredo, 2007; Ionita, 2015); and the 2010 floods in the central part of Europe (Bissolli et al., 2011), among others. These recent floods, recorded at different parts of the European continent, have shown that coping with floods is not trivial, and for a better management and improvement of flood predictions, it is necessary to improve our understanding of the underlying mechanisms of these extreme events. Taking into account the fact that climate change is expected to lead to an intensification in the hydrological cycle and, in particular, the hydrological extremes (Allan et al., 2014; O'Gorman and Schneider, 2009), it is imperative to properly understand the relationship between heavy rainfall events and floods and the prevailing large-scale atmospheric circulation on scales from planetary to mesoscale in order to be able to provide skillful forecasts of upcoming floods in terms of the time of occurrence, location and magnitude.
Flood risk management decisions and flood forecasting depend strongly on our understanding of the large-scale drivers of hydrological variability (DeFlorio et al., 2019; Guan and Waliser, 2019; Lavers et al., 2014). The timing, magnitude and duration of floods and heavy rainfall events depend on the hydroclimatic variability in different timescales ranging from hourly, daily and seasonal to interannual. This variability is connected to the large-scale moisture transport of the entire atmospheric column, which in turn is controlled by different large-scale teleconnection patterns such as the North Atlantic Oscillation (NAO), the Pacific North American Oscillation (PNA) and the El Niño–Southern Oscillation (ENSO; Guan et al., 2013; Paltan et al., 2017). Apart from these predefined large-scale teleconnection patterns, regional and local climates also modulate the water vapor transport in the form of transient, narrow and elongated corridors, also known as atmospheric rivers (ARs; Zhu and Newell 1994; Guan and Waliser, 2019; Ralph et al., 2018; Shields et al., 2018). ARs are responsible for ∼90 % of the poleward vertically integrated water vapor transport outside of the tropics, and at any time, there are at least three to five ARs around the globe (Guan and Waliser, 2015; Zhu and Newell, 1998). Their horizontal dimensions can be up to several thousands of kilometers long, with an average width of ∼500 km (Ralph et al., 2004; Ralph and Dettinger, 2011). The moisture associated with ARs can be visible on satellite images in the free troposphere and in the boundary level (Neiman et al., 2008; Ralph et al., 2004), and their structure results from either local convergence along the cold front of extratropical cyclones (Dacre et al., 2015) or from transport from lower latitudes (Zhu and Newell, 1998).
Different studies have linked the occurrence of ARs to extreme rainfall and flooding in different parts of the world, extending from arid and semiarid areas to the polar regions (Ralph et al., 2019). For example, in California, ARs contribute 30 %–50 % of the river flow (Dettinger, 2011), and they supply on average ∼30 % of the total precipitation on the western coast of the US and Europe (Lavers and Villarini, 2013a). On the other hand, heavy floods in the California and Washington states have been linked to AR occurrence (Neiman et al., 2011; Ralph et al., 2006), and similar results were later found in other west coast areas. In Europe, ARs have been found to significantly influence heavy rainfall events over the Iberian Peninsula (Brands et al., 2017; Eiras-Barca et al., 2016, 2018; Ramos et al., 2015), UK (Lavers et al., 2011; Lavers and Villarini, 2015), Norway (Benedict et al., 2019; Hegdahl et al., 2020) and France (Lu et al., 2013). Lavers et al. (2011) showed that the UK's extreme floods and precipitation are mainly driven by ARs, while Lu et al. (2013) related the extreme floods in the western part of France in January 1995 with tropical moisture exports in the form of ARs. Studies of ARs impacting the coastal European region found a significant relationship between winter ARs and NAO (Lavers and Villarini, 2013b). In the southern part of Europe, ARs are concurrent with a positive NAO phase, whereas over the northern part of Europe, ARs are concurrent with a negative phase of NAO.
All the aforementioned studies, in Europe, were conducted over coastal regions where ARs make landfall, thus contributing substantially to extreme rainfall events and floods over these regions. Nevertheless, for the European mainland there are limited studies which show a direct link between AR occurrence and heavy rainfall events and flooding. For example, Paltan et al. (2017) showed that 50 % of the Rhine's floods can be related to ARs, but their study took into account all floods peaks which are exceeded 10 % of the time over the period 1979–2010. In this study, we want to explore the relationship between the 10 highest flood peaks (in terms of their magnitude) in the lower part of the Rhine catchment area and intense water vapor transport and the large-scale atmospheric circulation over the last 180 years, including the lead–lag relationship between the timing of flood peaks and the occurrence of AR conditions, which have not been the focus of previous studies on AR-related flooding.
The objectives of this study are to (i) analyze, from a hydrological point of view (e.g., daily hydrographs and flood magnitude), three of the most damaging winter floods (1925–1926, 1993 and 1995) in the lower part of the Rhine catchment area, (ii) analyze the large-scale circulation preceding these extreme flood events, (iii) explore if/how the occurrence of ARs explains extreme flood peaks, and (iv) use cohesive long-term data sets (e.g., reanalysis products) to analyze the common drivers of 10 of the highest flood peaks (in terms of magnitude) recorded at the Köln gauging station situated on the lower Rhine.
The outline of the study is as follows. The basic features of the Rhine catchment area are described in Sect. 2, while the data and methods are described in Sect. 3. The hydrometeorological situation in relation to the most damaging floods is given in Sect. 4. The discussion and the main conclusions of the paper are presented in Sect. 5.
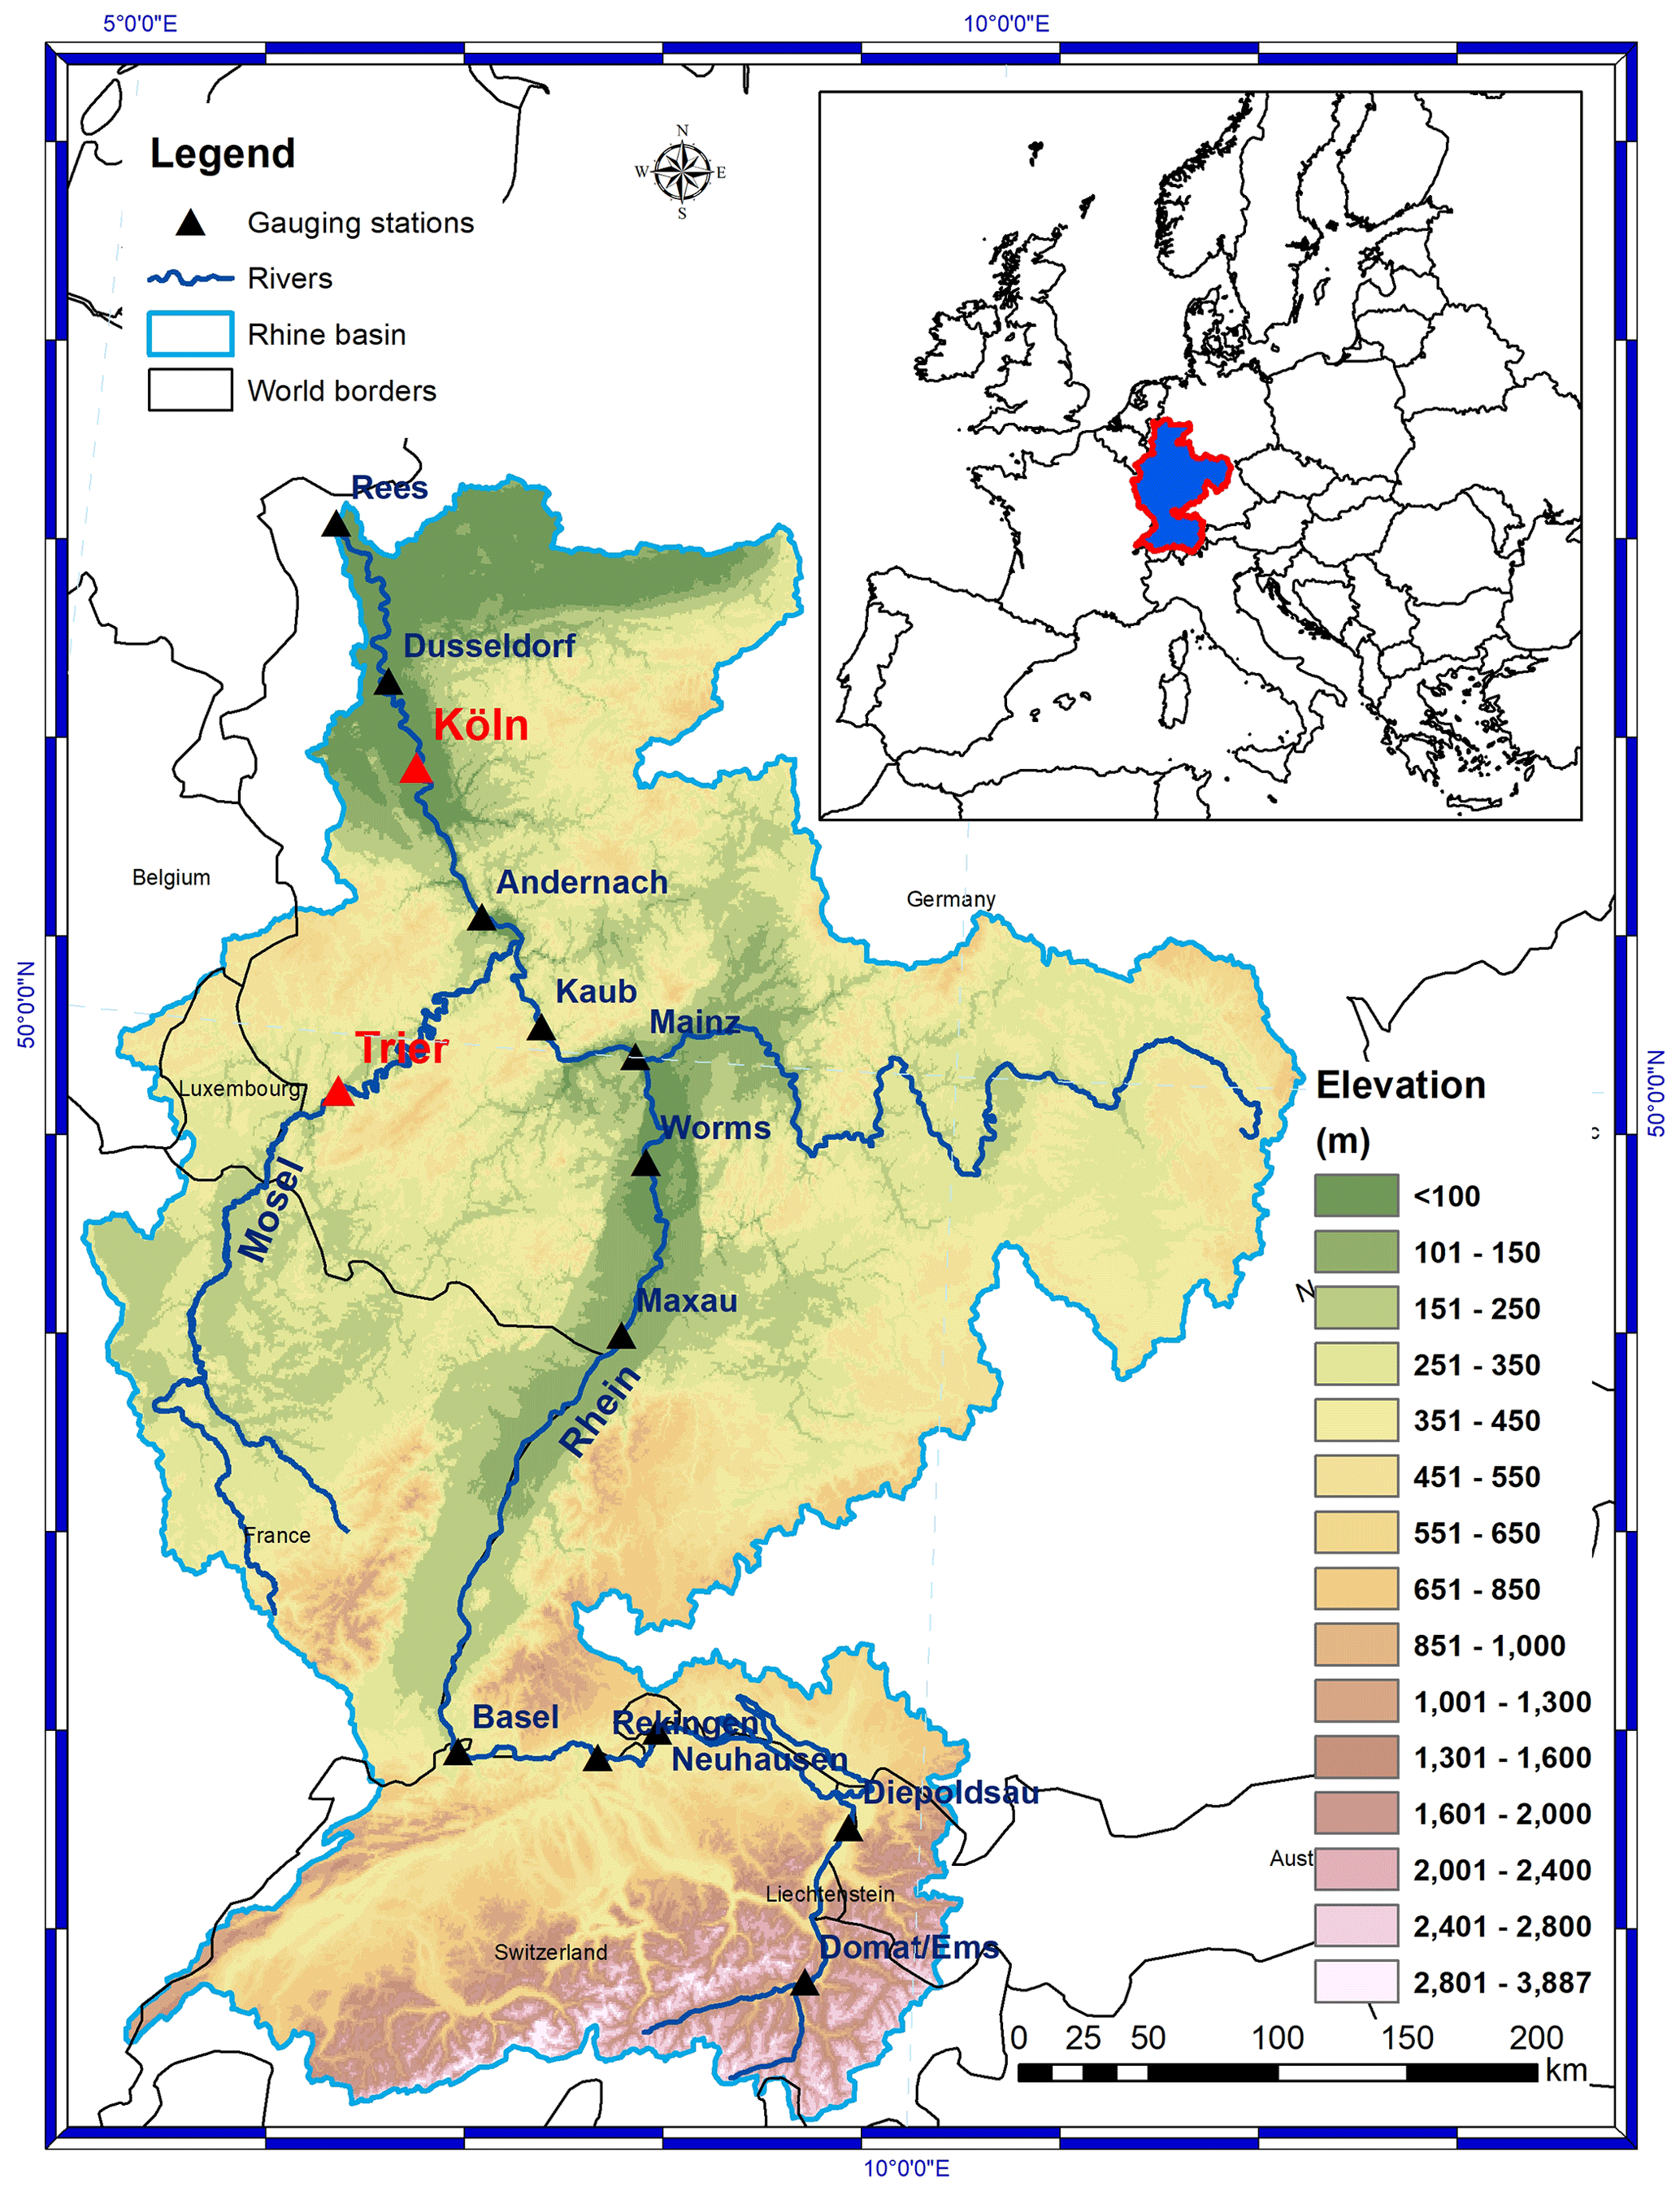
Figure 1The Rhine catchment area (black contour) and the location of the Trier meteorological station and the Köln gauging station. The digital elevation model data were extracted from the WorldClim 2 data set (Fick and Hijmans, 2017).
2.1 Catchment area
The Rhine ranks ninth among the Eurasian rivers, with a total length of ∼1250 km, a drainage area of ∼185 260 km2 and an average streamflow of 2300 m3 s−1. The catchment area of the Rhine covers nine countries (Germany, Austria, Switzerland, Belgium, Luxembourg, Lichtenstein, Italy, France and the Netherlands; Fig. 1), while the river itself provides services for inland waterway transportation, drinking water, power generation, agriculture, tourism and urban sanitation (Uehlinger et al., 2009). The Rhine is Europe's most important inland waterway, transporting almost 200 million tonnes per year (approximately two-thirds of the European inland waterway volume; Meißner et al., 2017).
The Rhine catchment area comprises different subbasins (e.g., the alpine Rhine, the high Rhine, the upper Rhine, the middle Rhine and the lower Rhine) influenced by different meteorological conditions. As such, the Rhine has a complex runoff regime, with a summer maximum in the alpine, high and upper Rhine,and a winter maximum in the middle and lower Rhine, influenced by its tributaries, the Main and Moselle rivers (Belz, 2010; Pfeiffer and Ionita, 2017). Extreme flood events in the Rhine region can be divided into the following two classes according to their hydrometeorological causes (Belz et al., 2007): (i) winter and spring floods, triggered by warm air intrusions and snowmelt, occurring mostly in the flatlands (e.g., lower Rhine), and (ii) summer floods, triggered by heavy rainfall and low snowmelt in the alpine region. Documentary and historical records since 1000 AD do not list a single flood event which occurred simultaneously in all subbasins of the Rhine (Disse and Engle, 2001).
The major tributaries of the Rhine on the German side are the Neckar, Main and Moselle rivers. All the tributaries are characterized by a pluvial regime, with the mean runoff reaching the highest values in the winter months and the minimum in August–September. Throughout the 20th century, flood peaks show an upward trend in the alpine and pre-alpine Rhine basin (Belz et al., 2007). In the middle and lower Rhine, extreme floods, due to enhanced rainfall sometimes combined with snowmelt, have increased in intensity, especially during the winter months, in the second part of the 20th century (Belz et al., 2007). This increasing trend in the flood peaks in the middle and lower Rhine basin is largely due to the contribution from the Moselle River, where flood waves with peaks up to 4200 m3 s−1 can occur in the winter months (annual mean average discharge at Cochem gauging station is 313 m3 s−1). Min (2006) showed that the basin-averaged precipitation for the Moselle basin has shown a significant increase since 1980, accompanied by a tendency toward more frequent, intense precipitation events (e.g., exceeding 10 mm d−1) in the winter half-year (November–April). The overall increase in winter precipitation in the catchments of the lower Rhine tributaries has caused an increase of ∼10 % of the mean discharge at the Lobith gauging station during the 20th century.
Flooding along the Rhine basin is a natural phenomenon. Nevertheless, flood risk, especially in the upper Rhine, has been highly increased by river training. The upper Rhine was subjected to heavy river training from the beginning of the 19th century until 1977. As a result of this river training, the flood risk downstream has increased considerably due to a shortening of the river course, a reduction in potential floodplains by constructing dikes directly on the summer river bed, an increased velocity of waves and the overlapping with flood waves from the tributaries. For the Köln gauging station, Pinter et al. (2006) showed that river engineering had an insignificant effect on flood magnification throughout the 20th century. The main driver of flood magnification at the Köln gauging station has been found to be an increase in the precipitation over the Rhine basin. A small contribution to the flood magnification in the lower Rhine also comes from land use and the industrialization of German agriculture.
2.2 Data
The main variable analyzed in this study is the daily streamflow data at the Köln gauging station situated on the lower part of the Rhine catchment area (Fig. 1). The Köln gauging station is one of the most important gauges along the Rhine; at this point one of the most populated areas over Rhine basin starts, namely North Rhine–Westphalia. In addition, before the Köln gauging station there is a confluence point for three of the main tributaries of the lower Rhine, namely the Lahn, Moselle and Sieg rivers. We chose this gauging station for the current analysis due to the availability of daily streamflow data (1817–2019), the importance of the lower Rhine, both from an economical and societal point of view, and because the river training effects are not so significant in this part of Rhine's catchment area. The daily streamflow data were provided by the German Hydrological Institute (https://bfg.de/en/, last access: 20 January 2020).
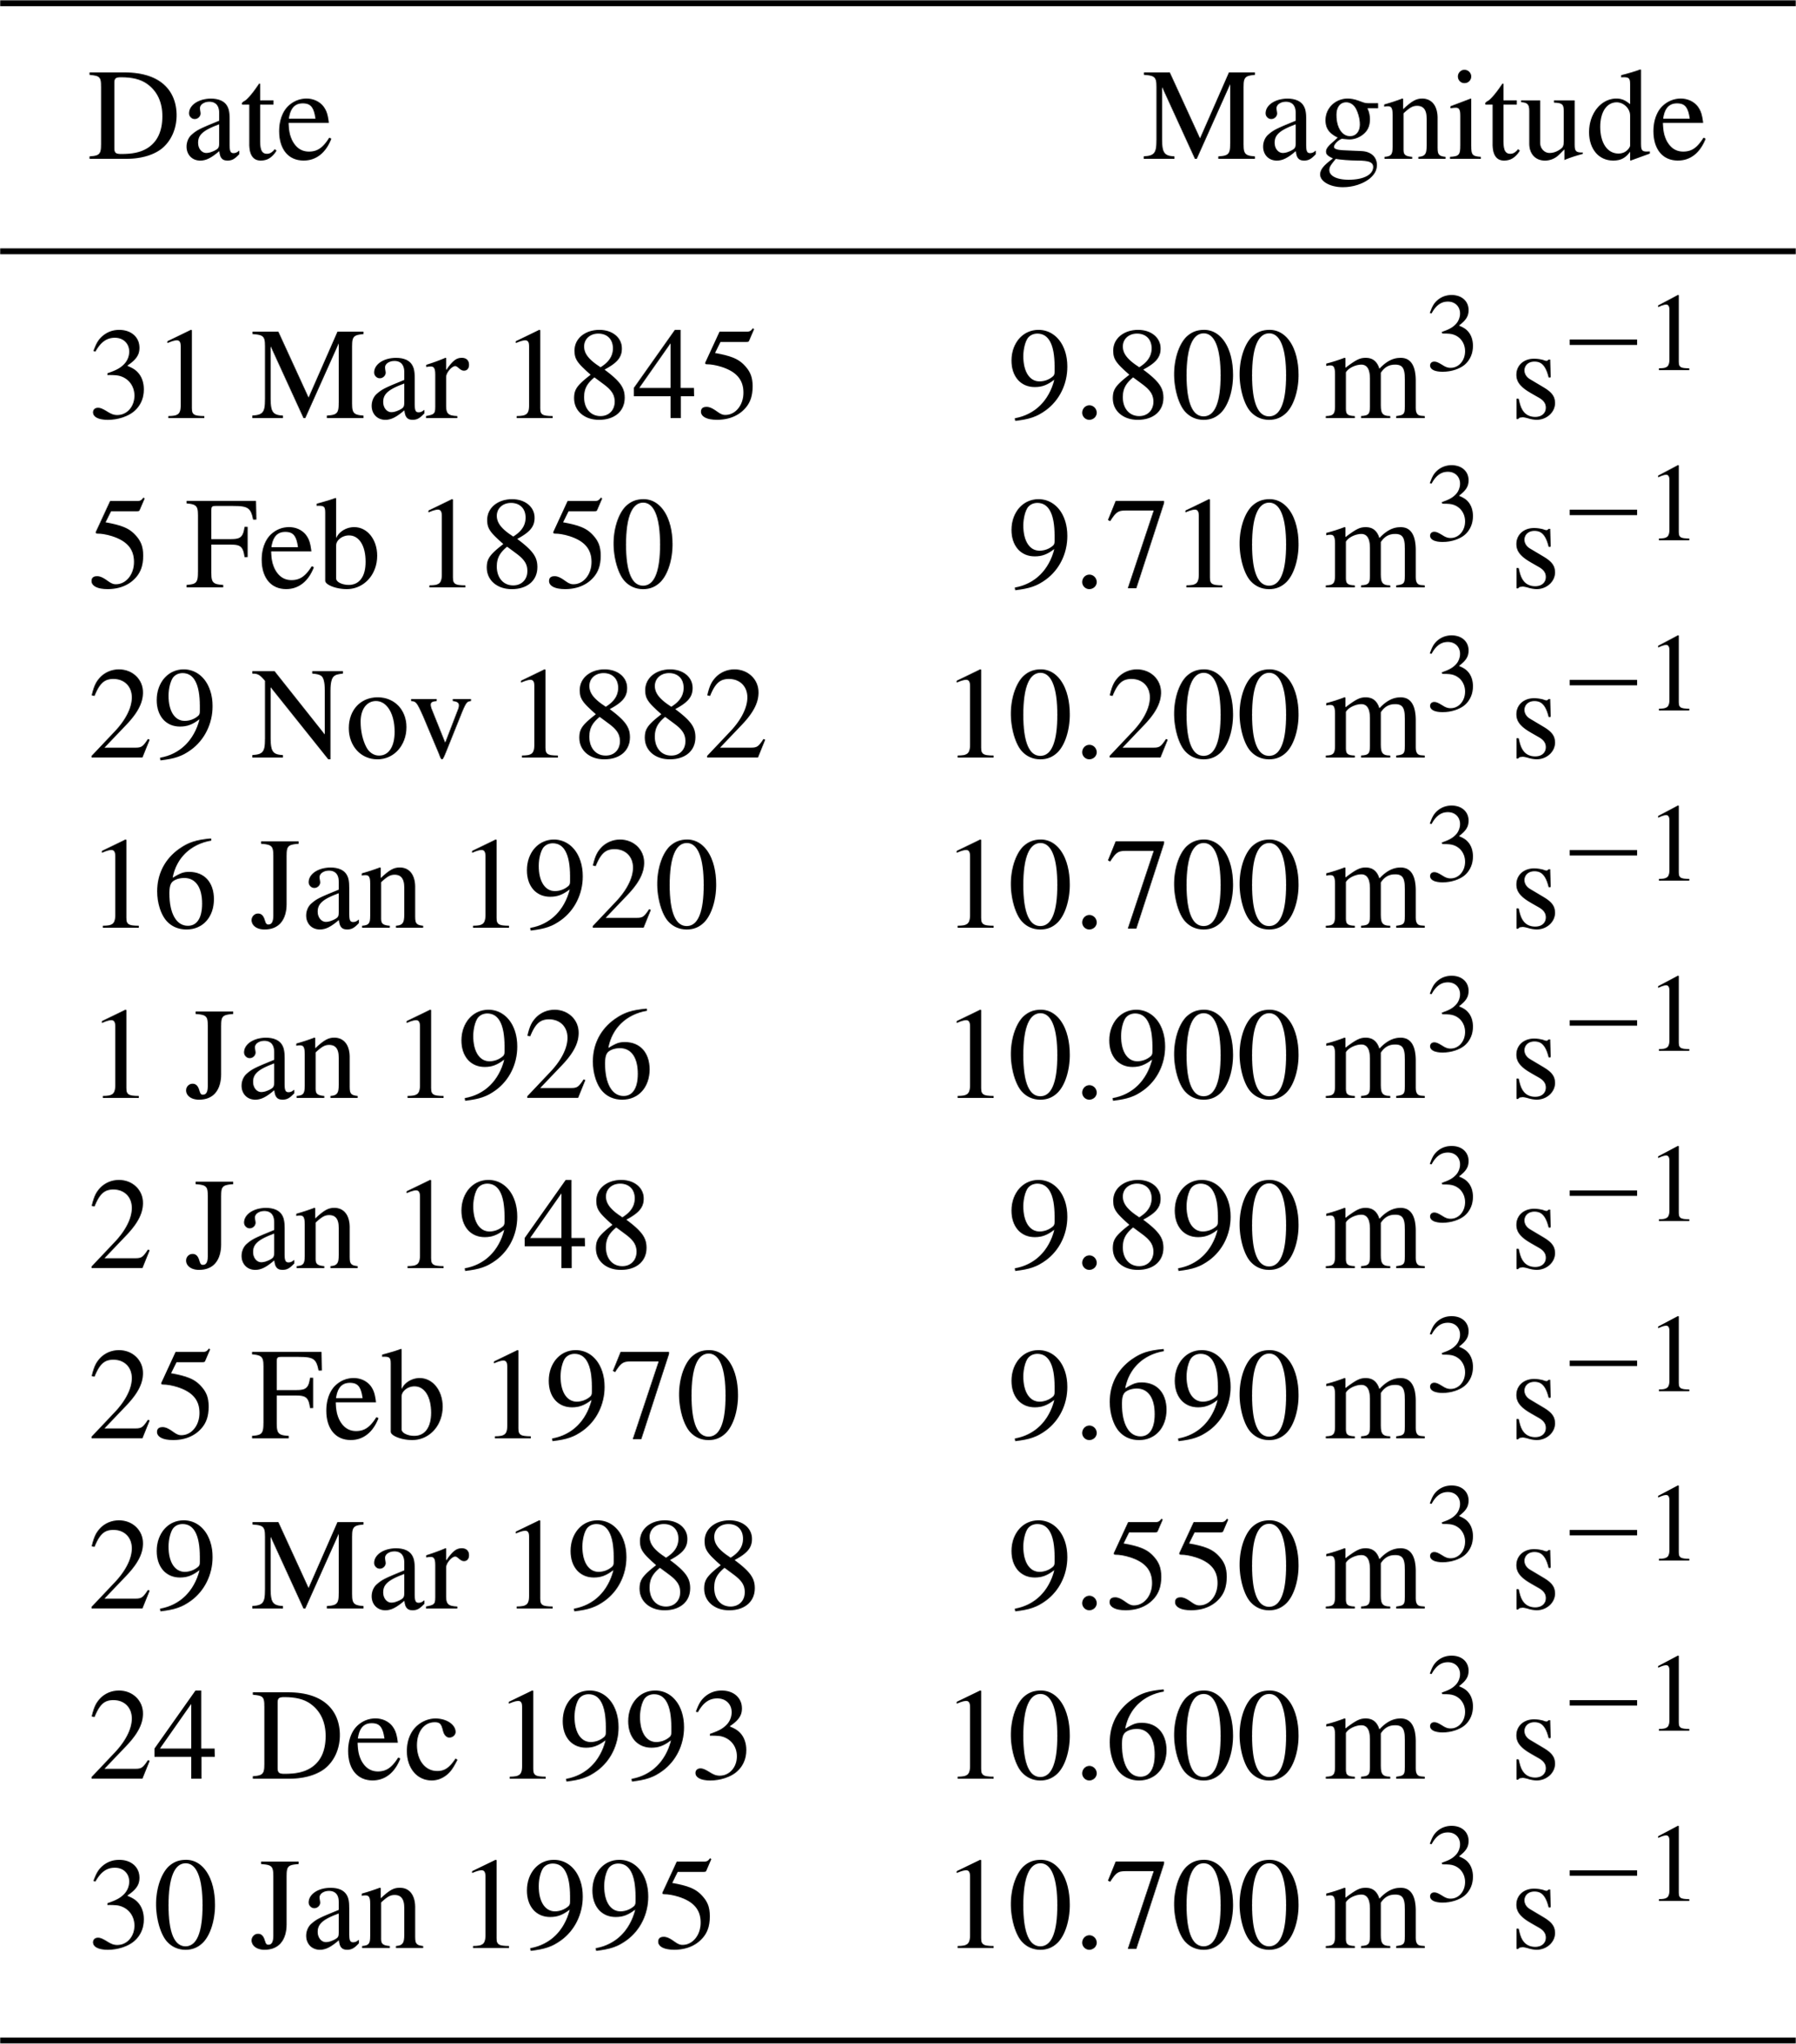
To identify the flood events, we extracted, from the daily streamflow time series at the Köln gauging station, the top 10 daily streamflow values over the period 1817–2019. We have compared our flood events with the ones from the information platform of the German Hydrological Institute (http://undine.bafg.de/rhein/rheingebiet.html, last access: 27 January 2020). We have restricted our analysis to just over the winter months (November–March) due to the fact that summer floods tend to be produced by different mechanisms (e.g., convective precipitation). In the lower Rhine, more than 80 % of the flooding events occur during the period November–March (Fig. S1 in the Supplement). For the top 10 winter flood events over the lower Rhine basin (Table 1), we have also extracted daily precipitation and daily mean air temperature at the Trier weather station, which is situated on the main course of the Moselle River, one of the most important tributaries of the Rhine. We choose the Trier station due to its length (1907–2019) and due to the fact that most of the floods in the lower basin of the Rhine are mainly influenced by the input from the Moselle River (Fig. 1). The daily precipitation and daily mean air temperature data were extracted from the ftp server of the German Weather Service (ftp://opendata.dwd.de/climate_environment/CDC/, last access: 22 January 2020).
Table 1Date of occurrence and magnitude of the 10 flood events recorded at the Köln gauging station used in this study.
For the large-scale atmospheric circulation, we have used the daily sea level pressure (SLP), zonal and meridional wind at 500 mb level, geopotential height at 500 mb level, potential vorticity, air temperature at 850 mb level, specific humidity and surface pressure data from the 20th Century Reanalysis V3 (Slivinski et al., 2019). The 20th Century Reanalysis V3 uses a state-of-the-art data assimilation system and surface pressure observations; it has 64 vertical levels and 80 ensemble members. The output of this reanalysis product is a 4D global atmospheric data set spanning the period 1836 to 2015. The resolution of the data set is (Slivinski et al., 2019).
The vertically integrated water vapor transport (IVT; Peixoto and Oort, 1992) is calculated through zonal wind (u), meridional wind (v) and specific humidity (q) from the 20th Century Reanalysis v3 data set. The IVT vectors for latitude (ϕ) and longitude (λ) are defined as follows:
where the zonal (Qλ) and meridional (Qϕ) components of Q are given by the following:
where u is the zonal wind component, v is the meridional wind component, q is the specific humidity and g is the gravitational constant. The ARs are identified using the vertically integrated water vapor transport (IVT) between the 1000 and 300 hPa levels. The methodology used in this study to define an AR is based on the global detection algorithm of Guan and Waliser (2015). We consider something to be an AR if the IVT exceeds an intensity threshold (e.g., the local 85th percentile), if it has a minimum value of 100 kg m−1 s−1 and if it has a length of at least 2000 km, among other considerations detailed in Guan and Waliser (2015). Performance of this AR detection algorithm has been validated against dropsonde observations over the northeastern Pacific (Guan et al., 2017), and results based on this global algorithm were found to agree well with algorithms independently developed for three specific regions (Guan and Waliser 2015).
Using the 20th Century Reanalysis v3 data set, we also computed the integrated water vapor (IWV) which is defined as follows:
To analyze the spatial distribution of the daily precipitation amount during the days prior to the flood peaks, we have used two gridded data sets, namely the daily precipitation data from the E-OBS v20e data set (Cornes et al., 2018), with a spatial resolution of , and the REGNIE daily precipitation data set (Rauthe et al., 2013), with a spatial resolution of 1 km × 1 km. The E-OBS data set covers the whole European region, while the REGNIE data set is restricted to Germany.
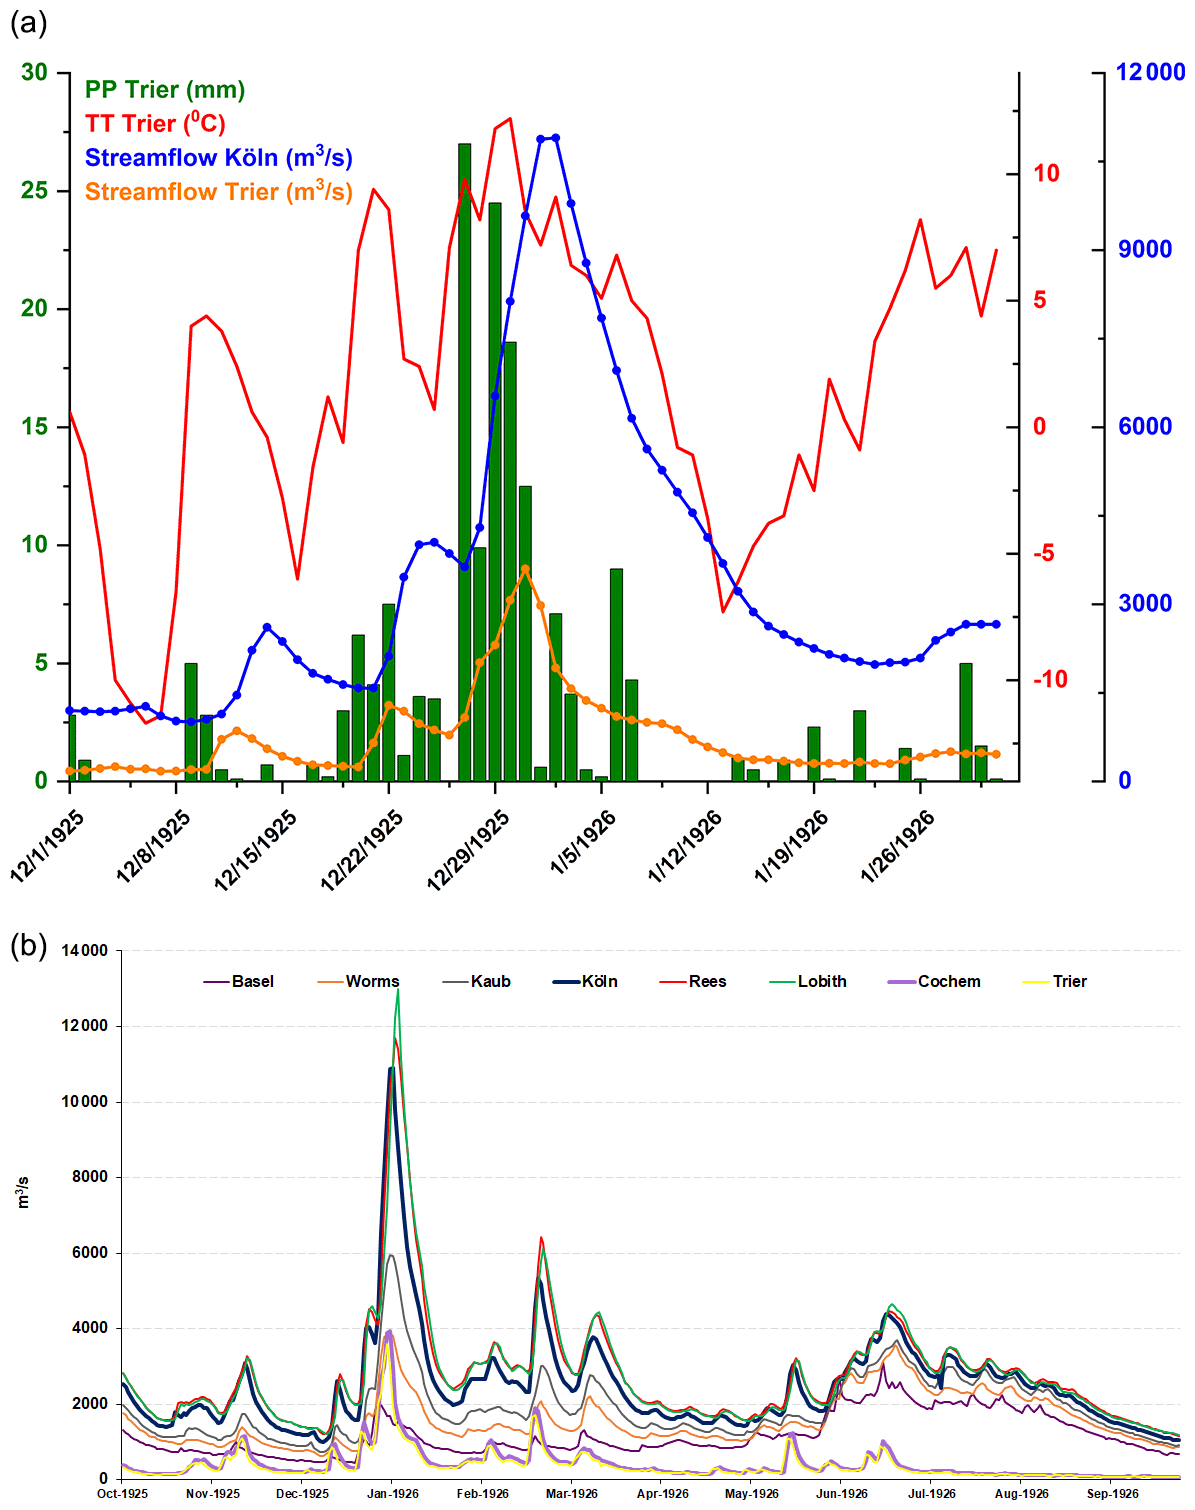
Figure 2(a) Daily precipitation (green bars) at the Trier meteorological station, daily mean temperature (red line), daily streamflow at the Köln gauging station (blue line) and daily streamflow at the Trier gauging station (orange line) for the period 1 December 1925–31 January 1926. (b) Daily streamflow at different gauging stations along the Rhine (Basel, Worms, Kaub, Köln, Rees and Lobith) and the Moselle rivers (Trier and Cochem) for the period 1 October 1925–30 September 1926.
3.1 Hydrometeorological situation – 1925–1926
The last week of November 1925 was characterized by heavy snowfall in the western part of Germany and the lower areas of the Rhine basin (Soldan, 1927). After a short period of dry and cold days, from the beginning of the second week of December until mid-December it began to thaw. In parts of the Rhine area, heavy snowfall together with extremely low temperatures were recorded over the period 12–18 December 1925 (Figs. S2 and S3). After this period of heavy snowfall and low temperatures, warm and humid air masses penetrated from the southwest on 26 December. The warm and humid air slid onto the cold air between the mountain areas of the Rhine region and caused extremely high rainfall in large parts of the Rhine catchment area between 27 and 29 December 1925 (Fig. S4). From 27 to 31 December, heavy rainfall affected large parts of the Moselle catchment area and the lower part of the Rhine basin. The highest rainfall amount, at Trier station, was recorded on 27 December (27 mm; Fig. 2a). The cumulated rainfall amount over the period 27–31 December was 92.5 mm. Overall, in December 1925 the total rainfall amount over the lower part of Rhine basin was, on average, almost double compared to the climatological mean (Fig. S5a). These extreme rainfall events in the last week of December 1925 were driven by a dipole-like structure in the SLP filled with a deep low pressure system (960 hPa) centered south of Greenland and a high pressure system (1025 hPa) centered over the northern part of Africa (Fig. 3a). This dipole-like structure started to develop on 25 December and persisted until 31 December, when it slightly shifted its center (Fig. 3). This circulation structure led to a pronounced southwesterly airflow over France and the western part of Germany, which is associated with a narrow band of atmospheric moisture extending from the US coast up to the central part of Europe. The narrow band of moisture was particularly active on 27–30 December (Fig. 3c–f), leading to heavy rainfall over northern part of France and the western part of Germany (Fig. S4). The ascent of the band of moisture in the warm sector of the extratropical cyclone and the rising air over the mountain areas in the Moselle catchment area (southern Vosges Mountains in France and Hunsrück and Eifel Mountains in Germany) led to heavy rainfall and, thus, to high flood peaks some days later in the lower part of the Rhine basin. At the Trier gauging station, the flood peak reached its third highest value in the observational record (1817–2020, 3600 m3 s−1) on 31 December 1925. During the days with extreme rainfall and flood peaks at Trier station (27–30 December 1925; Fig. S4) the maximum of the water vapor flux within the plume exceeded 700 kg s−1 m−1 (Fig. 3; Table 2), while at day −1 and day 0 of the flood peak at the Köln gauging station, the vapor flux weakened to ∼400 kg s−1 m−1. The arrival of the ARs toward the western part of Europe coincides with a sharp increase in the temperature over the western part of Europe (Fig. S6), a strong advection of moisture and heavy rainfall over our analyzed region.
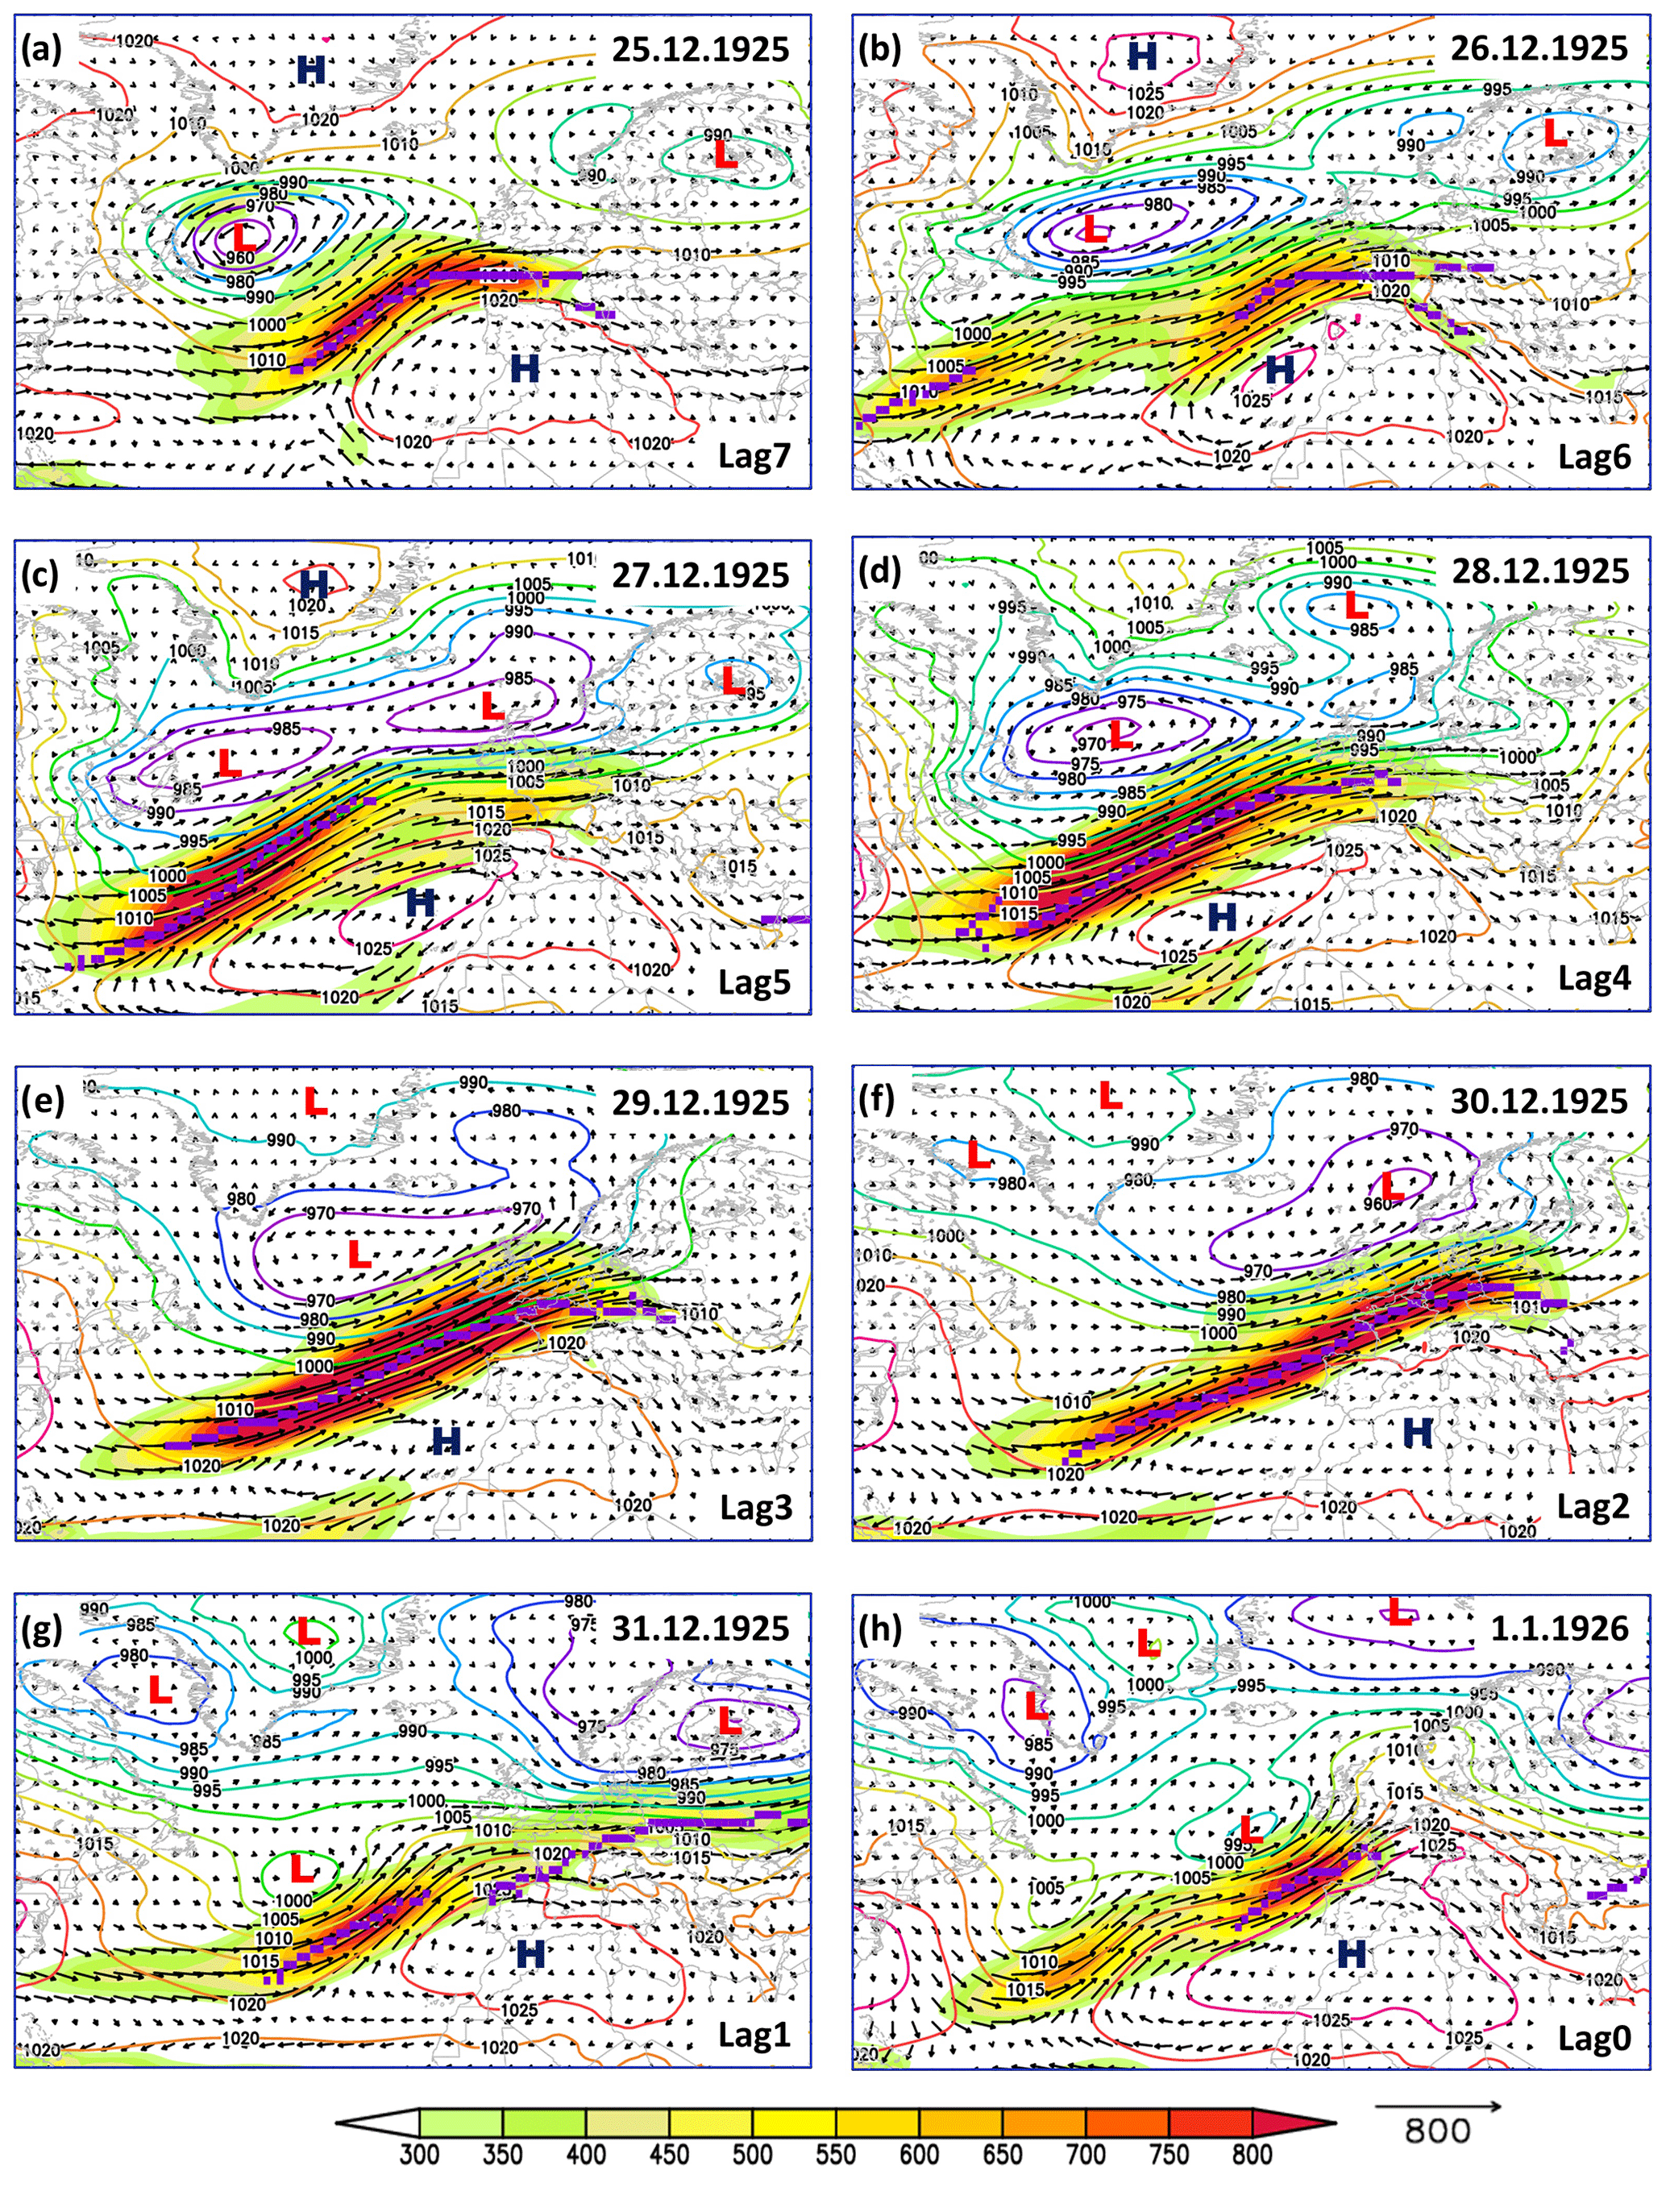
Figure 3Daily sea level pressure (SLP; colored contour lines), magnitude of the integrated water vapor transport (IVT; shading), direction of the integrated water vapor transport (vectors) and location of the AR axis (magenta line) for different time lags (0–7 d) for the 1925–1926 flood event. Units: SLP (hPa) and IVT (kg s−1 m−1).
Table 2Daily values of the magnitude of the IWV for the days prior to each flood peak (see Table 1) averaged over the box (4–12∘ E, 47–56∘ N). The bold values represent the days on which the highest magnitude was recorded. The climatology was computed over the period 1961–1990.
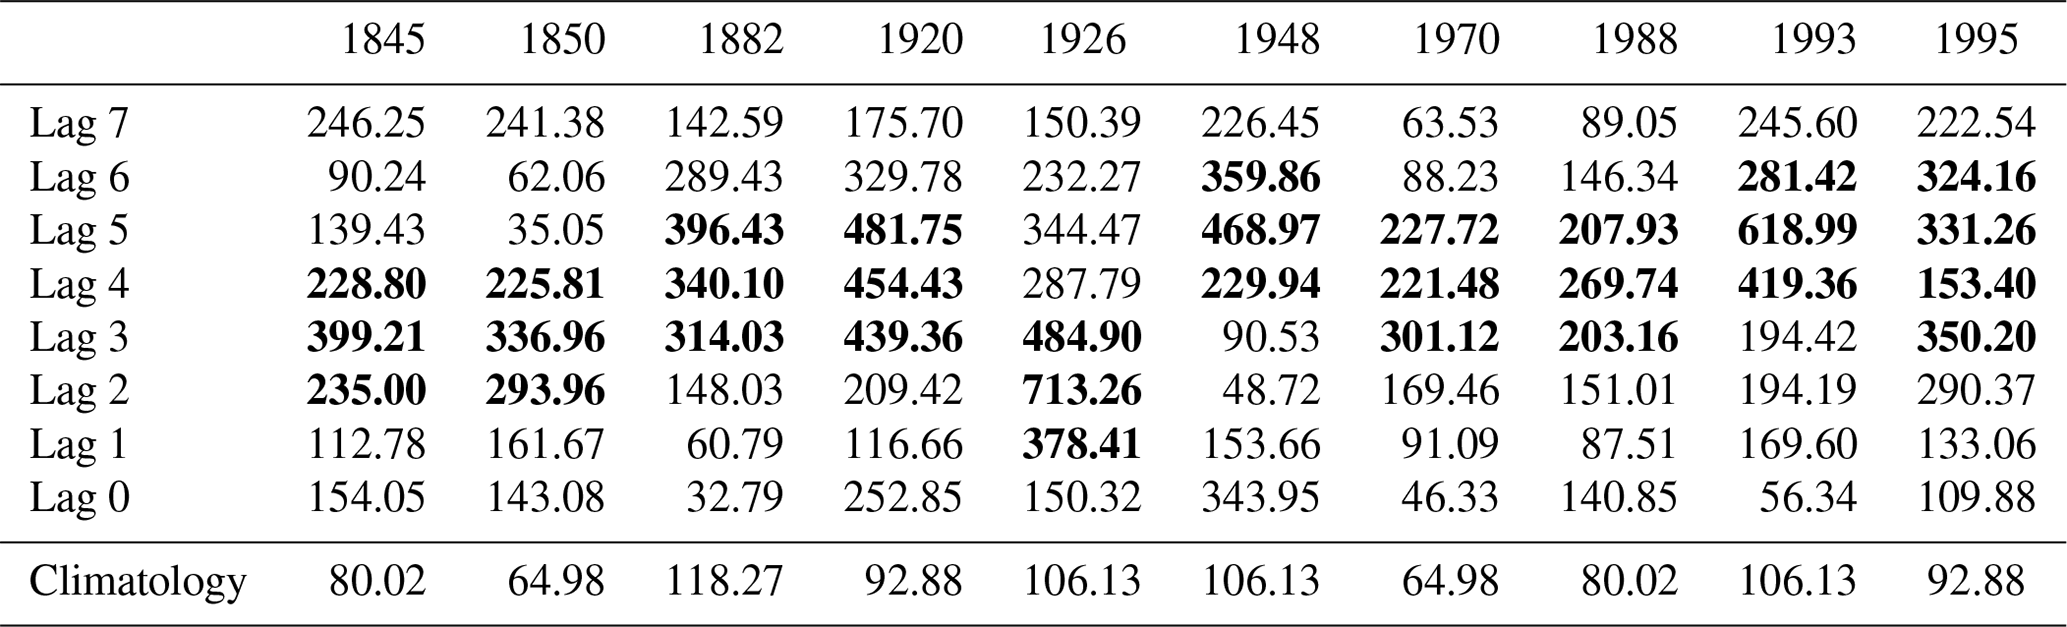
Looking in more detail at the dynamic fields of IWV during the days with heavy rainfall events, one can identify a distant source of moisture. During the days of rainfall events recorded at Trier station, a long and narrow band of IWV is transported from the subtropical latitudes, passing the North Atlantic Ocean and reaching the western part of Europe (Fig. 4). This narrow band of moisture is transported by a southwestern wind, at 900 hPa level, above 20 m s−1 (Fig. S7; left column). This combination of wind and IWV concentrated in such narrow bands suggests the presence of an AR, which is in agreement with the results obtained by using the AR tracking algorithm of Guan and Waliser (2015; Fig. 3).
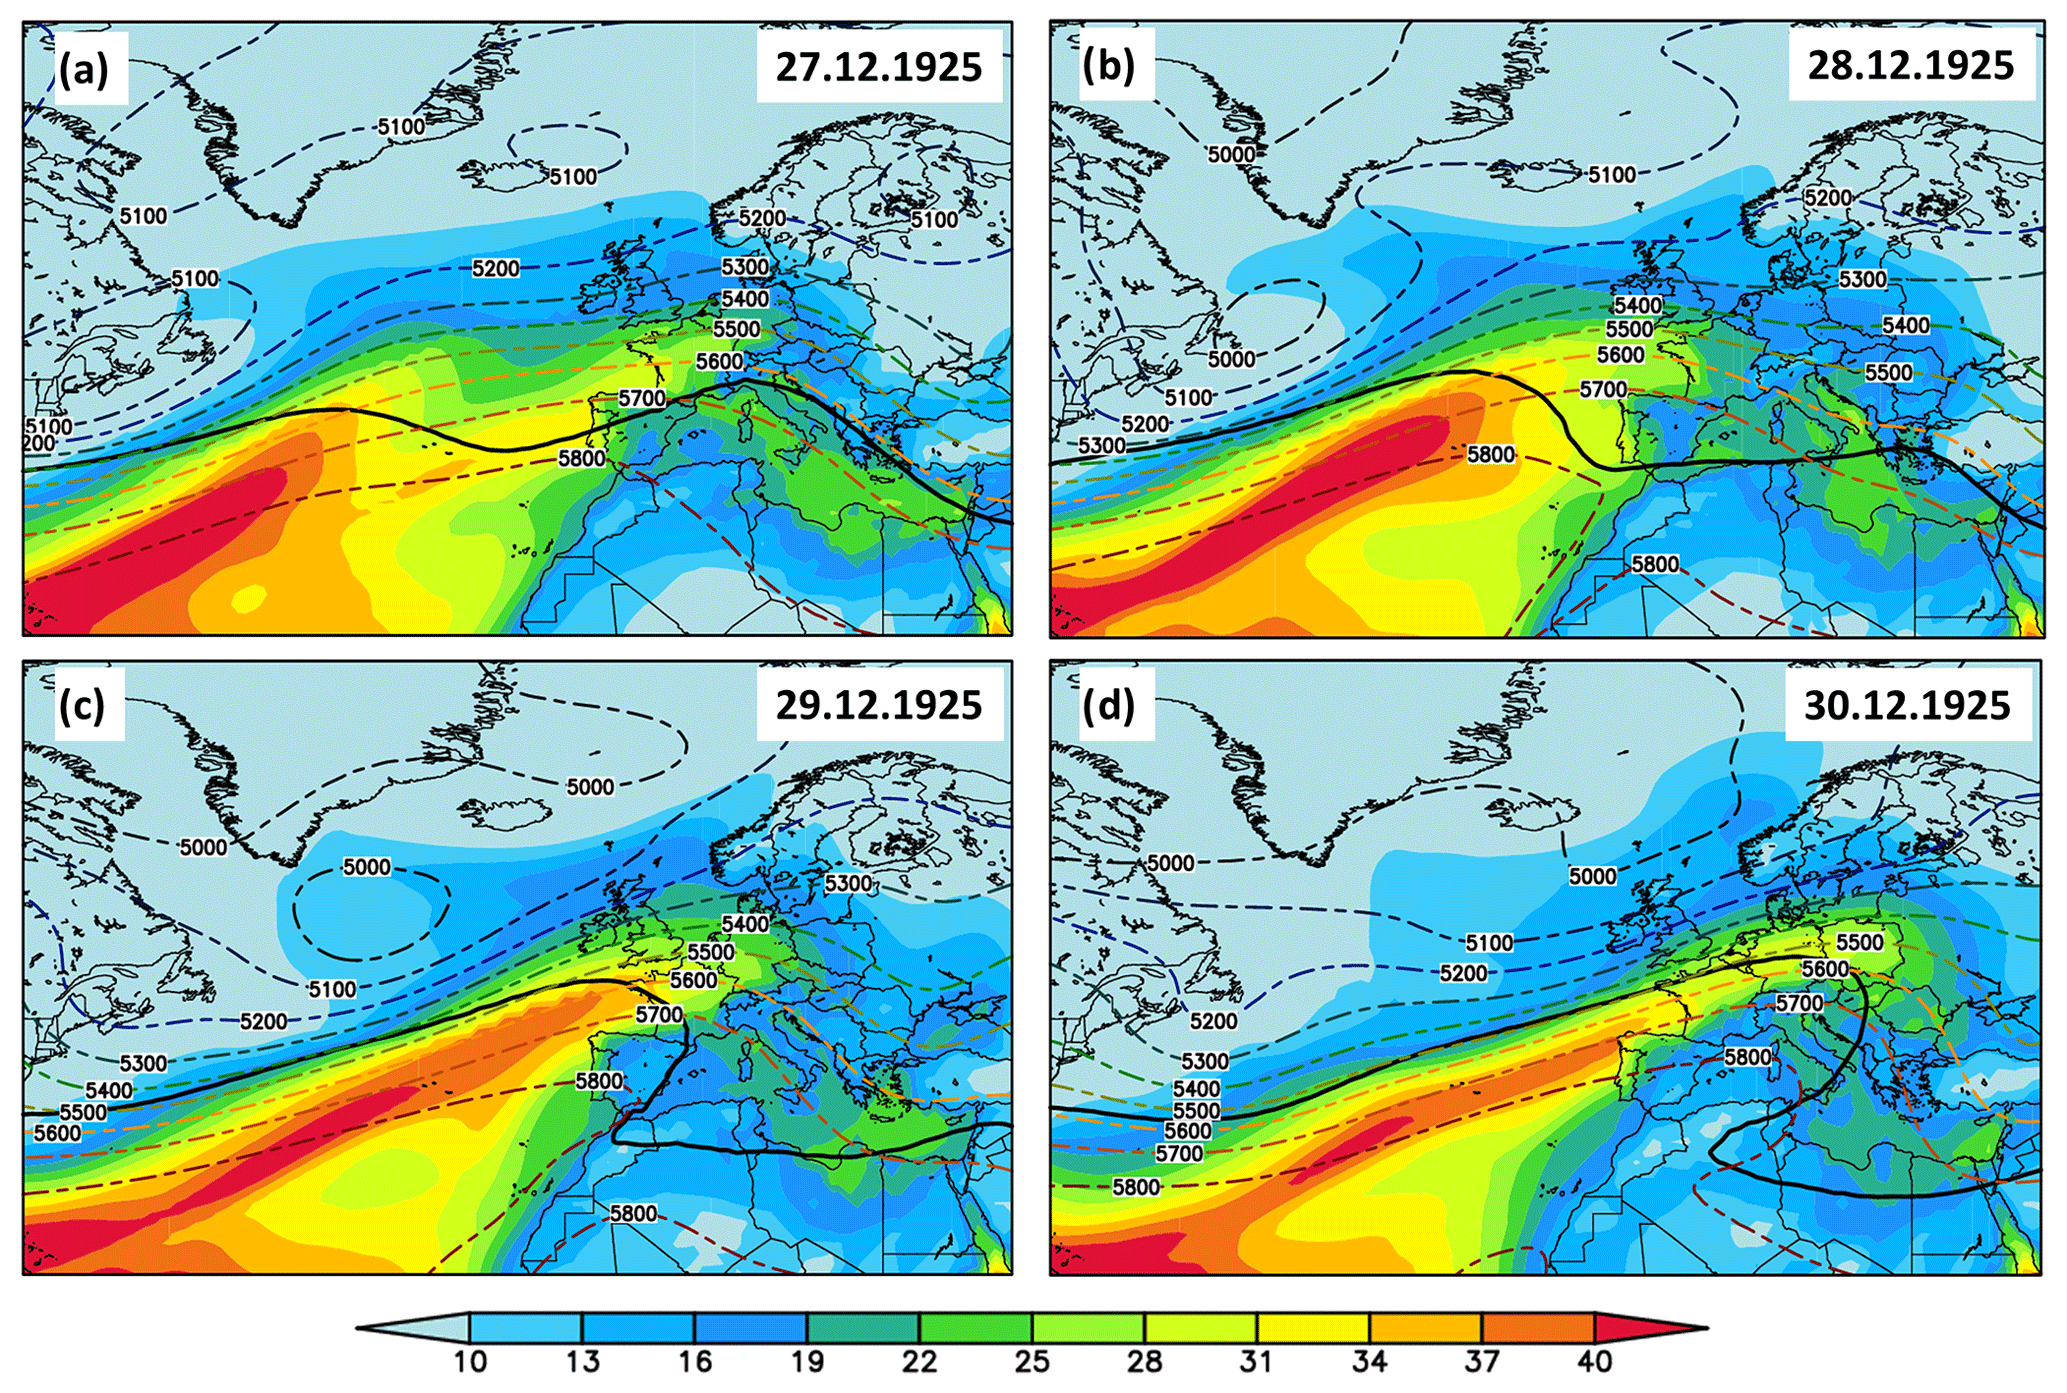
Figure 4Daily integrated water vapor (IWV; shading) and daily geopotential height at 500 hPa (Z500; contour lines) for (a) 27 December 1925, (b) 28 December 1925, (c) 29 December 1925 and (d) 30 December 1925. The thick black line in panels (a)–(d) indicates the 2 PV contour at 330 K. Units: IWV (kg m−2) and Z500 (m).
The synoptic evolution of the tropopause level flow is analyzed using the dynamical tropopause on the 330 K isentropic level (Fig. 4). Previous studies (Browning et al., 1997; Froidevaux and Martius, 2016) show that flooding and extreme rainfall are linked with upper level troughs associated with the presence of elongated intrusions of air, which are the so-called potential vorticity (PV) streamers. The southern intrusion of air with high PV in the lower stratosphere or higher troposphere is followed by the lowering of the dynamical tropopause, intense vertical motions, cyclogenesis and heavy rainfall (Krichak et al., 2014; Rimbu et al., 2020). The days prior to the flood peak, featuring extreme rainfall at the Trier gauging station, are associated with high PV values (PV > 2 PV) over the analyzed region (Fig. 4). The axis of the IWV field follows the nonlinear behavior of the PV, and the maximum of the IWV is situated in the overturning of the 2 PV contour line (Fig. 4). The shape of the 2 PV contour lines indicates the presence of an anticyclonic Rossby wave breaking (Payne and Magnusdottir, 2014). AR activity is also linked with the breaking of the midlatitude Rossby waves, which can be either cyclonic or anticyclonic (Payne and Magnusdottir, 2014). In this respect, we have found that all the ARs that have passed the western part of Europe prior to the flood peaks associated with an anticyclonic Rossby wave breaking (ARWB; Table 2), which is in agreement with the study of Zavadoff and Kirtman (2020), who showed that ARs over the western part of Europe are linked mostly with ARWB, and is in broad consistency with Hu et al. (2017), who found most of the AR landfalls along the northern coast of western USA were associated with ARWB.
In order to further analyze the dynamical drivers of extreme flood events, we computed the divergence field for the upper (300 hPa) and lower (900 hPa) level wind speed. The wind speed and its associated divergence/convergence at the 900 (300) hPa level are shown in Fig. S7. The upper and lower level analysis (Fig. S7; right column) indicates the presence of an upper level jet branch, shifting southward and stretching from the central North Atlantic basin to the central part of Europe, and an area with an upper level divergence over our analyzed region (contour lines in Fig. S7), which is an indicator of deep convection (Hoskins et al., 1978; Krichak et al., 2014). In addition, at lower levels, we can observe that an intense low-level jet is present, with a similar orientation to the upper level jet (Fig. S7; left column), over the analyzed region. The upper level divergence and lower level convergence over our analyzed region are an indication of strong vertical motions and heavy rainfall (Hoskins et al., 1978). The days characterized by rainfall episodes (e.g., 27–31 December 1925; Fig. 2a) are all associated with a southward shift of the polar front, convergence over the catchment area (dashed lines in Fig. S7) and enhanced moisture transport in a narrow band stretching from the tropical Atlantic to our analyzed region (Fig. 4).
From a hydrological perspective, the thaw that started in the second week of December 1925 brought the first flood peaks to the Rhine and its tributaries (especially the Neckar and Mosel), which peaked in the middle of the month (Fig. 2b). The subsequent frost period reduced the water flow before the renewed thaw caused rising peaks again in the third week of December. Over this period of time, most of the Rhine tributaries (e.g., Aare, Murg, Kinzig, Neckar, Lahn and especially Moselle) brought relatively large volumes of water to the Rhine (Soldan, 1927). This caused the flood peaks in the middle and lower Rhine to rise abruptly. The subsequent brief cold snap caused the water levels to drop again from 23 December before the abrupt weather change on 26 December, which led to the outstanding flood event. The rapid ascent of the Rhine began on 27 December. In the upper Rhine, the flood peak of the Ill river merged with that of the Rhine on 30 December (Soldan, 1927). The water of the Moselle reached the Rhine early on 1 January. Dike breaks occurred above Köln and at Neuss. In the Rhineland, more than 28 000 houses and 2500 businesses were flooded, and more than 13 500 apartments had to be cleared. The most severely damaged cities were Köln and Koblenz, with 72 000 and 14 000 people affected, respectively. Agricultural damage was also significant as 74 000 ha of land was under water. Arable crops and crop stocks were destroyed, and gravel and sand were deposited on the cultivated areas. The damage to hydraulic engineering systems on the Rhine, Mosel and Ruhr was put at EUR ∼284 000. The damage to the traffic facilities outside the rivers was rather small given the size of the flood. The total damage was estimated at EUR ∼75 million for the Rhineland region (Soldan, 1927).
3.2 Hydrometeorological situation – 1993
November 1993 and the first week of December 1993 were characterized by relatively reduced amounts of rainfall over the Rhine catchment area (Bornefeld, 1994). Between 8 and 24 December, the general weather situation was characterized by several Atlantic low pressure systems (a heavy storm with hurricane gusts on 9 December) and a stable high pressure system in front of North Africa, which led to frequent rainfall and sometimes heavy rain over the northern part of France and western part of Germany (Deutscher Wetterdienst, 1994). The maximum amount of precipitation recorded at the Trier station was on 20 December 1993 (33.3 mm; Fig. 5a). Overall, during the period from 8 to 20 December 1993 in the catchment areas of Neckar, Nahe and Mosel, as well as in large parts of the central upper Rhine and central middle Rhine, more than double the long-term December precipitation was recorded (Figs. S5a and S8). The extratropical cyclones in the North Atlantic persisted for several days, pushing a narrow band of moisture toward central Europe (Fig. 6). High rates of IVT (up to 800 kg m−1 s−1) were recorded from 18 to 21 December (Fig. 6b–d). Over the lower Rhine, the maximum of the IVT reached values up to ∼620 kg s−1 m−1 (Table 2). At the same time, warm, humid air entered the Rhine area, which led to an extraordinary increase in temperature (Fig. 5a). After a rainless period, 18–20 December were characterized by heavy rainfall events over most of the Rhine catchment area (Fig. 5a). The days that were characterized by heavy rainfall over our analyzed region (Fig. S8) are associated with a narrow band of IWV (Fig. 4), stretching from the subtropical North Atlantic basin to the central part of Europe, with strong winds directed toward the western part of Europe and lower (upper) level converging (divergence; Fig. S10). This large-scale pattern is favorable for strong vertical motions and heavy rainfall over our analyzed region. As in the case of the 1925–1926 flood peak, the axis of the IWV follows the path of the 2 PV contour line (Fig. 7) and exceeds 20 mm for all the days with heavy rainfall at the Trier station (Fig. 5). For the 1993 flood peaks, the days prior to the flood were associated with anticyclonic RWB (Table 2), which led to sharp meridional gradients of PV over Europe (Fig. 7). Positive upper level PV anomalies affect the structure of the atmosphere below them (Schlemmer et al., 2010) to the extent that cold air and reduced static stability are found below the positive PV anomalies (Fig. S9). The PV streamer observed over the period 18–21 December 1993 (black contour line Fig. 7) was associated with warm air advection toward the western part of Europe (Fig. S9) and cold air advection over the eastern part of Europe, which led to snowmelt and heavy rainfall over the lower Rhine catchment area (Figs. 5 and S9).
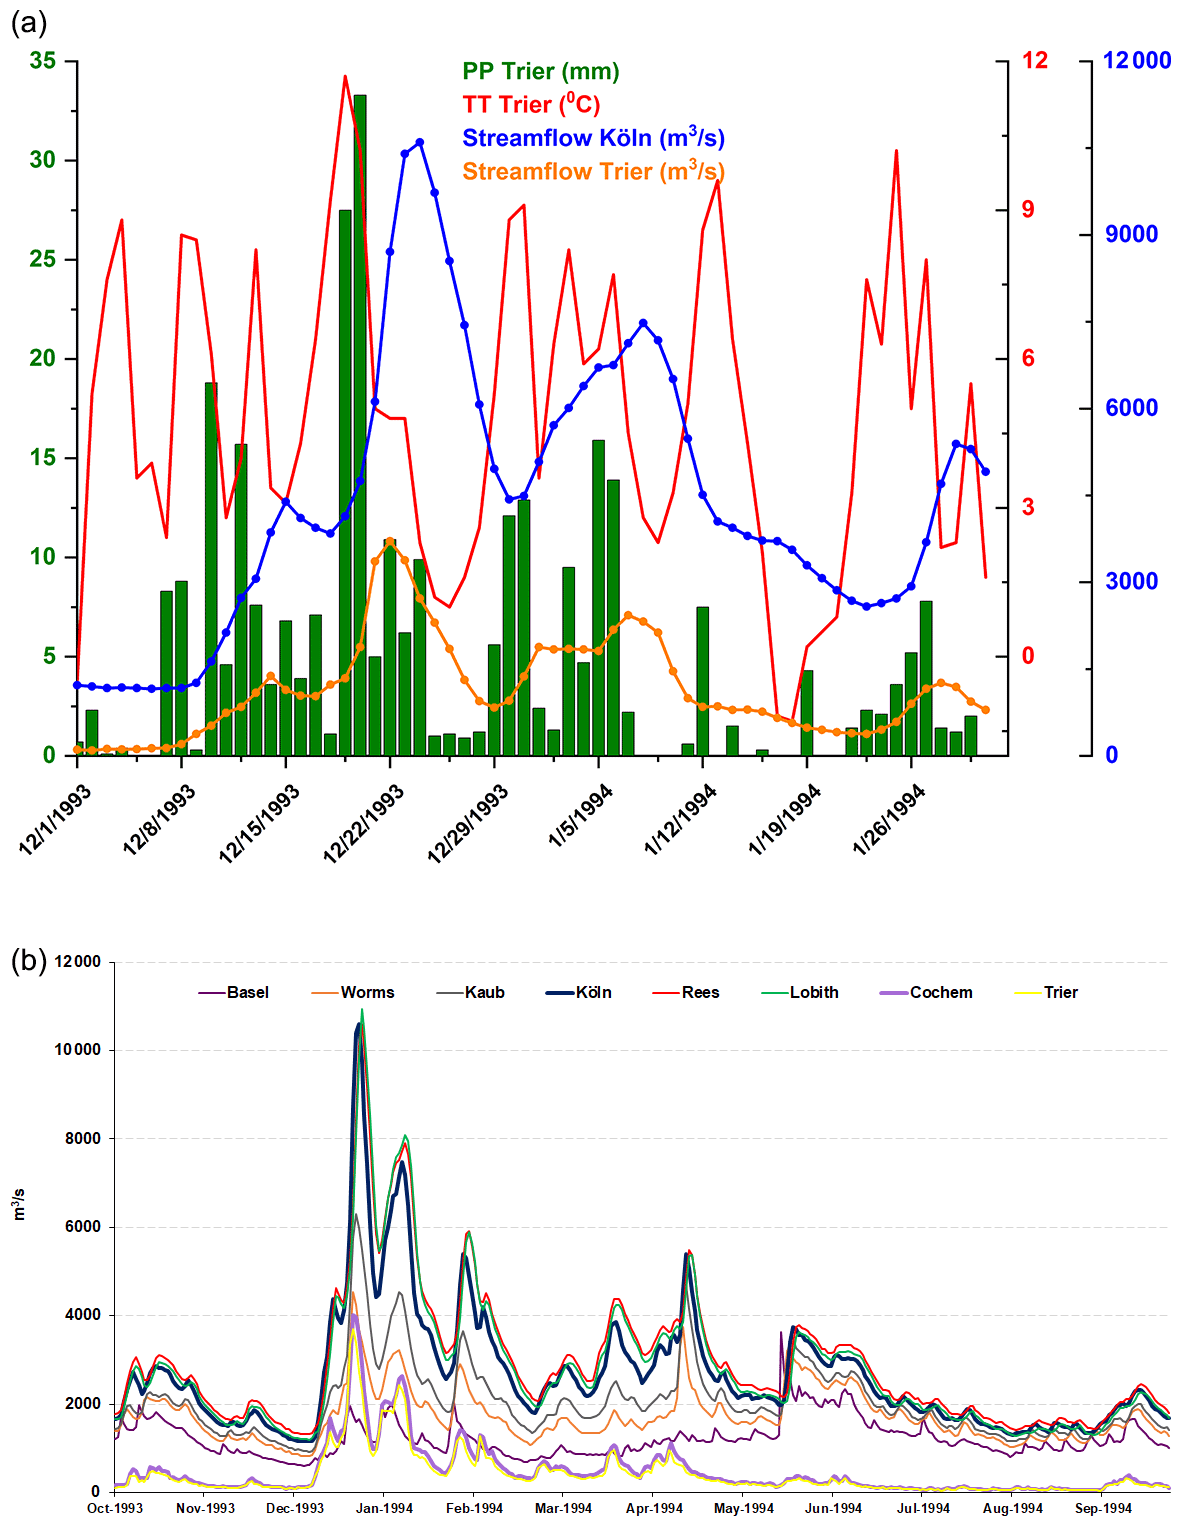
Figure 5(a) Daily precipitation (green bars) at the Trier meteorological station, daily mean temperature (red line), daily streamflow at the Köln gauging station (blue line) and daily streamflow at the Trier gauging station (orange line) for the period 1 December 1993–31 January 1994 (b) Daily streamflow at different gauging station along the Rhine (Basel, Worms, Kaub, Köln, Rees and Lobith) and Moselle rivers (Trier and Cochem) for the period 1 October 1993–30 September 1994.
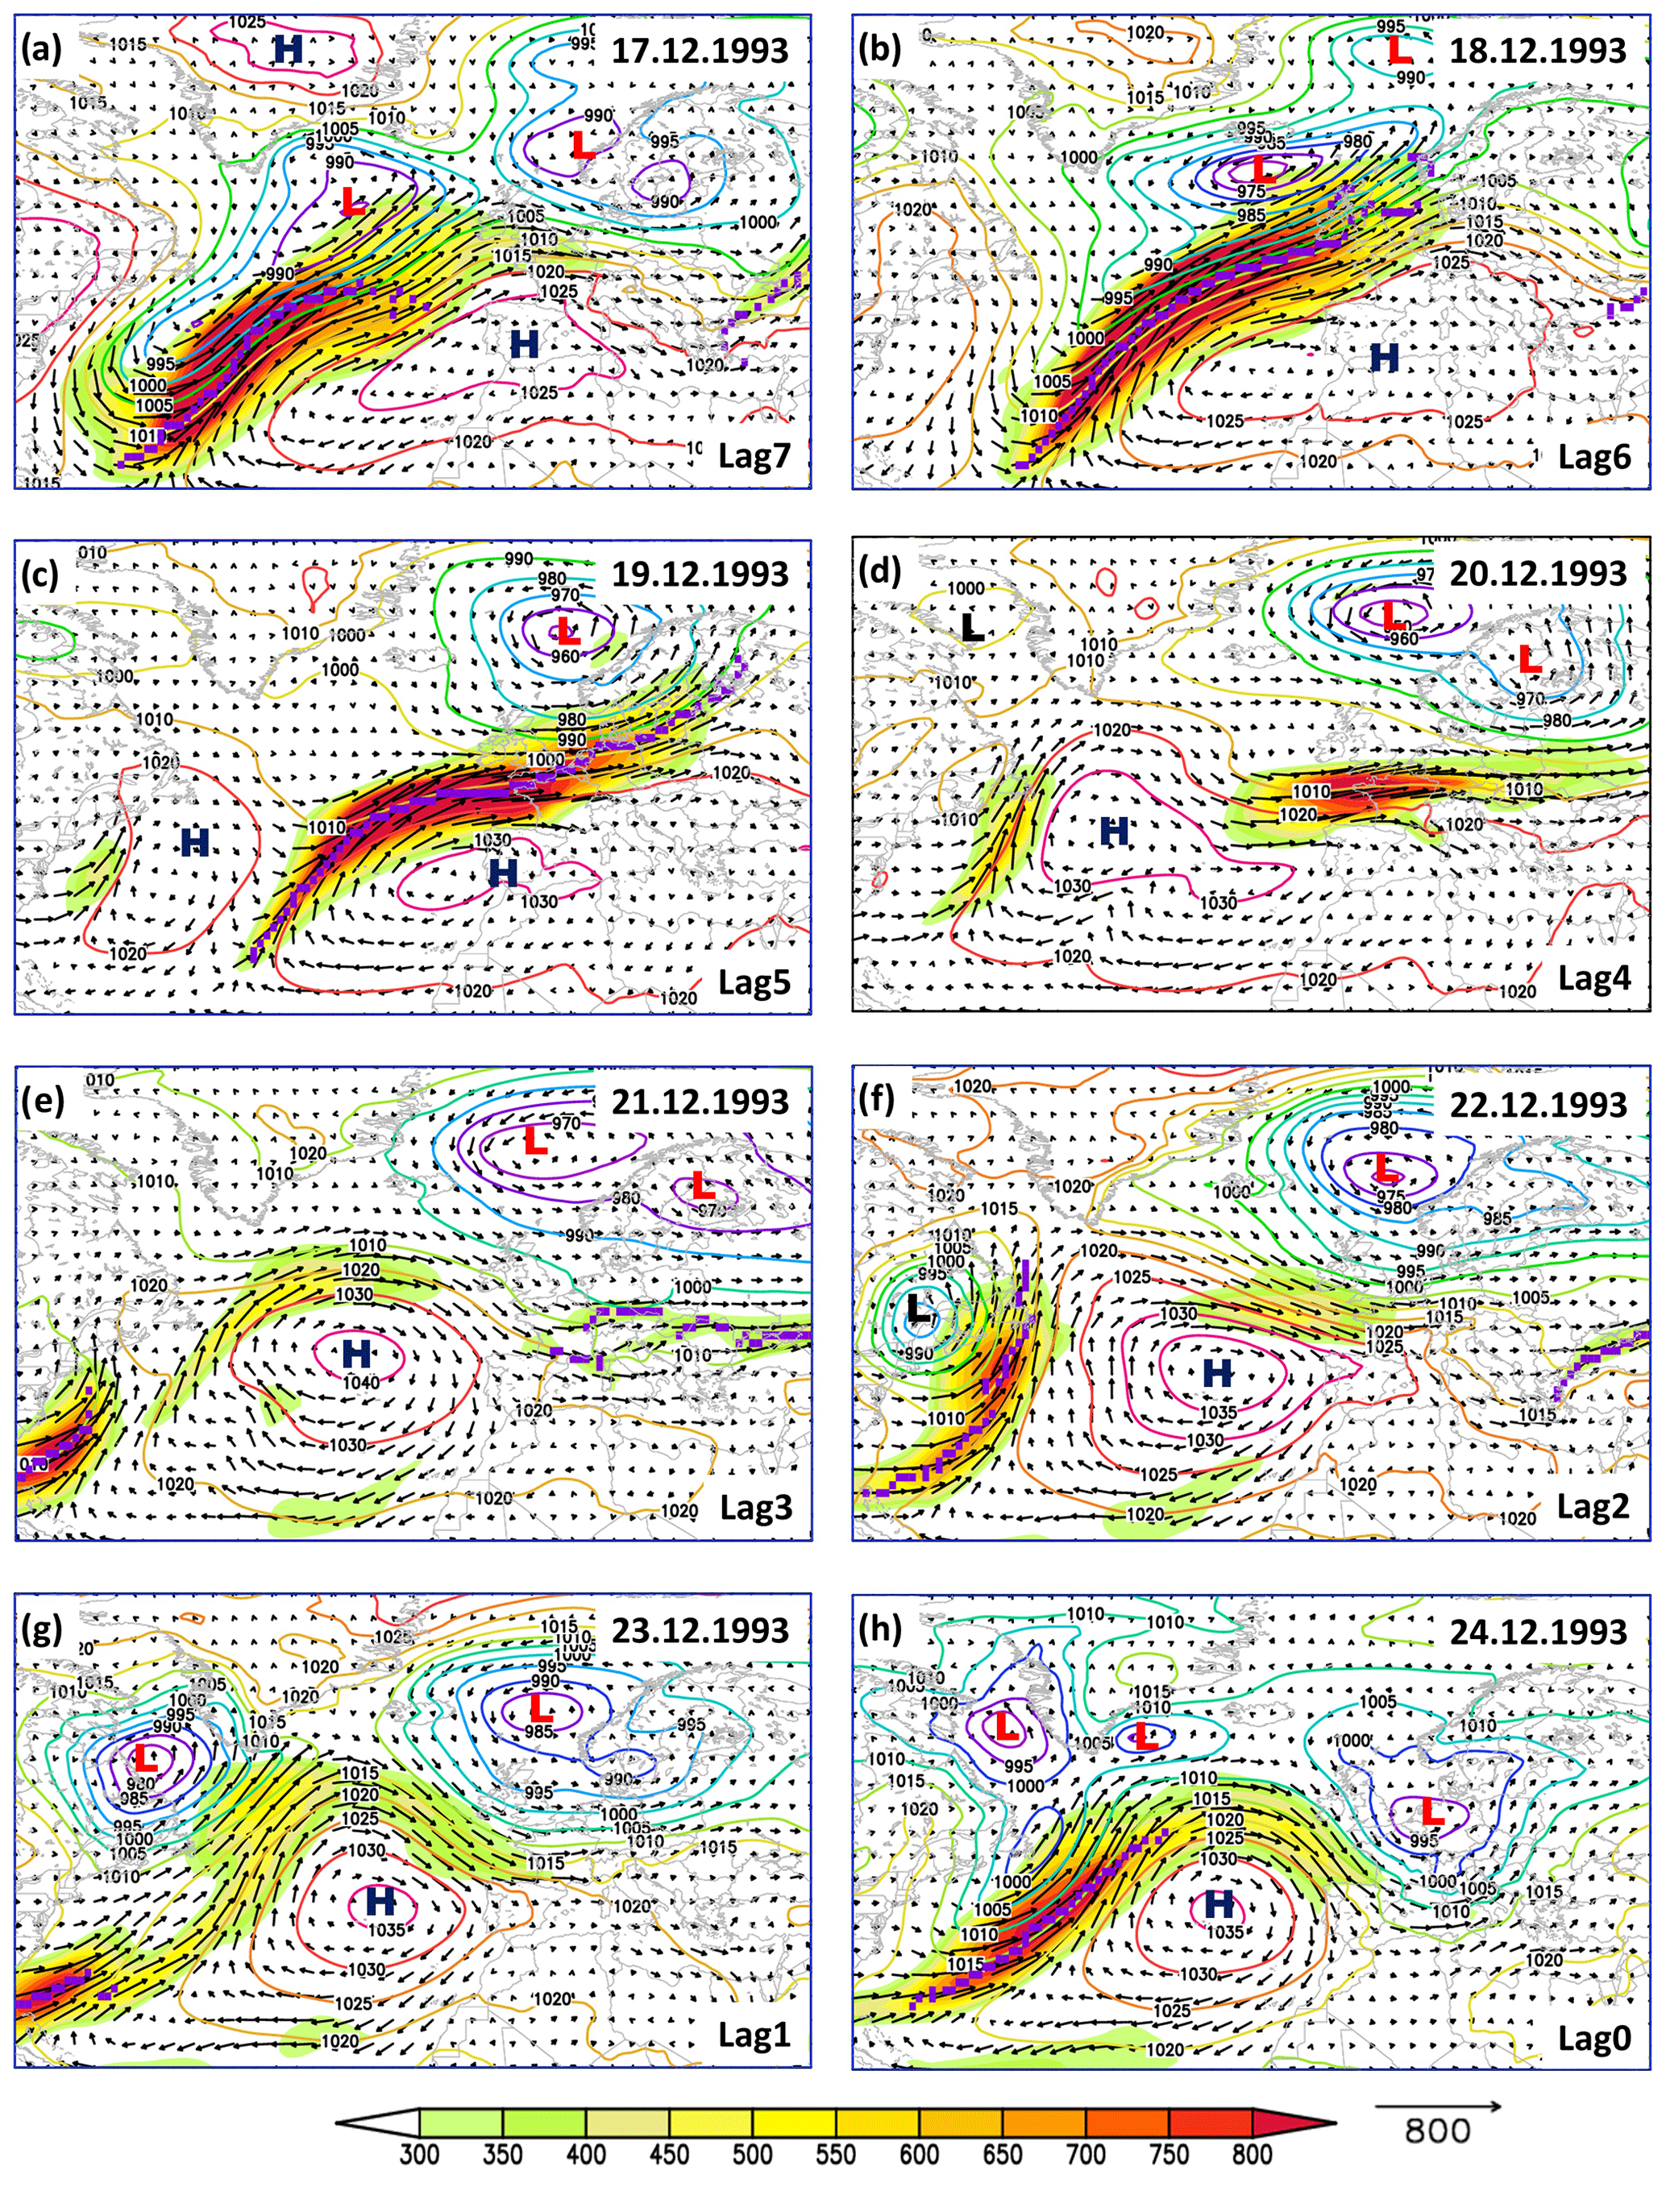
Figure 6Daily sea level pressure (SLP; colored contour lines), magnitude of the integrated water vapor transport (IVT; shading), direction of the integrated water vapor transport (vectors) and location of the AR axis (magenta line) for different time lags (0–7 d) for the 1993 flood event. Units: SLP (hPa) and IVT (kg s−1 m−1).

Figure 7Daily integrated water vapor (IWV; shading) and daily geopotential height at 500 hPa (Z500; contour lines) for (a) 18 December 1993, (b) 19 December 1993, (c) 20 December 1993 and (d) 21 December 1993. The thick black line in panels (a)–(d) indicates the 2 PV contour at 330 K. Units: IWV (kg m−2) and Z500 (m).
The precipitation in the first half of December 1993 caused the soil to become saturated with water, so the subsequent rain had an immediate drainage effect (Soldan, 1927). However, a noteworthy flood wave only developed in the Rhine from the inflow of the Neckar, which led to a significant flood, and reached its peak water level on 22 December at the Rockenau station (Engel et al., 1994). The highest flow at the Kaub gauging station is dated 23 December. An extraordinary flood peak developed in the Moselle, and the highest daily streamflow of the century was recorded at the Cochem gauging station on 22 December (4020 m3 s−1). This flood peak in the Moselle merged with the Rhine on 23 December, leading to one of the largest known flood waves of the Rhine downstream of Koblenz (Fig. 5b). The combined flood peak passed through Andernach on 23 December 1993 and reached the Köln gauging station on 24 December (10 600 m3 s−1; Fig. 5b), where the flood protection wall of the old town was flooded for about 70 h and Rees and Emmerich were flooded on the following day.
The Christmas flood in the Rhine area caused several losses of human life and required evacuations in many cities. In Baden-Württemberg (Neckar area), Rhineland Palatinate and North Rhine-Westphalia, high levels of building damage occurred. In Koblenz, almost a quarter of the built-up area of the city was flooded, while 10 000 inhabitants and ∼4000 houses were directly affected by the flood. In North Rhine-Westphalia, the number of damaged households was considerable, especially in Königswinter, Bonn, and Köln. In Köln, over 4500 households had direct flood damage and another 9000 households suffered damage from increased groundwater levels. The damage to the federal shipping routes was estimated to be EUR ∼9.8 million. Due to the flooding, shipping had to be completely stopped on Neckar and Saar for 9 d, on the Mosel 12 d and on the Rhine from Koblenz to the Dutch border for 7 d. The lost transport revenues were estimated at over EUR 38 million. A total of approximately EUR 1.4 billion in damages were caused in the Rhine regions affected by this flood event (Münchener Rückversicherungs-Gesellschaft, 1999).
3.3 Hydrometeorological situation – 1995
After heavy local rain in the higher low mountain regions at the end of December 1994, several periods of precipitation in January 1995 brought heavy rainfall to the entire Rhine region (Engel, 1999). The cold spell in the first week of January 1995 (Fig. 8a) led to snowfall in the middle of the Rhine. In the alpine region, there was almost 100 cm of snow recorded at the end of the first week of January 1995. In the second week of January 1995, a northwesterly flow led to daily showers on top of the accumulated snow (Engel, 1999). Thus, the rainfall, together with the snowmelt due the temperature increase, led to small flood peaks along the Rhine and its tributaries (Fig. 8b). The situation became exceptional, starting on 22 January 1995. The rainfall episodes began on the evening of 21 January and lasted ∼30 h. The total precipitation recorded in January 1995 (168 mm), averaged over the German part of the Rhine basin, is the highest one recorded over the period 1881–2019 for the month of January (Fig. S5b). The extreme rainfall episode was triggered by a frontal system which deepened into a low pressure system over the western part of Europe. On 22 January 1995, the Trier meteorological station recorded the highest daily precipitation amount (49.6 mm) over the last 70 years for the month of January. This event led to an increase in the water levels of the Moselle to a flood peak of 2880 m3 s−1 at the Trier station and 3410 m3 s−1 at the Cochem gauging station on 23 January 1995 (Fig. 8b). On 25 January 1995, another exceptional rainfall event was recorded, with values up to 55 mm in 24 h over a large area in the Moselle and Rhine catchment areas (Fig. S11). This event was triggered by an AR event, with a magnitude of ∼600 kg s−1 m−1 (Fig. 9b), and a westerly flow of the large-scale atmospheric circulation, characterized by a deep low pressure system over Scandinavia and a high pressure system over northern part of Africa. Between 26 and 29 January 1995, small frontal waves driven by the low pressure system south of Greenland (Fig. 9c–f) led to more rainfall episodes (Fig. 8a) over Moselle's catchment area and large parts of the Rhine catchment area (Fig. S11). These frontal systems were corroborated with ARs stretching from the subtropical North Atlantic basin and bringing moisture to the western part of Europe (Fig. 9e and f). The prevailing large-scale atmospheric circulation during the days characterized by enhanced rainfall over large area of Rhine's catchment area (Fig. S11) featured narrow bands of moisture transport from the subtropical North Atlantic basin toward the western part of Europe (Fig. 10), and this enhanced the lower level convergence over the central part of Europe (Fig. S13). The upper level large-scale atmospheric circulation was characterized by divergence over the Rhine catchment area, ascending motions and heavy rainfall (Fig. S13). As in the case of the 1925–1926 and 1993 flood peaks, the axis of the IWV follows the path of the 2 PV contour line (Fig. 10) and exceeds 20 mm for all the days with heavy rainfall at the Trier station (Fig. 10). For the 1995 flood peaks, the days prior to the flood were associated with anticyclonic RWB (Table 3), which led to sharp meridional gradients of PV over Europe (Fig. 10) and the advection of warm air toward the western part of Europe (Fig. S12) and cold air over the eastern part of Europe. The combination of warm air advection and intense ARs led to snowmelt and heavy rainfall over the Rhine catchment area and central part of Germany (Fig. S11).

Figure 8(a) Daily precipitation (green bars) at the Trier meteorological station, daily mean temperature (red line), daily streamflow at the Köln gauging station (blue line) and daily streamflow at the Trier gauging station (orange line) for the period 1 January–28 February 1995. (b) Daily streamflow at different gauging stations along the Rhine (Basel, Worms, Kaub, Köln, Rees and Lobith) and Moselle rivers (Trier and Cochem) for the period 1 October 1994–30 September 1995.
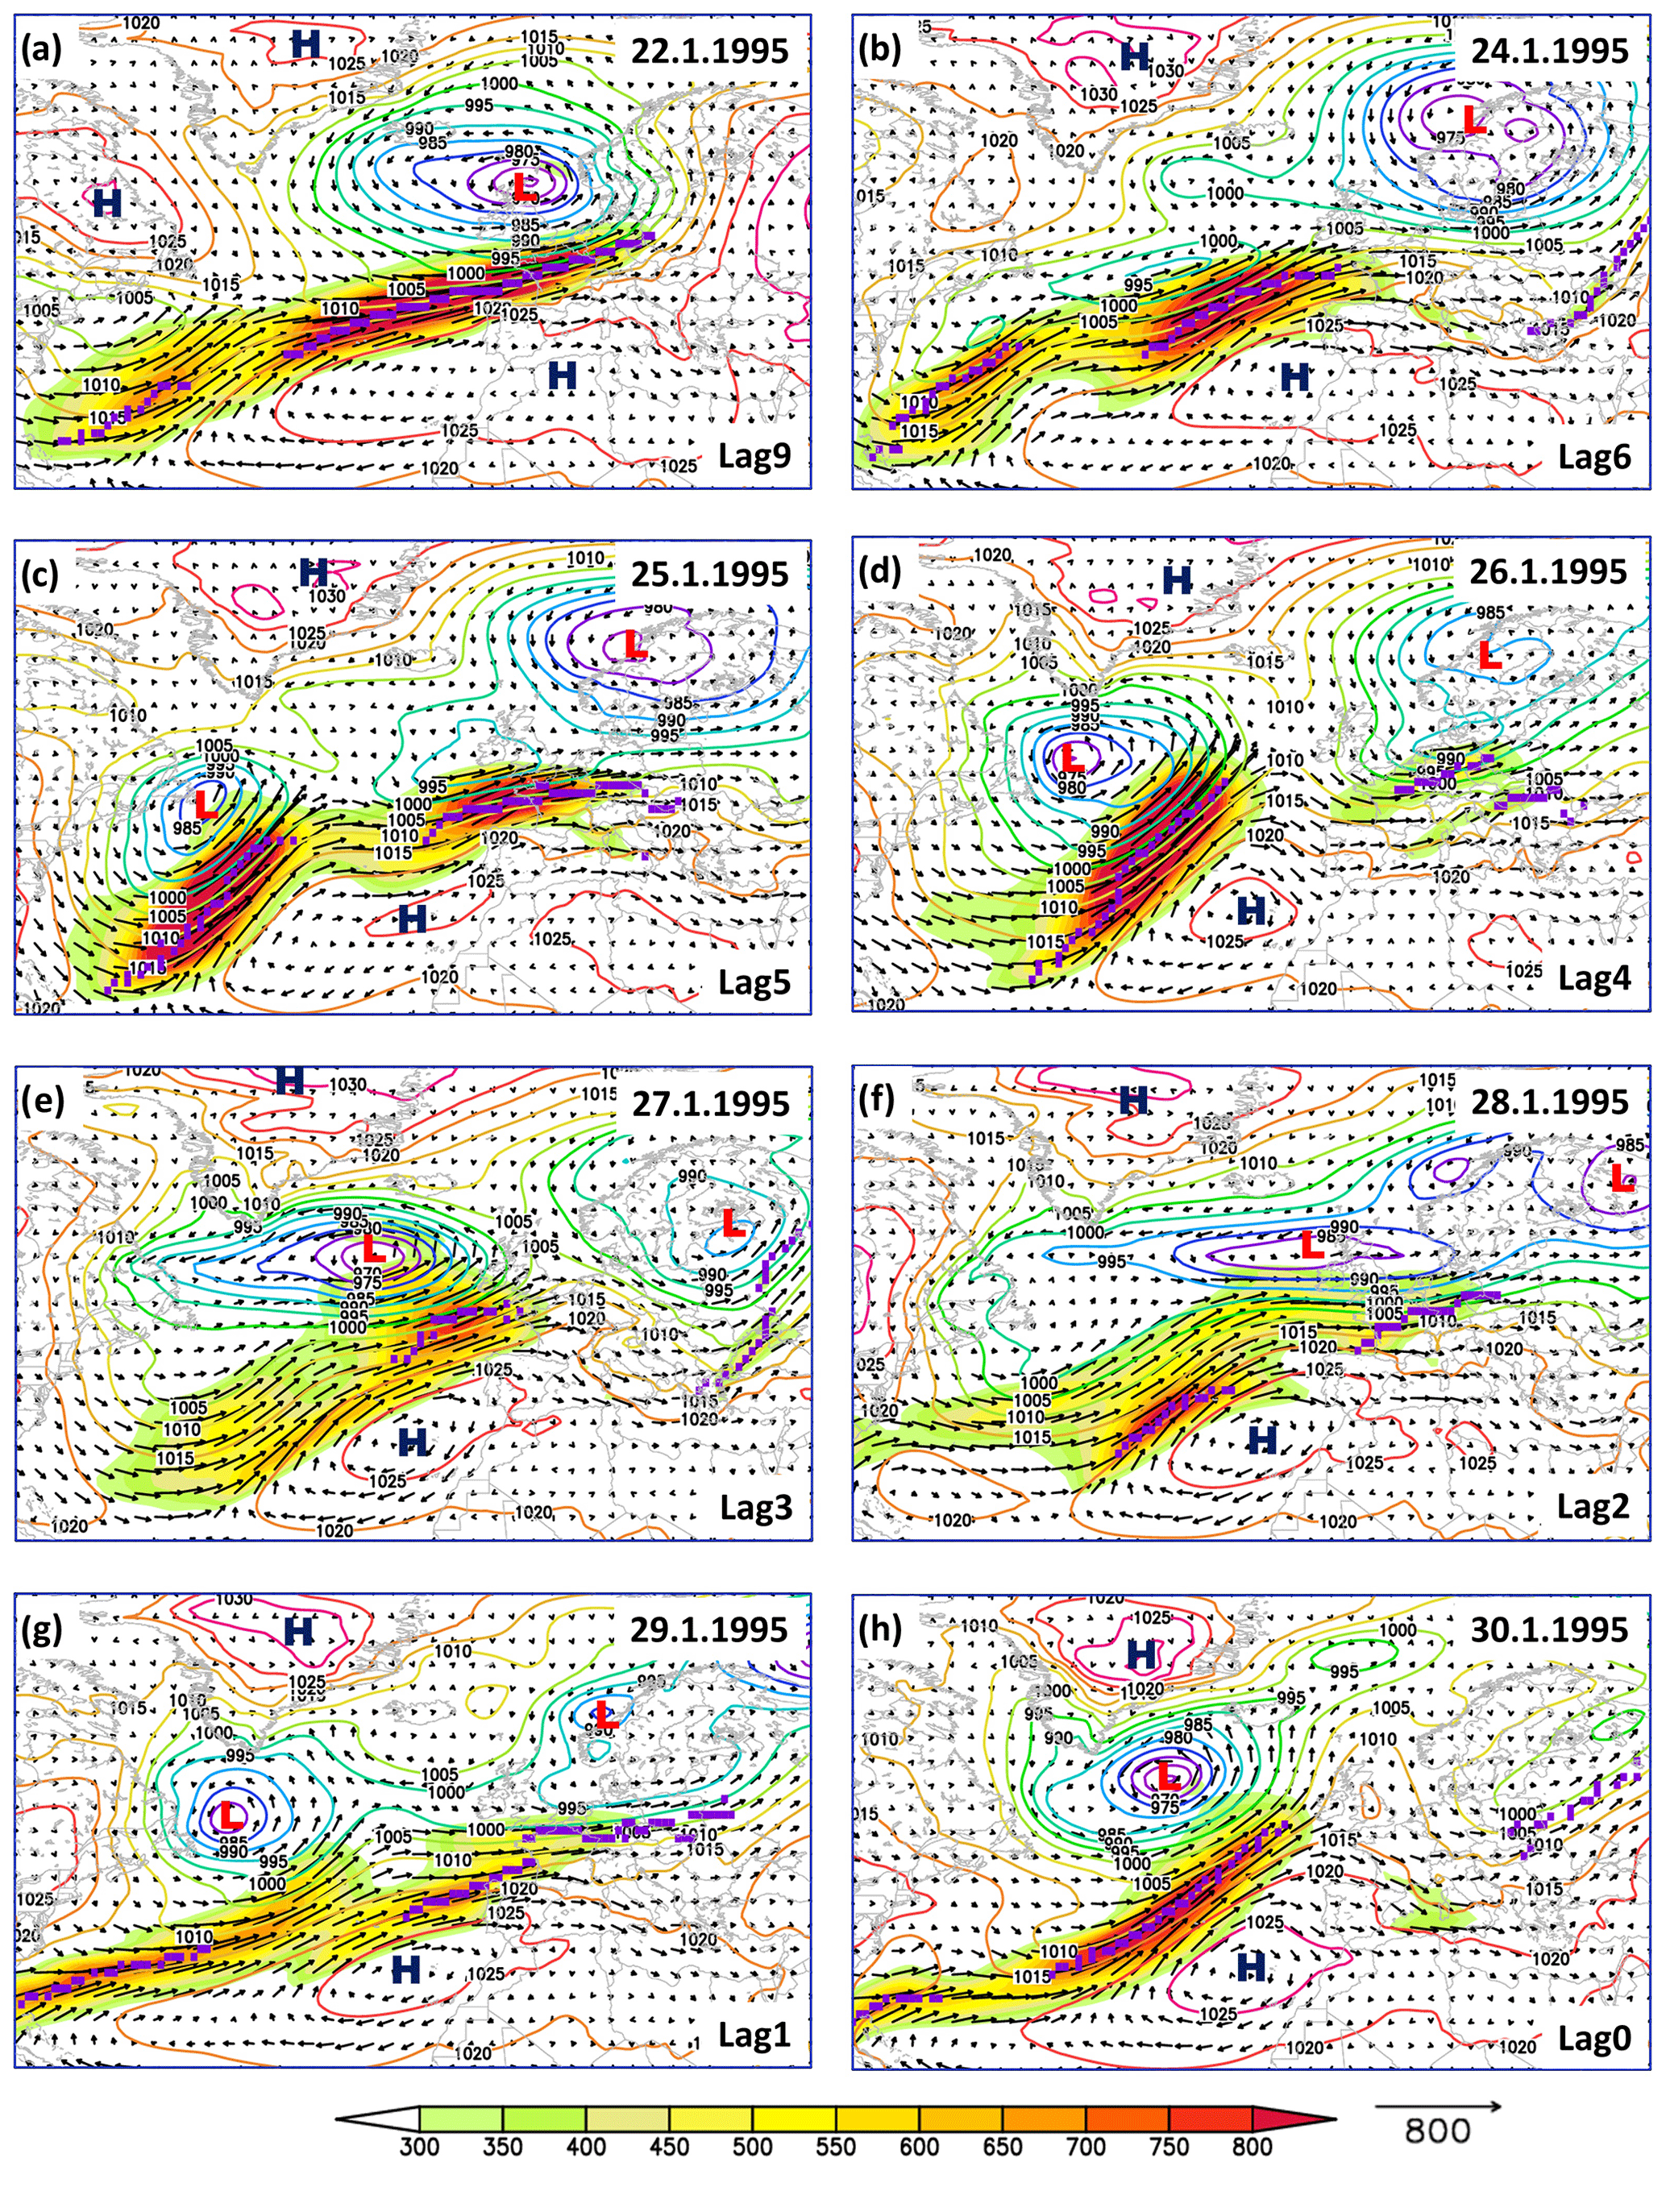
Figure 9Daily sea level pressure (SLP; colored contour lines), magnitude of the integrated water vapor transport (IVT; shading), direction of the integrated water vapor transport (vectors) and location of the AR axis (magenta line) for different time lags (0–7 d) for the 1995 flood event. Units: SLP (hPa) and IVT (kg s−1 m−1).
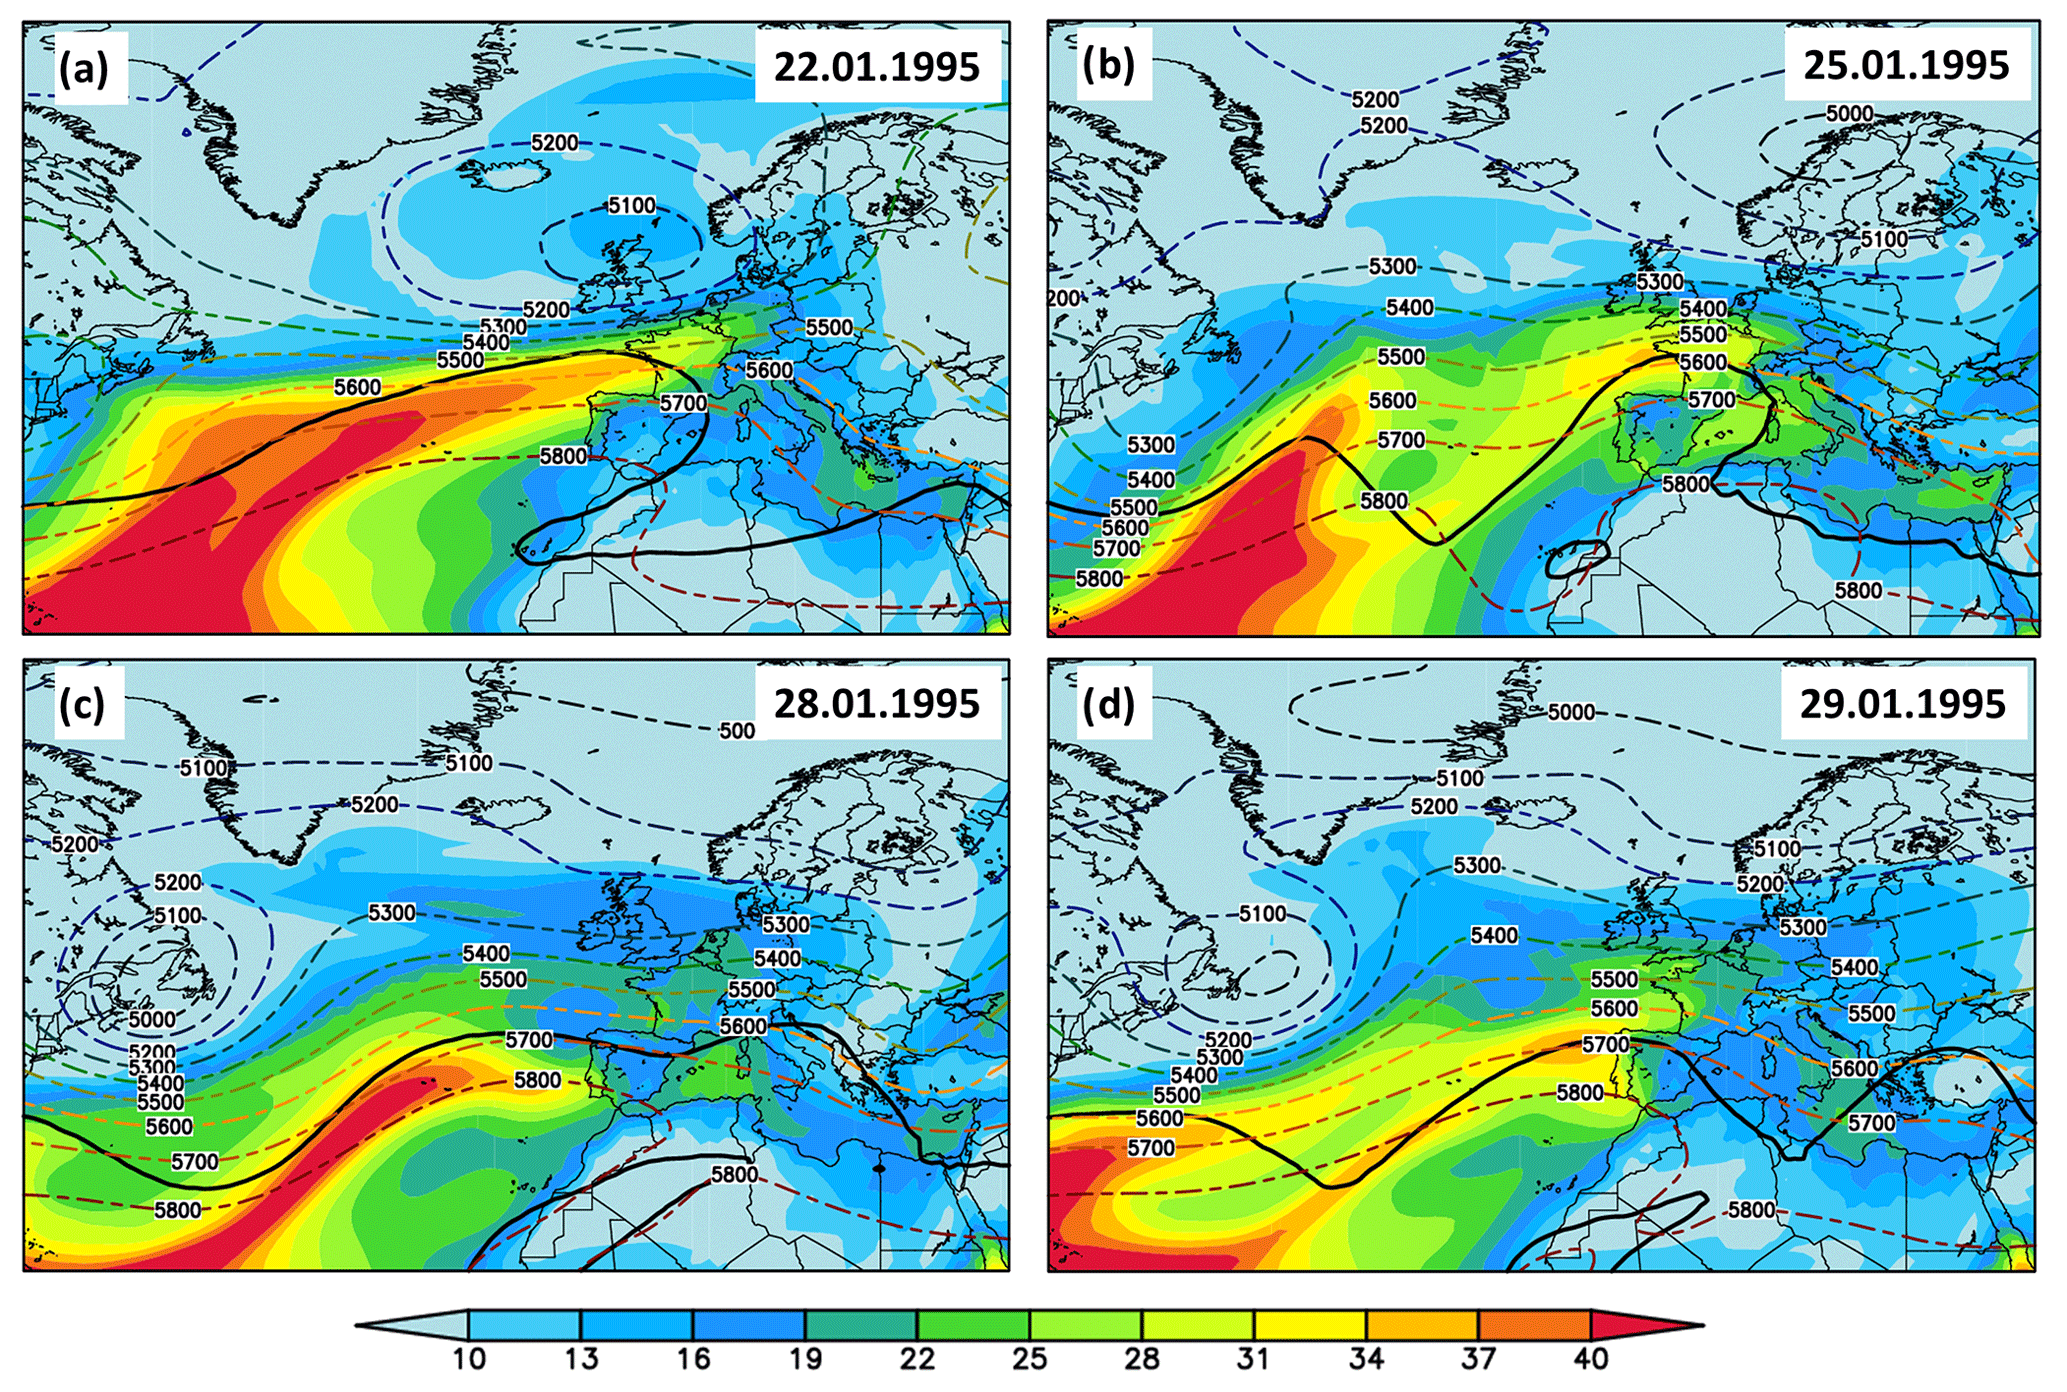
Figure 10Daily integrated water vapor (IWV; shading) and daily geopotential height at 500 hPa (Z500; contour lines) for (a) 22 January 1995, (b) 25 January 1995, (c) 28 January 1995 and (d) 29 January 1995. The thick black line in panels (a)–(d) indicates the 2 PV contour at 330 K. Units: IWV (kg m−2) and Z500 (m).
Table 3Monthly values of the North Atlantic Oscillation (NAO) index (second column), days with anticyclonic Rossby wave breaking (ARWB; third column) and the type of circulation patterns (Großwetterlage – GWL; fourth column) active during the days prior to each of the 10 extreme flood peaks at the Köln gauging station. Note: cyclonic west wind – WZ; southern west wind – WS; northwest cyclonic – NWZ; anticyclonic west wind – WA; western European trough – WW.

As a result of the repeated rainfall episodes, the catchment area in the middle and lower Rhine and the Main, Nahe, Mosel and Sieg tributaries saw a steep increase in daily streamflow (Engel, 1999). The water inflow from the Main and Nahe rivers resulted in a significant increase in the flood wave at the Mainz and Kaub gauges, where the Christmas flooding from 1993 was exceeded. On 30 January 1995, after the flooding of the Moselle began, the flood peaks of the Rhine reached 10 700 m3 s−1 at the Köln gauging station (the second highest daily streamflow recorded over a period of 200 years). Due to the flood inflow of the Sieg, the flood peak at the Köln gauging station was further increased, reaching with a water level that was 6 cm higher than during the Christmas flood in 1993 (Engel, 1999). At the Rees gauging station, the peak of the flood wave was 11 300 m3 s−1, above the Christmas flood in 1993 (10 600 m3 s−1), and only just below the highest known flood peak in January 1926 (11 700 m3 s−1). Overall, the extreme floods in January 1995 were mainly triggered by long-lasting rainfall episodes driven by frontal systems from the North Atlantic basin, a high frequency of AR events and intense moisture transport from the subtropical North Atlantic basin to the western part of Europe, as well as a southward shift of the polar front and upper (lower) level divergence (convergence) over the analyzed region.
The 1995 floods had huge consequences both for society and economy in Germany and the Netherlands. In numerous cities and towns on the Rhine and its tributaries, streets and houses were flooded, power outages and damage to the infrastructure occurred and five people were killed (Münchener Rückversicherungs-Gesellschaft, 1999). The total damage, in financial terms, in the German Rhine catchment area was estimated to be EUR ∼398 million. Due to the exceeding of the highest navigable water levels, shipping had to be temporarily suspended on individual sections of the Rhine, and the financial losses for the shipping-related companies were EUR ∼36 million. For Köln alone, the damage was around EUR 47 million (half as much as in the 1993 Christmas flood), and 4000 people were directly affected by the floods. In the Netherlands, at least four people were killed and ∼250 000 people had to be evacuated because of dike breaches and extensive flooding of polders, and large parts of cities were submerged between 30 January and 1 February 1995, from the Limburg region, south of Nijmegen, to Zeeland, around Rotterdam, Europe's largest port (Münchener Rückversicherungs-Gesellschaft, 1999).
3.4 Composite events
The crucial role that ARs have in preceding extreme flooding in the lower part of the Rhine catchment area is also highlighted by analyzing the IVT, SLP and the AR origin with different time lags (0–7 d) for the 10 highest flood peaks measured at the Köln gauging station. The occurrence date and the magnitude of each flood peak are shown in Table 1. The composite of all flood peaks shows that all of them are preceded by up to 7 d by a plume of moisture in the shape of an AR accompanied by a deep low pressure center over the British Isles and a high pressure center over the Iberian Peninsula (Fig. 11). The maximum of the IVT, averaged over the 10 floods peaks, reaches values of up to 500 kg s−1 m−1. The ARs associated with heavy winter floods in the lower part of the Rhine basin have an elongated shape, thus confirming the AR geometrical criterion of being at least 2000 km long and less than 1000 km wide (Ralph et al. 2004; Neiman et al. 2008).
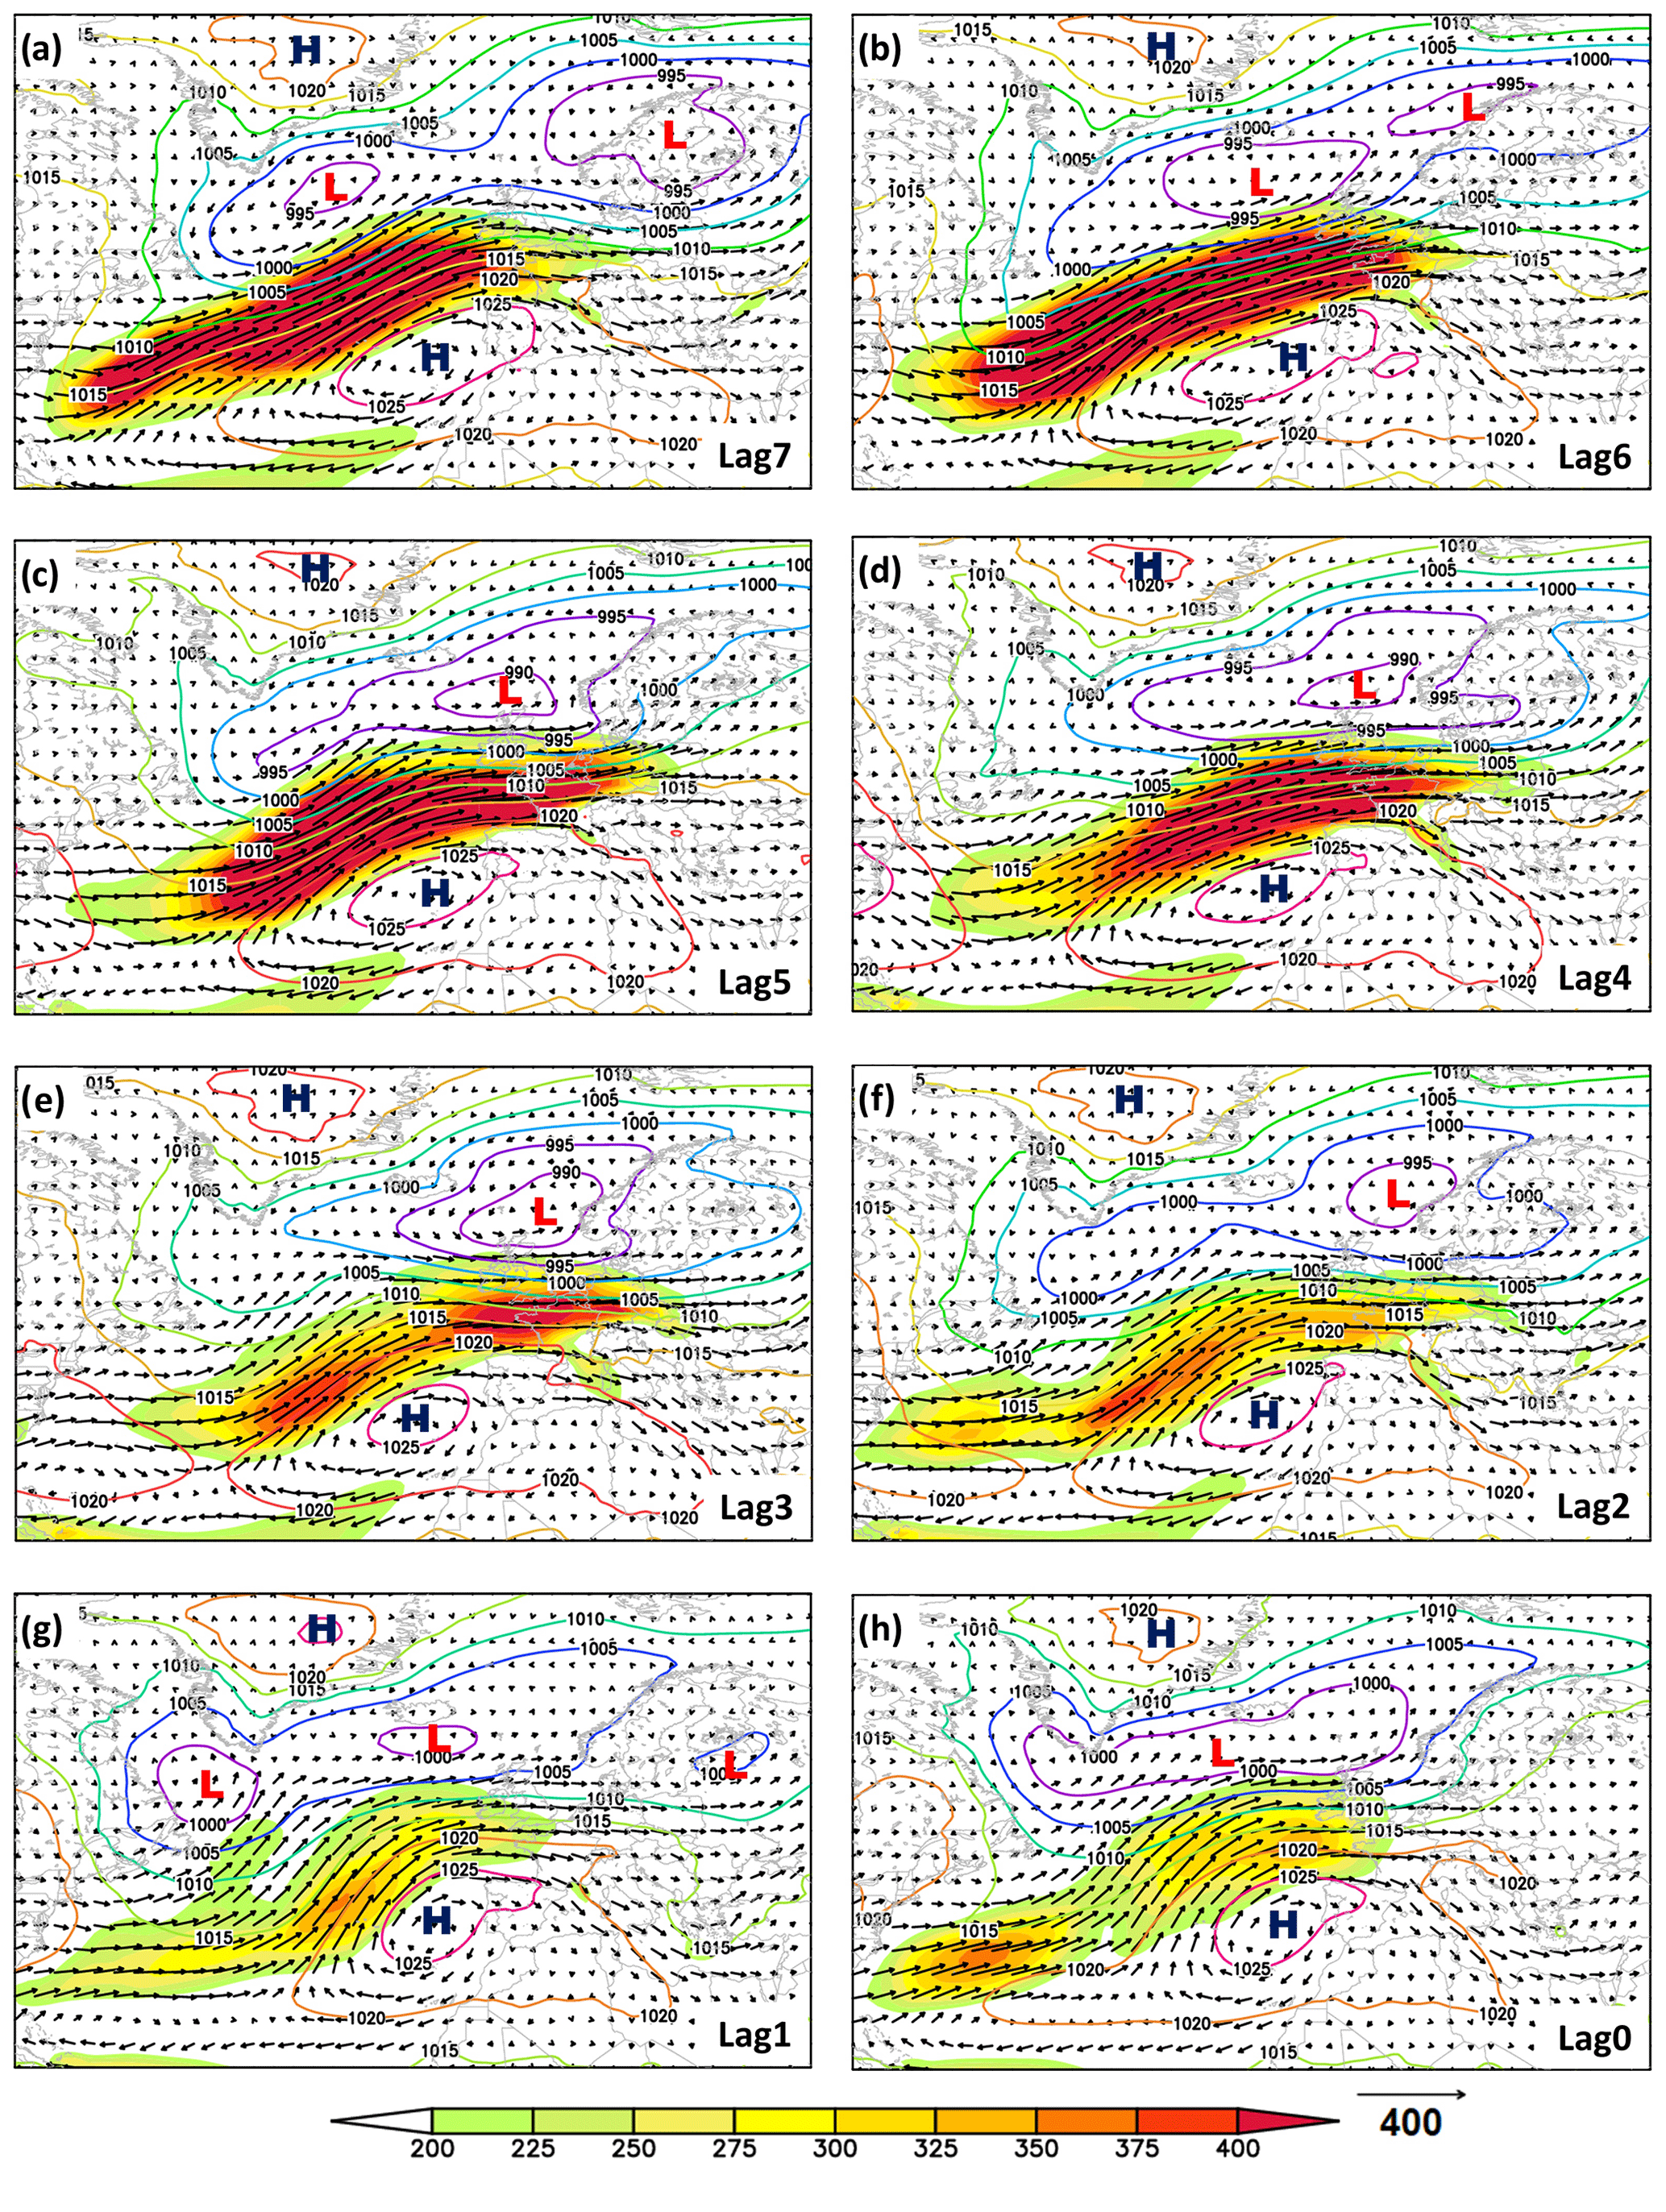
Figure 11Composite of the mean sea level pressure (SLP; colored contour lines), magnitude of the integrated water vapor transport (IVT; shading) and the direction of the integrated water vapor transport (vectors) for different time lags (0–7 d) for the 10 highest flood peaks recorded at the Köln gauging station (see Table 1). Units: SLP (hPa) and IVT (kg s−1 m−1).
Snapshots of the evolution of the AR axis, indicating the development and propagation of the AR prior to the occurrence date of the top 10 flood peaks over the last 180 years, are shown in Fig. 12. The evolution of ARs for the different snapshots further demonstrates the importance of moisture transport from the North Atlantic Ocean in producing damaging floods in the lower part of the Rhine basin. In all cases, the moisture transport is directed toward the northwestern part of France, penetrating to the western part of Germany. The axis of the ARs is strongly influenced by the dipole-like structure in the SLP field, with a migrating deep low over the central part of the North Atlantic and a high pressure system over the northern part of Africa and the Iberian Peninsula. For all of the 10 analyzed cases, there was at least one AR preceding the flood peak with a lag varying between 2 and 7 d. The maximum of the IVT over the catchment area of Rhine is reached from 4 up to 6 d prior to each flood peak (Table 2).
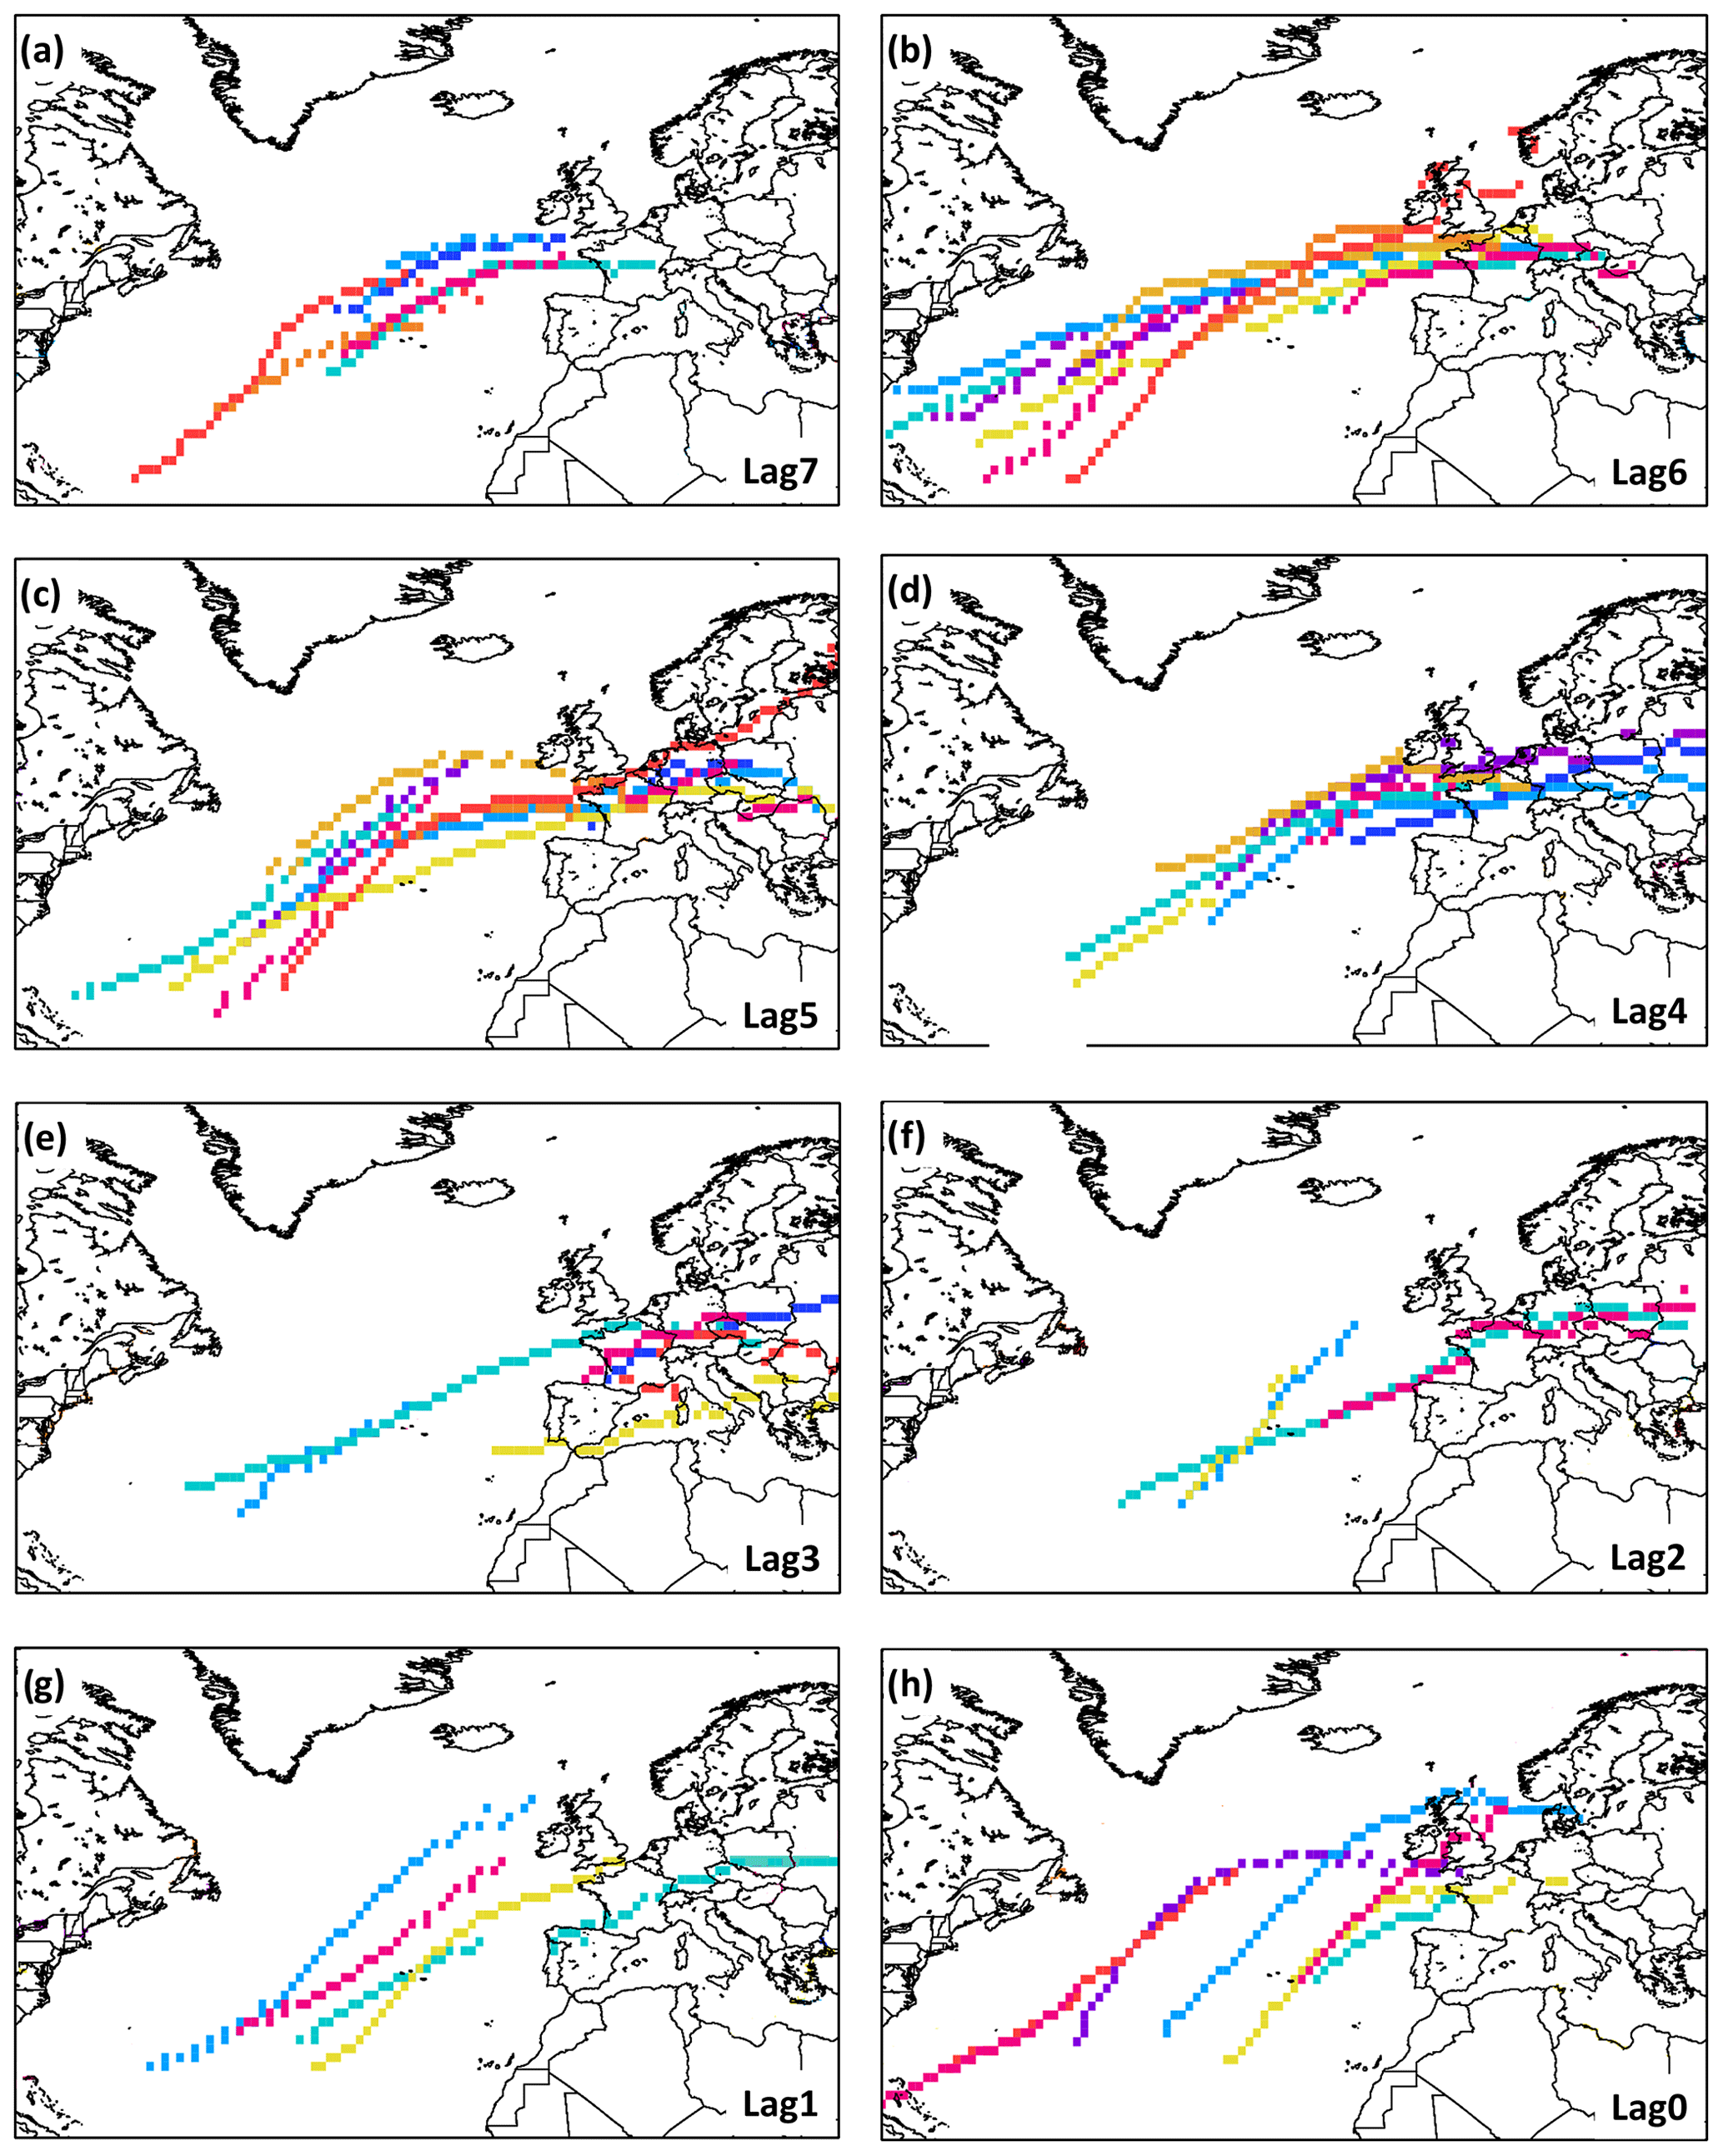
Figure 12The AR axis location for the top 10 winter floods with different time lags (0–7 d). Each color is assigned to a flood peak.
For a long-term perspective, there is a significant positive trend in the AR occurrence rate (∼0.9 d per decade) over the analyzed region (Fig. 13a), which is corroborated with a positive, but not significant, trend in the precipitation averaged over the catchment area of the Rhine over the winter months (November–March; Fig. 13b). The highest magnitude of ARs reaching the lower Rhine was recorded from the 1990s onward. The increase in the number of ARs reaching the lower Rhine, and the positive trend in precipitation, does not necessarily mean an increase in the annual maxima of the daily streamflow at the Köln gauging station over the period 1836–2015 (Fig. 13c). The lack of change in the amplitude of the annual maxima at the Köln gauging station might also be influenced by the lack of snow cover, which is a prerequisite for extreme flood peaks like in the case of the years 1925–1926, 1993 and 1995. At country level, snow days have decreased uniformly at a rate of 0.5 d yr−1 in the recent past (Kreyling, 2011), with this trend being projected to continue to a point where significant parts of Germany will no longer regularly experience snow cover.
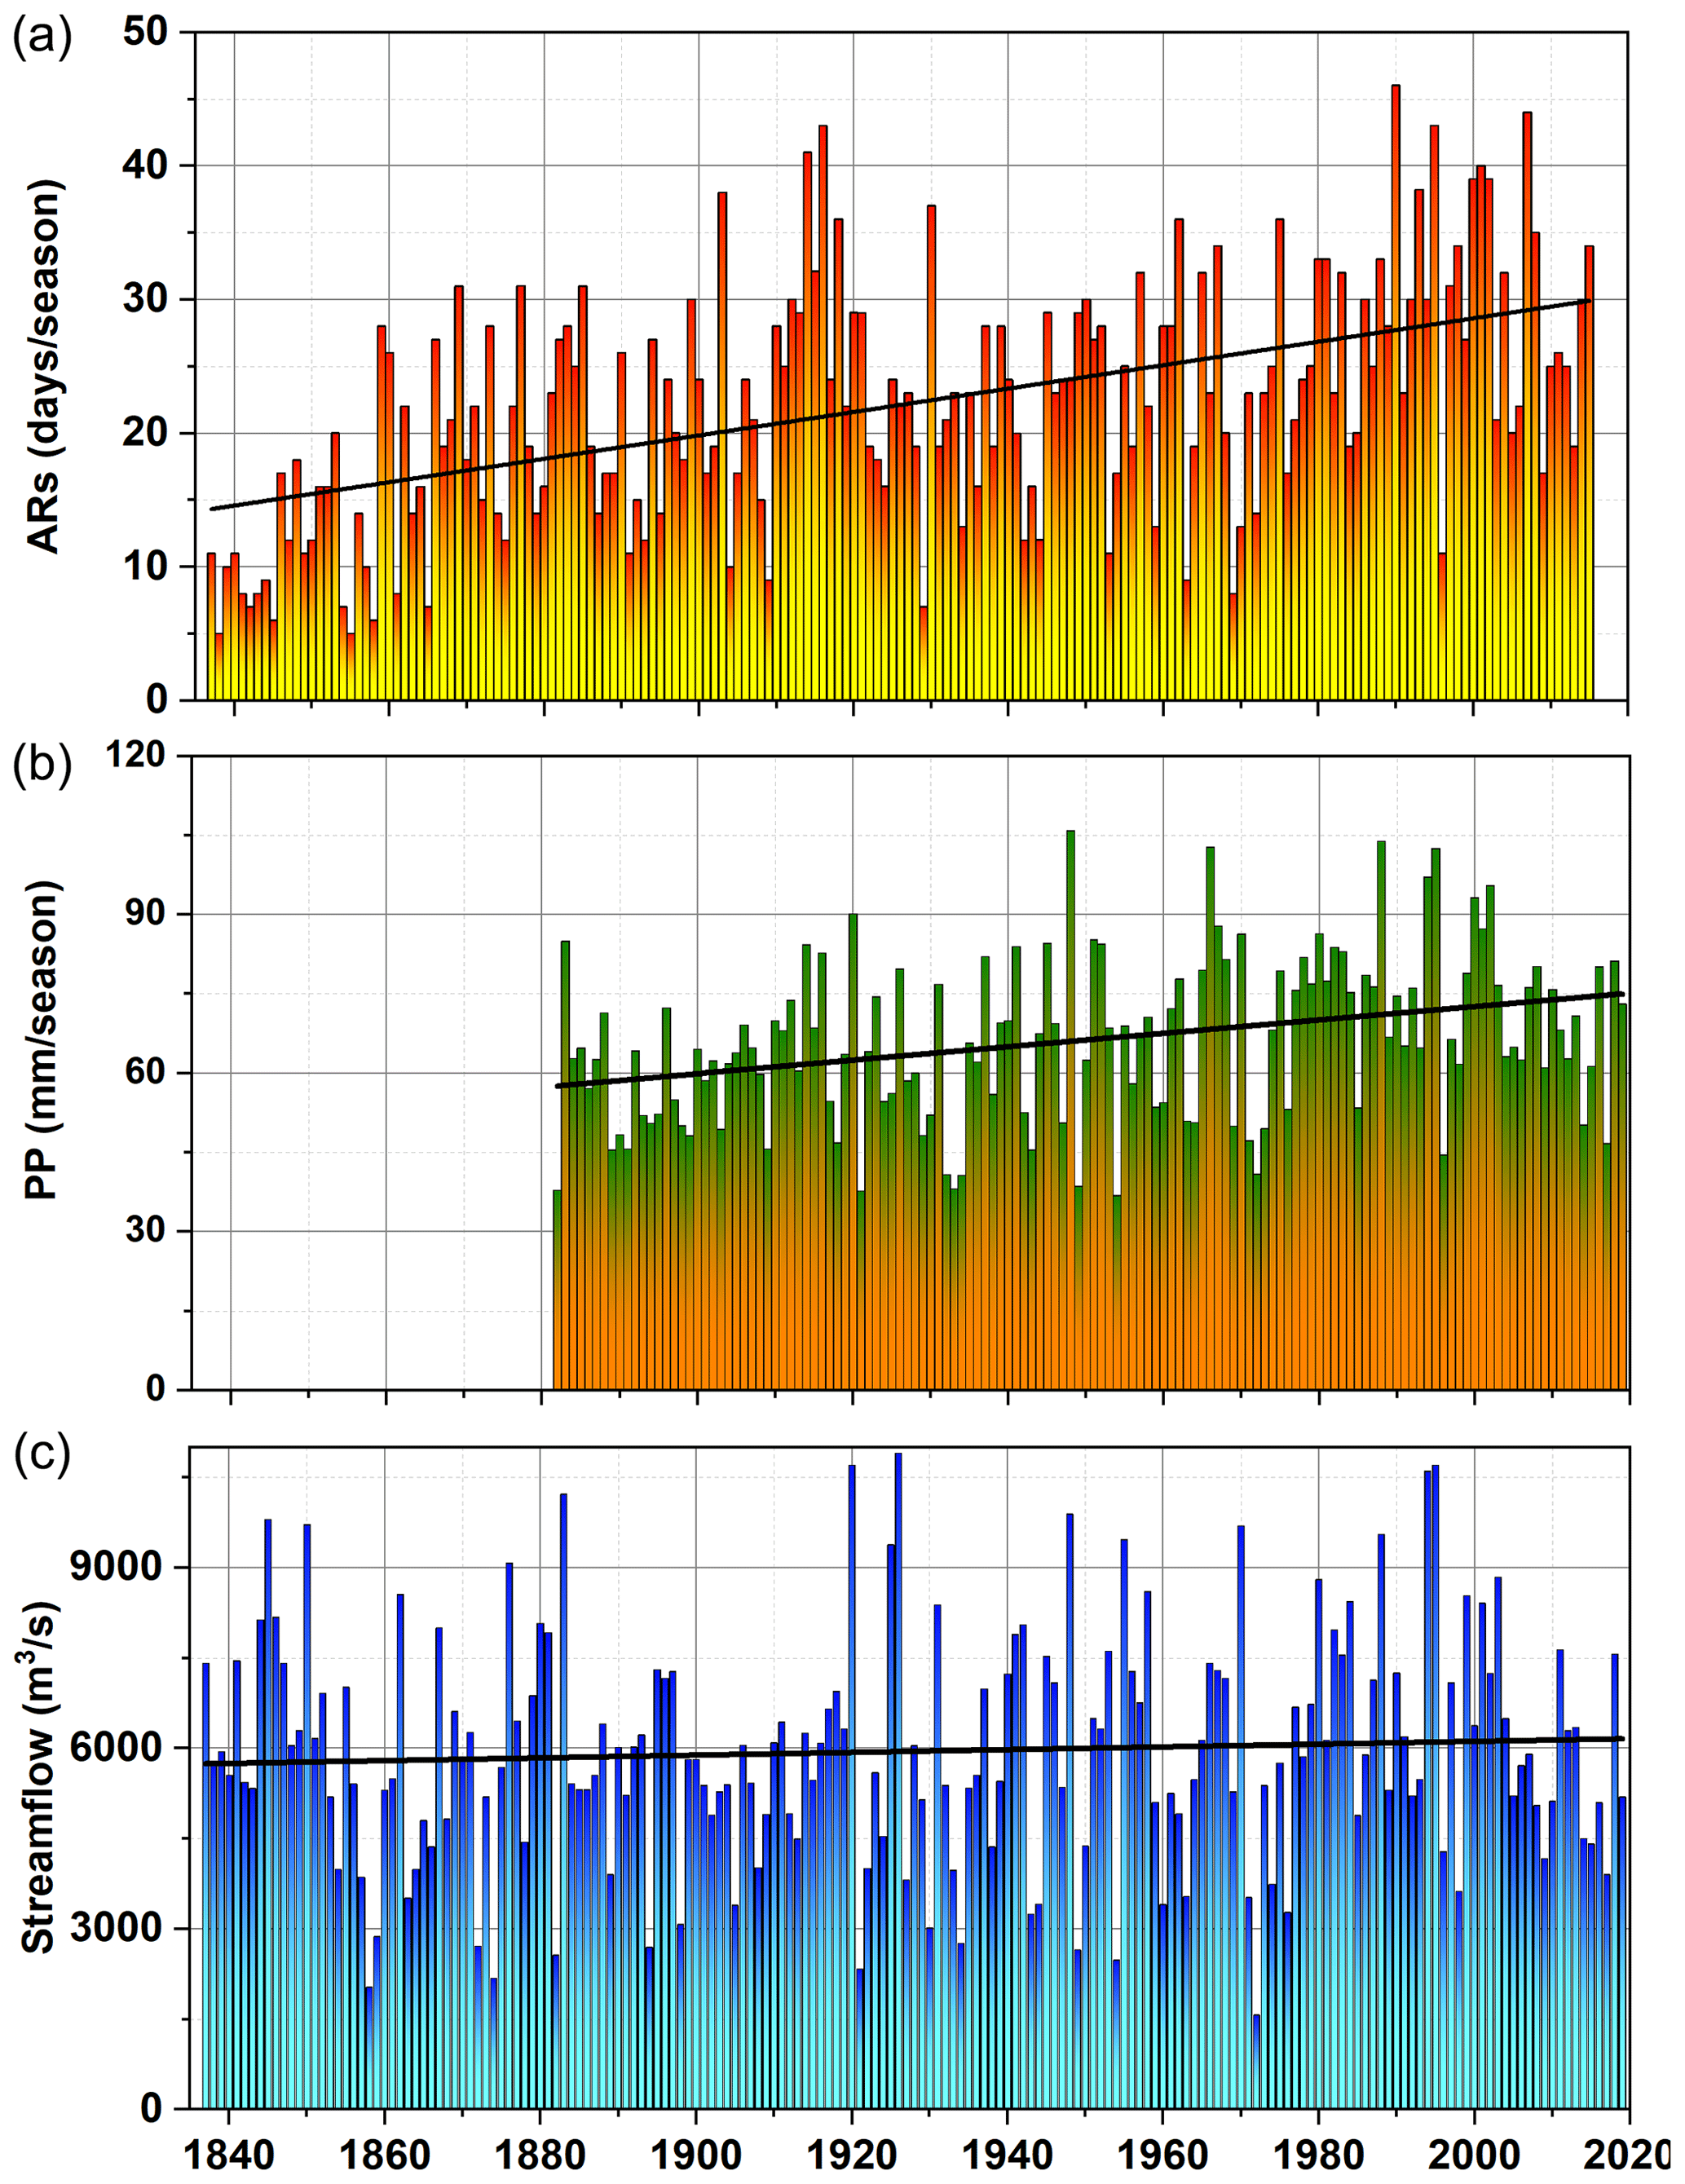
Figure 13(a) Number of days per season with ARs over the region (4–12∘ E, 47–56∘ N) for the period 1836–2015. (b) Seasonal precipitation averaged over the German side of the Rhine catchment area for the period 1881–2019. (c) Daily maximum streamflow at the Köln gauging station over the period 1836–2019. For panels (a–c), we used only the period of November–March for the analysis.
3.5 NAO and circulation types
Over the analyzed region, the flood events of 1970, 1988, 1993 and 1995 were all preceded by days with a positive NAO index (not shown). In the case of the 1993 flood event, the daily NAO index was characterized by positive values for almost 2 consecutive months (26 October–22 December 1993). For the whole analyzed period (1836–2019), only monthly data are available for the NAO index. A visual inspection of the NAO index during the month of each flood event indicates that in nine out of the 10 extreme floods events, the NAO was in a positive phase. The only exception is the flood peak from 31 March 1845 (March NAO = −0.54). The values of the NAO index for each flood peak are shown in Table 3. Overall, extreme flood peaks in the lower Rhine region seem to be preceded by a positive phase of the NAO. A positive phase of NAO is, in general, associated with an increased chance of higher rainfall in northwestern Europe and lower rainfall in southern Europe. The long-lasting positive NAO prior to most of the flood peaks might be one of the main drivers behind the high magnitude of the ARs. Zavadoff and Kirtman (2020) showed that long-lasting phases of the NAO have a more significant influence on the AR distribution when compared to short-lived NAO phases.
Looking into more detail at a country level, the influence of NAO on the hydroclimate of Germany was found to be very complex (Riaz et al., 2017). The relationship between the winter NAO and precipitation was found to be rather weak in the southern part of Germany but statistically significant in the northern part. Riaz et al. (2017) showed that the precipitation over Germany is mainly influenced by the position of the Icelandic Low, which is independent of the strength and position of the Azores High. Thus, by using the state-of-the-art definition of the NAO, namely the difference in the sea level pressure between Iceland and Azores, one cannot capture the real influence of NAO on the central European climate. A way to tackle this issue is to look at synoptic scale circulation types (e.g., Großwetterlage, Hess and Brezowsky, 1952). When looking at particular circulation types (e.g., Großwetterlage), the extreme flood peaks from 1881 onward are all mainly preceded by days featuring either cyclonic west wind (WZ) or southern west wind (WS) circulation types. Both types represent zonal circulation types (westerly flow) associated with extreme precipitation and floods over Germany (Petrow et al., 2009). For example, the 1993 and 1995 flood events were preceded by days featuring just the WZ circulation type (Table 3). Caspary (1995) showed that, over the period 1926–1996, nearly all flood events in the upper Danube basin have been caused by the WZ circulation type. In their study, Petrow et al. (2009) found that 62 % of the maximum discharges in the basins situated in the western part of Germany are triggered by the circulation patterns of WZ, WS, southwest cyclonic (SWZ) and NWZ. In this study, we have found that the WZ circulation type was present, in the days prior to the flood peaks, in seven out of eight analyzed extreme flood events over the period 1881–2019 (Table 2). For the 1993 and 1995 flood events, only the WZ circulation type was present in the days prior to the flood peak. Overall, the occurrence of these circulation types (WZ and WS) seem to be a prerequisite for extreme flood events in central part of Europe (Caspary, 1995; Petrow et al., 2009).
The variability in European precipitation in winter is strongly affected by enhanced moisture transport from the subtropical North Atlantic basin (Lavers and Villarini, 2015; Lu et al., 2013). Overall, ARs are responsible for ∼20 %–30 % of all recorded precipitation in regions situated in the western part of Europe (mainly France and the Iberian Peninsula; Gimeno et al., 2016). While ARs are essential ingredients for producing heavy rainfall events and flooding over the coastal areas of the European continent (e.g., Portugal, Spain, France and Norway) little is known about their influence on the precipitation and flood events in inland Europe (Gimeno et al., 2016). Although there have been numerous studies linking ARs with floods and heavy precipitation over large parts of the world (Neiman et al., 2008; Lavers et al., 2011; Dettinger, 2011; Lavers and Villarini, 2013b; Gimeno et al., 2016; Paltan et al., 2017; Vázquez et al., 2017; Benedict et al., 2019; Guan and Waliser, 2019, among others), this is the first study in which ARs are linked with specific events of extreme flooding in inland Europe and, more specifically, over the lower part of Rhine catchment area, which is one of the biggest rivers in Europe. The lower part of Rhine catchment area is dominated by winter floods which are often caused by westerly, southwesterly and northwesterly large-scale circulation types (Beurton and Thieken, 2009).
In this study, we have shown that extreme floods in winter, based on their magnitude, occur predominantly during mild and wet episodes, associated with a southward shift of the polar front, and frontal systems moving from the North Atlantic basin toward Europe, together with intense moisture transport from the subtropical North Atlantic basin to the western part of Europe. From a hydrological point of view (e.g., flood peak magnitude), the 1925–1926 flood was the worst flood of the 20th century at the Köln gauging station. However, the total volume of water was much higher for the 1993 flood than for that of 1925–1926 (Engel et al., 1999). The Rhine transported ∼60 % more water during the 1993 flood compared to the 1925–1926 flood event. The total damage caused by the Rhine flood in 1993 was estimated to be at EUR ∼1.4 billion; however, the damage caused by the Christmas flood in 1995 was only about half as great as the flood in 1993 due the preventative measures implemented by the Rhine countries after the 1993 flood event and due to earlier flood warnings.
Although the mechanism behind each individual extreme flood can be rather different (e.g., heavy snowfall, a sharp increase in the mean air temperature followed by thawing and/or just extreme rainfall events), all the analyzed floods have one thing in common, which is that the heavy snowfall and/or rainfall is driven by intense moisture transport from the Atlantic basin toward the northern part of France and western part of Germany, in narrow and long bands, which, once in contact with high mountain regions over the Moselle catchment area and parts of Rhine catchment area, lead to extreme flooding. The precipitation anomalies associated with extreme flood peaks are not just local; they occur on a larger spatial scale (Figs. S8 and S11). The spatial structure of the precipitation reflects the mean direction in which the IVT and, thus, the ARs are moving toward Europe. The typical large-scale synoptic circulation pattern, leading to heavy rainfall events and extreme flooding in the lower part of Rhine's catchment area, is characterized by a deep and mobile low pressure center south of Greenland, which migrates toward the northern part of Europe, and a high pressure system over the northern part of Africa and southern part of Europe. The dipole-like structure in the SLP field leads to a southwesterly flow over France and western Germany. As the plume of moisture ascends the warm sector of the extratropical cyclone, and as it is forced to rise over the Vosges mountains in France and Hunsrück and Eifel mountains in Germany, it precipitates out, thus producing extreme rainfall in a relatively narrow band and extreme flooding some days later.
The strong pole to Equator temperature gradient in winter results in an enhanced baroclinic zone and storm tracks that affect the western part of Europe. The extratropical cyclones associated with the extreme flooding events over western part of Europe, including the lower catchment area of the Rhine, grow in these baroclinic zones which also contain the ARs that make landfall over the European landmass (Lavers and Villarini, 2013b). The influence of ARs on the Rhine flood events is done via the prevailing large-scale atmospheric circulation, and most of the ARs associated with these flood events are embedded in the trailing fronts of the extratropical cyclones. The evolution of the atmospheric circulation during the days prior to the floods are limited mainly to changes in the amplitude of the sea level pressure. The low pressure systems develop a stronger anomaly than their high pressure counterparts. The dipole SLP pattern observed during the days prior to the flood peaks is reminiscent of the positive phase of NAO, and it guides the water vapor in a narrow band through France and the English Channel to the western part of Germany. This was also confirmed by looking at the daily and monthly values of the NAO index during the days prior to the flood events or the monthly NAO index during the month of the flood. In nine out of 10 extreme floods events, the monthly NAO was in a positive phase. The influence of the NAO on the flooding events over our analyzed region is made via the influence on the frequency and the direction of the extratropical cyclones. The phase of the NAO has a strong impact on the extratropical cyclones' frequency, affecting both the location and the orientation of the cyclone tracks, with extreme cyclones occurring more (less) frequently during strong positive (negative) NAO phases (Pinto et al., 2009).
The higher amplitude of the low pressure systems indicates the importance of the extratropical cyclones in directing the storm tracks toward the central part of Europe. The synoptic situation in a PV framework, for the days characterized by heavy rainfall, exhibits meridional, elongated PV anomalies associated with anticyclonic Rossby wave breaking. ARs activity over western Europe is linked with midlatitude Rossby wave breaking and strong PV anomalies (Zavadoff and Kirtman, 2020). The flood peaks of 1925–1926, 1993 and 1995 have the passage of sharp meridional PV gradient associated with anticyclonic RWB in common. These PV transitions at the tropopause level are accompanied, in all analyzed cases, by the advection of warm and humid air over the Rhine catchment area and cold air intrusions over the eastern part of Europe. PV streamers and anticyclonic Rossby wave breaking have also been associated with extreme precipitation and flooding over the alpine region (Froidevaux and Martius, 2016; Martius et al., 2006; Rimbu et al., 2020).
One of the most interesting findings of this study has been the fact that the extreme floods are preceded, especially 4–5 d in advance (Fig. 12), by intense moisture transport from the subtropical Atlantic in the form of ARs. The time lag between the AR occurrence and flood peak is related to the fact that multiple factors (e.g., duration of precipitation, travel time from the tributaries to the Köln gauging station, snowpack and soil moisture) are influencing the magnitude of the flood wave. Thus, this time lag between the AR occurrence and the flood peak, in the lower part of the catchment area of the Rhine, can be used as a potential predictor for the upcoming floods in the lower part of Rhine catchment area. Overall, the North Atlantic ARs are projected to increase both in magnitude and frequency, implying a greater risk of extreme rainfall and flooding (Lavers et al., 2013). Thus, more studies are needed to test if smaller flood peak are also associated with intense moisture transport and their potential predictability.
This study adds a new understanding of the meteorological processes leading to the occurrence of extreme rainfall events and flooding in the central part of Europe. Identifying ARs as potential contributors to floods in the lower part of the Rhine catchment area, and thus inland Europe, indicates the need for further studies to better understand the drivers of hydrometeorological extremes over different parts of Europe, thus allowing for a better assessment of flood risk.
All data sets used as input in our study can be found in the respective references.
The supplement related to this article is available online at: https://doi.org/10.5194/hess-24-5125-2020-supplement.
MI designed the study and wrote the paper. VN and BG helped with the writing of the paper and the interpretation of the results.
The authors declare that they have no conflict of interest.
This study was made possible by Helmholtz funding through the Polar regions and Coasts in the Changing Earth System (PACES) program of the AWI. Funding from the AWI strategy fund project, PalEX, and from the Helmholtz Climate Initiative, REKLIM, is gratefully acknowledged.
The article processing charges for this open-access publication were covered by a Research Centre of the Helmholtz Association.
This paper was edited by Nadav Peleg and reviewed by three anonymous referees.
Allan, R. P., Liu, C., Zahn, M., Lavers, D. A., Koukouvagias, E., and Bodas-Salcedo, A.: Physically Consistent Responses of the Global Atmospheric Hydrological Cycle in Models and Observations, Surv. Geophys., 35, 533–552, https://doi.org/10.1007/s10712-012-9213-z, 2014.
Barredo, J. I.: Major flood disasters in Europe: 1950–2005, Nat. Hazards, 42, 125–148, https://doi.org/10.1007/s11069-006-9065-2, 2007.
Barredo, J. I.: Normalised flood losses in Europe: 1970–2006, Nat. Hazards Earth Syst. Sci., 9, 97–104, https://doi.org/10.5194/nhess-9-97-2009, 2009.
Belz, J. U.: Das abflussregime des rheins und seiner nebenflüsse im 20. Jahrhundert – Analyse, veränderungen, trends, Hydrol. Wasserbewirt., 54, 4–17, 2010.
Belz, J. U., Brahmer, G., Buiteveld, H., Engel, H., Grabher, R., Hodel, H., Krahe, P., Lammersen, R., Larina, M., Mendel, H., Meuser, A., Plonka, B., Pfister, L., and Van Vuuren, W.: Das Abflussregime des Rheins und seiner Nebenflüsse Analyse, Veränderungen, Trends, CHR report No. I-22, International Commission for the Hydrology of the Rhine basin, available at: https://www.chr-khr.org/sites/default/files/extended_abstract_i_22_d.pdf (last access: 10 February 2020), 2007.
Benedict, I., Ødemark, K., Nipen, T., and Moore, R.: Large-scale flow patterns associated with extreme precipitation and atmospheric rivers over Norway, Mon. Weather Rev., 147, 1415–1428, https://doi.org/10.1175/MWR-D-18-0362.1, 2019.
Beurton, S. and Thieken, A. H.: Seasonality of floods in Germany, Hydrolog. Sci. J., 54, 62–76, https://doi.org/10.1623/hysj.54.1.62, 2009.
Bissolli, P., Friedrich, K., Rapp, J., and Ziese, M.: Flooding in eastern central Europe in May 2010 – Reasons, evolution and climatological assessment, Weather, 66, 147–153, https://doi.org/10.1002/wea.759, 2011.
Blöschl, G., Gaál, L., Hall, J., Kiss, A., Komma, J., Nester, T., Parajka, J., Perdigão, R. A. P., Plavcová, L., Rogger, M., Salinas, J. L., and Viglione, A.: Increasing river floods: fiction or reality?, Wiley Interdiscip. Rev. Water, 2, 329–344, https://doi.org/10.1002/wat2.1079, 2015.
Bornefeld, L.: Das Weihnachtshochwasser 1993 des Rheins, in: Ein Beitrag des Staatlichen Amtes für Wasser- und Abfallwirtschaft Düsseldorf, Düsseldorf, 1994.
Brands, S., Gutiérrez, J. M., and San-Martín, D.: Twentieth-century atmospheric river activity along the west coasts of Europe and North America: algorithm formulation, reanalysis uncertainty and links to atmospheric circulation patterns, Clim. Dynam., 48, 2771–2795, https://doi.org/10.1007/s00382-016-3095-6, 2017.
Browning, K. A., Roberts, N. M., and Illingworth, A. J.: Mesoscale analysis of the activation of a cold front during cyclogenesis, Q. J. Roy. Meteorol. Soc., 123, 2349–2374, https://doi.org/10.1002/qj.49712354410, 1997.
Caspary, H. J.: Recent winter floods in Germany caused by changes in the atmospheric circulation across Europe, Phys. Chem. Earth, 20, 459–462, https://doi.org/10.1016/S0079-1946(96)00006-7, 1995.
Chbab, E. H.: How extreme were the 1995 flood waves on the rivers Rhine and Meuse?, Phys. Chem. Earth, 20, 455–458, https://doi.org/10.1016/S0079-1946(96)00005-5, 1995.
Cornes, R. C., van der Schrier, G., van den Besselaar, E. J. M., and Jones, P. D.: An Ensemble Version of the E-OBS Temperature and Precipitation Data Sets, J. Geophys. Res.-Atmos., 123, 9391–9409, https://doi.org/10.1029/2017JD028200, 2018.
Dacre, H. F., Clark, P. A., Martinez-Alvarado, O., Stringer, M. A., and Lavers, D. A.: How Do Atmospheric Rivers Form?, B. Am. Meteorol. Soc., 96, 1243–1255, https://doi.org/10.1175/BAMS-D-14-00031.1, 2015.
DeFlorio, M. J., Waliser, D. E., Guan, B., Ralph, F. M., and Vitart, F.: Global evaluation of atmospheric river subseasonal prediction skill, Clim. Dynam., 52, 3039–3060, https://doi.org/10.1007/s00382-018-4309-x, 2019.
Dettinger, M.: Climate change, atmospheric rivers, and floods in California – a multimodel analysis of storm frequency and magnitude changes, J. Am. Water Resour. Assoc., 47, 514–523, https://doi.org/10.1111/j.1752-1688.2011.00546.x, 2011.
Deutscher Wetterdienst: Dezember 1993 – Monatlicher Witterungsbericht, Offenbach, 1994.
Disse, M. and Engel, H.: Flood events in the Rhine basin: Genesis, influences and mitigation, Nat. Hazards, 23, 271–290, https://doi.org/10.1023/A:1011142402374, 2001.
Eiras-Barca, J., Brands, S., and Miguez-Macho, G.: Seasonal variations in north atlantic atmospheric river activity and associations with anomalous precipitation over the iberian atlantic margin, J. Geophys. Res., 121, 931–948, https://doi.org/10.1002/2015JD023379, 2016.
Eiras-Barca, J., Lorenzo, N., Taboada, J., Robles, A., and Miguez-Macho, G.: On the relationship between atmospheric rivers, weather types and floods in Galicia (NW Spain), Nat. Hazards Earth Syst. Sci., 18, 1633–1645, https://doi.org/10.5194/nhess-18-1633-2018, 2018.
Engel, H.: The flood events of 1993/1994 and 1995 in the Rhine River basin, IAHS-AISH Publ., 239, 21–32, 1997.
Engel, H.: Eine Hochwasserperiode im Rheingebiet – Extremereignisse zwischen Dez. 1993 und Febr. 1995, Bericht I-17, Internationale Kommission für die Hydrologie des Rheingebietes (KHR), Lelystad, 1–129, 1999.
Engel, H., Busch, N., Wilke, K., Krahe, P., Mendel, H.-G., Giebel, H., and Zieger, C.: Das Hochwasser 1993/94 im Rheingebiet, German Federal Institute of Hydrology for the Japan Institute of Construction Engineering (JICE), 1994.
Engel, H., Busch, N., Helm, J., Keller, M., Ottens, J., Parmet, B., and Sprokkereef, E.: Eine Hochwasserperiode im Rheingebiet Extremereignisse zwischen Dez. 1993 und Febr. 1995, CHR/KHR – International Commission for the Hydrology of the Rhine basin, Lelystad, 1999.
Fick, S. E. and Hijmans, R. J.: WorldClim 2: new 1-km spatial resolution climate surfaces for global land areas, Int. J. Climatol., 37, 4302–4315, https://doi.org/10.1002/joc.5086, 2017.
Fink, A., Ulbrich, U., and Engel, H.: Aspects of the January 1995 flood in Germany, Weather, 51, 34–39, https://doi.org/10.1002/j.1477-8696.1996.tb06182.x, 1996.
Froidevaux, P. and Martius, O.: Exceptional integrated vapour transport toward orography: an important precursor to severe floods in Switzerland, Q. J. Roy. Meteorol. Soc., 142, 1997–2012, https://doi.org/10.1002/qj.2793, 2016.
Gimeno, L., Dominguez, F., Nieto, R., Trigo, R., Drumond, A., Reason, C. J. C. C., Taschetto, A. S., Ramos, A. M., Kumar, R., and Marengo, J.: Major Mechanisms of Atmospheric Moisture Transport and Their Role in Extreme Precipitation Events, Annu. Rev. Environ. Resour., 41, 117–141, https://doi.org/10.1146/annurev-environ-110615-085558, 2016.
Guan, B. and Waliser, D. E.: Detection of atmospheric rivers: Evaluation and application of an algorithm for global studies, J. Geophys. Res.-Atmos., 120, 12514–12535, https://doi.org/10.1002/2015JD024257, 2015.
Guan, B. and Waliser, D. E.: Tracking Atmospheric Rivers Globally: Spatial Distributions and Temporal Evolution of Life Cycle Characteristics, J. Geophys. Res.-Atmos., 124, 12523–12552, https://doi.org/10.1029/2019JD031205, 2019.
Guan, B., Molotch, N. P., Waliser, D. E., Fetzer, E. J., and Neiman, P. J.: The 2010/2011 snow season in California's Sierra Nevada: Role of atmospheric rivers and modes of large-scale variability, Water Resour. Res., 49, 6731–6743, https://doi.org/10.1002/wrcr.20537, 2013.
Guan, B., Waliser, D. E., and Ralph, F. M.: An Intercomparison between Reanalysis and Dropsonde Observations of the Total Water Vapor Transport in Individual Atmospheric Rivers, J. Hydrometeorol., 19, 321–337, https://doi.org/10.1175/JHM-D-17-0114.1, 2017.
Hegdahl, T. J., Engeland, K., Müller, M., and Sillmann, J.: An event-based approach to explore selected present and future Atmospheric River induced floods in western Norway, J. Hydrometeorol., 1, 2003–2021, https://doi.org/10.1175/JHM-D-19-0071.1, 2020.
Hess, P. and Brezowsky, H.: Katalog der Grosswetterlagen Europas, Deutscher Wetterdienst in d. US-Zone, Berichte des Deutschen Wetterdienstes 113, Deutscher Wetterdienst, Offenbach am Main, 1952.
Hoskins, B. J., Draghici, I., and Davies, H. C.: A new look at the ω-equation, Q. J. Roy. Meteorol. Soc., 104, 31–38, https://doi.org/10.1002/qj.49710443903, 1978.
Hu, H., Dominguez, F., Wang, Z., Lavers, D. A., Zhang, G., and Ralph, F. M.: Linking Atmospheric River Hydrological Impacts on the U.S. West Coast to Rossby Wave Breaking, J. Climate, 30, 3381–3399, https://doi.org/10.1175/JCLI-D-16-0386.1, 2017.
Ionita, M.: Interannual summer streamflow variability over Romania and its connection to large-scale atmospheric circulation, Int. J. Climatol., 35, 4186–4196, https://doi.org/10.1002/joc.4278, 2015.
Ionita, M., Dima, M., Lohmann, G., Scholz, P., and Rimbu, N.: Predicting the June 2013 European Flooding Based on Precipitation, Soil Moisture, and Sea Level Pressure, J. Hydrometeorol., 16, 598–614, https://doi.org/10.1175/JHM-D-14-0156.1, 2015.
Kelman, I.: The autumn 2000 floods in England and flood management, Weather, 56, 346–360, https://doi.org/10.1002/j.1477-8696.2001.tb06507.x, 2001.
Kreyling, J.: Vanishing winters in Germany: soil frost dynamics and snow cover trends, and ecological implications, Clim. Res., 46, 269–276, 2011.
Krichak, S. O., Breitgand, J. S., Gualdi, S., and Feldstein, S. B.: Teleconnection – extreme precipitation relationships over the Mediterranean region, Theor. Appl. Climatol., 117, 679–692, https://doi.org/10.1007/s00704-013-1036-4, 2014.
Lavers, D. A. and Villarini, G.: Atmospheric rivers and flooding over the central United States, J. Climate, 26, 7829–7836, https://doi.org/10.1175/JCLI-D-13-00212.1, 2013a.
Lavers, D. A. and Villarini, G.: The nexus between atmospheric rivers and extreme precipitation across Europe, Geophys. Res. Lett., 40, 3259–3264, https://doi.org/10.1002/grl.50636, 2013b.
Lavers, D. A. and Villarini, G.: The contribution of atmospheric rivers to precipitation in Europe and the United States, J. Hydrol., 522, 382–390, https://doi.org/10.1016/j.jhydrol.2014.12.010, 2015.
Lavers, D. A., Allan, R. P., Wood, E. F., Villarini, G., Brayshaw, D. J., and Wade, A. J.: Winter floods in Britain are connected to atmospheric rivers, Geophys. Res. Lett., 38, 1–8, https://doi.org/10.1029/2011GL049783, 2011.
Lavers, D. A., Allan, R. P., Villarini, G., Lloyd-Hughes, B., Brayshaw, D. J., and Wade, A. J.: Future changes in atmospheric rivers and their implications for winter flooding in Britain, Environ. Res. Lett., 8, 34010, https://doi.org/10.1088/1748-9326/8/3/034010, 2013.
Lavers, D. A., Pappenberger, F., and Zsoter, E.: Extending medium-range predictability of extreme hydrological events in Europe, Nat. Commun., 5, 5382, https://doi.org/10.1038/ncomms6382, 2014.
Lu, M., Lall, U., Schwartz, A., and Kwon, H.: Precipitation predictability associated with tropical moisture exports and circulation patterns for a major flood in France in 1995, Water Resour. Res., 49, 6381–6392, https://doi.org/10.1002/wrcr.20512, 2013.
Martius, O., Zenklusen, E., Schwierz, C., and Davies, H. C.: Episodes of alpine heavy precipitation with an overlying elongated stratospheric intrusion: a climatology, Int. J. Climatol., 26, 1149–1164, https://doi.org/10.1002/joc.1295, 2006.
Meißner, D., Klein, B., and Ionita, M.: Development of a monthly to seasonal forecast framework tailored to inland waterway transport in central Europe, Hydrol. Earth Syst. Sci., 21, 6401–6423, https://doi.org/10.5194/hess-21-6401-2017, 2017.
Min, T.: Assessment of the effects of climate variability and land use change on the hydrology of the meuse river basin, A. A. Balkema Publishers, a member of Taylor & Francis Group plc., available at: http://dare.ubvu.vu.nl/bitstream/1871/10234/1/Tu_Min_PhD_Thesis.pdf (last access: 3 February 2020), 2006.
Muchan, K., Lewis, M., Hannaford, J., and Parry, S.: The winter storms of 2013/2014 in the UK: hydrological responses and impacts, Weather, 70, 55–61, https://doi.org/10.1002/wea.2469, 2015.
Münchener Rückversicherungs-Gesellschaft: Naturkatastrophen in Deutschland – Schadenerfahrungen und Schadenpotentiale, München, 1999.
Neiman, P. J., Ralph, F. M., Wick, G. A., Lundquist, J. D., and Dettinger, M. D.: Meteorological characteristics and overland precipitation impacts of atmospheric rivers affecting the West coast of North America based on eight years of SSM/I satellite observations, J. Hydrometeorol., 9, 22–47, https://doi.org/10.1175/2007JHM855.1, 2008.
Neiman, P. J., Schick, L. J., Martin Ralph, F., Hughes, M., and Wick, G. A.: Flooding in western washington: The connection to atmospheric rivers, J. Hydrometeorol., 12, 1337–1358, https://doi.org/10.1175/2011JHM1358.1, 2011.
O'Gorman, P. A. and Schneider, T.: The physical basis for increases in precipitation extremes in simulations of 21st-century climate change, P. Natl. Acad. Sci. USA, 106, 14773–14777, https://doi.org/10.1073/pnas.0907610106, 2009.
Paltan, H., Waliser, D., Lim, W. H., Guan, B., Yamazaki, D., Pant, R., and Dadson, S.: Global Floods and Water Availability Driven by Atmospheric Rivers, Geophys. Res. Lett., 44, 10,387-10,395, https://doi.org/10.1002/2017GL074882, 2017.
Paprotny, D., Sebastian, A., Morales-Nápoles, O., and Jonkman, S. N.: Trends in flood losses in Europe over the past 150 years, Nat. Commun., 9, 1–11, https://doi.org/10.1038/s41467-018-04253-1, 2018.
Payne, A. E. and Magnusdottir, G.: Dynamics of landfalling atmospheric rivers over the North Pacific in 30 years of MERRA reanalysis, J. Climate, 27, 7133–7150, https://doi.org/10.1175/JCLI-D-14-00034.1, 2014.
Peixoto, J. P. and Oort, A. H.: Physics of climate, Springer, Berlin, Heidelberg, 1992.
Petrow, T., Zimmer, J., and Merz, B.: Changes in the flood hazard in Germany through changing frequency and persistence of circulation patterns, Nat. Hazards Earth Syst. Sci., 9, 1409–1423, https://doi.org/10.5194/nhess-9-1409-2009, 2009.
Pfeiffer, M. and Ionita, M.: Assessment of Hydrologic Alterations in Elbe and Rhine Rivers, Germany, Water, 9, 684, https://doi.org/10.3390/w9090684, 2017.
Pinter, N., van der Ploeg, R. R., Schweigert, P., and Hoefer, G.: Flood magnification on the River Rhine, Hydrol. Process., 20, 147–164, https://doi.org/10.1002/hyp.5908, 2006.
Pinto, J. G., Zacharias, S., Fink, A. H., Leckebusch, G. C., and Ulbrich, U.: Factors contributing to the development of extreme North Atlantic cyclones and their relationship with the NAO, Clim. Dynam., 32, 711–737, https://doi.org/10.1007/s00382-008-0396-4, 2009.
Posthumus, H., Morris, J., Hess, T. M., Neville, D., Phillips, E., and Baylis, A.: Impacts of the summer 2007 floods on agriculture in England, J. Flood Risk Manage., 2, 182–189, https://doi.org/10.1111/j.1753-318X.2009.01031.x, 2009.
Ralph, F. M. and Dettinger, M. D.: Storms, floods, and the science of atmospheric rivers, Eos Trans. Am. Geophys. Union, 92, 265–266, https://doi.org/10.1029/2011EO320001, 2011.
Ralph, F. M., Neiman, P. J., and Wick, G. A.: Satellite and CALJET Aircraft Observations of Atmospheric Rivers over the Eastern North Pacific Ocean during the Winter of 1997/98, Mon. Weather Rev., 132, 1721–1745, https://doi.org/10.1175/1520-0493(2004)132<1721:SACAOO>2.0.CO;2, 2004.
Ralph, F. M., Neiman, P. J., Wick, G. A., Gutman, S. I., Dettinger, M. D., Cayan, D. R., and White, A. B.: Flooding on California's Russian River: Role of atmospheric rivers, Geophys. Res. Lett., 33, L13801, https://doi.org/10.1029/2006GL026689, 2006.
Ralph, F. M., Dettinger, M. C. L. D., Cairns, M. M., Galarneau, T. J., and Eylander, J.: Defining “Atmospheric river”: How the glossary of meteorology helped resolve a debate, B. Am. Meteorol. Soc., 99, 837–839, https://doi.org/10.1175/BAMS-D-17-0157.1, 2018.
Ralph, F. M., Rutz, J. J., Cordeira, J. M., Dettinger, M., Anderson, M., Reynolds, D., Schick, L. J., and Smallcomb, C.: A Scale to Characterize the Strength and Impacts of Atmospheric Rivers, B. Am. Meteorol. Soc., 100, 269–289, https://doi.org/10.1175/BAMS-D-18-0023.1, 2019.
Ramos, A. M., Trigo, R. M., Liberato, M. L. R., and Tomé, R.: Daily precipitation extreme events in the Iberian Peninsula and its association with atmospheric rivers, J. Hydrometeorol., 16, 579–597, https://doi.org/10.1175/JHM-D-14-0103.1, 2015.
Rauthe, M., Steiner, H., Riediger, U., Mazurkiewicz, A., and Gratzki, A.: A Central European precipitation climatology? Part I: Generation and validation of a high-resolution gridded daily data set (HYRAS), Meteorol. Z., 22, 235–256, https://doi.org/10.1127/0941-2948/2013/0436, 2013.
Riaz, S. M. F., Iqbal, M. J., and Hameed, S.: Impact of the North Atlantic Oscillation on winter climate of Germany, Tellus A, 69, 1406263, https://doi.org/10.1080/16000870.2017.1406263, 2017.
Rimbu, N., Lohmann, G., Ionita, M., Czymzik, M., and Brauer, A.: Interannual to millennial-scale variability of River Ammer floods and its relationship with solar forcing, Int. J. Climatol., https://doi.org/10.1002/joc.6715, in press, 2020.
Schlemmer, L., Martius, O., Sprenger, M., Schwierz, C., and Twitchett, A.: Disentangling the Forcing Mechanisms of a Heavy Precipitation Event along the Alpine South Side Using Potential Vorticity Inversion, Mon. Weather Rev., 138, 2336–2353, https://doi.org/10.1175/2009MWR3202.1, 2010.
Shields, C. A., Rutz, J. J., Leung, L. Y., Martin Ralph, F., Wehner, M., Kawzenuk, B., Lora, J. M., McClenny, E., Osborne, T., Payne, A. E., Ullrich, P., Gershunov, A., Goldenson, N., Guan, B., Qian, Y., Ramos, A. M., Sarangi, C., Sellars, S., Gorodetskaya, I., Kashinath, K., Kurlin, V., Mahoney, K., Muszynski, G., Pierce, R., Subramanian, A. C., Tome, R., Waliser, D., Walton, D., Wick, G., Wilson, A., Lavers, D., Prabhat, Collow, A., Krishnan, H., Magnusdottir, G., and Nguyen, P.: Atmospheric River Tracking Method Intercomparison Project (ARTMIP): Project goals and experimental design, Geosci. Model Dev., 11, 2455–2474, https://doi.org/10.5194/gmd-11-2455-2018, 2018.
Slivinski, L. C., Compo, G. P., Whitaker, J. S., Sardeshmukh, P. D., Giese, B. S., McColl, C., Allan, R., Yin, X., Vose, R., Titchner, H., Kennedy, J., Spencer, L. J., Ashcroft, L., Brönnimann, S., Brunet, M., Camuffo, D., Cornes, R., Cram, T. A., Crouthamel, R., Domínguez-Castro, F., Freeman, J. E., Gergis, J., Hawkins, E., Jones, P. D., Jourdain, S., Kaplan, A., Kubota, H., Blancq, F. Le, Lee, T.-C., Lorrey, A., Luterbacher, J., Maugeri, M., Mock, C. J., Moore, G. W. K., Przybylak, R., Pudmenzky, C., Reason, C., Slonosky, V. C., Smith, C. A., Tinz, B., Trewin, B., Valente, M. A., Wang, X. L., Wilkinson, C., Wood, K., and Wyszyński, P.: Towards a more reliable historical reanalysis: Improvements for version 3 of the Twentieth Century Reanalysis system, Q. J. Roy. Meteorol. Soc., 145, 2876–2908, https://doi.org/10.1002/qj.3598, 2019.
Soldan, W.: Die großen Schadenhochwässer der letzten Jahre und ihre Ursachen, Zentralblatt der Bauverwaltung, 47, 233–237, 1927.
Stadtherr, L., Coumou, D., Petoukhov, V., Petri, S., and Rahmstorf, S.: Record Balkan floods of 2014 linked to planetary wave resonance, Sci. Adv., 2, e1501428, https://doi.org/10.1126/sciadv.1501428, 2016.
Stevens, A. J., Clarke, D., and Nicholls, R. J.: Trends in reported flooding in the UK: 1884–2013, Hydrolog. Sci. J., 61, 50–63, https://doi.org/10.1080/02626667.2014.950581, 2016.
Uehlinger, U., Arndt, H., Wantzen, K. M., and Leuven, R. S. E. W.: Chapter 6 – The Rhine River Basin, in: Rivers of Europe, edited by: Tockner, K., Uehlinger, U., and Robinson, C. T., Academic Press, London, 199–245, 2009.
Ulbrich, U., Brücher, T., Fink, A. H., Leckebusch, G. C., Krüger, A., and Pinto, J. G.: The central European floods of August 2002: Part 1 – Rainfall periods and flood development, Weather, 58, 371–377, https://doi.org/10.1256/wea.61.03A, 2003a.
Ulbrich, U., Brücher, T., Fink, A. H., Leckebusch, G. C., Krüger, A., and Pinto, J. G.: The central European floods of August 2002: Part 2 – Synoptic causes and considerations with respect to climatic change, Weather, 58, 434–442, https://doi.org/10.1256/wea.61.03B, 2003b.
Vázquez, M., Pereira, K., Nieto, R., and Gimeno, L.: The origin of moisture feeding up Atmospheric Rivers over the Arctic, Sciforum Electron. Conf. Ser., 1, 4829, https://doi.org/10.3390/chycle-2017-04829, 2017.
Zavadoff, B. L. and Kirtman, B. P.: Dynamic and Thermodynamic Modulators of European Atmospheric Rivers, J. Climate, 33, 4167–4185, https://doi.org/10.1175/JCLI-D-19-0601.1, 2020.
Zhu, Y. and Newell, R. E.: Atmospheric rivers and bombs, Geophys. Res. Lett., 21, 1999–2002, https://doi.org/10.1029/94GL01710, 1994.
Zhu, Y. and Newell, R. E.: A Proposed Algorithm for Moisture Fluxes from Atmospheric Rivers, Mon. Weather Rev., 126, 725–735, https://doi.org/10.1175/1520-0493(1998)126<0725:APAFMF>2.0.CO;2, 1998.