the Creative Commons Attribution 4.0 License.
the Creative Commons Attribution 4.0 License.
 | 29 Oct 2020
Dynamic mechanism of an extremely severe saltwater intrusion in the Changjiang estuary in February 2014
Xinyue Cheng
Linjiang Li
Jinghua Gu
Hanghang Lyu
Estuarine saltwater intrusions are mainly controlled by river discharge and tides. Unexpectedly, an extremely severe saltwater intrusion event occurred in February 2014 in the Changjiang estuary under normal river discharge conditions. This intrusion cut off the freshwater input for 23 d into the Qingcaosha reservoir, which is the largest estuarine reservoir in the world, creating a severe threat to water safety in Shanghai. No similar catastrophic saltwater intrusion has occurred since records of salinity in the estuary have been kept. During the event, a persistent and strong northerly wind existed, with a maximum speed of 17.6 m s−1, lasting 9 d and coinciding with a distinct water level rise. Our study demonstrates that the extremely severe saltwater intrusion was caused by this northerly wind, which drove substantial landward net water transport to form a horizontal estuarine circulation that flowed into the northern channel and out of the southern channel. This landward net water transport overpowered the seaward-flowing river runoff and transported a large volume of highly saline water into the northern channel. The mechanisms of this severe saltwater intrusion event, including the northerly wind, residual water level rise, landward water transport and resulting horizontal circulation, etc., were systematically investigated.
- Article
(12020 KB) - Full-text XML
- BibTeX
- EndNote


Saltwater intrusion is a common phenomenon in estuaries where freshwater and saltwater converge and is mainly controlled by tides and river discharge (Prandle, 1985; Simpson et al., 1990; Geyer, 1993), but it can also be affected by wind stress (Chen and Sanford, 2009; Aristizábal and Chant, 2015; Duran-Matute et al., 2016; Giddings and MacCready, 2017) and vertical mixing (Simpson and Hunter, 1974; Prandle and Lane, 2015). Along-estuary winds can strain density gradients and the associated destruction or enhancement of stratification, depending on the wind direction and the entrainment depth ratio (Chen and Sanford, 2009). Wind-driven sea level setups at the mouth of estuaries can produce landward flows that outcompete river runoff, resulting in the net landward advection of salt (Aristizabal and Chant, 2015). For multi-inlet coastal systems, residual (horizontal) circulation is influenced by winds, which alters salt transports in each inlet (Duran-Matute et al., 2016). The upwelling and downwelling favorable wind can significantly influence the estuarine exchange flow (Giddings and MacCready, 2017). Saltwater intrusions can produce estuarine circulation (Pritchard, 1956) and affect stratification (Simpson et al., 1990), thereby influencing sediment transport, producing peak estuarine turbidities (Geyer, 1993) and degrading the freshwater quality (Zhu et al., 2013). Therefore, the study of estuarine saltwater intrusions has scientific relevance for understanding circulation, sediment and ecological dynamics and can facilitate the effective utilization of estuarine freshwater resources.
Changjiang, also known as the Yangtze River, is one of the largest rivers in the world and discharges large amounts of freshwater (9.24×10¹¹ m3) into the East China Sea each year (Shen et al., 2003), with seasonal variations in river discharge ranging from a maximum monthly mean of 49 850 m3 s−1 in July to a minimum of 11 180 m3 s−1 in January (Zhu et al., 2015). The Changjiang estuary is characterized by multiple bifurcations (Fig. 1). The tides in the Changjiang estuary are semidiurnal, have biweekly spring neap signals and are highly energetic sources of water movement. The maximum tidal range reaches 3.38 m, and the minimum tidal range reaches 0.64 m at the Baozhen hydrological station (Zhu et al., 2015). The maximum tidal current amplitude reaches approximately 2.0 m s−1 at the river mouth during the spring tide. The prevailing monsoon climate results in a strong northerly wind of 5.5 m s−1 during winter and a southeasterly wind of 5.0 m s−1 during summer (Zhu et al., 2015). Saltwater intrusion in the Changjiang estuary is also mainly determined by river discharge and tides (Song and Mao, 2002; Gu et al., 2003; Shen et al., 2003; Luo and Chen, 2005; Qiu et al., 2012; Chen et al., 2019a) but is also influenced by wind (Xue et al., 2009; Wu et al., 2010; Li et al., 2012; Ding et al., 2017; Zhang et al., 2019) and topography (Li et al., 2014; Chen et al., 2019b). The impact of wind on saltwater intrusion has been studied but only with a climatic wind (Xue et al., 2009; Qiu et al., 2012; Chen et al., 2019a) and a strong northerly wind induced by ordinary cold fronts in winter lasting 1–2 d, which could cause a change in the observed salinity (Li et al., 2012). Xue et al. (2009) pointed out that a northerly wind tends to enhance the saltwater intrusion in the northern branch by reducing the seaward surface elevation gradient forcing. Wu et al. (2010) and Li et al. (2012) simulated the pure wind-driven current that flows into the northern channel and out of the southern channel with climatic wind to explain that the northerly wind can enhance saltwater intrusion in the northern channel and weaken it in the southern channel. Zhang et al. (2019) reported that the frequency of saltwater intrusion events in the Changjiang estuary is increasing in recent years due to the increasing frequency of winter storms passing the East China Sea.
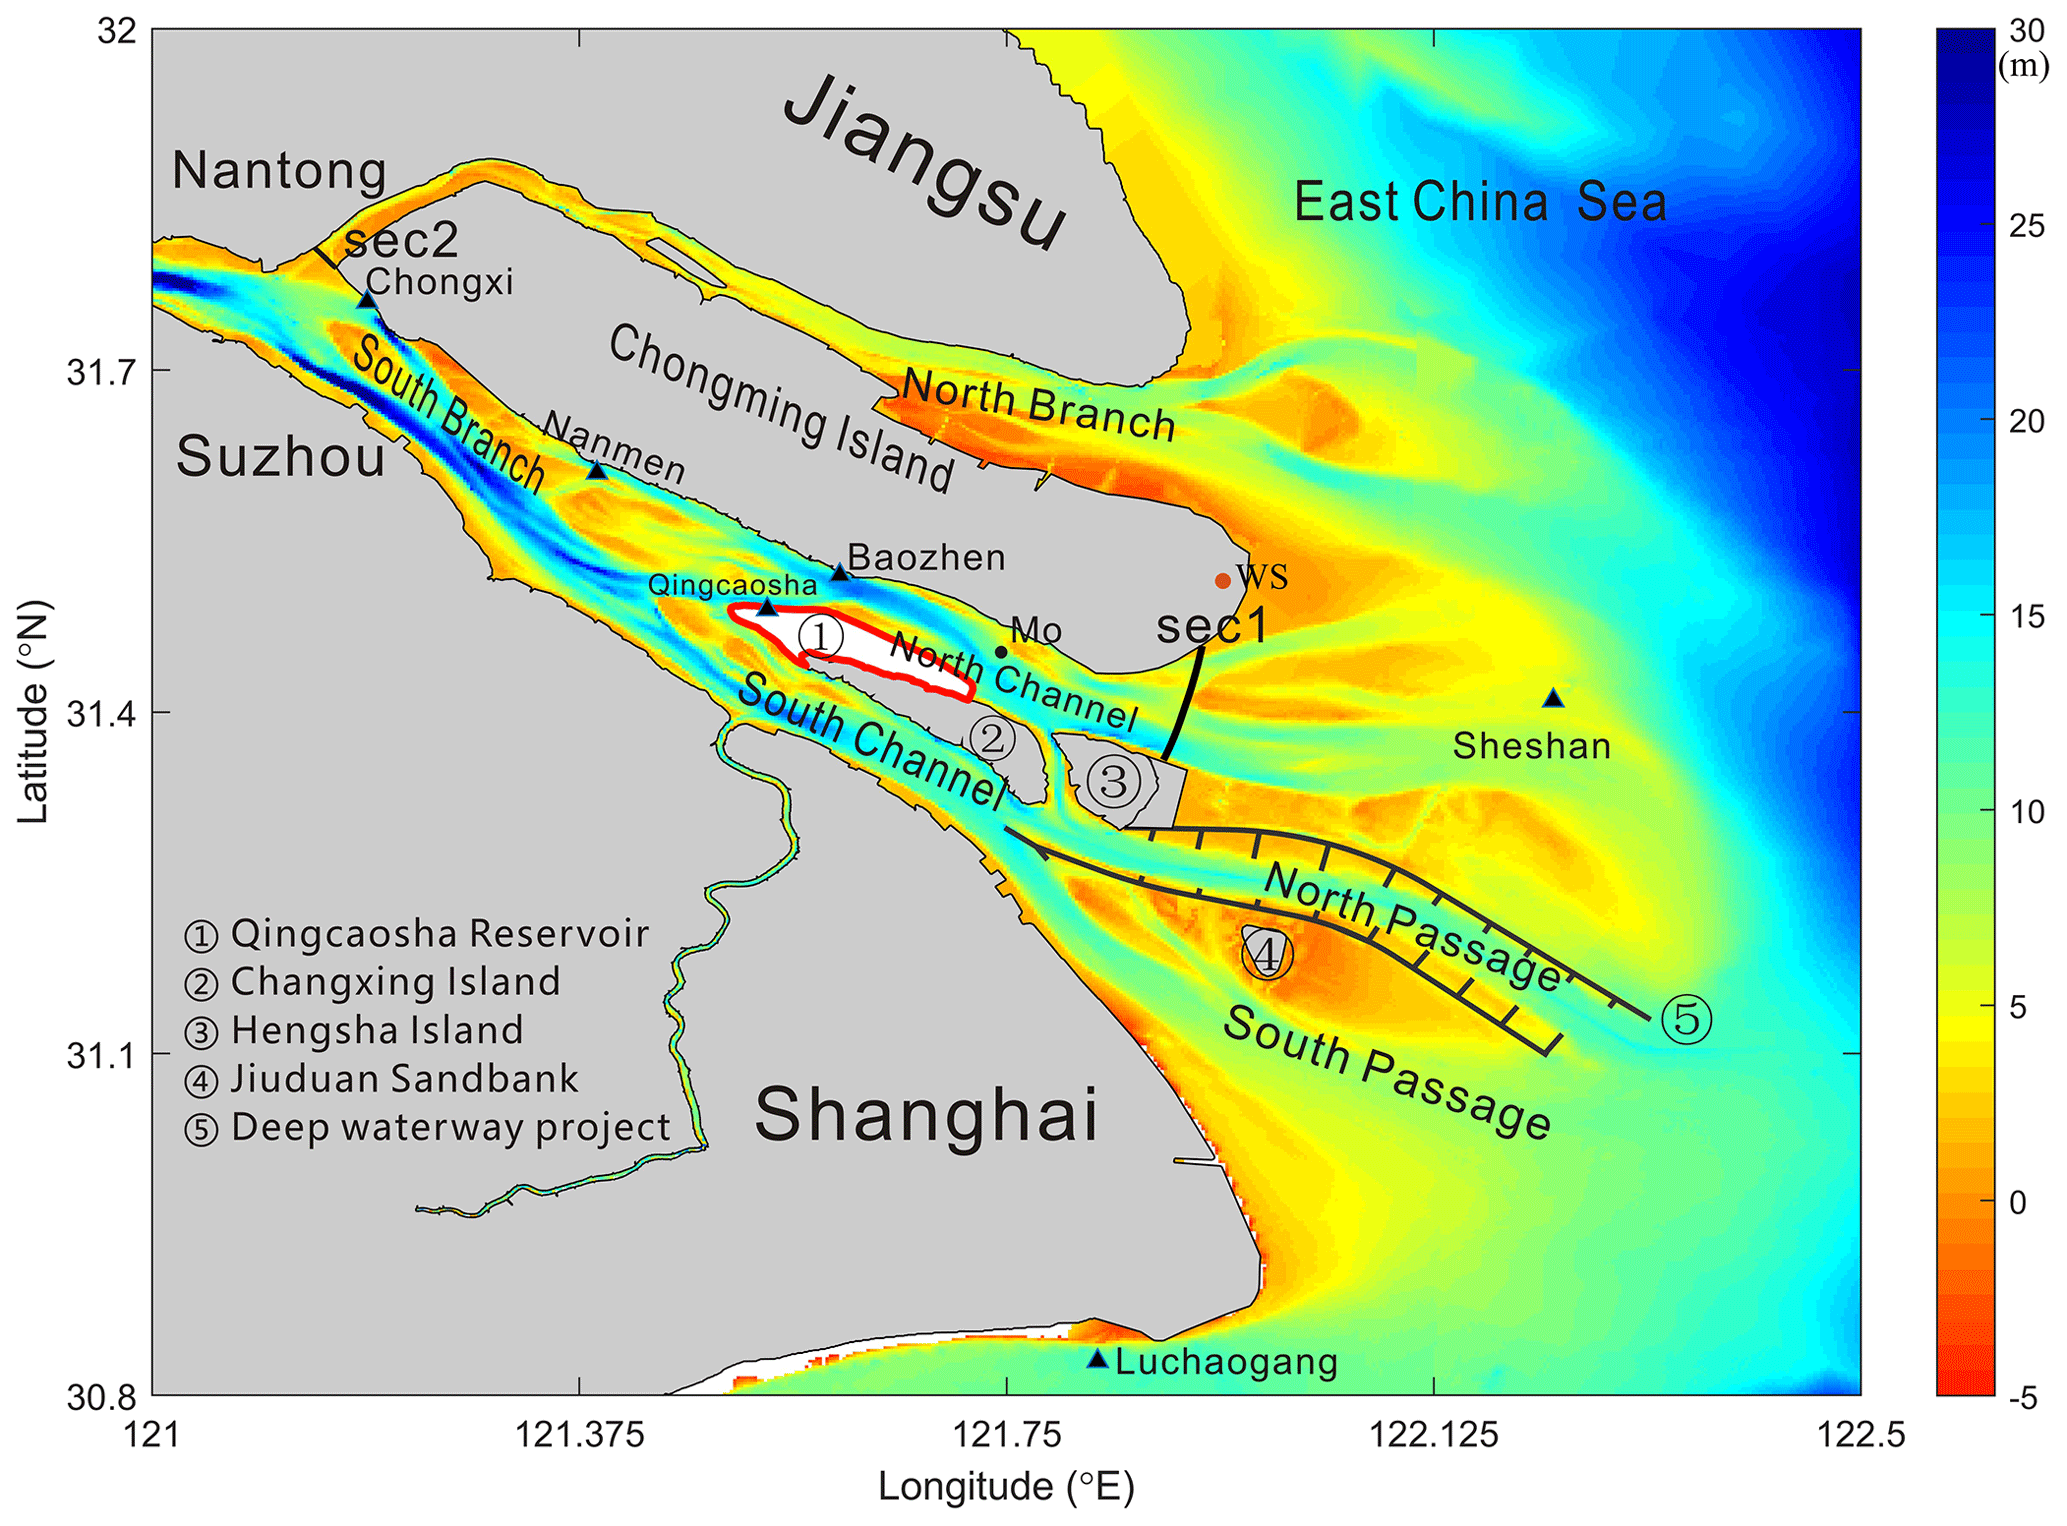
Figure 1Topography of the Changjiang estuary. The black triangles indicate the locations of hydrologic stations Chongxi, Nanmen, Baozhen, Qingcaosha, Sheshan and Luchaogang. WS is the location of the weather station at the Chongming eastern shoal. sec1 and sec2 are transects at the river mouth of the northern channel and upper reaches of the northern branch, respectively, and Mo is the model output site for terms in the momentum equations.
The estuaries of large rivers are often associated with growing populations and economic activity, leading to complex challenges in managing environmental conditions. Freshwater supplementation is of vital importance for industrial and home use, but estuarine freshwater is subject to frequent seawater intrusions. The Changjiang estuary, which is surrounded by fast-developing cities such as Shanghai, Suzhou and Nantong, is threatened by saltwater intrusions in the winter season. Numerous efforts have been made in recent decades to meet the astronomical freshwater demand of the megacity of Shanghai, which has a population of over 24 million people. The water resources in Shanghai were strategically transferred from the Huangpu River to the Changjiang estuary in 2010 when the largest estuarine reservoir in the world, the Qingcaosha reservoir, was built (shown in Fig. 1). This reservoir has an effective capacity of 4.35 × 10⁸ m3 and provides a daily water supply of 7.19 × 10⁶ m3 for the 13 million people in the main districts of Shanghai, accounting for 70 % of the total freshwater in the city. However, the Qingcaosha reservoir is frequently influenced by saltwater intrusions, particularly during the dry season. Limited by reservoir capacity, the long-lasting saltwater intrusions are extremely harmful (Chen et al., 2019a). The most characteristic type of saltwater intrusion in the estuary is the saltwater spillover (SSO) from the northern branch into the southern branch (Shen et al., 2003; Wu et al., 2006; Lyu and Zhu, 2018). The shallow and funnel-shaped topography helps to prevent runoff from entering the northern branch, especially during the dry season, and produces a greater tidal range in the northern branch than in the southern branch. The saltwater from the SSO is transported downstream by runoff and arrives in the middle reaches of the southern branch during the subsequent neap tide, threatening the water supplies of reservoirs located in the estuary.
An extremely severe saltwater intrusion event occurred in February 2014 in the Changjiang estuary under normal river discharge conditions and seriously influenced the water intake of the Qingcaosha reservoir and threatened water safety in Shanghai. Two severe saltwater intrusion events were recorded in the Changjiang estuary in the dry seasons of 1979 and 1999, which were caused by very low river discharge, with a mean value of 7485 m3 s−1 from 1 January to 15 March 1979 and 9246 m3 s−1 from 1 January to 16 March 1999, both lasting 2.5 months (Zhu et al., 2013). However, the mean monthly river discharge in February 2014 was 11 510 m3 s−1, which approached the annual climatic mean value of 12 430 m3 s−1 in February from 1950 to 2019. No similar catastrophic saltwater intrusion event has occurred since salinity data have been recorded, even when there was a much lower river discharge in the estuary, such as in the dry seasons of 1979 and 1999. Because the river discharge in February 2014 was close to the monthly mean discharge that has occurred since 1950, river discharge was not the cause of the extremely severe saltwater intrusion event. The tides in February in different years have been similar, and the estuarine topography has also been similar over the last 10 years. What was the reason for the extremely severe saltwater intrusion event in the Changjiang estuary in February 2014? In this paper, the dynamic mechanism of the event was studied using observation data and a numerical model.
2.1 Numerical model
The numerical model used in this study was based on ECOM-si (Blumberg, 1994) and later improved for a better studying of the hydrodynamics and substance transport (Chen et al., 2001; Wu and Zhu, 2010). The model uses a sigma coordinate system in the vertical direction and a curvilinear nonorthogonal grid in the horizontal direction (Chen et al., 2004). The model domain for saltwater intrusion covers the Changjiang estuary and its adjacent sea region (Fig. 2a). The Datong hydrological station is on the western open boundary of the Changjiang River.
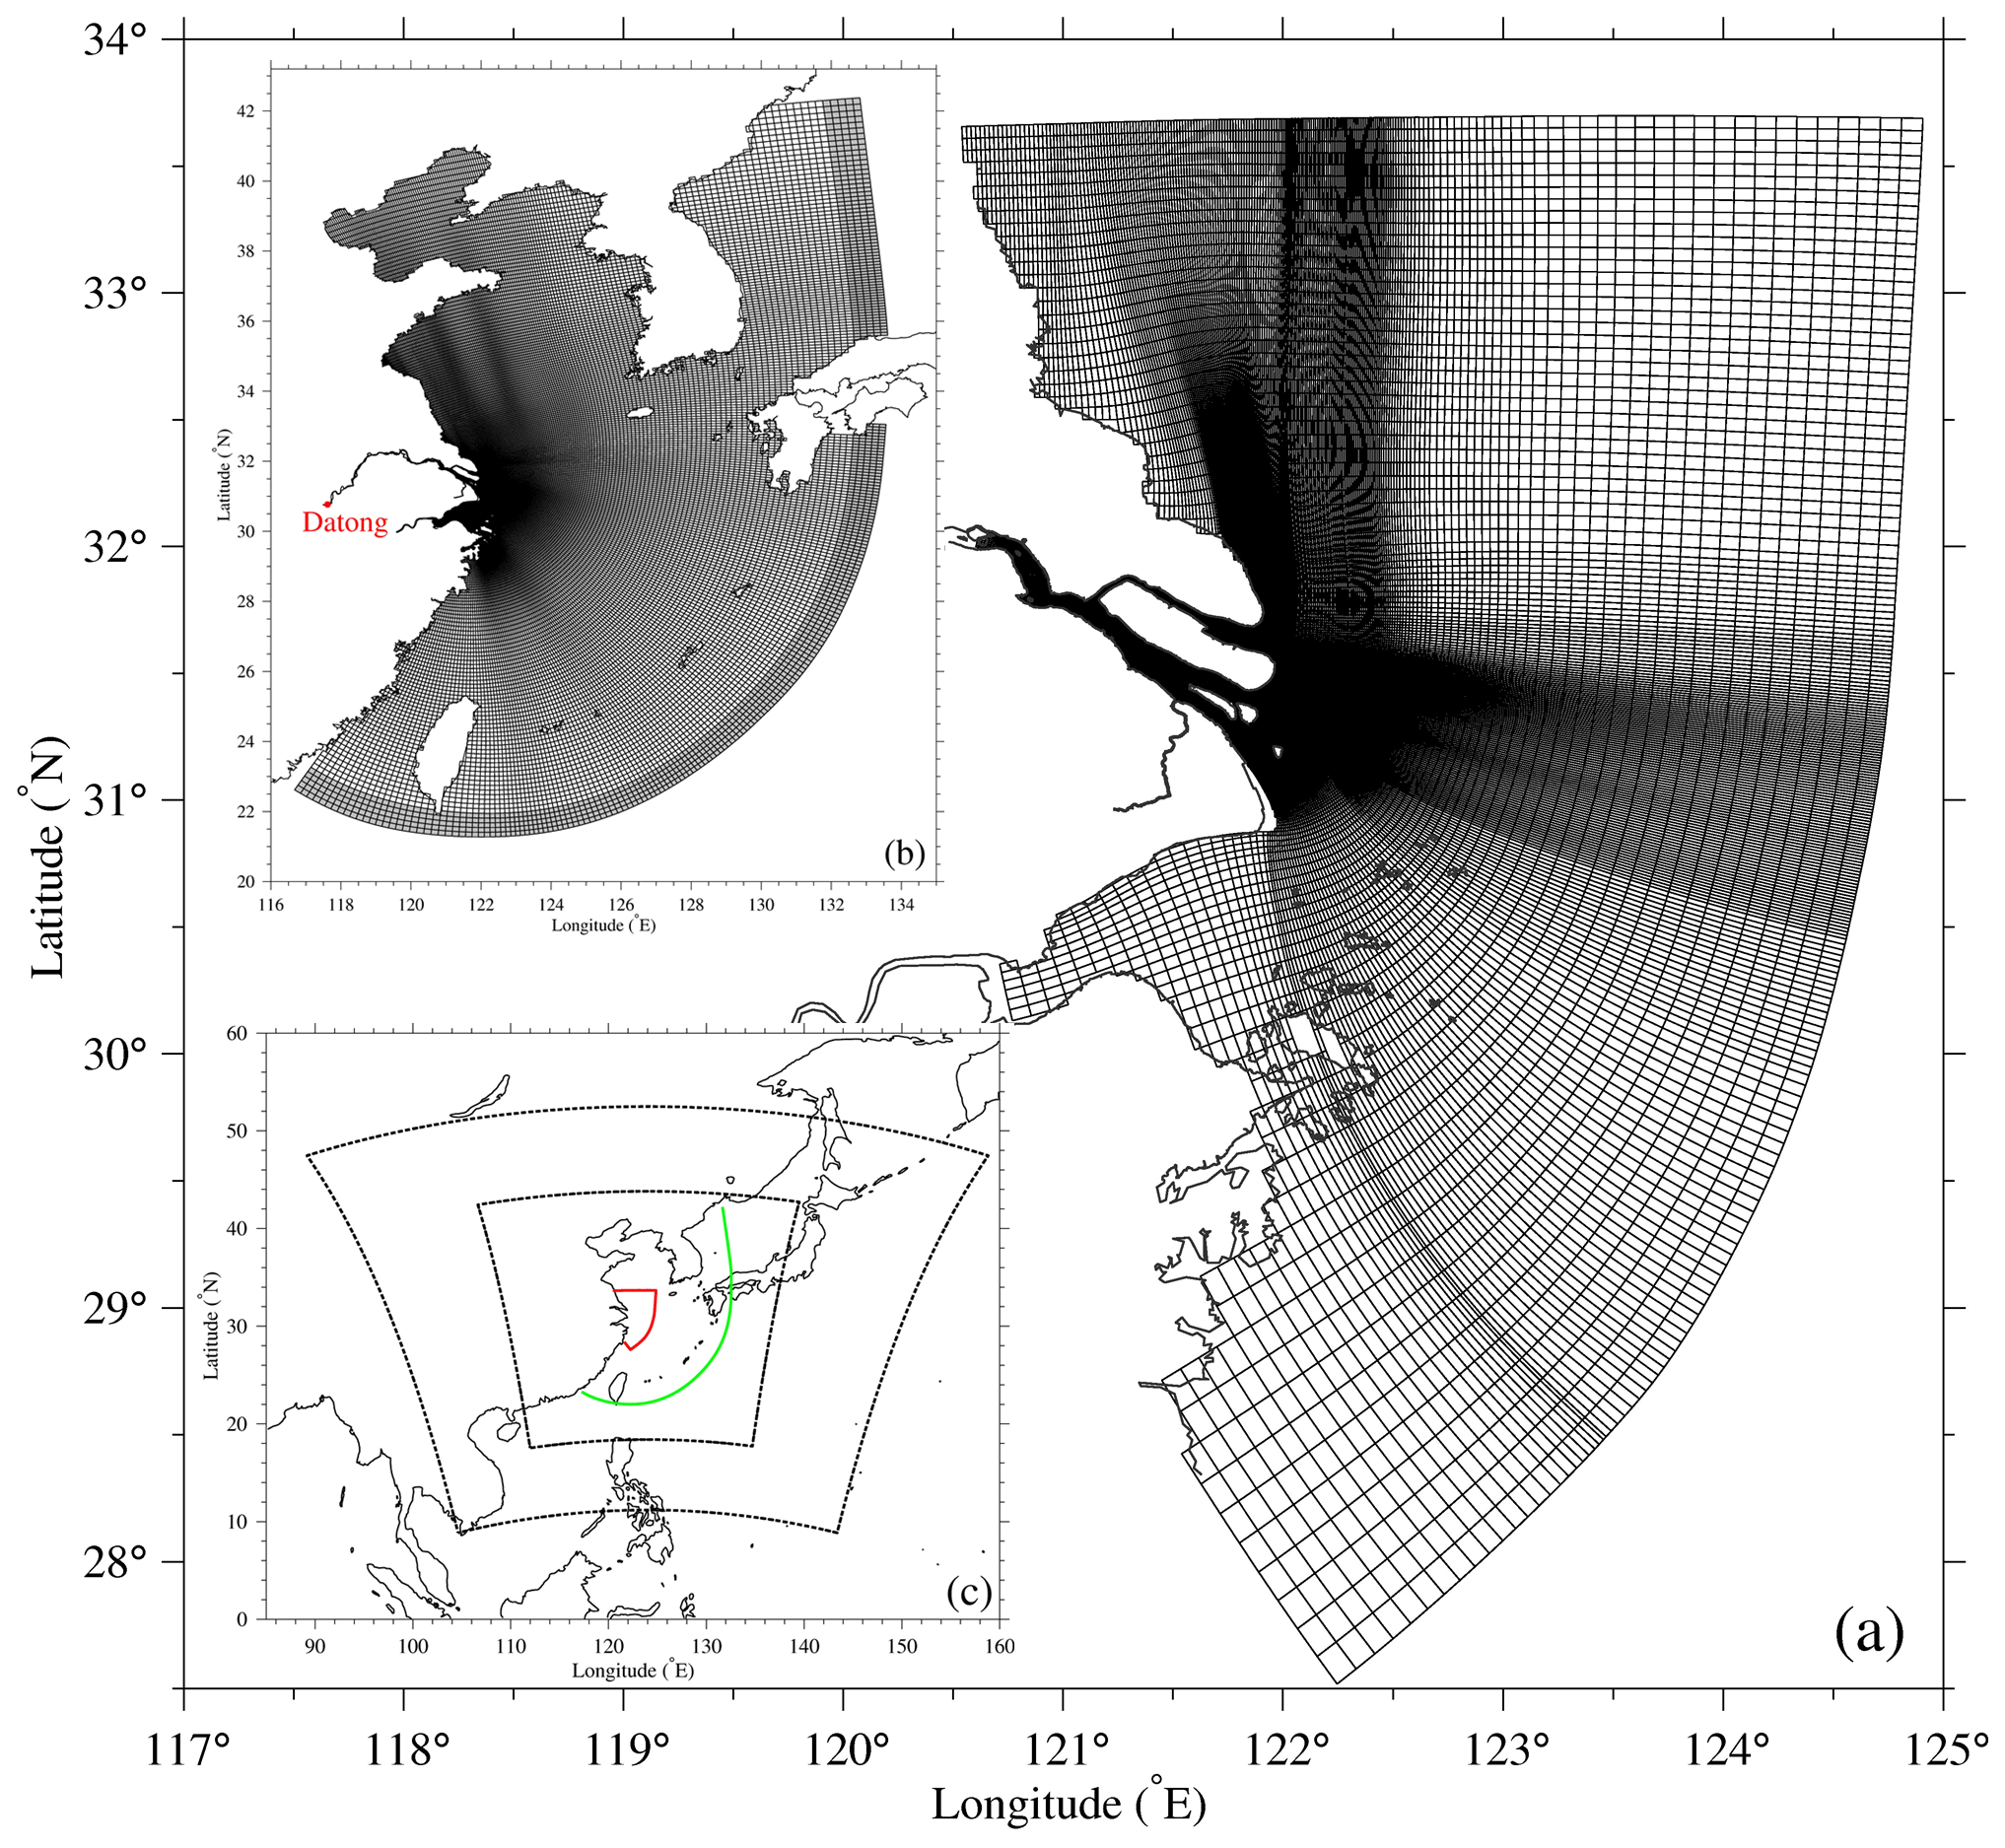
Figure 2Model grids of the Changjiang estuary (a) and model grids of the Bohai Sea, Yellow Sea and East China Sea (b). Domains of the models: within the red line – the Changjiang estuary model domain; within the green line – model domain of the Bohai Sea, Yellow Sea and East China Sea; black dashed lines – the two-fold nested Weather Research and Forecasting (WRF) model domain (c).
The model simulations in this study covered the period from 1 January to 28 February 2014. The daily river discharge recorded at the Datong hydrologic station was used in the model as the river boundary condition (Fig. 2b). At the open sea boundaries of the model, the momentum open boundaries were driven by total water levels, which are composed of the residual water level and tidal level as follows:
where ζ is the total water level, and is the residual (mean) water level reflecting the shelf current. The tidal level is calculated by combining the 16 main tidal constituents (M2, S2, N2, K2, K1, O1, P1, Q1, MU2, NU2, T2, L2, 2N2, J1, M1 and OO1) with harmonic constants, a and g, which are the amplitude and phase of the tidal constituent, respectively, derived from the NaoTide data set (NaoTide, 2004), and ω is the frequency. The method for determining the mean water level in Eq. (1) is a critical issue for correctly simulating the saltwater intrusion in the Changjiang estuary under a strong northerly wind. In this study, the mean water level was simulated by a large domain model encompassing the Bohai Sea, Yellow Sea and East China Sea (Fig. 2b; the model grids and domain), which is driven by ocean circulation, tide, river discharge and sea surface wind to simulate the water level, current and salinity (Wu et al., 2011).
2.2 Numerical validation
The numerical model has been extensively calibrated, validated and applied in a number of previous studies of the Changjiang estuary, which have shown that the model can reproduce the observed water level, current and salinity with high simulation accuracy (Wu and Zhu, 2010; Qiu and Zhu, 2015; Lyu and Zhu, 2018). Detailed descriptions of the model validation process can be found in the literature mentioned above. In this study, the model was validated with the observed water level at Baozhen, Sheshan and Luchaogang stations and salinity at Nanmen, Baozhen, Chongxi and Qingcaosha stations during the extremely severe saltwater intrusion event, and the results showed that modeled salinities were consistent with the observed values (shown in Figs. 3 and 6 and analyzed in Sect. 3.2).
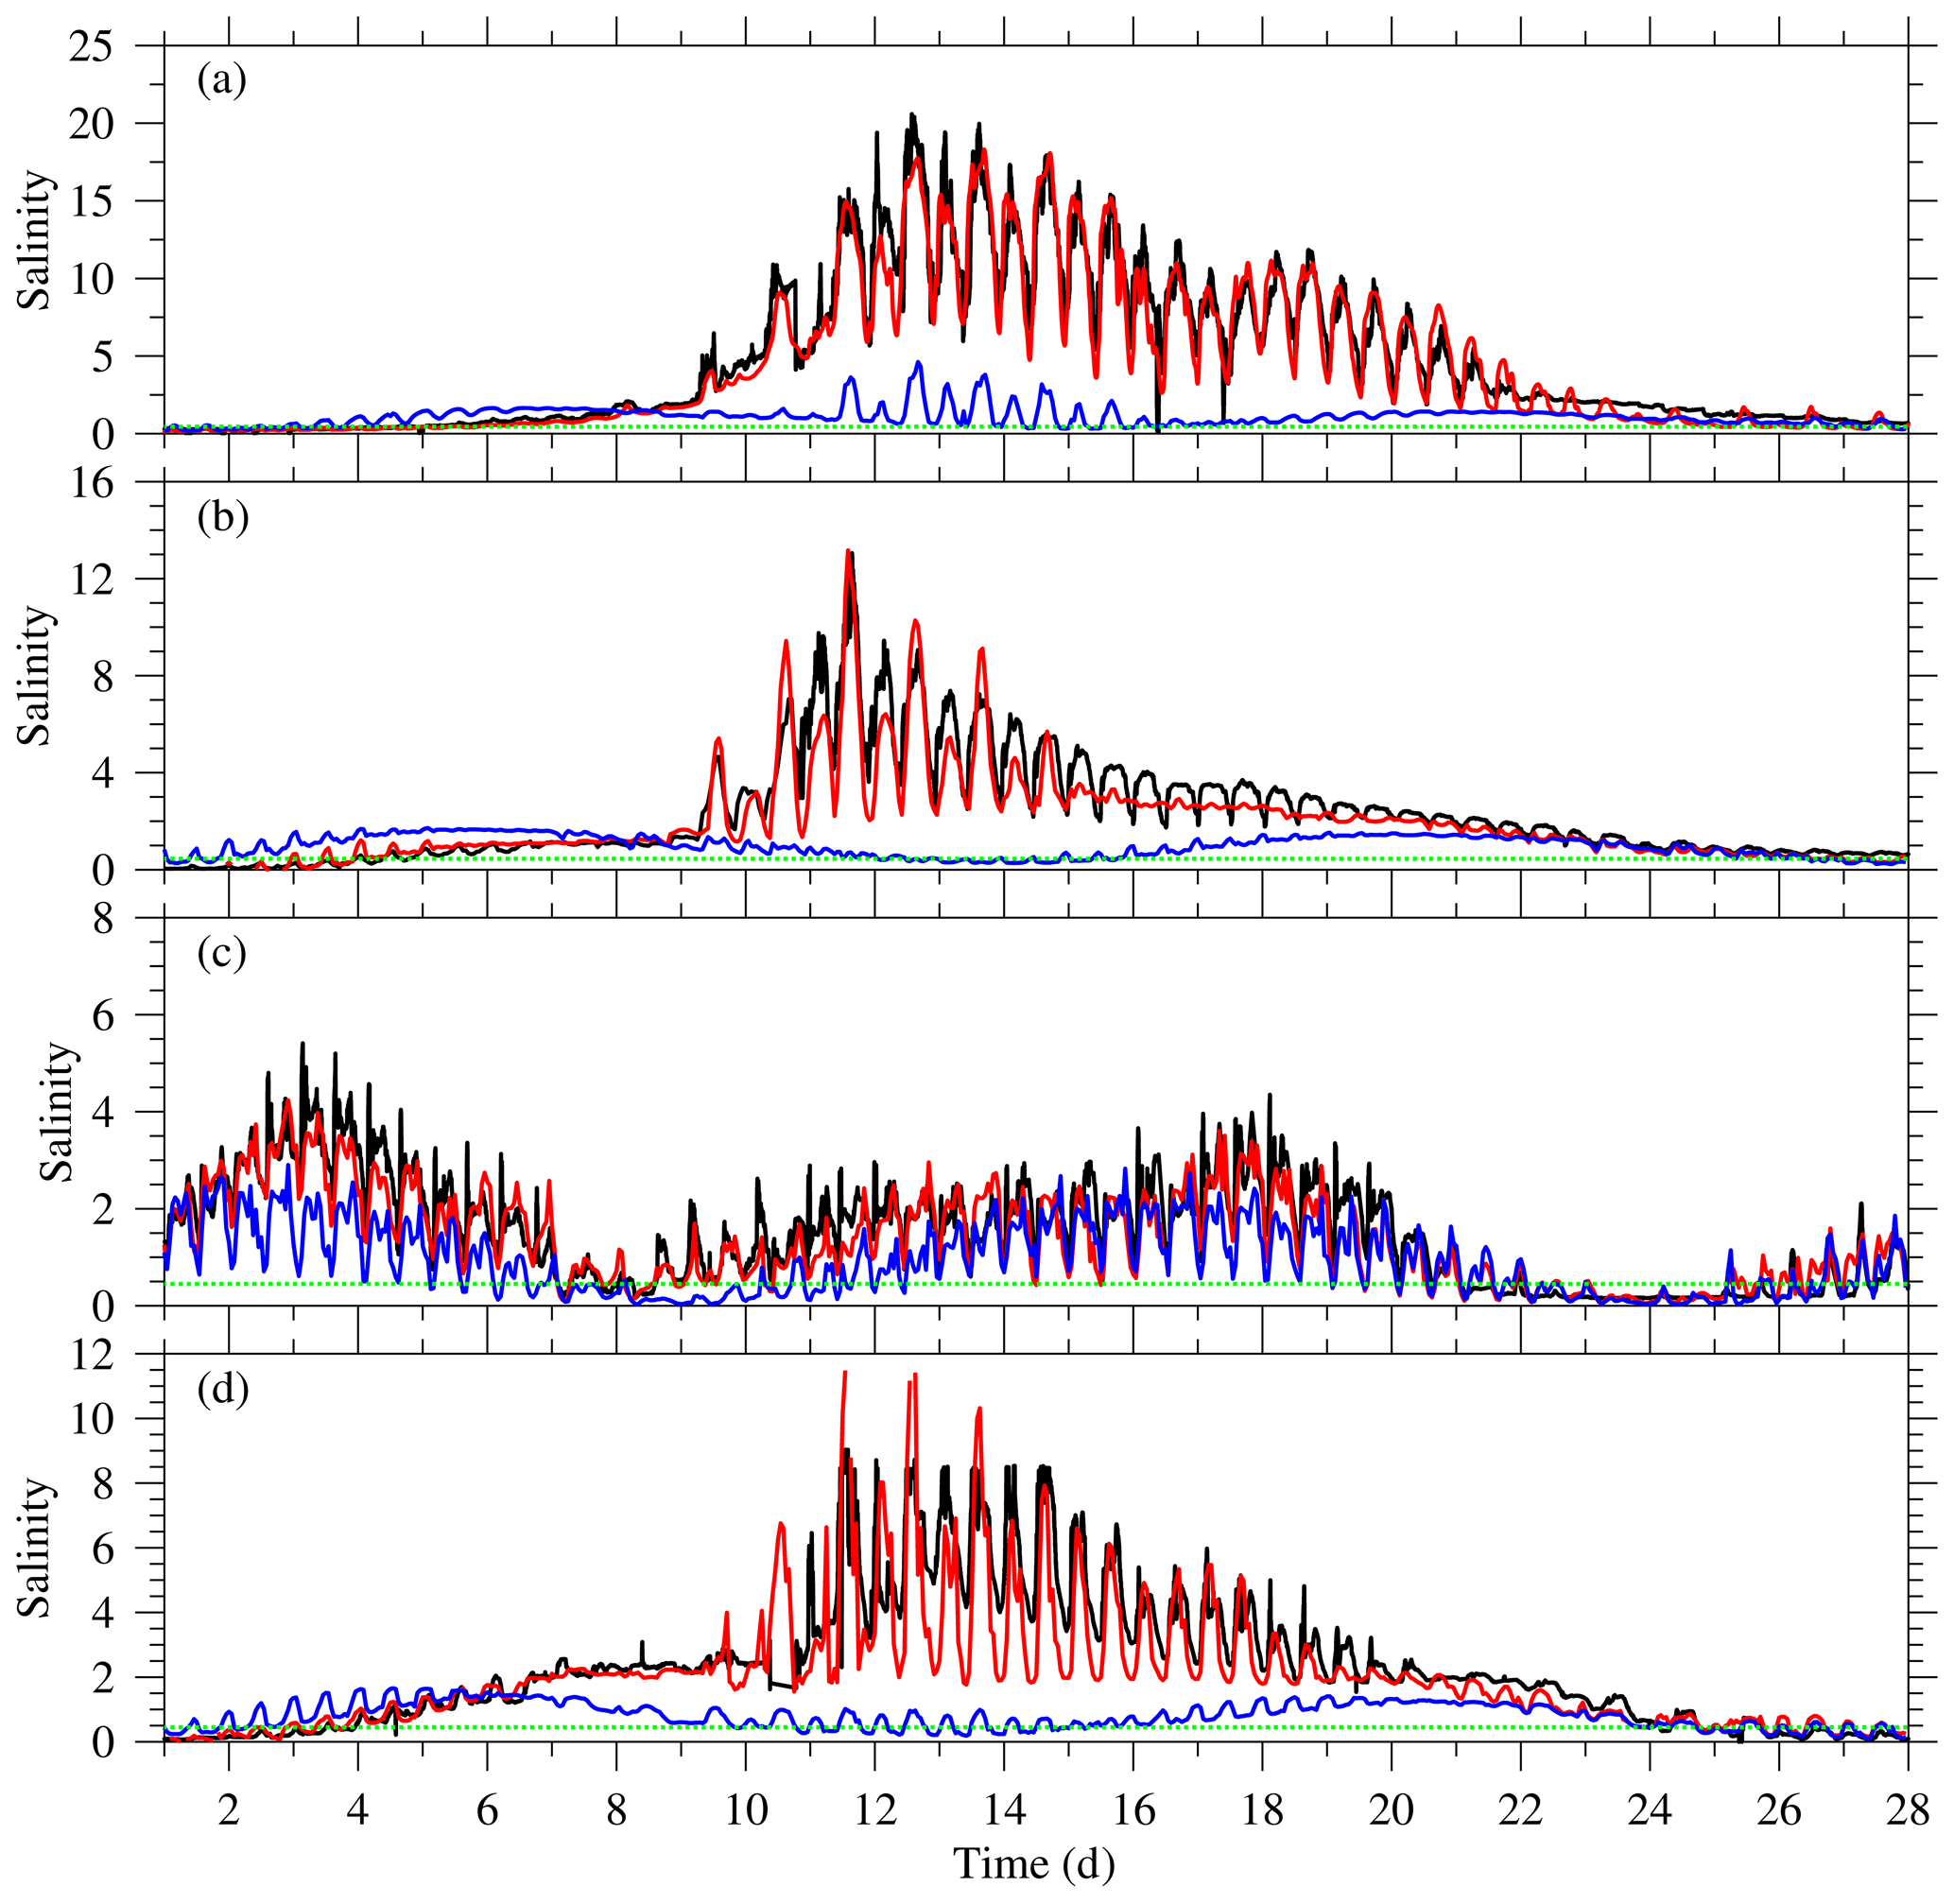
Figure 3Temporal variations in salinity in February 2014 at hydrologic stations. (a) Baozhen station, (b) Nanmen station, (c) Chongxi station and (d) Qingcaosha station. Black line – measured salinity; blue line – simulated salinity under climatic wind and residual water level conditions at open sea boundaries (experiment 1); red line – simulated salinity under a realistic wind and residual water levels at the open sea boundaries (experiment 2). The dashed green line represents salinity of 0.45, which is the standard for drinking water.
3.1 Observed data
The observed data of salinity, water level and wind were used to study the extremely severe saltwater intrusion event in February 2014. The observed salinity and wind data were from the State Key Laboratory of Estuarine and Coastal Research, East China Normal University, and the observed water level data were from the Shanghai Hydrology Administration. At the Baozhen hydrologic station, the salinity was normal before 8 February 2014 (in relation to January and February in other years) but rose to a very high value, with a peak of 20.1 from 9 to 20 February, which was unexpected and had never occurred (Fig. 3a). At Nanmen station, the salinity was also abnormally high, with a peak salinity of 12.4. At Chongxi station, the salinity was high, with a peak salinity of 6.5 induced by the SSO. At Qingcaosha station, the salinity was greater than 0.45 (the salinity standard for drinking water; similarly hereinafter) from 4 to 26 February, with a peak salinity of 8.6. Thus, the continuous period of unsuitable drinking water reached 23 d, causing a serious threat to the water intake of the Qingcaosha reservoir and water safety in Shanghai. The observed salinities at hydrologic stations indicated that there was an extremely severe saltwater intrusion event in February 2014.
The mean monthly river discharge recorded at the Datong hydrologic station (Changjiang Water Resources Commission) in February 2014 was 11 510 m3 s−1 (Fig. 4a), which approached the annual climatic mean value of 12 430 m3 s−1 in February from 1950 to 2019. Thus, river discharge was not the cause of the extremely severe saltwater intrusion event.
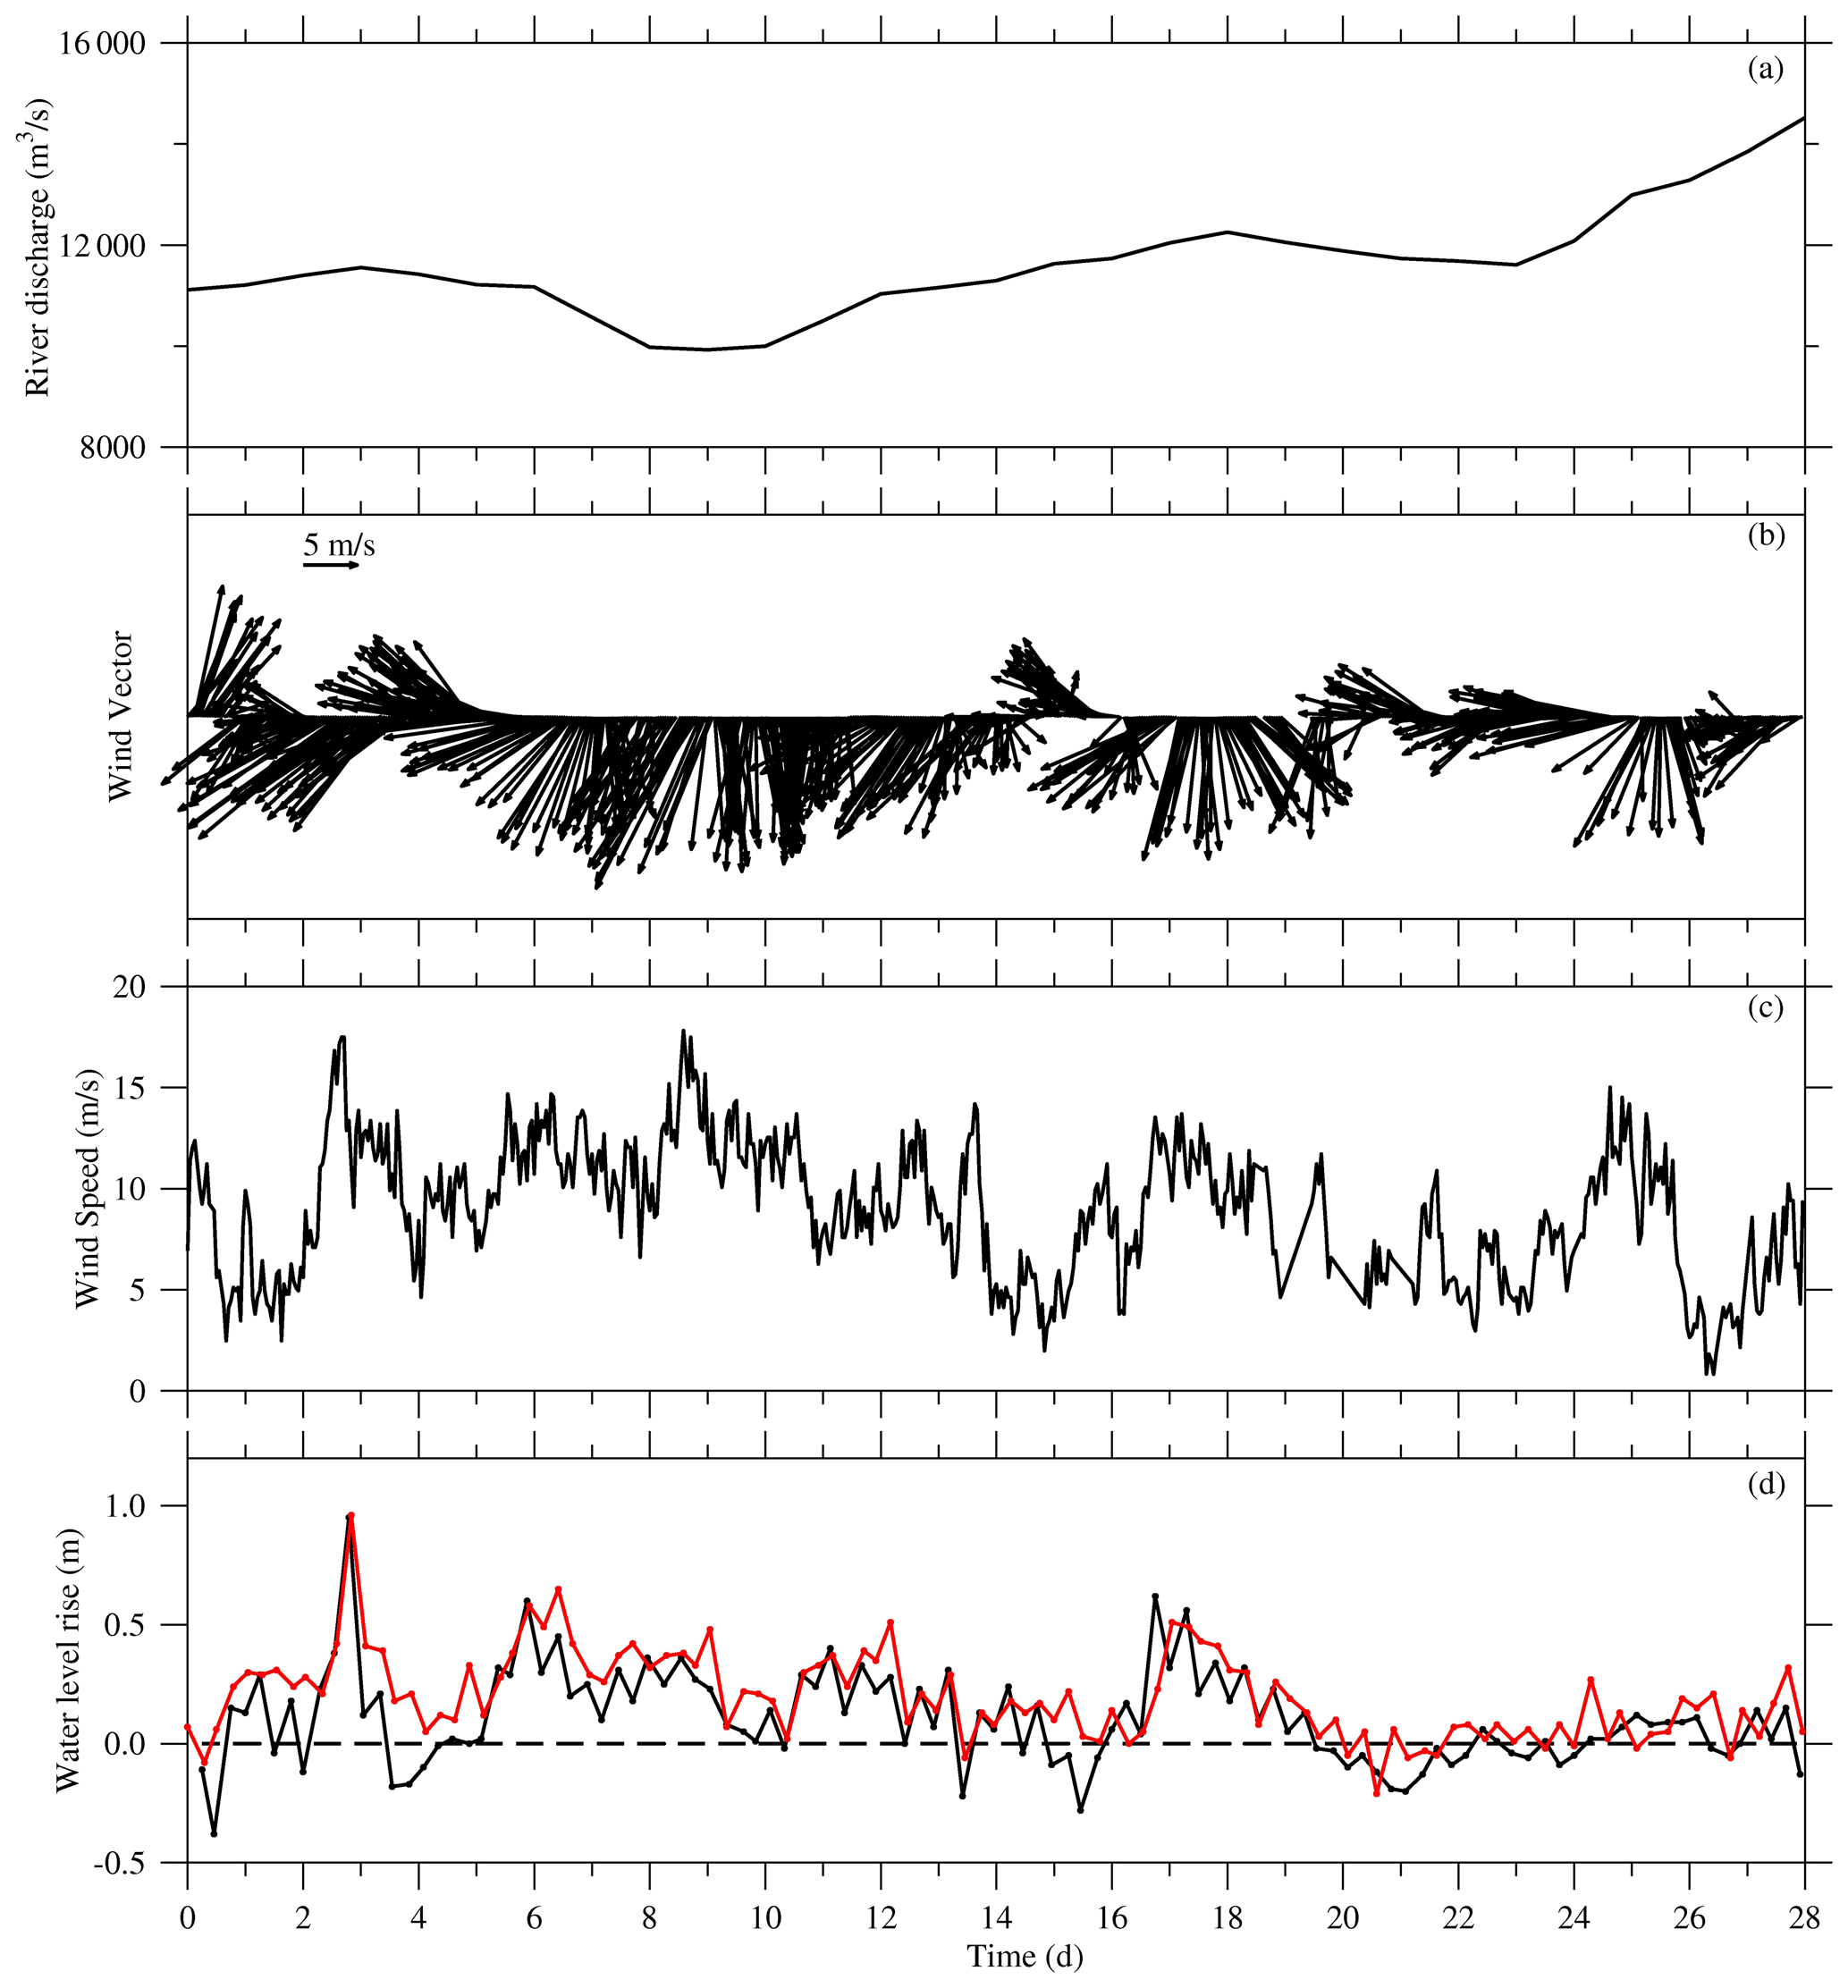
Figure 4Temporal variations in the measured river discharge at Datong station (a). Wind vector (b) and wind speed (c) at WS and water level rise obtained by subtracting the data in the tide table from the measured water level at Sheshan station (black line) and Luchaogang station (red line) in February 2014 (d).
The weather station at the Chongming eastern shoal (location is shown in Fig. 1 as WS) recorded a persistent and strong northerly wind (2 min average) from 6 to 14 February 2014, lasting 9 d, with an average wind speed of 10.01 m s−1 and a maximum wind speed of 17.6 m s−1 on 10 February (Fig. 4b, c). After a 2 d southerly wind from 15 to 16 February, there was a 4 d strong northerly wind from 17 to 20 February 2014. At the same time, the Sheshan and Luchaogang hydrologic stations recorded a distinct water level rise, with a peak value of more than 0.5 m during the strong northerly wind (Fig. 4d). The water level rise could not be directly observed and was obtained by subtracting the data in the tide table from the measured water level value.
The observed data indicated that an extremely severe saltwater intrusion in the Changjiang estuary occurred in February 2014; meanwhile, the river discharge was normal, and a persistent and strong northerly wind was present.
3.2 Modeled results
To reveal which dynamic factor caused the extremely severe saltwater intrusion event in February 2014, two numerical experiments were designed. The first experiment considered climatic wind conditions at the sea surface and residual water levels at open sea boundaries (experiment 1), and the second considered a realistic wind in February 2014 and residual water levels at the open sea boundaries (experiment 2). The river discharge at the upper boundary at the Datong station and the tide at the open sea boundary were the same in experiment 1 and experiment 2.
In experiment 1, the monthly mean wind field data set with a spatial resolution of 0.25∘ × 0.25∘ and a temporal resolution of 6 h from the National Centers for Environmental Prediction/Quick Scatterometer (NCEP/QSCAT, 2014) was used. The climatic wind field in February is a northerly wind with a speed of approximately 7 m s−1 over the Yellow Sea and East China Sea (Fig. 5a). The residual water level and residual current were simulated by the model, including the Bohai Sea, Yellow Sea and East China Sea. Forced by the northerly wind, the residual water level was 10–20 cm away from the Changjiang River mouth and was mainly induced by river discharge and a climatic northerly wind, and the residual surface current flows southward off the Changjiang mouth (Fig. 5b). The residual water level was interpolated into the open sea boundary of the saltwater intrusion model as an external forcing condition.
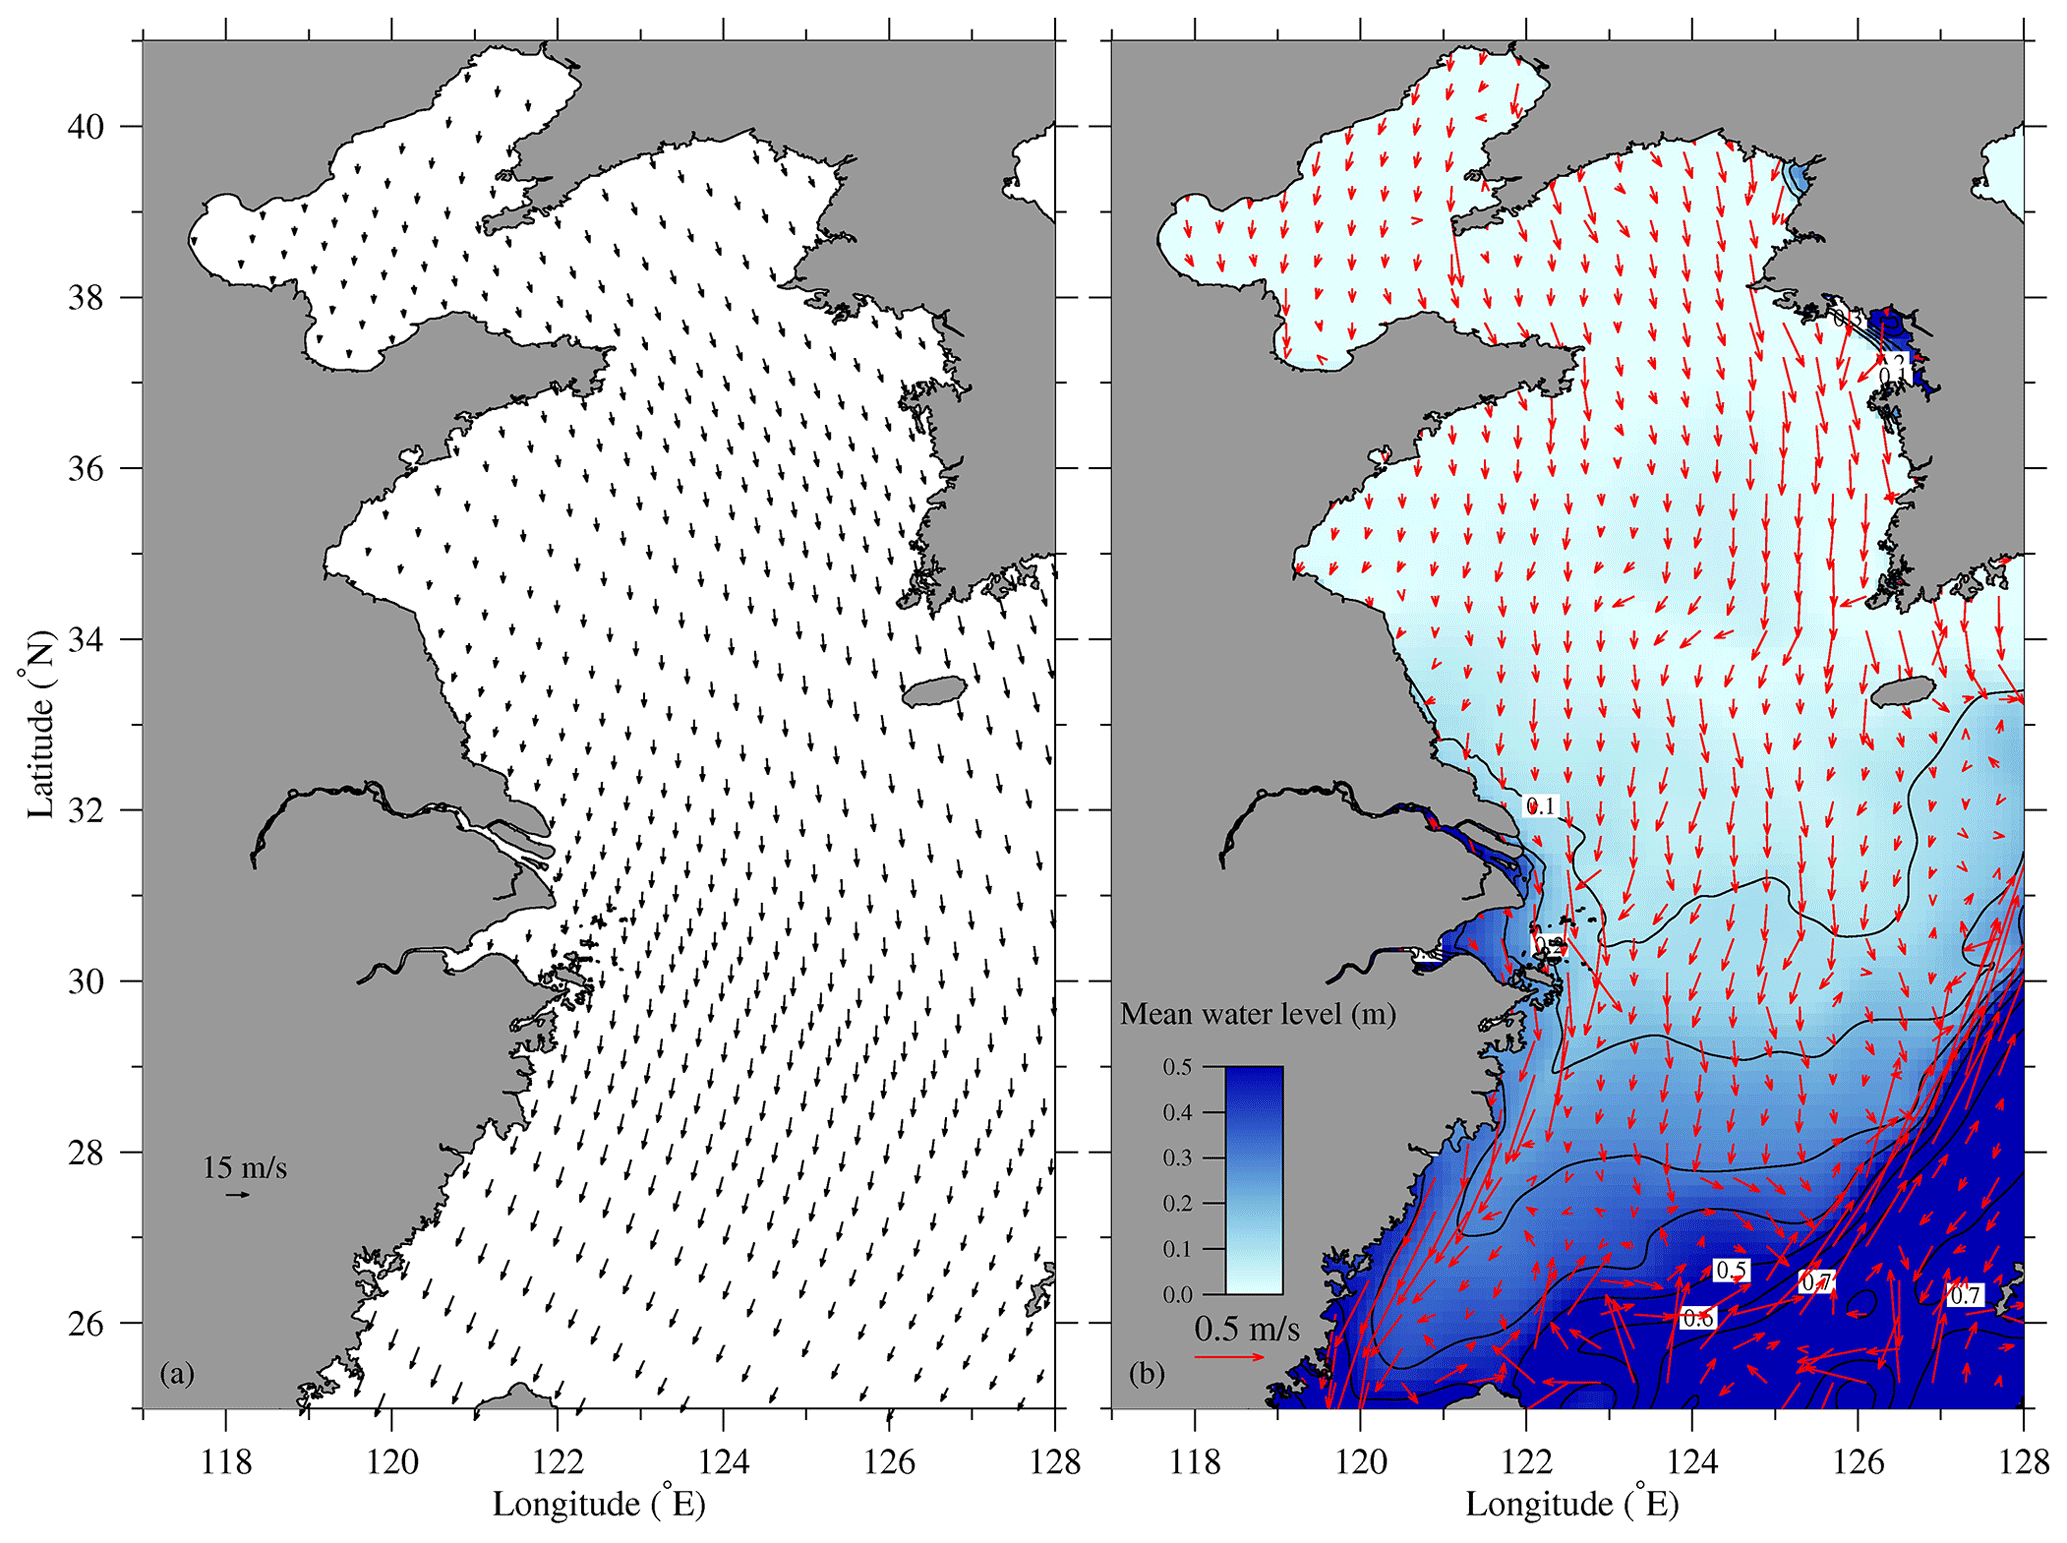
Figure 5Distributions of the climatic wind field (a) and residual (mean) water level and surface current (b) in February 2014.
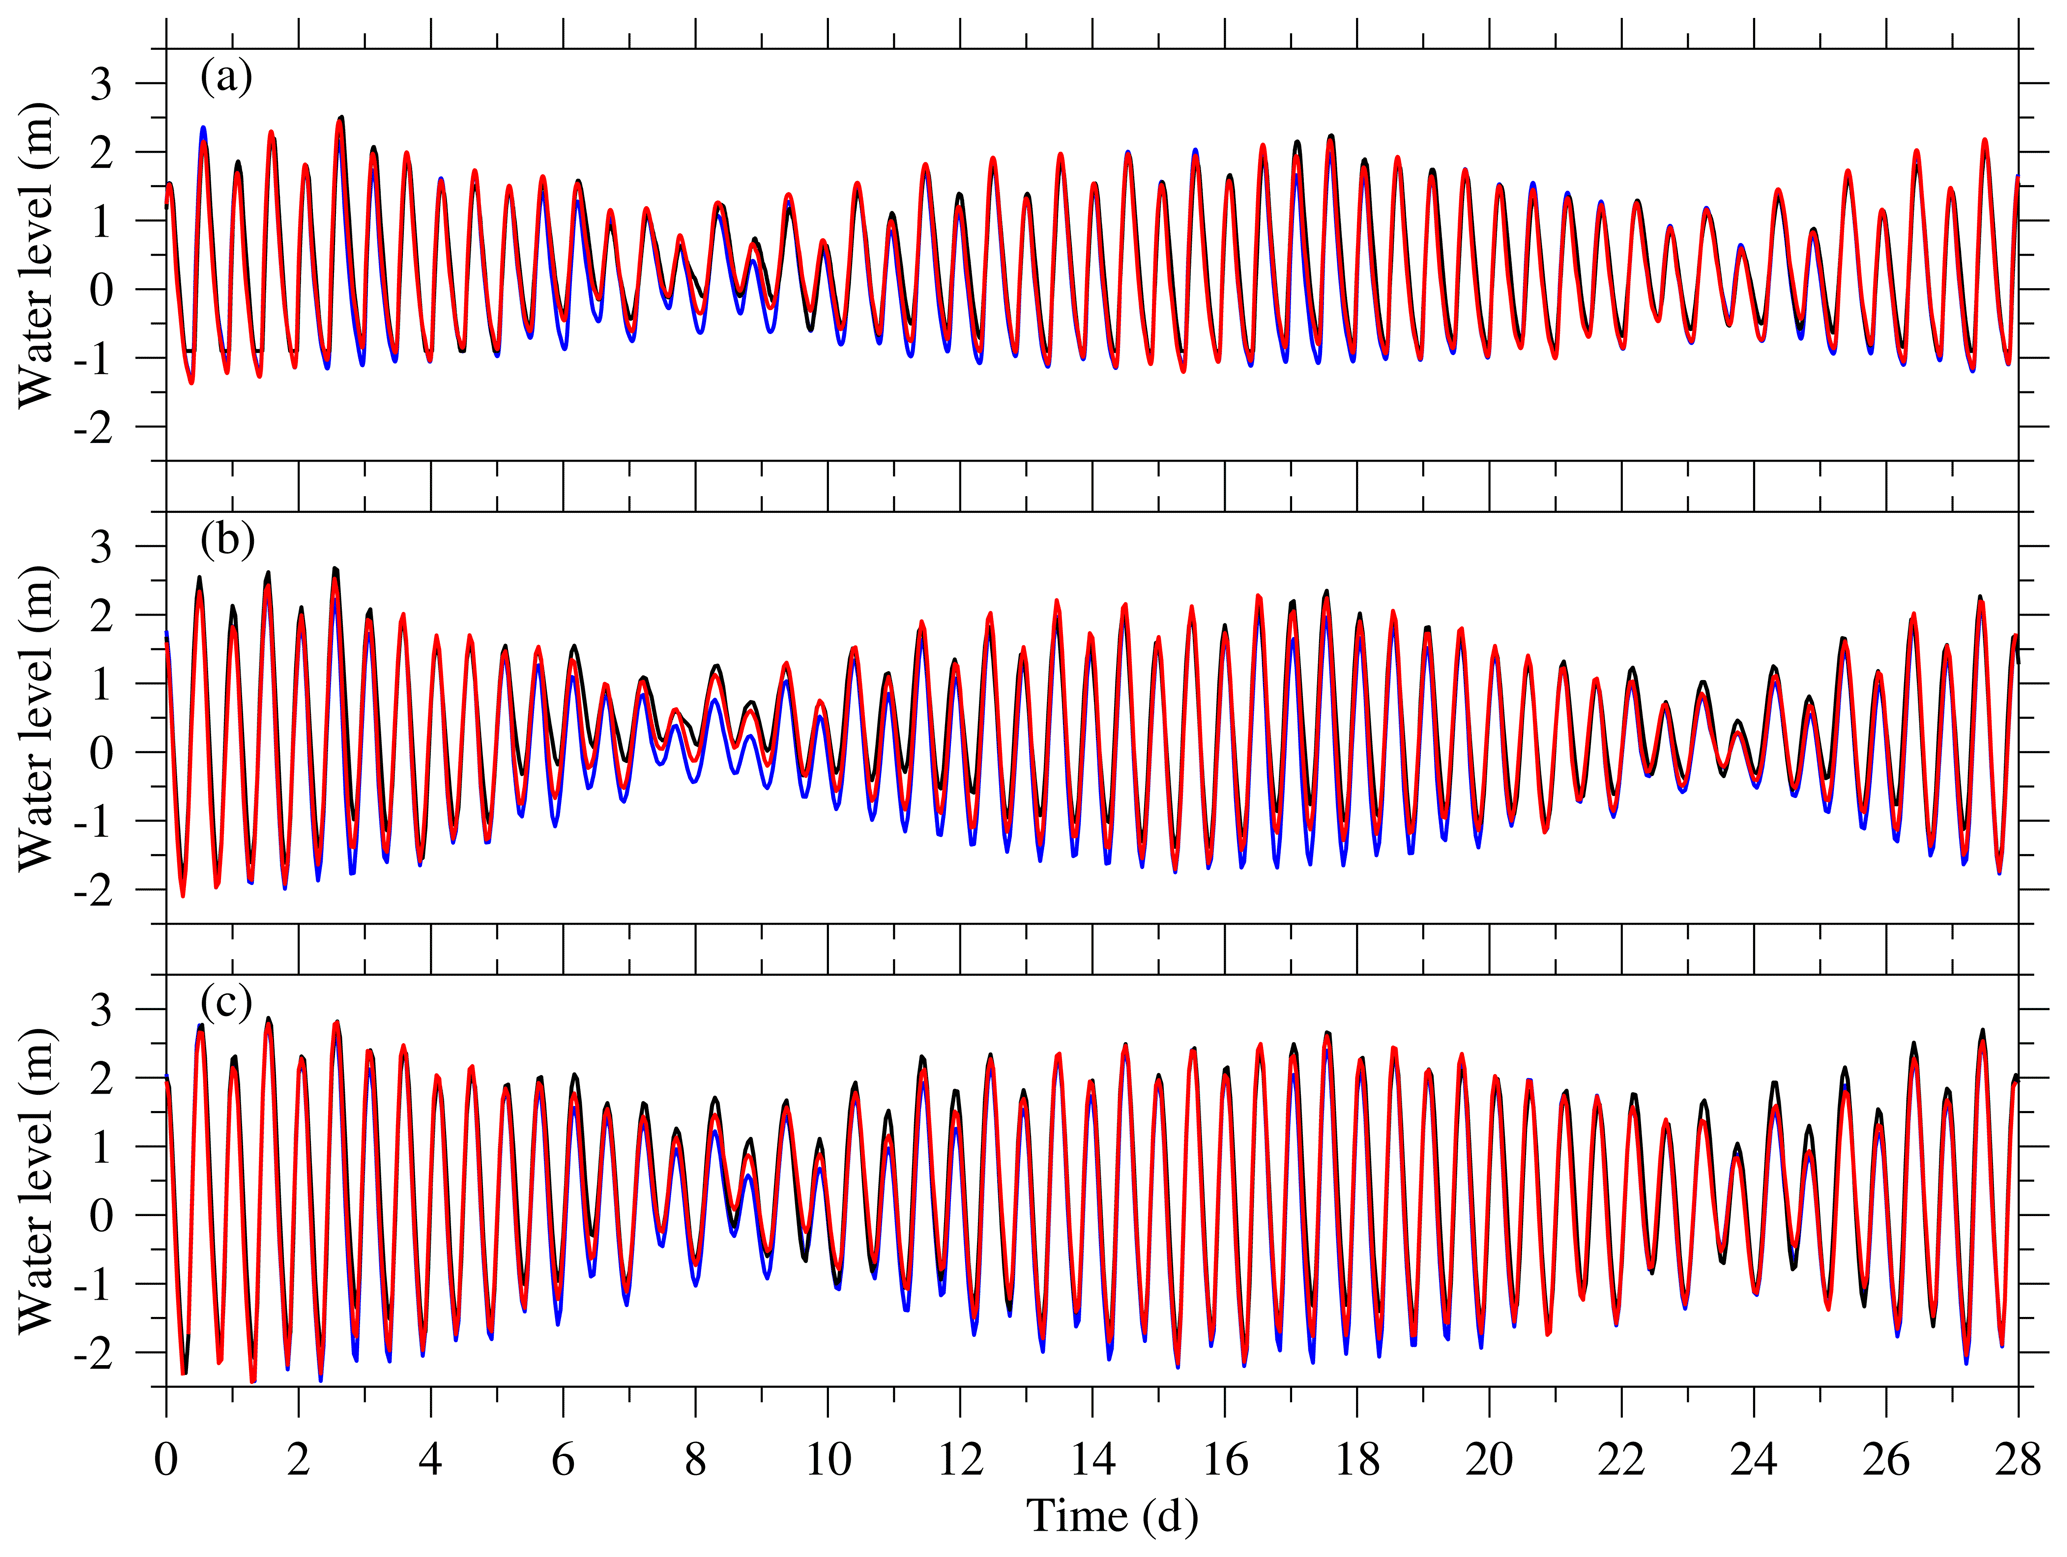
Figure 6Temporal variations in water levels in February 2014 at hydrologic stations. (a) Baozhen station, (b) Sheshan station and (c) Luchaogang station. Black line – measured data; blue line – simulated data in experiment 1; red line – simulated data in experiment 2.
The observed and modeled water level at Baozhen, Sheshan and Luchaogang stations is fairly consistent with the observed water level (Fig. 6), meaning that the water level is mainly determined by tide and river discharge inside the river mouth. However, during the neap tide from 6 to 9 February 2014, the modeled water level was approximately 10–30 cm lower than the observed level because the wind was not a realistically strong northerly wind.
The modeled salinity at Baozhen, Nanmen, Chongxi and Qingcaosha stations is shown in Fig. 3. Under climatic wind, the modeled salinity was significantly lower than the observed salinity at Baozhen, Nanmen and Qingcaosha stations and was distinctly lower at Chongxi station, which is similar to the normal saltwater intrusion regularly occurring under monthly mean river discharge and wind in the dry season (Shen et al., 2003; Zhu et al., 2015).
The residual unit width water flux at the surface from 10 to 13 February 2014 flowed seaward into the southern branch, northern channel, northern passage and southern passage but flowed landward into the northern branch due to its funnel shape and tidal Stokes transport (Qiu and Zhu, 2015), which means that the southern branch, northern channel and southern channel are the main channels for discharging river water into the sea (Fig. 7a). The distribution of time-averaged surface salinity indicated that there was a strong salinity front near the river mouth, which was caused by the confluence and mixing of fresh river water with seawater (Fig. 7b). The northern branch was occupied by highly saline water due to its topography. The funnel shape amplifies the tide in its upper reaches, and the wider tidal flat in the upper reaches lowers the amount of river discharge inflow (Wu et al., 2006; Lyu and Zhu, 2018). Salinity in the southern branch was less than 0.45, meaning that there was a wide area of fresh water near the water intake of the Qingcaosha reservoir. Among the southern passage, northern passage and northern channel, saltwater intrusion was the strongest in the southern passage and weakest in the northern channel, which is consistent with previous studies (Li et al., 2014; Wu et al., 2010; Lyu and Zhu, 2018).
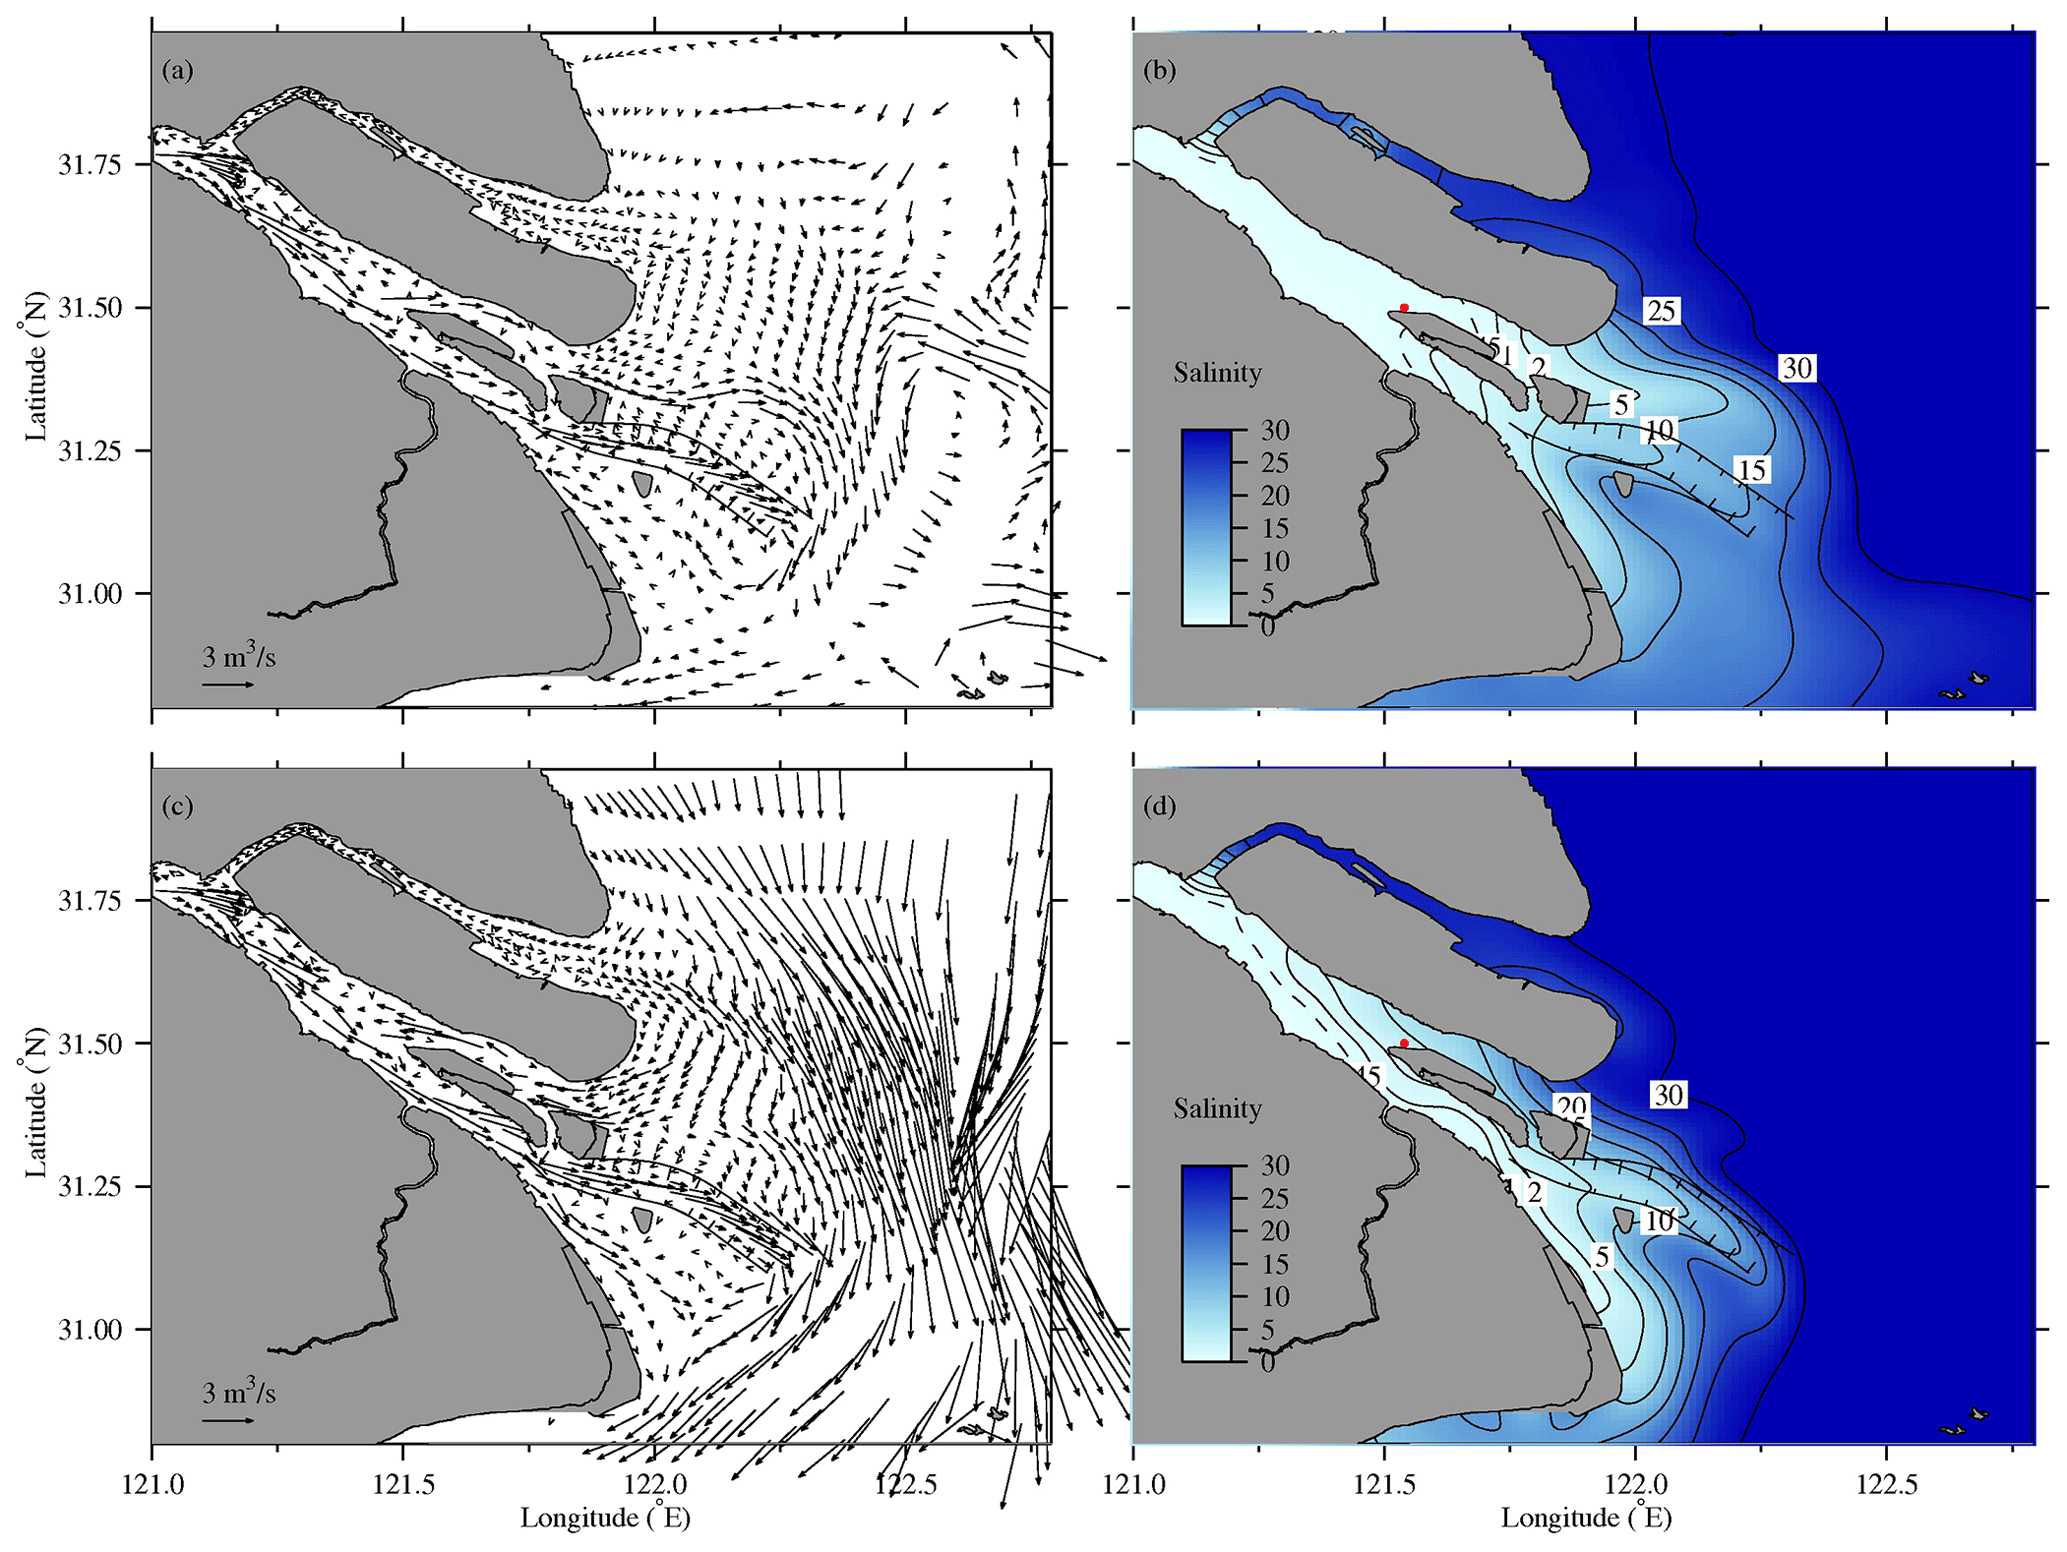
Figure 7Distributions of residual unit width water flux (a, c) and time-averaged surface salinity (b, d) from 10 to 13 February 2014 and from experiment 1 (a, b) and experiment 2 (c, d). The dashed isohaline represents a salinity of 0.45; the red dot denotes the location of water intake of Qingcaosha reservoir (similarly hereinafter).
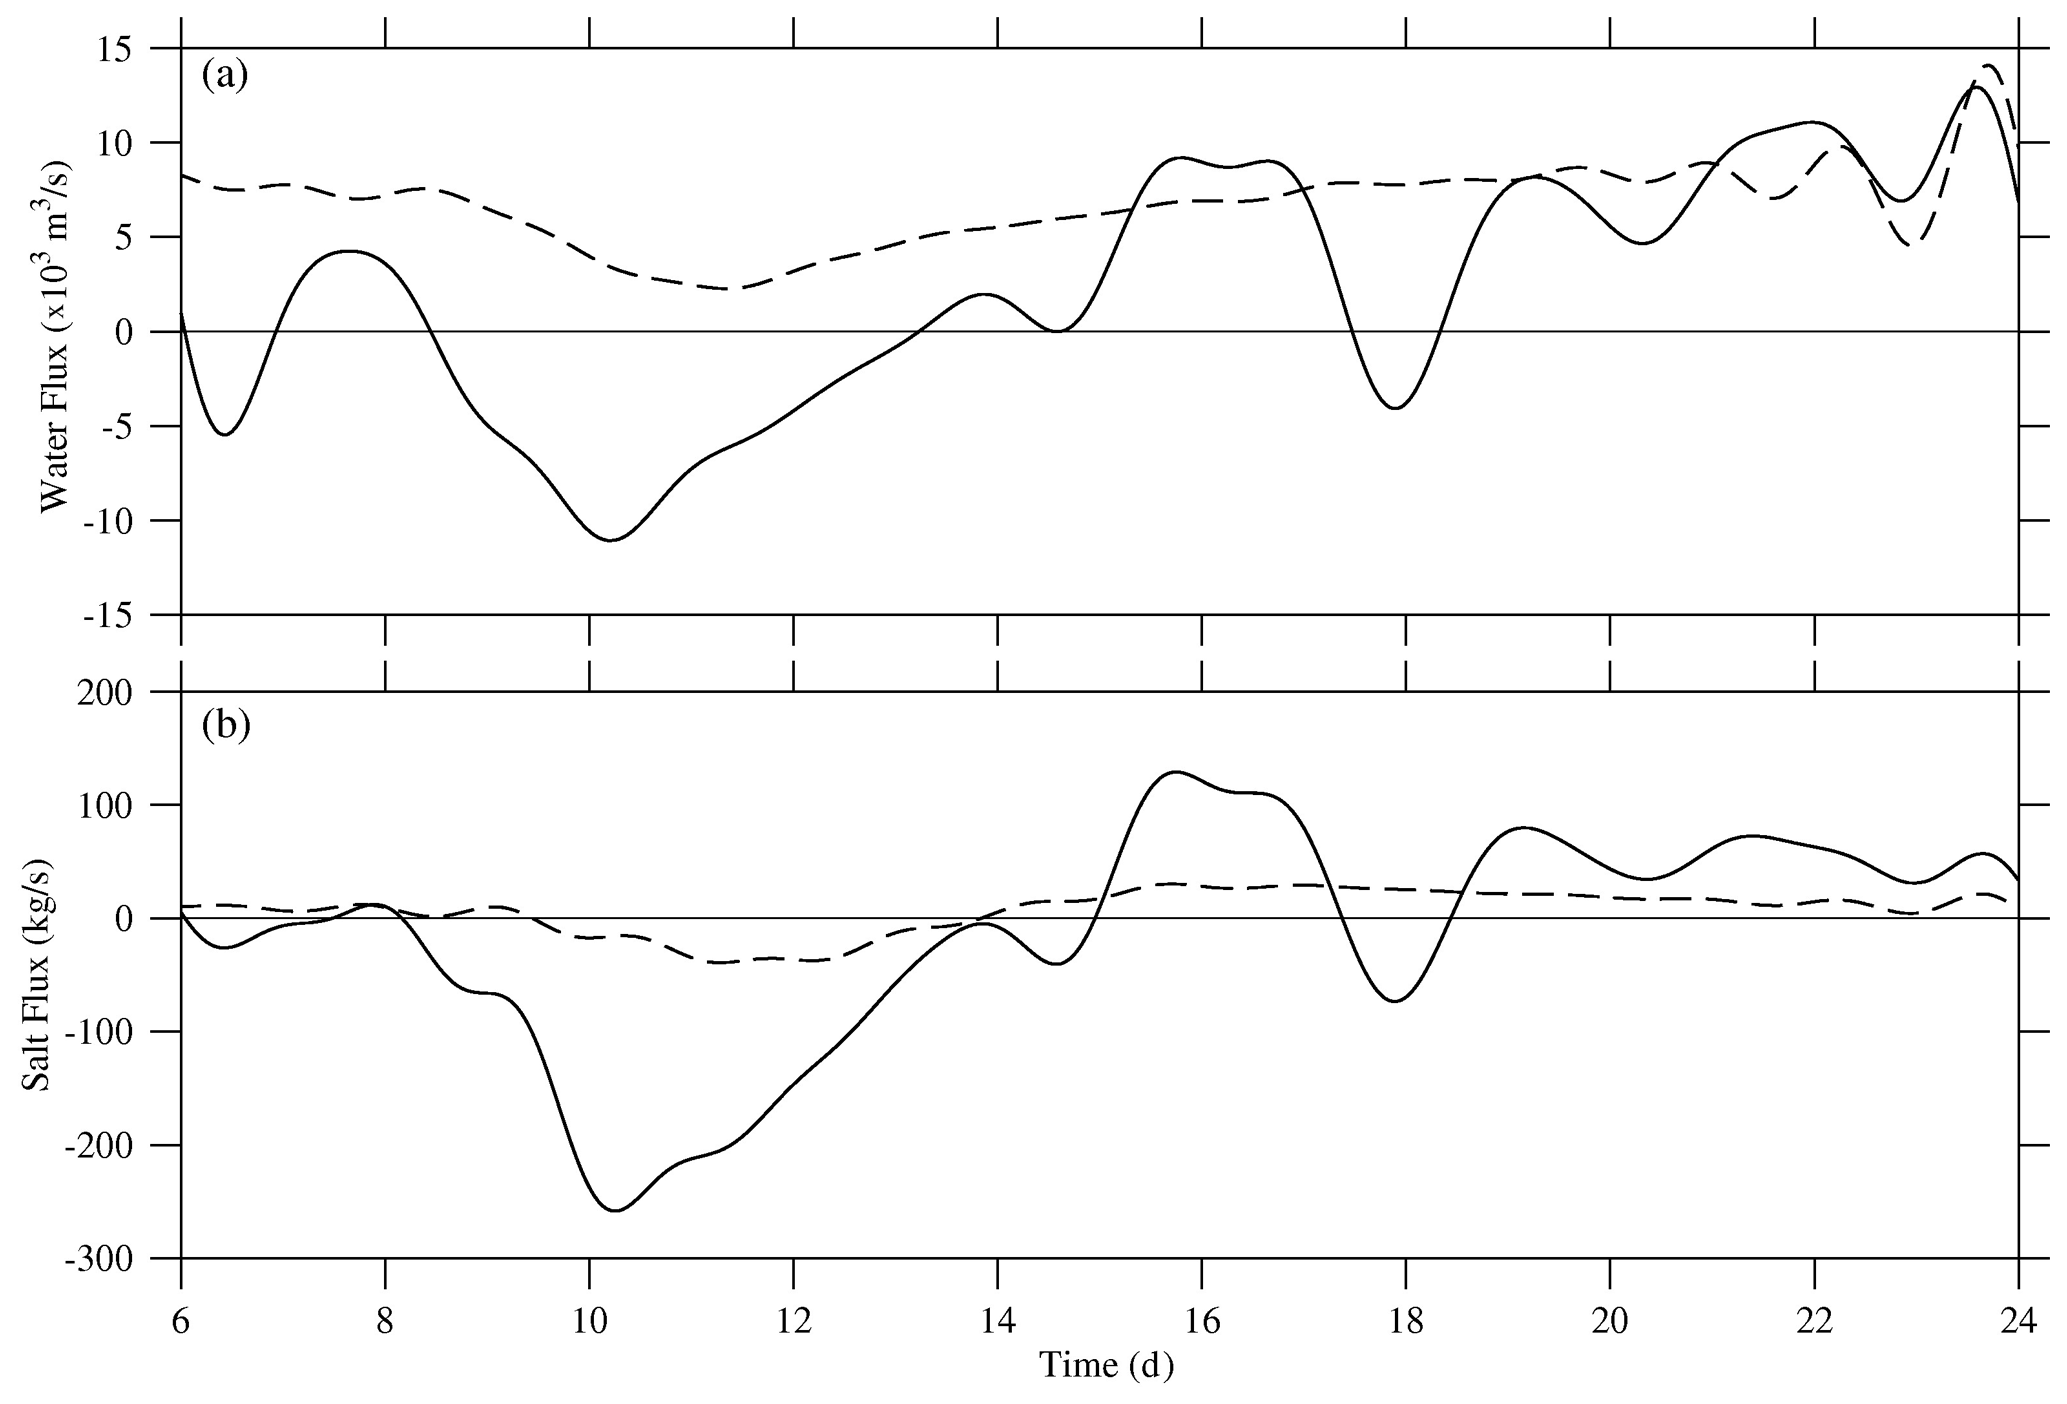
Figure 8Temporal variations in residual water flux (a) and salt flux (c) across sec1 in the northern channel from February 6 to 24 2014. Dashed line – experiment 1; solid line – experiment 2. A positive value represents seaward flux, and a negative value represents landward flux.
The residual water flux across the transverse section in the northern channel (sec1, as labeled in Fig. 1) from February 6 to 24 2014 flowed seaward due to the runoff force and decreased during the neap tide from 9 to 11 February (Fig. 8a). For the bifurcated Changjiang estuary, more river discharge flowed into the northern channel during the spring tide and into the southern channel during the neap tide (Li et al., 2010; Lyu and Zhu, 2018). The residual salt flux across this section flowed landward from 10 to 13 February 2014 during the later neap tide and the subsequent early middle tide, due to weaker tidal mixing and the saltwater wedge, and flowed seaward during other tidal conditions (Fig. 8b).
In experiment 1, the extremely severe saltwater intrusion event in February 2014 was not replicated, whereas the saltwater intrusion was simulated with experiment 2. The realistic wind was simulated by a mesoscale atmospheric model, namely the Weather Research Forecasting (WRF) model with two nested domains (Fig. 2c). The National Centers for Environmental Prediction (NCEP) reanalysis data set was used to establish the initial and boundary conditions of the WRF model. A comparison between the WRF-modeled wind vector and the measured wind vector at the weather station located at the Chongming eastern shoal showed that the persistent and strong northerly wind in February 2014 was well simulated by the WRF model (figure omitted).
The simulated temporally averaged wind field over the Yellow Sea and East China Sea from 7 to 14 February 2014 indicated that the northerly wind speed reached approximately 18 m s−1 (Fig. 9a), which was much higher than that observed at the weather station at the Chongming eastern shoal (Fig. 4b, c). The residual (mean) water level simulated by the model of the Bohai Sea, Yellow Sea and East China Sea showed that the strong northerly wind induced a significantly high water level along the coast of China during the extremely severe saltwater intrusion event from 10 to 13 February 2014 (Fig. 9b). The residual water level was interpolated into the open sea boundaries of the saltwater intrusion model. The temporal variations in wind vector and wind speed (b) at Sheshan island (labeled in Fig. 1) in February 2014, simulated by WRF (Fig. 10), was similar to the one observed at Chongming eastern shoal (Fig. 4b, c), indicating again that there existed a persistent and strong northerly wind in February 2014.
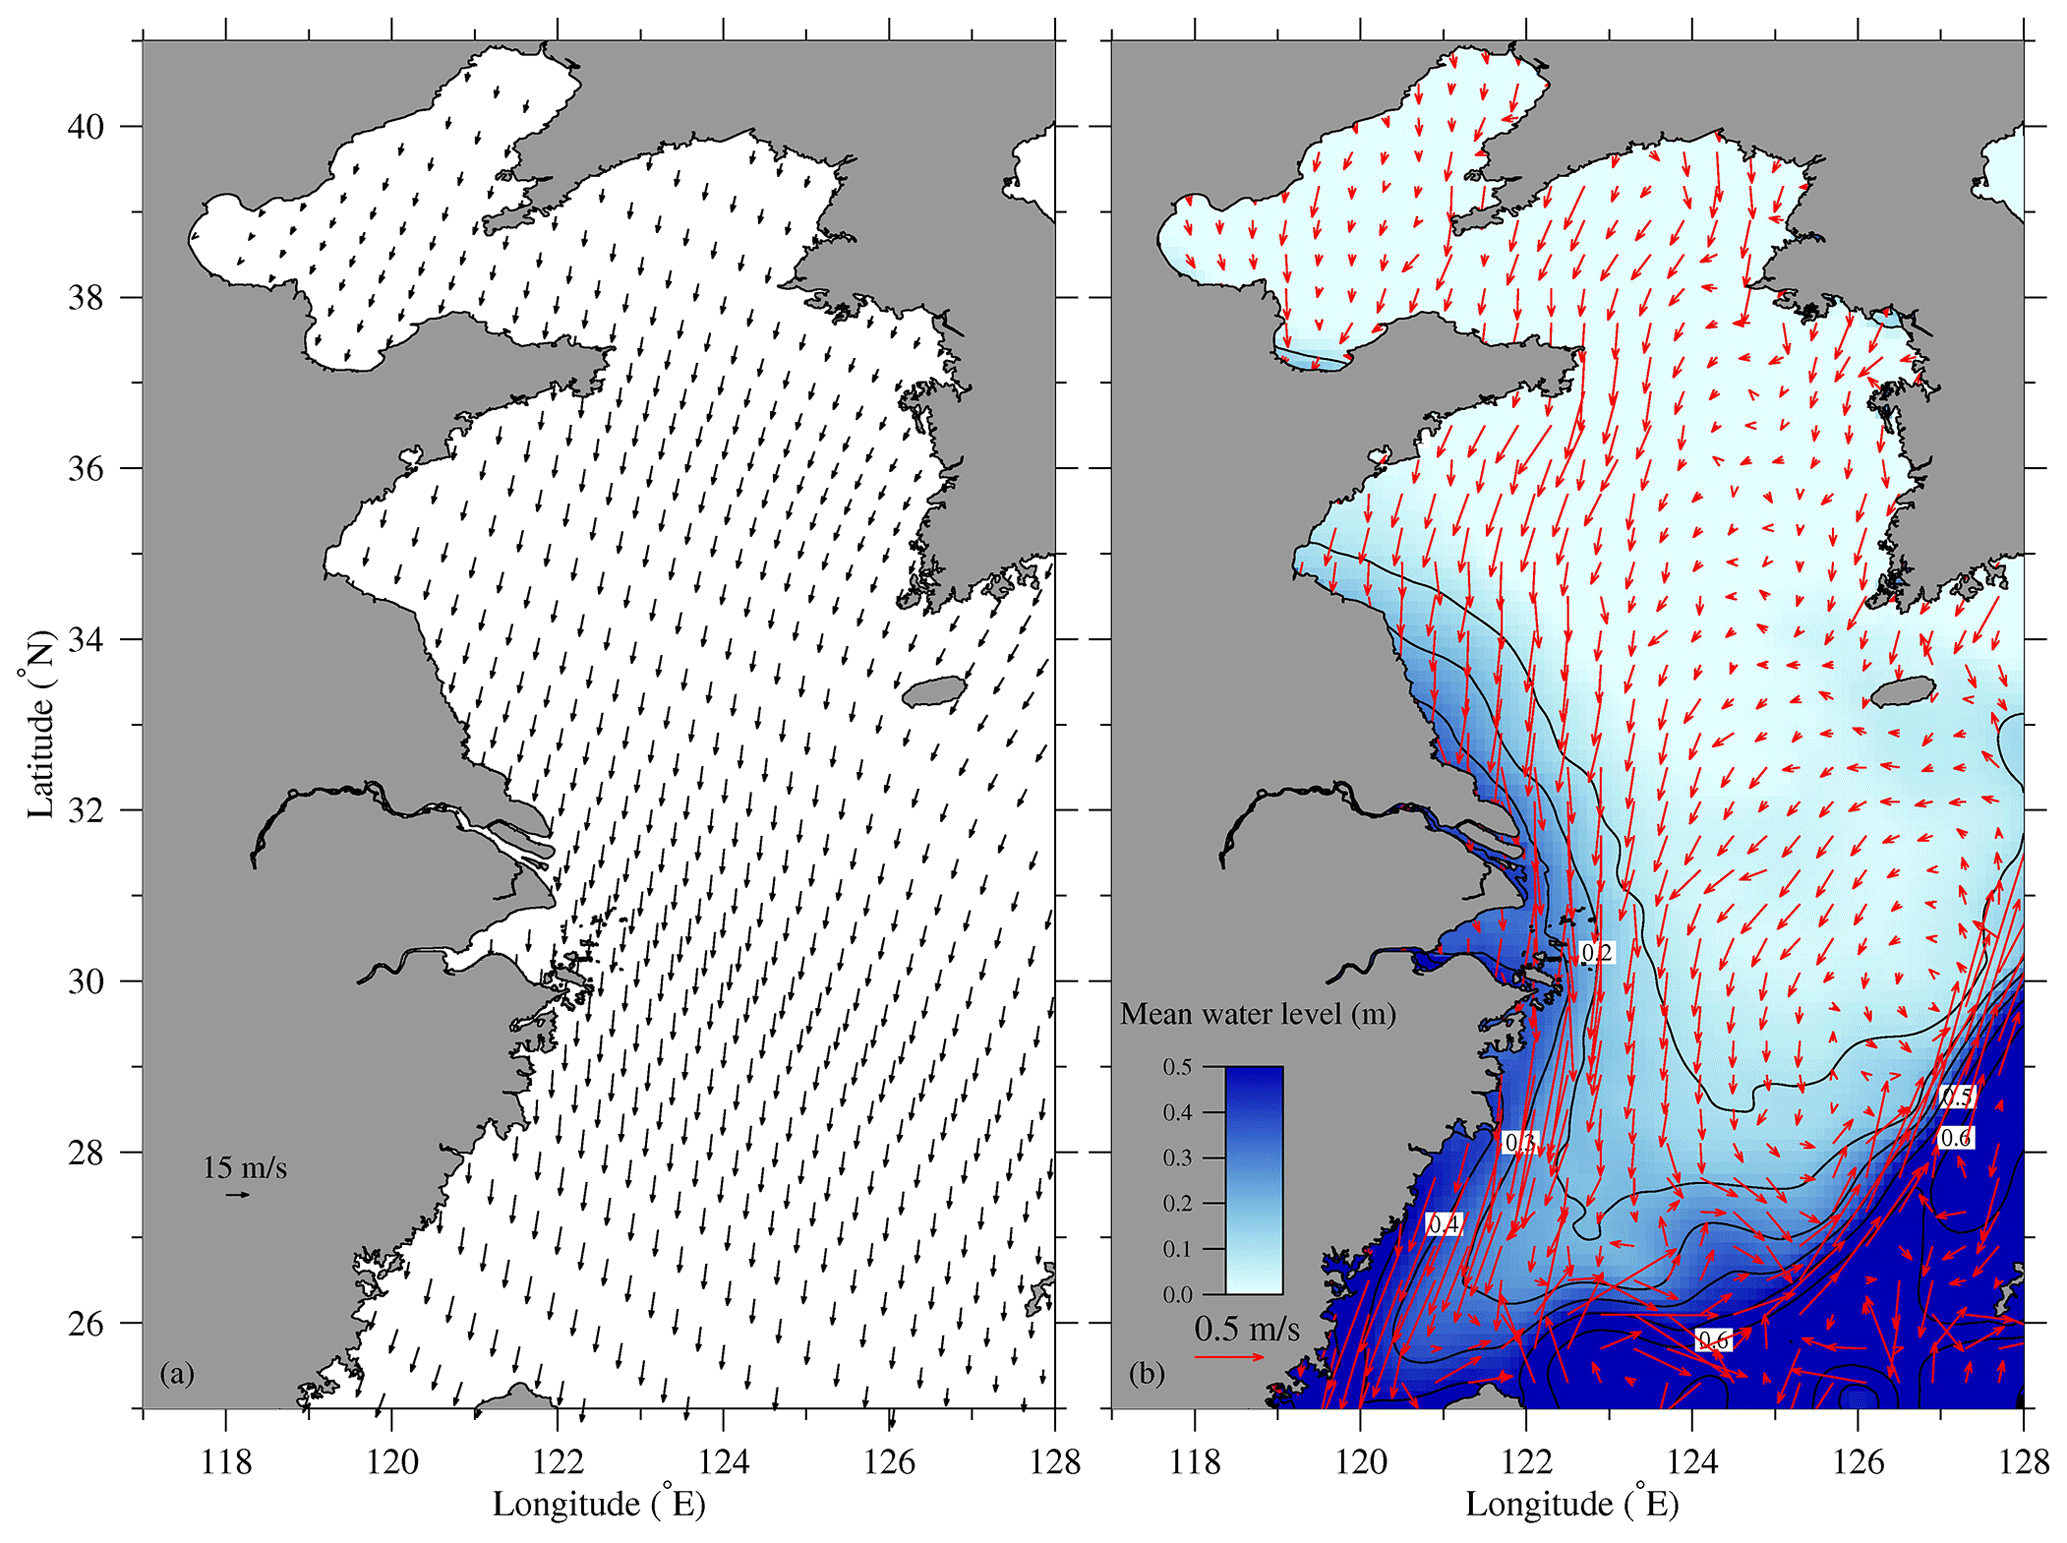
Figure 9Distributions of the temporally averaged wind field from 7 to 14 February 2014, as simulated by the WRF model (a), and the time-averaged (mean) water level and surface current from 10 to 13 February 2014, as simulated by the model encompassing the Bohai Sea, Yellow Sea and East China Sea (b).
In comparison to the results of experiment 1, the simulated water level in experiment 2 at the Baozhen, Sheshan and Luchaogang stations was closer to the observed water level, especially during the neap tide from 7 to 11 February 2014 (Fig. 6). The difference between the observed water level and the modeled water level under climatic wind can be considered the water level rise caused by the northerly strong wind. It is seen in Fig. 6 that the water level rise at the low water level from 5 to 12 February 2014 was approximately 0.35, 0.40 and 0.30 m at Baizhen, Sheshan and Luchaogang stations, respectively. The simulated salinity at Baozhen, Nanmen, Chongxi and Qingcaosha stations was significantly improved and was very consistent with the observed salinity in terms of both magnitude and phase (Fig. 3). The salinity modeled under climatic wind and residual water level conditions at open sea boundaries was significantly lower than the observed salinity, and the salinity variation process was successfully replicated under realistic wind and residual water levels at the open sea boundaries. Therefore, the persistent and strong northerly wind played an important role in the extremely severe saltwater intrusion event.
The temporal variations in the observed and modeled water levels at Baozhen, Sheshan and Luchaogang stations (Fig. 6) and salinity at Chongxi, Nanmen and Qingcaosha hydrologic stations in February 2014 (Fig. 3) show that the model can reproduce the salinity variation processes involved in the extreme saltwater intrusion event. The model was validated again, and the results are quite robust.
The long-lasting, persistent and strong northerly wind produced a strong southward current, with a speed of 40–60 cm s−1, and a landward Ekman water transport under the Coriolis force, resulting in a high water level of more than 30 cm along the coast of China (Fig. 9b), which was confirmed by the observed water level rise at the Sheshan and Luchaogang stations (Fig. 4d). Because the northern branch is very shallow, the landward Ekman water transport was weaker, flowing along the northern side and flowing out along the southern side only near the river mouth (Fig. 7c). However, the northern channel is deeper and wider and is located on the northern side of the southern branch, which is conducive to strong landward Ekman water transport in the northern channel.
The residual unit width water flux from 10 to 13 February 2014 flowed landward into the northern channel, meaning that the landward Ekman transport induced by the persistent and strong northerly wind surpassed the seaward runoff (Fig. 7c). The Changjiang is a large river, and its river discharge was 11 510 m3 s−1 in February 2014, so it is unexpected that wind-driven landward water transport could surpass the strong seaward runoff. The current flowed into the northern channel and flowed out of the southern channel, forming a horizontal circulation and leading to highly saline seawater in the northern channel.
The residual water and salt flux across the transverse section in the northern channel from 9 to 13 February 2014 flowed landward, with a maximum value of 12 000 m3 s−1 and 360 kg s−1, respectively (Fig. 8), which was consistent with the distribution of residual unit width water flux. In experiment 1, the residual water flux was seaward due to runoff, and the landward residual salt flux from 10 to 12 February 2014 was very small compared to that in experiment 2. Therefore, the extremely severe saltwater intrusion event in February 2014 was caused by the persistent and strong northerly wind, which produced a strong landward net transport and abnormal water level rise, induced a horizontal circulation and brought highly saline water into the northern channel.
This section systematically discusses the potential mechanism of the extremely severe saltwater intrusion with regard to the SSO, how the wind affects the individual terms in the momentum equations, the relationship between residual water level and wind, the generation of Ekman transport and the resulting horizontal circulation, and the duration of the severe saltwater intrusion induced by the northerly wind.

Figure 10Temporal variations in wind vector (a) and speed (b) in February 2014 as simulated by WRF.
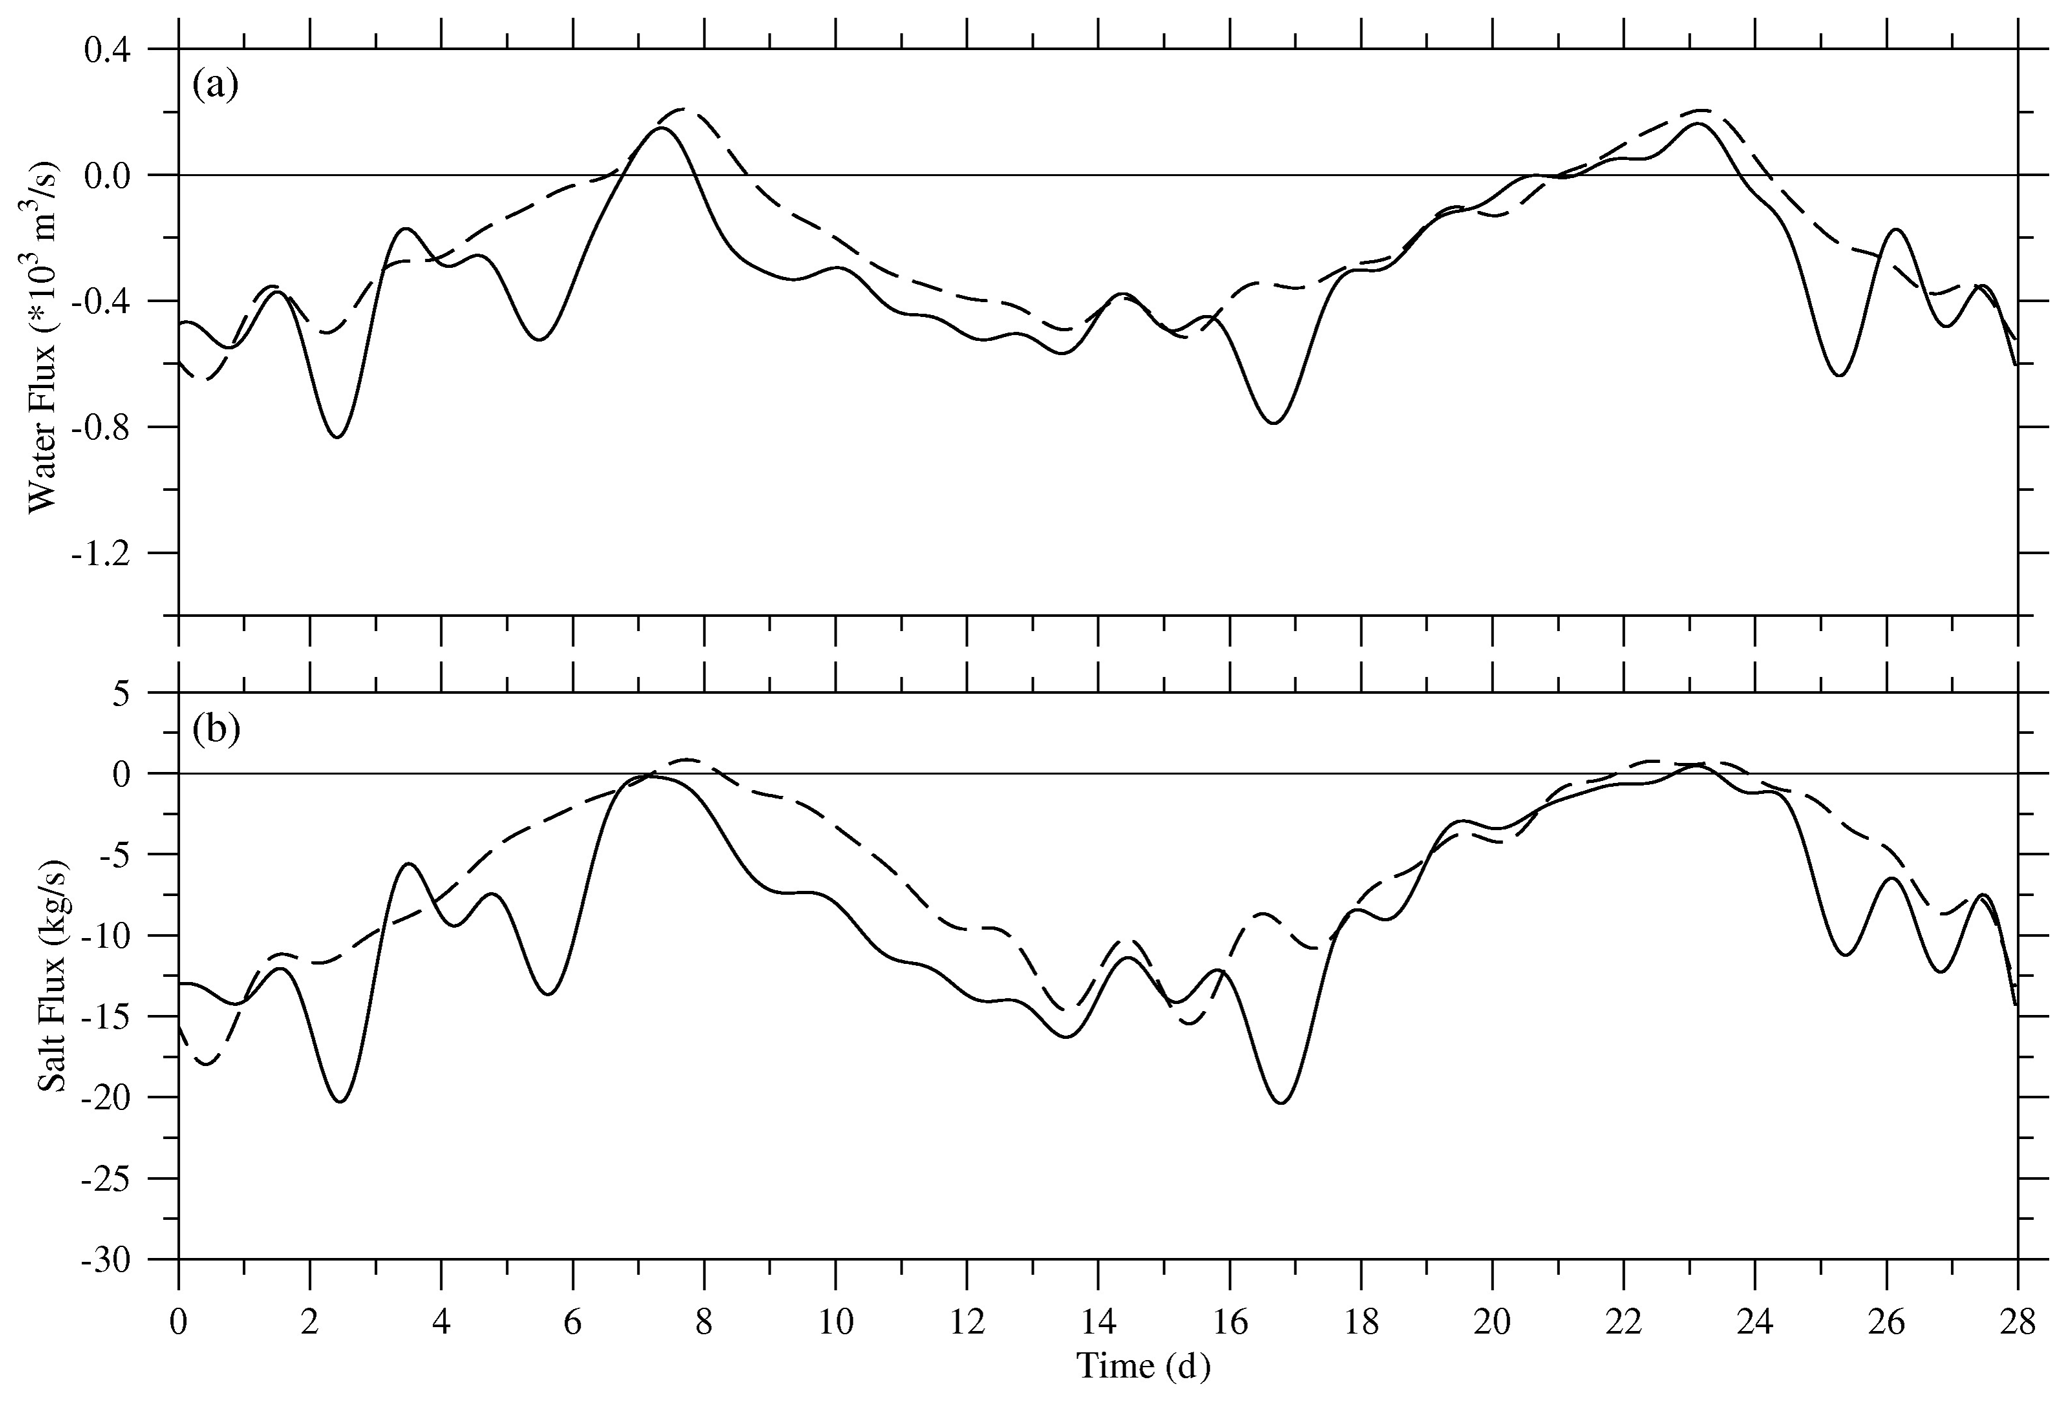
Figure 11Temporal variations in residual water flux (a) and salt flux (b) across sec2 in the northern branch in February 2014. Dashed line – experiment 1; solid line – experiment 2. A positive value represents seaward flux, and a negative value represents landward flux.
4.1 What was the contribution of the SSO to the saltwater intrusion event?
The most obvious feature of saltwater intrusion in the Changjiang estuary is the SSO. Previous studies showed that the SSO is the main source of saltwater intrusion in the upper and middle reaches of the southern branch and the main saltwater source of the reservoirs (Shen et al., 2003; Wu et al., 2006; Zhu et al., 2013; Lyu and Zhu, 2018). What was the extent of the contribution of the SSO to the extremely severe saltwater intrusion in February 2014? A transect sec2 at the upper reaches of the northern branch (location labeled in Fig. 1) was set to calculate water and salt flux.
In experiment 1, the water flux from 6 to 8 February 2014 and salt flux on 7 February 2014 were transported from the southern branch into the northern branch (Fig. 11). This phenomenon occurred during a neap tide (indicated by the water level in Fig. 6), while, in the other tidal patterns, the water and salt flux was transported from the northern branch into the southern branch, especially during the spring tide from 14 to 17 February 2014. This is the famous SSO occurring during the middle and spring tide in dry season.
In experiment 2, the seaward water flux on 7 February decreased, and the landward water flux increased from 4 to 6 February and from 8 to 14 February, and the salt flux from 4 to 14 February was landward, under a strong northerly wind, which was distinctly greater than the result under the climatic wind and residual water level conditions at open sea boundaries. Therefore, the strong northerly wind enhanced the SSO.
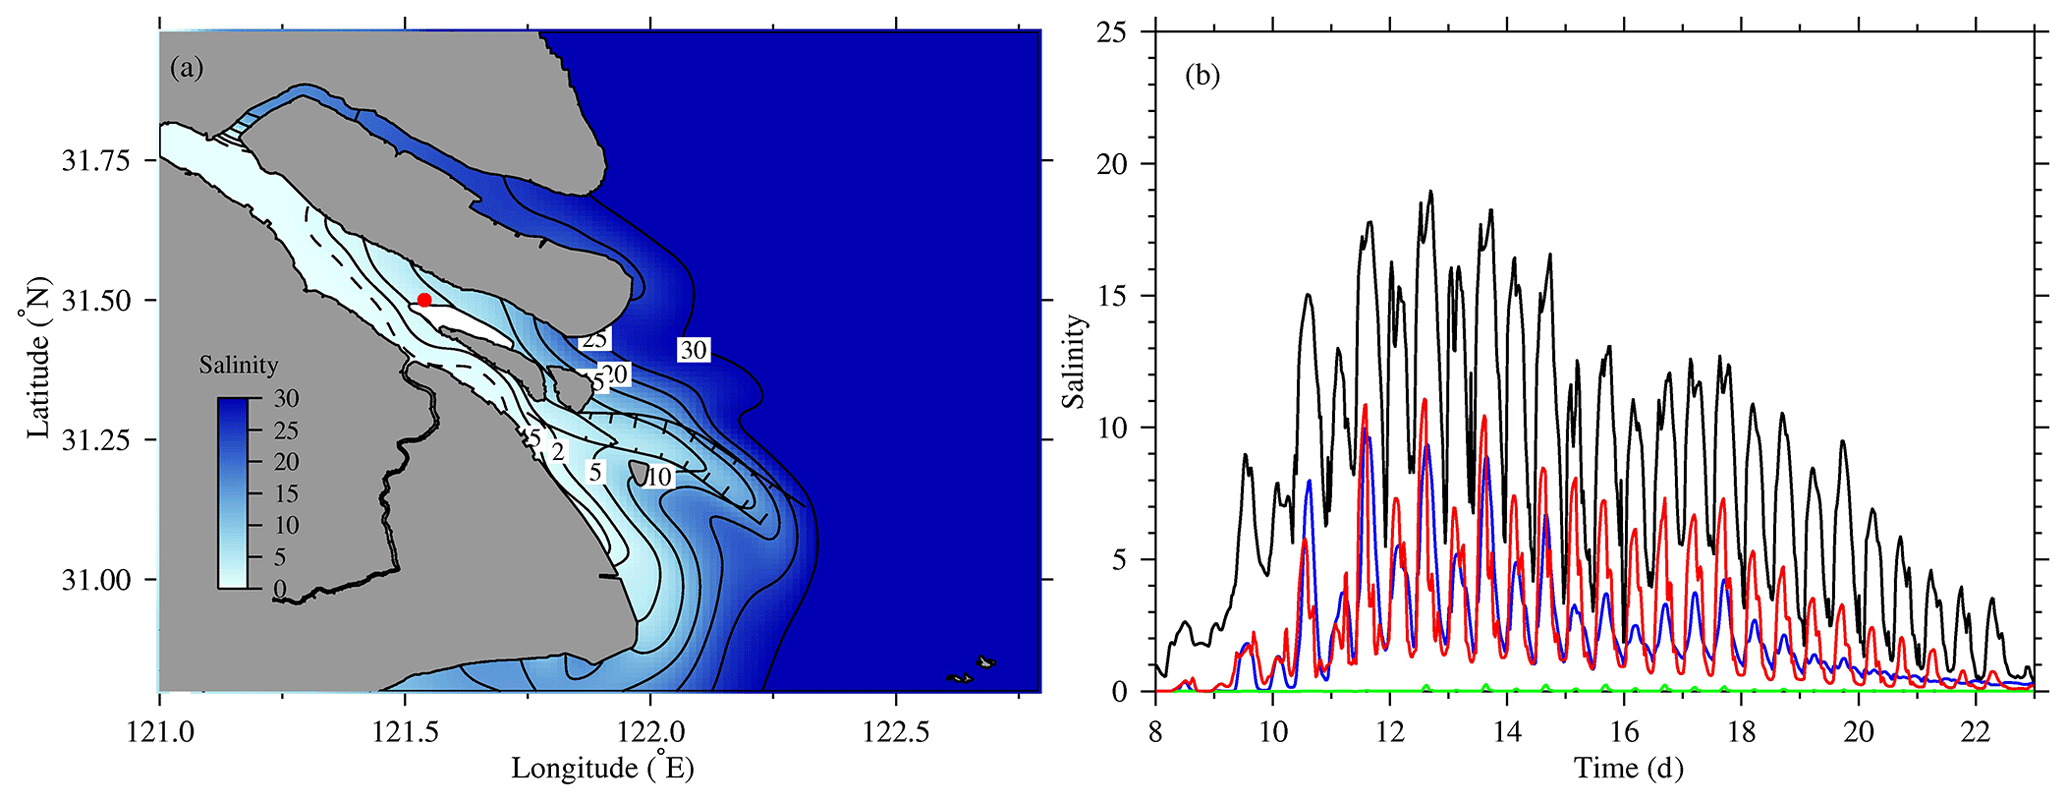
Figure 12Distribution of time-averaged surface salinity from 10 to 13 February 2014 (a). Temporal variations in salinity from 8 to 22 February 2014 at hydrologic stations (b) if the upper reaches of the northern branch are blocked and under realistic wind and residual water levels at the open sea boundaries. Black line – Baozhen; red line – Nanmen; green line – Chongxi; blue line – Qingcaosha.
A numerical experiment was designed in which the upper reaches of the northern branch were blocked (location labeled in Fig. 1) to further distinguish the contribution of SSO in the saltwater intrusion event. The distribution of time-averaged surface salinity from 10 to 13 February 2014 (Fig. 12a) and the temporal variations in salinity from 8 to 22 February 2014 at Chongxi station (Fig. 12b) show that the SSO was completely absent, while the salinity in the river mouth and near the Qingcaosha reservoir and at the Baozhen, Nanmen and Qingcaosh stations was almost identical to the results from experiment 2 (Figs. 7d, 3a, b, d), indicating that the SSO had almost no contribution to the saltwater intrusion event in February 2014.
4.2 How does the wind affect the individual terms in the momentum equations?
The modeled individual terms in the momentum equations were outputted at site of Mo in the northern channel (labeled in Fig. 1; water depth 9.62 m) in order to analyze how the wind affects these terms. The momentum along the river channel (ξ direction) is as follows:
The momentum across the river channel (η direction) is as follows:
where and represent the local variation, and are advection, vf and −uf indicate the Coriolis force, and represent the barotropic pressure gradient force, and are the baroclinic pressure gradient force, and are vertical turbulence viscosity, and Fξ and Fη are horizontal turbulence viscosity in the ξ and η directions, respectively. Each output term in the momentum equations was vertically averaged, and the vertical turbulence viscosity and equals , , in which τaξ, τaη and τbξ, τbη are the wind stress and bottom friction force in the ξ and η direction, respectively. The tidal fluctuations in the vertically averaged terms were filtered using the moving average method.
In experiment 1, the residual water movement along the northern channel was mainly determined by the seaward barotropic pressure gradient force and advection (Fig. 13a). The residual barotropic pressure gradient force was positive (seaward), induced mainly by river discharge, varied with spring and neap tide and had a smaller value from 7 to 9 February 2014 (during the neap tide; Fig. 6). The seaward runoff produced a negative Coriolis force. The baroclinic pressure gradient force was very small before 10 February because the saltwater intrusion was very weak at the model output site, but it then became larger with the increasing tide. This term is always landward in estuaries because the saline water is downstream. Across the channel, the residual water movement was also mainly determined by the barotropic pressure gradient force and advection (Fig. 13b). The barotropic pressure gradient force was positive (northward) because the water level is higher on southern side of the channel than on northern side due to the effect of the Coriolis force on runoff. The baroclinic pressure gradient force was negative because salinity was higher on the northern side than on the southern side due to the effect of the Coriolis force on the flood current that brought saline water into the estuary.
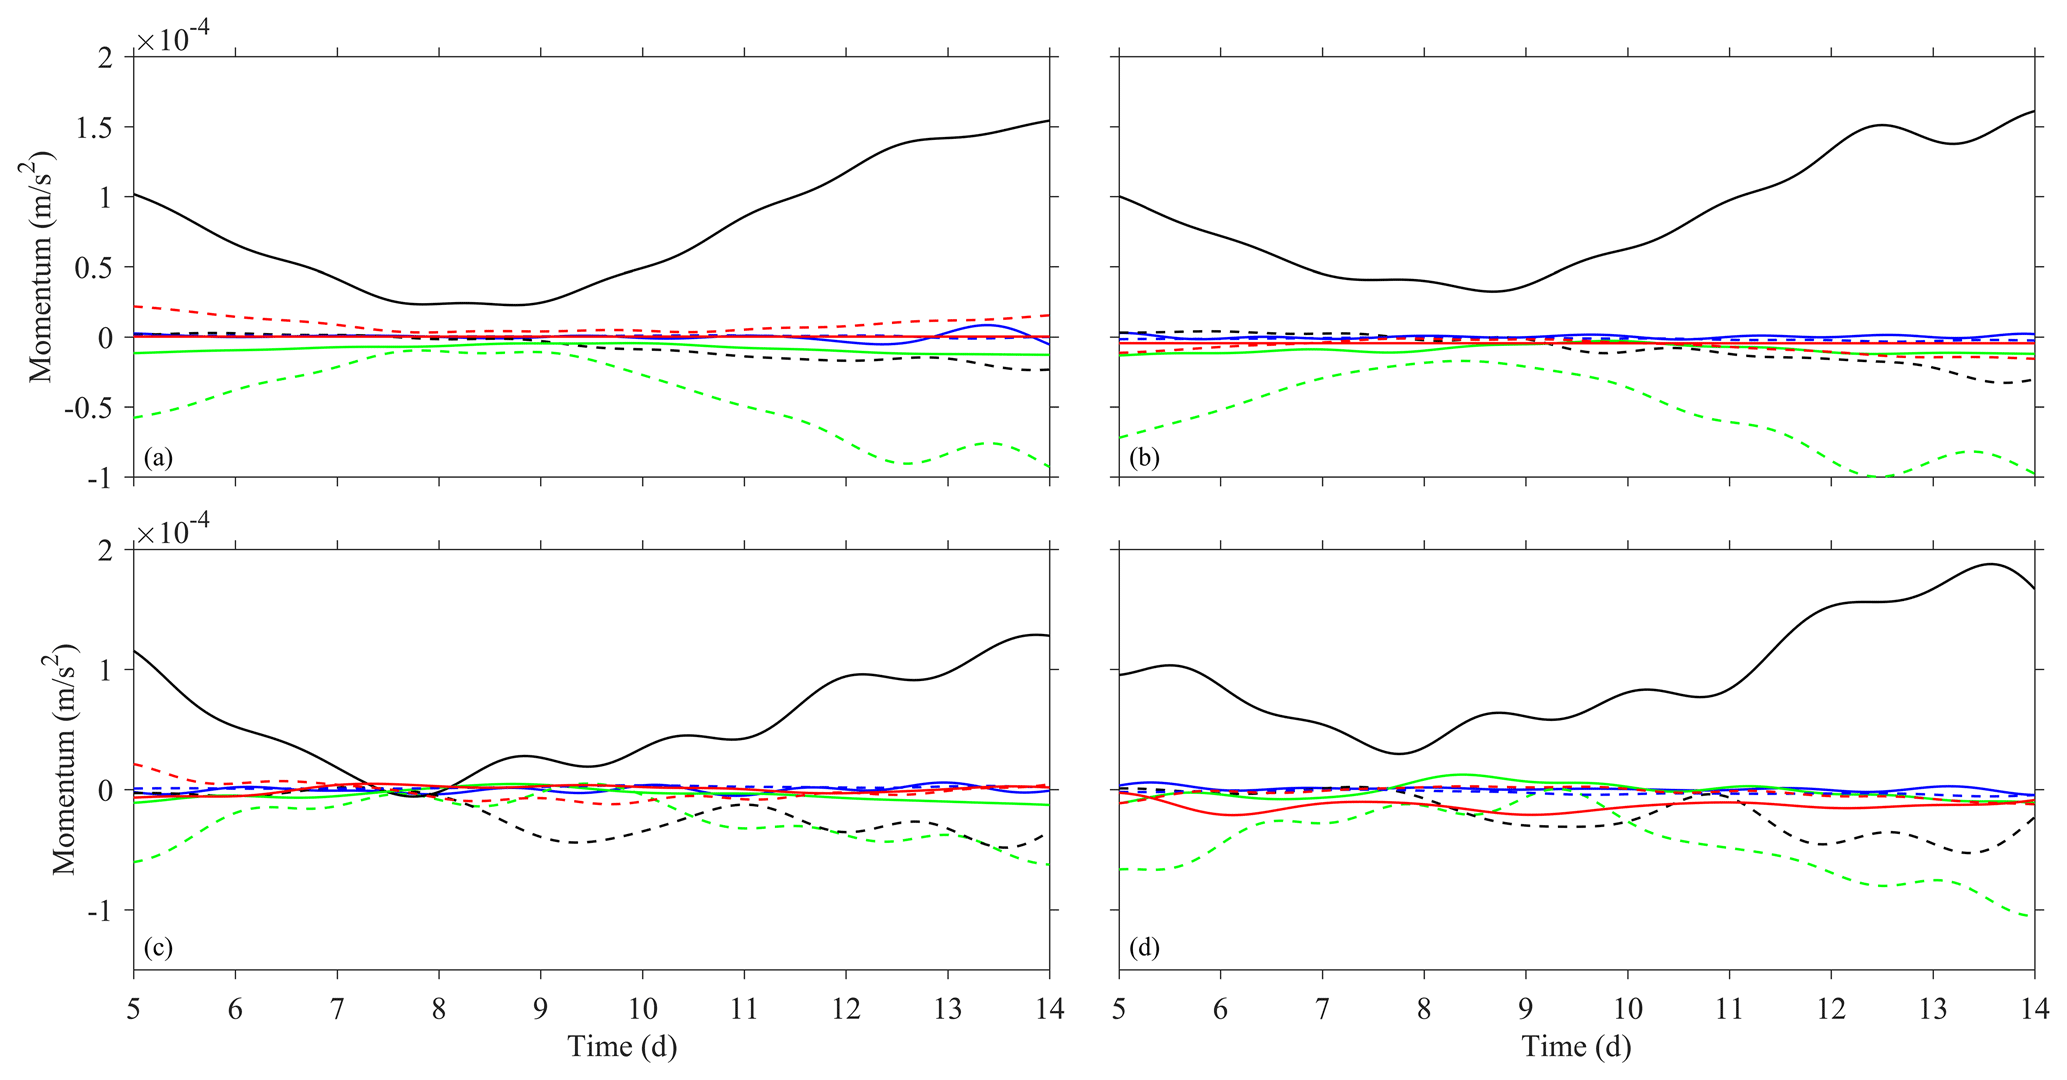
Figure 13Temporal variations in the vertically and time-averaged terms in the momentum equations along the channel (a, c) and across the channel (b, d) from 5 to 13 February 2014 in experiment 1 (a, b) and experiment 2 (c, d) at the site labeled Mo in the northern channel. Red solid line – wind stress at river surface; red dashed line – bottom friction force; black solid line – barotropic pressure gradient force; black dashed line – baroclinic pressure gradient force; green solid line – Coriolis force; green dashed line – advection; blue solid line – local variation; blue dashed line – horizontal turbulence viscosity.
The results of experiment 2 were considerably different from those in experiment 1 (Fig. 13c, d). The persistent and strong wind induced greater southward wind stress (red solid line in Fig. 13d) and produced landward Ekman transport and a rising water level, which significantly reduced the seaward barotropic pressure gradient force, especially from 7 to 8 February 2014. At this time, the barotropic pressure gradient force was very small, even negative (landward), and thus, the net water transport was landward, greatly enhancing the saltwater intrusion in the northern channel while distinctly increasing the landward baroclinic pressure gradient force (black dashed line in Fig. 13c).
4.3 The relationship between residual water level and wind
The residual (mean) water level in the Changjiang estuary is closely correlated with the wind. The water level at Sheshan and Luchaogang stations rose during the northerly wind and dropped during the southerly wind in February 2014 (Fig. 4d). The water level rise of more than 50 cm corresponded to the strong northerly wind. The water level was approximately 20 cm (Fig. 5b) under climatic wind in February 2014 and 30 cm (Fig. 9b) under persistent and strong northerly wind in February 2014. At Baozhen, Sheshan and Luchaogang stations in February 2014, the modeled water level under climatic wind was lower than that under strong northerly wind, especially from 6 to 10 February 2014, when the difference reached 10–30 cm (Fig. 6). Therefore, the stronger the northerly wind is, the higher the water level in the Changjiang estuary and the adjacent sea.
4.4 The generation of Ekman transport and the resulting horizontal circulation
The northerly wind produces a southward current along the China coast and pushes water landward, transported by the Coriolis force, resulting in a high water level along the coast. In the Changjiang estuary, this dynamic mechanism causes a pure wind-driven horizontal circulation that flows into the northern channel and out of the southern channel (Fig. 14a). The wind-driven estuarine current can enhance saltwater intrusion in the northern channel and weaken it in the southern channel. Previous studies revealed the dynamic mechanism of northerly wind on the saltwater intrusion by the purely wind-driven current in the estuary (Wu et al., 2010; Li et al., 2012). In this study, the horizontal estuarine circulation was a total (net) circulation forced by the river discharge, tide and a persistent and strong northerly wind (Fig. 7c) and was not a purely wind-driven circulation, which surpassed the strong seaward runoff from 9 to 13 February 2014 (Fig. 8a). This result was unexpected and surprising and was found for the first time.
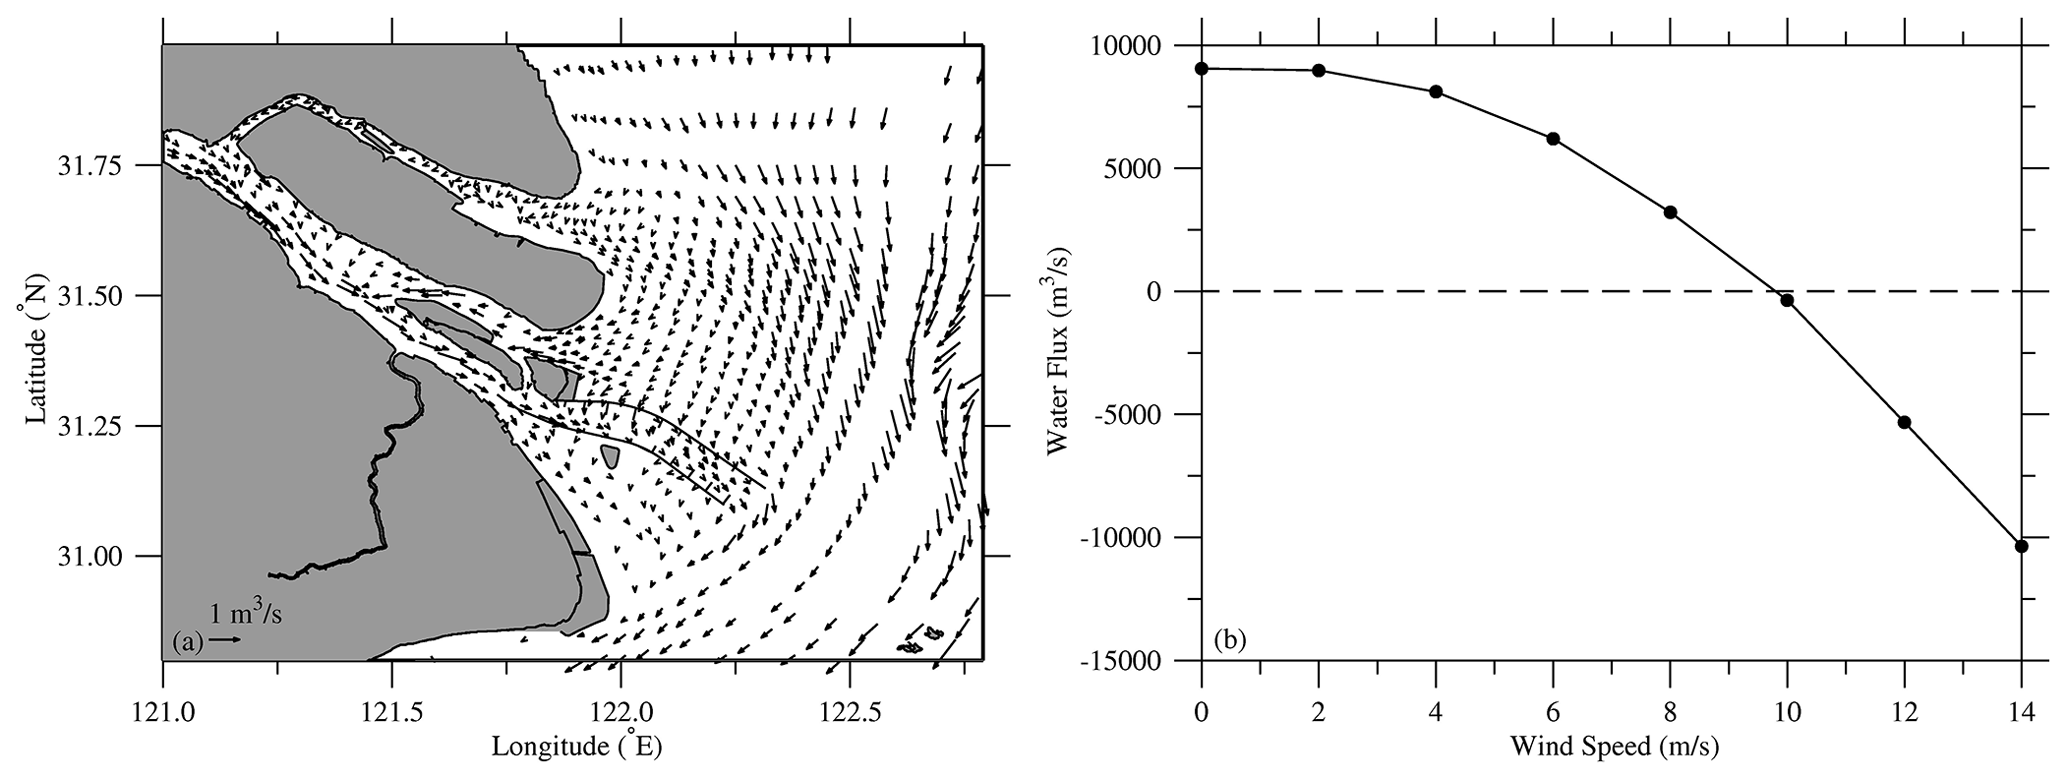
Figure 14Distribution of a purely wind-driven current, time averaged from 10 to 13 February 2014, modeled under the real wind (a). Relationship between water flux across sec1 in the northern channel and northerly wind speed (b). Except for the wind, the other dynamic factors in the numerical experiments are the same as in experiment 2.
Numerical experiments were performed with different northerly wind speeds to ascertain the influence of the wind on the water flux at sec1 in the landward transport in the northern channel. Except for the wind, the other dynamic factors were the same as in experiment 2. The results show that the net water flux is seaward when the wind speed is less than 8 m s−1, approximately zero when the wind speed is 10 m s−1 and landward when the wind speed is greater than 10 m s−1 (Fig. 14b). The landward water flux enhances with an increasing northerly wind. Therefore, northerly wind with speed of more than 10 m s−1 can be considered a strong wind that causes net water transport landward in the northern channel.
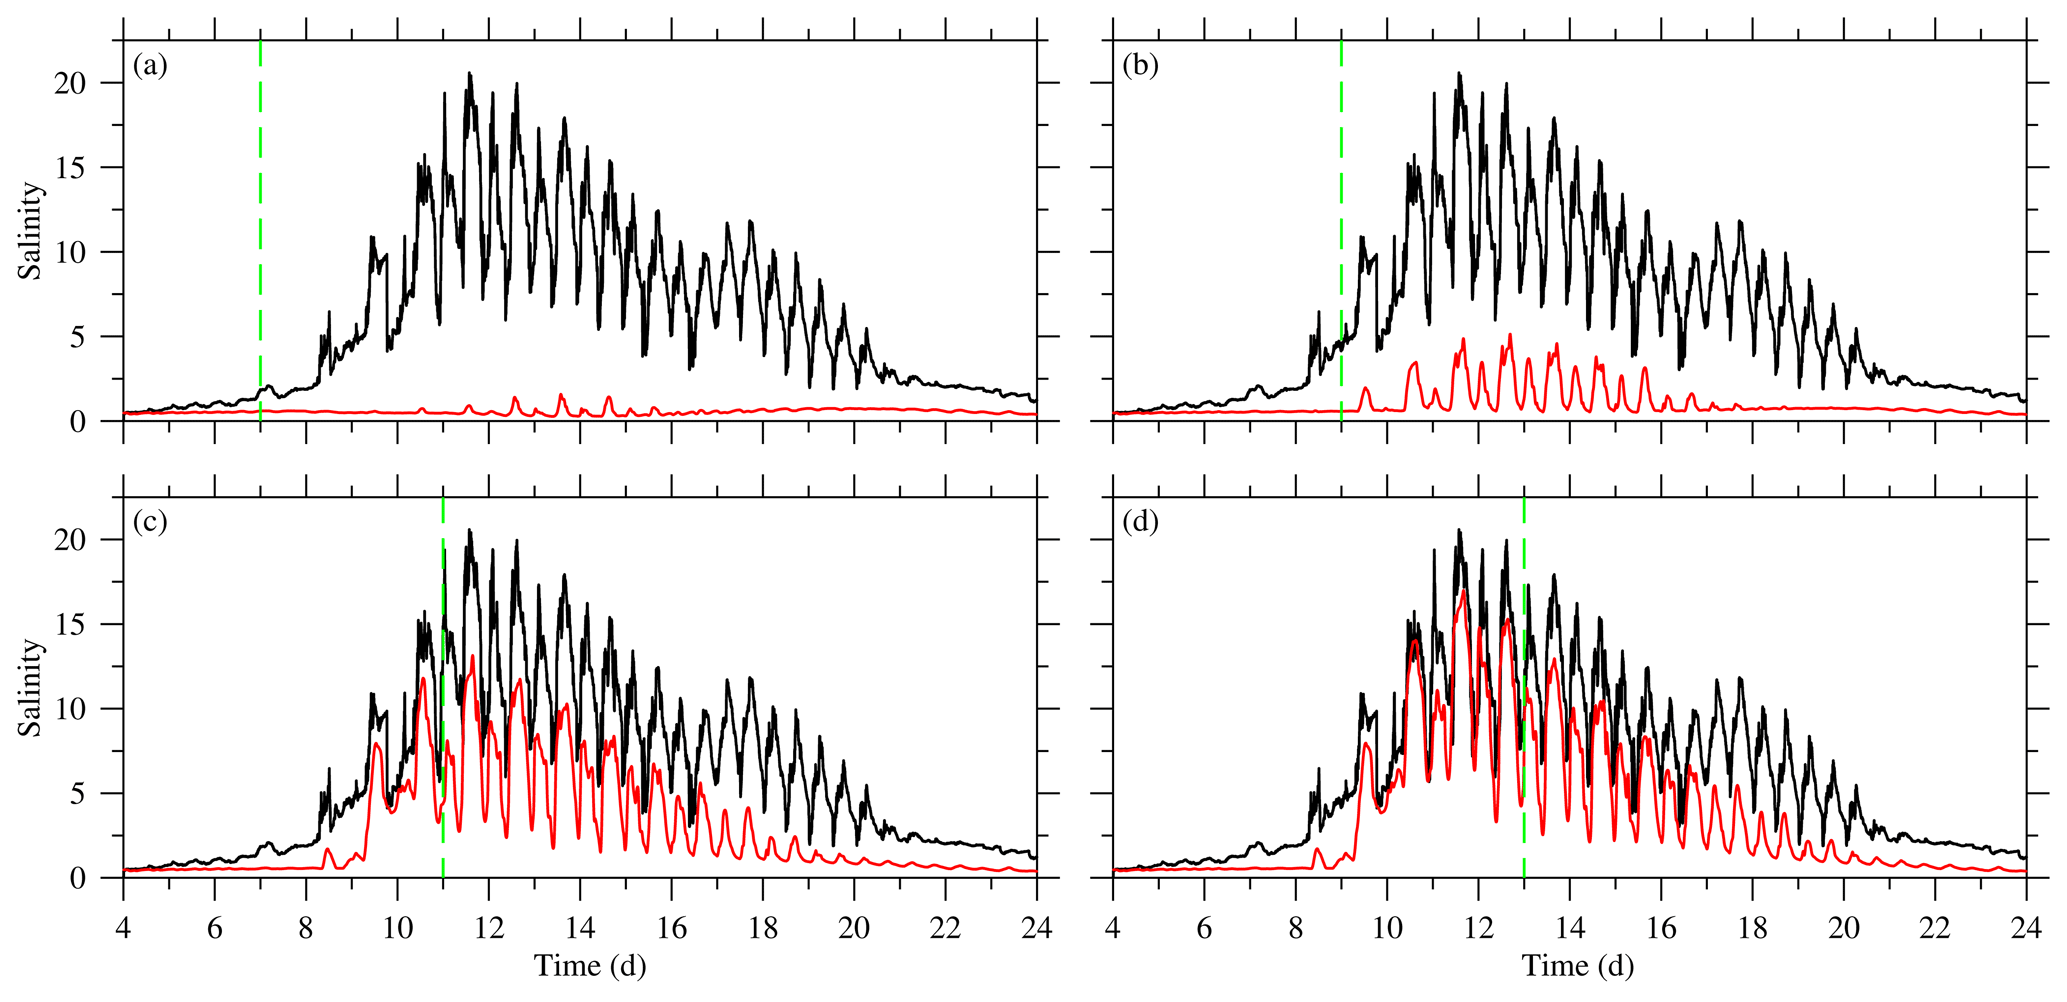
Figure 15Temporal variation in observed (black line) and modeled (red line) salinity at Baozhen station from 4 to 24 February 2014. The green dashed lines indicate the time before the wind was realistic and after it was set to 5 m s−1.
4.5 How long does the northerly wind induce severe saltwater intrusions?
In winter, frequent cold fronts pass over the Changjiang estuary and bring strong northerly winds, enhancing the saltwater intrusion (Li et al., 2012). For example, the relatively strong saltwater intrusions from 15 to 18 February 2011 and from 23 to 26 February 2017 were caused by the passing cold fronts. No extremely severe saltwater intrusion event occurred because the strong northerly wind induced by the cold fronts lasted only 1–2 d. How long does the northerly wind induce a severe saltwater intrusion? Based on the persistent and strong northerly wind process in February 2014, numerical experiments were conducted, and the results indicate that if a strong northerly wind lasts 2 d then the saltwater intrusion is weak (Fig. 15), which is similar to the case of an ordinary cold front passage; if a strong northerly wind lasts 4 d then the saltwater intrusion is stronger than normal, similar to the case of a stronger cold front passage. It can been seen that 4 d of strong wind can induce the higher than normal salinity after 8 d because the strong wind Ekman transport brought the salinity front in the sandbar area upstream and closer to the Baozhen station, and it then moved upstream and downstream with the oscillation of flood and ebb currents for 8 d after the strong northerly wind became a northerly wind with a speed of 5 m s−1. If a strong northerly wind lasts 6 d, saltwater intrusion becomes severe; if a strong northerly wind lasts 8 d, the salinity is dramatically increased, the maximum salinity approaches the real salinity and the saltwater intrusion becomes extremely severe. Therefore, the longer the strong northerly wind lasts, the more severe the saltwater intrusion is.
An extremely severe saltwater intrusion event in February 2014 occurred in the Changjiang estuary under normal river discharge conditions and caused a serious threat to water safety in Shanghai. No catastrophic saltwater intrusion of this magnitude has occurred since salinity in the estuary has been recorded. Our findings show that this extremely severe saltwater intrusion event was caused by a persistent and strong northerly wind, which produced a strong landward net transport and abnormally high water level along the coast of China and drove substantial landward water transport to form a horizontal estuarine circulation that flowed into the northern channel and out of the southern channel. This landward net water transport overcame seaward runoff and brought very large amounts of highly saline water into the upper reaches of the northern channel, which seriously threatened the water intake of the Qingcaosha reservoir.
To further reveal the dynamic mechanism of the event, numerical experiments were run, and the results were discussed. The strong northerly wind can enhance the SSO, but the SSO had almost no contribution to the saltwater intrusion event in February 2014. The individual terms in the momentum equations showed that the persistent and strong wind induced larger southward wind stress and produced landward Ekman transport and a rising water level, which significantly reduced the seaward barotropic pressure gradient force and pushed the net water transport landward, greatly enhancing the saltwater intrusion in the northern channel while distinctly increasing the landward baroclinic pressure gradient force. The stronger the northerly wind is, the higher the water level in the Changjiang estuary and the adjacent sea. The strong northerly wind can produce a purely wind-driven horizontal circulation that flows into the northern channel and out of the southern channel, which can enhance saltwater intrusion in the northern channel and weaken it in the southern channel. In this study, the horizontal estuarine circulation was a total (net) circulation induced by the persistent and strong northerly wind, which surpassed the strong seaward runoff. This effect represents a novel and unexpected finding. Only a northerly wind with speed of greater than 10 m s−1 can cause net landward water transport in the northern channel. A northerly wind lasting 8 d can produce extremely severe saltwater intrusion in the Changjiang estuary. With more frequent and stronger northerly winds caused by climate change, greater attention should be paid to extremely severe saltwater intrusions and freshwater safety in the Changjiang estuary, where the Qingcaosha reservoir provides water from the estuary for 13 million people in Shanghai.
The codes can be made available from the corresponding author upon reasonable request.
The data underlying the findings of this article can be accessed at https://doi.org/10.6084/m9.figshare.c.5114444.v1 (Zhu, 2020).
JZ analyzed the dynamics of the extremely severe saltwater intrusion in the Changjiang estuary. XC simulated the persistent and strong northerly wind with the Weather Research Forecasting (WRF) model and analyzed the model results. LL simulated the extremely severe saltwater intrusion in the Changjiang estuary. HW simulated the residual water level with the large domain model encompassing the Bohai Sea, Yellow Sea and East China Sea. JG measured the salinity at the hydrological stations. HL validated the saltwater intrusion model.
The authors declare that they have no conflict of interest.
The authors thank the Shanghai Hydrology Administration for providing the observed water level data in the Changjiang estuary.
This research has been supported by the National Natural Science Foundation of China (grant nos. 41676083 and 41476077) and the major program of the Shanghai Science and Technology Committee (grant no. 14231200402).
This paper was edited by Hubert H.G. Savenije and reviewed by three anonymous referees.
Aristizábal, M. F. and Chant, R. J.: An observational study of salt fluxes in Delaware Bay, J. Geophys. Res.-Oceans, 120, 2751–2768, 2015.
Blumberg, A. F.: A primer for ECOM-si, Technical Report of HydroQual, Mahwah, New Jersey, 66 pp., 1994.
Changjiang Water Resources Commission: Changjiang River Basin Real-Time Water Regimen, available at: http://www.cjh.com.cn/sssqcwww.html, last access: 30 June 2014 (updated daily).
Chen, C., Zhu, J., Ralph, E., Green, S. A., Budd, J. W., and Zhang, F. Y.: Prognostic modeling studies of the Keweenaw Current in Lake Superior, Part I: formation and evolution, J. Phys. Oceanogr., 31, 379–395, https://doi.org/10.1175/1520-0485(2001)031<0379:PMSOTK>2.0.CO;2, 2001.
Chen, C. S., Zhu, J. R., Zheng, L. Y., Ralph, E., and Budd, J. W.: A non-orthogonal primitive equation coastal ocean circulation model: application to Lake Superior, J. Great Lakes Res., 30, 41–54, 2004.
Chen, Q., Zhu, J. R., Lyu, H. H., and Chen, S. L.: Determining Critical River Discharge as a Means to Provide Water Supply Water Security to the Changjiang River Estuary, China, J. Coastal Res., 35, 1087–1094, 2019a.
Chen, Q., Zhu, J. R., Lyu, H. H., Pan, S. Q., and Chen, S. L.: Impacts of topography change in the recent ten years on saltwater intrusion in the Changjiang Estuary, Estuar. Coast. Shelf S., 231, 1–17, 2019b.
Chen, S. N. and Sanford, L. P.: Axial wind effects on stratification and longitudinal salt transport in an idealized, partially mixed estuary, J. Phys. Oceanogr., 39, 1905–1920, 2009.
Ding, L., Dou, X. P., Gao, X. Y., Jiao, J., and Hu, J.: Response of salinity intrusion to winds in the Yangtze Estuary, Proceedings of 5th International Conference on Hydraulic Engineering, CHE2017, 241–247, 2017.
Duran-Matute, M., Gerkema, T., and Sassi, M. G.: Quantifying the residual volume transport through a multiple-inlet system in response to wind forcing: The case of the western Dutch Wadden Sea, J. Geophys. Res.-Oceans, 12, 8888–8903, 2016.
Geyer, W. R.: The importance of suppression of turbulence by stratification on the estuarine turbidity maximum, Estuaries Coasts, 16, 113–125, 1993.
Giddings, S. N. and MacCready, P.: Reverse Estuarine Circulation Due to Local and Remote Wind Forcing, Enhanced by the Presence of Along-Coast Estuaries, J. Geophys. Res.-Oceans, 122, 10184–10205, 2017.
Gu, Y. L., Wu, S. P., and Le, Q.: The impact of North Branch saltwater intrusion on water source in Changjiang Estuary, Yangtze River, 34, 1–3, 2003 (in Chinese).
Li, L., Zhu, J. R., Wu, H., and Wang, B.: A numerical study on the water diversion ratio of the Changjiang Estuary during the dry season, Chin. J. Oceanol. Limn., 28, 700–712, 2010.
Li, L., Zhu, J. R., and Wu, H.: Impacts of wind stress on saltwater intrusion in the Yangtze Estuary, Sci. China Earth Sci., 55, 1178–1192, 2012.
Li, L., Zhu, J. R., Wu, H., and Guo, Z. G.: Lateral saltwater intrusion in the North Channel of the Changjiang Estuary, Estuaries Coasts, 37, 36–55, 2014.
Luo, X. F. and Chen, Z. C.: Numerical simulation study of effect of runoff and tide on the Changjiang River mouth saltwater intrusion, Coast. Eng., 24, 1–6, 2005 (in Chinese with English abstract).
Lyu, H. H. and Zhu, J. R.: Impact of the bottom drag coefficient on saltwater intrusion in the extremely shallow estuary, J. Hydrol., 557, 838–850, 2018.
NaoTide: NAO.99b tidal prediction system. Ocean Tide Models Developed by Assimilating TOPEX/POSEIDON Altimeter Data into Hydrodynamical Model: A Global Model and a Regional Model Around Japan, available at: https://www.miz.nao.ac.jp/staffs/nao99/ (last access: 10 July 2018), 2004.
NCEP/QSCAT: National Weather Service National Centers for Environmental Prediction, available at: https://www.ncep.noaa.gov (last access: 5 August 2019), 2014.
Pritchard, D. W.: The dynamic structure of a coastal plain estuary, J. Marine Res., 15, 33–42, 1956.
Prandle, D.: On salinity regimes and the vertical structure of residual flows in narrow tidal estuaries, Estuar. Coast. Shelf S., 20, 615–635, 1985.
Prandle, D. and Lane, A.: Sensitivity of estuaries to sea level rise: vulnerability indices, Estuar. Coast. Shelf S., 160, 60–68, 2015.
Qiu, C. and Zhu, J. R.: Assessing the influence of sea level rise on salt transport processes and estuarine circulation in the Changjiang River estuary, J. Coastal Res., 31, 661–670, 2015.
Qiu, C., Zhu, J. R., and Gu, Y. L.: Impact of seasonal tide variation on saltwater intrusion in the Changjiang River estuary, Chin. J. Oceanol. Limn., 30, 342–351, 2012.
Shen, H. T., Mao, Z. C., and Zhu, J. R.: Saltwater intrusion in the Changjiang Estuary, Beijing, China Ocean, 2003 (in Chinese with English abstract).
Simpson, J. H. and Hunter, J. R.: Fronts in the Irish Sea, Nature, 250, 404–406, 1974.
Simpson, J. H., Brown, J., Matthews, J., and Allen, G.: Tidal straining, density currents, and stirring in the control of estuarine stratification, Estuaries, 13, 125–132, 1990.
Song, Z. Y. and Mao, L. H.: The study of saltwater intrusion in the Changjiang Estuary, Water Resour. Protec., 3, 27–30, 2002 (in Chinese).
Wu, H. and Zhu, J. R.: Advection scheme with 3rd high-order spatial interpolation at the middle temporal level and its application to saltwater intrusion in the Changjiang Estuary, Ocean Model., 33, 33–51, 2010.
Wu, H., Zhu, J. R., Chen, B. R., and Chen, Y. Z.: Quantitative relationship of runoff and tide to saltwater spilling over from the North Branch in the Changjiang Estuary: A numerical study, Estuar. Coast. Shelf. S., 69, 125–132, 2006.
Wu, H., Zhu, J. R., and Choi, B. H.: Links between saltwater intrusion and subtidal circulation in the Changjiang Estuary: a model-guided study, Cont. Shelf Res., 30, 1891–1905, 2010.
Wu, H., Zhu, J. R., Shen, J., and Wang, H.: Tidal modulation on the Changjiang River plume in summer, J. Geophys. Res., 116, 192–197, 2011.
Xue, P. F., Chen, C. S., Ding, P. X., Beardsley, R. C., Lin, H. C., Ge, J. Z., and Kong, Y. Z.: Saltwater intrusion into the Changjiang River: A model-guided mechanism study, J. Geophys. Res., 114, C02006, https://doi.org/10.1029/2008JC004831, 2009.
Zhang, E, Gao, S, Savenije, H. H. G., Si, C., and Cao, S: Saline water intrusion in relation to strong winds during winter cold outbreaks: North Branch of the Yangtze Estuary, J. Hydrol., 574, 1099–1109, 2019.
Zhu, J.: Saltwater Intrusion, figshare, Collection, https://doi.org/10.6084/m9.figshare.c.5114444.v1, 2020.
Zhu, J. R., Gu, Y. L., and Wu, H.: Determination of the period not suitable for taking domestic water supply to the Qingcaosha Reservoir near Changjiang River Estuary, Oceanologia et Limnologia Sinica, 44, 1138–1145, 2013.
Zhu, J. R., Wu, H., and Li, L.: Hydrodynamics of the Changjiang Estuary and Adjacent Seas, In Ecological Continuum from the Changjiang (Yangtze River) Watersheds to the East China Sea Continental Margin, 19–45, Springer International Publishing, https://doi.org/10.1007/978-3-319-16339-0_2, 2015.