the Creative Commons Attribution 4.0 License.
the Creative Commons Attribution 4.0 License.
 | 20 Oct 2020
Imprints of evaporative conditions and vegetation type in diurnal temperature variations
Maik Renner
Axel Kleidon
Diurnal temperature variations are strongly shaped by the absorption of solar radiation, but evaporation, or the latent heat flux, also plays an important role. Generally, evaporation cools. Its relation to diurnal temperature variations, however, is unclear. This study investigates the diurnal response of surface and air temperatures to evaporative conditions for different vegetation types. We use the warming rate, defined as the increase in temperature in response to absorbed solar radiation in the morning, and evaluate how it changes with evaporative fraction, which is an indicator of the evaporative conditions. Results for 51 FLUXNET sites show that the warming rate of air temperature carries very weak imprints of evaporative fraction across all vegetation types. However, the warming rate of surface temperature is highly sensitive to evaporative fraction with a value of K (W m, indicating stronger evaporative cooling for moister conditions. Contrarily, the warming rates of surface and air temperatures are similar at forest sites and carry literally no imprints of evaporative fraction. We explain these contrasting patterns with an analytical surface energy balance model. The derived expressions reproduce the observed warming rates and their sensitivity to evaporative fraction in all vegetation types. Multiplying the warming rate with daily maximum solar radiation gives an approximation for the diurnal surface temperature range (DTsR). We use our model to compare the individual contributions of solar radiation, evaporative conditions, and vegetation (by its aerodynamic conductance) in shaping DTsR and show that the high aerodynamic conductance of forests reduces DTsR substantially more (−56 %) than evaporative cooling (−22 %). We further show that the strong diurnal variation in aerodynamic conductance (∼2.5 times of the mean across vegetation types) reduces DTsR by ∼35 % in short vegetation and savanna but only by ∼22 % in forests. We conclude that diurnal temperature variations may be useful for predicting evaporation for short vegetation. In forests, however, the diurnal variations in temperatures are mainly governed by their high aerodynamic conductance, resulting in negligible imprints of evaporative conditions.
- Article
(6525 KB) - Full-text XML
- BibTeX
- EndNote


Temperature is one of the most widely monitored variables in meteorology. Besides being important for our day-to-day activities, temperature serves as a primary attribute for understanding Earth system processes. The diurnal variation in temperature is considered to be informative in climate science, as described by the diurnal temperature range (DTR), which is basically the difference between daily maximum and minimum temperatures. Information on the diurnal temperature range has facilitated a broad spectrum of research including agriculture, health welfare, climate change, and ecological studies.
Over land, the diurnal variation in temperature is mainly driven by the solar energy input (Bristow and Campbell, 1984). Liu et al. (2004) show a high correlation of 0.88 between the annual solar radiation and the DTR in China. Likewise, Makowski et al. (2009) found their annual correlation to be 0.87 for Europe. Their obvious and still intricate association is also important for determining the influence of solar dimming and brightening on diurnal temperature variations (Wang and Dickinson, 2013; Wild, 2005).
Solar radiation is the dominant, but not the only, factor shaping the diurnal temperature. Available energy at the surface is partitioned into latent and sensible heat fluxes. A higher latent heat flux signifies higher evaporation, which reduces the temperature through evaporative cooling, an effect that can be seen in sensitivity simulations with a global climate model of land evaporation (Shukla and Mintz, 1982). Another climate-model-based analysis (Mearns et al., 1995) shows that differences in evaporation explain 52% of the variance in DTR in the summer season for the USA. Similarly, climate model simulations also show the high sensitivity of DTR to evaporation, especially in the summer season when evaporation is not energy limited (Lindvall and Svensson, 2015). Consequently, methods for estimating evaporation use air temperature (Blaney and Criddle, 1950; Hargreaves and Samani, 1985; Thornthwaite, 1948) and remotely sensed surface temperature (Anderson et al., 2012; Boegh et al., 2002; Jackson et al., 1999; Kustas and Norman, 1999; Price, 1982; Su et al., 2007). Most of the surface-energy-balance-based estimates of evaporation use DTR as an input (Baier and Robertson, 1965; Vinukollu et al., 2011; Yao et al., 2013).
Clouds and precipitation are also important factors that determine DTR (Dai et al., 1999; Stenchikov and Robock, 1995). One can exclude their contribution to some extent by considering only clear sky days in order to distinctly identify the role of evaporative conditions on DTR. Furthermore, the partitioning of the turbulent heat fluxes into sensible and latent heat is also influenced by vegetation type. Taller vegetation has a higher aerodynamic conductance that facilitates mass and heat exchange between the land and atmosphere (Jarvis and McNaughton, 1986). The greater aerodynamic conductance in forests reduces their DTR by reducing their maximum temperatures (Bevan et al., 2014; Gallo, 1996; Jackson and Forster, 2010). Few studies captured the impact of aerodynamic properties of vegetation on temperature, for example, in terms of the decomposed temperature metric theory (Juang et al., 2007; Luyssaert et al., 2014) and the theory of intrinsic biophysical mechanisms (Lee et al., 2011a; Zhao et al., 2014a). Generally, the lower temperatures of forests are associated with their mean evaporative environment, although this may be affected by periods of dry and moist conditions.
In this study, we investigate how the diurnal variation in surface and air temperature responds to changes in evaporative conditions in different vegetation types. Clearly, DTR is not independent of solar radiation, which is why we develop an alternative indicator, namely the warming rate (Panwar et al., 2019), that eliminates the contribution of solar radiation. To illustrate this, the observed normalized diurnal air and surface temperatures are plotted against absorbed solar radiation for a cropland and forest site in Fig. 1. Surface temperature is obtained from upwelling longwave radiation from the surface and air temperature above the canopy, which is usually measured at 2 m height. The diurnal evolution of temperature is mainly governed by the absorbed solar radiation (Rs); this is discernible from the linear increase in the morning (20 W m), as described by the slope. This dependence is accounted for by what we refer to as the warming rate, defined as the increase in temperature due to a unit increase in the absorbed solar radiation and expressed as the derivative dTa∕dRs for air temperature and dTs∕dRs for surface temperature with units of K (W m. One can approximate the warming rate by the ratio of DTR to maximum solar radiation, Rs,max, so that the warming rate can be seen as an efficient characteristic that captures the effects on DTR that are not caused by solar radiation. In this study, we use linear regressions of observed data from morning to noon to calculate warming rates.
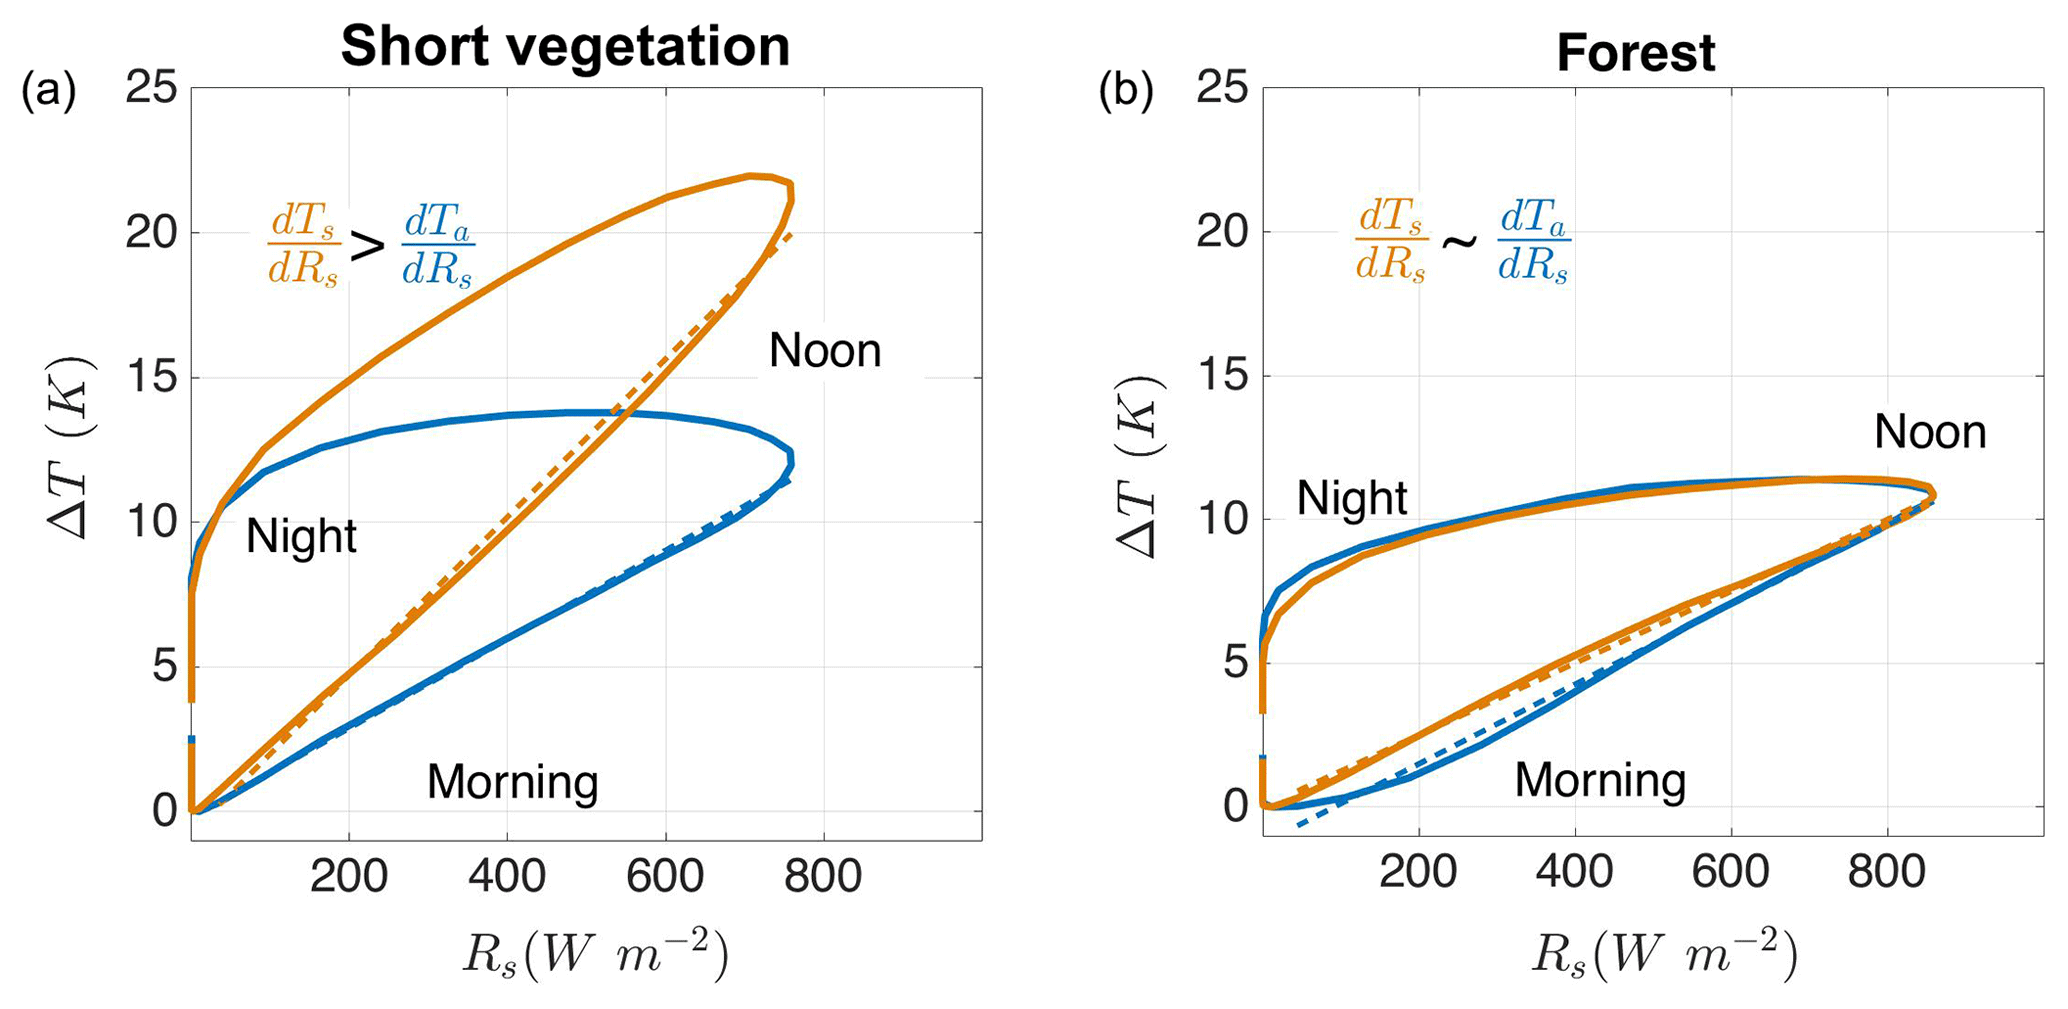
Figure 1Mean diurnal hysteresis formed by plotting the normalized diurnal temperature () against absorbed solar radiation (Rs) for summer clear sky days. Surface temperature (Ts) is depicted in orange and air temperature (Ta) in blue. (a) A short vegetation cropland site (US Atmospheric Radiation Measurement – ARM) in the Southern Great Plains, Lamont, OK, USA. (b) A forest site (CA-TP4) in Ontario, Canada. The dashed lines are the linear regression of the observations falling in the morning slope of the hysteresis that corresponds to the warming rate of air (dTa∕dRs) and surface temperature (dTs∕dRs).
The temperature warming rate provides insights on the effect of vegetation on the diurnal temperatures variation. Figure 1a shows a greater surface temperature warming compared to air temperature for a cropland site. Contrarily to the short vegetation site, the warming rates of the two temperatures are similar for a forest site (Fig. 1b). This indicates the strong aerodynamic coupling of diurnal air and surface temperatures in forests compared to short vegetation.
Certainly, it is intriguing to find out how evaporative conditions alter this coupling. In our earlier work (Panwar et al., 2019), we looked at the temperature warming rate for a cropland site in the Southern Great Plains (which is shown in Fig. 1a). We observed that the warming rate of surface temperature decreases from dry (less evaporative; sensible heat flux dominates) to moist (evaporative; latent heat flux dominates) conditions, but the warming rate of air temperature remained unaffected. Combining the boundary layer information and heat budget expression, we explained that the diurnal variation in air temperature does not contain the imprints of evaporative conditions due to the compensating role of boundary layer development. If this is a general finding, then the surface temperature warming rate can be used to estimate the evaporative conditions of short vegetation. Furthermore, it is also interesting to see how evaporative cooling competes with the cooling effect of a higher aerodynamic conductance of forests.
In this study, we approach the following two major questions to advance our understanding of diurnal temperature variations: (a) do the diurnal variations in surface and air temperature respond to evaporative conditions? And (b) what is the role of the aerodynamic conductance of vegetation in altering these responses? Our previous work (Panwar et al., 2019) shows the stronger imprints of evaporative conditions in diurnal surface temperature variations in a cropland site. Here, we examine the generality of this finding in short vegetation. Additionally, to understand the role of aerodynamic conductance in modifying these imprints, we analyze data from the taller and more complex vegetation like savanna and forests.
We first present a model based on the surface energy balance to provide an expression for the diurnal temperature variation and its response to changes in evaporative conditions and aerodynamic conductance (all variables used are summarized in Table A1). Previous studies (Mallick et al., 2013; Ronda et al., 2001; Steduto and Hsiao, 1998) show diurnal variations in aerodynamic conductance, which are also considered in our model. To evaluate our model, we used observations from 51 FLUXNET sites that include short vegetation, savanna, and forests. Surface and air temperature warming rates, and their response to evaporative conditions, are quantified for each site.
The observational analysis is followed by a demonstration of our model performance that reproduces observed temperature warming rates and their response to evaporative conditions. Using our model, we analyze the factors shaping the diurnal range of surface temperature (DTsR). For this, the diurnal temperature range is obtained by combining the warming rates with the information on solar radiation. We conclude the study by demonstrating the contribution of solar radiation, evaporative fraction, aerodynamic conductance, and its diurnal variation in shaping DTsR, using our observational analysis and model.
Surface and air temperatures possess a strong diurnal variation that is driven by the absorption of solar radiation. The amplitude of this variation is also affected by other components of the surface energy balance, among which the partitioning of turbulent heat fluxes into latent and sensible heat is important. Generally, the surface energy balance is written as follows:
Here, Rs is the absorbed solar radiation at the surface, Rl,net is the net longwave radiation, LE is the latent heat flux (with L being the latent heat of vaporization and E the evaporation rate), H is the sensible heat flux, and G is the ground heat flux. For simplification of the surface energy balance, we linearize Rl,net using the first-order terms, such that . Here, Ro is the net radiation at a reference temperature Tref. The second term, , is the linearization constant. Incorporating this simplification of Rl,net in Eq. (1), the surface energy balance can be rearranged to yield an expression for Ts, as follows:
The warming rate of surface temperature is obtained by taking the derivative of Eq. (2) with respect to absorbed solar radiation, Rs, such that, in the following:
Since Ro and Tref are assumed to be constants and do not vary diurnally with Rs, they disappear in Eq. (3). Additionally, it is assumed that the diurnal change in G, in response to Rs, is negligible () compared to the other components of surface energy balance. This assumption is valid since we are considering vegetated sites for our study, although we are aware that, for nonvegetated surfaces, G can represent a noticeable share of absorbed solar radiation (Clothier et al., 1986; Kustas and Daughtry, 1990).
We describe the evaporative conditions by the evaporative fraction (fe), which is the ratio of the latent heat flux (LE) to the total turbulent heat fluxes (H+LE). Given this, the term H+LE in Eq. (3) can be written as , which yields the following:
Furthermore, the sensible heat flux can be expressed in terms of the aerodynamic conductance as , where cp=1005 J kg−1 K−1 is the specific heat capacity of air, ρ=1.23 kg m−3 is air density, ga is the aerodynamic conductance, and Ts−Ta is difference between surface and air temperature.
To use Eq. (4) to estimate warming rates, information is needed on dH∕dRs. Typically, H increases linearly with Rs in the morning so that the derivative dH∕dRs is constant. Thus, the instantaneous response of H to Rs is equivalent to the mean response, such that dH∕dRs can be expressed as follows:
Here, () and are the morning to noon means of Ts−Ta and ga. The diurnal variations in ga and Ts−Ta are captured by the terms dga∕dRs and . When including Eq. (5) in Eq. (4), we obtain an approximation for the surface temperature warming rate, which is given by the following:
Here, dTa∕dRs is the warming rate of air temperature. We can further simplify this expression by considering the two terms in the denominator of Eq. (6). Considering Tref∼288 K, the term kr(1−fe) varies between ∼4.87 and ∼0.54 W m−2 K−1, from dry (fe=0) to moist (fe=1) conditions, which is much smaller in magnitude compared to the term that is ∼60 W m−2 K−1 for a typical cropland site ( m s−1) and 250 W m−2 K−1 for a typical forest site ( m s−1). Because of these magnitudes, the term kr(1−fe) can be neglected. This leads to a further simplification of the warming rate to the following:
Equation (7) shows that the morning to noon warming rate of surface temperature is a function of evaporative fraction, the warming rate of air temperature, the mean difference in surface and air temperature, the mean aerodynamic conductance, and also the sensitivity of aerodynamic conductance to solar radiation. Multiplying Eq. (7) with the daily maximum solar radiation shall provide an approximation of the diurnal range of surface temperature (DTsR) as follows:
The DTsR approximation can be validated with the observational data. Using Eq. (8), the contribution of fe, , and dga∕dRs in shaping DTsR can be quantified.
Next, the sensitivity of the warming rate to changes in evaporative conditions is obtained by taking the derivative of Eq. (7) with respect to evaporative fraction (fe). To express these derivatives with respect to evaporative fraction, we use the prime (). Therefore, () and () represent the change in surface and air temperature warming rates due to a unit change in the evaporative fraction. The sensitivity of the warming rate of surface temperature to evaporative fraction is as follows:
Equation (9) is a negative quantity that is provided (), and the third term response to evaporative fraction is small (or negative). The negative sign means that the warming rate decreases with an increase in evaporative fraction. The amplitude of this decrease mainly depends on the mean aerodynamic conductance () and also on its diurnal sensitivity to solar radiation (dga∕dRs).
We next look into observations to obtain the values in Eq. (7) to predict the warming rate of surface temperature with fe, , , and dga∕dRs. Likewise, using Eq. (9) requires the observations to quantify the sensitivities of the components of its third term (, , and dga∕dRs) to the evaporative fraction. We derive these quantities from observations to then show that Eq. (7) reproduces the warming rate of surface temperature and its sensitivity to evaporative fraction using Eq. (9). Lastly, using the values from observations and our model expression for DTsR, as shown in Eq. (8), we estimate the contribution of the evaporative fraction and aerodynamic properties in shaping the magnitude of the diurnal surface temperature range.
We use observations from 51 FLUXNET sites representing different vegetation types. The FLUXNET data consists of sensible and latent heat fluxes, using the standard eddy covariance method, and provides half-hourly radiation and meteorological data (Baldocchi et al., 2001). The selected 51 sites contain data of the surface energy balance components and temperatures for more than 4 years. To avoid the effect of energy limitation on evaporation, only summer days are considered. Summer is defined here as days having a greater daily mean incoming solar radiation at the surface than the median of the annual distribution. This approach standardizes the definition of summer days for sites at different latitudes and provides days with comparable solar energy input for the individual sites.
Furthermore, among summer days, only clear sky days are considered to avoid the influence of clouds on temperatures. A filter to remove the cloudy days is applied, and it is based on the quantile regression method using surface solar radiation and potential solar radiation (Renner et al., 2019). This method was applied only from morning to noon so that the days with clouds in the evening were also considered as being clear sky days. This does not influence warming rates since they are calculated only from the morning to noontime variation in temperature.
The information on vegetation type is obtained from the FLUXNET land cover classification (Falge et al., 2017), which is based on the International Geosphere–Biosphere Programme (IGBP) data and information system. The IGBP land cover product is available at a 1 km resolution and was derived from the advanced very high-resolution radiometer (Loveland and Belward, 1997). Detailed information of each site with their location, number of days used in the analysis, land cover type, and references is provided in the Appendix (Table A2). Vegetation is classified into three types that are based on their typical height and coverage (see Table 1). Shorter vegetation, like croplands, grasslands, and shrublands, are grouped into the “short vegetation” type. Savanna ecosystems are complex, with heterogeneous vegetation height which basically delineates the transition of short vegetation to forests, and are grouped into the “savanna” type. All forest types, including deciduous broadleaf, evergreen broadleaf, evergreen needleleaf, and mixed, are grouped in the “forest” type.
Table 1Land cover types of the different sites considered here, and their grouping into the short vegetation, savanna, or forest types.

The geographic location of the selected 51 sites is shown in Fig. 2. The color bar represents the mean annual evaporative fraction derived from FLUXCOM data (Jung et al., 2019; Tramontana et al., 2016). Selected sites represent a wide range of ecosystems that is ideal for studying the generality of the response of warming rates to differences in evaporative conditions and vegetation type.
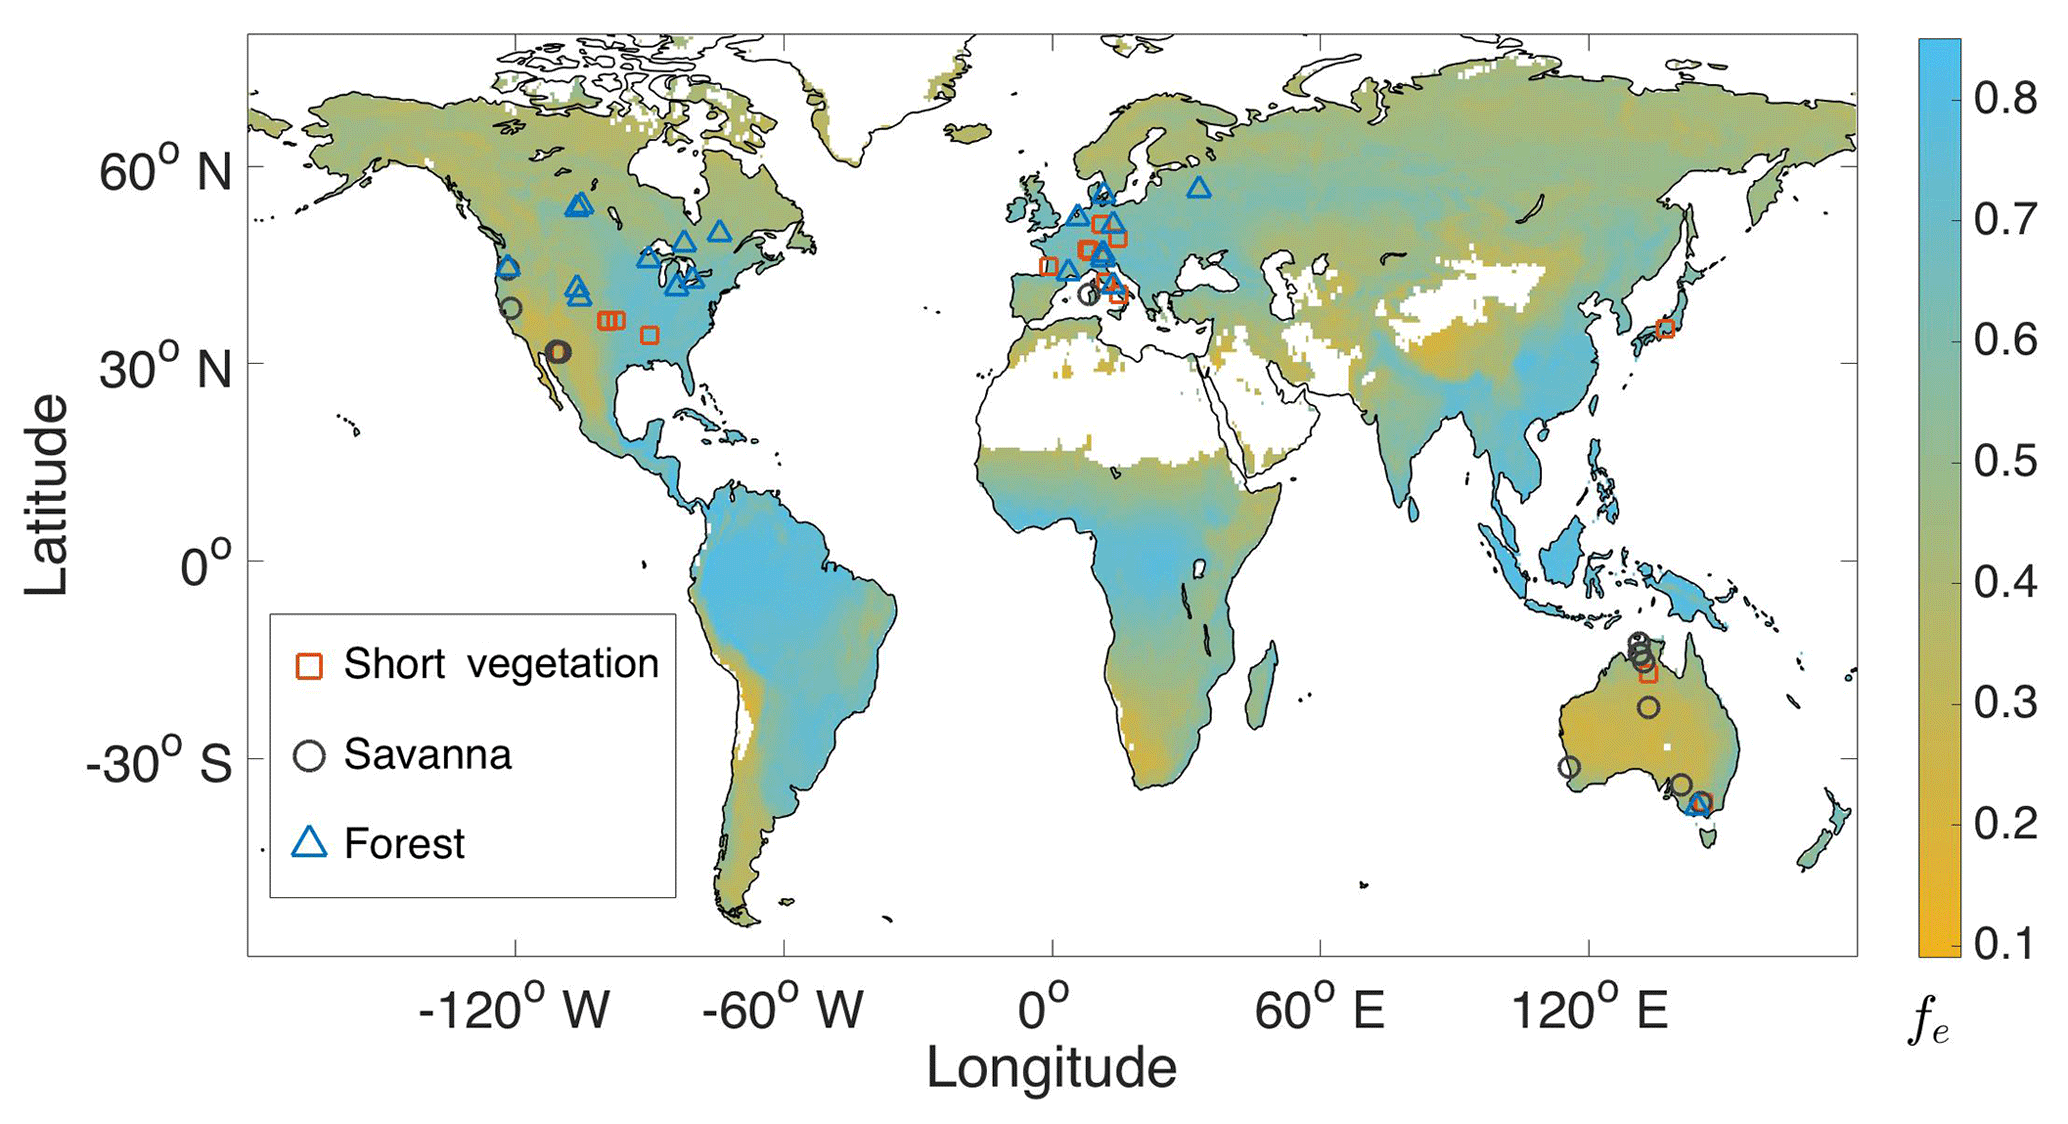
Figure 2Geographical locations of FLUXNET sites used in this study. The vegetation type at each site is shown by the symbols. The color bar shows the mean annual evaporative fraction (fe) derived from FLUXCOM data (2001 to 2013).
Evaporative conditions are quantified by the evaporative fraction. One of the advantages of the evaporative fraction is its stability for daylight hours, such that it can be assumed to be constant over a day (Shuttleworth et al., 1989). The daily mean evaporative fraction is obtained by the linear regression of the half-hourly morning to noon values of the latent heat flux to the total turbulent heat fluxes. Similarly, a linear regression of the daily mean warming rates and daily mean evaporative fractions is used to quantify the sensitivity of the warming rate to the evaporative fraction.
We use the term air temperature for the temperature measured above the canopy, which is typically at a 2 m height. Surface temperature is calculated from the upwelling flux of longwave radiation using the Stefan–Boltzmann law, such that it represents the skin temperature of the vegetated surface. The aerodynamic conductance (ga) is obtained from the observed sensible heat flux from . Since aerodynamic conductance is not constant over the day, its diurnal variation is described by dga∕dRs, which is estimated from a linear regression of the morning to noon half-hourly values of ga and Rs.
4.1 Observational analysis
The primary advantage of the warming rate over DTR is its suitability for comparing sites with different solar energy input. This is apparent from Fig. 3, where we show the density distribution of the observed daily warming rates of (a) surface and (b) air temperatures for short vegetation, savanna, and forest. The warming rates of surface temperature for short vegetation, with a median value of K (W m, are larger by almost a factor of 2 compared to the respective warming rates of forests with a median value of K (W m. Savanna covers the range in warming rates of surface temperature, with a median value of K (W m, reflecting their characteristics due to being positioned between short vegetation and forests. Hence, the warming rates of surface temperature clearly show similar characteristics across different sites and a clear influence of vegetation type.
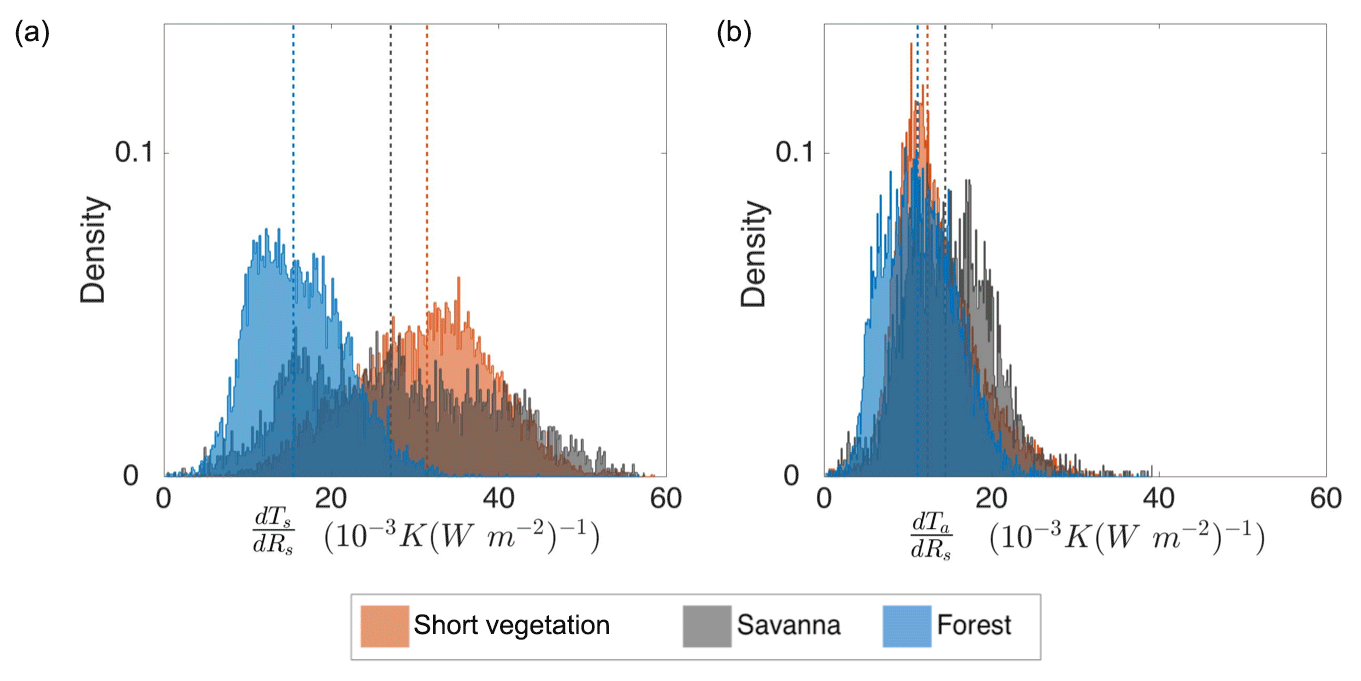
Figure 3Density distribution of observed warming rates of (a) surface temperature and (b) air temperature for short vegetation, savanna, and forest. The vertical dashed lines indicate the median of each distribution in the respective colors of the vegetation types.
Surprisingly, this is not true for the warming rates of air temperature. All vegetation types show very similar distributions (Fig. 3b). For short vegetation, this distribution shifts markedly to smaller values, with a median of K (W m, compared to the respective distribution for the warming rates of surface temperature. Conversely, in forests, the distributions are similar (with a median of K (W m, indicating the strong aerodynamic coupling between surface and air temperatures. The distribution for savanna has a median of K (W m.
Within the short vegetation type, grassland and shrubland sites show much greater warming rates of surface temperature than cropland sites (site-specific information on warming rates is provided in Fig. A1). This distinction could be attributed to site-specific evaporative conditions. Most of the shrubland sites are drier, while cropland sites are generally moister. Such an uneven distribution of evaporative conditions could impact the estimation of warming rates, such that it is higher for dry sites and lower for moist sites. On the other hand, despite these differences in the mean evaporative conditions, the sites contain days with a good range of evaporative fractions (see Fig. A2). The range of evaporative fractions is important for the estimation of the sensitivity of the warming rates to the evaporative fraction.
Next, we quantify the sensitivity of warming rates to the evaporative fraction, () from the linear regression of the daily means. The value of this sensitivity represents the change in the warming rate from dry (fe=0) to moist (fe=1) conditions, although we should note that these extreme values for the evaporative fraction are hypothetical. Figure 4 shows the mean sensitivity of the warming rates of surface (orange) and air (blue) temperature to the evaporative fraction for short vegetation, savanna, and forest (for site-specific responses, see Fig. A2). The sensitivity in short vegetation shows a strong decrease of K (W m for surface temperature, but a much smaller decrease by K (W m for air temperature. In our earlier work, similar responses were found for a cropland site (Fig. A2, site no. 8). The savanna vegetation type shows a weaker decrease of K (W m for surface temperature, but the warming rate of air temperature is almost insensitive to the evaporative fraction. In forests, both warming rates show very weak to almost no sensitivity to the evaporative fraction.
Table 2First quartile (Q1), median, and third quartile (Q3) for the distributions of dTs∕dRs, dTa∕dRs, , and dga∕dRs for short vegetation, savanna, and forest.
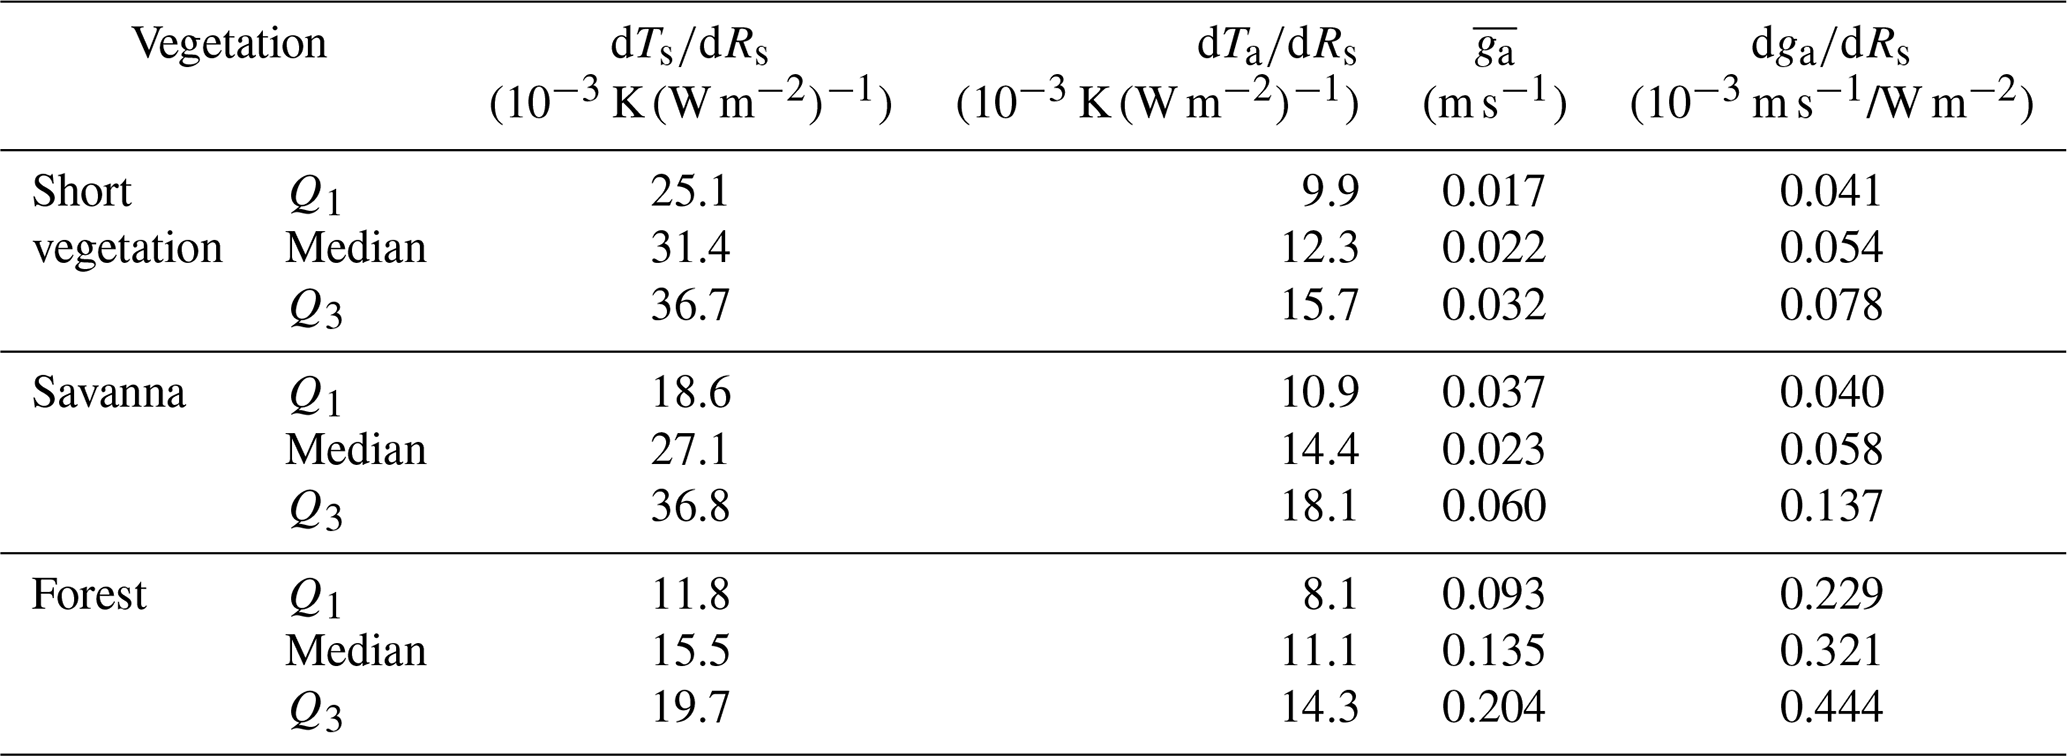
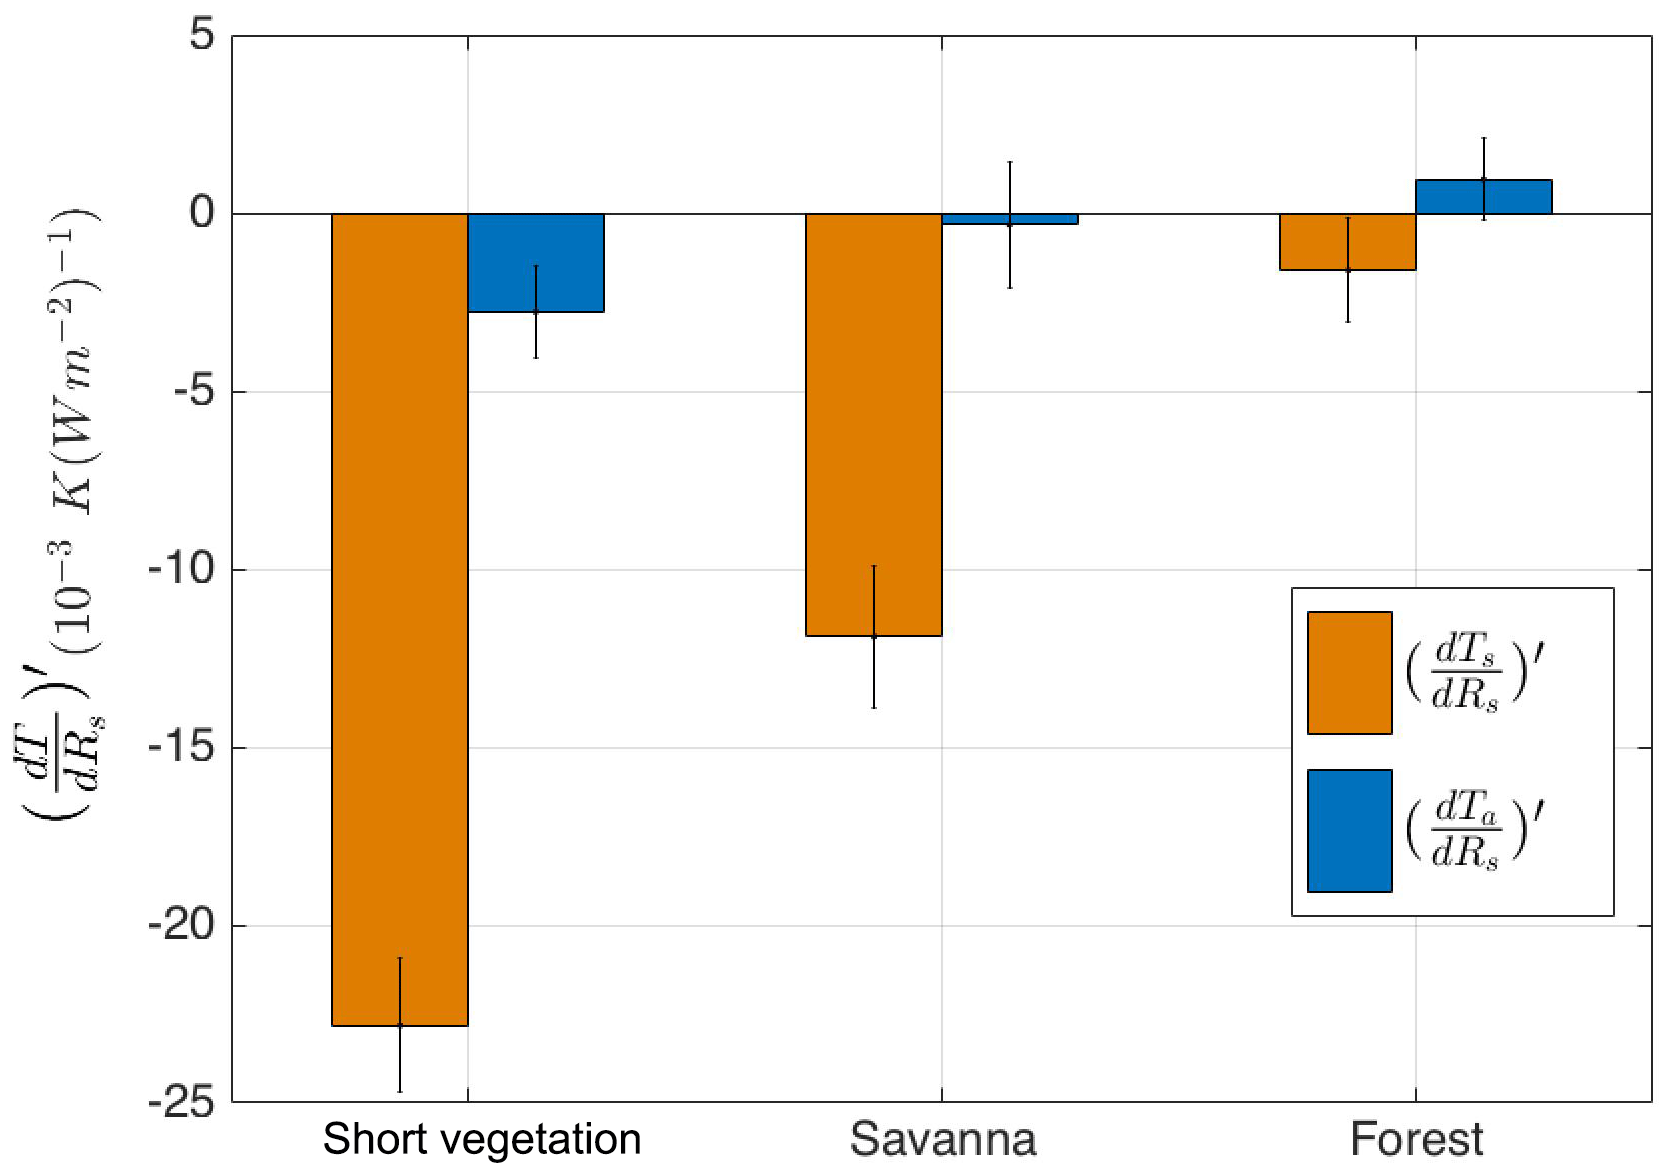
Figure 4Bar plot of the sensitivity of warming rates of surface () and air () temperatures to evaporative fractions from observations for short vegetation, savanna, and forest. The error bars represent the standard error of the mean.
In addition to the evaporative fraction, the aerodynamic conductance also influences the diurnal variation in temperatures. The aerodynamic conductance governs the ventilation of energy and mass from the surface to the atmosphere (Thom, 1972). Figure 5a shows the density distribution of morning to noon mean of the aerodynamic conductance for the short vegetation, savanna, and forest sites. The mean aerodynamic conductance is usually a characteristic of vegetation height (Jones, 1992). We find that the aerodynamic conductance of short vegetation is much lower (median = 0.022 m s−1) than for forest (median = 0.32 m s−1). Savanna sites have a similar aerodynamic conductance (median = 0.023 m s−1) to short vegetation, but some woody savanna sites show relatively higher aerodynamic conductance (as shown by the second peak around 0.08 m s−1 in the distribution in Fig. 5a).

Figure 5Density distributions inferred from the observations of the morning to noon (a) mean aerodynamic conductance () and (b) its sensitivity to solar radiation (dga∕dRs). The vertical dashed lines show the medians of the distributions. Also shown in (c) is the sensitivity of the morning to noon mean surface and air temperature difference () to evaporative fraction, which is a sensitivity needed for the estimation of how the warming rate of surface temperature responds to evaporative fraction, using Eq. (9). The bars indicate the 25th and 75th percentiles of the observations, respectively. The lines are the best fit for the linear regression of and evaporative fraction for each vegetation type, with the equations and r2 shown in the plot.
Aerodynamic conductance typically increases substantially during the day, increasing roughly linearly with absorbed solar radiation, which is captured by dga∕dRs (Fig. 5b). The positive sign of dga∕dRs reflects the increase in ga from morning to noon, which is found for all vegetation types. Forest sites show a stronger increase, but note that these sites also have a higher mean aerodynamic conductance. Overall, the aerodynamic conductance at noon is ∼2.5 times the mean value across all vegetation types (calculated with a W m−2), indicating similar relative diurnal variations (see Table 2). In other words, the relative sensitivity of aerodynamic conductance, (W m is about the same across the different sites. Because a greater aerodynamic conductance is expected to cool the surface more effectively, we expect that the diurnal increase in aerodynamic conductance shall reduce the warming rates of the surface temperature (which can also be seen in Eq. (7), where the last term on the right-hand side is negative). Thus, in addition to the mean aerodynamic conductance, its diurnal variation is another important factor which shapes the diurnal variation in temperatures.
To estimate the warming rate of surface temperature and its sensitivity to evaporative fraction using Eqs. (7)–(9), we also need to know the mean difference in surface and air temperature (). We find that is higher in short vegetation and savanna compared to forest sites. Additionally, decreases on days with a high evaporative fraction in short vegetation and savanna but not in forests. Betts and Ball (1995) showed a similar sensitivity of to evaporative conditions in a grassland site. Unlike , we found no such sensitivity of and dga∕dRs to the evaporative fraction. This finding is different to the study by Rigden and Li (2017), who showed that the aerodynamic resistance depends on the Bowen ratio. This difference can be attributed to their method for estimating aerodynamic resistance from the frictional velocity and wind speeds, which assumes neutral conditions, whereas we obtain aerodynamic conductance from sensible heat flux.
Given that only the mean temperature difference, , is sensitive to the evaporative fraction, while and dga∕dRs are not, the last term in Eq. (9) reduces the sensitivity of this temperature difference to the evaporative fraction. This sensitivity is shown in Fig. 5c. The third term of Eq. (9) thus depends mostly on () because the relative diurnal variation in aerodynamic conductance () is similar for all vegetation types.
To summarize our analysis of the observations, we found that the diurnal variation in the surface temperature of short vegetation showed much stronger imprints of evaporative conditions than air temperature. In forests, the diurnal variations in both surface and air temperature were found to be insensitive to evaporative conditions. The mean aerodynamic conductance derived from observations confirms the characteristic high values for forests compared to short vegetation. Additionally, we found a strong diurnal variation in the aerodynamic conductance that, in relative terms, is comparable for all vegetation types.
To explain these findings, we hypothesize that the high aerodynamic conductance of forests lowers the diurnal increase in surface temperature as it provides greater ventilation. Since air temperatures do not respond to the evaporative fraction, we therefore expect the warming rate of the surface temperature of forests to be less sensitive. This can already be anticipated from Eq. (9), together with the values provided in Table 2 and the sensitivities shown in Fig. 5c. Using these values, Eq. (9) yields an estimate for the sensitivity of the warming rate of surface temperature to the evaporative fraction for short vegetation of about and K (W m for forests, similar to what is shown in Fig. 4. In the following, we verify our model expression in greater detail.
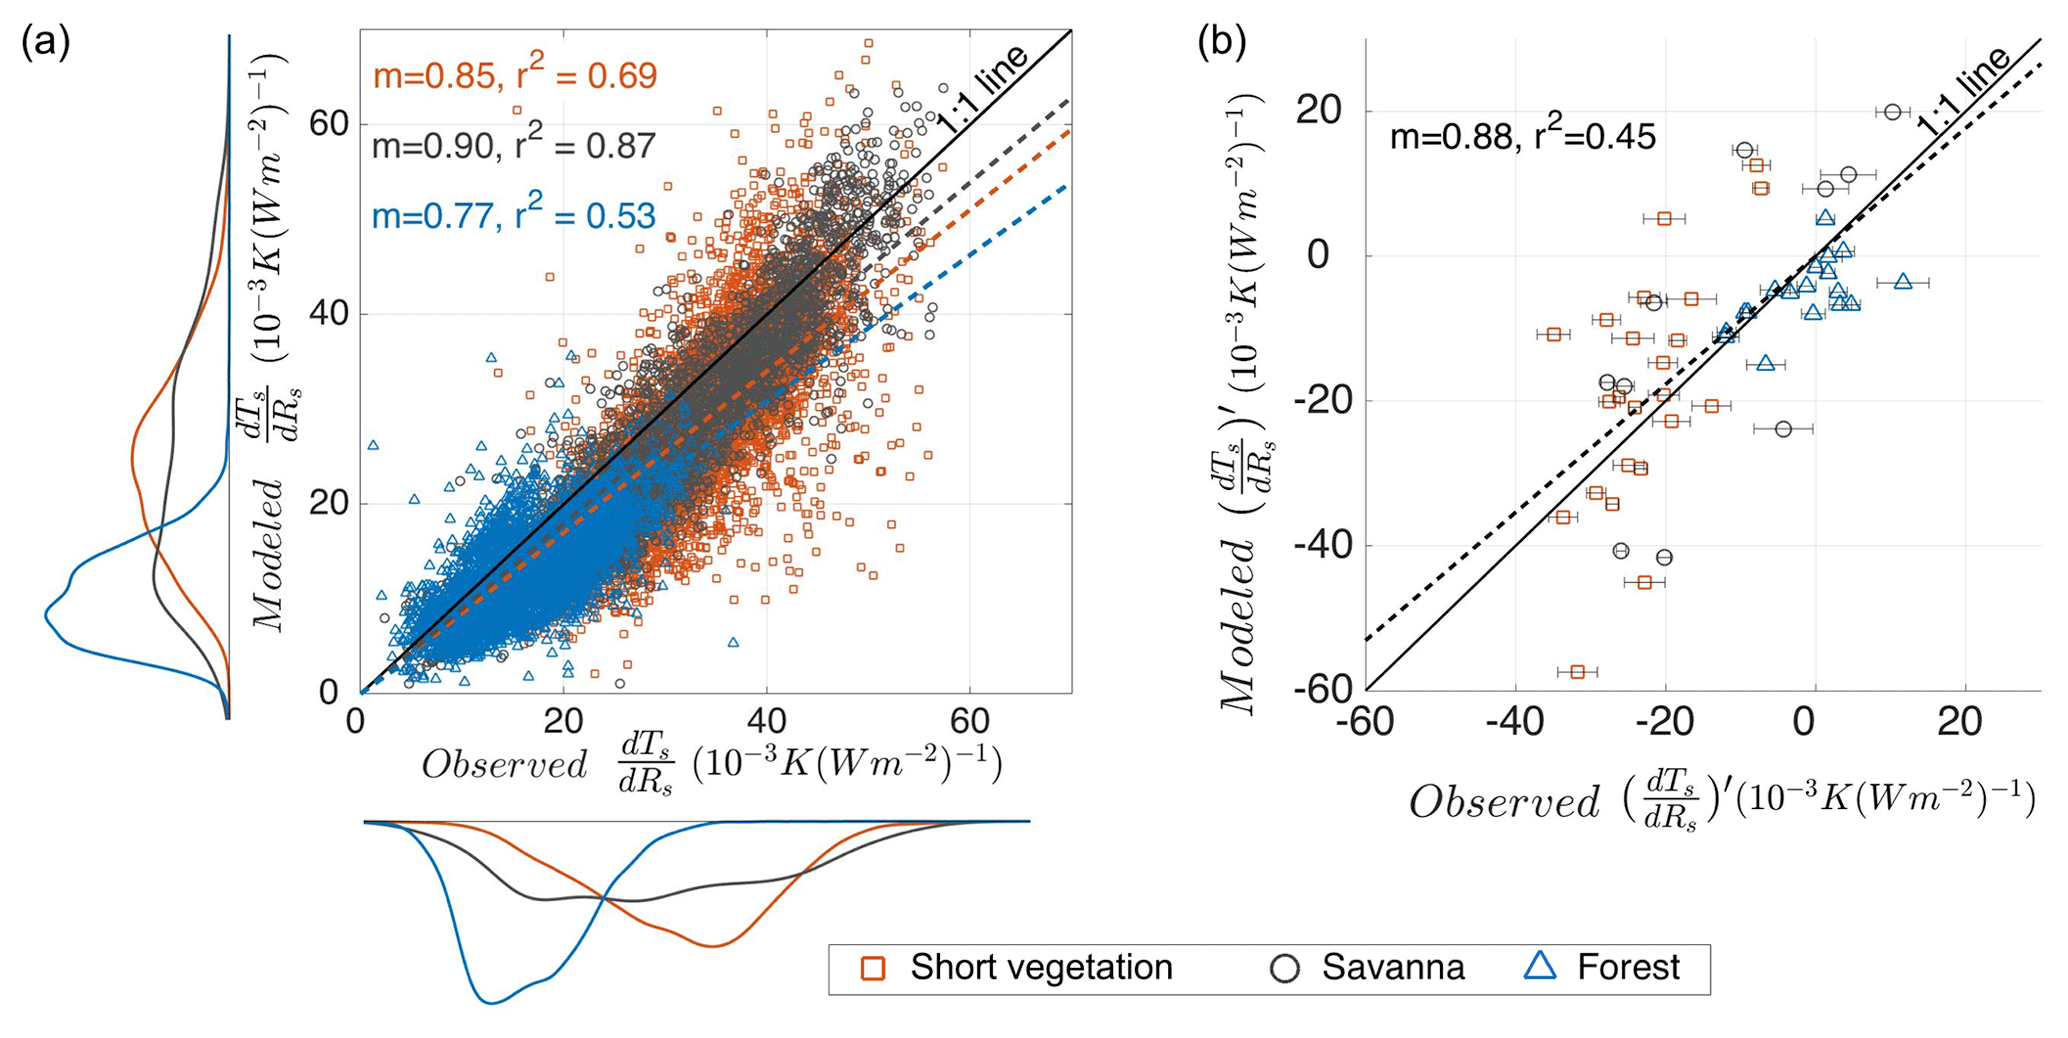
Figure 6(a) Modeled versus observed warming rates, dTs∕dRs for each site, for the three vegetation types. The density distributions show the spread. The coefficient of the determination (r2) and slope (m) of the linear fit (dashed lines) are depicted for each vegetation type. (b) Model evaluation of the sensitivity of the warming rates to the evaporative fraction () with those derived from observations for each site.
4.2 Model application and interpretation
To estimate the warming rate of surface temperature using Eq. (7) in greater detail, we used daily values of observed , dTa∕dRs, , and dga∕dRs. Since dTa∕dRs is similar for all sites, the diurnal variation in air temperature does not seem to depend on the diurnal variation in surface temperature and vice versa. Figure 6a shows the comparison of the modeled warming rates to those derived from observations. The model performs very well for all sites for the given information, with coefficients of determination (r2) of r2=0.69 for short vegetation, r2=0.87 for savanna, and r2=0.53 for forests. Similarly, the slopes (m) of the regression between modeled and observed dTs∕dRs are close to 1 for short vegetation (m=0.85) and savanna (m=0.90), meaning the dTs∕dRs magnitudes are well captured by our model, although the slope is too low for forests (m=0.77). However, at some sites with short vegetation, dTs∕dRs is underestimated. We speculate that these are the sites with nonvegetated surfaces where the ground heat flux contribution to diurnal surface temperature variations can be significant (Saltzman and Pollack, 1977), which is currently neglected in our model.
It is apparent from Fig. 6a, that the warming rates for surface temperature are higher for short vegetation compared to those of forests. This is mainly due to the relatively high aerodynamic conductance of forests, which reduces the magnitude of the first and third term on the right-hand side of Eq. (7).
The greater aerodynamic conductance of forests also reduces the sensitivity of warming rates to evaporative fraction compared to short vegetation, which can be seen in Eq. (9). Note that the diurnal variation in the aerodynamic conductance is included here by the term dga∕dRs in our estimates. Equation (9) reproduces the response of the warming rates to evaporative fraction quite well for all vegetation types (m=0.88, r2=0.45, Fig. 6b), including their ranges. Certain deviations exist because there are some biases in the number of moist and dry days in the observations that are reflected in the horizontal error bars. The other possible cause for bias is the large variation in the sensitivity of to fe in short vegetation and savanna (Fig. 5c).
We next link our estimates for warming rates back to the diurnal surface temperature range (DTsR) by multiplying the expression for the warming rate with the daily maximum of absorbed solar radiation, namely Rs,max (see Eq. 8). To understand how solar radiation, evaporative fraction, and the mean aerodynamic conductance and its diurnal variation contribute to DTsR separately, we consider four cases. In the first case, we assume that the diurnal variation in surface temperature is solely driven by solar radiation, such that there is no evaporation (fe=0), and the surface has a low and constant aerodynamic conductance of ga=0.022 m s−1, which is the median of the aerodynamic conductance of short vegetation (see Table 2). Figure 7a shows that, in this case, DTsR is overestimated for all vegetation types (regression slope m>1), with a low r2≤0.3. This greater warming indicates that vegetation and evaporation cool surface temperatures and reduce the diurnal surface temperature range.
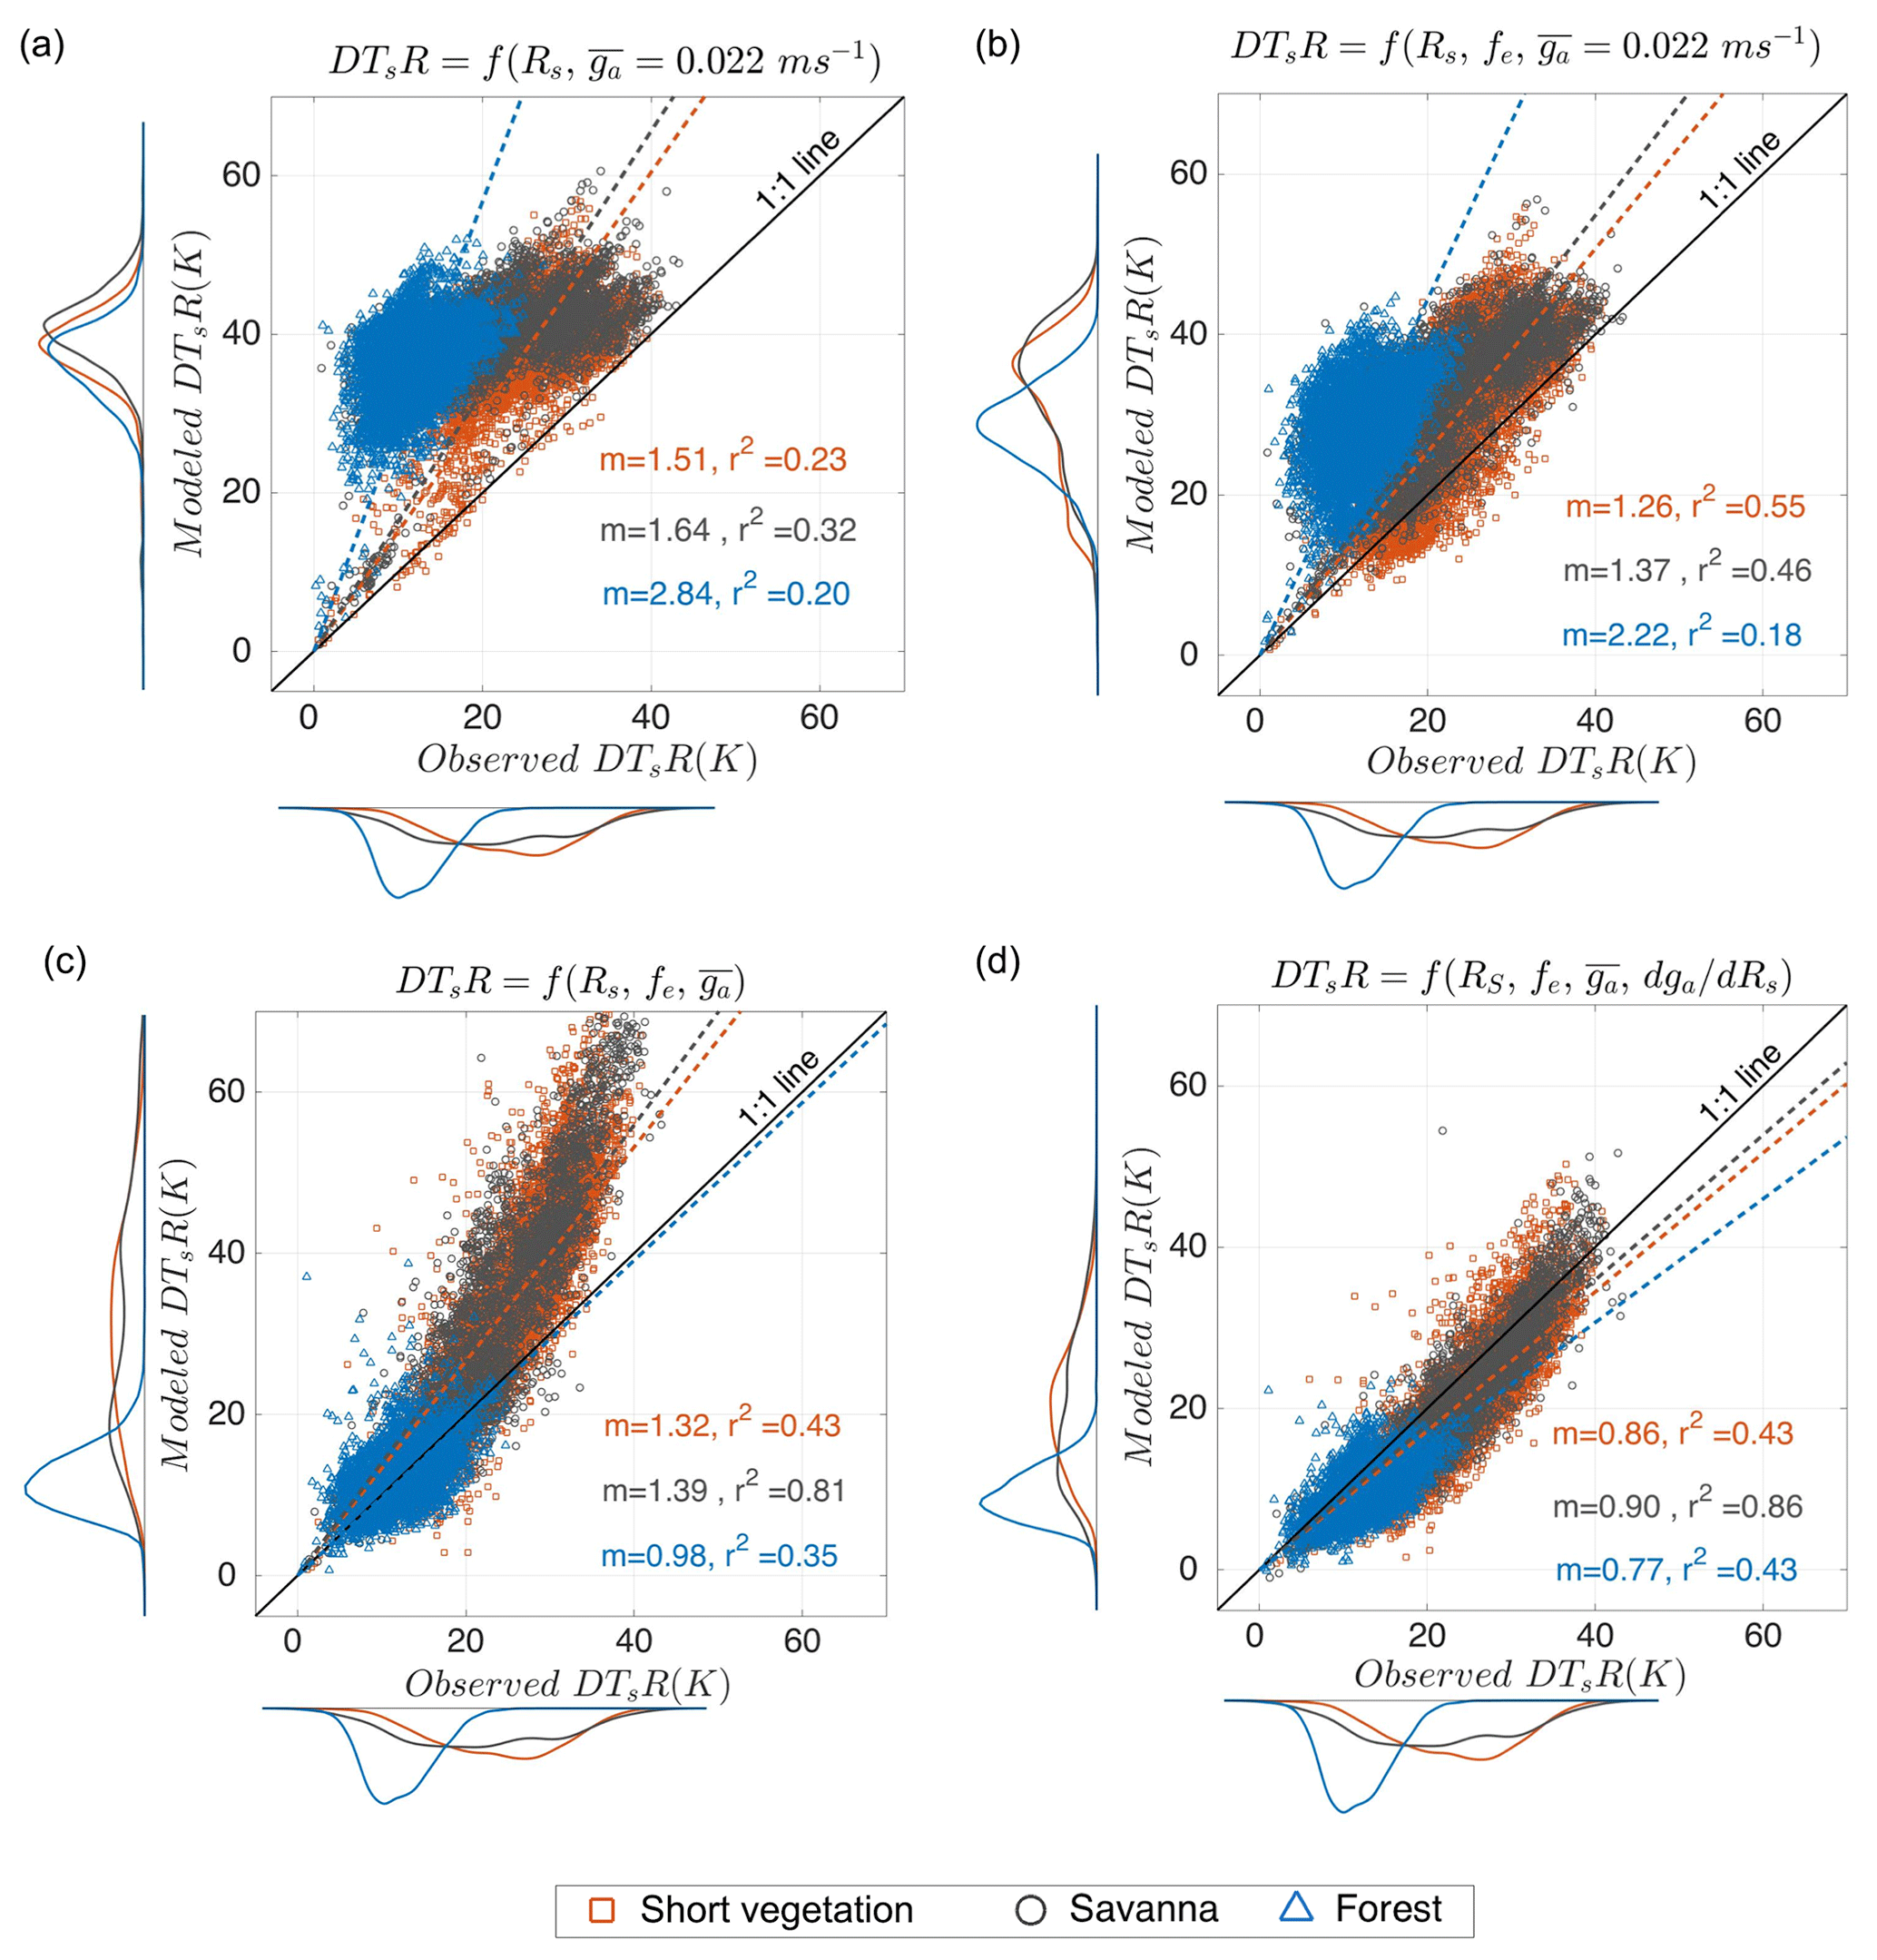
Figure 7Comparison of the estimated diurnal surface temperature range (DTsR) for short vegetation (red), savanna (gray), and forest (blue), with observations for the four scenarios. (a) DTsR is only a function of solar radiation (Rs). (b) DTsR including the effect of evaporative fraction (fe). (c) DTsR with the additional effect of differences in the mean aerodynamic conductance between vegetation types (). (d) DTsR additionally includes the effect of the diurnal variation in aerodynamic conductance (dga∕dRs). Dashed lines show the linear regression between the model and observation with their slopes (m), and the coefficient of the determination is indicated (r2) in the plots.
In the second case, we add the information on evaporative fraction (Fig. 7b). The DTsR estimates for short vegetation (m=1.26; r2=0.55) and, to some extent, for savanna (m=1.37, r2=0.46) are considerably improved but not for forests (m=2.22, r2=0.18). Nevertheless, in this case, DTsR is cooler and closer to the observed values than the previous case, indicating the importance of evaporation in cooling the diurnal temperature, although the values are still too high, as indicated by the regression slopes being m>1.
However, in forests, the information on the evaporative fraction alone does not reduce DTsR because their high aerodynamic conductance is not accounted for. Therefore, in the third case, in addition to the absorbed solar radiation and evaporative fraction, we added the information on the mean aerodynamic conductance (). The DTsR in forests is now better captured (r2=0.35), and the magnitude is closer to the observed (m=0.98); see Fig. 7c. In short vegetation and savanna, however, DTsR is still mostly overestimated. This can be attributed to the diurnal variation in the aerodynamic conductance, dga∕dRs, not being included in this case.
Finally, we add information on all components to our estimate (Fig. 7d). DTsR estimates are much closer to the observation, with a good r2 for all vegetation types, and regression slopes are reduced to values m<1, indicating a slight cold bias. Forest sites show a slight improvement in r2, although the contribution of dga∕dRs is comparatively small because in the forest is small (∼1 K).
These four cases show that vegetation type and evaporative conditions play significant roles in modulating the diurnal variation in surface temperature. Evaporative fraction is important for reducing the spread and magnitude (as indicated by the lower values of m and higher r2), whereas differences in the mean aerodynamic conductance are important for capturing the different magnitudes of DTsR between short vegetation and forests.
The importance of these factors can be illustrated by how much they act to reduce the magnitude of DTsR. This can be done by evaluating the extent to which the regression slope, m, is reduced by these factors, using the first case that only considers solar radiation as the reference case. Evaporation reduces DTsR by ∼18 % (short vegetation – (1.26–1.51) %; savanna – (1.37–1.64) %; forest – (2.22–2.84) %). On comparing Fig. 7b and c, we found that the high aerodynamic conductance of forests reduces DTsR by 56 % ((0.98–2.22) %). In other words, the higher aerodynamic conductance of forests causes substantially larger cooling than evaporation. The diurnal variation in the aerodynamic conductance then reduces the DTsR further, being stronger in short vegetation ((0.86–1.32) %) and savanna ((0.90–1.40) %) than in forests ((0.77–0.98) %).
We demonstrate a robust way of characterizing the diurnal variation in temperatures, using their morning to noon warming rates, which are derived from the half-hourly changes in temperatures and absorbed solar radiation. Warming rates are suitable for the analysis of other factors that affect temperatures, such as evaporation and vegetation, because the most dominant variation in temperature caused by solar energy input is removed.
Our analytic surface energy balance model can reproduce the warming rates of the surface temperature derived from observations quite well and shows the physical significance of evaporative fraction, aerodynamic conductance, and its diurnal variation in shaping diurnal temperature variations. The approximations made in the derivation of Eqs. (7) and (9) can be further improved by a more detailed formulation of net longwave radiation (which could, for instance, include optical properties of the atmosphere) and the ground heat flux. Warming rates are also likely to be sensitive to clouds and might not capture the information of evaporative conditions and vegetation on cloudy days. These effects were not evaluated here because we focused the analysis on clear sky days. It may, however, very well be that the dominant effect of clouds is simply to reduce absorbed solar radiation, so that Eqs. (7) and (9) could also predict warming rates for those conditions. Also, we did not provide a way to estimate the warming rates of air temperature. These could be topics for future research.
One of the main findings of our study is the contrasting response of the warming rates of surface and air temperature to evaporative fraction. The warming rate of air temperature does not contain any imprints of evaporative fraction across all sites, irrespective of their aerodynamic conductance and evaporative conditions. This finding is consistent with our previous work (Panwar et al., 2019), where we explained this finding by showing how the effect of boundary layer growth compensates for the effects of different evaporative conditions. We anticipate that our hypothesis of the compensating effect of boundary layer growth might also hold for forests, but this would need further research.
The warming rate of surface temperature is highly sensitive to the evaporative fraction for short vegetation. The mean sensitivity of K (W m is consistent with the reported sensitivity in Panwar et al. (2019). This decrease is comparable for all sites with short vegetation, and we anticipate that some of the spread is due to their somewhat different aerodynamic properties. Another source of uncertainty is the uneven distribution of the days of different evaporative fractions, which may affect the estimation of the sensitivity. This uncertainty could be reduced by a longer time series of observations to obtain a greater sampling range of evaporative conditions.
The notion that surface and air temperature variations respond differently to evaporative conditions was reported in previous research (Cresswell et al., 1999; Fu et al., 2011; Hengl et al., 2012; Jang et al., 2004; Kilibarda et al., 2014; Zhu et al., 2013) and is relevant when air temperature products are developed from remotely sensed surface temperature. Typically, these products are primarily based on the assumption that surface temperature is a proxy of air temperature. Generally, these approaches overestimate daytime air temperature (Oyler et al., 2016; Zhang et al., 2011). This is consistent with our analysis, which shows markedly higher warming rates of surface temperature for nonforested vegetation than the warming rates of air temperature (see Fig. 3). This overestimate can also be understood by the first term on the right-hand side of Eq. (7), which causes the stronger response of surface temperature compared to air temperature to changes in absorbed solar radiation.
Our study shows that the warming rates of surface and air temperature are similar at forest sites, which indicates the strong coupling between the two temperatures. This finding is in agreement with the previous study by Li et al. (2015) and Mildrexler et al. (2011), where evaporative cooling and the high aerodynamic conductance of forests were identified as being the responsible factors for the strong coupling between surface and air temperature. Additionally, we show that the diurnal variation in surface and air temperature remains similar irrespective of the evaporative conditions in the forest. We can only speculate about the physical mechanism behind this finding. While it is well established that the greater aerodynamic roughness of the forest leads to a greater aerodynamic conductance for neutral conditions (Oke, 1978) we also find that the diurnal variation is much larger than the mean (the term dga∕dRs). This enhancement is most likely related to buoyancy, which is produced when the surface is heated by the absorption of solar radiation during the day. The finding that the relative enhancement of aerodynamic conductance between forests and nonforests is the same, and that this enhancement is insensitive to evaporative fraction, seems to be surprising and would need further investigations about their physical explanations.
We then applied our analytical model to estimate the diurnal surface temperature range DTsR and attribute the dominant factors that influence this range. It attributed the low DTsR of forests mostly to their high aerodynamic conductance (∼56 %), with evaporation playing only a secondary role (∼22 %). This finding is consistent with studies that showed that the warming induced by deforestation is mainly the consequence of changes in aerodynamic conductance rather than changes in evaporative conditions (Bright et al., 2017; Chen and Dirmeyer, 2016; Lee et al., 2011b; Zhao et al., 2014b). This aerodynamic effect is thus important for the cooling effect of forests (Ellison et al., 2017; Li et al., 2015; Tang et al., 2018), which our analysis and analytical model supports.
In addition to the role of the mean aerodynamic conductance, we find a strong diurnal variation in the aerodynamic conductance that is greater than the mean (as already reported by Mallick et al., 2013; Ronda et al., 2001; Steduto and Hsiao, 1998). This diurnal variation acts to reduce the diurnal variation in surface temperature further. While our findings show that the relative diurnal variation in aerodynamic conductance is about the same across the sites, this variation caused a stronger reduction in DTsR ( %) in short vegetation and savanna compared to forests ( %). It indicates that in forests the greater mean aerodynamic conductance is much more important than its diurnal variation. This can be explained by being small (∼1 K) in forests, although the reason for this small difference would need further evaluation.
Our model demonstrates a similar sensitivity of DTsR to energy partitioning and aerodynamic conductance as per a previous study by Diak and Whipple (1993), who used simulations with a boundary layer model. Our model can capture this sensitivity solely with surface energy balance information, but it does not require information on the boundary layer (which is likely to be encapsulated in the warming rate of air temperature and its lack of sensitivity to evaporative fraction). This indicates that the diurnal variation in surface temperature is chiefly governed by the exchange at the surface, particularly regarding its aerodynamic conductance and the evaporative fraction.
To sum up this discussion, our findings are consistent with previously published research regarding the main factors that shape the diurnal variation in surface and air temperature across different vegetation types. The derived equations of the warming rate of surface temperature (Eq. 7) and its sensitivity to evaporative fraction (Eq. 9) appear to be useful for describing and quantifying the primary factors that cause differences in the diurnal variation in surface temperature across different land cover types.
We used warming rates, i.e., the change in temperatures with a change in absorbed solar radiation from morning to solar noon, to identify the influences of evaporative conditions and vegetation on diurnal temperature variations across 51 FLUXNET sites covering different vegetation types. We found that the warming rates of air temperature are similar across the sites and are insensitive to evaporative fraction. The warming rates of surface temperatures of sites with short vegetation decreased with greater evaporative fraction, representing a stronger evaporative cooling. For forests, warming rates of surface temperature are almost the same as those for air temperature, and they lacked sensitivity to the evaporative fraction. Using an analytical description of the surface energy balance, we reproduced these findings and attributed the different response of forests primarily to their higher aerodynamic conductance.
From our analysis, we can draw several conclusions. First, we found that diurnal variations in air temperature reflect very little information on evaporative conditions, implying that these observations cannot be used to infer evaporation. Second, the diurnal variation in surface temperature, however, shows a clear sensitivity to the evaporative fraction for short vegetation, so that evaporation may be inferred from surface temperature observations. Third, in forests, surface temperature is strongly aerodynamically coupled to air temperatures by their high aerodynamic conductance, so that these lack sensitivity to evaporative fraction. Hence, diurnal temperature variations in forested sites do not seem to carry a notable effect from evaporation. What this shows is that the effect of evaporative conditions on diurnal temperature variations delicately depends on the presence or absence of forests.
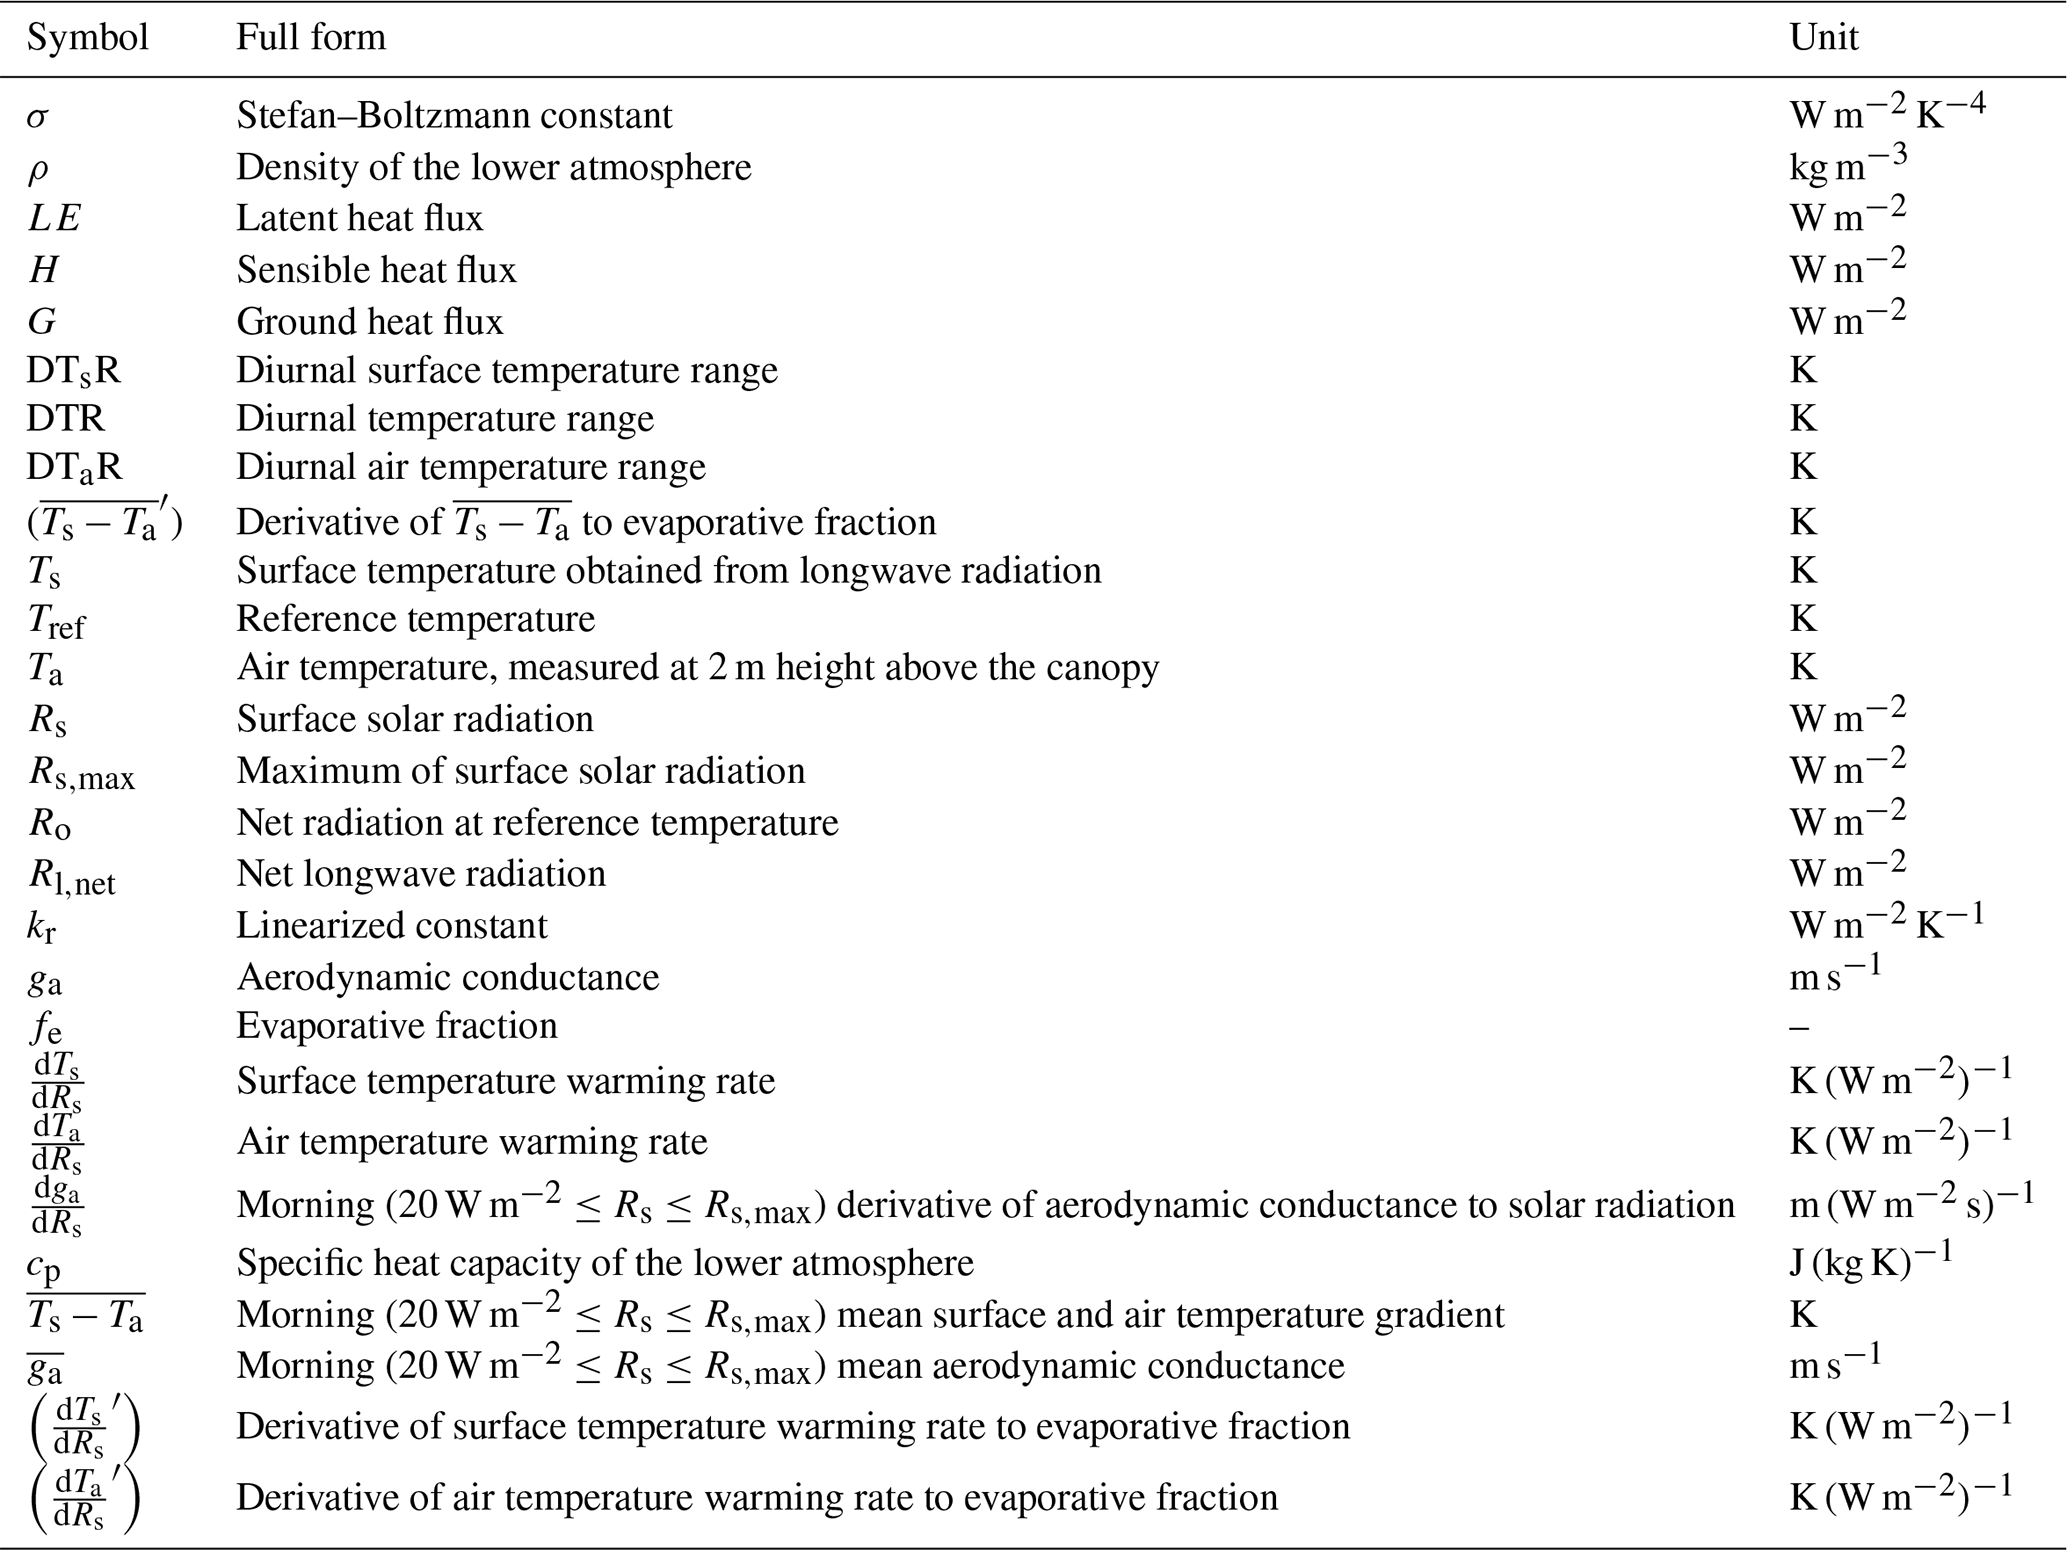
Table A2Description of the sites used for this study. For the definitions of the terms included herein, please see the corresponding DOI.
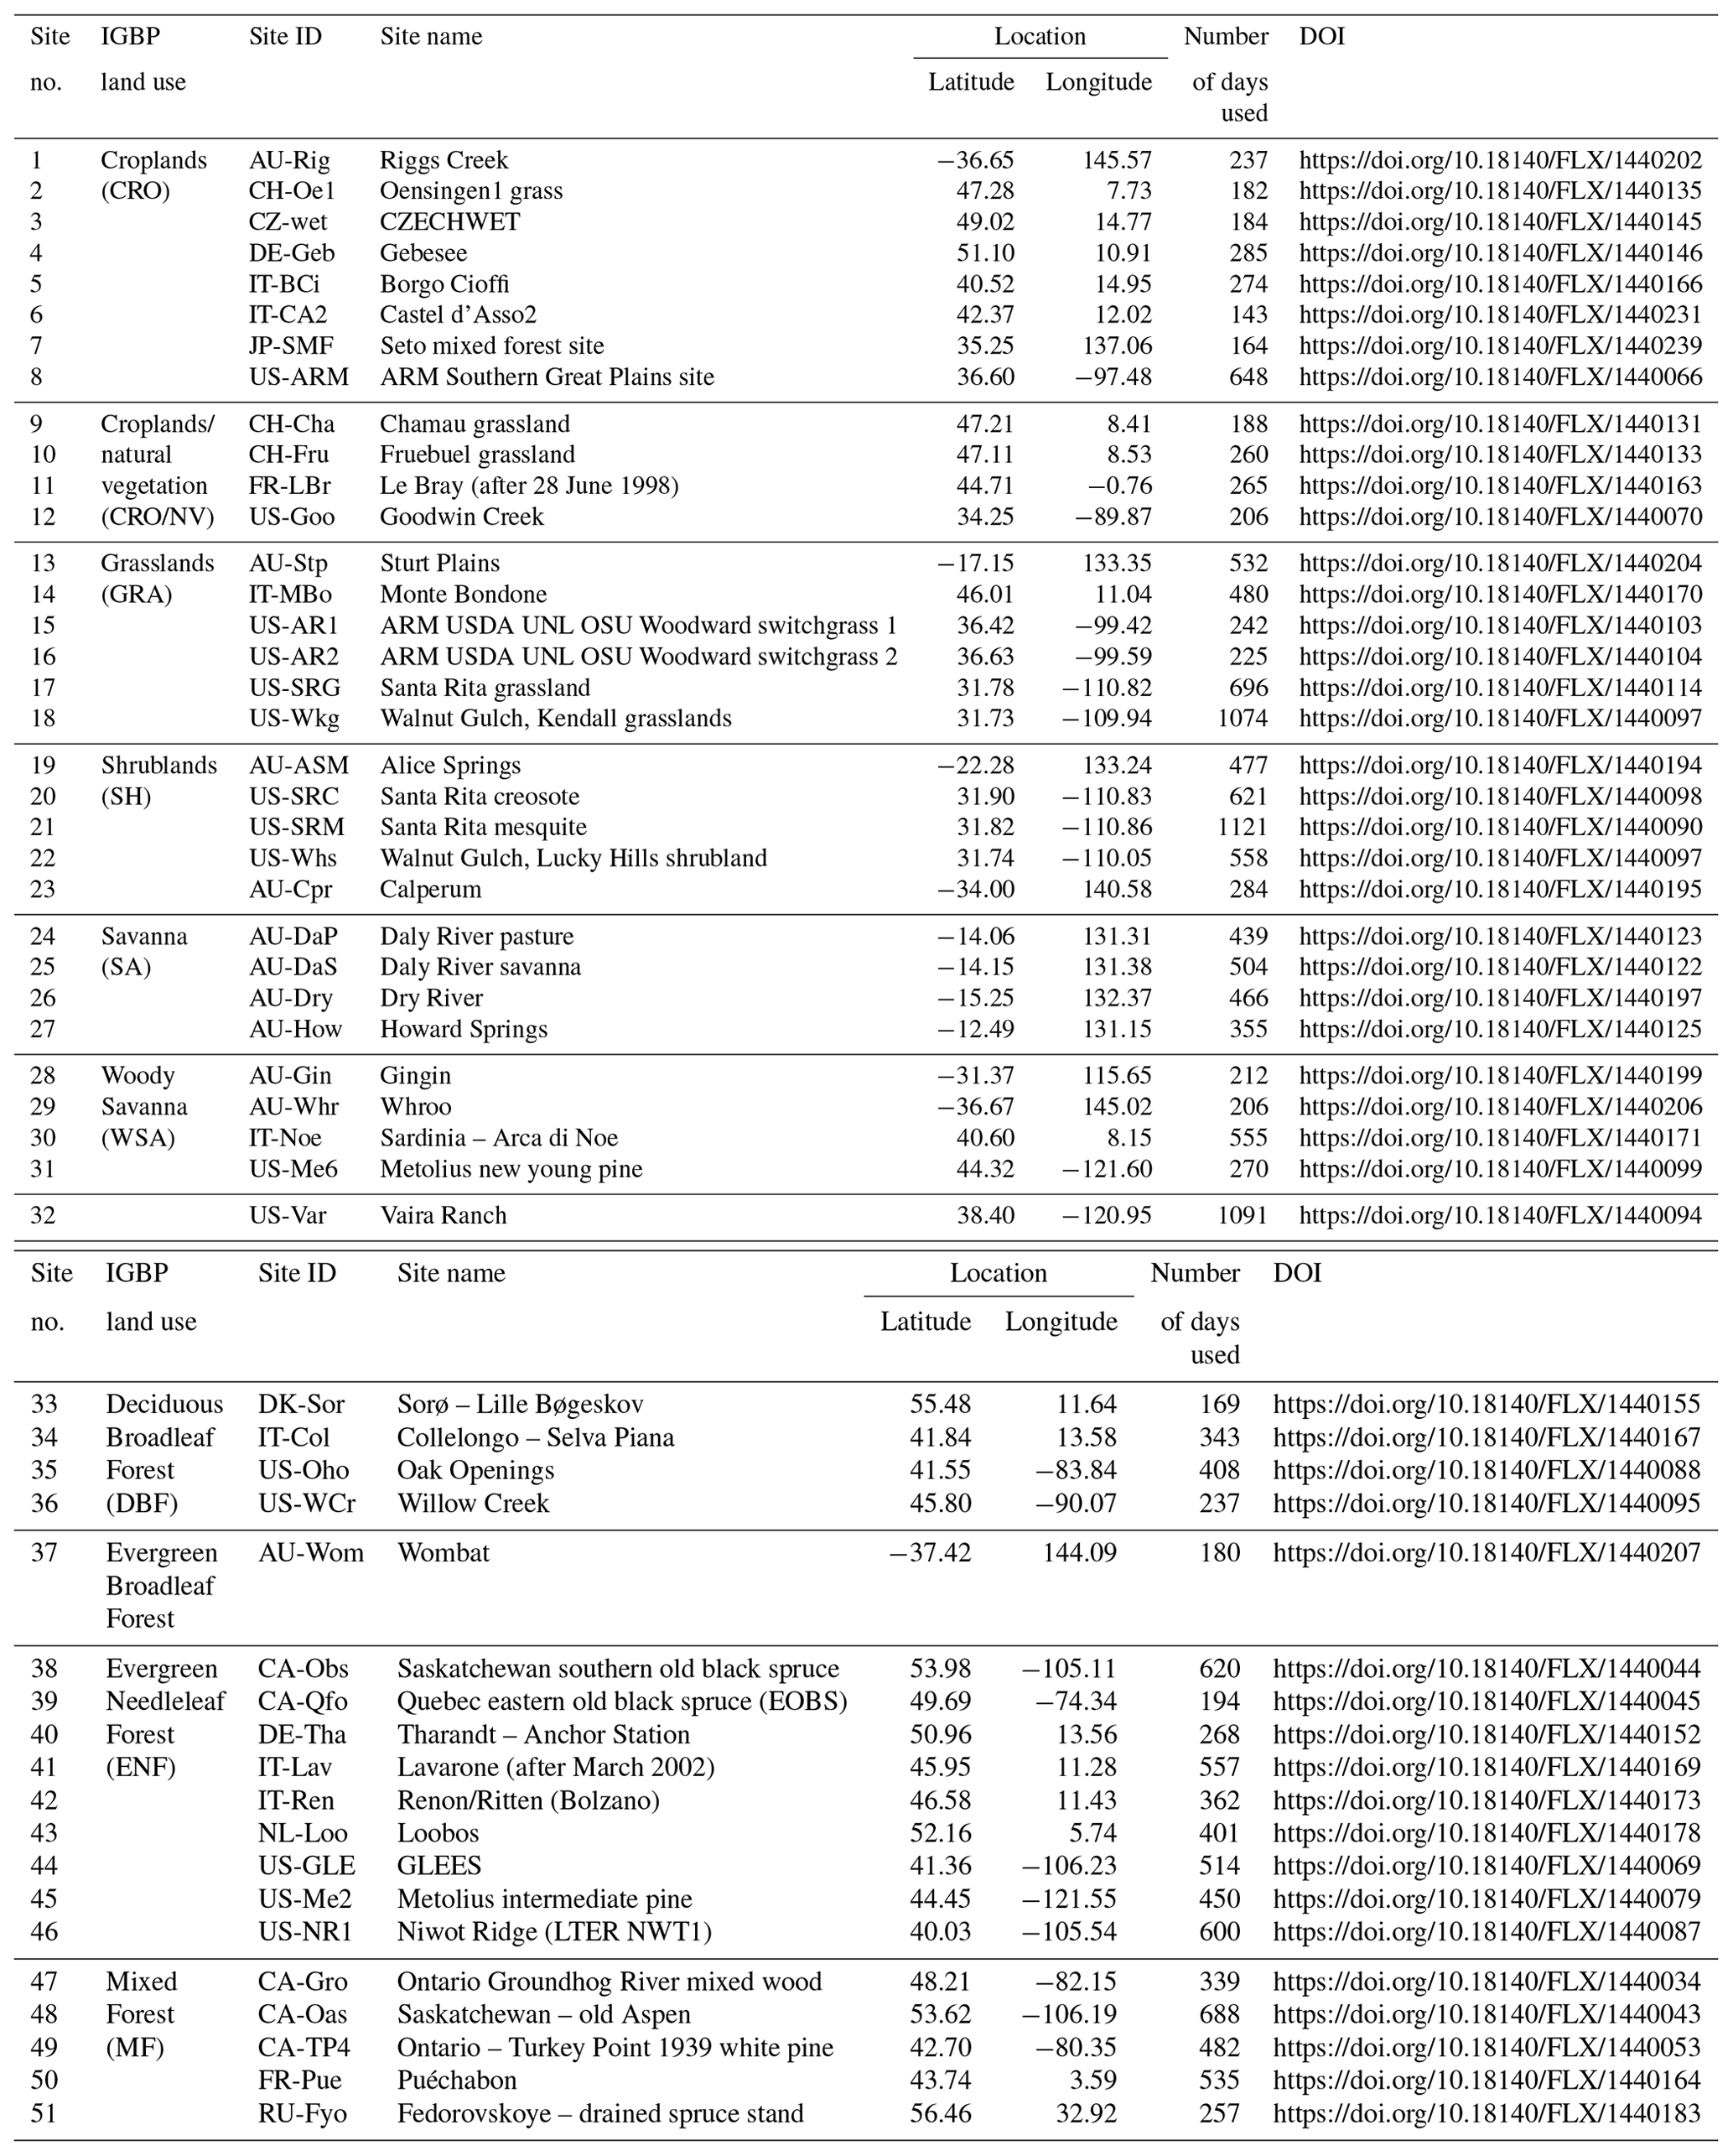

Figure A1(a) Box plot of surface (Ts – orange) and air (Ta – blue) temperature warming rates (dT∕dRs). (b) Box plot of evaporative fractions. The vegetation types are separated by gray and white shading. The circle in the box plot indicates the median, and the top and bottom edges indicate the 75th and 25th percentiles, respectively. The whisker covers the range in the observation.
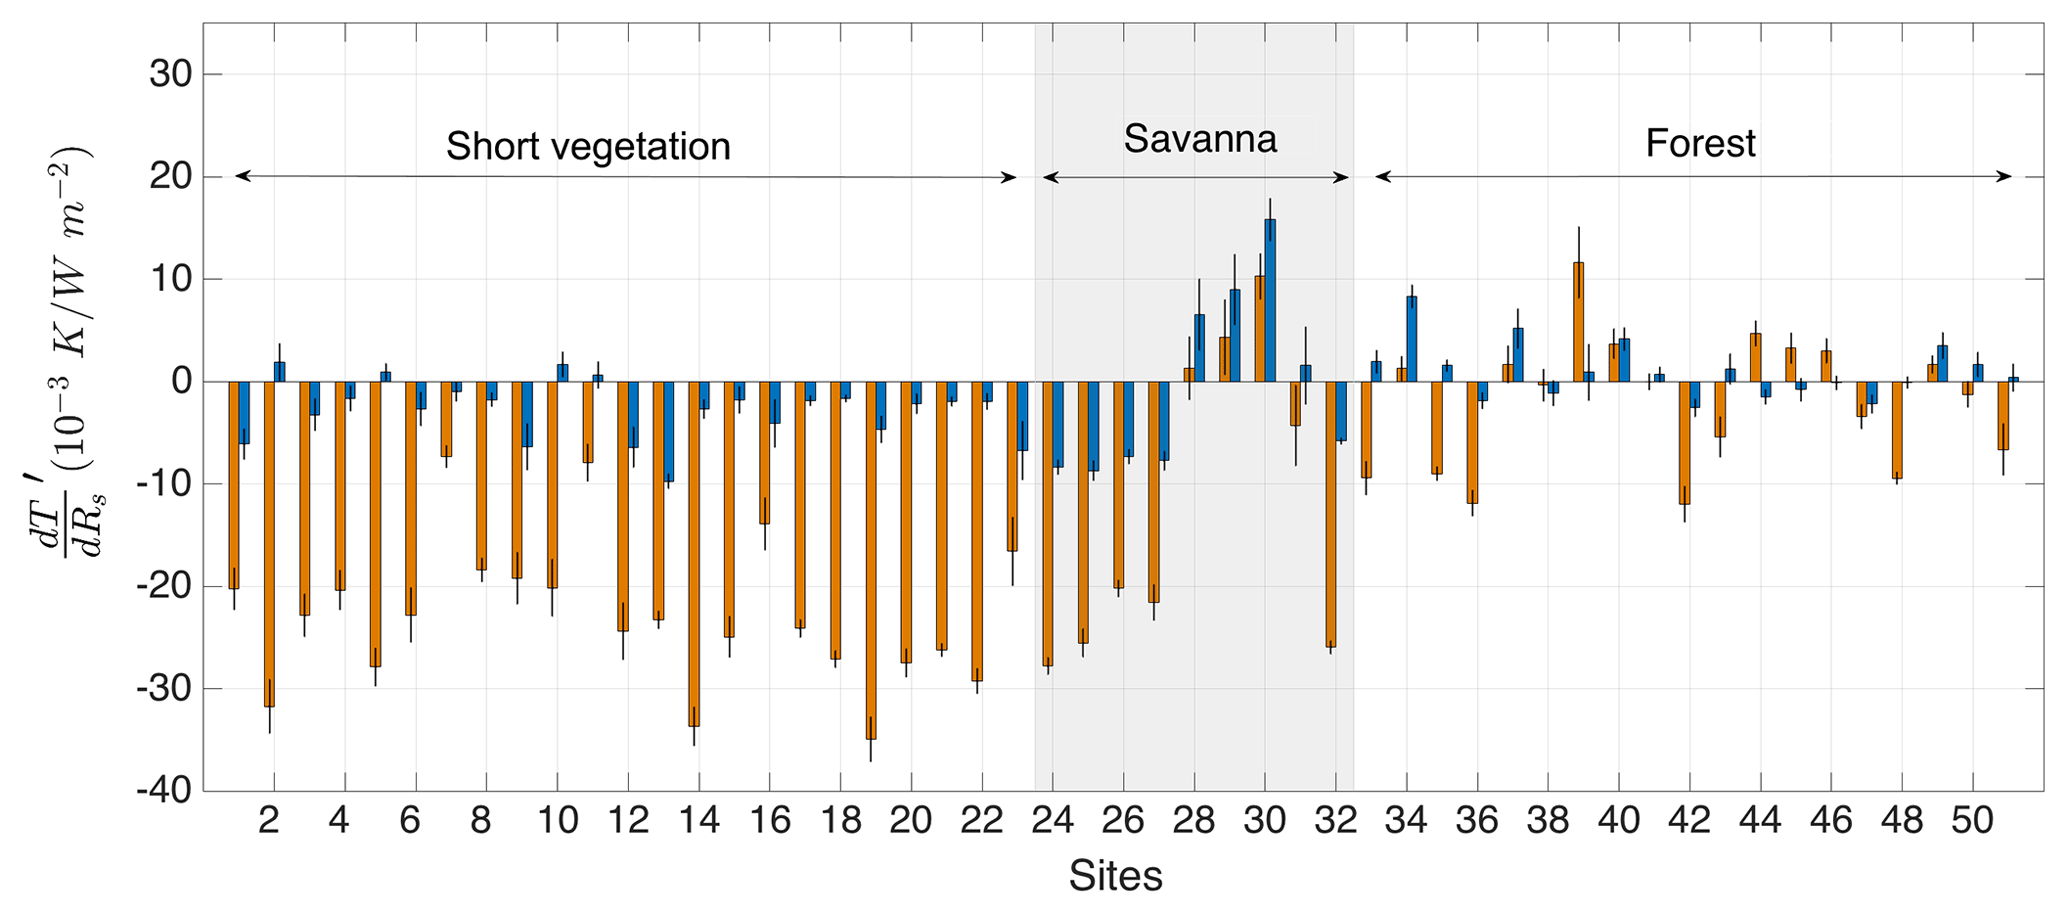
Figure A2Warming rates response to evaporation () for surface (Ts – orange) and air (Ta – blue) temperature. The vegetation types are separated by gray and white shading. The black bar represents the standard error in the linear regression of observed warming rate and evaporative fraction.
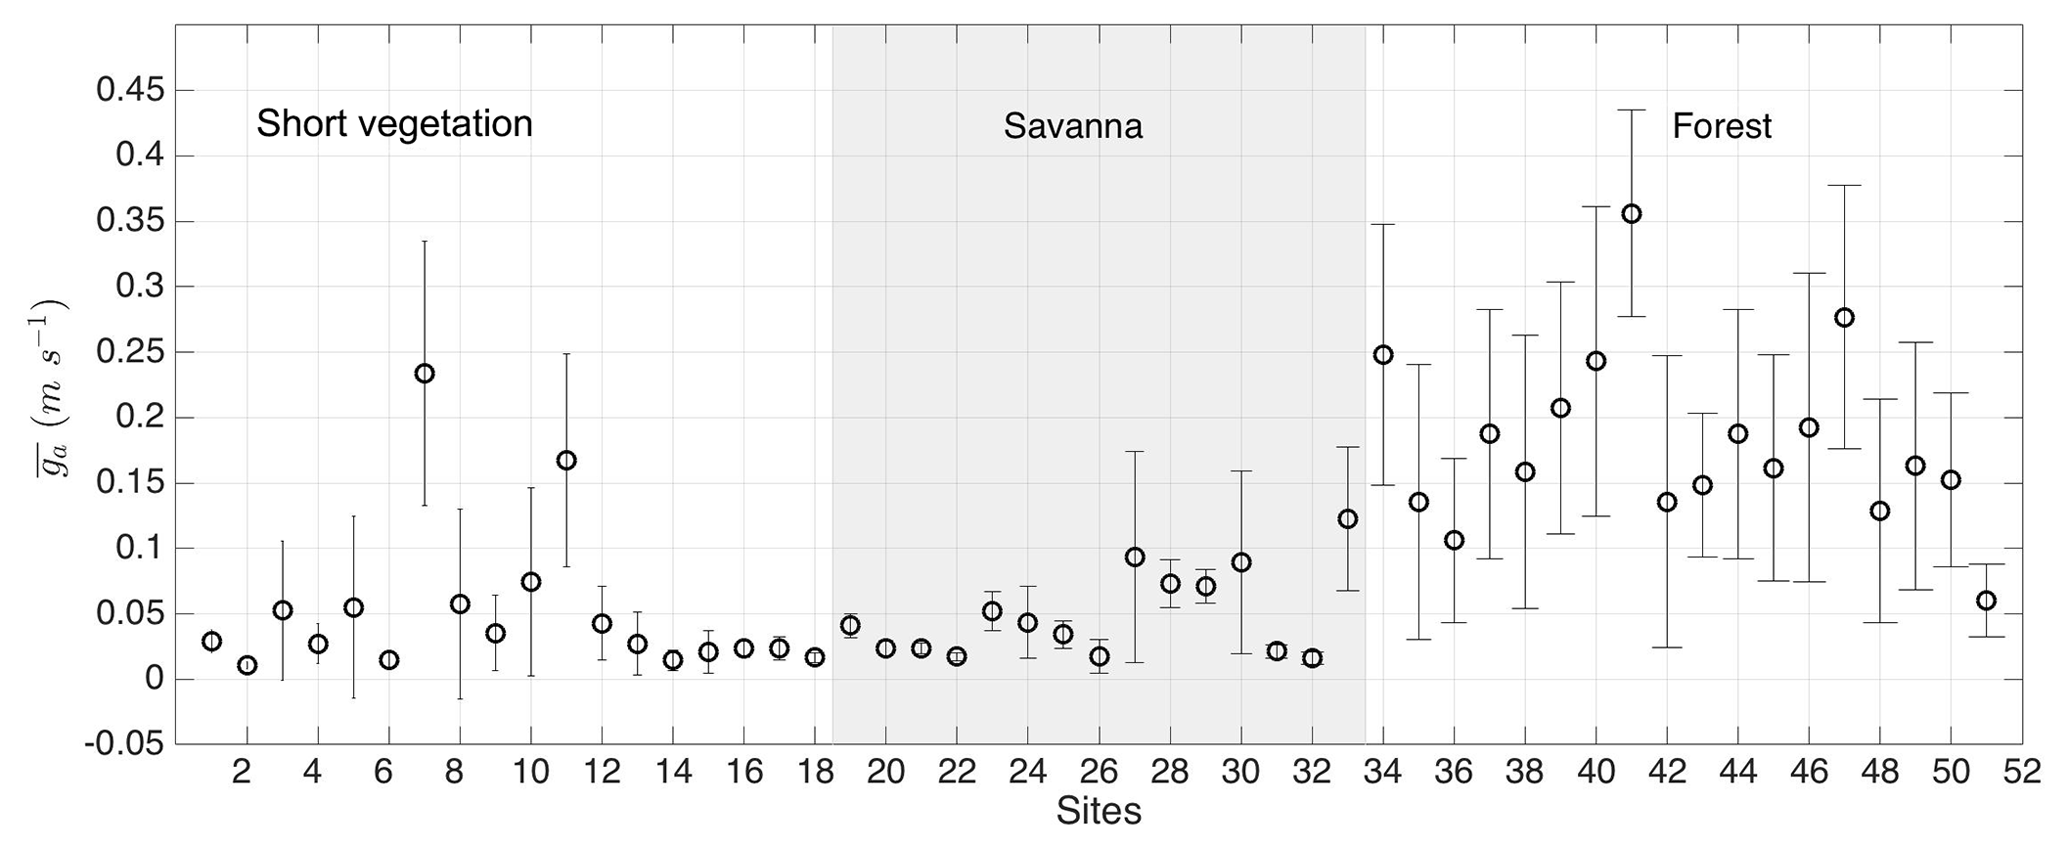
Figure A3Morning time mean of aerodynamic conductance (ga) for each site. The vegetation types are separated by gray and white shading. The error bar represents the standard deviation of the mean.
For the map of evaporative fraction, we used the FLUXCOM monthly data of sensible and latent heat fluxes, which are available at http://www.fluxcom.org/ (last access: October 2020) (Jung et al., 2019; Tramontana et al., 2016). The observational analysis used FLUXNET data from 51 sites, which are available at https://fluxnet.fluxdata.org/ (last access: October 2020) (Baldocchi et al., 2001). More descriptions of each site are provided in the Appendix.
All authors conceived the study. AP analyzed data, and AK derived the energy-balance model that was further developed by AP. MR provided classification of cloud-free conditions. All authors interpreted the results. AP wrote the paper with input from MR and AK.
The authors declare that they have no conflict of interest.
Annu Panwar is sincerely thankful for the stipend from the International Max Planck Research School for Global Biogeochemical Cycles (IMPRS-gBGC) which enabled her to perform this research.
The article processing charges for this
open-access publication were covered by the Max Planck Society.
This paper was edited by Dominic Mazvimavi and reviewed by two anonymous referees.
Anderson, M. C., Allen, R. G., Morse, A., and Kustas, W. P.: Use of Landsat thermal imagery in monitoring evapotranspiration and managing water resources, Remote Sens. Environ., 122, 50–65, https://doi.org/10.1016/j.rse.2011.08.025, 2012.
Baier, W. and Robertson, G. W.: Estimation of latent evaporation from simple weather observations, Can. J. Plant Sci., 45, 276–284, https://doi.org/10.4141/cjps65-051, 1965.
Baldocchi, D., Falge, E., Gu, L., Olson, R., Hollinger, D., Running, S., Anthoni, P., Bernhofer, C., Davis, K., Evans, R., Fuentes, J., Goldstein, A., Katul, G., Law, B., Lee, X., Malhi, Y., Meyers, T., Munger, W., Oechel, W., Paw, K. T., Pilegaard, K., Schmid, H. P., Valentini, R., Verma, S., Vesala, T., Wilson, K., and Wofsy, S.: FLUXNET: A New Tool to Study the Temporal and Spatial Variability of Ecosystem–Scale Carbon Dioxide, Water Vapor, and Energy Flux Densities, B. Am. Meteorol. Soc., 82, 2415–2434, https://doi.org/10.1175/1520-0477(2001)082<2415:FANTTS>2.3.CO;2, 2001.
Betts, A. K. and Ball, J. H.: The FIFE surface diurnal cycle climate, J. Geophys. Res., 100, 25679, https://doi.org/10.1029/94JD03121, 1995.
Bevan, S. L., Los, S. O., and North, P. R. J.: Response of vegetation to the 2003 European drought was mitigated by height, Biogeosciences, 11, 2897–2908, https://doi.org/10.5194/bg-11-2897-2014, 2014.
Blaney, H. F. and Cridlle, W. D.: Determining Water Requirements in Irrigated Areas from Climatological Irrigation Data, Technical Paper No. 96, US Department of Agriculture, Soil Conservation Service, Washington, D.C., 48 pp., 1950.
Boegh, E., Soegaard, H., and Thomsen, A.: Evaluating evapotranspiration rates and surface conditions using Landsat TM to estimate atmospheric resistance and surface resistance, Remote Sens. Environ., 79, 329–343, https://doi.org/10.1016/S0034-4257(01)00283-8, 2002.
Bright, R. M., Davin, E., O'Halloran, T., Pongratz, J., Zhao, K., and Cescatti, A.: Local temperature response to land cover and management change driven by non-radiative processes, Nat. Clim. Change, 7, 296–302, https://doi.org/10.1038/nclimate3250, 2017.
Bristow, K. L. and Campbell, G. S.: On the relationship between incoming solar radiation and daily maximum and minimum temperature, Agr. Forest Meteorol., 31, 159–166, https://doi.org/10.1016/0168-1923(84)90017-0, 1984.
Chen, L. and Dirmeyer, P. A.: Adapting observationally based metrics of biogeophysical feedbacks from land cover/land use change to climate modeling, Environ. Res. Lett., 11, 034002, https://doi.org/10.1088/1748-9326/11/3/034002, 2016.
Clothier, B. E., Clawson, K. L., Pinter, P. J., Moran, M. S., Reginato, R. J., and Jackson, R. D.: Estimation of soil heat flux from net radiation during the growth of alfalfa, Agr. Forest Meteorol., 37, 319–329, https://doi.org/10.1016/0168-1923(86)90069-9, 1986.
Cresswell, M. P., Morse, A. P., Thomson, M. C., and Connor, S. J.: Estimating surface air temperatures, from Meteosat land surface temperatures, using an empirical solar zenith angle model, Int. J. Remote Sens., 20, 1125–1132, https://doi.org/10.1080/014311699212885, 1999.
Dai, A., Trenberth, K. E., and Karl, T. R.: Effects of Clouds, Soil Moisture, Precipitation, and Water Vapor on Diurnal Temperature Range, J. Climate, 12, 2451–2473, 1999.
Diak, G. R. and Whipple, M. S.: Improvements to models and methods for evaluating the land-surface energy balance and `effective' roughness using radiosonde reports and satellite-measured `skin' temperature data, Agr. Forest Meteorol., 63, 189–218, https://doi.org/10.1016/0168-1923(93)90060-U, 1993.
Ellison, D., Morris, C. E., Locatelli, B., Sheil, D., Cohen, J., Murdiyarso, D., Gutierrez, V., van Noordwijk, M., Creed, I. F., Pokorny, J., Gaveau, D., Spracklen, D. V., Tobella, A. B., Ilstedt, U., Teuling, A. J., Gebrehiwot, S. G., Sands, D. C., Muys, B., Verbist, B., Springgay, E., Sugandi, Y., and Sullivan, C. A.: Trees, forests and water: Cool insights for a hot world, Global Environ. Change, 43, 51–61, https://doi.org/10.1016/j.gloenvcha.2017.01.002, 2017.
Falge, E., Aubinet, M., Bakwin, P. S., Baldocchi, D., Berbigier, P., Bernhofer, C., Black, T. A., Ceulemans, R., Davis, K. J., Dolman, A. J., Goldstein, A., Goulden, M. L., Granier, A., Hollinger, D. Y., Jarvis, P. G., Jensen, N., Pilegaard, K., Katul, G., Kyawthapaw, P., Law, B. E., Lindroth, A., Loustau, D., Mahli, Y., Monson, R., Moncrieff, P., Moors, E., Munger, J. W., Meyers, T., Oechel, W., Schulze, E.-D., Thorgeirsson, H., Tenhunen, J., Valentini, R., Verma, S. B., Vesala, T., and Wofsy, S. C.: FLUXNET Research Network Site Characteristics, Investigators, and Bibliography, 2016, 1459.4803539999996 MB, ORNL DAAC – Oak Ridge National Laboratory Distributed Active Archive Center, Oak Ridge, Tennessee, USA, https://doi.org/10.3334/ORNLDAAC/1530, 2017.
Fu, G., Shen, Z., Zhang, X., Shi, P., Zhang, Y., and Wu, J.: Estimating air temperature of an alpine meadow on the Northern Tibetan Plateau using MODIS land surface temperature, Acta Ecol. Sin., 31, 8–13, https://doi.org/10.1016/j.chnaes.2010.11.002, 2011.
Gallo, K. P.: The Influence of Land Use/Land Cover on Climatological Values of the Diurnal Temperature Range, J. Climate, 9, 2941–2944, 1996.
Hargreaves, G. H. and Samani, Z. A.: Reference Crop Evapotranspiration from Temperature, Appl. Eng. Agricult., 1, 96–99, https://doi.org/10.13031/2013.26773, 1985.
Hengl, T., Heuvelink, G. B. M., Perèec Tadiæ, M., and Pebesma, E. J.: Spatio-temporal prediction of daily temperatures using time-series of MODIS LST images, Theor. Appl. Climatol., 107, 265–277, https://doi.org/10.1007/s00704-011-0464-2, 2012.
Jackson, L. S. and Forster, P. M.: An Empirical Study of Geographic and Seasonal Variations in Diurnal Temperature Range, J. Climate, 23, 3205–3221, https://doi.org/10.1175/2010JCLI3215.1, 2010.
Jackson, T. J., Le Vine, D. M., Hsu, A. Y., Oldak, A., Starks, P. J., Swift, C. T., Isham, J. D., and Haken, M.: Soil moisture mapping at regional scales using microwave radiometry: the Southern Great Plains Hydrology Experiment, IEEE T. Geosci. Remote., 37, 2136–2151, https://doi.org/10.1109/36.789610, 1999.
Jang, J.-D., Viau, A. A., and Anctil, F.: Neural network estimation of air temperatures from AVHRR data, Int. J. Remote Sens., 25, 4541–4554, https://doi.org/10.1080/01431160310001657533, 2004.
Jarvis, P. G. and McNaughton, K. G.: Stomatal Control of Transpiration: Scaling Up from Leaf' to Region, Adv. Ecol. Res., 15, 1–49, 1986.
Jones, H. G.: Plants and Microclimate, Cambridge University Press, New York, USA, 47–67, 1992.
Juang, J.-Y., Katul, G., Siqueira, M., Stoy, P., and Novick, K.: Separating the effects of albedo from eco-physiological changes on surface temperature along a successional chronosequence in the southeastern United States, Geophys. Res. Lett., 34, L21408, https://doi.org/10.1029/2007GL031296, 2007.
Jung, M., Koirala, S., Weber, U., Ichii, K., Gans, F., Camps-Valls, G., Papale, D., Schwalm, C., Tramontana, G., and Reichstein, M.: The FLUXCOM ensemble of global land-atmosphere energy fluxes, Scient. Data, 6, 74, https://doi.org/10.1038/s41597-019-0076-8, 2019.
Kilibarda, M., Hengl, T., Heuvelink, G. B. M., Gräler, B., Pebesma, E., Perèec Tadiæ, M., and Bajat, B.: Spatio-temporal interpolation of daily temperatures for global land areas at 1 km resolution, J. Geophys. Res.-Atmos., 119, 2294–2313, https://doi.org/10.1002/2013JD020803, 2014.
Kustas, W. P. and Daughtry, C. S. T.: Estimation of the soil heat flux/net radiation ratio from spectral data, Agr. Forest Meteorol., 49, 205–223, https://doi.org/10.1016/0168-1923(90)90033-3, 1990.
Kustas, W. P. and Norman, J. M.: Evaluation of soil and vegetation heat flux predictions using a simple two-source model with radiometric temperatures for partial canopy cover, Agr. Forest Meteorol., 94, 13–29, https://doi.org/10.1016/S0168-1923(99)00005-2, 1999.
Lee, X., Goulden, M. L., Hollinger, D. Y., Barr, A., Black, T. A., Bohrer, G., Bracho, R., Drake, B., Goldstein, A., Gu, L., Katul, G., Kolb, T., Law, B. E., Margolis, H., Meyers, T., Monson, R., Munger, W., Oren, R., Paw U, K. T., Richardson, A. D., Schmid, H. P., Staebler, R., Wofsy, S., and Zhao, L.: Observed increase in local cooling effect of deforestation at higher latitudes, Nature, 479, 384–387, https://doi.org/10.1038/nature10588, 2011a.
Lee, X., Goulden, M. L., Hollinger, D. Y., Barr, A., Black, T. A., Bohrer, G., Bracho, R., Drake, B., Goldstein, A., Gu, L., Katul, G., Kolb, T., Law, B. E., Margolis, H., Meyers, T., Monson, R., Munger, W., Oren, R., Paw U, K. T., Richardson, A. D., Schmid, H. P., Staebler, R., Wofsy, S., and Zhao, L.: Observed increase in local cooling effect of deforestation at higher latitudes, Nature, 479, 384–387, https://doi.org/10.1038/nature10588, 2011b.
Li, Y., Zhao, M., Motesharrei, S., Mu, Q., Kalnay, E., and Li, S.: Local cooling and warming effects of forests based on satellite observations, Nat. Commun., 6, 6603, https://doi.org/10.1038/ncomms7603, 2015.
Lindvall, J. and Svensson, G.: The diurnal temperature range in the CMIP5 models, Clim. Dynam., 44, 405–421, https://doi.org/10.1007/s00382-014-2144-2, 2015.
Liu, B., Xu, M., Henderson, M., Qi, Y., and Li, Y.: Taking China's Temperature: Daily Range, Warming Trends, and Regional Variations, 1955–2000, J. Climate, 17, 4453–4462, https://doi.org/10.1175/3230.1, 2004.
Loveland, T. R. and Belward, A. S.: The International Geosphere Biosphere Programme Data and Information System global land cover data set (DISCover), Acta Astronaut., 41, 681–689, https://doi.org/10.1016/S0094-5765(98)00050-2, 1997.
Luyssaert, S., Jammet, M., Stoy, P. C., Estel, S., Pongratz, J., Ceschia, E., Churkina, G., Don, A., Erb, K., Ferlicoq, M., Gielen, B., Grünwald, T., Houghton, R. A., Klumpp, K., Knohl, A., Kolb, T., Kuemmerle, T., Laurila, T., Lohila, A., Loustau, D., McGrath, M. J., Meyfroidt, P., Moors, E. J., Naudts, K., Novick, K., Otto, J., Pilegaard, K., Pio, C. A., Rambal, S., Rebmann, C., Ryder, J., Suyker, A. E., Varlagin, A., Wattenbach, M., and Dolman, A. J.: Land management and land-cover change have impacts of similar magnitude on surface temperature, Nat. Clim. Change, 4, 389–393, https://doi.org/10.1038/nclimate2196, 2014.
Makowski, K., Jaeger, E. B., Chiacchio, M., Wild, M., Ewen, T., and Ohmura, A.: On the relationship between diurnal temperature range and surface solar radiation in Europe, J. Geophys. Res., 114, D00D07, https://doi.org/10.1029/2008JD011104, 2009.
Mallick, K., Jarvis, A., Fisher, J. B., Tu, K. P., Boegh, E., and Niyogi, D.: Latent Heat Flux and Canopy Conductance Based on Penman–Monteith, Priestley–Taylor Equation, and Bouchet's Complementary Hypothesis, J. Hydrometeorol., 14, 419–442, https://doi.org/10.1175/JHM-D-12-0117.1, 2013.
Mearns, L. O., Giorgi, F., McDaniel, L., and Shields, C.: Analysis of variability and diurnal range of daily temperature in a nested regional climate model: comparison with observations and doubled CO2 results, Clim. Dynam., 11, 193–209, https://doi.org/10.1007/BF00215007, 1995.
Mildrexler, D. J., Zhao, M., and Running, S. W.: A global comparison between station air temperatures and MODIS land surface temperatures reveals the cooling role of forests, J. Geophys. Res., 116, G03025, https://doi.org/10.1029/2010JG001486, 2011.
Oke, T. R.: Boundary layer climates, Methuen and Co., Ltd., London, Halsted Press, New York, p. 390, 1978.
Oyler, J. W., Dobrowski, S. Z., Holden, Z. A., and Running, S. W.: Remotely Sensed Land Skin Temperature as a Spatial Predictor of Air Temperature across the Conterminous United States, J. Appl. Meteorol. Clim., 55, 1441–1457, https://doi.org/10.1175/JAMC-D-15-0276.1, 2016.
Panwar, A., Kleidon, A., and Renner, M.: Do Surface and Air Temperatures Contain Similar Imprints of Evaporative Conditions?, Geophys. Res. Lett., 46, 3802–3809, https://doi.org/10.1029/2019GL082248, 2019.
Price, J. C.: Estimation of Regional Scale Evapotranspiration Through Analysis of Satellite Thermal-infrared Data, IEEE T. Geosci. Remote, GE-20, 286–292, https://doi.org/10.1109/TGRS.1982.350445, 1982.
Renner, M., Wild, M., Schwarz, M., and Kleidon, A.: Estimating Shortwave Clear-Sky Fluxes From Hourly Global Radiation Records by Quantile Regression, Earth Space Sci., 6, 1532–1546, https://doi.org/10.1029/2019EA000686, 2019.
Rigden, A. J. and Li, D.: Attribution of surface temperature anomalies induced by land use and land cover changes: Attribution of Temperature Anomalies, Geophys. Res. Lett., 44, 6814–6822, https://doi.org/10.1002/2017GL073811, 2017.
Ronda, R. J., de Bruin, H. A. R., and Holtslag, A. A. M.: Representation of the Canopy Conductance in Modeling the Surface Energy Budget for Low Vegetation, J. Appl. Meteorol., 40, 1431–1444, https://doi.org/10.1175/1520-0450(2001)040<1431:ROTCCI>2.0.CO;2, 2001.
Saltzman, B. and Pollack, J. A.: Sensitivity of the Diurnal Surface Temperature Range to Changes in Physical Parameters, J. Appl. Meteorol., 16, 614–619, https://doi.org/10.1175/1520-0450(1977)016<0614:SOTDST>2.0.CO;2, 1977.
Shukla, J. and Mintz, Y.: Influence of Land-Surface Evapotranspiration on the Earth's Climate, Science, 215, 1498–1501, https://doi.org/10.1126/science.215.4539.1498, 1982.
Shuttleworth, W. J., Gurney, R. J., Hsu, A. Y., and Ormsby, J. P.: FIFE: the variation in energy partition at surface flux sites, IAHS-AISH Publication, IAHS Publication – International Association of Hydrological Sciences, Belgium, 67–74, ISSN 0144-7815, 1989.
Steduto, P. and Hsiao, T. C.: Maize canopies under two soil water regimes, Agr. Forest Meteorol., 89, 169–184, https://doi.org/10.1016/S0168-1923(97)00085-3, 1998.
Stenchikov, G. L. and Robock, A.: Diurnal asymmetry of climatic response to increased CO2 and aerosols: Forcings and feedbacks, J. Geophys. Res., 100, 26211, https://doi.org/10.1029/95JD02166, 1995.
Su, H., Wood, E. F., Mccabe, M. F., and Su, Z.: Evaluation of Remotely Sensed Evapotranspiration Over the CEOP EOP-1 Reference Sites, J. Meteorol. Soc. Jpn. A, 85, 439–459, https://doi.org/10.2151/jmsj.85A.439, 2007.
Tang, B., Zhao, X., and Zhao, W.: Local Effects of Forests on Temperatures across Europe, Remote Sens., 10, 529, https://doi.org/10.3390/rs10040529, 2018.
Thom, A. S.: Momentum, mass and heat exchange of vegetation, Q. J. Roy. Meteorol. Soc., 98, 124–134, https://doi.org/10.1002/qj.49709841510, 1972.
Thornthwaite, C. W.: An Approach toward a Rational Classification of Climate, Geogr. Rev., 38, 55–75, https://doi.org/10.2307/210739, 1948.
Tramontana, G., Jung, M., Schwalm, C. R., Ichii, K., Camps-Valls, G., Ráduly, B., Reichstein, M., Arain, M. A., Cescatti, A., Kiely, G., Merbold, L., Serrano-Ortiz, P., Sickert, S., Wolf, S., and Papale, D.: Predicting carbon dioxide and energy fluxes across global FLUXNET sites with regression algorithms, Biogeosciences, 13, 4291–4313, https://doi.org/10.5194/bg-13-4291-2016, 2016.
Vinukollu, R. K., Wood, E. F., Ferguson, C. R., and Fisher, J. B.: Global estimates of evapotranspiration for climate studies using multi-sensor remote sensing data: Evaluation of three process-based approaches, Remote Sens. Environ., 115, 801–823, https://doi.org/10.1016/j.rse.2010.11.006, 2011.
Wang, K. and Dickinson, R. E.: Contribution of solar radiation to decadal temperature variability over land, P. Natl. Acad. Sci. USA, 110, 14877–14882, https://doi.org/10.1073/pnas.1311433110, 2013.
Wild, M.: From Dimming to Brightening: Decadal Changes in Solar Radiation at Earth's Surface, Science, 308, 847–850, https://doi.org/10.1126/science.1103215, 2005.
Yao, Y., Liang, S., Cheng, J., Liu, S., Fisher, J. B., Zhang, X., Jia, K., Zhao, X., Qin, Q., Zhao, B., Han, S., Zhou, G., Zhou, G., Li, Y., and Zhao, S.: MODIS-driven estimation of terrestrial latent heat flux in China based on a modified Priestley–Taylor algorithm, Agr. Forest Meteorol., 171–172, 187–202, https://doi.org/10.1016/j.agrformet.2012.11.016, 2013.
Zhang, W., Huang, Y., Yu, Y., and Sun, W.: Empirical models for estimating daily maximum, minimum and mean air temperatures with MODIS land surface temperatures, Int. J. Remote Sens., 32, 9415–9440, https://doi.org/10.1080/01431161.2011.560622, 2011.
Zhao, L., Lee, X., Smith, R. B., and Oleson, K.: Strong contributions of local background climate to urban heat islands, Nature, 511, 216–219, https://doi.org/10.1038/nature13462, 2014a.
Zhao, L., Lee, X., Smith, R. B., and Oleson, K.: Strong contributions of local background climate to urban heat islands, Nature, 511, 216–219, https://doi.org/10.1038/nature13462, 2014b.
Zhu, W., Lû, A., and Jia, S.: Estimation of daily maximum and minimum air temperature using MODIS land surface temperature products, Remote Sens. Environ., 130, 62–73, https://doi.org/10.1016/j.rse.2012.10.034, 2013.