the Creative Commons Attribution 4.0 License.
the Creative Commons Attribution 4.0 License.
 | 13 Oct 2020
Which rainfall score is more informative about the performance in river discharge simulation? A comprehensive assessment on 1318 basins over Europe
Stefania Camici
Christian Massari
Luca Ciabatta
Ivan Marchesini
Luca Brocca
The global availability of satellite rainfall products (SRPs) at an increasingly high temporal and spatial resolution has made their exploitation in hydrological applications possible, especially in data-scarce regions. In this context, understanding how uncertainties transfer from SRPs to river discharge simulations, through the hydrological model, is a main research question.
SRPs' accuracy is normally characterized by comparing them with ground observations via the calculation of categorical (e.g. threat score, false alarm ratio and probability of detection) and/or continuous (e.g. bias, root mean square error, Nash–Sutcliffe index, Kling–Gupta efficiency index and correlation coefficient) performance scores. However, whether these scores are informative about the associated performance in river discharge simulations (when the SRP is used as input to a hydrological model) is an under-discussed research topic.
This study aims to relate the accuracy of different SRPs both in terms of rainfall and in terms of river discharge simulation. That is, the following research questions are addressed: is there any performance score that can be used to select the best performing rainfall product for river discharge simulation? Are multiple scores needed? And, which are these scores? To answer these questions, three SRPs, namely the Tropical Rainfall Measurement Mission (TRRM) Multi-satellite Precipitation Analysis (TMPA), the Climate Prediction Center MORPHing (CMORPH) algorithm and the SM2RAIN algorithm applied to the Advanced SCATterometer (ASCAT) soil moisture product (SM2RAIN–ASCAT) have been used as input into a lumped hydrologic model, “Modello Idrologico Semi-Distribuito in continuo” (MISDc), for 1318 basins over Europe with different physiographic characteristics.
Results suggest that, among the continuous scores, the correlation coefficient and Kling–Gupta efficiency index are not reliable indices to select the best performing rainfall product for hydrological modelling, whereas bias and root mean square error seem more appropriate. In particular, by constraining the relative bias to absolute values lower than 0.2 and the relative root mean square error to values lower than 2, good hydrological performances (Kling–Gupta efficiency index on river discharge greater than 0.5) are ensured for almost 75 % of the basins fulfilling these criteria. Conversely, the categorical scores have not provided suitable information for addressing the SRP selection for hydrological modelling.
- Article
(7123 KB) - Full-text XML
-
Supplement
(1019 KB) - BibTeX
- EndNote


An accurate rainfall estimate is essential in many fields spanning from climate change research and weather prediction to hydrological applications (Tapiador et al., 2017; Ricciardelli et al., 2018; Lu et al., 2018). In particular, the delivery of real-time rainfall observations is one of the most challenging tasks in operational flood forecasting, both for technical reasons related to the need for a prompt release of the observations and for scientific motives linked to the necessity for sufficient accuracy to ensure that a reliable forecasting is provided. Generally, rainfall observations are obtained through real-time ground monitoring networks (e.g. Artan et al., 2007), meteorological and numerical weather prediction models (e.g, Montani et al., 2011; Zappa et al., 2008) and, more recently, satellite observations (Mugnai et al., 2013) that, albeit with some difficulties (Maggioni and Massari, 2018), are becoming a potential alternative to the classical rainfall monitoring methods thanks to their global availability and increasing accuracy.
The global availability of near-real-time satellite rainfall products (SRPs) has boosted their use for hydrological applications, specifically for river discharge estimation via rainfall–runoff models (Casse et al., 2015; Elgamal et al., 2017; Camici et al., 2018; Beck et al., 2017; see Maggioni and Massari, 2018, and Jiang and Wang, 2019, for a more complete review). In particular, in the past decade special attention has been paid to the propagation of the satellite rainfall error in flood simulations (Hong et al., 2006; Hossain and Anagnostou, 2006; Pan et al., 2010; Maggioni et al., 2013; Thiemig et al., 2013; Ehsan Bhuiyan et al., 2019), and two approaches, one probabilistic and one statistical, can be recognized (Quintero et al., 2016). In the probabilistic approach, a statistical model is first used to produce an ensemble of possible rainfall realizations. Then, each rainfall realization is used to simulate a river discharge time series through a hydrological model, and the difference between simulated and observed in situ discharge data is used to assess how rainfall accuracy transfers to the flood simulation (e.g. Hong et al., 2006; Hossain and Anagnostou, 2006; Demaria et al., 2014; Maggioni et al., 2013, 2011). In the deterministic approach, SRPs are first compared with a reference data set to assess the accuracy in terms of rainfall estimate. Then, SRPs are used as input in rainfall–runoff models to estimate river discharge that is then compared with in situ discharge observations. Eventually, the existence and the shape of the relationship between the SRP accuracy and the associated discharge score is analysed (e.g, Serpetzoglou et al., 2010; Pan et al., 2010; Thiemig et al., 2013; Chintalapudi et al., 2014; Pakoksung and Takagi, 2016; Shah and Mishra, 2016; Qi et al., 2016; Ren et al., 2018; Ehsan Bhuiyan et al., 2019).
In both approaches, several continuous (e.g. bias; root mean square error – RMSE; correlation coefficient – R; Nash–Sutcliffe efficiency index – NSE; and Kling–Gupta efficiency index – KGE) and categorical (e.g. probability of detection – POD; false alarm ratio – FAR; and threat score – TS) performance scores are used to characterize the accuracy in terms of rainfall and river discharge. Generally, this comparison has been carried out for few basins (e.g. Hong et al., 2006; Pan et al., 2010; Demaria et al., 2014; Chintalapudi et al., 2014; Qi et al., 2016; Ren et al., 2018; Thiemig et al., 2013), rarely at a regional scale (e.g. Ehsan Bhuiyan et al., 2019), whereas no studies investigated the hydrological propagation of SRP error at a continental scale. In Beck et al. (2017), the authors carried out an evaluation of multiple (22) global daily rainfall data sets, both in terms of rainfall and river discharge for many (+9000) basins across the globe; however, the relationship between the accuracy, in terms of rainfall and river discharge, was not investigated in detail.
From the analysis of both the probabilistic and the statistical approaches arises the fact that the hydrological performances of SRPs depend on a complex interaction among the characteristics of the input data (i.e. precipitation type, seasonality, data resolution or time window considered; see e.g. Ebert et al., 2007; Vergara et al., 2014; Satgé et al., 2019), the hydrological model formulation (i.e. parameter estimation and modelled processes; Quintero et al., 2016; Mei et al., 2017; Ehsan Bhuiyan et al., 2019), the characteristics of the basin (e.g. area and initial soil moisture conditions, land use and land cover; Yong et al., 2010; Yilmaz et al., 2005; Nikolopoulos et al., 2010; Mei et al., 2016; Shah and Mishra, 2016; Gebregiorgis et al., 2012), and observations (i.e. streamflow data; see e.g. Nikolopoulos et al., 2012). In this context, it is not trivial to have general guidelines about which SRPs should be favoured or which performance score(s) should be used to identify the best performing rainfall product for river discharge estimation (Qi et al., 2016; Hossain and Huffman, 2008). The only largely accepted suggestion is about SRP bias, recognized as a major issue for a reliable flood forecast across several basins around the world (Maggioni et al., 2013; Thiemig et al., 2013; Shah and Mishra 2016; Jiang and Wang, 2019). Based on that, bias correction methods have shown to significantly reduce streamflow errors (e. g, Yilmaz et al., 2005; Bitew and Gebremichael, 2011; Valdés-Pineda et al., 2016). For instance, by using the MIKE SHE model on a small and mountainous basin in the Blue Nile basin, Bitew and Gebremichael (2011) stated that large biases in satellite rainfall directly translate into bias in one or more of the hydrology simulation components. Zhu et al. (2016) found that, for two humid basins in China, the accuracy in flood simulations is related to the mean error and to bias in the rainfall estimates, as also found by Yilmaz et al. (2005). Besides bias, it is difficult to find studies advising on rainfall error metrics that are able to indicate river discharge simulation performances. The work of Bisselink et al. (2016), even if conducted over only four basins in southern Africa, is an exception. The authors, by using different SRPs as input to the LISFLOOD model, proved that a high correlation between monthly rainfall and observed streamflow is a needed prerequisite to obtain good hydrological performances, as long as the rainfall variability in time is not too high.
Based on that, there is a need to investigate metrics that can more effectively advance the use of SRPs for hydrological applications and, specifically, for river discharge modelling at regional scales. This paper aims to explore the link between satellite rainfall accuracy of different products and their river discharge modelling performance. The following research questions are addressed: is there any performance score that can be used to select the best performing rainfall product for river discharge simulation? Are multiple scores needed? And, which are these scores? Are R and RMSE, generally used to characterize the rainfall accuracy, informative about the hydrological modelling performance? How small or large should these rainfall scores be to obtain good performances in river discharge simulations, i.e. KGE on discharge greater than 0.5?
In pursuing this goal, three different near-real-time SRPs, i.e. Tropical Rainfall Measurement Mission (TRMM) Multi-satellite Precipitation Analysis (TMPA) real-time product (TMPA 3B42RT; Huffman et al., 2010), the Climate Prediction Center (CPC) MORPHing technique (CMORPH; Joyce et al., 2004) and SM2RAIN–ASCAT rainfall product (Brocca et al., 2019a) obtained by applying the SM2RAIN algorithm (Brocca et al., 2014) to the ASCAT satellite soil moisture product, are used to force a lumped hydrological model, MISDc (Brocca et al., 2011) over 1318 basins across Europe. An intercomparison of SRPs with respect to a benchmark rainfall data set, i.e. E-OBS (Haylock et al., 2008), is carried out. This step, along with the reliability assessment of the different SRPs for flood modelling over Europe, constitutes only an intermediate output of the work. The ultimate aim of the paper is to investigate how SRPs' accuracy propagates through the river discharge simulations, so as to help in the selection of the rainfall performance scores that are more informative of better hydrological performances. As the intent of the paper is to analyse the performances of near-real-time satellite rainfall products, gauge-corrected satellite or reanalysis rainfall products are not considered in this work.
The study area is composed of 1318 basins, with an area ranging in size from 200 to 136 000 km2, belonging to 23 different countries and spread over the whole of Europe, over a longitude varying from −10 to 25∘ and a latitude from 35 to 70∘ (Fig. 1a). The European continent is characterized by a complex topography ranging, from south to north, from huge mountains and hilly plateaus to a large plain. The Alpine mountain chain, crossing the continent from west to east, represents the highest and more extensive mountain range system in Europe. Hilly plateaus gently slope towards the Great European Plain, a low, flat region, extending from the Atlantic coast of France to the Urals, crossed by many rivers and with densely populated cities.
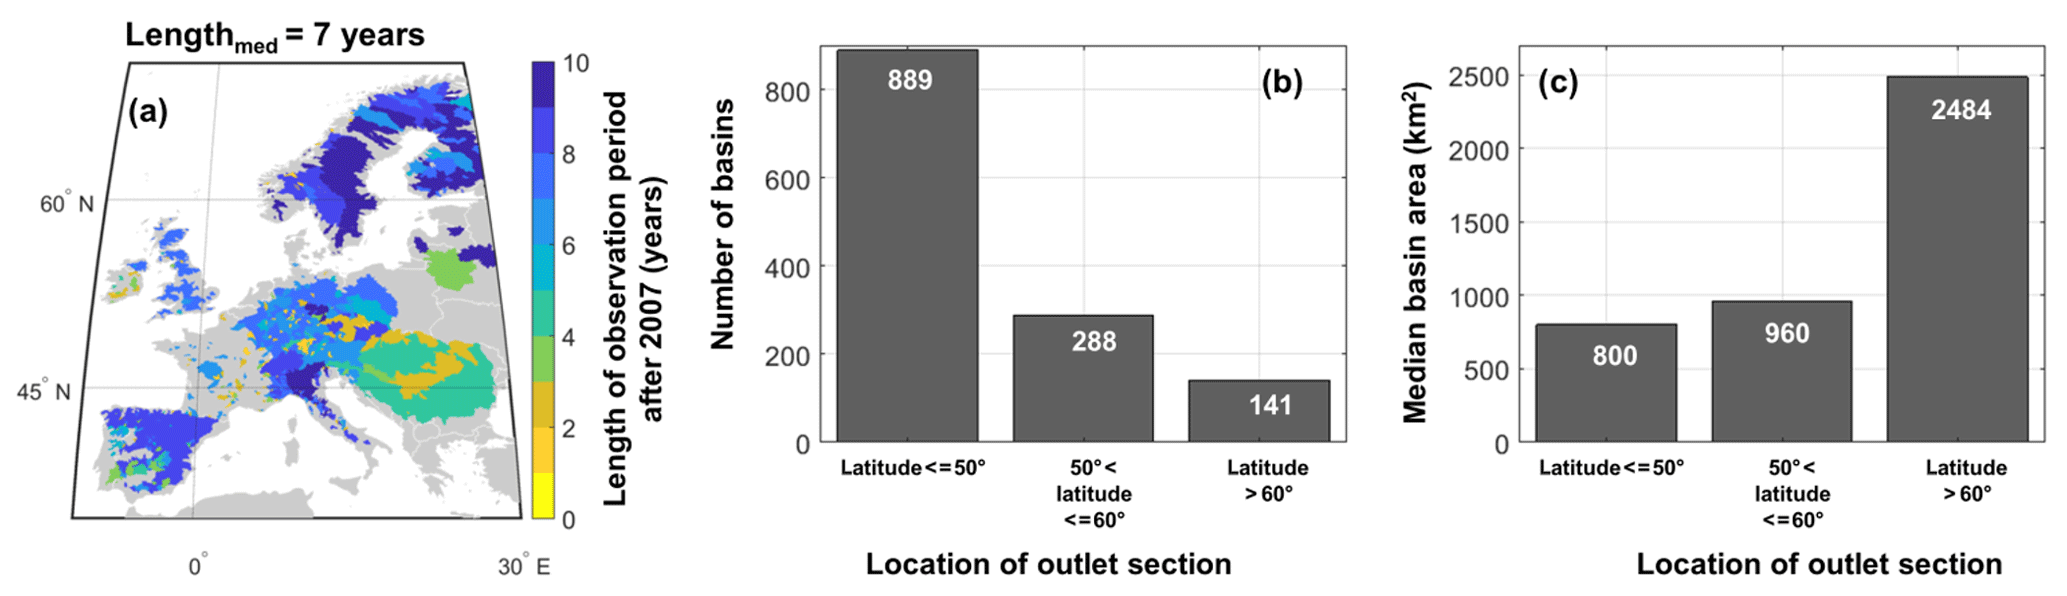
Figure 1Location of study basins and length of discharge observation period after 2007 (a). Number of basins (b) and median basin area (c) clustered according to the latitude coordinate of the outlet section of the basins.
The climate is humid continental, with cold summers in central and eastern Europe. Mean annual rainfall across Europe ranges between 300 and 4000 mm yr−1, depending on the location. The north Atlantic coast of Spain, the Alps and Balkan Mediterranean countries generally receive higher rainfall amounts, while along the western edges of the Mediterranean Sea, in northern Europe and in northern Scandinavia, lighter rainfall is common. In terms of floods, their occurrence ranges from spring to summer, moving from northeastern Europe towards the Alps, whereas the Mediterranean region and western Europe are prevailingly subject to winter floods (Berghuijs et al., 2019).
The main features of the study basins, clustered according to the latitude of the outlet section, are illustrated in Fig. 1b and c. Among the 1318 basins, more than half (889) have the outlet section located below the 50∘ latitude, and for about 11 % of them, the outlet section is placed above 60∘ latitude. The median area of the basins located below 50∘ is lower than one of the basins located in the northern part of Europe (above 50∘ latitude). By considering these features, the selected set of basins can be considered a comprehensive sample of the European basin characteristics.
The data sets used in this study include both ground observations and satellite rainfall products (Table 1).
Table 1Main characteristics of the data sets used in this study.

3.1 Ground observations
Ground observations comprise rainfall, air temperature and river discharge data. Rainfall and air temperature are extracted from the European high-resolution gridded data sets, version 17.0 (E-OBS, https://www.ecad.eu/download/ensembles/download.php#datafiles, last access: 2 October 2020; Haylock et al., 2008), currently maintained by the Copernicus Climate Change Service. The E-OBS data set is built by using data from nearly 9618 stations (i.e. equivalent on average to a density of 1 station every 1000 km2), but the station density significantly varies across Europe (see Haylock et al., 2008; Cornes et al., 2018). For some regions, the station density is sufficiently low enough to expect a strong tendency for interpolated daily rainfall and temperature values to be underestimated with respect to the “true” area average of stations (Hofstra et al., 2009, 2010; Kyselý and Plavcová, 2010). As the smoothing is greatest for higher percentiles, an underestimation of peak floods is expected if E-OBS rainfall data are used for rainfall–runoff modelling, above all for basins with areas lower than 1000 km2 (Hofstra et al., 2010). However, as this product is comprised by time series thoroughly checked, both in terms of quality and homogeneity (Klok and Tank, 2009), and it is continuously available from 1950 up to now at a daily time step, it can be considered a good benchmark for the analysis of long rainfall time series.
Daily river discharge data are obtained through a European daily data set, compiled by the authors, merging stations from five different databases, namely the Global Runoff Data Base (GRDC, https://www.bafg.de/GRDC/EN/Home/homepage_node.html, last access: 2 October 2020), the European Water Archive (EWA, https://www.bafg.de/GRDC/EN/04_spcldtbss/42_EWA/ewa.html?nn=201574, last access: 2 October 2020), the Italian National Institute for Environmental Protection and Research (ISPRA) HIS national database (http://www.hiscentral.isprambiente.gov.it/hiscentral/default.aspx, last access: 2 October 2020), the Portuguese national database (http://snirh.pt/, last access: 2 October 2020), and the Spanish national database (http://ceh-flumen64.cedex.es/anuarioaforos/default.asp, last access: 2 October 2020). From the resulting European data set, composed of 3913 quality checked stations covering the period 1900–2016, 1318 stations with available observations after 2007 (according the availability of SRPs; see Sect. 3.2) have been extracted.
To ensure the quality of discharge observations, the following steps have been followed: (1) a visual inspection of the hydrograph, which is probably the most thorough method (Crochemore et al., 2020), (2) a check on data availability, (3) a check on the presence of outliers and (4) a check the presence of inhomogeneities. Only stations with less than 20 % of missing data in 1 year, showing no inhomogeneities in the time series, were retained in the compiled European data set. The time series were also checked against the presence of anomalous values (i.e. values greater than five times the standard deviation), which were flagged as outliers.
The authors, using the EU digital elevation model (EU-DEM; Mouratidis and Ampatzidis, 2019) resampled at 100 m ground resolution, developed an automatic and rapid procedure to delineate the drainage watersheds located upstream of each discharge measurement location (outlet section). The procedure is based on the following steps: (i) we select cells having a contributing area larger than or equal to 4 km2 over the entire study area; (ii) we move the discharge measurement locations from the coordinates reported in the original metadata to the closest cells of the river network; and (iii) we delineate the catchments. Adopting the method used by Do et al. (2018), we evaluated the quality of the products, comparing the area of the delineated catchment (Ad) with that available from the original metadata (Am). The absolute percentage difference (Dp) was calculated according to the following formula Dp = (Ad − Am) ∕ Ad × 100. The median and 75th percentile of the distribution of the Dp values were, respectively, 2.67 % and 22.07 %. We excluded, from the following hydrological simulation, catchments having Dp values larger than 50 % (less than the 20 % of the total number of catchments).
The study basins and the related observation period length after 2007 are shown in Fig. 1a. More than 50 % of the basins have an observation period longer than 7 years. Spanish, Italian and northern European basins have a nearly complete observation period (10 years), whereas, for central Europe, some stations end the monitoring period in 2012, and the median length of discharge observations is about 6–7 years (see Fig. 1a).
3.2 Satellite rainfall products
Three different SRPs have been used in this study, namely TMPA 3B42RT, CMORPH and SM2RAIN–ASCAT satellite products. As these products have been largely discussed in the literature, only a brief product description is reported in the following, whereas for major details the reader is referred to Huffman et al. (2010), Joyce et al. (2004) and Brocca et al. (2019a) for TMPA 3B42RT, CMORPH and SM2RAIN–ASCAT, respectively.
TMPA 3B42RT, provided by the National Aeronautics and Space Administration (NASA; https://disc.gsfc.nasa.gov/datasets/TRMM_3B42RT_7/summary?keywords=TMPA 3b42, last access: 2 October 2020), covers ±50∘ north–south latitude band, with a spatial sampling of 0.25∘ and a temporal resolution of 3 h from 1997 onwards.
CMORPH is provided by the Climate Prediction Center (CPC; ftp://ftp.cpc.ncep.noaa.gov/precip/global_CMORPH/3-hourly_025deg/, last access: 2 October 2020) for the latitude band from March 2000 up to now. In this study, the CMORPH raw version is extracted with a spatial and temporal resolution of 0.25∘ and 3 h.
In addition to these state-of-the-art SRPs, we used the SM2RAIN–ASCAT rainfall product (Brocca et al., 2019a) obtained through the application of the SM2RAIN algorithm (Brocca et al., 2014) to the ASCAT satellite soil moisture product (Wagner et al., 2013). SM2RAIN is an algorithm based on the concept that the soil acts as a natural rain gauge. By inverting the soil water balance equation, the algorithm allows one to estimate the accumulated rainfall from soil moisture observations. SM2RAIN–ASCAT, downloadable from https://doi.org/10.5281/zenodo.2591214 (Brocca et al., 2019b), is available for the period 2007–2019, with a 12.5 km spatial sampling and a daily temporal aggregation.
For the sake of simplicity, the TMPA 3B42RT, CMORPH and SM2RAIN–ASCAT satellite data sets are indicated in the following as TMPA, CMOR and SM2RASCAT, respectively. By considering the spatial and temporal availability of both ground-based and satellite observations (see Table 1 for a summary), the analysis has been carried out to cover the maximum common observation period, i.e. from 2007 to 2016 at daily timescales (TMPA and CMOR are aggregated at a daily scale), with three different areal masks cut (1) at the original spatial coverage of each SRP, i.e. until 50, 60 and 70∘ latitude for TMPA, CMOR and SM2RASCAT, respectively, (2) over the TMPA area (latitude <50∘) and (3) above the TMPA area (latitude >50∘).
4.1 Hydrological model
The “Modello Idrologico Semi-Distribuito in continuo” (MISDc; Brocca et al., 2011) is a two-layer continuous hydrological model characterized by a component simulating the temporal pattern of soil moisture and a rainfall–runoff transformation component for simulating river discharge time series. By using daily rainfall and air temperature data, MISDc simulates the most important processes involved in the rainfall–runoff transformation (e.g. infiltration, evapotranspiration, saturation excess and percolation). The geomorphological instantaneous unit hydrograph (IUH) is used to transfer surface and subsurface runoff to the outlet of the catchment. The model (downloadable from http://hydrology.irpi.cnr.it/download-area/midsc-code/, last access: 2 October 2020) uses nine parameters calibrated by maximizing the Kling–Gupta efficiency index (KGE; Gupta et al., 2009; Kling et al., 2012, see Sect. 4.5 for more details) between the observed and simulated river discharge.
The successful results obtained through the MISDc model for discharge simulation in many different basins (in Italy – see e.g. Brocca et al., 2011, 2013a, Massari et al., 2015, Masseroni et al., 2016, and Cislaghi et al., 2019; and in Europe – see e.g. Brocca et al., 2013b, Massari et al., 2018, and Camici et al., 2018) and for different applications (e.g. climate change impact studies; see Camici et al., 2014) allow us to consider the model suitable for the purpose of this analysis.
4.2 Experimental design
The first step of the analysis is the quality assessment of the SRPs in terms of rainfall. For that, each SRP has been compared with the daily E-OBS data used as reference. Then, river discharge simulations have been obtained by running the lumped version of MISDc with the E-OBS data set (river discharge reference) and with each SRP as input. Specifically, this involves the following:
-
The MISDc model has been calibrated over the entire 2007–2016 period by using, as input, the mean areal E-OBS rainfall and air temperature data for each basin. These simulated discharge data, QE-OBS, have been used as a benchmark to estimate the accuracy of the selected SRPs for the river discharge simulation.
-
The MISDc model has been run for each basin by using, as input, the mean areal SRPs and E-OBS air temperature data. In accordance with other literature (e.g, Thiemig et al., 2013), in these runs the model parameters are calibrated separately for each SRP. The period 2007–2012 is used for the parameter values calibration, whereas the remaining (2013–2016) period is used for the validation. QE-OBS is used as a benchmark to calibrate the parameters of the MISDc model.
The use of QE-OBS as benchmark presents three advantages as it allows one to (1) consider a common and extended analysis period for all basins, (2) consider a common benchmark in evaluating the SRP accuracy, both in terms of rainfall and in terms of river discharge, and, more importantly, (3) neglect the uncertainty due to the hydrological model structure in the SRP comparison.
4.3 Performance scores
The quality assessment of the different SRPs has been calculated by four continuous dimensionless metrics and three categorical scores. Among the continuous scores, the relative bias (rBIAS), the Pearson correlation coefficient (R), the relative root mean square error (RRMSE) and the KGE, an index increasingly used in hydrology to measure the goodness of fit between simulated and observed data, have been computed between the daily E-OBS and the satellite rainfall data averaged over the area of each basin as follows:
where SRP and Pref represent the SRPs and E-OBS rainfall time series, Cov and σ are the covariance and the standard deviation operator, respectively, and n corresponds to the length of the time series. rBIAS ranges from −∞ to +∞, R values range from −1 to 1 and RRMSE is bounded from 0 to +∞, while KGE varies from −∞ to 1. The more rBIAS, R, RRMSE and KGE values go towards 0, 1, 0 and 1, respectively, the higher the agreement between E-OBS and SRPs. In particular, for KGE, values in the range indicate that satellite rainfall data outperform the mean of the E-OBS observations (Knoben et al., 2019). In addition, for each SRP and for different rainfall thresholds, three categorical metrics are evaluated (Chen et al., 2012; Brocca et al., 2014), namely probability of detection (POD), false alarm ratio (FAR) and threat score (TS). POD reports on the capability of SRP to correctly detect rainfall events, FAR counts the fraction of rainfall events that are actually non-events and TS takes into account the correctly detected, missed rainfall events and false alarms. These categorical metrics range from 0 to 1. Higher POD and TS, along with lower FAR values, indicate a better capability of SRPs to detect rainfall events.
To evaluate the suitability of the rainfall products for river discharge modelling, the KGE index between observed and simulated river discharge data has been computed. In particular, we selected only this score for the following three main reasons. (1) Due to inherent limitations recognized for other indices (e.g. Nash–Sutcliffe efficiency index; Schaefli and Gupta, 2007; Gupta et al., 2009), KGE is today the criterion most commonly recommended and applied for evaluating the performance of hydrological models, and therefore, its use allows meaningful comparisons with other studies. (2) The purpose of the analysis was to investigate the relationship between rainfall score and river discharge simulation without a specific focus on high or low flows. In this respect, it is known that KGE assigns a relatively greater importance to discharge variability with respect to other scores (e.g. NSE or RMSE) that are generally found to be highly sensitive to high discharge values (Gupta et al., 2009). (3) It was the decision of the author, for reasons of practicality, to limit the number of investigated performance scores in order to communicate the results of the work in the most efficient way.
To distinguish between the KGE of rainfall and discharge, hereinafter the symbols KGE-P and KGE-Q will be used. Specifically, the KGE-Q index has been evaluated between the observed and simulated QE-OBS discharge and between QE-OBS and the simulated discharge data obtained, by using SRPs as input, in order to establish the hydrological performances of E-OBS and SRPs, respectively. River discharge simulations characterized by KGE-Q values in the range −0.41 and 1 can be assumed as reliable; KGE-Q values greater than 0.5 have been considered good with respect to their ability to reproduce benchmark river discharge time series (Thiemig et al., 2013).
The findings of this work for the three SRPs are presented below. The SRP quality has been evaluated first in terms of rainfall and then in terms of river discharge, and finally, the propagation of the rainfall error into the river discharge simulation has been investigated.
5.1 Rainfall assessment
The performances of the three SRPs against the E-OBS data sets are illustrated in Fig. 2. For the sake of brevity, the SRP performances are presented only for the validation period (2013–2016), but similar findings are obtained in the calibration period (see Table 2). Specifically, rBIAS, R, RRMSE and KGE-P values are illustrated in Fig. 2 for each study basin and for the three products of TMPA, CMOR and SM2RASCAT. At the top of each panel, the median score value is reported by considering the original spatial coverage of each SRP, whereas in Table 2 the performances of the basins whose outlet section is located below or above 50∘ latitude, i.e. over or above the TMPA coverage, are listed. From a first glance at Fig. 2 it is possible to note that the three products show similar patterns in terms of R (Fig. 2d–f) and RRMSE (Fig. 2g–i), whereas the same does not hold for the rBIAS (Fig. 2a–c) and KGE-P (Fig. 2l–n). The rBIAS is small for TMPA and SM2RASCAT, with median values equal to −0.127 and 0.047, respectively, whereas CMOR shows a clear underestimation of the daily rainfall data over the entire European area. Higher and lower R/RRMSE values are obtained in central Europe; the opposite is observed in the Mediterranean area. In terms of KGE-P, TMPA presents higher values, with respect to the other two products, over all the basins whose outlet section is located between 40 and 50∘ latitude. The median KGE-P value for TMPA is equal to 0.516; this value reduces by about 24 % and 42 % for SM2RASCAT and CMOR, respectively. The median rBIAS, R, RRMSE and KGE-P rainfall score values for the three products remain approximately the same if the analysis is focused on the TMPA area (see Table 2).
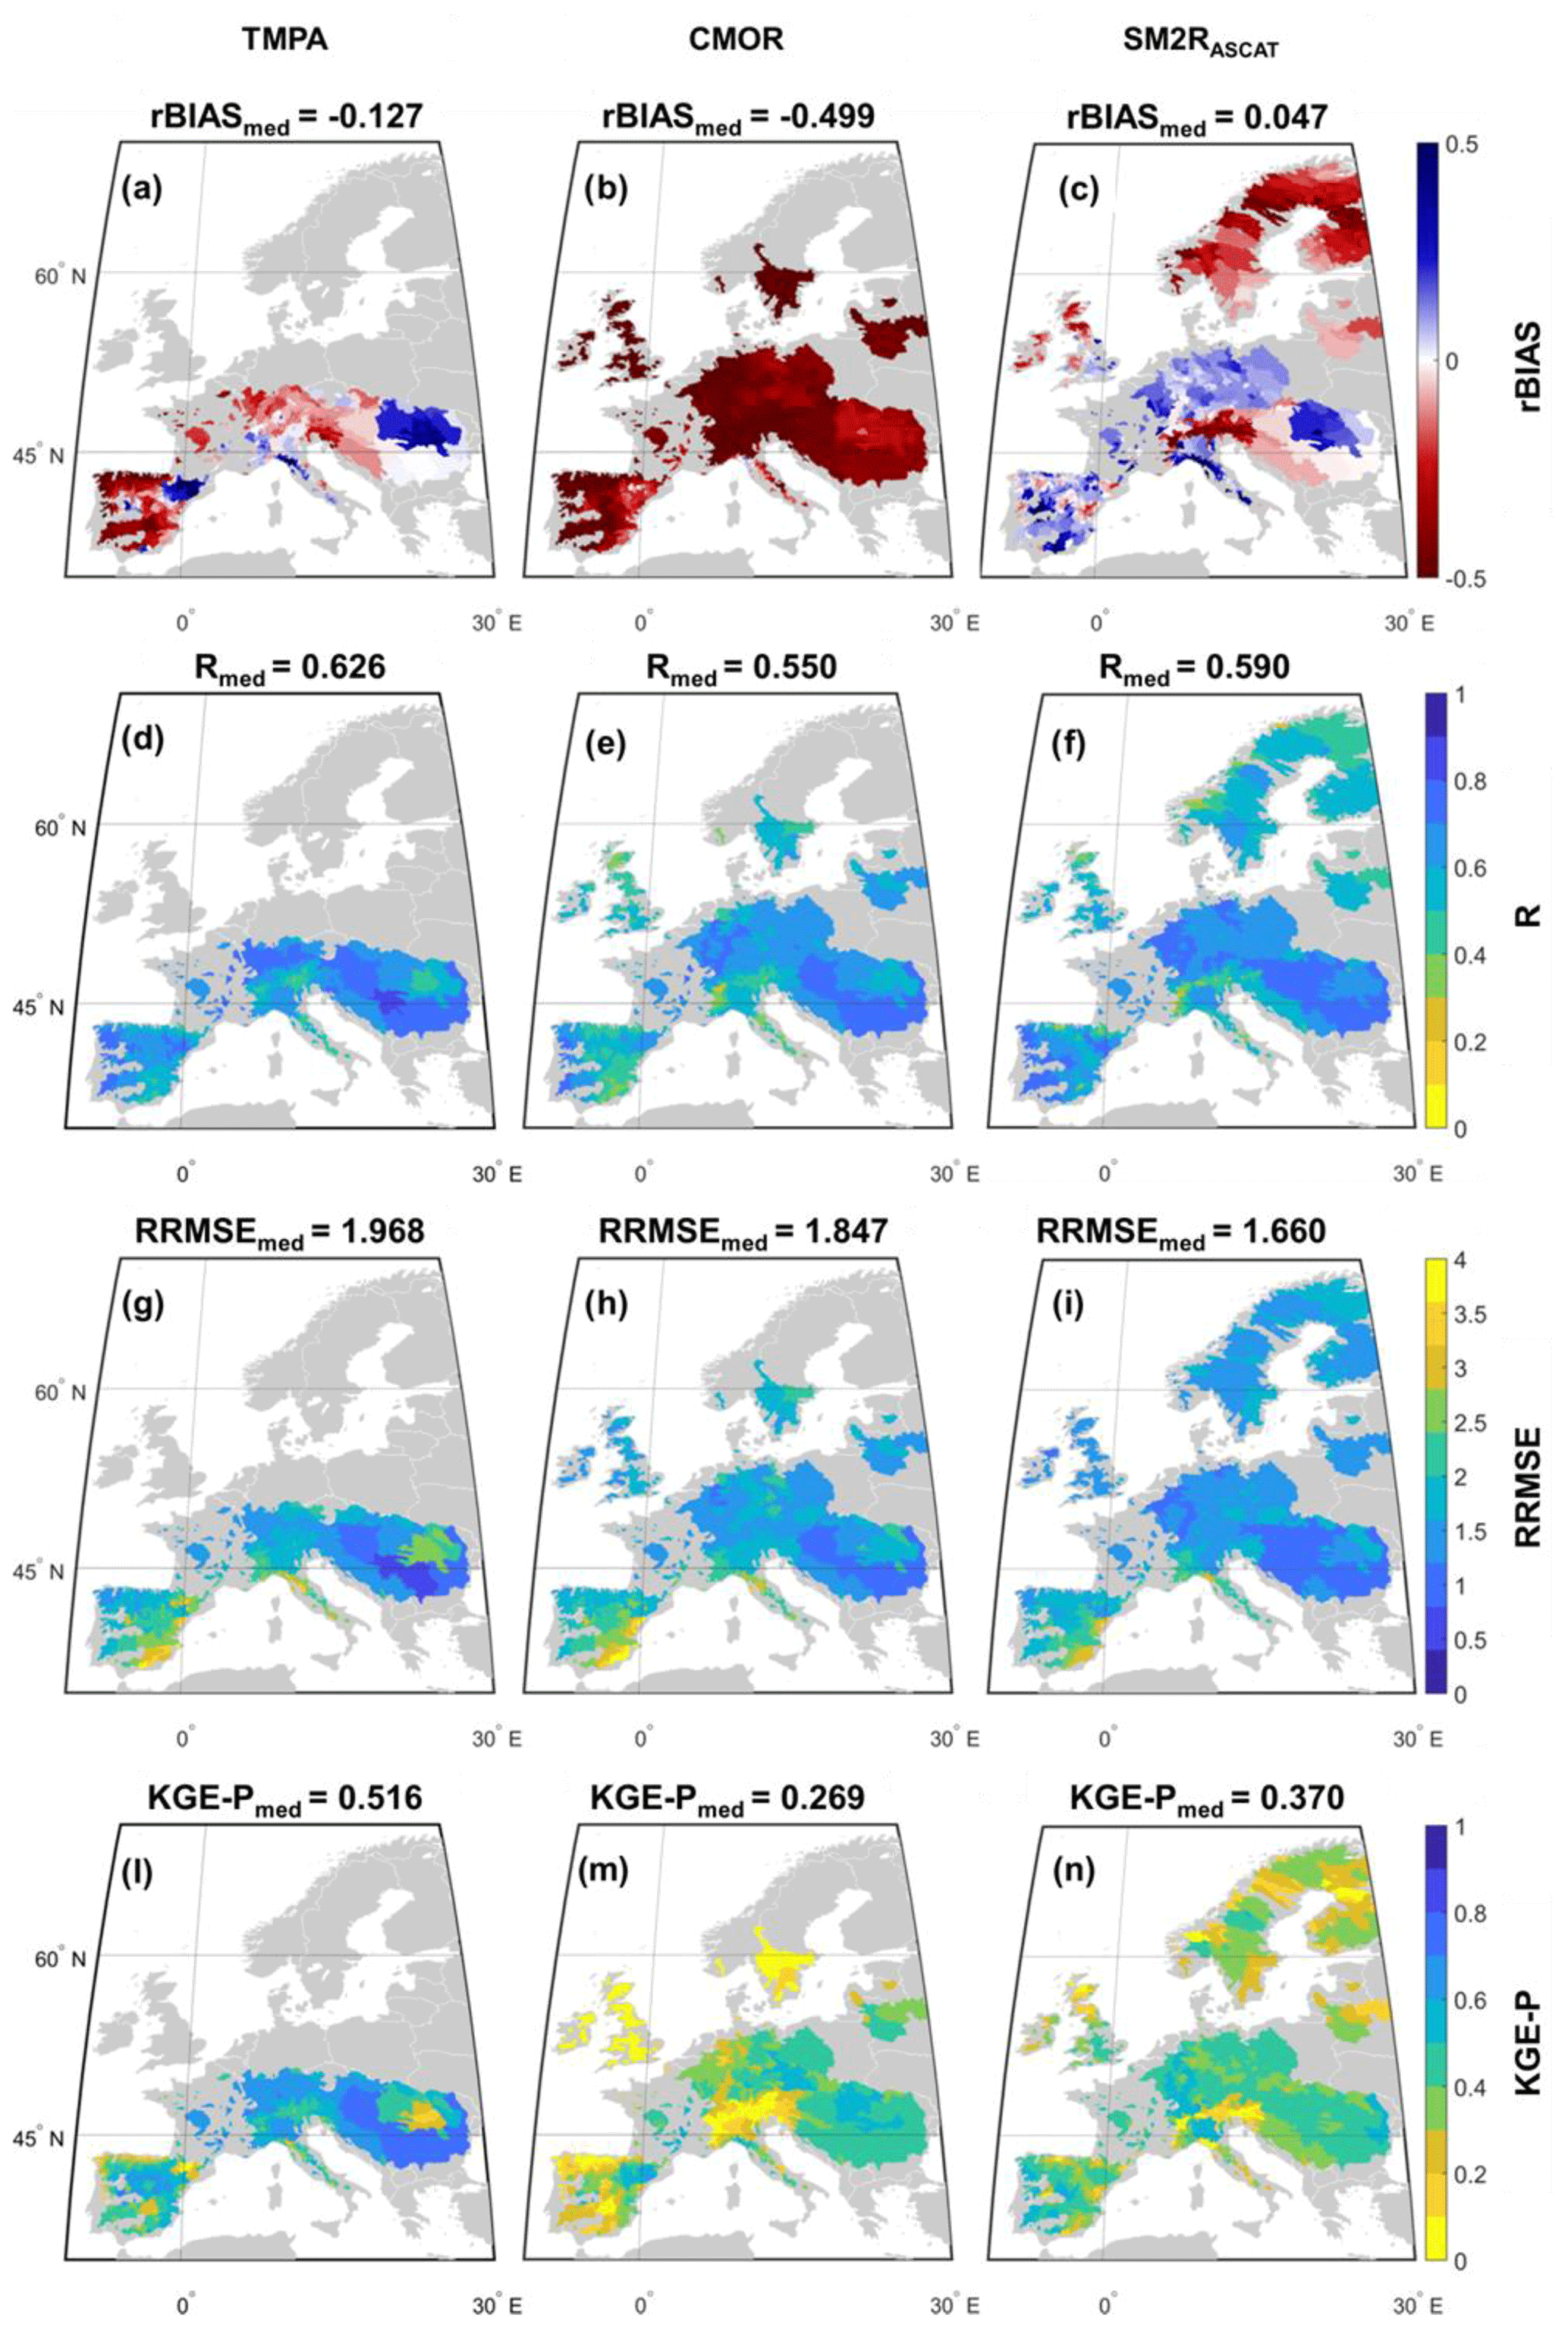
Figure 2Performances of satellite rainfall during the validation period in terms of rBIAS (a, b, c), R (d, e, f), RRMSE (g, h, i) and KGE-P (l, m, n) over the study basins for the three products of TMPA (first column), CMOR (second column) and SM2RASCAT (third column). The numbers in each plot represent the median score value obtained by considering the original spatial coverage of each product.
Table 2Performance scores for rainfall (in terms of rBIAS, R, RRMSE and KGE-P) time series computed during the calibration (in italics) and the validation periods. Rainfall performances are evaluated with respect to E-OBS rainfall data and distinguished between basins whose outlet section is below or above 50∘ latitude. It has to be noted that the more rBIAS, R, RRMSE and KGE-P values go toward 0, 1, 0 and 1, respectively, the higher the agreement between E-OBS and SRPs.
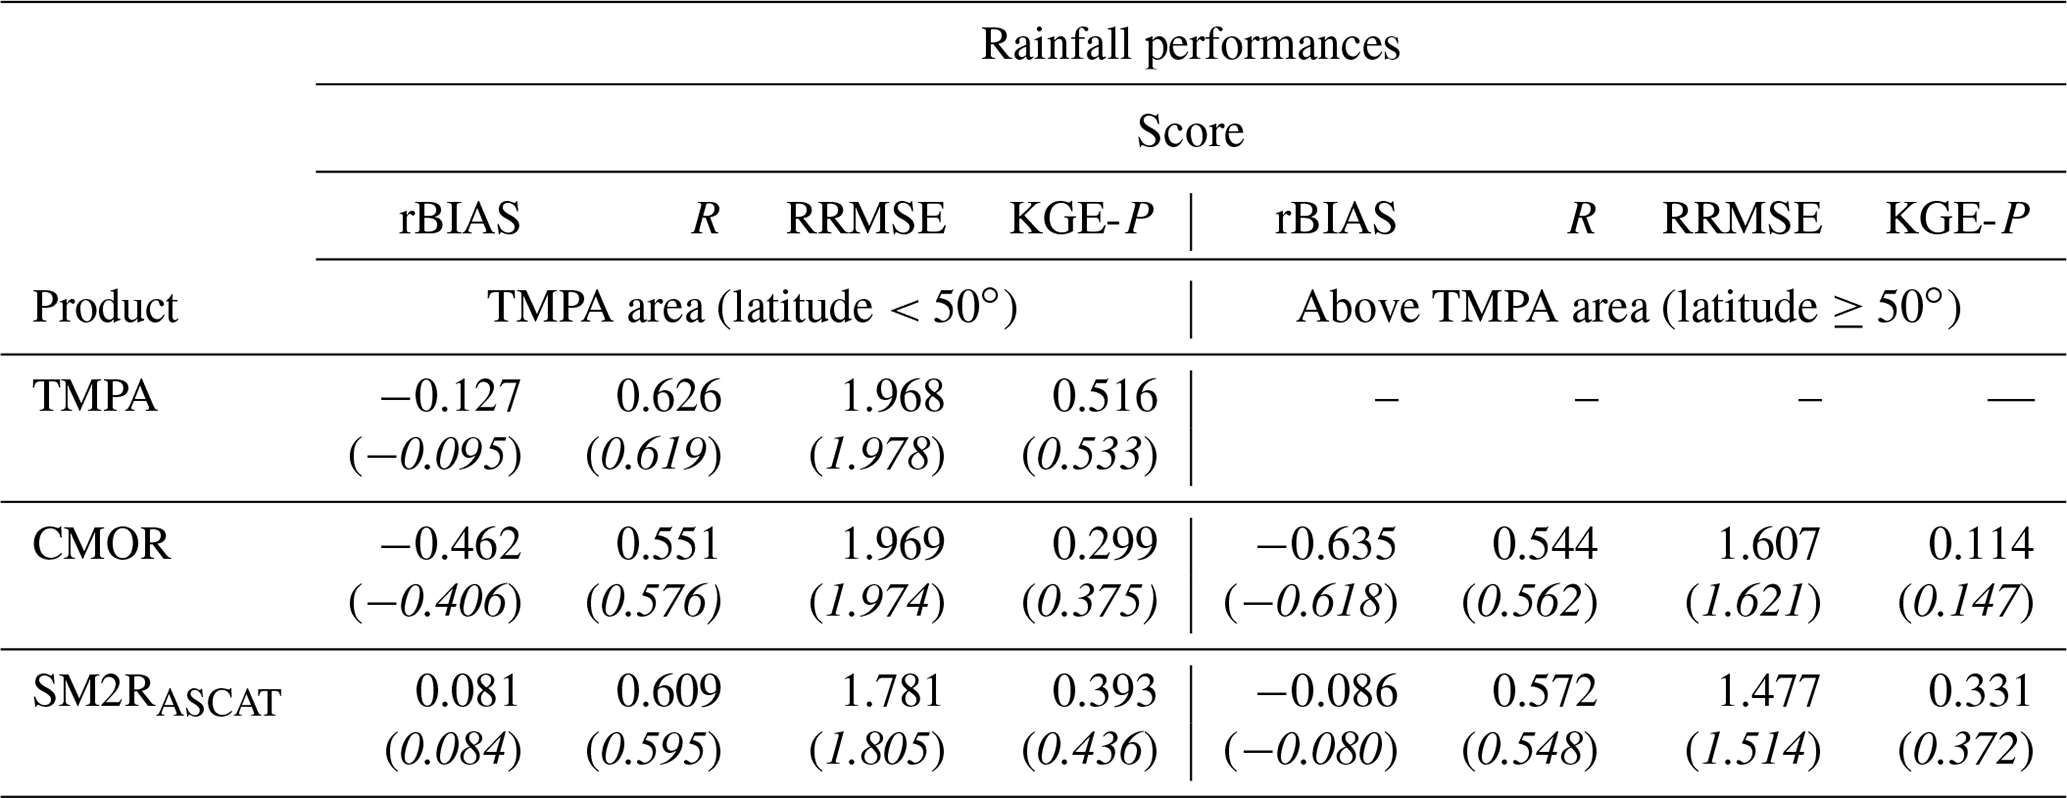
Outside the TMPA area and until a 60∘ latitude, CMOR and SM2RASCAT show quite similar performances in terms of R and RRMSE, while SM2RASCAT outperforms CMOR in terms of rBIAS and KGE-P. Due to soil freezing and snow presence, the performances of SM2RASCAT decrease in terms of R, rBIAS and KGE-P when moving towards northern Europe (Brocca et al., 2019a).
Results in terms of categorical metrics are summarized in Fig. S1 in the Supplement, where POD (first row), FAR (second row) and TS (third row) have been computed for the validation period for three rainfall thresholds (0.5, 5 and 10 mm d−1) in order to assess the capability of SRPs to detect low to high rainfall events. The numbers at the top of each panel represent the median score value obtained by considering the original spatial coverage of each product. For all three metrics and for the moderate to heavy rainfall events, TMPA presents the highest values of POD (median values equal to 0.500/0.415 for moderate or high events) and TS (median values equal to 0.368/0.288 for moderate or high events), outperforming the other two products. Conversely, SM2RASCAT shows a higher ability to detect small and moderate rainfall events, with performances in terms of TS being slightly lower than the ones of the TMPA product.
5.2 Discharge assessment
Prior to assessing the hydrological performances of the satellite rainfall data, the MISDc model was run with the E-OBS rainfall data as input to obtain QE-OBS, the benchmark river discharge data. The results of this calibration, carried out for the entire observation period (2007–2016), are good, as illustrated in Fig. 3a. For all the analysed basins, the KGE-Q values are greater than −0.41, i.e. the model improves upon the mean flow benchmark, and the median KGE-Q value obtained for the European area is equal to 0.768 (0.770 over the TMPA area). In addition, to explore the impact of the density of E-OBS rainfall on smaller basins (area <1000 km2), the relationship between basin area and KGE-Q has been investigated (not shown). As no relationship was found, and considering that the purpose of the study is to investigate the performances between rainfall and discharge time series (without a specific focus on high or low flows), the limitations of the E-OBS station density can be assumed to have a negligible impact on the analysis results, and the QE-OBS data can be assumed to be a good benchmark for the successive analysis. Hereinafter, the hydrological performance has been assessed in terms of KGE-Q with respect to QE-OBS, with values higher than 0.5 considered as being good.

Figure 3Maps of the KGE-Q index obtained by considering (a) E-OBS, (b) TMPA, (c) CMOR and (d) SM2RASCAT rainfall data sets. For E-OBS, the KGE-Q index has been obtained by comparing observed against modelled discharge data over the period 2007–2016. Modelled discharge data have been obtained by using the E-OBS rainfall data set as input to the MISDc model. For the satellite data, KGE-Q refers to the validation period (2013–2016). In panels (a), (b), (c) and (d), the median KGE value averaged over the original product coverage is reported.
Depending on the product, SRPs show different hydrological performances, as illustrated in Fig. 3b–d for the validation period and in Table 3 for both the calibration and the validation periods. At the top of each panel in Fig. 3 the median KGE-Q value, averaged over the spatial coverage of each product, is reported, whereas in Table 3 the performances of the basins whose outlet section is located below or above 50∘ latitude are listed. In addition, in Table 3 the percentage of basins showing KGE-Q values higher than 0.5 is computed.
Table 3Median KGE-Q index computed by comparing QE-OBS simulated data against simulated discharge data obtained by forcing the MISDc hydrological model with satellite (TMPA, CMOR and SM2RASCAT) rainfall data. The percentage of the basins showing KGE-Q values higher than 0.5 is also listed. Performances and percentages are averaged over different spatial windows, i.e. the original spatial coverage of the product and over or above the TMPA area (latitude ±50∘). Note: Cal – calibration period; Val – validation period.
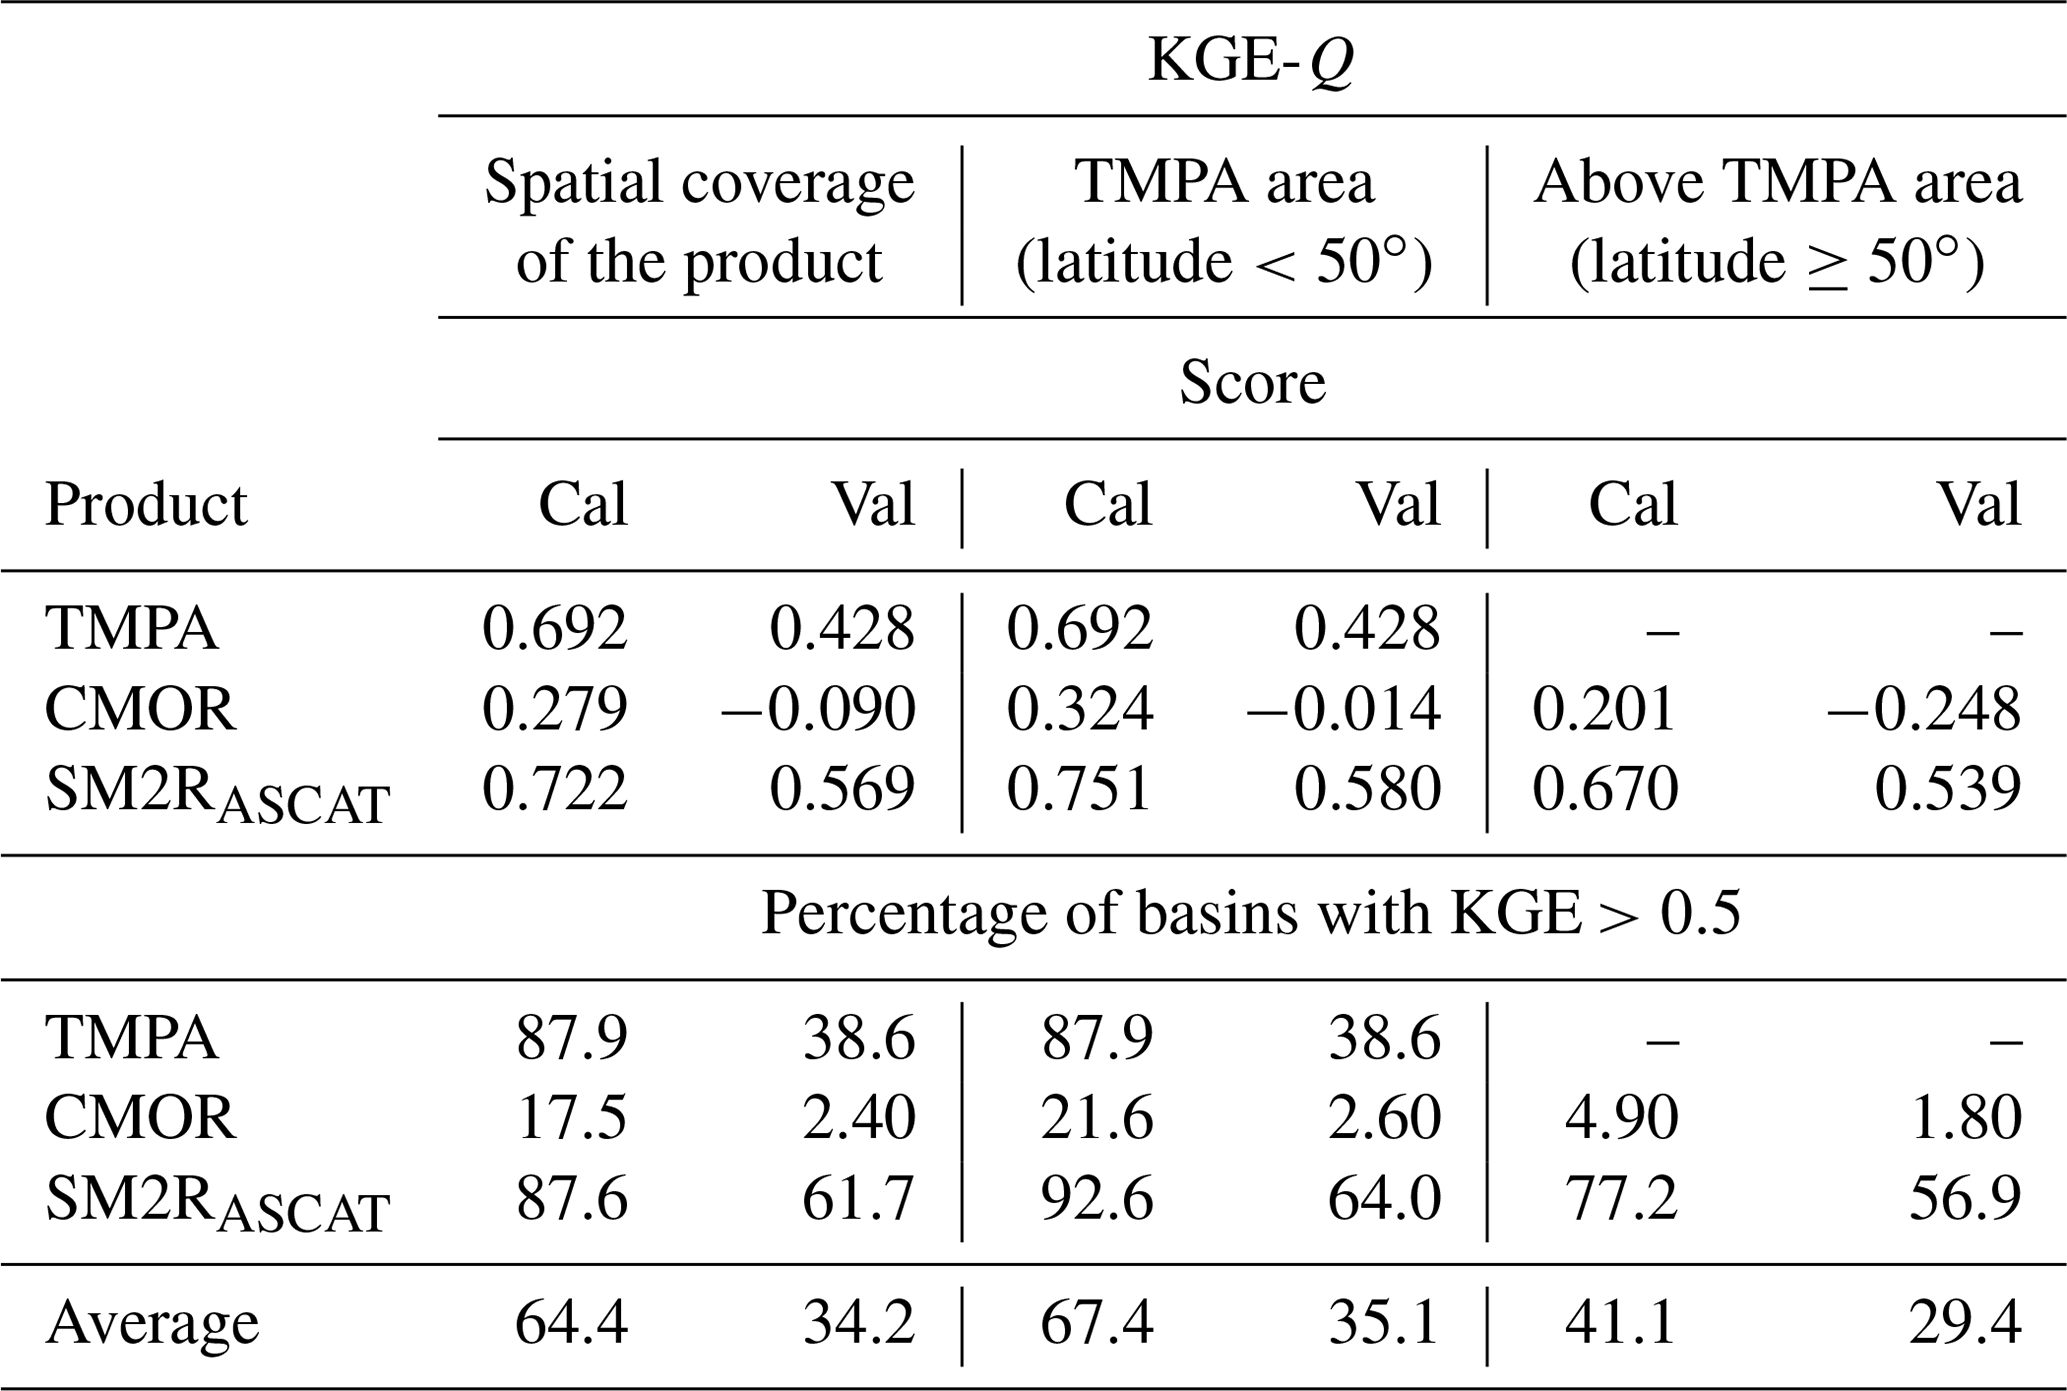
By averaging the performances over the spatial coverage of each product, median KGE-Q values range from 0.279 to 0.722 for CMOR and SM2RASCAT, respectively, in the calibration period and from −0.090 to 0.569 for the same products in the validation period (Fig. 3b–d). The percentage of the basins showing KGE-Q values higher than 0.5 is 18 % and 88 % for CMOR and SM2RASCAT, respectively, whereas the same percentage drop in the validation period, up to about 2 % and 62 %, is seen for the same products. TMPA is in the middle between the two products in terms of performances. The percentage of basins with good hydrological performances is similar to that of SM2RASCAT.
Similar findings hold if the comparison is carried out over the TMPA area (see Table 3). Poor results are obtained by CMOR during the validation period (median KGE-Q<0; only 2.6 % show KGE-Q higher than 0.5), whereas SM2RASCAT outperforms TMPA in both periods. In particular, during the validation period a median KGE-Q value equal to 0.580 is obtained for SM2RASCAT against a value equal to 0.428 for TMPA. Moreover, by comparing SM2RASCAT against TMPA in terms of basins with KGE-Q greater than 0.5, the ratio is nearly two to one, i.e. 64 % of basins show good hydrological performances when forced with SM2RASCAT with respect to 39 % for TMPA. The lowest performances for both products are obtained over southern Spain and northern Italy. Conversely, the basins located over northern Spain and central Europe show a better agreement with respect to QE-OBS benchmark data, above all when SM2RASCAT is used as rainfall input. The performances of SM2RASCAT also remain good when the analysis is extended above the TMPA area, with a median KGE-Q higher than 0.5 (Table 3). This is the first notable result of the paper; i.e. among the SRPs available in near real time, there are some products that can be profitably used to force a hydrological model to obtain reliable river discharge data over Europe. However, some questions raised in the introduction are still unsolved, i.e. if there is any link between rainfall and river discharge performances and if it is possible to find a rainfall score to select a priori the best SRP to obtain reliable river discharge simulations. The answer to these questions is given in the next paragraph, where the rainfall performances are compared with the river discharge performances.
5.3 Rainfall vs. river discharge performances: is there any link between them?
By comparing the patterns of Fig. 2 against the patterns of Fig. 3b–d, some insights about the link between the rainfall accuracy and the hydrological performance can be noted. The basins with the highest RRMSE (e.g. in the Mediterranean area and, in particular, in southern Spain and northern Italy) correspond to basins with poorer hydrological performances (KGE-Q<0.4). In addition, as for the CMOR product, high rBIAS values (both negative or positive) produce negative KGE-Q values. Interestingly, R and KGE-P rainfall scores seem to be weakly linked to the hydrological performances. Finally, no clear link can be highlighted between KGE-Q and the rainfall categorical scores as, for instance, the low or high values of SM2RASCAT in terms of TS and FAR do not explain the higher performances of this product in terms of discharge (compare Fig. 3 to Fig. S1).

Figure 4Performances of discharge in terms of KGE (KGE-Q) against (a) relative rainfall bias – rBIAS; (b) rainfall correlation – R; (c) relative root mean square error of rainfall – RRMSE; and (d) KGE-P. The scores are evaluated for the validation period (2013–2016) for all the 1318 basins.
To better investigate these relationships, the scatter plots of Figs. 4 and S2 have been constructed for the continuous and categorical scores, respectively. For each basin and for each SRP, the rainfall scores (x axis) are plotted against the KGE-Q values (y axis), resulting in a large ensemble of points spread out in the full range of rainfall or discharge scores without any apparent relationship. The unique result in Fig. 4 is that CMOR shows higher absolute values of rBIAS and lower KGE-P values with respect to the other two products; rBIAS of SM2RASCAT varies near zero and, in terms of RRMSE, SM2RASCAT is characterized by a reduced range of variability (i.e. most of the SM2RASCAT data are characterized by RRMSE ranging from 1.5 and 2.5) with respect to the other two products. By looking at the categorical scores (Fig. S2), the three products show a similar variability range for moderate to high rainfall events, whereas some differences are evident for low rainfall events that, however, should have a minor impact on river discharge modelling. In particular, SM2RASCAT tend to have higher POD values for a rainfall threshold equal to 0.5, due to the tendency of the product to overestimate the rainfall occurrence (Brocca et al., 2019a).
To extract useful information from Figs. 4 and S2, the scores obtained separately for each product have been grouped, and the KGE-Q data points have been binned into uniform ranges (with step 0.1) of rainfall scores. The median KGE-Q and the 25th and 75th percentiles of KGE-Q values have been computed for each rainfall score within each bin. The white dots in Figs. 4 and S2 represent, for each bin of each rainfall score, the median KGE-Q value; the two ends of the black lines in the same figure represent the 25th and 75th percentile of the KGE-Q data points. By looking at the boxplots so obtained, some insights, already anticipated by inspecting Fig. 2 vs. Fig. 3 for the continuous scores, can be confirmed. The SRP hydrological performances decrease by increasing the absolute value of rBIAS, |rBIAS| and the RRMSE values (higher |rBIAS| and RRMSE values indicate lower rainfall performances; Fig. 4a and c), whereas KGE-Q increases with R and KGE-P (higher R and KGE-P values indicate higher rainfall performances; Fig. 4b and d). If these relationships have reflected the expectations, the same did not occur for all the categorical scores and rainfall events investigated here. Indeed, it has been found that higher (i.e. better) POD and TS scores lead to a better performance, whereas the relationships between KGE-Q and the FAR for small and moderate rainfall are different (i.e. inverse) from what can be expected. This could be due to the lowest impact of small or moderate rainfall events on flood generation. Then, focusing the attention only on high rainfall events, it seems that KGE-Q slightly increase with POD, whereas a stronger link can be noted between KGE-Q and TS or FAR.
The findings obtained so far become even more interesting if the following question is posed: for which values of rainfall scores is it possible to obtain good results in terms of river discharge simulation (i.e. KGE-Q>0.5)? The straight grey line in Fig. 4 (and Fig. S2), drawn for a threshold value of KGE-Q equal to 0.5, helps us to answer the question by suggesting that good hydrological performances can be obtained for SRPs characterized by rBIAS values close to 0 and small RRMSE scores, i.e. for good rainfall data. Conversely, R and KGE-P seem to have a smaller impact on KGE-Q than for a large range of R and KGE-P values (from 0.5 to 0.8 and from 0.4 to 0.8, respectively), so it is possible to obtain high KGE-Q values. Similar conclusions hold for the categorical scores evaluated for heavy rainfall events. It can be noted that the higher capability of SRPs to detect rainfall events does not affect the hydrological performances, i.e. it is possible to obtain KGE-Q higher than 0.5 for a large range of POD, FAR and TS values. Finally, a last point has to be addressed to fulfil the purpose of the paper. It has to be determined how small or large the rainfall scores should be to obtain good hydrological performances, i.e. KGE-Q greater than 0.5. In particular, a range of variability for rBIAS and RRMSE that seems to have a stronger link with the hydrological performances should be defined.
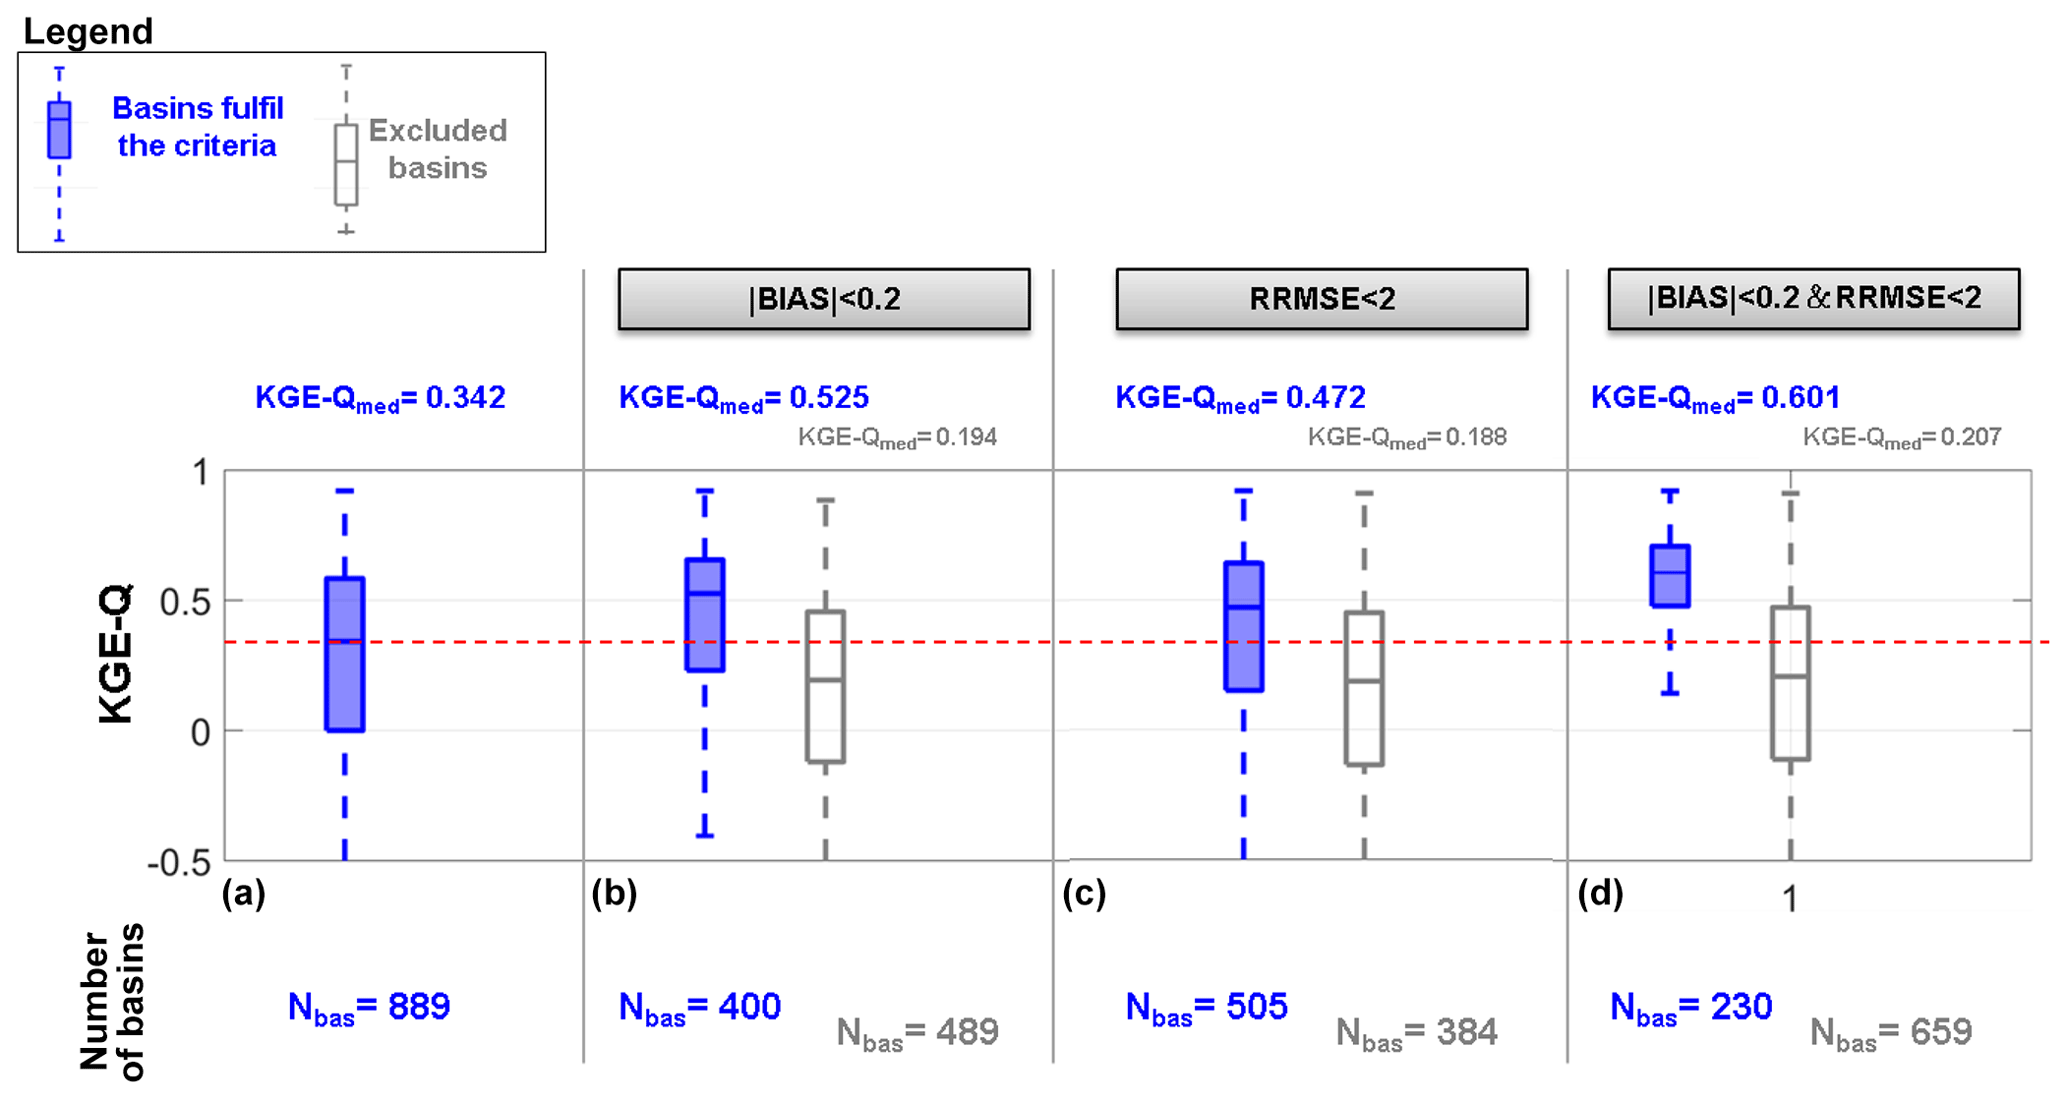
Figure 5Hydrological performances in terms of the KGE values obtained during the validation period by the three satellite rainfall products for all the basins whose outlet section is located over the TMPA area (889). The following hydrological performances are shown: (a) without any constraint on the rainfall scores, (b) constraining the module of rBIAS to values lower than 0.2, (c) constraining RRMSE to values lower than 2 and (d) constraining the module of rBIAS to values lower than 0.2 and RRMSE to values lower than 2.
The boxplot of Fig. 5a shows the hydrological performances that have been obtained during the validation period by the three SRPs without any constraint on the rainfall scores. In order to always consider the same number of basins for all the products, the area of analysis is cut over the TMPA area, and a median KGE-Q value equal to 0.342 is obtained for the 889 basins. According to Table 3, nearly 35 % of the basins show KGE-Q greater than 0.5. If the absolute value of rBIAS (i.e. |rBIAS|) is constrained to values lower than 0.2 (Fig. 5b), the median KGE-Q value over the 400 basins that fulfils the criteria is equal to 0.525. As shown in Fig. 5c, a constraint on RRMSE lower than 2 is not enough to ensure good hydrological performances (median KGE-Q lower than 0.5), whereas, if a combination of the two rainfall scores is considered, the threshold on KGE-Q>0.5 is exceeded by nearly 75 % of the basins fulfilling the criteria (see first boxplot of Fig. 5d). In other words, this means that nearly less than 25 % of the basins fulfilling the criteria show low performances (first boxplot in Fig. 5d). Alternatively, less than 25 % of basins not fulfilling the rainfall constraints show good hydrological performances (see second boxplot in Fig. 5d).
For the sake of completeness, a figure similar to Fig. 5 has been added in the Supplement (Fig. S3) for the other rainfall scores (R, KGE-P, POD, FAR and TS and relative combinations), but none of the shown rainfall constraints can be considered satisfactory for the purposes of the analysis. Indeed, not one of the rainfall constraints in Fig. S3 allows a clear separation between basins fulfilling or not fulfilling the criteria with a corresponding increase in KGE-Q.
The findings of Figs. 4 and 5 draw some interesting conclusions about the main research question of the paper, i.e. for rainfall performance, score(s) can be used to select the best performing rainfall product for river discharge simulation. In particular, it has been noted that R and KGE-P rainfall scores have a small impact on KGE-Q as, for R ranging from 0.5 to 0.8 and for KGE-P ranging from 0.4 to 0.8, it is possible to obtain high (>0.5) KGE-Q values. As the meaningful range of R (KGE-P) is between 0 and 1 (−0.41 and 1), we can conclude that R and KGE-P are not suitable scores for defining a criterion able to discern between good and bad hydrological simulations. This result could be linked to the hydrological model structure and to the parameters calibrated into the model. Indeed, it has been largely demonstrated in the scientific literature (e.g. Zeng et al., 2018) that the impact of imperfect precipitation estimates on model efficiency can be reduced to some extent through the adjustment of model parameters. In this case, it is clear that the hydrological model calibration step is able to correct the rainfall time shift, allowing one to obtain good hydrological performances (KGE-Q) for a large range of R values. A similar consideration holds for KGE-P, largely influenced by the correlation coefficient. Conversely, rBIAS along with RRMSE seem to be the most appropriate error metrics to be used in conjunction to select the best performing SRP for river discharge simulation. With respect to bias, the finding is in line with other studies. For instance, Maggioni et al. (2013) showed that bias can double from rainfall to runoff consistently from small to large basins. Conversely, no suggestions can be found with respect to RRMSE or R metrics to characterize the SRP potential in terms of river discharge simulation. In the scientific literature, we have found thresholds on metric scores to express the quality of SRPs in terms of rainfall. In particular, some authors considered an R value equal to or greater than 0.7 (Condom et al., 2011), a normalized RMSE value less than or equal to 0.5 (Adeyewa and Nakamura, 2003; Condom et al., 2011; Satgé et al., 2016; Shrestha et al., 2017) and bias ranging from bias ≤10 % (Brown, 2006; Yang and Luo, 2014) to be associated with good satellite rainfall performances – but without a reference to justify these numbers.
Specifically, in this study we have found that, by constraining |rBIAS| to values lower than 0.2 and RRMSE to values lower than 2, good hydrological performances are assured for nearly 75 % of the basins fulfilling the criteria. The remaining percentage of basins for which the rainfall or discharge performance relationship is not satisfied highlights that it is not straightforward to find such relationships as errors in rainfall and river discharge data used as a benchmark, and the hydrological model recalibration could influence the analysis. These findings corroborate those obtained by Qi et al. (2016), stating that a good river discharge simulation is a result of a good combination between a rainfall product and a hydrological model, and the selection of the most accurate rainfall product alone does not guarantee the most accurate hydrological performances.
This study represents the most comprehensive European-scale evaluation to date of satellite rainfall products (SRPs). Three different near-real-time SRPs are used to force a lumped hydrological model over 1318 basins throughout Europe. The results can be summarized as follows:
-
In terms of rainfall accuracy, the three SRPs show similar patterns in terms of R and RRMSE, whereas the same does not hold for the rBIAS. For the three products, higher or lower R or RRMSE values are obtained in central Europe; the opposite is observed in the Mediterranean area. The rBIAS is low for TMPA and SM2RASCAT, whereas CMOR shows a clear underestimation of the daily rainfall data over the entire European area.
-
Among the SRPs available in near real time, there are some SRPs that can be reasonably used to force a hydrological model in order to obtain reliable river discharge simulations over Europe. In particular, SM2RASCAT is the best performing product for river discharge simulation across Europe (even at high latitudes).
-
There is a link between rainfall accuracy and river discharge performance. In particular, by constraining |rBIAS| to values lower than 0.2 and RRMSE to values lower than 2, good hydrological performances are assured for almost 75 % of the basins fulfilling these criteria.
Overall, we believe the results obtained from this study provide very useful information about the application of SRPs in simulating river discharge at basin scale. In particular, for the first time, this work addresses the topic of providing quantitative guidelines for the use of SRPs for near-real-time hydrological applications.
Nevertheless, some limitations can be recognized in the analysis. One of the main limitations lies in the use of only one hydrological model for river discharge simulation. In this respect, further analysis with multiple hydrological models will be carried out to better investigate the link between rainfall, hydrological model and discharge performance. In addition, in future research the ranges of rainfall performance scores defined here will also be checked with the use of different satellite rainfall products (e.g. the global precipitation measurement – GPM; Huffmann et al., 2018) and in different regions worldwide. In particular, the extension of the analysis to different regions in the world could allow us to explore the connection between rainfall accuracy and river discharge performances as a function of additional criteria such as climate type, soil characteristics and terrain features (topography).
Another limitation of the study lies in having considered only one performance score for the river discharge. Indeed, as the main purpose of this study has been to reproduce the entire river discharge time series, special attention was not paid to high or low flows. A more comprehensive study should consider a larger set of river discharge metrics to better address the SRP selection. Finally, the results of this study are likely sensitive to the quality of the data taken as “reference”, i.e. the E-OBS data sets used as benchmark to evaluate the performances of SRPs, both in terms of rainfall and, through the hydrological model, in terms streamflow.
Despite the aforementioned limitation, this study contributes to a better understanding of the propagation of the satellite rainfall error in streamflow simulations. This could be very helpful for data users facing the selection of the best satellite rainfall for hydrological applications.
All data and codes used in the study are freely available online. The E-OBS data set by Haylock et al. (2008) is available from the European Climate Assessment and Dataset (ECA&D) website at https://www.ecad.eu/download/ensembles/download.php#datafiles (last access: 2 October 2020). The ground discharge data collected in the paper can be requested from the Global Runoff Data Centre (GRDC), Federal Institute of Hydrology, Koblenz, Germany, at https://www.bafg.de/GRDC/EN/Home/homepage_node.html (last access: 2 October 2020). The European Water Archive (EWA), assembled by the European Flow Regimes from International Experimental and Network Data (Euro-FRIEND) project (http://ne-friend.bafg.de/servlet/is/7413/, last access: 2 October 2020) and held by the GRDC, is available at https://www.bafg.de/GRDC/EN/04_spcldtbss/42_EWA/ewa.html?nn=201574, (last access: 2 October 2020). The Italian National Database, created by Istituto Superiore per la Protezione e la Ricerca Ambientale, Sistema informativo idrologico servizio registri Web (ISPRA HIS), is available at http://www.hiscentral.isprambiente.gov.it/hiscentral/default.aspx (last access: 2 October 2020). The Portuguese National Database, created by Sistema national de Informaçao de Recursos Hidricos (SNIRH), is available at http://snirh.pt/ (last access: 2 October 2020). The Spanish National Database, created by the Ecological Transition Ministry, is available at http://ceh-flumen64.cedex.es/anuarioaforos/default.asp (last access: 2 October 2020). The TMPA 3B42RT rainfall data by Huffman et al. (2010), provided by the National Aeronautics and Space Administration (NASA), are available at https://doi.org/10.5067/TRMM/TMPA/3H-E/7 (Huffman, 2016). CMORPH by Joyce et al. (2004), provided by the Climate Prediction Center (CPC), is available at ftp://ftp.cpc.ncep.noaa.gov/precip/global_CMORPH/3-hourly_025deg/ (last access: 2 October 2020). The SM2RAIN ASCAT rainfall product by Brocca et al. (2019b) is freely downloadable at https://doi.org/10.5281/zenodo.2591214. The “Modello Idrologico Semi-Distribuito in continuo” (MISDc) hydrological model, created by Brocca et al. (2011), is freely downloadable at http://hydrology.irpi.cnr.it/download-area/midsc-code/ (last access: 2 October 2020).
The supplement related to this article is available online at: https://doi.org/10.5194/hess-24-4869-2020-supplement.
SC collected the discharge data, performed the analysis and wrote the paper. LC collected satellite rainfall data, and IM performed the basins delineation. CM and LB contributed on the supervision of the work. All authors discussed the results and contributed to the final paper.
The authors declare that they have no conflict of interest.
The authors wish to thank the Global Runoff Data Centre (GRDC) for providing most of the streamflow data throughout Europe and the E-OBS data set from the EU-FP6 project UERRA (http://www.uerra.eu, last access: 2 October 2020) and the Copernicus Climate Change Service as well as the data providers in the ECA&D project (https://www.ecad.eu, last access: 2 October 2020). The authors gratefully acknowledge support from EUMETSAT through the “Satellite Application Facility on Support to Operational Hydrology and Water Management (H SAF)” as part of the Continuous Development and Operations Phase 3 (CDOP3) (grant no. EUM/C/85/16/DOC/15) and the Global SM2RAIN project (grant no. EUM/CO/17/4600001981/BBo) and from the European Space Agency (ESA) through the SMOS+RAINFALL project (grant no. 4000114738/15/I-SBo). Finally, the authors wish to thank the two anonymous reviewers, who, with their valuable comments, helped to improve the paper.
This research has been supported by the EUMETSAT (grant nos. EUM/C/85/16/DOC/15 and EUM/CO/17/4600001981/BBo) and the ESA (grant no. 4000114738/15/ISBo)
This paper was edited by Thomas Kjeldsen and reviewed by two anonymous referees.
Adeyewa, Z. D. and Nakamura, K.: Validation of TRMM radar rainfall data over major climatic regions in Africa, J. Appl. Meteorol., 42, 331–347, https://doi.org/10.1175/1520-0450(2003)042<0331:VOTRRD>2.0.CO;2, 2003.
Artan, G., Gadain, H., Smith, J. L., Asante, K., Bandaragoda, C. J., and Verdin, J. P.: Adequacy of satellite derived rainfall data for stream flow modelling, Nat. Hazards, 43, 167–185, https://doi.org/10.1007/s11069-007-9121-6, 2007.
Beck, H. E., Vergopolan, N., Pan, M., Levizzani, V., van Dijk, A. I. J. M., Weedon, G. P., Brocca, L., Pappenberger, F., Huffman, G. J., and Wood, E. F.: Global-scale evaluation of 22 precipitation datasets using gauge observations and hydrological modeling, Hydrol. Earth Syst. Sci., 21, 6201–6217, https://doi.org/10.5194/hess-21-6201-2017, 2017.
Berghuijs, W. R., Harrigan, S., Molnar, P., Slater, L. J., and Kirchner, J. W.: The relative importance of different flood-generating mechanisms across Europe, Water. Resour. Res., 55, 6, 4582–4593, https://doi.org/10.1029/2019WR024841, 2019.
Bisselink, B., Zambrano-Bigiarini, M., Burek, P., and De Roo, A.: Assessing the role of uncertain precipitation estimates on the robustness of hydrological model parameters under highly variable climate conditions, J. Hydrol. Reg. Stud., 8, 112–129, https://doi.org/10.1016/j.ejrh.2016.09.003, 2016.
Bitew, M. M. and Gebremichael, M.: Evaluation of satellite rainfall products through hydrologic simulation in a fully distributed hydrologic model, Water Resour. Res., 47, W06526, https://doi.org/10.1029/2010WR009917, 2011.
Brocca, L., Melone, F., and Moramarco, T.: Distributed rainfall–runoff modelling for flood frequency estimation and flood forecasting, Hydrol. Process., 25, 18, 2801–2813, https://doi.org/10.1002/hyp.8042, 2011 (data available at: http://hydrology.irpi.cnr.it/download-area/midsc-code/, last access: 2 Ocotber 2020).
Brocca, L., Liersch, S., Melone, F., Moramarco, T., and Volk, M.: Application of a model-based rainfall–runoff database as efficient tool for flood risk management, Hydrol. Earth Syst. Sci., 17, 3159–3169, https://doi.org/10.5194/hess-17-3159-2013, 2013a.
Brocca, L., Moramarco, T., Dorigo, W., and Wagner, W.: Assimilation of satellite soil moisture data into rainfall–runoff modelling for several catchments worldwide. 2013 IEEE International Geoscience and Remote Sensing Symposium – IGARSS, 21–26 July 2013, Melbourne, Australia, 2281–2284, https://doi.org/10.1109/IGARSS.2013.6723273, 2013b.
Brocca, L., Ciabatta, L., Massari, C., Moramarco, T., Hahn, S., Hasenauer, S., Kidd, R., Dorigo, W., Wagner, W., and Levizzani, V.: Soil as a natural rain gauge: estimating global rainfall from satellite soil moisture data, J. Geophys. Res., 119, 9, 5128–5141, https://doi.org/10.1002/2014JD021489, 2014.
Brocca, L., Filippucci, P., Hahn, S., Ciabatta, L., Massari, C., Camici, S., Schüller, L., Bojkov, B., and Wagner, W.: SM2RAIN–ASCAT (2007–2018): global daily satellite rainfall data from ASCAT soil moisture observations, Earth Syst. Sci. Data, 11, 1583–1601, https://doi.org/10.5194/essd-11-1583-2019, 2019a.
Brocca, L., Filippucci, P., Hahn, S., Ciabatta, L., Massari, C., Camici, S., Schüller, L., Bojkov, B., and Wagner, W.: SM2RAIN-ASCAT (2007–June 2020): global daily satellite rainfall from ASCAT soil moisture (Version 1.3), Zenodo, https://doi.org/10.5281/zenodo.3972958, 2019b.
Brown, J. E.: An analysis of the performance of hybrid infrared and microwave satellite precipitation algorithms over India and adjacent regions, Remote. Sens. Environ., 101, 63–81, https://doi.org/10.1016/j.rse.2005.12.005, 2006.
Camici, S., Brocca, L., Melone, F., and Moramarco, T.: Impact of climate change on flood frequency using different climate models and downscaling approaches, J. Hydrol. Eng., 19, 8, 04014002, https://doi.org/10.1061/(ASCE)HE.1943-5584.0000959, 2014.
Camici, S., Ciabatta, L., Massari, C., and Brocca, L.: How reliable are satellite precipitation estimates for driving hydrological models: a verification study over the Mediterranean area, J. Hydrol., 563, 950–961, https://doi.org/10.1016/j.jhydrol.2018.06.067, 2018.
Casse, C., Gosset, M., Peugeot, C., Pedinotti, V., Boone, A., Tanimoun, B. A., and Decharme, B.: Potential of satellite rainfall products to predict Niger River flood events in Niamey, Atmos. Res., 163, 162–176, https://doi.org/10.1016/j.atmosres.2015.01.010, 2015.
Chen, F., Crow, W., and Holmes, T. R.: Improving long-term, retrospective precipitation datasets using satellite surface soil moisture retrievals and the soil moisture analysis rainfall tool, J. Appl. Remote Sens., 6, 063604, https://doi.org/10.1117/1.JRS.6.063604, 2012.
Chintalapudi, S., Sharif, H., and Xie, H.: Sensitivity of distributed hydrologic simulations to ground and satellite based rainfall products, Water, 6, 5, 1221–1245, https://doi.org/10.3390/w6051221, 2014.
Cislaghi, A., Masseroni, D., Massari, C., Camici, S., and Brocca, L.: Combining rainfall–runoff model and regionalization approach for flood and water resource assessment in the western Po-Valley (Italy). Hydrolog. Sci. J., 65, 348–370, https://doi.org/10.1080/02626667.2019.1690656, 2019.
Condom, T., Rau, P., and Espinoza, J. C.: Correction of TRMM 3B43 monthly precipitation data over the mountainous areas of Peru during the period 1998–2007, Hydrol. Process., 25, 12, 1924–1933, https://doi.org/10.1002/hyp.7949, 2011.
Cornes, R. C., van der Schrier, G., van den Besselaar, E. J., and Jones, P. D.: An Ensemble Version of the E-OBS Temperature and Precipitation Data Sets, J. Geophys. Res.-Atmos., 123, 17, 9391–9409, https://doi.org/10.1029/2017JD028200, 2018.
Crochemore, L., Isberg, K., Pimentel, R., Pineda, L., Hasan, A., and Arheimer, B.: Lessons learnt from checking the quality of openly accessible river flow data worldwide, Hydrolog. Sci. J., 65, 5, 699–711, https://doi.org/10.1080/02626667.2019.1659509, 2020.
Demaria, E. M., Nijssen, B., Valdés, J. B., Rodriguez, D. A., and Su, F.: Satellite precipitation in southeastern South America: how do sampling errors impact high flow simulations?, Int. J. River Basin Manag., 12, 1–13, https://doi.org/10.1080/15715124.2013.865637, 2014.
Do, H. X., Gudmundsson, L., Leonard, M., and Westra, S.: The Global Streamflow Indices and Metadata Archive (GSIM) – Part 1: The production of a daily streamflow archive and metadata, Earth Syst. Sci. Data, 10, 765–785, https://doi.org/10.5194/essd-10-765-2018, 2018.
Ebert, E. E., Janowiak, J. E., and Kidd, C.: Comparison of near-real-time precipitation estimates from satellite observations and numerical models, B. Am. Meteorol. Soc., 88, 47–64, https://doi.org/10.1175/BAMS-88-1-47, 2007.
Ehsan Bhuiyan, M. A., Nikolopoulos, E. I., Anagnostou, E. N., Polcher, J., Albergel, C., Dutra, E., Fink, G., Martínez-de la Torre, A., and Munier, S.: Assessment of precipitation error propagation in multi-model global water resource reanalysis, Hydrol. Earth Syst. Sci., 23, 1973–1994, https://doi.org/10.5194/hess-23-1973-2019, 2019.
Elgamal, A., Reggiani, P., and Jonoski, A.: Impact analysis of satellite rainfall products on flow simulations in the Magdalena River Basin, Colombia, J. Hydrol. Reg. Stud., 9, 85–103, https://doi.org/10.1016/j.ejrh.2016.09.001, 2017.
Gebregiorgis, A. S., Tian, Y., Peters-Lidard, C. D., and Hossain, F.: Tracing hydrologic model simulation error as a function of satellite rainfall estimation bias components and land use and land cover conditions, Water Resour. Res., 48, W11509, https://doi.org/10.1029/2011WR011643, 2012.
Gupta, H. V., Kling, H., Yilmaz, K. K., and Martinez, G. F.: Decomposition of the mean squared error and NSE performance criteria: Implications for improving hydrological modelling, J. Hydrol., 377, 1–2, 80–91, https://doi.org/10.1016/j.jhydrol.2009.08.003, 2009.
Haylock, M. R., Hofstra, N., Klein Tank, A. M. G., Klok, E. J., Jones, P. D., and New, M.: A European daily high-resolution gridded data set of surface temperature and precipitation for 1950–2006, J. Geophys. Res.-Atmos., 113, D20119, https://doi.org/10.1029/2008JD010201, 2008 (data available at: https://www.ecad.eu/download/ensembles/download.php#datafiles, last access: 2 October 2020).
Hofstra, N., Haylock, M., New, M., and Jones, P. D.: Testing E-OBS European high-resolution gridded data set of daily precipitation and surface temperature, J. Geophys. Res.-Atmos., 114, D21101, https://doi.org/10.1029/2009JD011799, 2009.
Hofstra, N., New, M., and McSweeney, C.: The influence of interpolation and station network density on the distributions and trends of climate variables in gridded daily data, Clim. Dynam., 35, 5, 841–858, https://doi.org/10.1007/s00382-009-0698-1, 2010.
Hong, Y., Hsu, K. L., Moradkhani, H., and Sorooshian, S.: Uncertainty quantification of satellite precipitation estimation and Monte Carlo assessment of the error propagation into hydrologic response, Water Resour. Res., 42, W08421, https://doi.org/10.1029/2005WR004398, 2006.
Hossain, F. and Anagnostou, E. N.: A two-dimensional satellite rainfall error model, IEEE T. Geosci. Remote., 44, 6, 1511–1522, https://doi.org/10.1109/TGRS.2005.863866, 2006.
Hossain, F. and Huffman, G. J.: Investigating error metrics for satellite rainfall data at hydrologically relevant scales, J. Hydrometeorol., 9, 563–575, https://doi.org/10.1175/2007JHM925.1, 2008.
Huffman, G.: TRMM (TMPA-RT) Near Real-Time Precipitation L3 3 hour 0.25 degree x 0.25 degree V7, edited by: MacRitchie, K., Greenbelt, MD, Goddard Earth Sciences Data and Information Services Center (GES DISC), https://doi.org/10.5067/TRMM/TMPA/3H-E/7, 2016.
Huffman, G. J., Adler, R. F., Bolvin, D. T., and Nelkin, E. J.: The TRMM multi-satellite precipitation analysis (TMPA), in: Satellite rainfall applications for surface hydrology, edited by: Gebremichael, M. and Hossain, F., Springer, Dordrecht, 3–22, https://doi.org/10.1007/978-90-481-2915-7, 2010.
Huffman, G., Bolvin, D., Braithwaite, D., Hsu, K., Joyce, R., Kidd, C., Nelkin, E., and Xie, P.: Algorithm Theoretical Basis Document (ATBD) Version 4.5. NASA Global Precipitation Measurement (GPM) Integrated Multi-satellitE Retrievals for GPM (IMERG) NASA, available at: https://docserver.gesdisc.eosdis.nasa.gov/public/project/GPM/IMERG_ATBD_V5.pdf (last access: 2 October 2020), 2018.
Jiang, D. and Wang, K.: The Role of Satellite Remote Sensing in Improving Simulated Streamflow: A Review, Water, 11, 1615, https://doi.org/10.3390/w11081615, 2019.
Joyce, R. J., Janowiak, J. E., Arkin, P. A., and Xie, P.: CMORPH: A method that produces global precipitation estimates from passive microwave and infrared data at high spatial and temporal resolution, J. Hydrometeorol., 5, 487–503, https://doi.org/10.1175/1525-7541(2004)005<0487:CAMTPG>2.0.CO;2, 2004 (data available at: ftp://ftp.cpc.ncep.noaa.gov/precip/global_CMORPH/3-hourly_025deg/, last access: 2 October).
Kling, H., Fuchs, M., and Paulin, M.: Runoff conditions in the upper Danube basin under an ensemble of climate change scenarios, J. Hydrol., 424, 264–277, https://doi.org/10.1016/j.jhydrol.2012.01.011, 2012.
Klok, E. J. and Tank, A. K.: Updated and extended European dataset of daily climate observations, Int. J. Climatol., 29, 8, 1182–1191, https://doi.org/10.1002/joc.1779, 2009.
Knoben, W. J. M., Freer, J. E., and Woods, R. A.: Technical note: Inherent benchmark or not? Comparing Nash–Sutcliffe and Kling–Gupta efficiency scores, Hydrol. Earth Syst. Sci., 23, 4323–4331, https://doi.org/10.5194/hess-23-4323-2019, 2019.
Kyselý, J. and Plavcová, E.: A critical remark on the applicability of E-OBS European gridded temperature data set for validating control climate simulations, J. Geophys. Res.-Atmos., 115, D23118, https://doi.org/10.1029/2010JD014123, 2010.
Lu, D. and Yong, B.: Evaluation and Hydrological Utility of the Latest GPM IMERG V5 and GSMaP V7 Precipitation Products over the Tibetan Plateau, Remote Sens., 10, 2022, https://doi.org/10.3390/rs10122022, 2018.
Maggioni, V., Reichle, R. H., and Anagnostou, E. N.: The effect of satellite rainfall error modeling on soil moisture prediction uncertainty, J. Hydrometeorol., 12, 413–428, https://doi.org/10.1175/2011JHM1355.1, 2011.
Maggioni, V., Vergara, H. J., Anagnostou, E. N., Gourley, J. J., Hong, Y., and Stampoulis, D.: Investigating the applicability of error correction ensembles of satellite rainfall products in river flow simulations, J. Hydrometeorol., 14, 1194–1211, https://doi.org/10.1175/JHM-D-12-074.1, 2013.
Maggioni, V. and Massari, C.: On the performance of satellite precipitation products in riverine flood modeling: A review, J. Hydrol., 558, 214–224, https://doi.org/10.1016/j.jhydrol.2018.01.039, 2018.
Massari, C., Brocca, L., Ciabatta, L., Moramarco, T., Gabellani, S., Albergel, C., de Rosnay, P., Puca, S., and Wagner, W.: The use of H-SAF soil moisture products for operational hydrology: flood modelling over Italy, Hydrology, 2, 2–22, https://doi.org/10.3390/hydrology2010002, 2015.
Massari, C., Camici, S., Ciabatta, L., and Brocca, L.: Exploiting satellite surface soil moisture for flood forecasting in the Mediterranean area: state update versus rainfall correction, Remote Sens., 10, 292, https://doi.org/10.3390/rs10020292, 2018.
Masseroni, D., Cislaghi, A., Camici, S., Massari, C., and Brocca, L.: A reliable rainfall–runoff model for flood forecasting: review and application to a semi-urbanized watershed at high flood risk in Italy, Hydrol. Res., 48, 726–740, https://doi.org/10.2166/nh.2016.037, 2016.
Mei, Y., Nikolopoulos, E., Anagnostou, E., Zoccatelli, D., and Borga, M.: Error analysis of satellite precipitation-driven modeling of flood events in complex alpine terrain, Remote Sens., 8, 293, https://doi.org/10.3390/rs8040293, 2016.
Mei, Y., Anagnostou, E. N., Shen, X., and Nikolopoulos, E. I.: Decomposing the satellite precipitation error propagation through the rainfall-runoff processes, Adv. Water Resour., 109, 253–266, https://doi.org/10.1016/j.advwatres.2017.09.012, 2017.
Montani, A., Cesari, D., Marsigli, C., and Paccagnella, T.: Seven years of activity in the field of mesoscale ensemble forecasting by the COSMO-LEPS system: main achievements and open challenges, Tellus A, 63, 605–624, https://doi.org/10.1111/j.1600-0870.2010.00499.x, 2011.
Mouratidis, A., and Ampatzidis, D.: European Digital Elevation Model Validation against Extensive Global Navigation Satellite Systems Data and Comparison with SRTM DEM and ASTER GDEM in Central Macedonia (Greece). ISPRS Int. J. Geo.-Inf., 8, 108, https://doi.org/10.3390/ijgi8030108, 2019.
Mugnai, A., Casella, D., Cattani, E., Dietrich, S., Laviola, S., Levizzani, V., Panegrossi, G., Petracca, M., Sanò, P., Di Paola, F., Biron, D., De Leonibus, L., Melfi, D., Rosci, P., Vocino, A., Zauli, F., Pagliara, P., Puca, S., Rinollo, A., Milani, L., Porcù, F., and Gattari, F.: Precipitation products from the hydrology SAF, Nat. Hazards Earth Syst. Sci., 13, 1959–1981, https://doi.org/10.5194/nhess-13-1959-2013, 2013.
Nikolopoulos, E. I., Anagnostou, E. N., Hossain, F., Gebremichael, M., and Borga, M.: Understanding the scale relationships of uncertainty propagation of satellite rainfall through a distributed hydrologic model, J. Hydrometeorol., 11, 520–532, https://doi.org/10.1175/2009JHM1169.1, 2010.
Nikolopoulos, E. I., Anagnostou, E. N., and Borga, M.: Using high-resolution satellite rainfall products to simulate a major flash flood event in northern Italy, J. Hydrometeorol., 14, 171–185, https://doi.org/10.1175/JHM-D-12-09.1, 2012.
Pakoksung, K. and Takagi, M.: Effect of satellite based rainfall products on river basin responses of runoff simulation on flood event, Model. Earth Sys. Environ., 2, 143, https://doi.org/10.1007/s40808-016-0200-0, 2016.
Pan, M., Li, H., and Wood, E.: Assessing the skill of satellite-based precipitation estimates in hydrologic applications, Water Resour. Res., 46, W09535, https://doi.org/10.1029/2009WR008290, 2010.
Qi, W., Zhang, C., Fu, G., Sweetapple, C., and Zhou, H.: Evaluation of global fine-resolution precipitation products and their uncertainty quantification in ensemble discharge simulations, Hydrol. Earth Syst. Sci., 20, 903–920, https://doi.org/10.5194/hess-20-903-2016, 2016.
Quintero, F., Krajewski, W. F., Mantilla, R., Small, S., and Seo, B. C.: A spatial–dynamical framework for evaluation of satellite rainfall products for flood prediction, J Hydrometeorol, 17, 2137–2154, https://doi.org/10.1175/JHM-D-15-0195.1, 2016.
Ren, P., Li, J., Feng, P., Guo, Y., and Ma, Q.: Evaluation of multiple satellite precipitation products and their use in hydrological modelling over the Luanhe River basin, China. Water, 10, 677, https://doi.org/10.3390/w10060677, 2018.
Ricciardelli, E., Di Paola, F., Gentile, S., Cersosimo, A., Cimini, D., Gallucci, D., Geraldi, E., Larosa, S., Nilo, S. T., Ripepi, E., Romano, F., Viggiano, M.: Analysis of Livorno Heavy Rainfall Event: Examples of Satellite Observation Techniques in Support of Numerical Weather Prediction, Remote Sens., 10, 1549, https://doi.org/10.3390/rs10101549, 2018.
Satgé, F., Bonnet, M. P., Gosset, M., Molina, J., Lima, W. H. Y., Zolá, R. P., Timouk, F., and Garnier, J.: Assessment of satellite rainfall products over the Andean plateau, Atmos. Res., 167, 1–14, https://doi.org/10.1016/j.atmosres.2015.07.012, 2016.
Satgé, F., Ruelland, D., Bonnet, M.-P., Molina, J., and Pillco, R.: Consistency of satellite-based precipitation products in space and over time compared with gauge observations and snow-hydrological modelling in the Lake Titicaca region, Hydrol. Earth Syst. Sci., 23, 595–619, https://doi.org/10.5194/hess-23-595-2019, 2019.
Schaefli, B. and Gupta, H. V.: Do Nash values have value?, Hydrol. Process., 21, 2075–2080, https://doi.org/10.1002/hyp.6825, 2007.
Serpetzoglou, E., Anagnostou, E. N., Papadopoulos, A., Nikolopoulos, E. I., and Maggioni, V.: Error propagation of remote sensing rainfall estimates in soil moisture prediction from a land surface model, J. Hydrometeorol., 11, 705–720, https://doi.org/10.1175/2009JHM1166.1, 2010.
Shah, H. L., and Mishra, V.: Uncertainty and bias in satellite-based precipitation estimates over Indian subcontinental basins: Implications for real-time streamflow simulation and flood prediction, J. Hydrometeorol., 17, 615–636, https://doi.org/10.1175/JHM-D-15-0115.1, 2016.
Shrestha, N. K., Qamer, F. M., Pedreros, D., Murthy, M. S. R., Wahid, S. M., and Shrestha, M.: Evaluating the accuracy of Climate Hazard Group (CHG) satellite rainfall estimates for precipitation based drought monitoring in Koshi basin, Nepal, J. Hydrol. Reg. Stud., 13, 138–151, https://doi.org/10.1016/j.ejrh.2017.08.004, 2017.
Tapiador, F. J., Navarro, A., Levizzani, V., García-Ortega, E., Huffman, G. J., Kidd, C., Kucera, P. A., Kummerow, C. D., Masunaga, H., Petersen, W. A., Roca, R., Sánchez, J.-L., Tao, W.-K., and Turk, F. J.: Global precipitation measurements for validating climate models, Atmos. Res., 197, 1–20, https://doi.org/10.1016/j.atmosres.2017.06.021, 2017.
Thiemig, V., Rojas, R., Zambrano-Bigiarini, M., and De Roo, A.: Hydrological evaluation of satellite rainfall estimates over the Volta and Baro-Akobo Basin, J. Hydrol., 499, 324–338, https://doi.org/10.1016/j.jhydrol.2013.07.012, 2013.
Valdés-Pineda, R., Demaría, E. M. C., Valdés, J. B., Wi, S., and Serrat-Capdevilla, A.: Bias correction of daily satellite-based rainfall estimates for hydrologic forecasting in the Upper Zambezi, Africa, Hydrol. Earth Syst. Sci. Discuss., https://doi.org/10.5194/hess-2016-473, 2016.
Vergara, H., Hong, Y., Gourley, J. J., Anagnostou, E. N., Maggioni, V., Stampoulis, D., and Kirstetter, P. E.: Effects of resolution of satellite rainfall estimates on hydrologic modeling skill at different scales, J. Hydrometeorol., 15, 593–613, https://doi.org/10.1175/JHM-D-12-0113.1, 2014.
Wagner, W., Hahn, S., Kidd, R., Melzer, T., Bartalis, Z., Hasenauer, S., Figa, J., de Rosnay, P., Jann, A., Schneider, S., Komma, J., Kubu, G., Brugger, K., Aubrecht, C., Zuger, J., Gangkofner, U., Kienberger, S., Brocca, L., Wang, Y., Bloeschl, G., Eitzinger, J., Steinnocher, K., Zeil, P., and Rubel, F.: The ASCAT soil moisture product: A review of its specifications, validation results, and emerging applications, Meteorol. Z. (contrib. Atm. Sci.), 22, 5–33, https://doi.org/10.1127/0941-2948/2013/0399, 2013.
Yang, Y. and Luo, Y.: Evaluating the performance of remote sensing precipitation products CMORPH, PERSIANN, and TMPA, in the arid region of northwest China, Theor. Appl. Climatol., 118, 429–445, https://doi.org/10.1007/s00704-013-1072-0, 2014.
Yilmaz, K. K., Hogue, T. S., Hsu, K. L., Sorooshian, S., Gupta, H. V., and Wagener, T.: Intercomparison of rain gauge, radar, and satellite precipitation estimates with emphasis on hydrologic forecasting, J. Hydrometeorol., 6, 497–517, https://doi.org/10.1175/JHM431.1, 2005.
Yong, B., Ren, L. L., Hong, Y., Wang, J. H., Gourley, J. J., Jiang, S. H., Gourley, J. J. Jiang, S.-H., Chen, X., and Wang, W.: Hydrologic evaluation of Multisatellite Precipitation Analysis standard precipitation products in basins beyond its inclined latitude band: A case study in Laohahe basin, China, Water Resour. Res., 46, W07542, https://doi.org/10.1029/2009WR008965, 2010.
Zappa, M., Rotach, M. W., Arpagaus, M., Dorninger, M., Hegg, C., Montani, A., Ranzi, R., Ament, F., Germann, U., Grossi, G., Jaun, S., Rossa, A., Vogt, S., Walser, A., Wehrhan, J., and Wunram, C.: MAP D-PHASE: real-time demonstration of hydrological ensemble prediction systems, Atmos. Sci. Lett., 9, 80–87, https://doi.org/10.1002/asl.183, 2008.
Zeng, Q., Chen, H., Xu, C. Y., Jie, M. X., Chen, J., Guo, S. L., and Liu, J.: The effect of rain gauge density and distribution on runoff simulation using a lumped hydrological modelling approach, J. Hydrol., 563, 106–122, https://doi.org/10.1016/j.jhydrol.2018.05.058, 2018.
Zhu, Q., Xuan, W., Liu, L., and Xu, Y. P.: Evaluation and hydrological application of precipitation estimates derived from PERSIANN-CDR, TRMM 3B42V7, and NCEP-CFSR over humid regions in China, Hydrol. Process., 30, 17, 3061–3083, https://doi.org/10.1002/hyp.10846, 2016.