the Creative Commons Attribution 4.0 License.
the Creative Commons Attribution 4.0 License.
 | 16 Sep 2020
Specific climate classification for Mediterranean hydrology and future evolution under Med-CORDEX regional climate model scenarios
Antoine Allam
Roger Moussa
Wajdi Najem
Claude Bocquillon
The Mediterranean region is one of the most sensitive regions to anthropogenic and climatic changes, mostly affecting its water resources and related practices. With multiple studies raising serious concerns about climate shifts and aridity expansion in the region, this one aims to establish a new high-resolution classification for hydrology purposes based on Mediterranean-specific climate indices. This classification is useful in following up on hydrological (water resource management, floods, droughts, etc.) and ecohydrological applications such as Mediterranean agriculture. Olive cultivation is the characteristic agricultural practice of the Mediterranean region. The proposed approach includes the use of classic climatic indices and the definition of new climatic indices, mainly precipitation seasonality index Is or evapotranspiration threshold SPET, both in line with river flow regimes, a principal component analysis to reduce the number of indices, K-means classification to distribute them into classes, and finally the construction of a decision tree based on the distances to class kernels to reproduce the classification without having to repeat the whole process. The classification was set and validated by WorldClim-2 at 1 km high-resolution gridded data for the 1970–2000 baseline period and 144 stations' data over 30 to 120 years, both at monthly time steps. Climatic classes coincided with a geographical distribution in the Mediterranean ranging from the most seasonal and driest class 1 in the south to the least seasonal and most humid class 5 in the north, showing the climatic continuity from one place to another and enhancing the visibility of change trends. The MED-CORDEX ALADIN and CCLM historical and projected data at 12 and 50 km resolution simulated under the RCP4.5 and 8.5 scenarios for the 2070–2100 period served to assess the climate change impact on this classification by superimposing the projected changes on the baseline grid-based classification. RCP scenarios increase the seasonality index Is by +80 % and the aridity index IArid by +60 % in the north and IArid by +10 % without Is change in the south, hence causing the wet season shortening and river regime modification with the migration north of moderate and extreme winter regimes instead of early spring regimes. The ALADIN and CCLM regional climate models (RCMs) have demonstrated an evolution of the Mediterranean region towards arid climate. The classes located to the north are slowly evolving towards moderate coastal classes, which might affect hydrologic regimes due to shorter humid seasons and earlier snowmelts. These scenarios might look favourable for Mediterranean cultivation; however, the expected impact on water resources and flow regimes will surely expand and directly hit ecosystems, food, health, and tourism, as risk is interconnected between domains. This kind of classification might be reproduced at the global scale, using the same or other climatic indices specific to each region, highlighting their physiographic characteristics and hydrological responses.
- Article
(20363 KB) - Full-text XML
- BibTeX
- EndNote


Mediterranean climate is a result of a complicated global cyclonic system swiping a large evaporative basin. The distribution of marine and continental air masses creates an alternation of low-pressure zones coming over from Iceland and the Persian Gulf or high-pressure zones from Siberia and the Azores (Clerget, 1937). The seasonal shifts of these zones are magnified by the North Atlantic Oscillation (NAO) that plays an important role in shaping Mediterranean climate and influencing the evolution of farming and social activities in the long term (Rodwell and Hoskins, 1996). During the positive phases of the NAO, oceanic disturbances bring the most humid to northern Europe and the less humid to northern Africa and the Middle East (Douguédroit and Lionello, 2015). This continuous alternation of high- and low-pressure, cold and humid winters followed by hot and dry summers marks the Mediterranean seasonality, which makes the region attractive for social activities, hence its sensitivity to climate change and anthropogenic pressures (PlanBleu, 2012). A north–south general precipitation and evapotranspiration gradient has been identified in Tunisia through the analysis of directional variograms that results from partial gradients evolving through seasons (Slimani et al., 2007; Baccour et al., 2012; Feki et al., 2012). These spatial gradients mainly depend on topographic structures through the interception of rainfall-generating air masses. The climatic classification will try to identify the general spatial gradients across the Mediterranean. Hydrologically, the precipitation seasonality characterizing the Mediterranean climate is reflected in the flow regimes of Mediterranean rivers, as pointed out by Haines (1988), who classified the Mediterranean rivers under Group 12 Winter Moderate hydrologic regimes, Group 13 Extreme Winter, and Group 14 Early Spring and found a clear relation to the Köppen Csa and Csb climates and a close equivalent of the “Mediterranean Seasonal” categories of Gentilli (Haines et al., 1988). Seasonality is the main factor in the Mediterranean, but to our knowledge its use is still limited as a characterizing index for climatic and hydrological classification. Climate change is expected to have severe consequences for Mediterranean runoff, with a serious risk of freshwater availability decrease of 2 % to 15 % for 2 ∘C of warming (Cramer et al., 2018) and a significant increase in drought periods, particularly in the south and east (Hreiche et al., 2007; Cudennec et al., 2007; Garcia-Ruiz et al., 2011; Verdier and Viollet, 2015). The CMIP5 simulations (Coupled Model Intercomparison Project, Phase 5) expected a mean precipitation decrease of −4 % ∘C−1 and a temperature increase of 20 %, more than the global average, with a maximum precipitation reduction reaching −7 % ∘C−1 in winter in the southern Mediterranean region and −9 % ∘C−1 in the summer in the northern region (Lionello and Scarascia, 2018). At 1.5 ∘C global warming, some Mediterranean areas are under aridification while moving to drier states due to the decrease in precipitation combined with a potential evapotranspiration (PET) increase leading to an expansion of drylands, thus affecting more people (Koutroulis, 2019).
Automatic classification methods partition a set of objects, knowing their distances by pairs in a way to keep the classes as homogeneous as possible while remaining distinct from each other. Like any classification, the adopted method depends on the objective and its specificity. There are several modes of climatic classification: (a) genetic classifications related to meteorological causes and the origin of air masses (Bergeron, 1928; Barry and Chorley, 2009); (b) bioclimatic classifications based on the interrelation between vegetation type and climate (Holdridge, 1947; Mather and Yoshioka, 1968; Harrison et al., 2010); (c) an agro-climatic method based on the assessment of the rainfall–evapotranspiration balance for the estimation of agricultural productivity (Thornthwaite, 1948); and (d) climatic methods based on precipitation and temperature indices similarly to the classification of Köppen (1936) updated by Peel in 2007 (Peel et al., 2007) and which remains the most used.
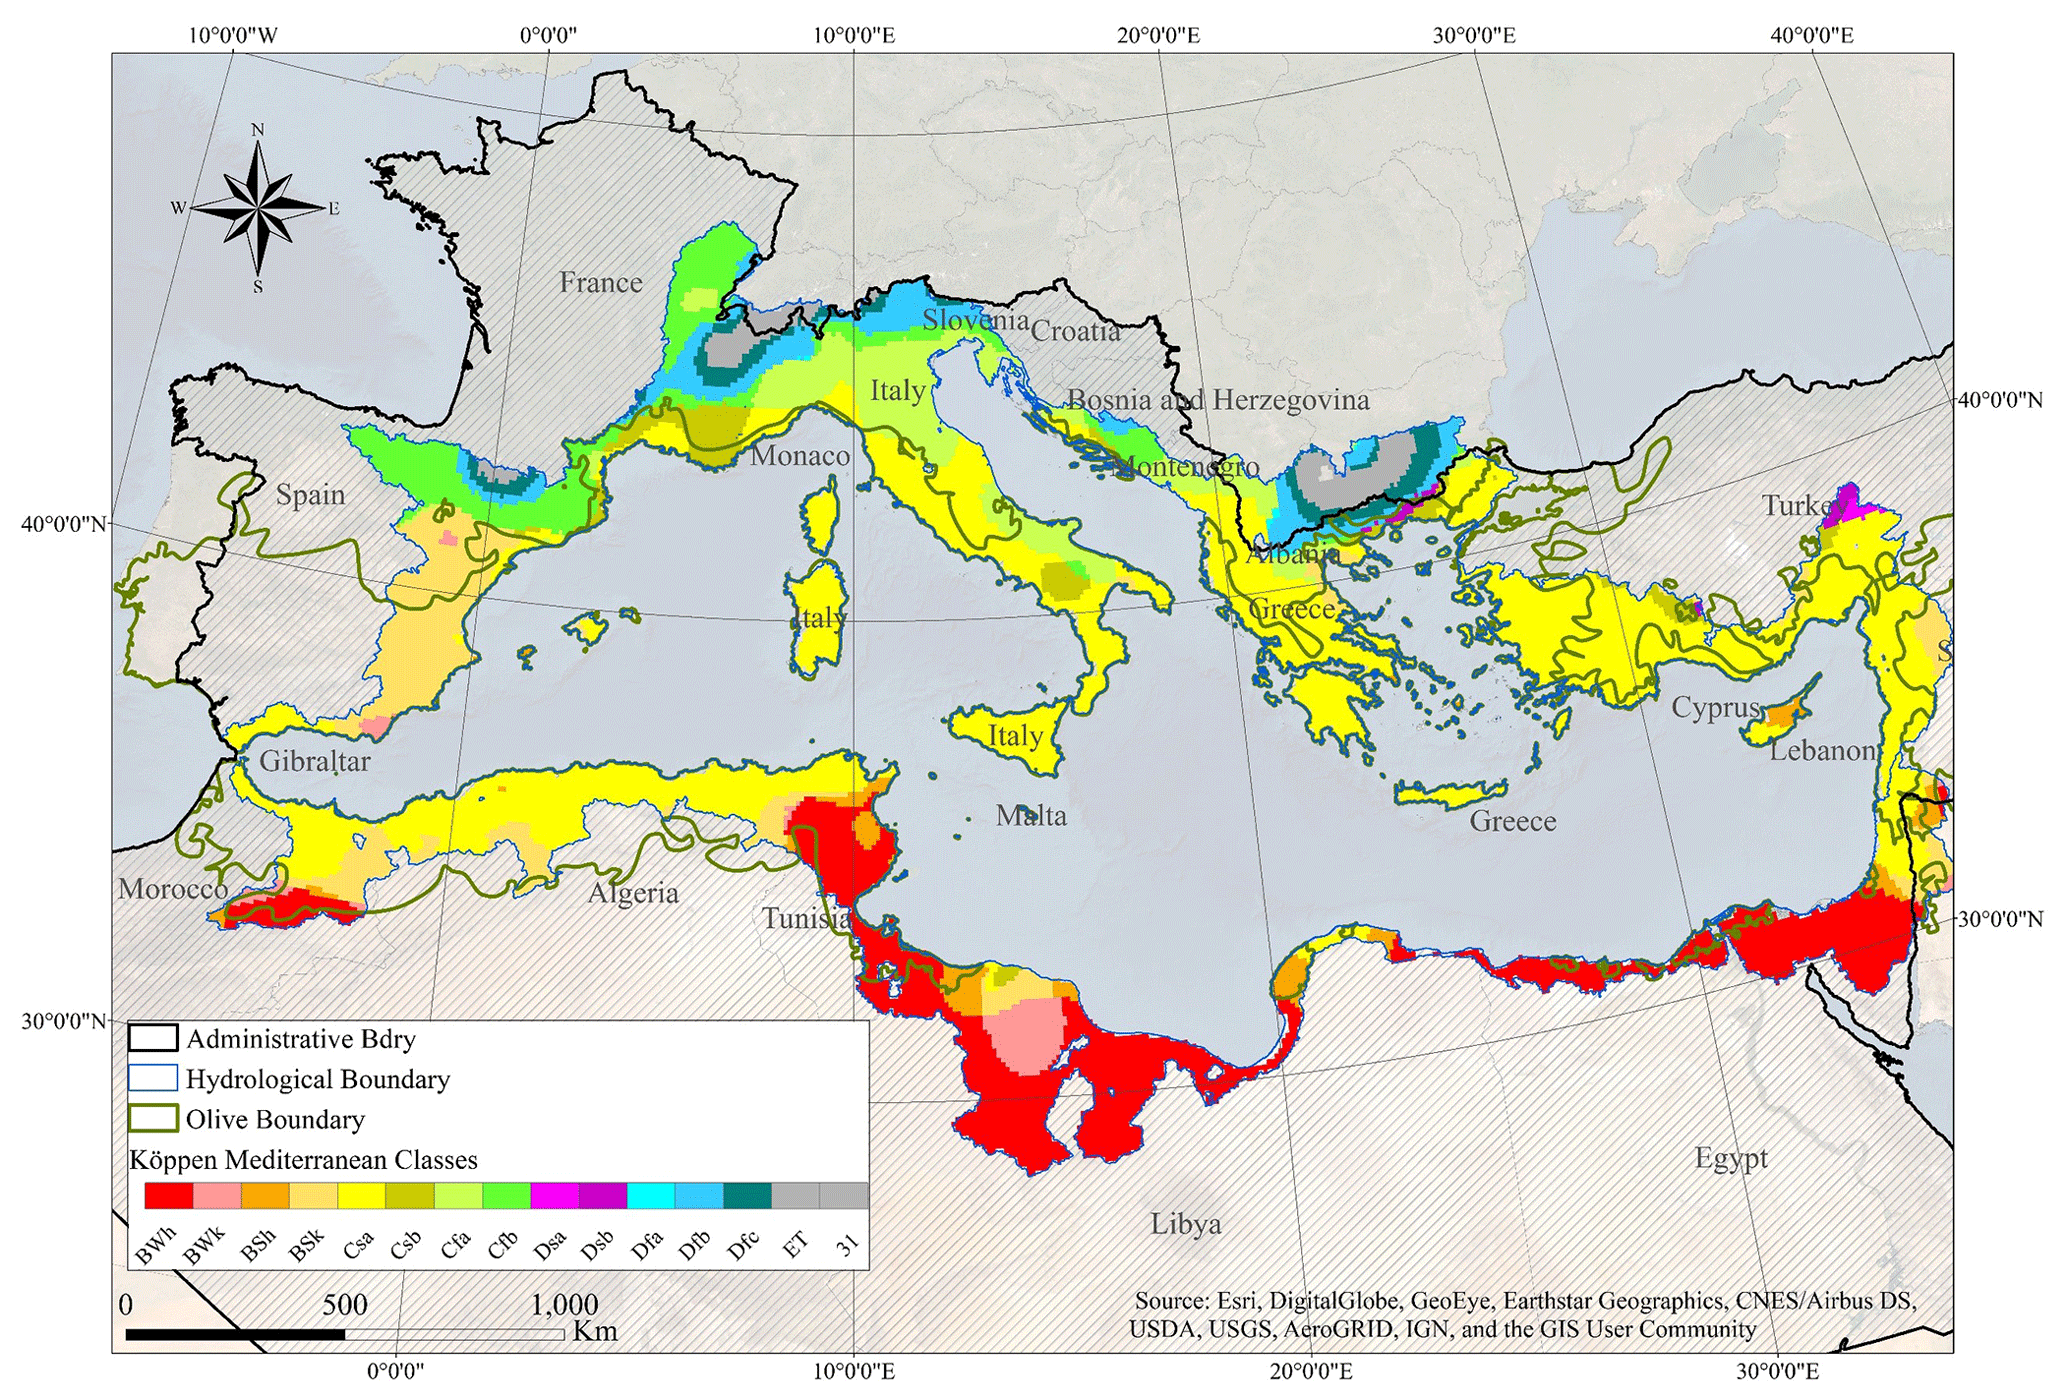
Figure 1Four Mediterranean region boundaries (Merheb et al., 2016); first administrative, second topographic (Milano, 2013), third olive cultivation (Moreno, 2014), and fourth climatic (Peel et al., 2007).
There are several climate classification studies of the Mediterranean region; among these we cite Köppen–Geiger classification at the global scale in which the Mediterranean climate is very distinctive (Köppen, 1936; Peel et al., 2007; Eveno et al., 2016). Köppen's classification divides the globe into 30 climate zones and relies on a partition hierarchy. It is based on precipitation and temperature indices where Mediterranean climate corresponds to dry hot or dry warm summer where the precipitation in the driest month in summer is either below 40 mm or below the third of the precipitation in the wettest month in winter (Cs) and the air temperature of the warmest month is above 22 ∘C (Csa) or the number of months with air temperature above 10 ∘C exceeds 4 (Csb). The (Cs) climate does not reign all over the Mediterranean region, as Köppen (B) classes are also observable. (B) classes correspond to arid climate in general, with (BWh) the desertic and hot climate that dominates Egypt and Libya characterized by very low precipitation (MAP < 5 × Pthreshold with Pthreshold=2 × MAT) and high temperature (MAT ≥ 18 ∘C), (BSk) the arid steppe cold climate that dominates south-eastern Spain characterized by low precipitation (5×Pthreshold > MAP > 10×Pthreshold) and low temperature (MAT < 18 ∘C), (Cf) the temperate climate without any dry season in the regions of Thessaloniki and Veneto, and finally (D) cold climate present further north. On the other hand, and at a global scale, some regions share a similar Mediterranean (Cs) climate, such as California, Chile, South Africa, and Australia (Fig. 1). Rivoire et al. (2019) classified 160 Mediterranean rain gauges according to monthly net precipitation (P−ET0). The classification showed a marked distinction between two clusters, with northern stations having a precipitation deficit from April to September and southern stations having a precipitation deficit from March to October. Other climatic classifications were also carried out in the Mediterranean but at the national scale like in France, using ascending hierarchical automatic classification based on a 1976-rain-gauge network for the 1971–1990 period (Champeaux and Tamburini, 1996). In Turkey seven different climate zones were identified by using Ward's hierarchical cluster analysis based on data from 113 climate stations for the 1951–1998 period (Unal et al., 2003). Another reclassification of rainfall regions of Turkey was also carried out in 2011 by K-means based on 148 stations covering the 1977–2006 period (Sönmez and Kömüşcü, 2011). We also mention the classification of cyclonic trajectory information using K-means clustering for an 18-year period over the Mediterranean (Trigo et al., 1999). Synoptic meteorology uses discriminant analysis over the eastern Mediterranean for 1948–2000 (Alpert et al., 2004). Cloud physical property classification at the pixel level uses K-means applied over the European Mediterranean region (Chéruy and Aires, 2009). The hydrological classification of 40 Mediterranean streams' natural flow regimes uses principal component analysis (PCA) to identify the most representative Richter hydrological indices and agglomerative cluster analysis (Oueslati et al., 2015). However, no specific classification based on precipitation and temperature series has yet treated the Mediterranean region as a climatic or hydrological unit, hence the aim of our study.
The objective of this study is first to establish a Mediterranean-specific climatic classification for hydrology purposes based on a set of indices, mainly seasonality and aridity, and second to estimate the future evolution of this classification based on Radiative Concentration Pathway (RCP) scenarios with an easy follow-up tool using olive cultivation evolution in the Mediterranean.
Through the classification of the Mediterranean catchments climatically and, in a second step, physiographically, we will be able to characterize their hydrological patterns and identify homogeneous regions which will be useful for the prediction of ungauged basins (Wagener et al., 2007; Hrachowitz et al., 2013). This study is a contribution to the HyMeX (HYdrological cycle in the Mediterranean Experiment) programme and to the Med-CORDEX initiative. The HyMeX programme aims at a better understanding of the Mediterranean hydrology, with emphasis on the predictability and evolution of decadal variability in the context of global change. Med-CORDEX, a HyMeX initiative (Ruti et al., 2016), is part of the COordinated Regional Downscaling EXperiment specific to the Mediterranean that aims at improving our understanding of climate change through high-resolution atmosphere regional climate models (RCMs). RCMs were introduced in the late 1980s as a nested technique in global climate models (GCMs) to consider regional-scale climatic forcings caused by the complex physiographic features and small-scale circulation features (Giorgi, 2006). The primary application of RCMs has been in the development of climate change scenarios, of which we mention the ALADIN RCM (Aire Limitée Adaptation dynamique Développement InterNational) developed by Météo France and the CCLM (Cosmo Climate Limited-area Model) developed by the German Weather Service (DWD), both applied for the EURO-CORDEX and MED-CORDEX projects (Rockel et al., 2008; Tramblay et al., 2013). We aim in this study to discuss the results of the individual models and not to compare their performances; such a study was carried out for EURO-CORDEX with 17 RCM models for the representation of the basic spatiotemporal patterns of the European climate for the period 1989–2008 (Kotlarski et al., 2014).
This paper is structured into six sections: Sect. 1 Introduction; Sect. 2 presents the Mediterranean limits and the database; Sect. 3 the classification approach based on PCA, K-means, and the decision tree with the presentation of MED-CORDEX atmosphere-RCM climate change scenarios; Sect. 4 the results of WorldClim-2 classification of gridded indices, verification of stations and comparison to catchment indices, and classification projection and impacts under MED-CORDEX scenarios; followed by a discussion in Sect. 5 before concluding with Sect. 6.
2.1 Defining the Mediterranean region boundaries
From the Latin word “Mediterranĕus” meaning “in the middle of lands”, the Mediterranean refers to the sea and bordering region located in the middle of the ecumene between the European, African, and Asiatic continents. With Köppen's classification (Köppen, 1936), the definition designated henceforth a moderate climate and extended geographically beyond the limits of the Mediterranean Sea. The question that arises is how the Mediterranean boundary would be defined. Several definitions of the Mediterranean boundary have been previously mentioned by Merheb et al. (2016) as collected from the literature; a hydrological boundary was adopted for this study as shown in Fig. 1.
-
The climatic boundary could be defined according to Köppen's classification where a set of regions shares similar temperature and precipitation characteristics and is known for their warm and dry summers and cold and humid winters. It is limited by the African desert to the south and the temperate European countries to the north. This boundary might change according to the definition of this similarity.
-
The hydrological boundary is defined by the set of catchments draining towards the Mediterranean Sea (Milano, 2013). This definition neglects some Mediterranean climate regions like Portugal and western Spain and favours geographically adjacent regions like Egypt and Libya.
-
The agricultural–bioclimatic boundary consists of the set of regions sharing the same types of vegetation considered to be indicators of the Mediterranean region, such as olives (Moreno, 2014). This definition is linked to human activity with the same nuances as the climatic limit.
-
The administrative boundaries of countries adjacent to the Mediterranean Sea have a problematic definition independent of any natural basis (Wainwright and Thornes, 2004). These boundaries include several climatic classes and cover larger areas than the topographical limits.
2.2 Catchments
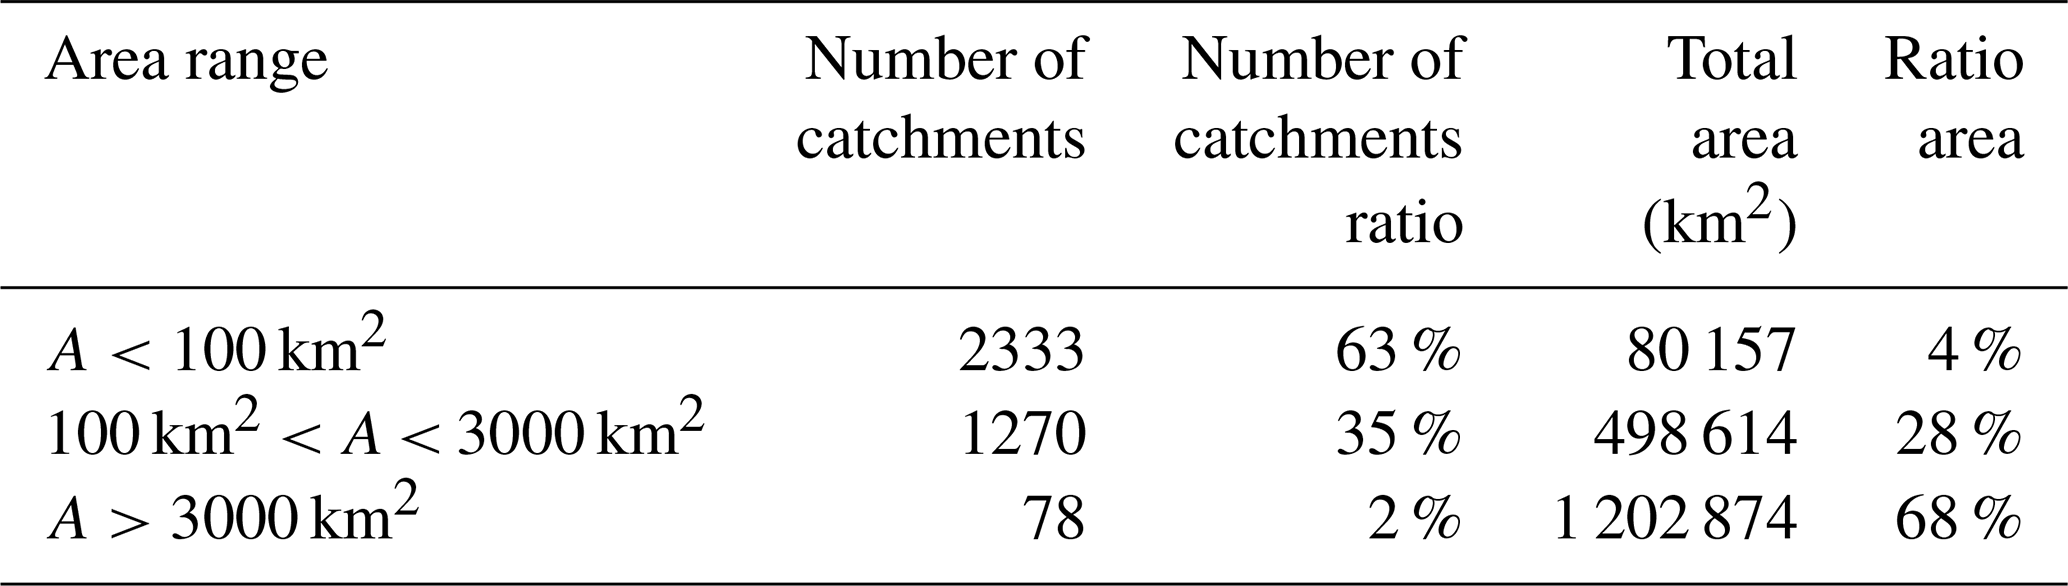
Since the geographic extent of the study is very wide, the delimitation of catchments was imported from international references. The European Commission, using the Joint Research Centre (JRC), has done extensive and elaborate work on the delimitation of catchments in Europe and some adjacent countries as part of the Catchment Characterization and Modelling (CMM) project (de Jager and Vogt, 2010). For catchments in the Middle East and northern Africa, catchments from HydroSHEDS, the World Wildlife Fund's project, were used (Lehner and Grill, 2013). According to these databases, the total number of catchments extracted at their main stem outlet to the Mediterranean coastline and exceeding 1 km2 is 3681, covering a total area of 1 781 645 km2. It should be noted that the Nile was omitted for its extent 3500 km to the south of the Mediterranean. Catchment surface distribution is shown in Table 1, where middle-range catchments, between 100 and 3000 km2, constitute 35 % of the total and cover 28 % of the total area.
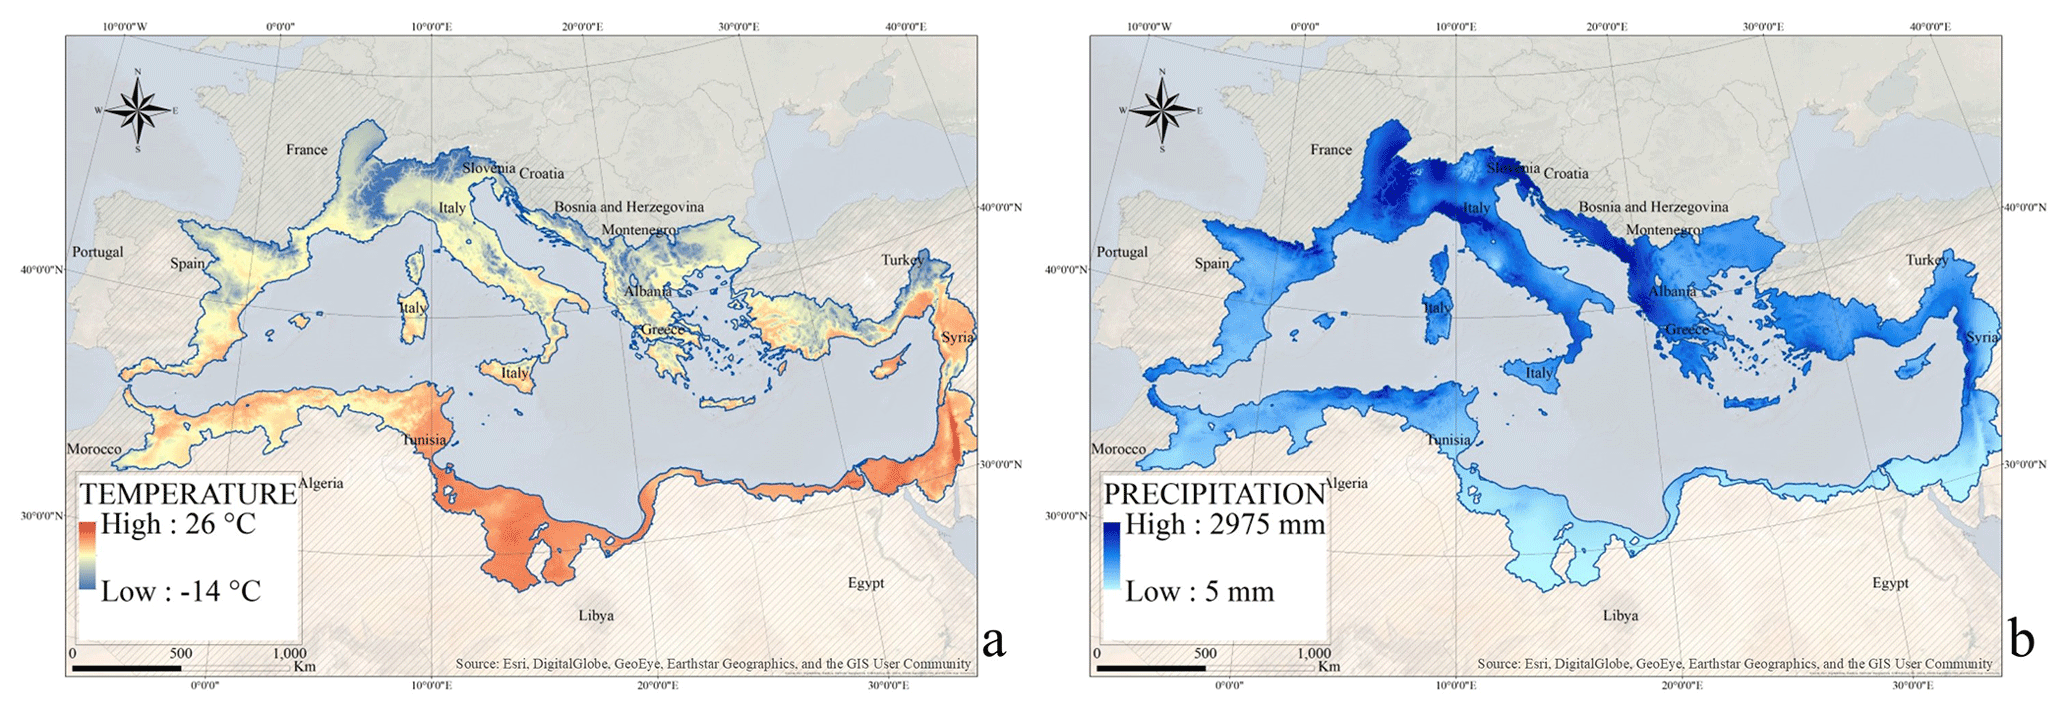
Figure 2WorldClim-2 gridded mean annual temperature in ∘C (a) and mean annual precipitation in mm (b) from Fick and Hijmans (2017).
Table 1Catchment distribution per area and ratio to total area.
2.3 Climatic data
Three types of monthly climatic data were used in this study: (1) WorldClim-2 new 1 km spatial resolution climate surface data (Fick and Hijmans, 2017), (2) time series of 144 stations from the NOAA database of 20 different Mediterranean countries covering a period of 30 to 120 years used for validation purposes, and (3) MED-CORDEX historical and projected data simulated under the RCP4.5 and 8.5 scenarios for future projections (Tramblay et al., 2013).
-
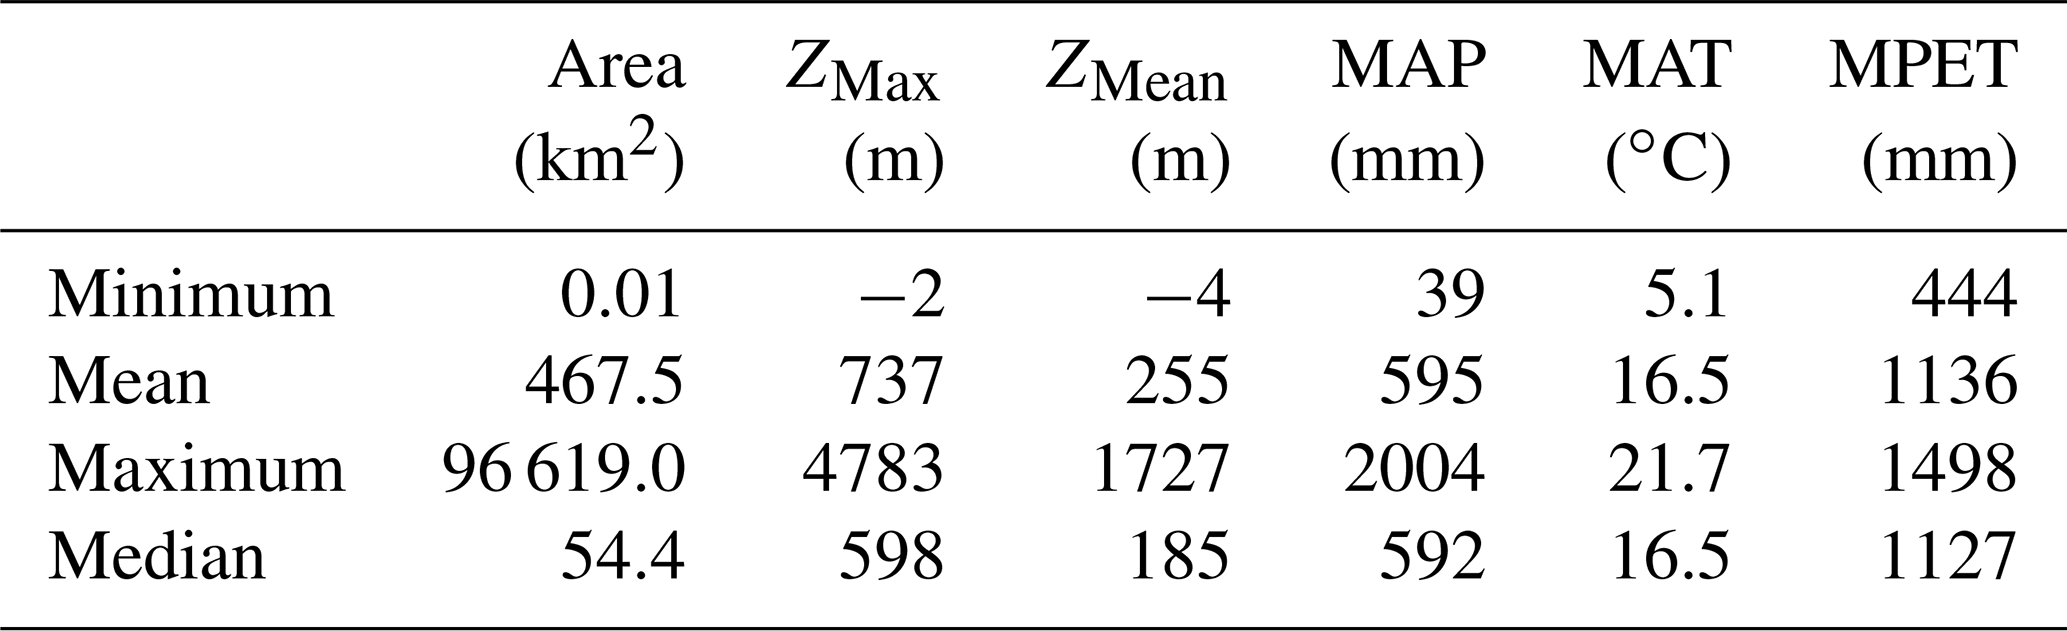
WorldClim-2 new 1 km spatial resolution climate surface data, which consist of long-term average monthly temperature and precipitation, solar radiation, vapour pressure, and wind speed data, aggregated across a target temporal range of 1970–2000, using data from 9000 to 60 000 weather stations (Fick and Hijmans, 2017). The WorldClim-2 database is a refined and expanded version of the 2005 WorldClim-1 database (Hijmans et al., 2005). This database covers the whole study area; thus, climatic classification of Mediterranean catchments was possible. The WorldClim-2 database was built over 23 regions with different coverage for each parameter. For the precipitation an overlap of three regions covered the Mediterranean area, with a total of 10 410 stations for the three regions (western Europe n=3730; eastern Europe n=3632; northern Africa n=3048). For average temperature, the Mediterranean was covered by one region (eu1) with number of stations n=1760; n=1627 for maximum temperature and n=1626 for minimum temperature; refer to Figs. S1 and S2 in the supporting information of the Fick and Hijmans (2017) article. Monthly precipitation and temperature were averaged for each catchment and then climatic indices calculated at both grid and catchment scale. Climatic characteristics of a Mediterranean catchment are summarized and illustrated in Table 2 and Fig. 2, reflecting the wide variability of mean annual precipitation ranging between 5 (“Jabal el Aswad desert in Libya”) and 3000 mm (Kobarid in Slovenia) and mean annual temperature ranging between −14 ∘C (Mont Blanc, Alps, France) and +26 ∘C (Karak, Jordan), where some catchments receive 50 times the amount of precipitation more than others while being 4 times colder.
-
144 ground weather station data covering the whole study area served to validate the Mediterranean climate classification, with 105 stations located within catchment boundaries and 39 outside. Also, 102 of these stations were located within Köppen's (Csa) and (Csb) Mediterranean climate, and 42 outside. These stations belong to the Global Historical Climatology Network – GHCN (Menne et al., 2012) – and are recognized by the World Meteorological Organization (WMO); they are available for free access on the portal of the National Administration of Oceans and Atmosphere of the United States (NOAA). The average length of data series is 60 years and ranges between 30 and 120 years at a monthly time step. The 1960–1990 period is common to all stations. The data quality was verified (i.e. ellipse of Bois, 1987), and only complete hydrological years were retained for indices calculation.
-
MED-CORDEX simulations of the regional climate models (RCMs) ALADIN-Climate v5.2 at 12 km and CCLM at a 50 km spatial resolution grid were used to analyse the climate change impacts on the climatic classification for the end of the century projection period 2070–2100 and for two different RCP4.5 and 8.5 scenarios in comparison to the historical 1970–2000 baseline period (Rockel et al., 2008; Tramblay et al., 2013). We limited the climate change study to the ALADIN and CCLM models since when the article was written those were the only MED-CORDEX models to present the simulation results for RCP4.5 and 8.5 for the 2070–2100 period with the three required variables available (average temperature – tas, average precipitation – pr, and average radiation – rlds).
Table 2Statistical summaries for the catchment climatic parameters maximum altitude (ZMax), mean altitude (ZMean), mean annual precipitation (MAP), mean annual temperature (MAT), and mean potential evapotranspiration (MPET).
RCP or Radiative Concentration Pathway is a greenhouse gas (GHG) concentration trajectory adopted by the International Panel for Climate Change (IPCC) for its fifth Assessment Report (AR5) in 2014. RCP4.5 and 8.5 were chosen between four available scenarios, being the most focused on in the literature. RCP4.5 assumes that global annual emissions measured in CO2 equivalents peak around 2040, with emissions declining substantially thereafter, while under RCP8.5, emissions continue to rise throughout the 21st century. RCP4.5 (RCP8.5) means that the GHG and aerosol concentrations evolve in a way that leads to an additional radiative forcing equal to +4.5 W m−2 (+8.5 W m−2) at the end of the 21st century with respect to the pre-industrial climate. Consequently, RCP4.5 can be considered an optimistic scenario, whereas RCP8.5 is a more pessimistic option (Giorgi et al., 2009; IPCC, 2013; Ruti et al., 2016).
While temperature increase and precipitation decrease have already been observed (IPCC, 2013), MED-CORDEX RCP4.5 scenario projections, as simulated by ALADIN v5.2 for the 2071–2100 period (Tramblay et al., 2013; Dell'Aquila et al., 2018; Drobinski et al., 2018; Tramblay et al., 2018), estimate a spatially distributed temperature increase of 1.4 to 3.5 ∘C and a precipitation evolution of ±10 %, while RCP8.5 projects an increase of 2.2 to 6.4 ∘C and a precipitation evolution of ±20 % compared with the baseline period 1970–2000 with expected shifts of Mediterranean climate and expansion of arid regions (Beck et al., 2018; Barredo et al., 2019) and related water restrictions and legal decision-making processes (Sauquet et al., 2019).
The use of ground-based station time series or gridded observational data is limited by several uncertainties, mainly density and interpolation processing methods, especially in the Mediterranean region, where northern African and Levantine countries are poorly covered (Raymond et al., 2016; Zittis, 2018). Nevertheless, the use of specific indices like seasonality and aridity, which are averaged on 30-year periods and based on monthly and annual values, while avoiding extreme event indices, reduces data quality uncertainties. On the other hand, several studies have revealed the uncertainties connected to the resolution of RCM-simulated gridded data in the Mediterranean complex domain (Romera et al., 2015), hence the use of high-resolution data like MED-CORDEX 12 and 50 km grids and WorldClim-2 1 km, and overall, the regional aspect of this study makes it less sensitive to local errors.
The suggested methodology includes first the definition of the climatic indices, of which some are classic, like the frequency indices, and others are specific to the Mediterranean climate, like precipitation seasonality. Second, there is a PCA to reduce the number of climate indices and consider only the most contributing ones. Third, there are K-means classification according to the most contributing indices and finally the construction of a decision tree based on distances to class kernels to determine whether or not a place has a Mediterranean climate and to which type it belongs. This approach was applied at grid scale, verified on a set of ground stations, and then compared to a catchment-scale classification where indices are calculated from averaged climatic variables of each catchment. Each class was described and characterized by its corresponding climatic indices. The Mediterranean climatic class evolution was assessed according to indices variation based on simulated RCP scenarios and by following up the olive tree cultivation boundary as an example of a historical Mediterranean-specific bioindicator. The olive reproductive cycle displays considerable variations due to climate evolution among others, influencing flowering intensity mainly affected by seasonal temperature and water availability (Moreno, 2014).
3.1 Hydrology-driven climatic indices
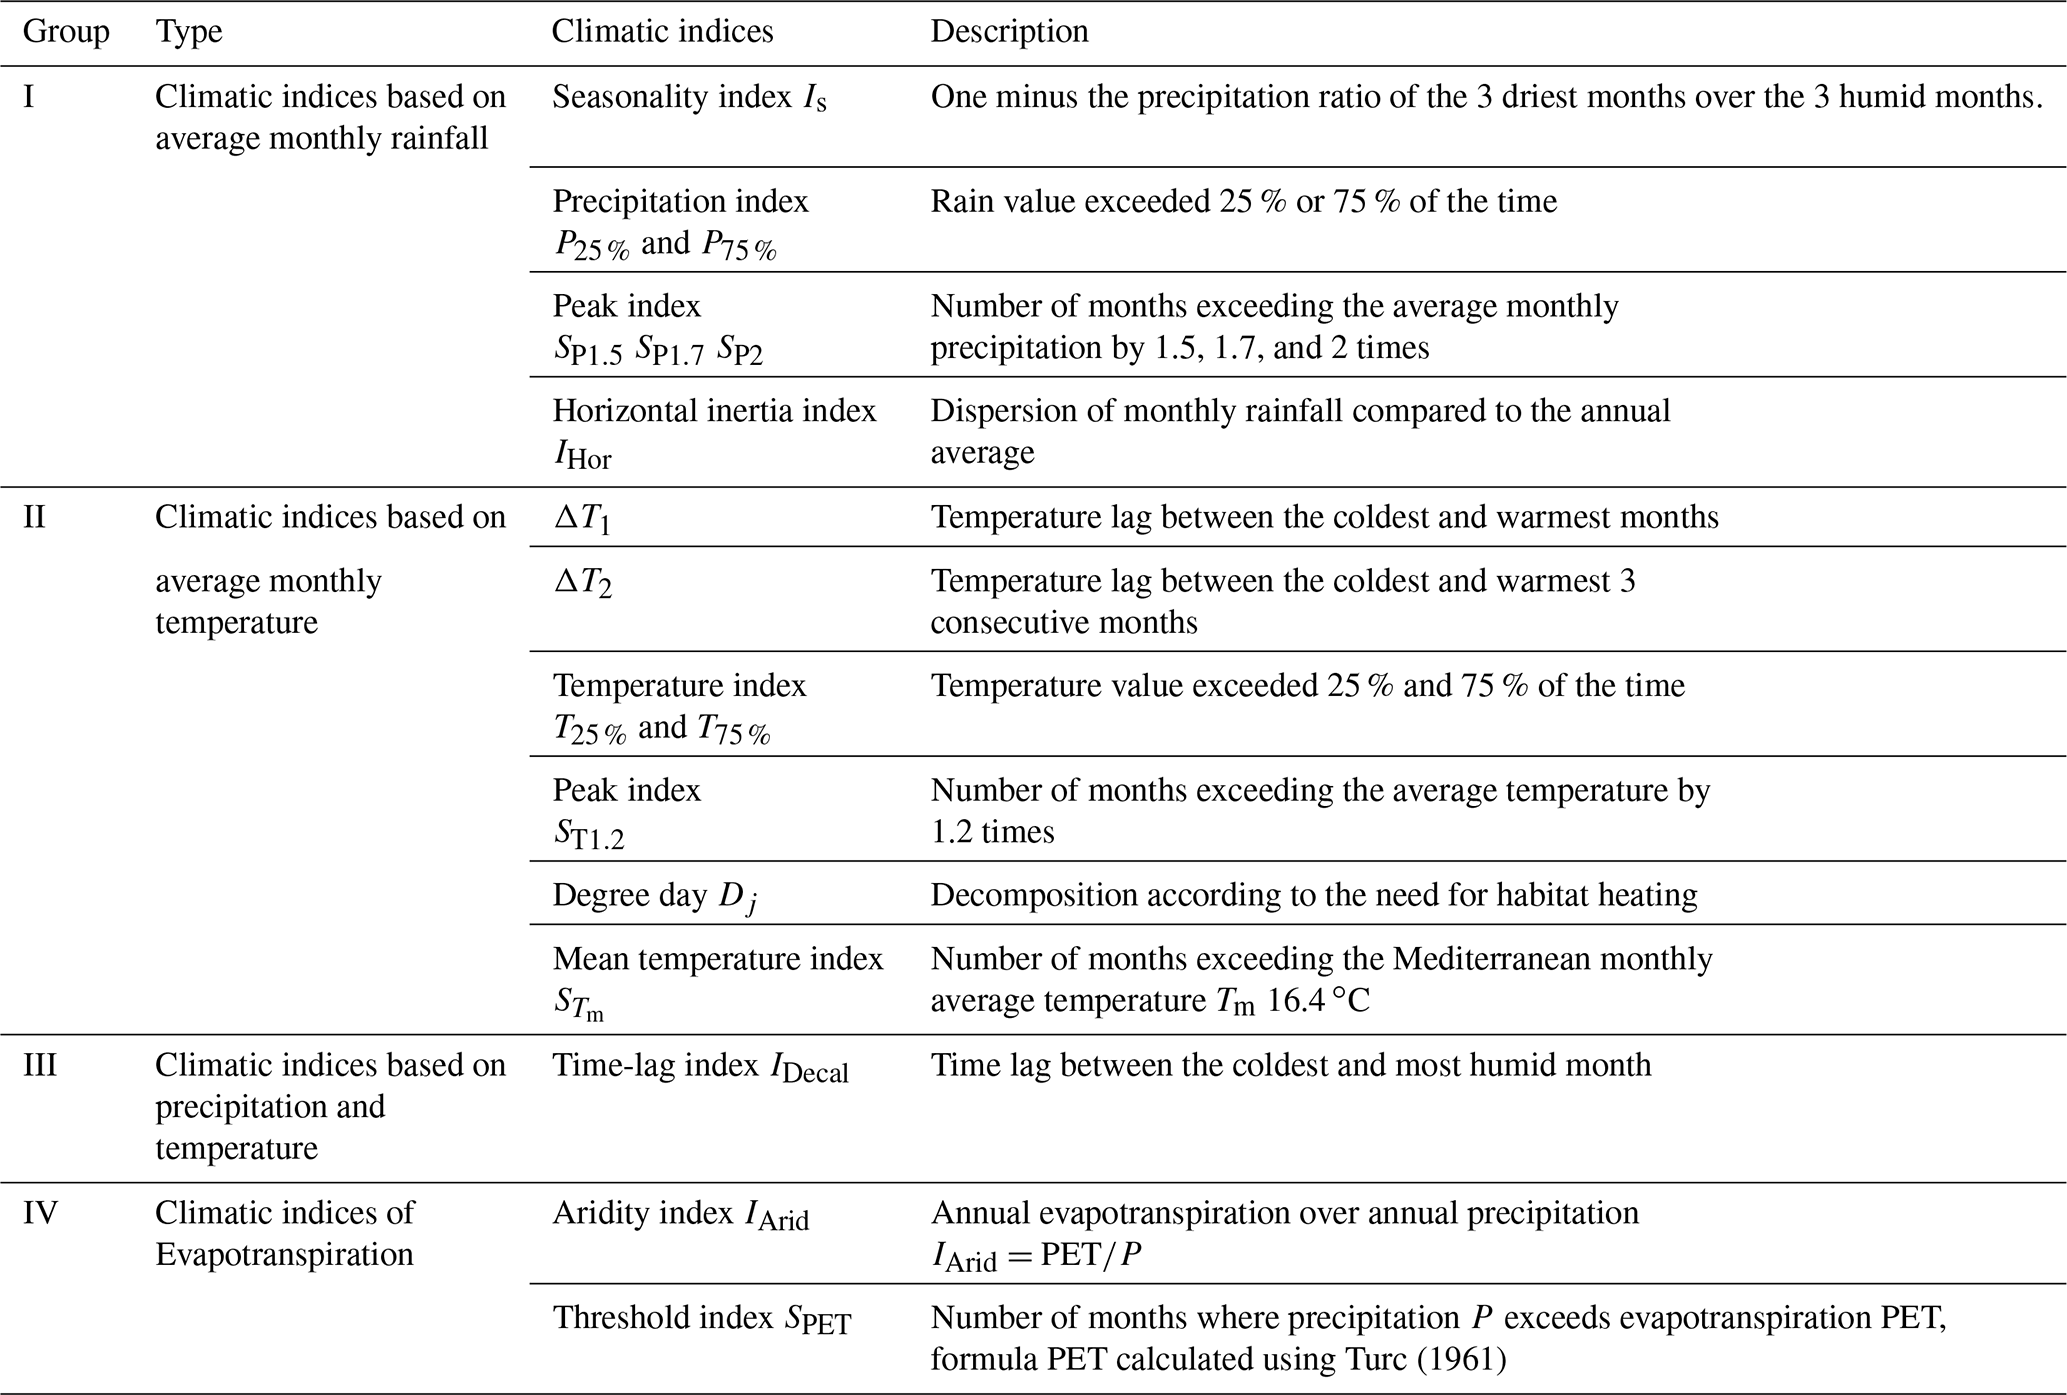
The hydrology-driven independent climatic indices were chosen subjectively and developed at the grid and catchment scales from WorldClim-2 monthly average data and divided into four groups to highlight the Mediterranean seasonality and precipitation intermittence hypothesis of the climate and its corresponding hydrological response. The climatic indices were inspired by Köppen's definition of Mediterranean climates to emphasize the precipitation and temperature variability between seasons and from the components of the water balance in its general form (P: precipitation, S: surface runoff, U: underground runoff, V: evapotranspiration) to highlight the link between climate and hydrology. Hence Group I and II indices Is, P25 %, P75 %, and IDecal characterize Mediterranean precipitation P in its seasonality and monthly distribution. Group II and IV indices SPET, IArid, T25 %, and T75 % characterize the hydrological loss to evapotranspiration in the Mediterranean. While the flow seasonality is clearly affected by the precipitation seasonality, the other indices help in fine-tuning this theory, like monthly temperature and potential evapotranspiration variation. A complete list of indices with a description of each is in Table 3.
-
Group I: indices based on monthly precipitation, of which we mention seasonality index Is, peak indices P1.5, P2, and frequency indices P25 %, P75 %. Is is directly linked to Mediterranean flow regimes for expressing the precipitation ratio between the 3 most humid months and the 3 driest months, with values ranging from 0 to 1 (Hreiche, 2003). Is values tending towards 0 express uniform distribution of precipitation along the year with a hydrological response lacking flood and drought seasons, while Is values tending towards 1 correspond to a normal distribution of precipitation with a hydrological response more likely to show flood and drought seasons.
-
Group II: indices based on monthly temperature expressed by the temperature lag between the coldest and warmest months ΔT1, frequency indices T25 %, and number of months exceeding the average Mediterranean temperature .
-
Group III: indices based on both temperature and precipitation expressed by IDecal, the time lag between the coldest and most humid months.
-
Group IV: indices based on precipitation and evapotranspiration expressed by aridity index IArid. The evapotranspiration was estimated according to Turc's formula (Turc, 1961), chosen for its application simplicity and adequacy for Mediterranean humid areas in southern European countries, as it was originally developed for southern France and northern African countries (Trajković and Stojnić, 2007; Trajković and Kolaković, 2009; Jensen and Allen, 2016). Turc's formula is mainly based on temperature and radiation, two stable parameters on the regional scale which reduce the uncertainties when using a regionalized dataset such as WorldClim-2. Group II and IV indices describe the seasonality and variability of evapotranspiration and intermittence of wet and dry seasons.
3.2 Principle component analysis
Principal component analysis is widely applied to reduce the dimensionality of datasets and keep the most representative and uncorrelated variables. This section presents a brief description of the method along with some of their applications in hydrology. For an extensive mathematical description and demonstration of these methods, we advise the reader to consult Krzanowski (1988) and Jollife (2002).
PCA was first introduced by Karl Pearson (Pearson, 1901) and then developed by Harold Hotelling (Hotelling, 1933). Hotelling's (1933) motivation is that there may be a smaller fundamental set of independent variables which determine the values and conserve the maximum amount of information of the original variables (Jolliffe, 2002). This is achieved by transforming a vector of p random variables to a new set of variables, named principal components (PCs), by looking for a linear function of the elements with maximum variance and next looking for another linear function uncorrelated with the first and having maximum variance and so on up to p PCs. It is hoped in general that most of the variation will be accounted for by m PCs, where m<p.
The number of indices is reduced at two steps. The first step is based on the correlation matrix, where strongly correlated indices were eliminated (a threshold of 0.85 was chosen for this study). The second is based on PCA results, where indices that do not contribute to the principal components that represent the greatest variabilities are eliminated.
3.3 K-means clustering technique
Cluster analysis consists of data points partitioning into isolated groups while minimizing the distance between the same cluster data points and maximizing it between different clusters. One of the most popular clustering methods is the K-means method introduced by Edward Forgy (Forgy, 1965) and MacQueen (1967). It aims to minimize the square error objective function for distance optimization. The optimization steps begin with (1) kernel initialization, the kernel being a virtual point representing the statistical centre of a class, (2) updating classes, (3) re-evaluation of kernels, and (4) repetition of steps (2) and (3) until stabilization. The quality of the solution thus found strongly depends on the initial kernels. In its turn, kernel initialization is sensitive to the data dimensionality. Classification gives a deterministic result where each point should belong to one of the classes, a result of a set of decision rules based on its distances to class kernels.
The application of K-means requires the setting of a number of classes; otherwise, the optimization leads to as many classes as individuals. The optimum number of classes K could be defined according to the elbow method (Bholowalia and Kumar, 2014).
K-means has gained in reputation in the last decades and has been widely applied in the hydrology field for cloud classification from satellite imagery (Desbois et al., 1982) and for climatic classification using measured and simulated time series (Moron et al., 2008; Carvalho et al. 2016) for catchment classification based on streamflow characterization and precipitation (Toth, 2013). K-means classification was applied, and indices were distributed into five classes of kernels to determine whether they belong, or not, to a Mediterranean climate and to which type they belong, if so. We hoped for a classification that delimits the Mediterranean climate from the south and north and divides the intermediate coastal zone. Therefore, a distribution into five classes was chosen despite three classes being optimal as per the elbow method, in detail, one class that covers the southern desertic region, another class that covers the northern continental region of non-Mediterranean climate, and three classes that cover the intermediate coastal region. A larger number of classes would produce an uninterpretable fragmented classification.
3.4 Decision tree
A decision tree is a set of distance criteria or questions in the form of a hierarchy that leads to an intended classification (Breiman, 1984). To classify new points or stations or to reproduce the classification on another dataset, it suffices to define the distance criterion to the various kernels of the climatic classes by predicting values of a dependent variable based on values of predictor variables from a reference classification. This procedure provides validation tools for exploratory and confirmatory classification analysis.
We generated a decision tree based on the distances to the clusters' kernels obtained from the gridded indices classification. The aim of this decision tree is to easily reproduce the classification with the same kernels rather than to repeat the whole classification process, which will modify the clusters and their kernels. By conserving the same kernels, the decision tree will permit us to follow up the climate evolution and its impact on the classification under other scenarios.
In our case, the dependent variables are the climatic classes obtained from K-means clustering, while the predictor variables are the distances to each cluster's kernels. This procedure was done for both gridded and catchment classification. The decision tree generates a set of classification rules usually used to classify new stations based on their distances to class kernels. In this study, these rules were used in Sect. 5 to classify the projected indices. This has fixed the class kernel indices of the 1970–2000 baseline period and calculated the distances to the baseline of the 2070–2100 projected grid to compare both the classification indices and the spatial evolution.
3.5 RCP scenarios
For climate change impact assessment, temperature and precipitation delta change were calculated between both baseline period 1970–2000 and projected period 2070–2100 for the MED-CORDEX RCM ALADIN and RCM CCLM grids and for two different RCP scenarios (RCP4.5 and RCP8.5). Those delta changes were then superimposed on the WorldClim-2 grid, based on the nearest Euclidean distance between MED-CORDEX grid cells and WorldClim-2 grid cells using the GIS spatial join toolbox. The indices were then recalculated using the projected values of monthly temperatures and precipitation. The decision tree rules from Table 6 were then applied for the projected period and the climate change under RCP was illustrated in Fig. 7 and expressed by indices evolution between classes in Table 7.
3.6 Adopted methodology
The proposed methodology consisted first in calculating the grid-based climatic indices using WorldClim-2 monthly data, second in reducing the number of indices with the PCA, and third in classifying it using K-means clustering. The gridded indices classification was later verified on the ground station indices and then compared to the catchment-scale-averaged data for future hydrological applications. In addition, a hierarchical decision tree was constructed to avoid repeating the whole process when classifying projected indices. All PCAs, K-means, and decision trees were calculated using SPSS software. Projected indices under RCP scenarios were calculated and classification evolutions were then deduced.
This section details the climatic indices derived from the collected database, the results of PCA/K-means classification of the gridded indices, and their validation on the stations and catchment indices with a decision tree for replicating the classification on new stations or grids.
4.1 PCA results for WorldClim-2 grid-based indices
The number of indices was reduced the first time based on the correlation matrix and the second based on PCA results. We eliminated the strongly correlated indices (correlation higher than 0.85), and 10 indices were kept upon the first step.
-
Is and P75 % are strongly inversely correlated (−0.947). Is was kept.
-
ΔT1 and ΔT2 are strongly correlated (0.992). ΔT1 was kept.
-
T25 % and T75 % are strongly inversely correlated (−0.999). T25 % was kept.
-
P25 %, SP1.7, and SP2 are strongly correlated (0.885, 0.852). P25 % was kept.
-
IHor and IArid are strongly correlated (0.856). IArid was kept.
-
and Dj are strongly inversely correlated (−0.949). was kept.
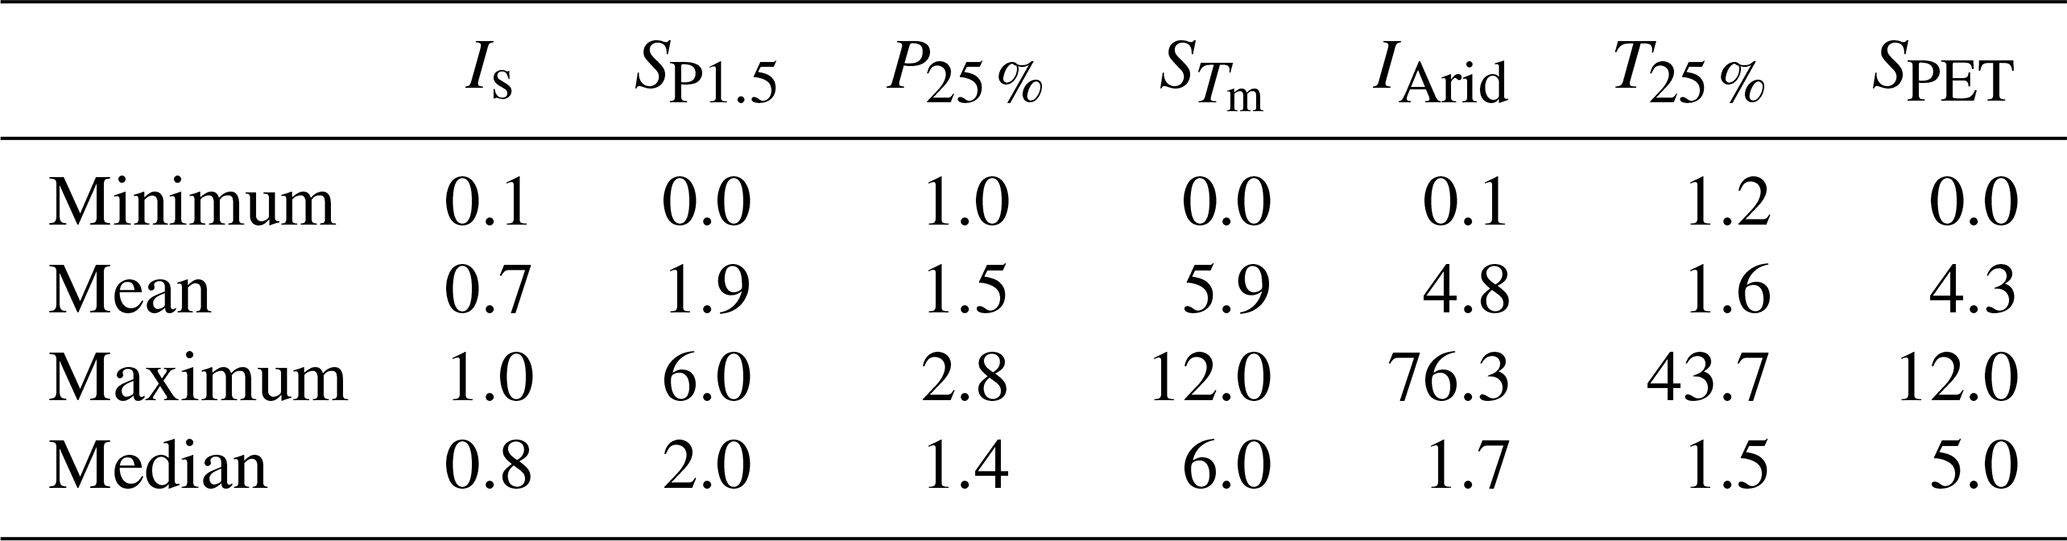
Once the correlation matrix transformed into a diagonal one, it was possible to find the eigenvalues representing the projection from p to k dimensions. The eigenvector matrix is the linear expression of the indices with respect to the principal components. The first eigenvalue 4.8 represents 48 % of the variability, the second 1.09 represents 11 %, and the third 1.02 represents 10 %. The first three factors represent the three greatest variabilities with respect to the following factors, and 68 % of the total variability is thus preserved with this choice. Upon PCA, the number of indices was reduced to 7, showing that Is, SP1.5, P25 %, , IArid, T25 %, and SPET were the most contributing climatic indices, with 68 % of the total variance explained. Statistical summaries are shown in Table 4, with Is values ranging between 0.06 and 1 with an average of 0.7 highlighting Mediterranean seasonality.
Table 4Statistical summaries of the PCA-selected grid-based climatic indices using WorldClim-2 monthly data.
4.2 Grid-based classification
The K-means classification shown in Fig. 3 is distributed into five classes.
-
Class 1: present between Egypt and Libya, highlighting a desertic influence with few rain episodes registered per year, if any, expressed by Is=0.99 and IArid=39.8 on average. Precipitation never exceeds evapotranspiration in this region, hence SPET=0.
-
Class 2: mainly present in the south and east of the Mediterranean, characterized by a high seasonality Is=0.98 and high aridity IArid=9.27.
-
Class 3: dominates the central region from the southern tip of Spain to Syria with an average seasonality Is=0.87.
-
Class 4: covers mainly coastal catchments in north-western countries, south-eastern Italy, and western Greece and present discontinuously in the south-west. Is=0.62 in this class.
-
Class 5: only present in northern non-coastal catchments and characterized by a low seasonality Is=0.42.
In comparison to Köppen's, classes 2–4 match with (Csa), while classes 1 and 5 are mainly outside (Csa) and (Csb), henceforth defined as non-Mediterranean climate. The main difference with Köppen's Mediterranean classes is in southern Spain, defined as an arid climate (Bsk), while in the present classification it varies between classes 2 and 4. This new distribution indicates climate variability within (Csa) or (Csb), hence the importance of a fine gridded classification. This variability is highlighted in the class kernel indices (Fig. 4) and is mainly due to the complex seasonality across the Mediterranean. This complexity is shown here more delicately than the one defined by Köppen, which is climate-oriented only and limited to the simple criteria of a wet winter and dry or temperate summer. Therefore, we think that a hydrology-oriented climatic classification should account for an intra-climate characteristic expressed by specific indices like the one shown here, specific to the Mediterranean and expressed by Is.
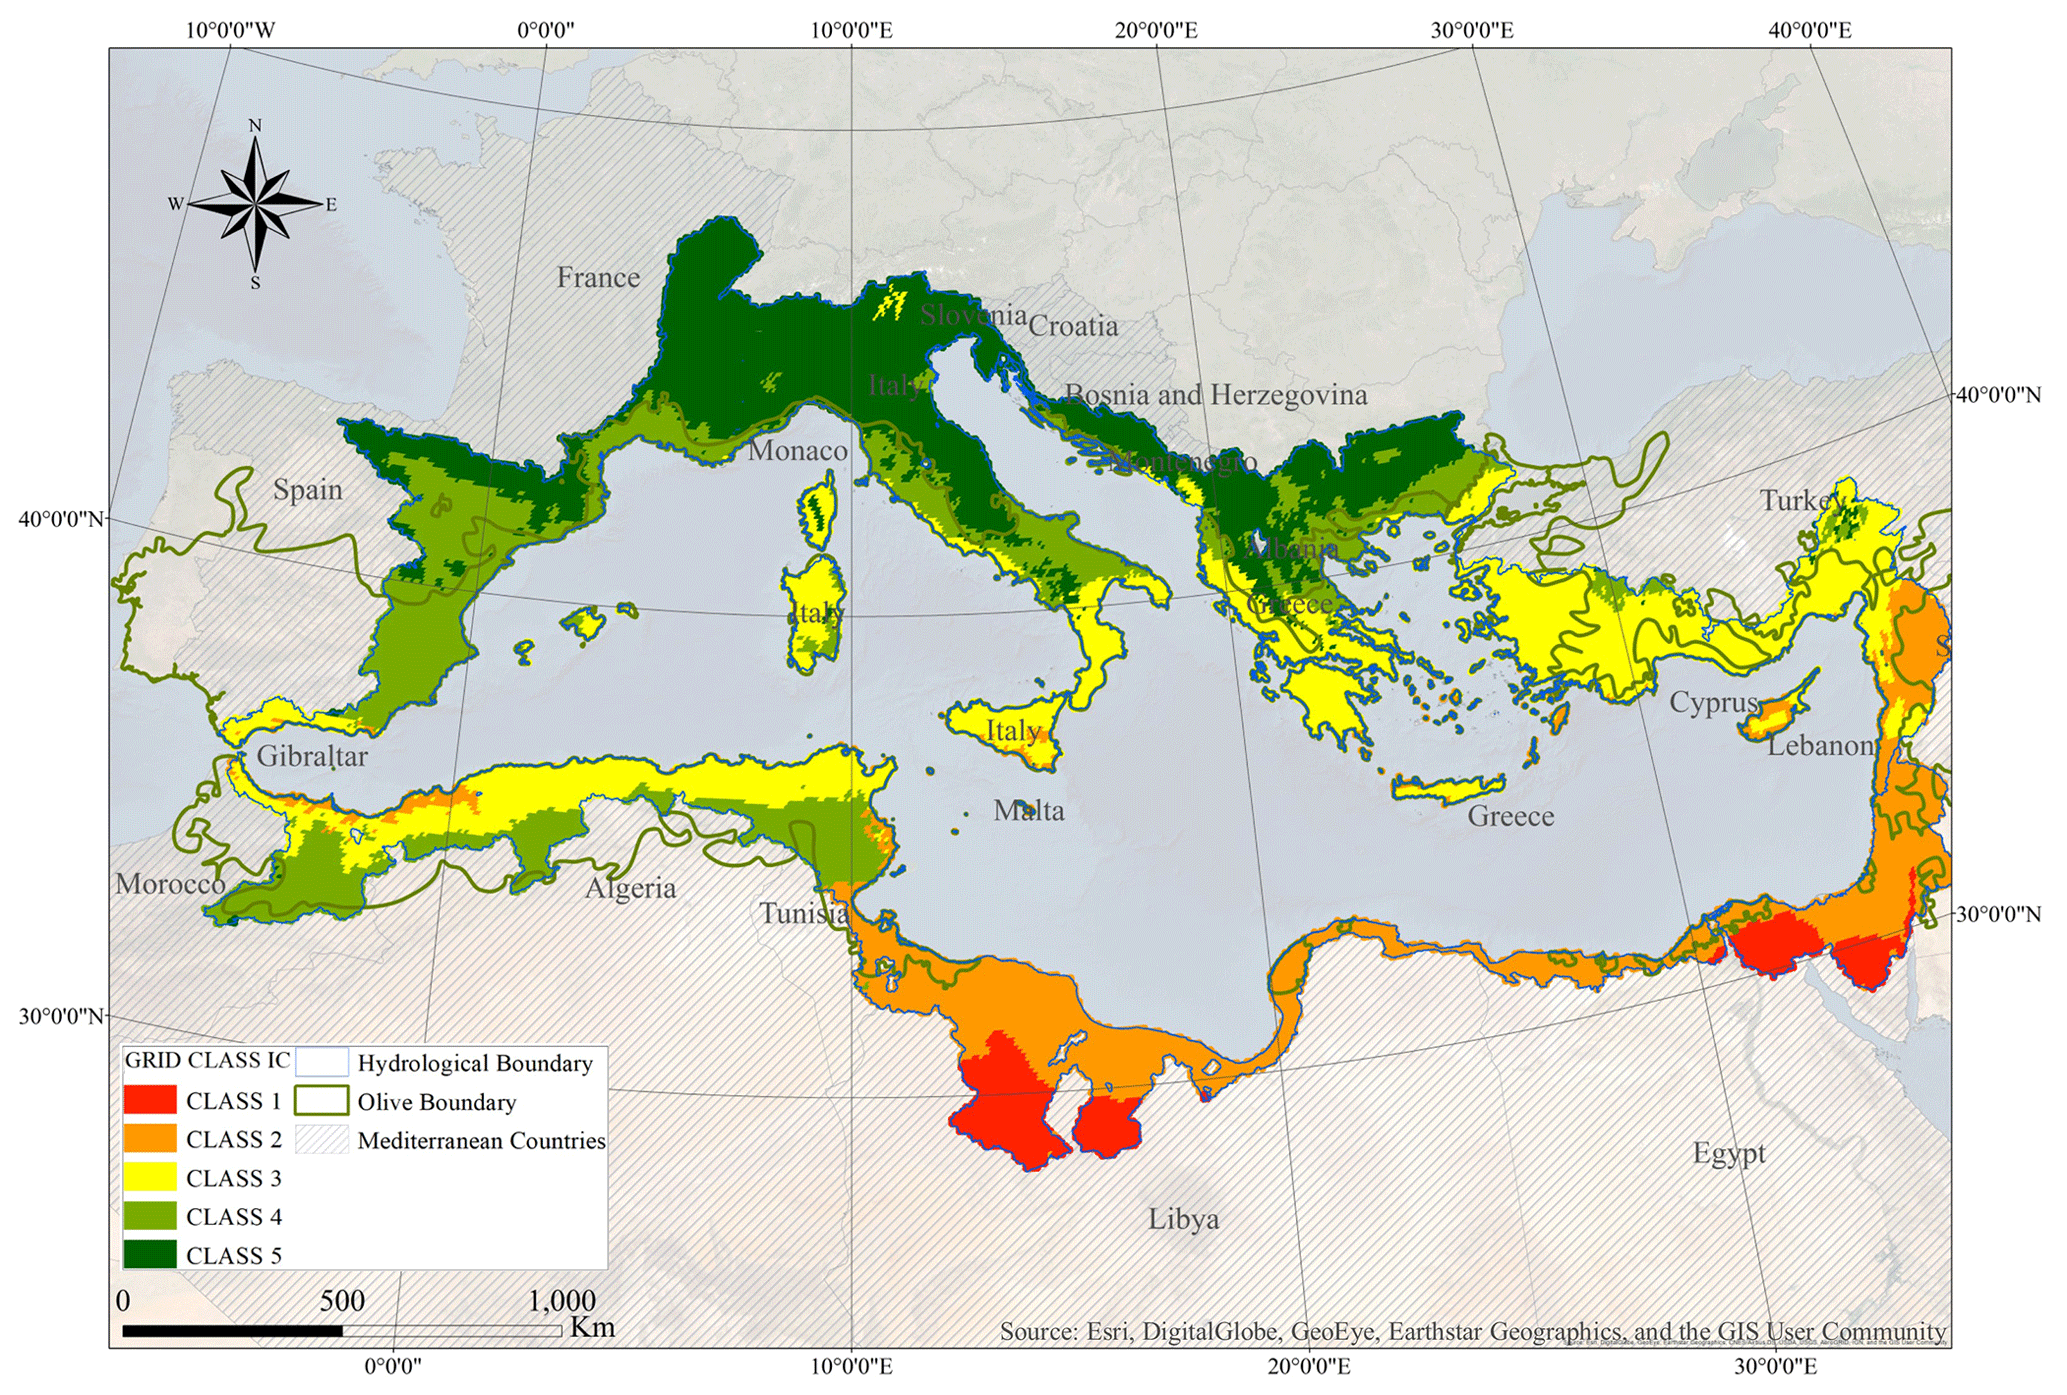
Figure 3Geographical distribution of the Mediterranean climatic classes based on gridded indices using WorldClim-2 monthly data.

Figure 4Normalized indices values of the five climatic class kernels from the Mediterranean catchment's classification using WorldClim-2 data.
Olive is one of the best Mediterranean-specific physiographic indices, and we noticed that its cultivation boundary is limited by those of classes 1 and 5, where 13 % is in class 2, 49 % in class 3, and 34 % in class 4. This observation gives an accurate idea of suitable climate conditions for olive cultivation, deducing that extreme seasonality combined with very high aridity (south) or very low seasonality combined with high humidity (north) are avoided by olive trees. In a similar way, other tree types like pine trees also characterize Mediterranean landscapes, putting forward the need for a physiographic classification to interpret in parallel to this climatic classification under the umbrella of hydrological characterization. The future of Mediterranean cultivation in the case of climate change will be checked under the RCP4.5 and 8.5 scenarios in the next section.
4.3 Verification on station indices
The 144 stations were also K-means clustered based on the selected indices from the PCA. The resulting geographical distribution differed only by some shifting due to averaging and normalization as the sample is much less than the gridded cells. There is no coverage of class 1 as no weather station was found in that region (Fig. 5). Despite the shifting, there is an 82 % accuracy rate or 86 out of 105 stations that matched the gridded distribution; the rest is located within the adjacent class boundaries. As for the olive boundary, there was only one class 5 station corresponding to Florence that was located within the boundary.
4.4 Comparison to catchment-based classification
The K-means clustering of the catchment indices classification resulted in a spatial distribution similar to the WoldClim-2 grid-based classification, where class 1 catchments dominate the south, class 5 the north, and classes 2–4 the central region (Fig. 6). This classification has shown lower resolution and revealed the shifts of some regions to adjacent classes. Class 1 dominated Egypt and Libya, class 5 climate disappeared from northern Spanish coasts, class 3 climate from Sardinia and Greece, and class 2 from Syria, and the limited spread of classes 4 and 5 also disappeared from eastern Turkey. However, climate continuity is conserved in this classification for indices gradually increasing or decreasing from north to south.
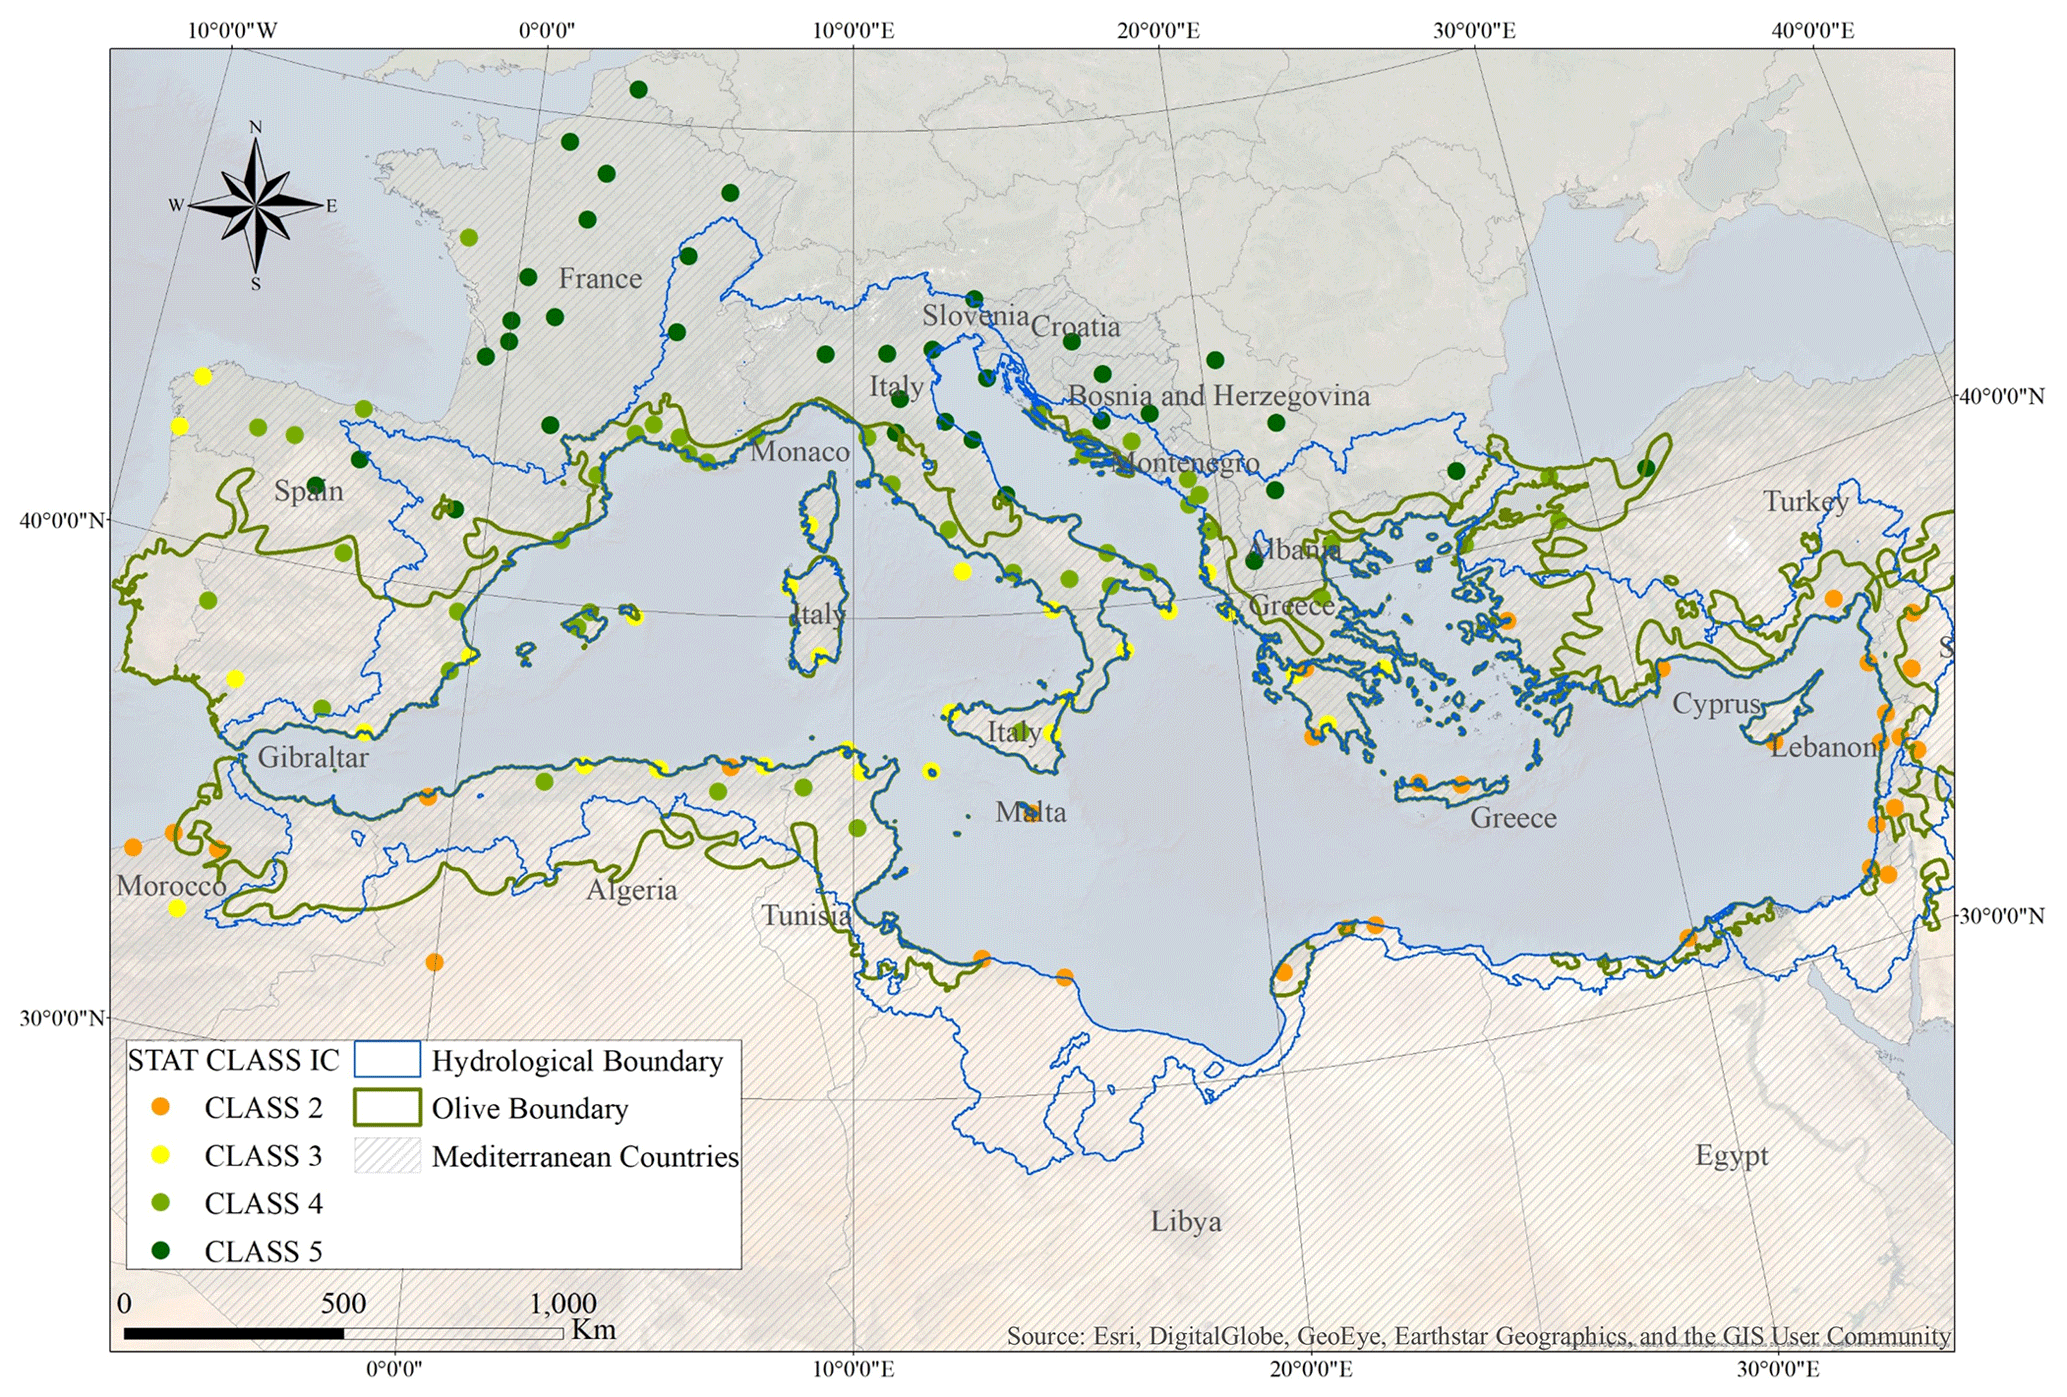
Figure 5Geographical distribution of the Mediterranean climatic classes based on 144 stations' climatic indices.

Figure 6Geographical distribution of the Mediterranean climatic classes based on average catchment indices using WorldClim-2 monthly data.
We believe that this classification is useful both for hydrological and ecohydrological applications like cultivation and other related environmental practices affected by water resources and river flows.
4.5 Decision tree analysis
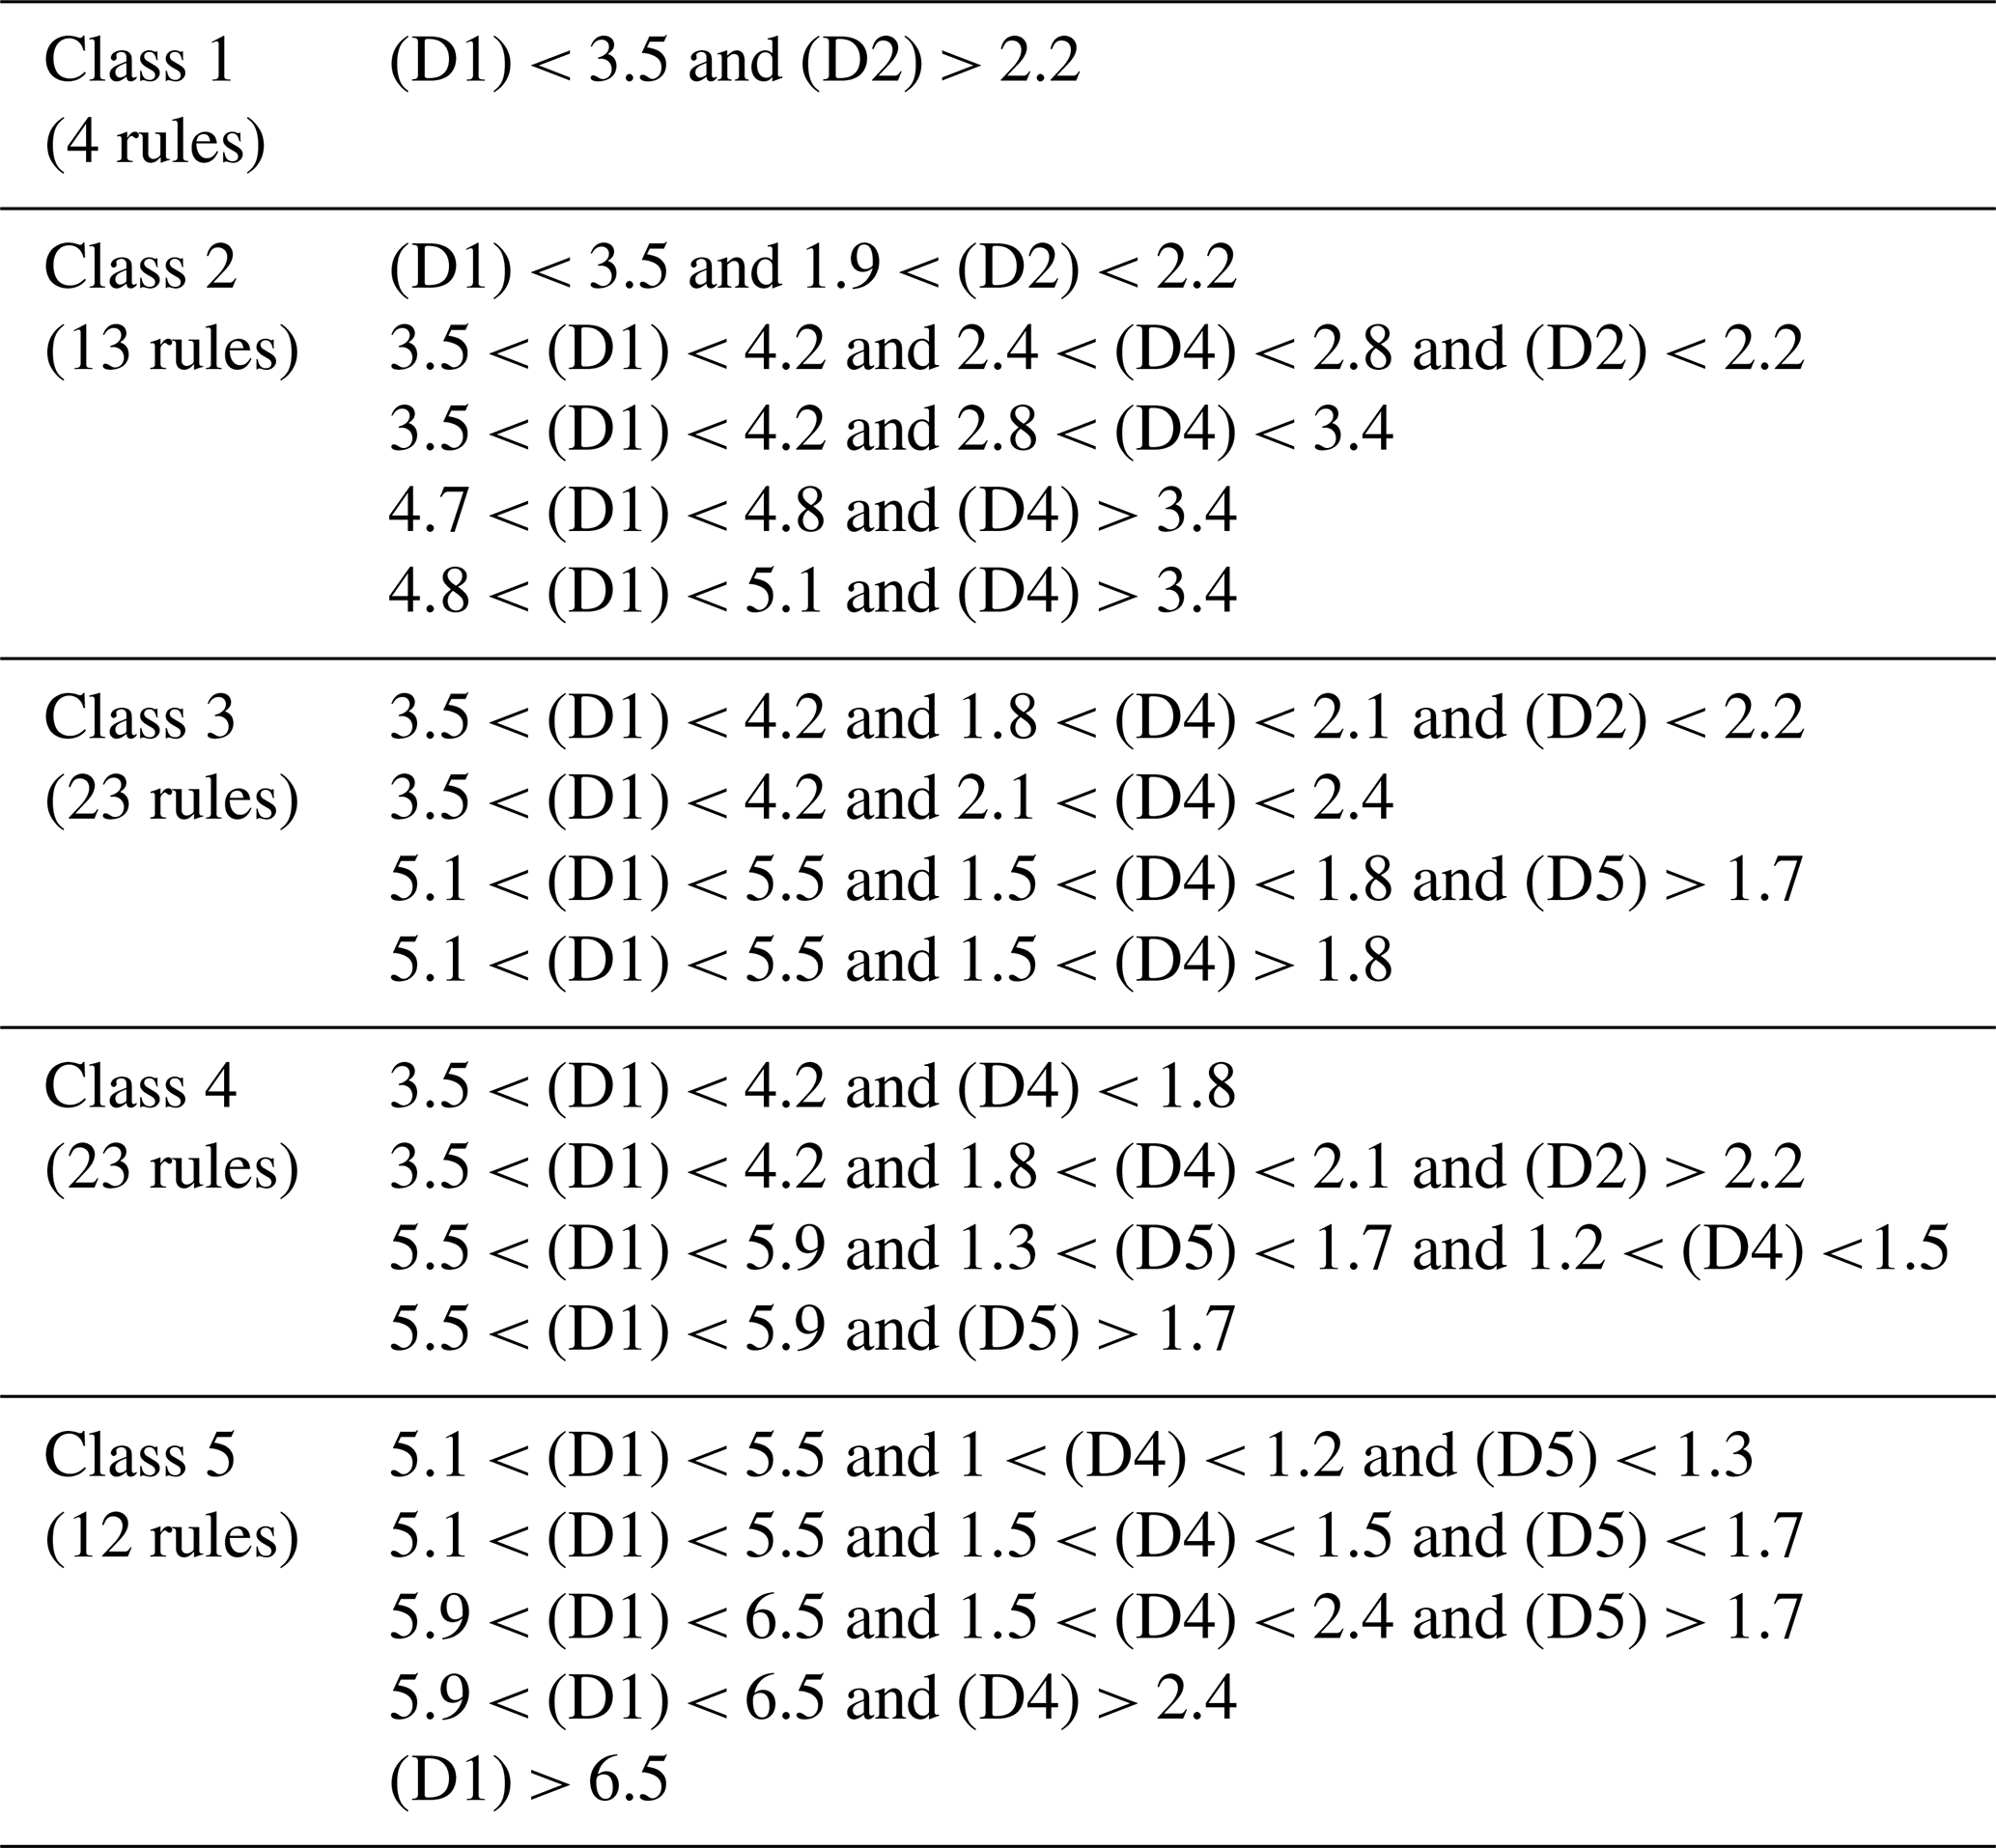
A decision tree was generated based on the gridded indices and their distances to a cluster's kernels. The total population of gridded indices was divided randomly into two equal subsets, one for training and the second for testing. The predicted class values of both sets were then compared to the original classification of the gridded indices obtained in Sect. 4.3, and both yielded an overall 93 % accuracy (Table 5). We notice that some grids have joined one of the adjacent classes due to interclass connectivity; this confirms once more the continuity of climate. The generated decision tree of three levels includes 75 nodes in total due to the high population number with 75 classification rules sampled in Table 6. As an example, for class 1, if the distance to kernel 1 (D1) is below 3.5 and the distance to kernel 2 (D2) is above 2.2, then the grid cell belongs to class 1. This decision tree permits us to follow up the climate evolution and its impact on the classification applied in Sect. 5.
Table 5Gridded classification decision tree accuracy table. The accuracy rate is calculated in comparison to the K-means classification of the gridded indices in Sect. 4.4.1.
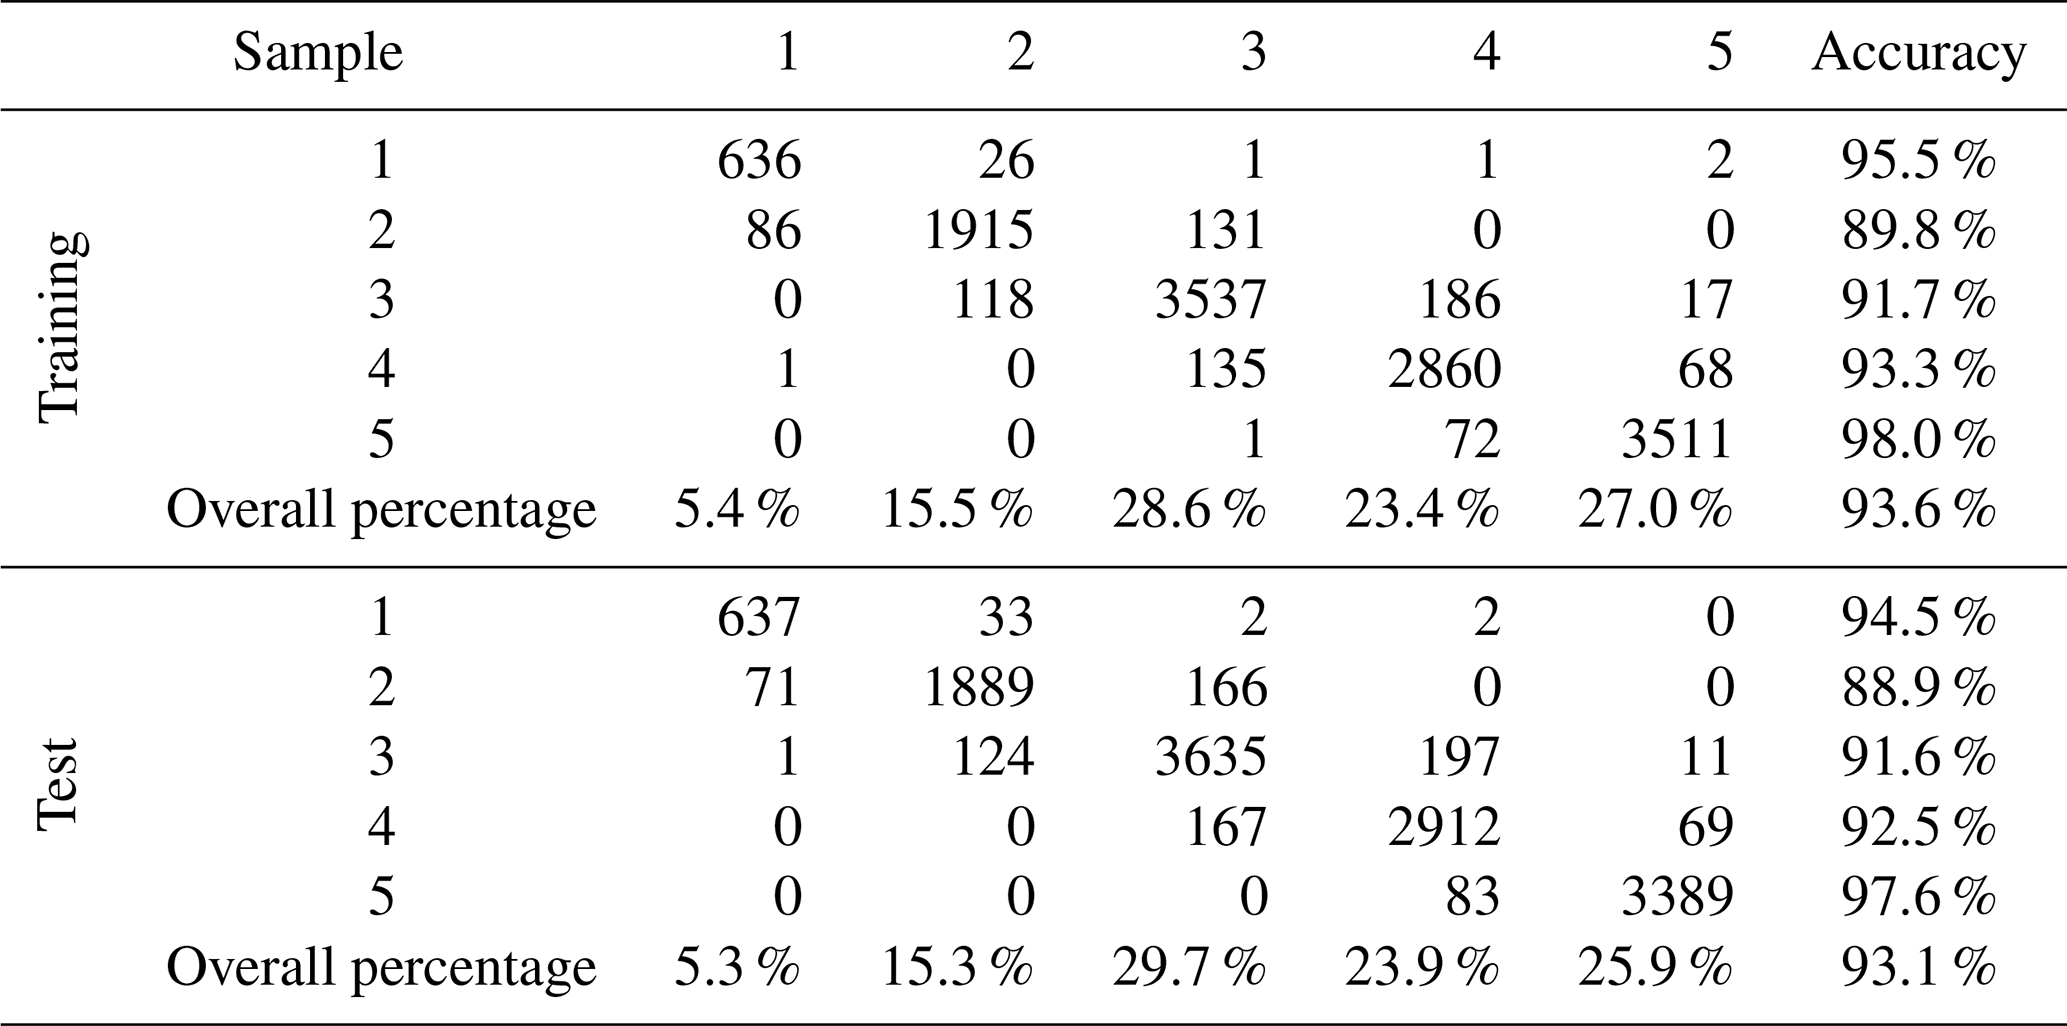
Table 6Sample of the decision tree set of rules for the gridded classification (D1–D5 correspond to distance to kernel of classes 1–5). As an example, for class 1, if the distance to kernel 1 (D1) is below 3.5 and the distance to kernel 2 (D2) is above 2.2, then the grid cell belongs to class 1.
4.6 MED-CORDEX ALADIN RCP scenario climate evolution
The climate change under the RCP was illustrated in Fig. 7 and expressed by indices evolution between classes in Table 7. Under the RCP4.5 scenario, temperature increases by 1.4 to 3.5 ∘C (average 2.2 ∘C), with the lowest rates during winter and the highest during summer. In the south, on average, precipitation increases by 25 % during winter and by 70 % during summer and decreases by 15 % during spring and by 5 % during autumn. In the north it increases by 10 % during winter, spring, and autumn while staying stable along the year in the central region. No major area changes occur between classes. In detail, class 5 reduces its extent in Greece and Albania in favour of classes 3 and 4 but compensates in central Spain; class 3 extent decreases in Turkey and Corsica in favour of class 4 in Lebanon and class 2 in Cyprus. Classes 1–3 seasonality indices Is are stable, while classes 4 and 5 increase by 7 % and 9 %. Also for classes 4 and 5, SP1.5 is highly increasing (70 %), with P25 % staying almost the same (3 %), which means that precipitation change is temporally distributed in a way that more months exceed the average monthly precipitation by 1.5 times and that the humid season has shortened, enhancing seasonality variation. Another remarkable change is the class 5 IArid 20 % increase, pushing it towards class 4.
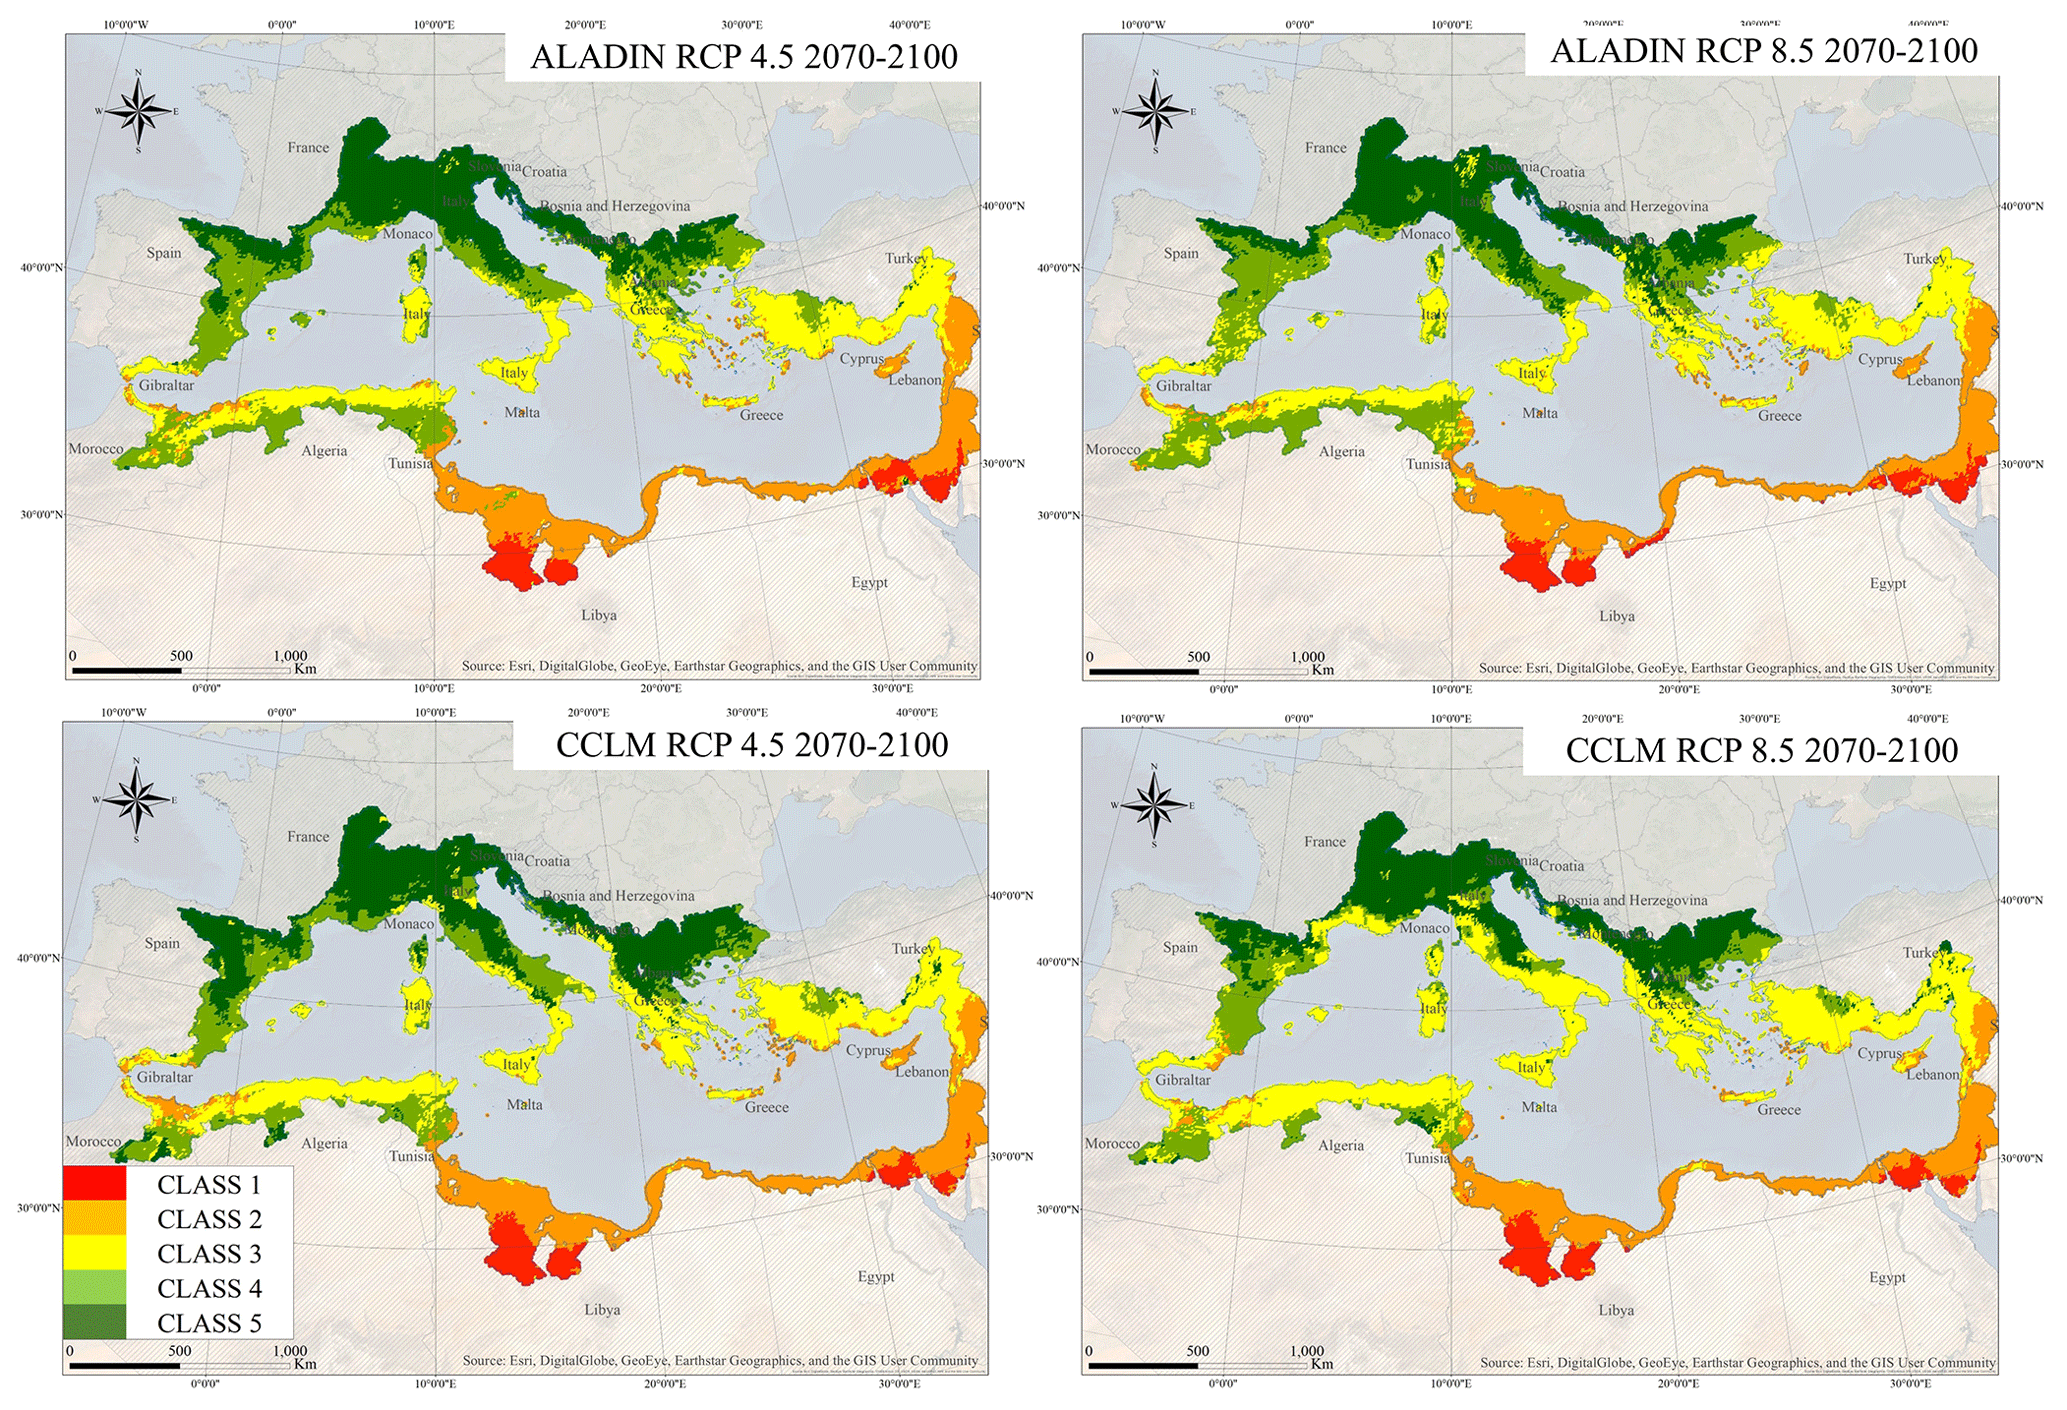
Figure 7Projected geographical distribution of the Mediterranean climatic classes based on WorldClim-2 gridded climatic indices using projected data under the ALADIN and CCLM RCP4.5 and 8.5 scenarios for the 2070–2100 period.
Table 7Climatic indices values under the RCM ALADIN and CCLM RCP scenarios, with the evolution ratio in italic.

Under the RCP8.5 scenario, the case is accentuated for temperature, which increases evenly across the Mediterranean by 2.5 to 5.6 ∘C (average 3.8 ∘C), with the lowest rates during winter and the highest during summer. In the south, on average, precipitation increases by 60 % during summer and decreases by 10 % during winter. In the north it increases by 5 % during spring and summer while staying almost stable along the year in the central region. The area also did not change much under RCP8.5; in detail, class 3 takes over the south-eastern coast of Spain but retreats in favour of class 4 from north-western Africa and Turkey. The difference with the RCP4.5 scenario is first in the indices evolution, where Is increases by 9 % in class 5 and SP1.5 highly increases by 96 %. This has caused an area change of 2 % towards class 4, mainly in Spain, Greece, and Albania. Another change is class 3 IArid increasing by 19 % and SPET decreasing by 10 %, which means that this moderate region is pushing towards a more arid climate.
4.7 MED-CORDEX CCLM RCP scenario climate evolution
Under the RCP4.5 scenario, temperature increases by 1.9 to 3.5 ∘C (average 2.9 ∘C), with the lowest rates in the south during winter and the highest in the north during summer. In the south, on average, precipitation increases by 20 % during winter and by 10 % during autumn and decreases by 10 % during summer but is stable during spring. In the north it increases by up to 10 % during autumn and winter and decreases to 30 % during spring and summer. The spatial extent of class 5 increases by 4 %, mostly in northern Spain, Albania, Morocco, and Algeria in favour of class 4, which decreases by 5 %; class 3 appeared between Italy and France on the Ligurian Sea, at San Marino, and on the Spanish coast; class 2 expanded over the Turkish coast and in Morocco; class 1 remained almost unchanged. Classes 1 and 2 seasonality indices Is are constant, while classes 3–5 increase by 4 %, 27 %, and 42 %. Also, SP1.5 increases by 14 %, 120 %, and 320 % for classes 3–5, with a little change in P25 % (less than 10 %), the same observation as the ALADIN RCP4.5 scenario but more accentuated. IArid increases by 56 % in class 5, while SPET increases by 25 %.
Under the RCP8.5 scenario, temperature increases by 3.6 to 6.4 ∘C (average 5.1 ∘C), with the lowest rates in the south during winter and the highest in the north during summer. In the south, on average, precipitation increases by 30 % during winter and by 10 % during autumn and decreases to 25% during summer but is stable during spring. In the north it increases by 10 % during autumn and winter and decreases to 60 % during spring and summer. Spatially, class 3 increases by 9 %, mostly in Italy, France, Spain, northern Greece, and Algeria in favour of class 4, which decreases by 7 %; classes 1, 2, and 5 remained almost unchanged. Class 3–5 seasonality indices Is increase by 8 %, 39 %, and 80 %. SP1.5 increases by 17 %, 215 %, and 516 % for classes 3–5, with a change in P25 % of a maximum of 17 %. Aridity indices increase by 24 % to 50 % for classes 3–5, while SPET decreases between 13 % and 26 % for the same classes. In summary, the Mediterranean is evolving towards an arid region under both the CCLM RCP4.5 and 8.5 scenarios.
The objective of this study is first to establish a Mediterranean-specific climatic classification for hydrology purposes based on a set of indices, mainly seasonality and aridity, and second to estimate the future evolution of this classification based on RCP scenarios.
In this study, the climatic classification was applied and verified on three datasets of different resolutions; the grid-based, the station-based, and catchment-based classification using the same climatic indices. We can clearly notice that the grid-based classification yielded the best resolution; however, despite the variability of the class boundaries between classifications, where some regions shift from class to another, the continuous evolution of climate across the Mediterranean was demonstrated by the indices values uniformly increasing or decreasing from north to south in all classifications. In general, precipitation seasonality is highest in the south and lowest in the north, the same for other precipitation indices and aridity; hence, the overall classification gradient was maintained from class 1 in the south to class 5 in the north, which confirms that Is and IArid are the main contributors to the classification taking over precipitation and temperature frequency indices (Figs. 4–6).
The catchment-based classification put the whole catchment within the same class despite the intra-climatic diversity which mostly affected wide catchments (above 10 000 km2) like the Rhône, Ebro, and Po and, to a lesser extent, smaller catchments (less than 3000 km2) as climatic diversity decreases with area and spatial spread. The grid-based classification refined the catchment-based classification showing different climatic classes within the same catchment mainly between coastal lowland areas, valleys, and mountainous highland areas. However, we could still notice in Fig. 5 that the Alps and the Po Valley are still in the same class according to our classification approach as they both share close seasonality index (Is≈0.47) and aridity index (IArid≈1.06). Nevertheless, class 3 spots were seen in northern Italian mountains at the boundary with Austria which upon checking appeared to have a higher seasonality and aridity (Is≈0.70; IArid≈0.98) than the surrounding region (Is≈0.61; IArid≈0.78), an anomaly that might be caused by variables interpolations in the area. It is interesting to cross-analyse this classification with a catchment-based physiographic classification (article in preparation) which both classifications will be used for a hydrological characterization of Mediterranean catchments.
In the north, where seasonality is low and precipitation is regular along the year, RCP4.5 and 8.5 scenario impacts on hydrology are more accentuated for CCLM than ALADIN, as the first projects a high precipitation decrease, down to −30 % and −60 % and a warming of 3.8 and 6.8 ∘C for RCP4.5 and 8.5 consequently during dry spring and summer seasons, hence increasing Is by +80 % and IArid by +60 %, causing the wet season shortening and river regime modification with the migration north of Group 12 Winter Moderate regimes instead of Group 14 Early Spring regimes. ALADIN projects a moderate precipitation variation of ±10 % with a warming of 2.7 and 4.5 ∘C and increasing Is by only +9 % and IArid by +20 % (see Table 7).
In the south, where seasonality is very high already and precipitation is limited to autumn and winter, models have projected little to no modification. RCP4.5 and 8.5 scenario impacts on hydrology are more accentuated for ALADIN than CCLM as the first is projecting a precipitation change between −5 % and +25 % for RCP4.5 and between −12 % and −2 % for RCP8.5 during autumn and winter consequently with IArid change reaching 10 %; CCLM is projecting a precipitation increase between +8 % and +22 % for RCP4.5 and between +5 % and +32 % for RCP8.5 with only +3 % IArid change, while Is did not change for both. A modification of hydrologic regime from Group 14 Early Spring to Group 13 Extreme Winter is expected.
Looking to the maps in Fig. 7, we can easily notice that classes 2 and 3 are expanding to the north for RCM CCLM, while this change is limited for RCM ALADIN; looking south, we do not see much change on the maps, thus confirming our previous observations.
The use of the ALADIN and CCLM models is not enough to fully assess the uncertainties, which is beyond the scope of this paper. Nevertheless, the seasonal variability between models and scenarios, despite the general trend towards warming, aridity and accentuated seasonality, incited us to address the main reasons behind. This uncertainty usually depends on adopted climate variables, the region, seasons (Lionello and Scarascia, 2018). In addition, the adopted models in this study are atmosphere-RCM and not fully coupled models, as they are not yet achieved by the MED-CORDEX, which could have returned different results.
The ALADIN and CCLM RCM models have demonstrated an evolution of the Mediterranean region towards arid climates, more emphasized with CCLM, especially for RCP8.5. These scenarios might look Mediterranean friendly as class 4 and 5 seasonality indices are evolving towards class 3 in addition to some spatial expansion which might look favourable for Mediterranean cultivation. However, the expected impact on water resources and flow regimes will surely expand and directly hit ecosystems, food, health, and tourism, as risk is interconnected between domains (Cramer et al., 2018).
The Mediterranean climate characteristics, and specifically precipitation seasonality, the main contributor according to PCA, play an important role in the hydrological mechanisms of Mediterranean catchments and flow intermittence. A decision tree makes it possible to define, from distances to class kernels, whether any place has a Mediterranean climate or not and to which type of Mediterranean climate it belongs, for present and future scenarios. On the other hand, the superposition of the olive cultivation boundary as a Mediterranean-specific physiographic index highlighted the utility and importance of physiographic–climatic coupled scenario models that could be extended to other Mediterranean physiographic or bio-climatic indices. The climatic classification and corresponding indices evolution under RCP scenarios helped in identifying the general climate change impact on Mediterranean seasonality that might uncover valuable findings about water balance, floods, and droughts for water sector stakeholders. Both the ALADIN and CCLM scenarios showed an increase in the average seasonality and aridity indices affecting hydrologic regimes due to shorter humid seasons and earlier snowmelts. The results of this study are useful for future water resources and cultivation management policies to identify the most impacted zones and propose preventive and adaptative measures for a more resilient and sustainable region. This kind of classification might be reproduced at the global scale, using the same or other region-specific climatic indices highlighting their physiographic characteristics and hydrological response.
All the climatic data are freely available online. The WorldClim-2 data are available from the WorldClim website at https://www.worldclim.org/data/worldclim21.html (last access: 8 September 2020, WorldClim, 2020). The ground weather station data are available from the Global Historical Climatology Network website at https://www.ncdc.noaa.gov/ghcn-daily-description (last access: 8 September 2020, NCEI, 2020). The ALADIN and CCLM simulations used in the current work can be downloaded from the Med-CORDEX database at https://www.medcordex.eu/ (last access: 8 September 2020).
All the authors (AA, RM, WN and CB) contributed to the conceptualization and methodology of the study as well as drafting, reviewing, and editing the article. AA developed the climatic classification for the 1970–2000 baseline period and for the 2070–2100 projected period under Med-CORDEX scenarios. AA, RM, WN and CB carried out the validation and analysis of the results.
The authors declare that they have no conflict of interest.
This article is part of the special issue “Hydrological cycle in the Mediterranean (ACP/AMT/GMD/HESS/NHESS/OS inter-journal SI)”. It is not associated with a conference.
The authors would like to thank the editor Giuseppe Tito Aronica, first reviewer Christophe Cudennec, and anonymous second reviewer for their constructive comments. We would also like to thank the Med-CORDEX providers for making their Regional Climate Data available.
Thanks to the HESS Executive Editor for granting the authors a full APC waiver for this paper.
This paper was edited by Giuseppe Tito Aronica and reviewed by Christophe Cudennec and one anonymous referee.
Alpert, P., Osetinsky, I., Ziv, B., and Shafir, H.: Semi-objective classification for daily synoptic systems: Application to the eastern Mediterranean climate change, Int. J. Climatol., 24, 1001–1011, https://doi.org/10.1002/joc.1036, 2004.
Baccour, H., Slimani, M., and Cudennec, C.: Spatial structures of reference evapotranspiration and climatic variables in Tunisia, Hydrolog. Sci. J., 57, 818–829, https://doi.org/10.1080/02626667.2012.672986, 2012.
Barredo, J. I., Mauri, A., Caudullo, G., and Dosio, A.: Assessing shifts of Mediterranean and arid climates under RCP4.5 and RCP8.5 climate projections in Europe, in: Meteorology and Climatology of the Mediterranean and Black Seas, Springer, 235–251, 2019.
Barry, R. G. and Chorley, R. J.: Atmosphere, weather and climate, Routledge, 2009.
Beck, H. E., Zimmermann, N. E., McVicar, T. R., Vergopolan, N., Berg, A., and Wood, E. F.: Present and future Köppen-Geiger climate classification maps at 1-km resolution, Scient. Data, 5, 180214, https://doi.org/10.1038/sdata.2018.214, 2018.
Bergeron, T.: Über die dreidimensional verknüpfende Wetteranalyse: Cammermeyer in Komm., Oslo Cammermeyers Boghandel, 1928.
Bholowalia, P. and Kumar, A.: EBK-means: A clustering technique based on elbow method and k-means in WSN, Int. J. Comput. Appl., 105, 17–24, https://doi.org/10.5120/18405-9674, 2014.
Bois, P.: Contrôle de séries chronologiques corrélées par étude du cumul des résidus de la corrélation, in: Deuxièmes journées hydrologiques de l'ORSTOM à Montpellier, Paris, ORSTOM, 89–99, Colloques et Séminaires, Journées Hydrologiques de l'ORSTOM à Montpellier, 2, Montpellier (FRA), 16–17 September 1986, ISBN 2-7099-0865-4, 1987.
Breiman, L., Friedman, J., Stone, C. J., and Olshen, R. A.: Classification and Regression Trees, Taylor & Francis, 1984.
Carvalho, M. J., Melo-Gonçalves, P., Teixeira, J. C., and Rocha, A.: Regionalization of Europe based on a K-Means Cluster Analysis of the climate change of temperatures and precipitation, Phys. Chem. Earth Pt. A/B/C, 94, 22–28, https://doi.org/10.1016/j.pce.2016.05.001, 2016.
Champeaux, J. and Tamburini, A.: Climatological zoning of France from precipitation measurements (1971–1990) of the French climatological network, Meteorologie (France), 14, 44-54, https://doi.org/10.4267/2042/51183, 1996.
Chéruy, F. and Aires, F.: Cluster Analysis of Cloud Properties over the Southern European Mediterranean Area in Observations and a Model, Mon. Weather Rev., 137, 3161–3176, https://doi.org/10.1175/2009MWR2882.1, 2009.
Clerget, M.: Les types de temps en Méditerranée, Paper presented at the Annales de géographie, Armand Colin, 1937.
Cramer, W., Guiot, J., Fader, M., Garrabou, J., Gattuso, J.-P., Iglesias, A., Lange, M. A., Lionello, P., Llasat, M. C., and Paz, S.: Climate change and interconnected risks to sustainable development in the Mediterranean, Nat. Clim. Change, 8, 972–980, https://doi.org/10.1038/s41558-018-0299-2, 2018.
Cudennec, C., Leduc, C., and Koutsoyiannis, D.: Dryland hydrology in Mediterranean regions – a review, Hydrolog. Sci. J./Journal des Sciences Hydrologiques, 52, 1077–1087, https://doi.org/10.1623/hysj.52.6.1077, 2007.
De Jager, A. L. and Vogt, J. V.: Development and demonstration of a structured hydrological feature coding system for Europe, Hydrolog. Sci. J., 55, 661–675, https://doi.org/10.1080/02626667.2010.490786, 2010.
Dell'Aquila, A., Mariotti, A., Bastin, S., Calmanti, S., Cavicchia, L., Deque, M., Djurdjevic, V., Dominguez, M., Gaertner, M., and Gualdi, S.: Evaluation of simulated decadal variations over the Euro-Mediterranean region from ENSEMBLES to Med-CORDEX, Clim. Dynam., 51, 857–876, https://doi.org/10.1007/s00382-016-3143-2, 2018.
Desbois, M., Seze, G., and Szejwach, G.: Automatic Classification of Clouds on METEOSAT Imagery: Application to High-Level Clouds, J. Appl. Meteorol., 21, 401–412, https://doi.org/10.1175/1520-0450(1982)021<0401:ACOCOM>2.0.CO;2, 1982.
Douguédroit, A. and Lionello, P.: Temperature and precipitation in the Mediterranean region: Present trends and future scenarios, in: Connections, Mobilities, Urban Prospects and Environmental Threats: The Mediterranean in Transition, Cambridge Scholars, Newcastle upon Tyne, UK, 2015.
Drobinski, P., Silva, N. D., Panthou, G., Bastin, S., Muller, C., Ahrens, B., Borga, M., Conte, D., Fosser, G., Giorgi, F., Güttler, I., Kotroni, V., Li, L., Morin, E., Önol, B., Quintana-Segui, P., Romera, R., and Torma, C. Z.: Scaling precipitation extremes with temperature in the Mediterranean: past climate assessment and projection in anthropogenic scenarios, Clim. Dynam., 51, 1237–1257, https://doi.org/10.1007/s00382-016-3083-x, 2018.
Eveno, M., Planchon, O., Oszwald, J., Dubreuil, V., and Quénol, H.: Variabilité et changement climatique en France de 1951 à 2010: analyse au moyen de la classification de Köppen et des “types de climats annuels”, Climatologie, 13, 47–70, https://doi.org/10.4267/climatologie.1203, 2016.
Feki, H., Slimani, M., and Cudennec, C.: Incorporating elevation in rainfall interpolation in Tunisia using geostatistical methods, Hydrolog. Sci. J., 57, 1294–1314, https://doi.org/10.1080/02626667.2012.710334, 2012.
Fick, S. E. and Hijmans, R. J.: WorldClim 2: new 1-km spatial resolution climate surfaces for global land areas, Int. J. Climatol., 37, 4302–4315, https://doi.org/10.1002/joc.5086, 2017.
Forgy, E. W.: Cluster analysis of multivariate data: efficiency versus interpretability of classifications, Biometrics, 21, 768–769, 1965.
García-Ruiz, J. M., López-Moreno, J. I., Vicente-Serrano, S. M., Lasanta-Martínez, T., and Beguería, S.: Mediterranean water resources in a global change scenario, Earth-Sci. Rev., 105, 121–139, https://doi.org/10.1016/j.earscirev.2011.01.006, 2011.
Giorgi, F., Regional climate modeling: Status and perspectives, Paper presented at the Journal de Physique IV (Proceedings), EDP sciences, 2006.
Giorgi, F., Jones, C., and Asrar, G. R.: Addressing climate information needs at the regional level: the CORDEX framework, World Meteorol. Organiz. Bull., 58, 175–183, 2009.
Haines, A., Finlayson, B., and McMahon, T.: A global classification of river regimes, Appl. Geogr., 8, 255–272, https://doi.org/10.1016/0143-6228(88)90035-5, 1988.
Harrison, S. P., Prentice, I. C., Barboni, D., Kohfeld, K. E., Ni, J., and Sutra, J. P.: Ecophysiological and bioclimatic foundations for a global plant functional classification, J. Veg. Sci., 21, 300–317, https://doi.org/10.1111/j.1654-1103.2009.01144.x, 2010.
Hijmans, R. J., Cameron, S. E., Parra, J. L., Jones, P. G., and Jarvis, A.: Very high resolution interpolated climate surfaces for global land areas, Int. J. Climatol., 25, 1965–1978, https://doi.org/10.1002/joc.1276, 2005.
Holdridge, L. R.: Determination of world plant formations from simple climatic data, Science, 105, 367–368, https://doi.org/10.1126/science.105.2727.367, 1947.
Hotelling, H.: Analysis of a complex of statistical variables into principal components, J. Educ. Psychol., 24, 417–441, https://doi.org/10.1037/h0071325, 1933.
Hrachowitz, M., Savenije, H. H. G., Blöschl, G., McDonnell, J. J., Sivapalan, M., Pomeroy, J. W., Arheimer, B., Blume, T., Clark, M. P., Ehret, U., Fenicia, F., Freer, J. E., Gelfan, A., Gupta, H. V., Hughes, D. A., Hut, R. W., Montanari, A., Pande, S., Tetzlaff, D., Troch, P. A., Uhlenbrook, S., Wagener, T., Winsemius, H. C., Woods, R. A., Zehe, E., and Cudennec, C.: A decade of Predictions in Ungauged Basins (PUB) – a review, Hydrolog. Sci. J., 58, 1198–1255, https://doi.org/10.1080/02626667.2013.803183, 2013.
Hreiche, A.: Modélisation conceptuelle de la transformation pluie-débit dans le contexte méditerranéen, Université Montpellier II – Sciences et Techniques du Languedoc, Montpellier, 2003.
Hreiche, A., Najem, W., and Bocquillon, C.: Hydrological impact simulations of climate change on Lebanese coastal rivers/Simulations des impacts hydrologiques du changement climatique sur les fleuves côtiers Libanais, Hydrolog. Sci. J./Journal des Sciences Hydrologiques, 52, 1119–1133, https://doi.org/10.1623/hysj.52.6.1119, 2007.
IPCC: Climate Change 2013: The Physical Science Basis: Working Group I contribution to the Fifth assessment report of the Intergovernmental Panel on Climate Change, Cambridge University Press, Cambridge, UK and New York, NY, USA, 2013.
Jolliffe, I. T.: Principal Component Analysis, Springer, 2002.
Köppen, W.: Das geographische System der Klimate, Borntraeger, 1936.
Kotlarski, S., Keuler, K., Christensen, O. B., Colette, A., Déqué, M., Gobiet, A., Goergen, K., Jacob, D., Lüthi, D., van Meijgaard, E., Nikulin, G., Schär, C., Teichmann, C., Vautard, R., Warrach-Sagi, K., and Wulfmeyer, V.: Regional climate modeling on European scales: a joint standard evaluation of the EURO-CORDEX RCM ensemble, Geosci. Model Dev., 7, 1297–1333, https://doi.org/10.5194/gmd-7-1297-2014, 2014.
Koutroulis, A. G.: Dryland changes under different levels of global warming, Sci. Total Environ., 655, 482–511, https://doi.org/10.1016/j.scitotenv.2018.11.215, 2019.
Krzanowski, W. J.: Principles of multivariate analysis: a user's perspective, Clarendon Press, 1988.
Lehner, B. and Grill, G.: Global river hydrography and network routing: baseline data and new approaches to study the world's large river systems, Hydrol. Process., 27, 2171–2186, 2013.
Lionello, P. and Scarascia, L.: The relation between climate change in the Mediterranean region and global warming, Reg. Environ. Change, 18, 1481–1493, https://doi.org/10.1007/s10113-018-1290-1, 2018.
MacQueen, J.: Some methods for classification and analysis of multivariate observations, in: Proceedings of the fifth Berkeley symposium on mathematical statistics and probability, Univ. of Calif. Press, 1967.
Mather, J. R. and Yoshioka, G. A.: The role of climate in the distribution of vegetation, Ann. Assoc. Am. Geogr., 58, 29–41, https://doi.org/10.1111/j.1467-8306.1968.tb01634.x, 1968.
Menne, M. J., Durre, I., Korzeniewski, B., McNeal, S., Thomas, K., Yin, X., Anthony, S., Ray, R., Vose, R. S., and Gleason, B. E.: Global historical climatology network-daily (GHCN-Daily), Version 3, 10, V5D21VHZ, NOAA National Climatic Data Center, 2012.
Merheb, M., Moussa, R., Abdallah, C., Colin, F., Perrin, C., and Baghdadi, N.: Hydrological response characteristics of Mediterranean catchments at different time scales: a meta-analysis, Hydrolog. Sci. J., 61, 2520–2539, https://doi.org/10.1080/02626667.2016.1140174, 2016.
Milano, M., Ruelland, D., Fernandez, S., Dezetter, A., Fabre, J., Servat, E., Fritsch, J.-M., Ardoin-Bardin, S., and Thivet, G.: Current state of Mediterranean water resources and future trends under climatic and anthropogenic changes, Hydrolog. Sci. J., 58, 498–518, https://doi.org/10.1080/02626667.2013.774458, 2013.
Moreno, J. A. O.: Modelización del ciclo fenológico reproductor del olivo (Olea europaea L.), Universidad de Córdoba, Córdoba, 2014.
Moron, V., Robertson, A. W., Ward, M. N., and Ndiaye, O.: Weather types and rainfall over Senegal. Part I: Observational analysis, J. Climate, 21, 266–287, https://doi.org/10.1175/2007JCLI1601.1, 2008.
NCEI: Ground weather station data, Global Historical Climatology Network, National Centers for Environmental Information, available at: https://www.ncdc.noaa.gov/ghcn-daily-description, last access: 8 September 2020.
Oueslati, O., De Girolamo, A. M., Abouabdillah, A., Kjeldsen, T. R., and Lo Porto, A.: Classifying the flow regimes of Mediterranean streams using multivariate analysis, Hydrol. Process., 29, 4666–4682, https://doi.org/10.1002/hyp.10530, 2015.
Pearson, K.: Principal components analysis, London Edinburgh Dublin Philos. Mag. J. Sci., 6, 559–572, 1901.
Peel, M. C., Finlayson, B. L., and McMahon, T. A.: Updated world map of the Köppen–Geiger climate classification, Hydrol. Earth Syst. Sci., 11, 1633–1644, https://doi.org/10.5194/hess-11-1633-2007, 2007.
PlanBleu: Les demandes en eau toujours satisfaites en Méditerranée à l'horizon 2050? In Les Notes du Plan Bleu, in: Vol. #25, Plan Bleu PNUE/PAM, Sophia Antipolis, 2012.
Raymond, F., Ullmann, A., Camberlin, P., Drobinski, P., and Smith, C. C.: Extreme dry spell detection and climatology over the Mediterranean Basin during the wet season, Geophys. Res. Lett., 43, 7196–7204, https://doi.org/10.1002/2016GL069758, 2016.
Rivoire, P., Tramblay, Y., Neppel, L., Hertig, E., and Vicente-Serrano, S. M.: Impact of the dry-day definition on Mediterranean extreme dry-spell analysis, Nat. Hazards Earth Syst. Sci., 19, 1629–1638, https://doi.org/10.5194/nhess-19-1629-2019, 2019.
Rockel, B., Will, A., and Hense, A.: The regional climate model COSMO-CLM (CCLM), Meteorol. Z., 17, 347–348, https://doi.org/10.1127/0941-2948/2008/0309, 2008.
Rodwell, M. J. and Hoskins, B. J.: Monsoons and the dynamics of deserts, Q. J. Roy. Meteorol. Soc., 122, 1385–1404, https://doi.org/10.1002/qj.49712253408, 1996.
Romera, R., Sánchez, E., Domínguez, M., Gaertner, M. Á., and Gallardo, C.: Evaluation of present-climate precipitation in 25 km resolution regional climate model simulations over Northwest Africa, Clim. Res., 66, 125–139, https://doi.org/10.3354/cr01330, 2015.
Ruti, P. M., Somot, S., Giorgi, F., Dubois, C., Flaounas, E., Obermann, A., Dell'Aquila, A., Pisacane, G., Harzallah, A., and Lombardi, E.: MED-CORDEX initiative for Mediterranean climate studies, B. Am. Meteorol. Soc., 97, 1187–1208, https://doi.org/10.1175/BAMS-D-14-00176.1, 2016.
Sauquet, E., Richard, B., Devers, A., and Prudhomme, C.: Water restrictions under climate change: a Rhône–Mediterranean perspective combining bottom-up and top-down approaches, Hydrol. Earth Syst. Sci., 23, 3683–3710, https://doi.org/10.5194/hess-23-3683-2019, 2019.
Slimani, M., Cudennec, C., and Feki, H.: Structure of the rainfall gradient in the Mediterranean–Sahara transition in Tunisia: geographical determinants and seasonality, Hydrol. Sci. J., 52, 1088–1102, https://doi.org/10.1623/hysj.52.6.1088, 2007.
Sönmez, Ý. and Kömüþcü, A. Ü.: Reclassification of rainfall regions of Turkey by K-means methodology and their temporal variability in relation to North Atlantic Oscillation (NAO), Theor. Appl. Climatol., 106, 499–510, https://doi.org/10.1007/s00704-011-0449-1, 2011.
Thornthwaite, C. W.: An approach toward a rational classification of climate, Geogr. Rev., 38, 55–94, https://doi.org/10.2307/210739, 1948.
Toth, E.: Catchment classification based on characterisation of streamflow and precipitation time series, Hydrol. Earth Syst. Sci., 17, 1149–1159, https://doi.org/10.5194/hess-17-1149-2013, 2013.
Tramblay, Y. and Somot, S.: Future evolution of extreme precipitation in the Mediterranean, Climatic Change, 151, 289–302, https://doi.org/10.1007/s10584-018-2300-5, 2018.
Tramblay, Y., Ruelland, D., Somot, S., Bouaicha, R., and Servat, E.: High-resolution Med-CORDEX regional climate model simulations for hydrological impact studies: a first evaluation of the ALADIN-Climate model in Morocco, Hydrol. Earth Syst. Sci., 17, 3721–3739, https://doi.org/10.5194/hess-17-3721-2013, 2013.
Trigo, I. F., Davies, T. D., and Bigg, G. R.: Objective climatology of cyclones in the Mediterranean region, J. Climate, 12, 1685–1696, https://doi.org/10.1175/1520-0442(1999)012<1685:OCOCIT>2.0.CO;2, 1999.
Turc, L.: Estimation of irrigation water requirements, potential evapotranspiration: a simple climatic formula evolved up to date, Ann. Agron., 12, 13–49, 1961.
Unal, Y., Kindap, T., and Karaca, M.: Redefining the climate zones of Turkey using cluster analysis, Int. J. Climatol., 23, 1045–1055, https://doi.org/10.1002/joc.910, 2003.
Verdier, J. and Viollet, P.-L.: Les tensions sur l'eau en Europe et dans le bassin méditerranéen. Des crises de l'eau d'ici 2050, La Houille Blanche, 6, 102–107, https://doi.org/10.1051/lhb/20150075, 2015.
Vicente-Serrano, S. M., González-Hidalgo, J. C., de Luis, M., and Raventós, J.: Drought patterns in the Mediterranean area: the Valencia region (eastern Spain), Clim. Res., 26, 5–15, https://doi.org/10.3354/cr026005, 2004.
Wagener, T., Sivapalan, M., Troch, P., and Woods, R.: Catchment Classification and Hydrologic Similarity, Geogr. Compass, 1, 901–931, https://doi.org/10.1111/j.1749-8198.2007.00039.x, 2007.
Wainwright, J. and Thornes, J. B.: Environmental issues in the Mediterraean, 1st edn., Routledge, London, 512 pp., https://doi.org/10.4324/9780203495490, 2004.
WorldClim: Worldclim-2 data, available at: https://www.worldclim.org/data/worldclim21.html, last access: 8 September 2020.
Zittis, G.: Observed rainfall trends and precipitation uncertainty in the vicinity of the Mediterranean, Middle East and North Africa, Theor. Appl. Climatol., 134, 1207–1230, https://doi.org/10.1007/s00704-017-2333-0, 2018.