the Creative Commons Attribution 4.0 License.
the Creative Commons Attribution 4.0 License.
 | 02 Sep 2020
Calibration of a lumped karst system model and application to the Qachqouch karst spring (Lebanon) under climate change conditions
Emmanuel Dubois
Séverin Pistre
Marie Larocque
Flow in complex karst aquifers is challenging to conceptualize and model, especially in poorly investigated areas, in semiarid climates, and under changing climatic conditions; however, it is necessary in order to implement long-term sustainable water management practices. Thus, the objectives of this work were to propose a calibration approach based on time series analyses for a karst aquifer and to assess the impact of climate change on spring discharge. Based on more than 3 years of high-resolution continuous monitoring, a semi-distributed lumped model was calibrated and validated for the Qachqouch karst spring, north of Beirut (Lebanon). Time series analyses and decomposition of spring hydrographs revealed that the system has a high regulatory function, with considerable storage capacity providing stable flow (minimum flow of 0.2 m3 s−1) during the dry season and with flow rates exceeding 10 m3 s−1 during the wet season, which is similar to other karst aquifers in the region. Based on this detailed understanding of the hydrodynamics of the system, the model geometry and parameters were validated. Three linear reservoirs were implemented to reproduce the combined contribution of the different flow components of the system. A satisfactory simulation (Nash–Sutcliffe efficiency coefficient, NSE, of 0.72) of the measured spring flow rates was obtained after calibration. Climate change conditions (+1 to +3 ∘C warming, −10 % to −30 % less precipitation annually, and the intensification of rain events) were added to a baseline climatic year to produce scenarios of expected spring flow responses. Results show that the Qachqouch karst aquifer is sensitive to decreasing rainfall, which is associated with more pronounced recessions, with flow rates decreasing by 34 % and 1-month longer dry periods. Because of the limited influence of snow on the spring flow rate, a warming climate has less impact on spring flow conditions than a reduction in precipitation. Although the model shows that increasing rainfall intensity induces larger floods, recessions, and shorter low-flow periods, the real impact of high-intensity precipitation events remains uncertain, as the model does not account for complex unsaturated and epikarstic processes. This work shows that calibrating a semi-distributed lumped model using time series analyses can be an efficient approach to improve simulations of complex karst aquifers, thereby providing useful models for long-term sustainable water management.
Please read the corrigendum first before continuing.
-
Notice on corrigendum
The requested paper has a corresponding corrigendum published. Please read the corrigendum first before downloading the article.
-
Article
(7294 KB)
-
The requested paper has a corresponding corrigendum published. Please read the corrigendum first before downloading the article.
- Article
(7294 KB) - Full-text XML
- Corrigendum
- BibTeX
- EndNote


Around the world, karstic aquifers are strategic water resources that have been used to provide water to populations since early civilizations (Chen et al., 2017a; Ford and Williams, 2007). This is particularly true in Mediterranean areas (Bakalowicz, 2015), where water resources are scarce. The exploitation of karst aquifers remains a challenge because of their highly heterogeneous nature (Bakalowicz, 2005; Ford and Williams, 2007; Stevanović, 2015) and their high vulnerability to contamination from anthropogenic activities, especially under global change conditions (Chen et al., 2018; Doummar and Aoun, 2018a, b; Hartmann et al., 2014; Iván and Mádl-Szőnyi, 2017; Leduc et al., 2017). A decrease in precipitation rates and an increase in temperature have already been experienced in the Mediterranean Basin for the last 4 decades (Milano et al., 2013), and these conditions are expected to worsen according to the climate change scenarios established for the 21st century (Collins et al., 2013; Giorgi and Lionello, 2008; Kirtman et al., 2013).
Hydrogeological modeling of karst systems is a useful approach for sustainable aquifer management, as it allows spring discharge to be simulated (Fleury et al., 2009; Li et al., 2016) and provides a means to account for the impacts of climate change on future flow rates (Chen et al., 2018; Hartmann et al., 2012, 2014). Among the different types of available models, lumped models simplify karst systems (epikarst, conduit network, porous or fissured matrix, and superposed karstic series) into a schematic representation of interconnected reservoirs to reproduce spring discharge (Ghasemizadeh et al., 2012; Hartmann et al., 2013; Mazzilli et al., 2019; Sauter et al., 2006). As these models do not usually require spatial variations in karst hydrodynamic properties and subsurface processes (Chen and Goldscheider, 2014), they are best suited to poorly characterized karst hydrosystems. These models usually require meteorological data and sometimes river flow data as input (Bailly-Comte et al., 2008, 2010, 2012; Larocque et al., 1998). Usually, their calibration is based on the manual or automatic adjustment of empirical parameters that represent connections between the reservoirs in order to reproduce measured spring discharges to the extent possible using rainfall time series as input (Chen and Goldscheider, 2014; Doummar et al., 2012). However, these models are often calibrated to reproduce only the observed outputs of the systems, without accounting for subsurface discretization and distributed physical flow processes (Kong-A-Siou et al., 2013).
In the last 40 years, time series analyses of karst aquifers have been widely used to enhance the understanding of karst aquifer dynamics (Bailly-Comte et al., 2008; Fiorillo, 2014; Jeannin and Sauter, 1998; Larocque et al., 1998; Mangin, 1984), providing information on karst aquifer storage, groundwater travel times, and hydrogeological properties. By including these inferred processes, models of karst aquifers have been successfully calibrated to reproduce karst aquifer groundwater levels, spring flow rates, and chemographs (Adinehvand et al., 2017; Chen and Goldscheider, 2014; Hartmann et al., 2013; Hosseini et al., 2017; Larocque et al., 2000; Schmidt et al., 2014), thereby enhancing their representativeness and usefulness. However, the utility of lumped models calibrated to reproduce only spring flow rates can be limited with respect to estimating water vulnerability to contamination, especially in karstified areas, because input data are not spatially distributed and the flow processes are highly simplified.
The objectives of this work were (1) to acquire new knowledge of the hydrodynamic functioning of a complex karst aquifer derived from statistical and correlation time series analyses, (2) to illustrate how a semi-distributed lumped model can be calibrated on the basis of this knowledge, and (3) to assess the impact of climate change on the spring hydrodynamics to provide insight into fresh water availability. The approach is demonstrated on the Qachqouch karst spring in the region north of Beirut (Lebanon), which is a Mediterranean region governed by semiarid conditions. In 2014, a high-resolution monitoring network was established in the Qachqouch Spring catchment area, which had previously only been poorly studied (Doummar and Aoun, 2018a, b; Dubois, 2017). A semi-distributed lumped model developed using MIKE SHE (DHI, 2016a, b) is calibrated here using observed spring discharge time series. Fitting parameters were inferred and refined based on hydrodynamic properties derived from autocorrelation and cross-correlation analyses. The calibrated model was used to assess the sensitivity of flow rates in this karst system to potential variations related to climate change.
The Qachqouch spring, located in the Metn area in Lebanon, 18 km north of Beirut, drains a catchment of approximately 56 km2, with a northern boundary (shared with the Jeita Spring catchment) delineated by the Nahr el-Kalb River (Fig. 1). The topography of the upstream catchment area is mountainous, with an elevation ranging from 60 to more than 1500 m above sea level (m a.s.l.). The catchment of the Nahr el-Kalb River was determined topographically (Margane and Stoeckl, 2013), while the hydrogeology of the Qachqouch spring was further investigated by Dubois (2017). A minor hydrogeological connection was established between the Nahr el-Kalb River and the Qachqouch Spring from repeated tracer experiments and micro-pollutant analyses (Doummar and Aoun, 2018a, b).

Figure 1Location of the Qachqouch karst spring near Beirut (Lebanon).
Similar to the nearby Jeita Spring (Margane et al., 2013, 2018), the Qachqouch Spring originates from the Jurassic karst aquifer at about 64 m a.s.l. (Fig. 1). The Jurassic formation is mainly comprised of a 1070 m thick massive limestone sequence with intertonguing dolostones in the lower parts of the formation resulting from diagenetic dolomitization (Hahne, 2011; Margane et al., 2013; Nader et al., 2007). The catchment area is under the influence of the Yammouneh Fault regime (El Hakim, 2005, Hahne, 2011), leading to a high degree of tectonic deformation and fracturing. Sea level variations, especially the Messinian salinity crisis, and Quaternary glaciations also contributed to creating a high degree of karstification (very intense and very deep) in the Mediterranean area in several stages (Bakalowicz, 2015; Nehme et al., 2016) and the Jurassic limestone (Margane et al., 2013) with karst features, such as lapies, sinkholes, drains, and caves.
The spring is highly polluted due to excessive non-sorted solid waste and untreated wastewater disposal upstream in its urbanized catchment (Doummar and Aoun, 2018a, b). However, during low-flow and drought periods, the spring is used to supplement domestic water use in Beirut and its surrounding areas. The spring outlet consists of a 150 m long concrete tunnel, thereby offering a suitable cross section for flow measurement, except during extensive floods when access to the spring is inundated.
The average annual precipitation is estimated to be 1000 mm from one station deployed in the Qachqouch Catchment at 950 m a.s.l. (with ongoing high-resolution monitoring since 2014), while the average annual temperature is 16.2 ∘C. Precipitation occurs mostly between November to April, and snow is observed in January and February (above 1000 m a.s.l.), with only limited snow accumulation over long periods in the catchment (Dubois, 2017). Rainfall events are usually intense, with considerable amounts occurring over relatively short periods (e.g., 461 mm in January 2019, 97 mm on 24 December 2017, and 43 mm in 1 h on 30 October 2017). The average daily air temperature varies between 5 ∘C during winter and 23 ∘C during summer with occasional subzero temperatures.
3.1 General approach
The conceptualization of the Qachqouch system (Fig. 2) was developed based on the collection of over 3 years of high-resolution data and on the subsurface characterization of the system (panel 1, Fig. 2). Flow rate classification was performed to qualitatively characterize the system's functioning (panel 2, Fig. 2). Time series decomposition as well as simple and cross-correlation analyses were performed to estimate the system memory and response time (panel 3, Fig. 2). Using this information, a semi-distributed linear reservoir model of the Qachqouch system was conceptualized and parameterized (panel 4, Fig. 2). Climate change scenarios were elaborated (panel 5, Fig. 2) based on the Intergovernmental Panel on Climate Change (IPCC) projections for 2040 in order to test possible future system responses under different scenarios gleaned from the calibrated and validated model (panel 6, Fig. 2). The data, methods, and theories used for each of these steps are presented in the following sections.
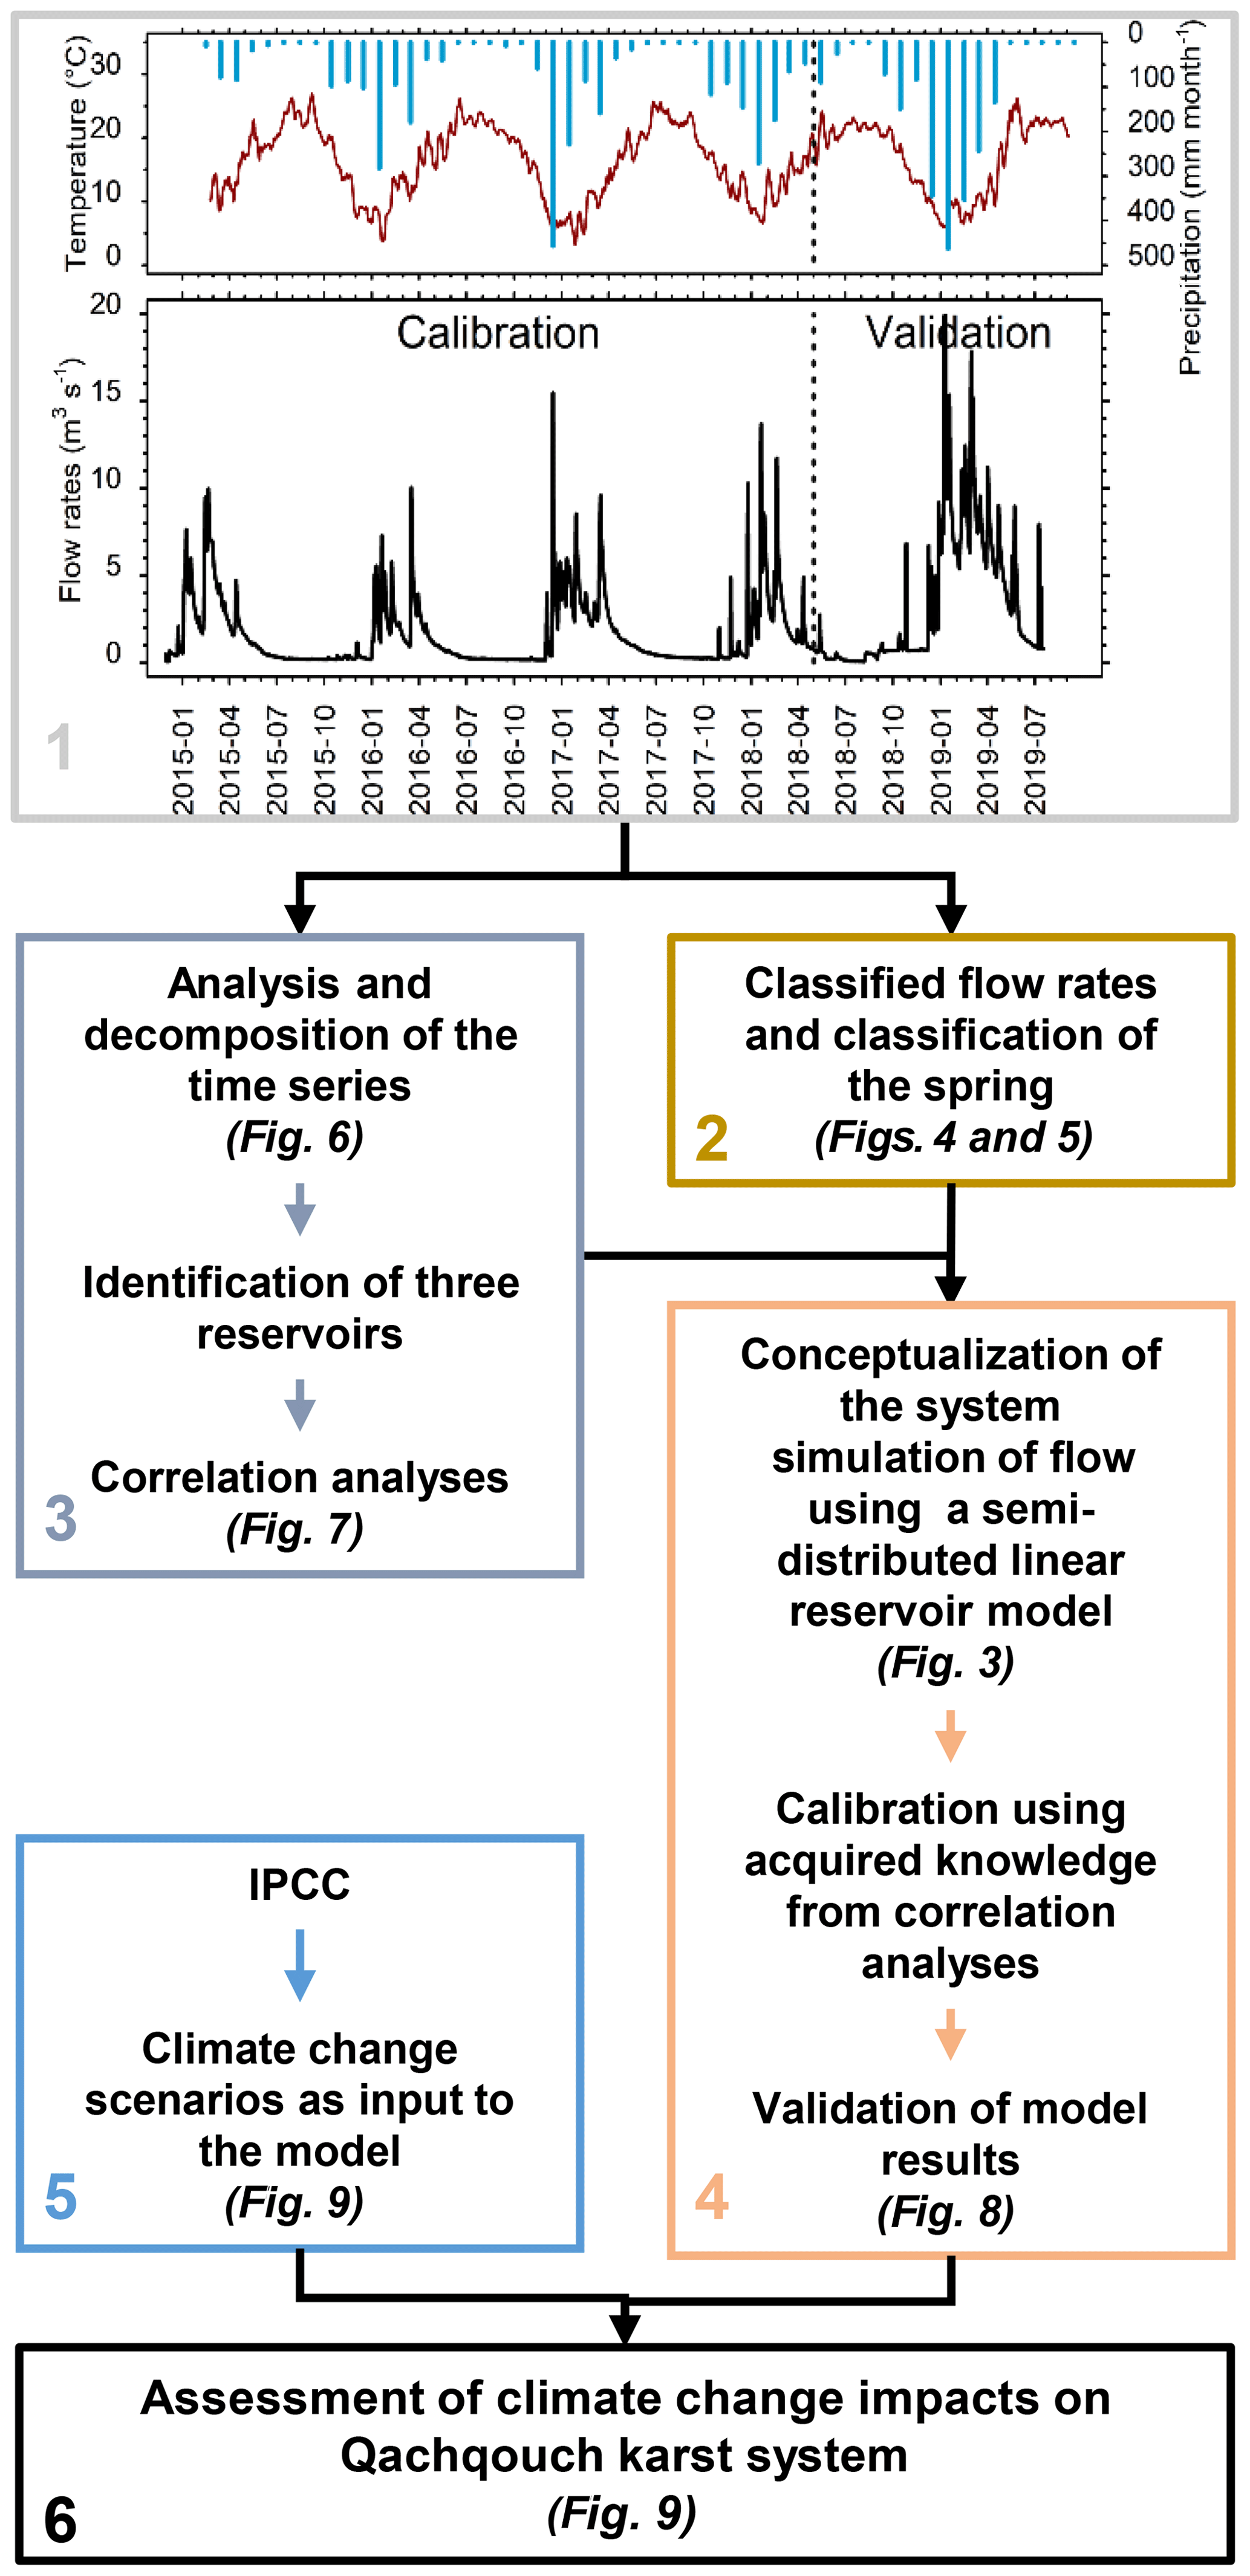
Figure 2Schematic representation of the six-step methodology adopted for model conceptualization and the calibration.
3.2 Meteorological and hydrological data
In the framework of a monitoring project funded by USAID since 2014 (PEER, Cycle 3), two full meteorological stations with hourly precipitation, temperature, humidity, wind direction and speed, and solar radiation measurements (one Campbell-Scientific Alpine station with a heated gauge and one Hobo station mounted with a data logger) were installed at elevations of 1700 and 950 m a.s.l., respectively, in the region of the Qachqouch and Jeita springs. Additionally, a multiparameter probe (In situ TROLL 9500) was installed at the spring discharge to record water level and water temperature every 30 min. The discharge flow rates were calculated using a rating curve based on bimonthly measured discharge rates by direct gauging with errors of 8 %–10 % during recession periods. Flow rates exceeding 10 m3 s−1 are considered to be less precise, especially when the section is overflowed. The few gaps in the time series (less than 1 month combined) were linearly interpolated and smoothed using a moving average over the entire time series to remove outliers and aberrant values.
For the purposes of this study, temperature (−0.45 elevation) and precipitation (6% 100 m−1 elevation) gradients were calculated via regression analysis of the incremental and cumulative variations in temperature and precipitation with altitude between the two climatic stations (Doummar et al., 2018).
3.3 Time series analyses
3.3.1 Analyses of the spring flow rate data
A frequency analysis of the spring flow rates data was performed (Dörfliger et al., 2010; Mangin, 1971; Marsaud, 1997). Flow rates and their frequency of measurements were linked with a lognormal distribution, except for outliers arising from variation in flow dynamics.
Following hydrograph decomposition, the method developed by Mangin (1971, 1975) was used to estimate the dynamic volume (Vdyn) available in the aquifer during the depletion flow of a karst spring. As shown in Eqs. (1)–(3), this method separates the recession of the hydrograph (Ψ) from depletion (φ). It is the equivalent of considering two reservoirs: the first reservoir – which is associated with the vadose zone – drains into the second reservoir – which corresponds to the phreatic zone. The total spring flow rate (Q) is divided as follows:
The two parts are detailed as
Finally, the dynamic volume is obtained by
where qo is the infiltrating flow at the beginning of the flood event (L3 T−1; L refers to length and T refers to time), η is the infiltration velocity coefficient (T−1), ε is the heterogeneity flow coefficient (T−1), t is the time from the beginning of the flood event (T), is the fictional flow rate of the depleting curve at the maximum of the flood event (L3 T−1), α is the depleting coefficient (T−1), Qi is the flow rate (L3 T−1) at time ti when depletion began (), and c is the time constant (86 400 s d−1 for Qi in m3 s−1 and α in d−1).
The calculation of the parameters listed above allows the two parameters, k and i, used in the karst spring classification proposed by Mangin (1975) to be characterized for comparison with other Middle Eastern and Lebanese springs analyzed by El-Hakim and Bakalowicz (2007) and Bakalowicz et al. (2008) (panel 2, Fig. 2). The parameter k (Eq. 5) characterizes the extent of the phreatic zone and its regulating capacity: its processes of storage and discharge of infiltrated rainfall. Karstic springs are supposed to have k < 0.5 (Mangin, 1975; Marsaud, 1997), as opposed to the value of k > 0.5 that is characteristic of porous aquifers.
where Vdyn is the dynamic volume (L3 T−1), and Vtrans is the average annual transit volume (L3 T−1).
A system with mainly fast infiltration would be characterized by an i close to zero, whereas a system with mainly slow and delayed infiltration would have an i value of close to one. The parameter i is estimated using the following ratio at t=2 d (Eq. 6):
3.3.2 Decomposition of the spring hydrograph
Based on Forkasiewicz and Paloc (1967), Jeannin and Sauter (1998) suggested considering three reservoirs when conceptualizing flow from a fractured rock aquifer: a reservoir with low permeability (reservoir 1), a conduit network (reservoir 2), and an intermediate system (reservoir 3). Each of these can be represented using the exponential drainage of a reservoir based on Darcy's law, with specific recession coefficients (Eq. 7).
where Q1, Q2, and Q3 are the initial discharge rates of each respective reservoir (L3 T−1), and α1, α2, and α3 are the respective reservoir recession coefficients (T−1), which are linked to their respective hydraulic conductivities and geometries (Kovács et al., 2005; Fiorillo, 2011).
This time series decomposition was applied to the spring flow rates (panel 3, Fig. 2) to verify if spring flows could be relevantly linked to three conceptual reservoirs.
3.3.3 Correlation analyses
The autocorrelation function of a time series r(p) is obtained by measuring the linear dependency of a given signal to itself (Eq. 8), shifted by the time lag (p), and is deduced from the correlogram C(p) (Eq. 9).
where C(0) is the correlogram for p=0; p is the time lag (p=0 to m); n is the length of the time series; x is a single event; is the mean of all events; and m is the cutoff point, which determines the interval over which the analysis is carried out, and is usually chosen to circumscribe a given hydrograph feature, such as annual or long-term effects.
Mangin (1984) suggested that the analysis is only valid until . Based on the autocorrelation function, the memory effect represents the inertia of the system and the possibility of storage. It is identified as the time when r(p) reaches a small value, and it is used to compare karstic hydrosystems to one another. Here, this value is set to 0.2, as suggested by Mangin (1984).
The correlation between an input signal, x(t), and an output signal, y(t), is given by a cross-correlation function, rxy(p) (Eq. 10), which is obtained from the cross-correlogram Cxy(p) (Eq. 11).
where σx and σy are the standard deviations of the time series. The delay of a system is the lag between p=0 and the peak of cross-correlation between the input and output.
Autocorrelation and cross-correlation analyses were performed on precipitation and on the Qachqouch flow rate time series to estimate the memory effect of the system and the delay between precipitation and the hydrological response of the karst system (panel 3, Fig. 2). Autocorrelation and cross-correlation of simulated flow rates were compared to those of the input data, as an additional validation method (panel 4, Fig. 2).
3.4 Numerical modeling of a semi-distributed linear reservoir
The Qachqouch system was modeled using the MIKE SHE software (DHI 2016a, b). The modeled catchment is subdivided spatially into several sub-catchments, in addition to the saturated zone, which is represented as several linked reservoirs (Fig. 3). The model is decomposed into three domains (Doummar et al., 2012). The first domain consists of the atmosphere, composed of rainfall and snow time series spatialized over the spring catchment and its topography (Fig. 3). The second domain entails a spatialized simplified unsaturated zone (UZ), consisting of land use, vegetation, and crop coefficients, such as the leaf area index (LAI) and root density (RD) to calculate potential evapotranspiration (PET) based on the Penman–Monteith equation (FAO, 1998), water interception by vegetation (Kristensen and Jensen, 1975), and runoff. The second domain also includes the unsaturated zone, represented using a simple two-layer model to calculate the actual evapotranspiration (AET) and subsequent infiltration through the unsaturated zone. The volume of water infiltrating into the third domain, which is the saturated zone (SZ), is then simulated at each time step. The SZ is simulated via linear reservoirs comprised of five interflowing reservoirs, corresponding to the five major sub-catchments of the spring (I1 to I5; Fig. 3), which empty into each other (in topographical order), and includes two base flow reservoirs (B1 and B2; Fig. 3). In this configuration, discharge from the entire system feeding the Qachqouch Spring consists of the cumulative discharge of spatially discretized connected reservoirs feeding into a fast-flow and a slow-flow reservoir with different recession coefficients. Therefore, the complete model is considered a classical lumped model for the saturated zone but also a physically based model for the system inputs (atmosphere) and the soil compartment.
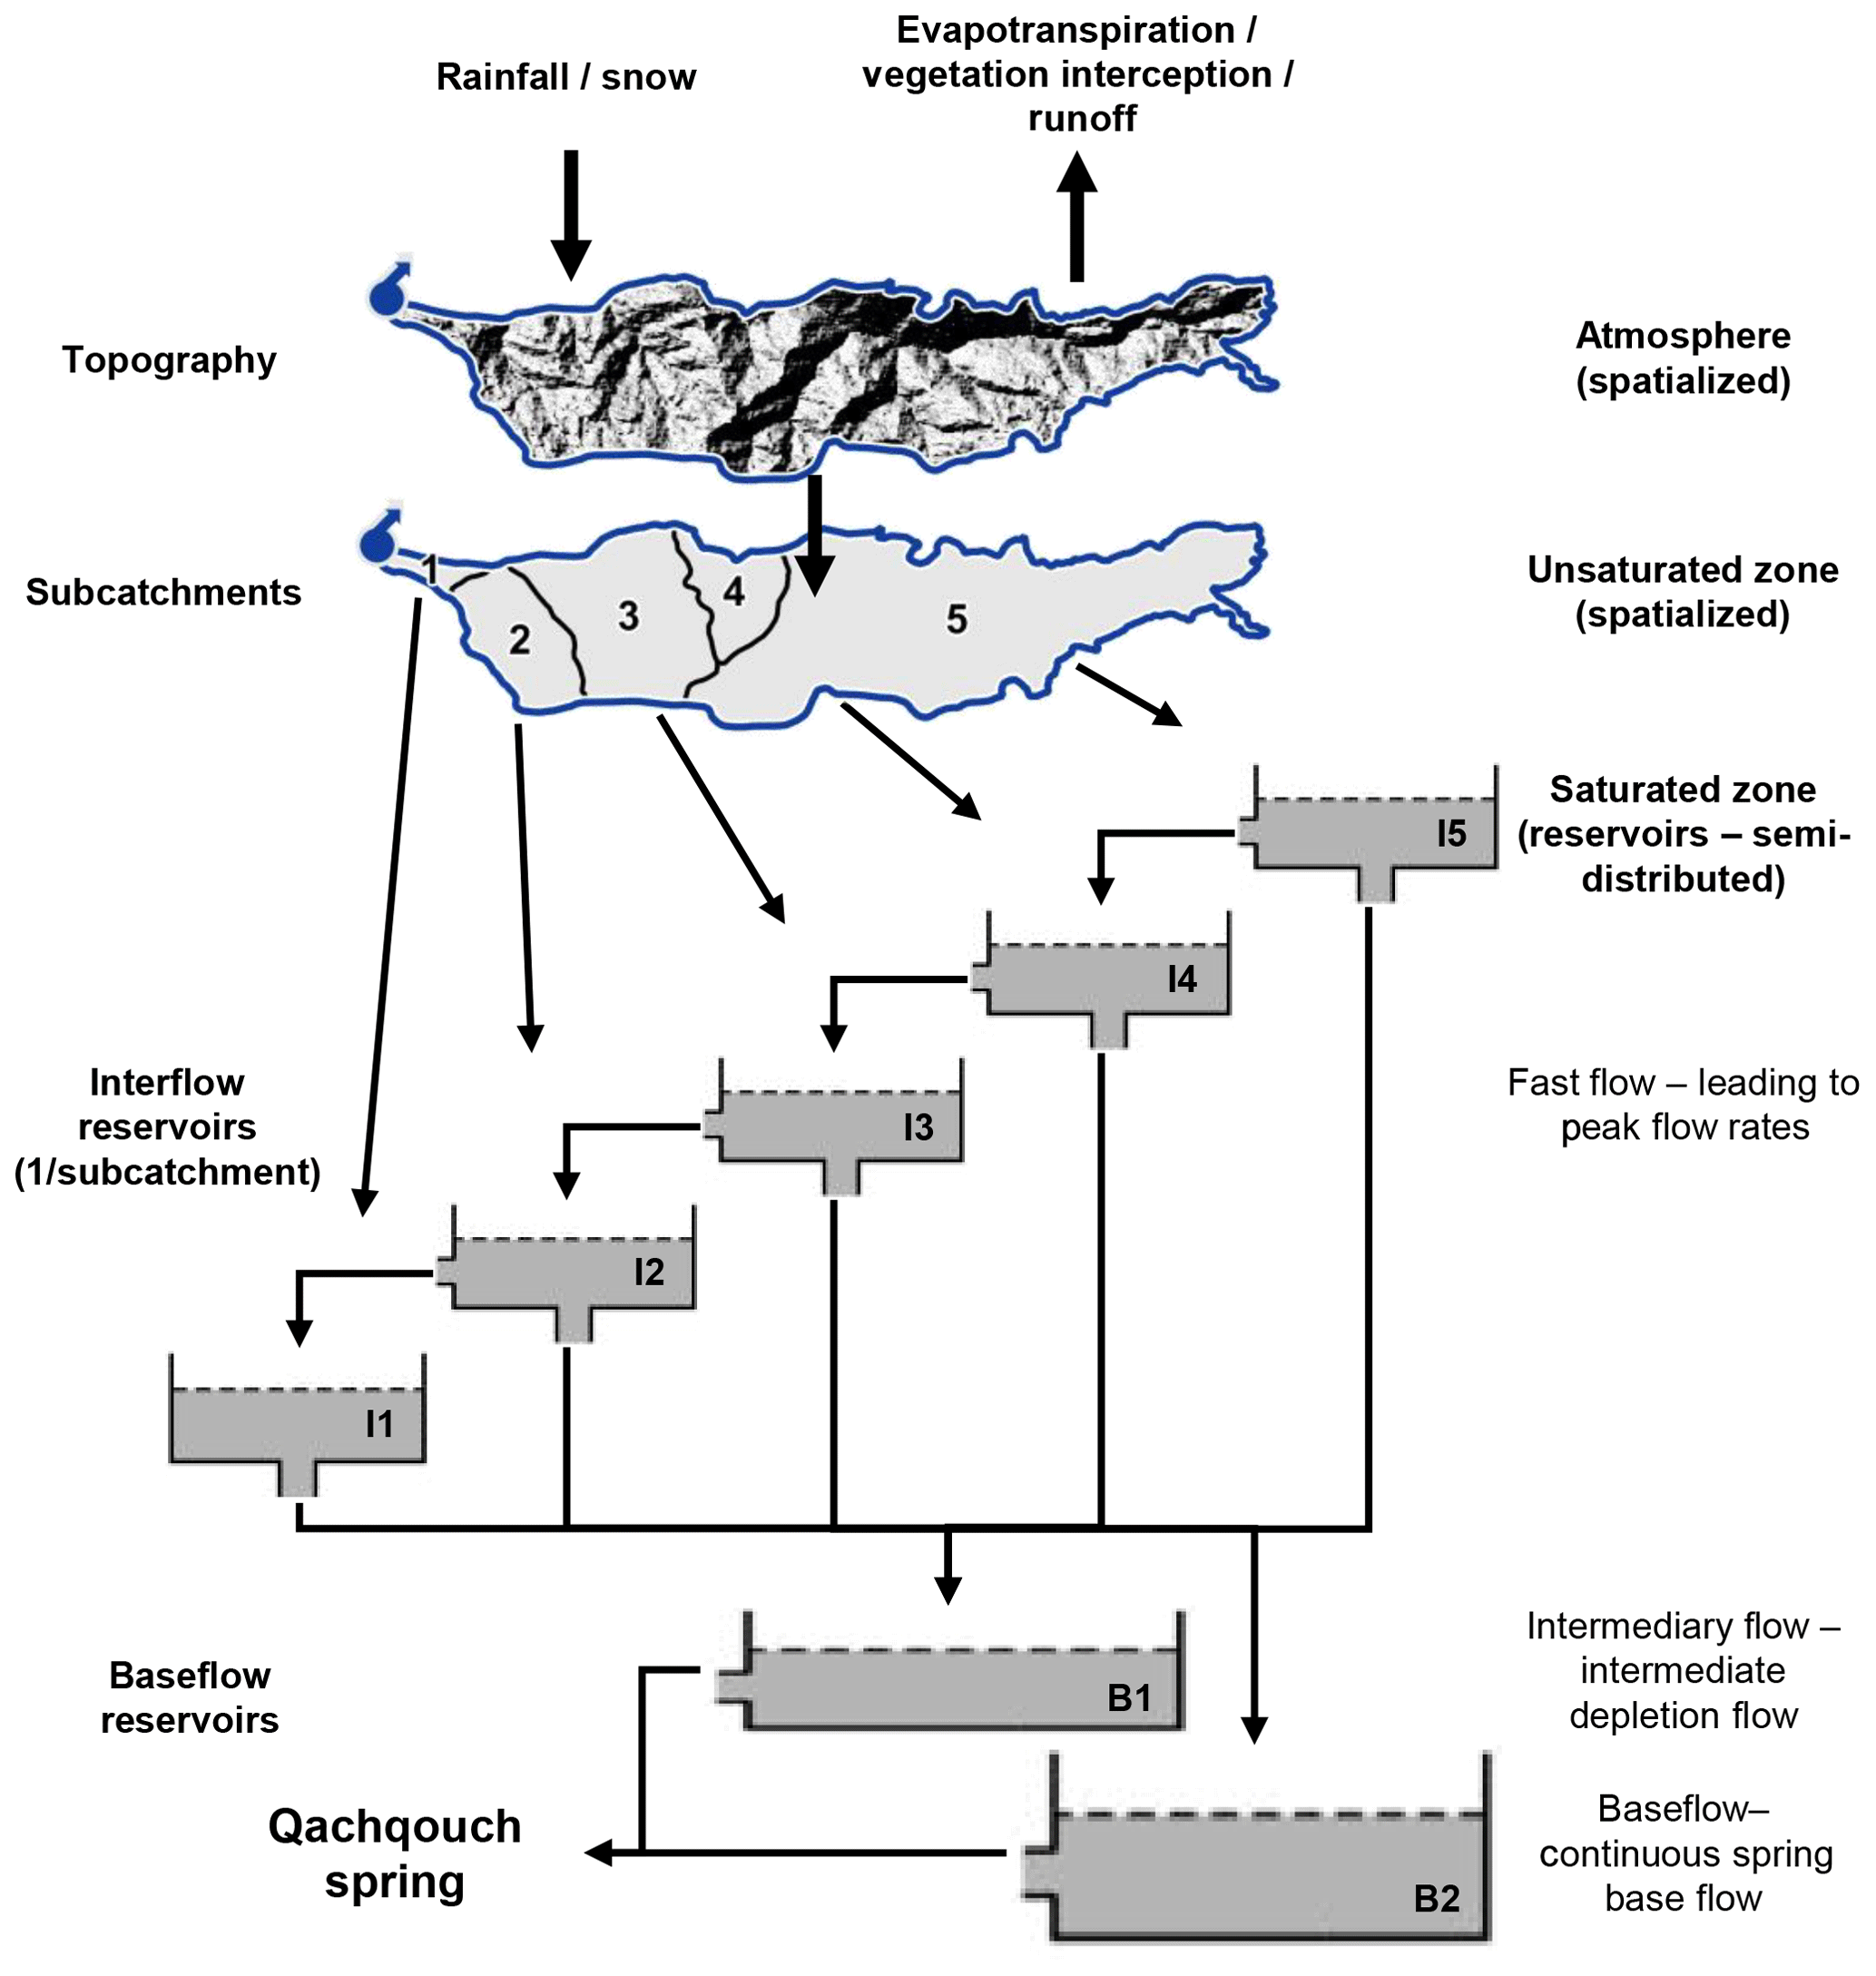
Figure 3Conceptual map of the model, using the internal structure of MIKE SHE (DHI, 2016a, b).
The model uses 20 parameters defining the atmosphere, the UZ, and the saturated interflow and base flow reservoirs. The simulated flow rates were compared to measured values using the Nash–Sutcliffe efficiency coefficient (NSE) and the root-mean-squared error (RMSE) to achieve the best calibration possible with a calibration period (January 2015–April 2018) and a validation period (May 2018–July 2019). A sensitivity analysis was conducted automatically on single parameters using the Autocal function (DHI, 2016a) to identify the parameters to which the model is highly sensitive.
Calibrating a model of the spring was a necessary step in the analysis of the impact of changing climate conditions on the spring hydrodynamics (panel 4, Fig. 2).
3.5 Sensitivity to future climatic variations
According to the IPCC (2014), at the 2080–2100 horizon, the temperature in the eastern Mediterranean Basin will have increased from +2 to +3 ∘C (Representative Concentration Pathway, RCP, 2.6 – optimistic scenario) to +5 to +7 ∘C (RCP 8.5 – pessimistic scenario) during the December–May rainy season relative to the 20th century trend (Collins et al., 2013; Kirtman et al., 2013). Here, the assessment of potential climate change impacts on spring flow rates is undertaken by applying several simple climate change conditions onto climate data from the observation period (average daily temperature and precipitation estimated from the mean observed values) for an average year for the catchment to simulate the expected spring discharge under future conditions (panel 5, Fig. 2). According to the global climate model (GCM) IPSL-CM5 and the mid-range RCP 6.0 scenario (Dufresne et al., 2013) adapted for the Lebanese context (Doummar et al., 2018), the expected warming is +0.1 to +0.3 ∘C yr−1 (i.e., a total increase of +1 to +3 ∘C above the current average annual temperature for the 10th year of the 2020–2030 period). A reduction in annual precipitation in the range from −10 % to −30 % (Fig. 9) is expected with an increase in evapotranspiration proportional to the rise in temperature.
4.1 Qualitative functioning of the system
4.1.1 Measured flow rates
The interannual (2015 to 2019) average Qachqouch Spring flow rate is 2.1 m3 s−1 (1.7 m3 s−1 during the calibration period and 3.4 m3 s−1 during the validation period), and its total annual discharge varies between 44 and more than 50 Mm3. The average flow rate is 2 m3 s−1 during high-flow periods (during a normal year) and recedes to 0.2 m3 s−1 during recession periods, with a maximum recorded flow of more than 20 m3 s−1 for a short period of time following a flood event (there is a high degree of uncertainty as to the exact value of the maximum flow rate as it is higher than 10 m3 s−1). Flow rates for the 2018–2019 hydrological year were particularly high, corresponding an exceptionally rainy year (1800 mm between September 2018 and July 2019 in comparison to the average of 1000 mm yr−1). Therefore, this period is only used as a modeling validation period, and flow measurement are not included in the time series analysis.
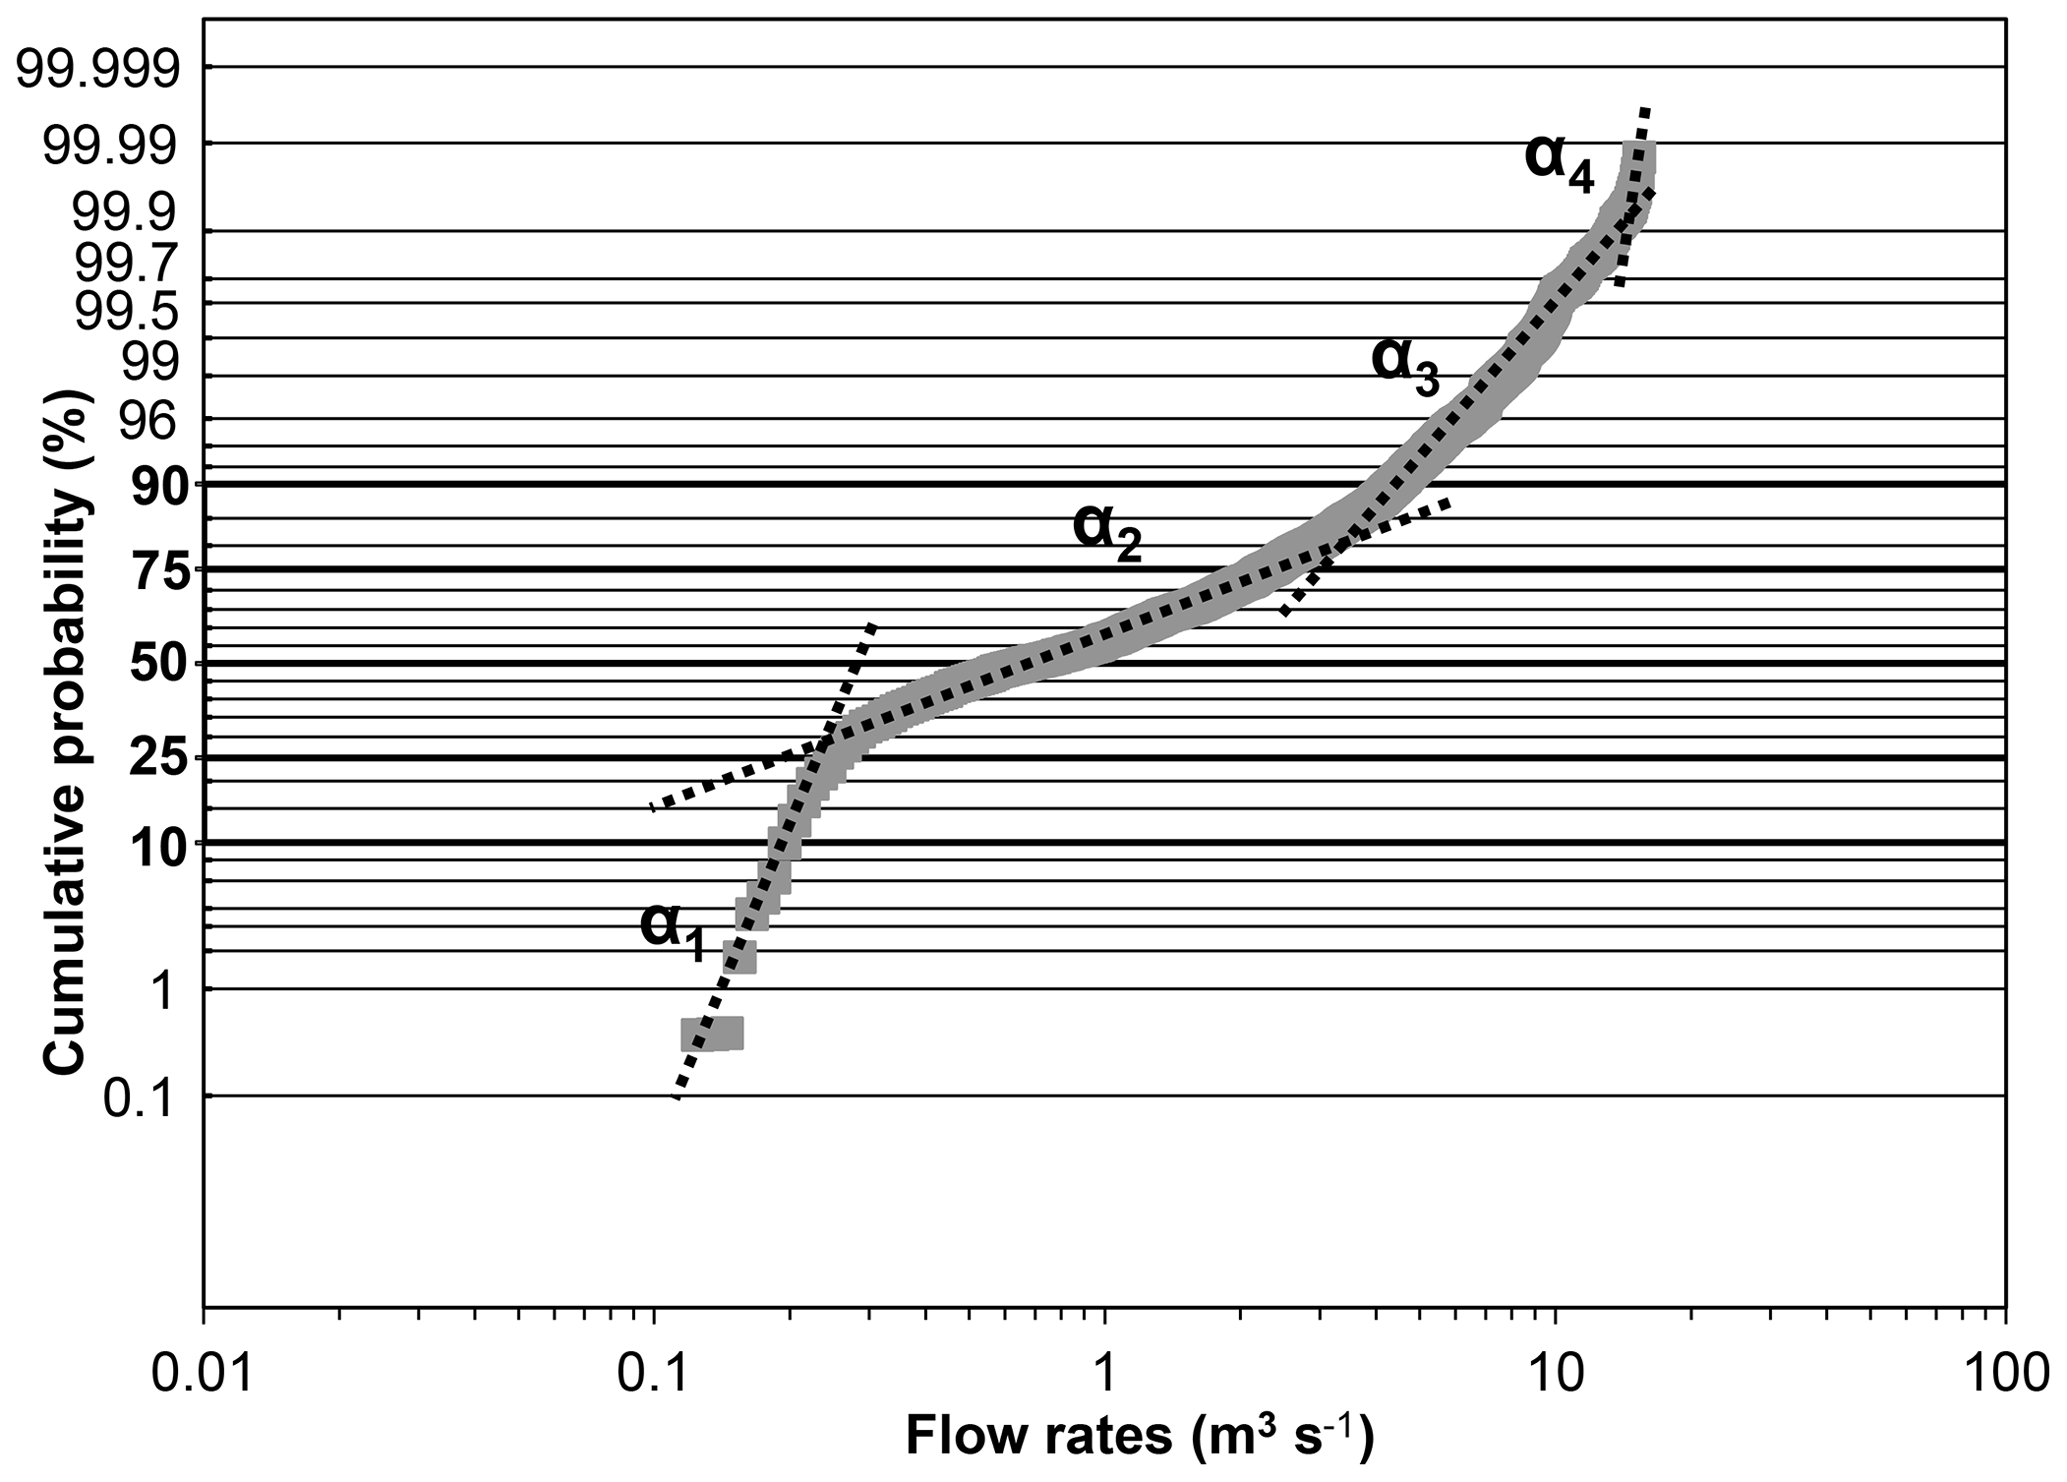
Figure 4Cumulative probability of flow rates and their classification by slope (α1 to α4) for the 2015–2018 period.
The flow rate frequencies (Fig. 4) can be divided into four different categories based on the slopes of the frequency curve. The interpretation suggested by Dörfliger et al. (2010), based on the shapes of the curves and the positions of the three breaking slope points, can be used to understand the aquifer hydrodynamics. The break in slope between a3 and a4 shows that the section at the gauging station is probably overflowed for flow rates above 10 m3 s−1. The flow rates corresponding to slopes a2 (between 0.25 and 3 m3 s−1) and a3 (between 3 and 10 m3 s−1) are interpreted as the presence of two distinct temporary storages within the aquifer. Flow rates of less than 0.25 m3 s−1 (break in the slope between a1 and a2) correspond to water that is slowly released from the aquifer. This generally confirms that the flow rates are related to a single aquifer with two interacting base flow reservoirs corresponding to a capacitive and conductive function, or slow and fast flows, with no inter-aquifer exchanges, therefore facilitating further interpretation of the time series analyses.
4.1.2 Recession coefficients
The coefficients k and i, representing the regulation capacity of the system (storage and discharge of rainfall) and the infiltration conditions (fast versus delayed), respectively, were calculated for the Qachqouch Spring based on the 2015, 2016, and 2017 recessions (Fig. 5). Although the Qachqouch system has a high regulation capacity (k=4 years), similar to a porous aquifer, it has an average infiltration delay, i, of 0.5, characterizing a system with significant storage recharged by both fast and slow infiltration, which classifies Qachqouch system among the other Lebanese and Middle Eastern karstic systems (El-Hakim and Bakalowicz, 2007).
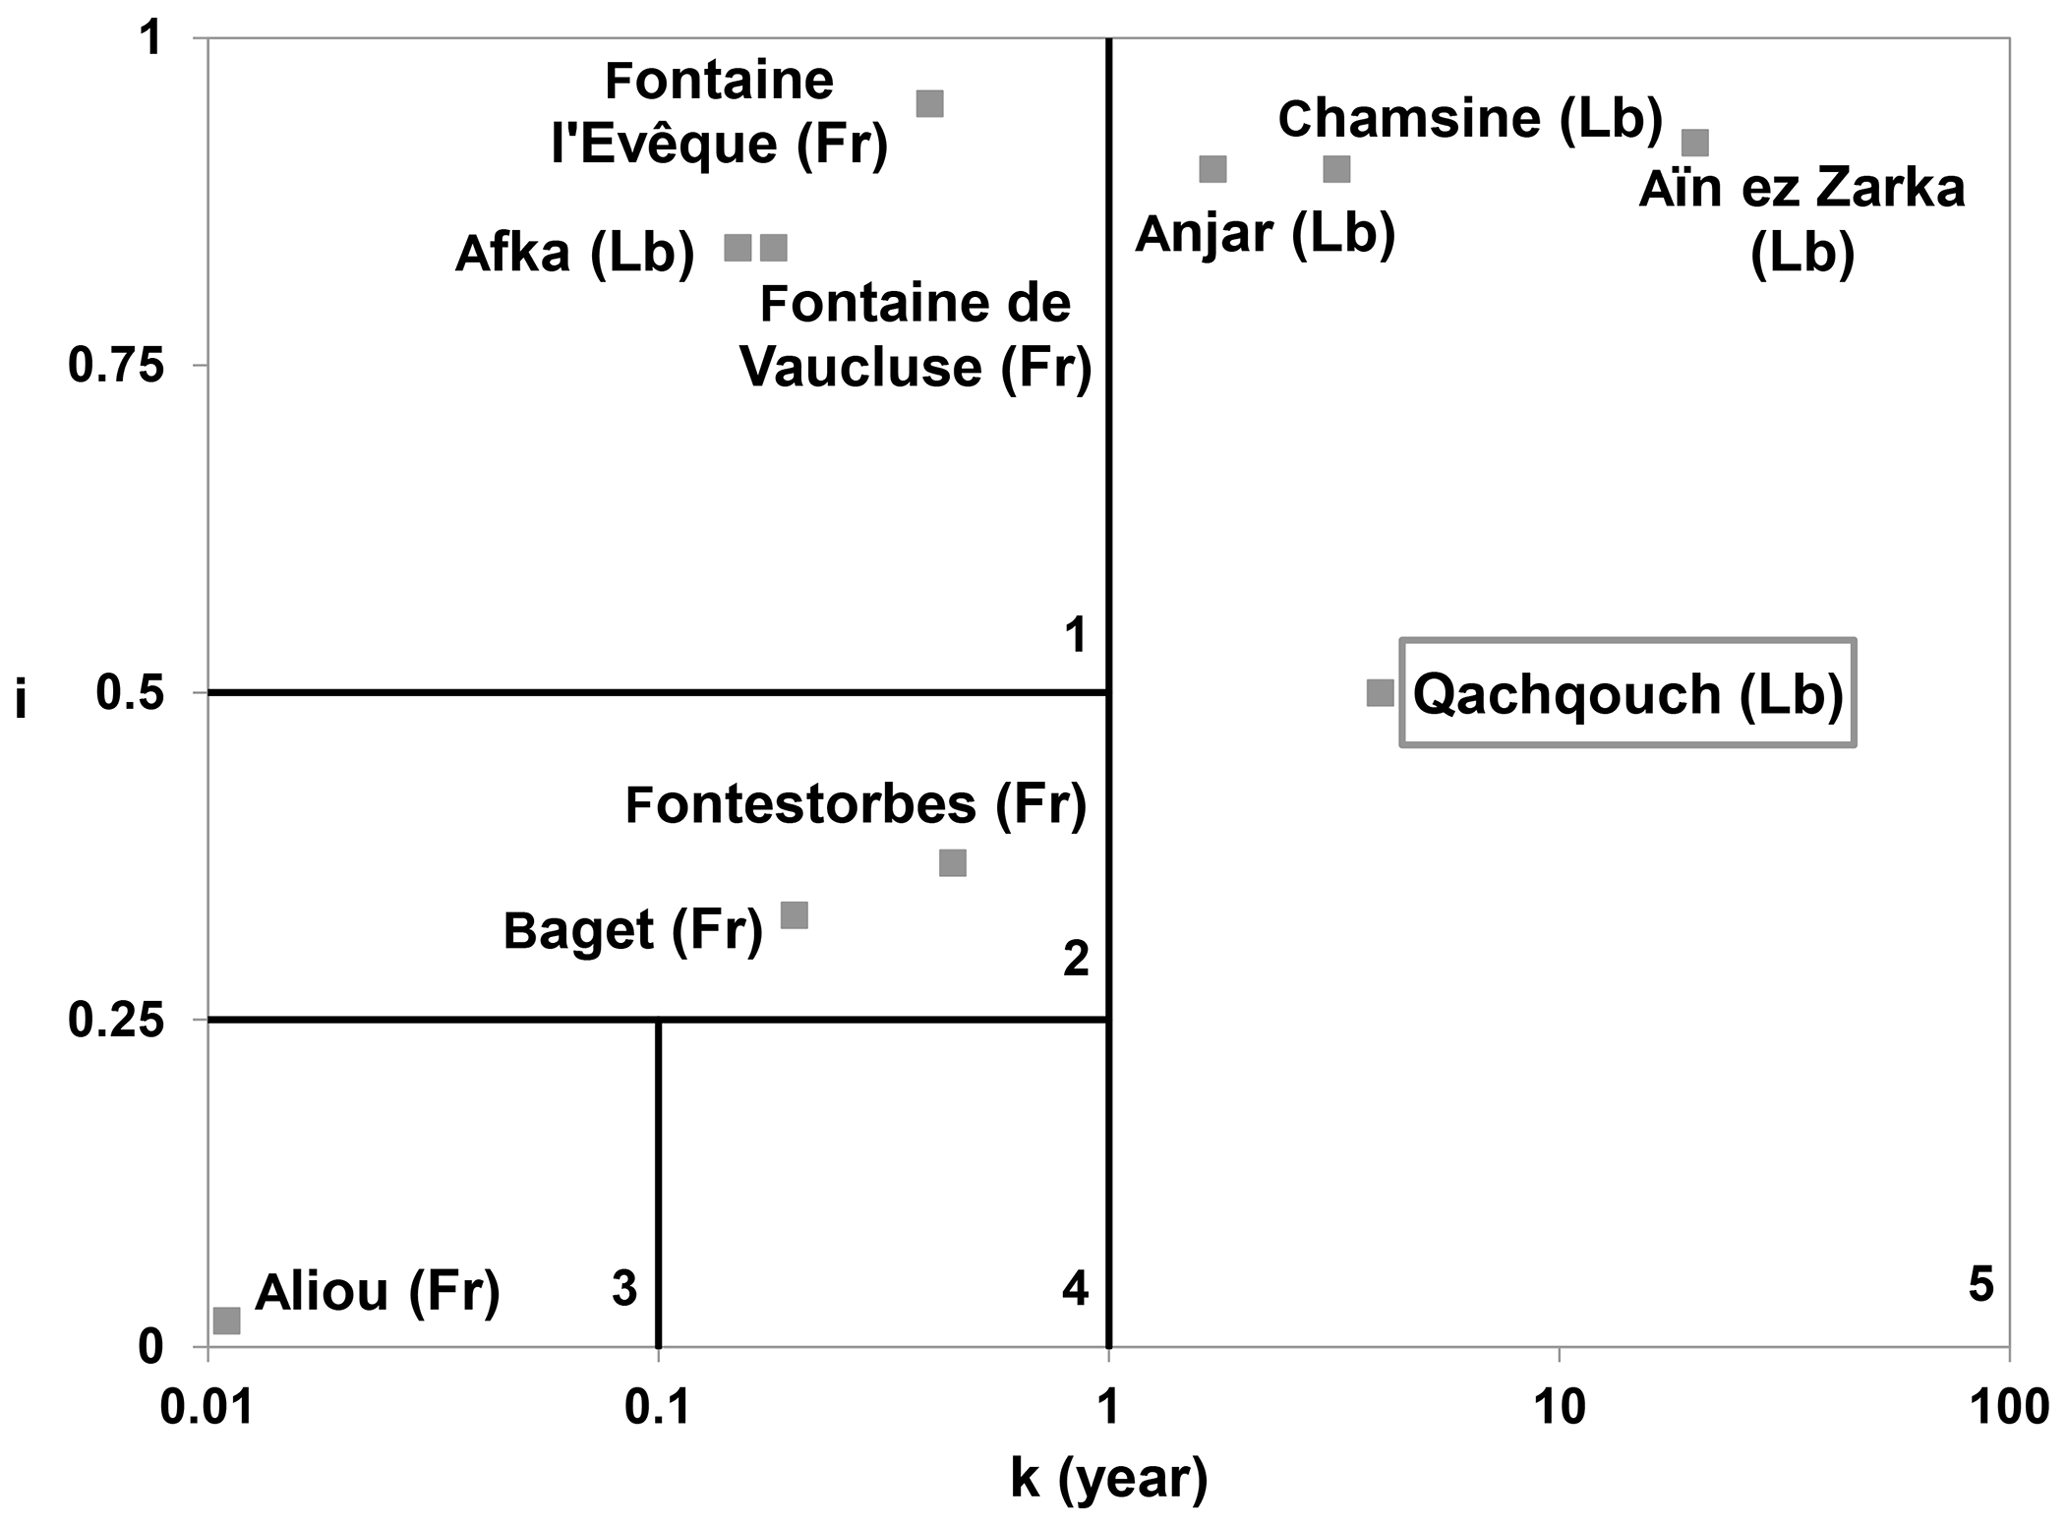
Figure 5Qachqouch Spring within the classification of karstic springs as a function of their k and i parameters (El-Hakim and Bakalowicz, 2007). Fr stands for France, and Lb stands for Lebanon.
4.1.3 Decomposition of the spring discharge time series
Assuming that the spring discharge can be represented using several draining reservoirs (with the drainage function following Darcy's law), 77 depletion coefficients (Mangin, 1975) were calculated over the entire time series (Fig. 6). These coefficients can be classified into three categories. In the first, the summer dry period has low flow rates, around 0.25 m3 s−1, and slow depletion, characterized by α values of 0.004 d−1 on average (α1). In the second category, flow rates are less than 7 m3 s−1, with faster depletion and α values of 0.050 d−1 on average (α2). The highest flow rates are found in the third category and occur at the beginning of the depletion, with very fast depletion related to α values of 0.220 d−1 on average (α3).
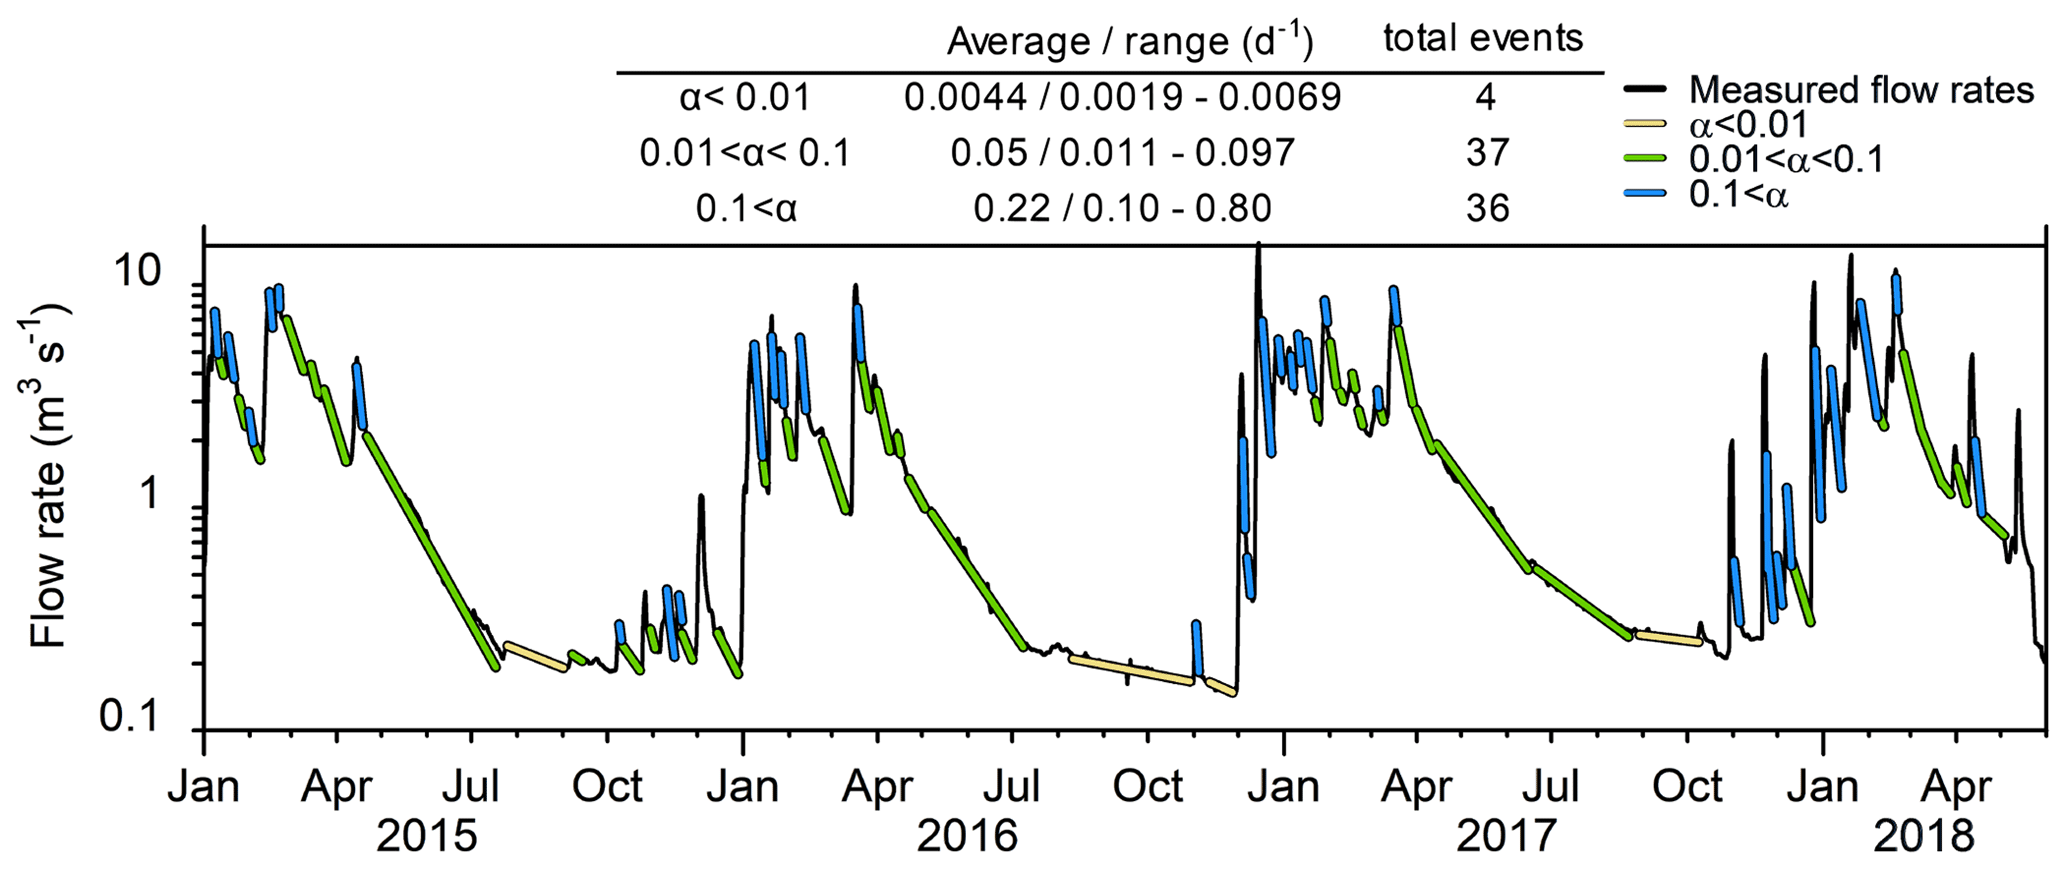
Figure 6Calibration of the recession coefficients for 77 depletions over the 2015–2018 period.
4.1.4 Correlation analysis
The autocorrelation function of rainfall (performed with a maximum lag of one-third of the available time series) shows a rapid decrease to zero, whereas that of the spring flow rates shows a slow decrease, with a memory effect of approximately 50 d (Fig. 7a). This means that the system has a substantial regulation capacity, similar to that reported for other Lebanese springs (Bakalowicz et al., 2008; El-Hajj, 2008). The peak of the cross-correlation function of rainfall (input) against spring flow rates (output; also performed with a maximum lag of one-third of the available time series) is 0.52 (Fig. 7b). It is delayed by approximately 1 d, characterizing a fast infiltration component with a strong correlation with the rainfall events. The inertia of the rest of the system tends to smoothen the input signal, as portrayed by the slow decrease in the cross-correlation function from rxy(p)=0.25. An annual cycle (not fully displayed here) is visible with an increase in rxy(p) starting again at 270 d.
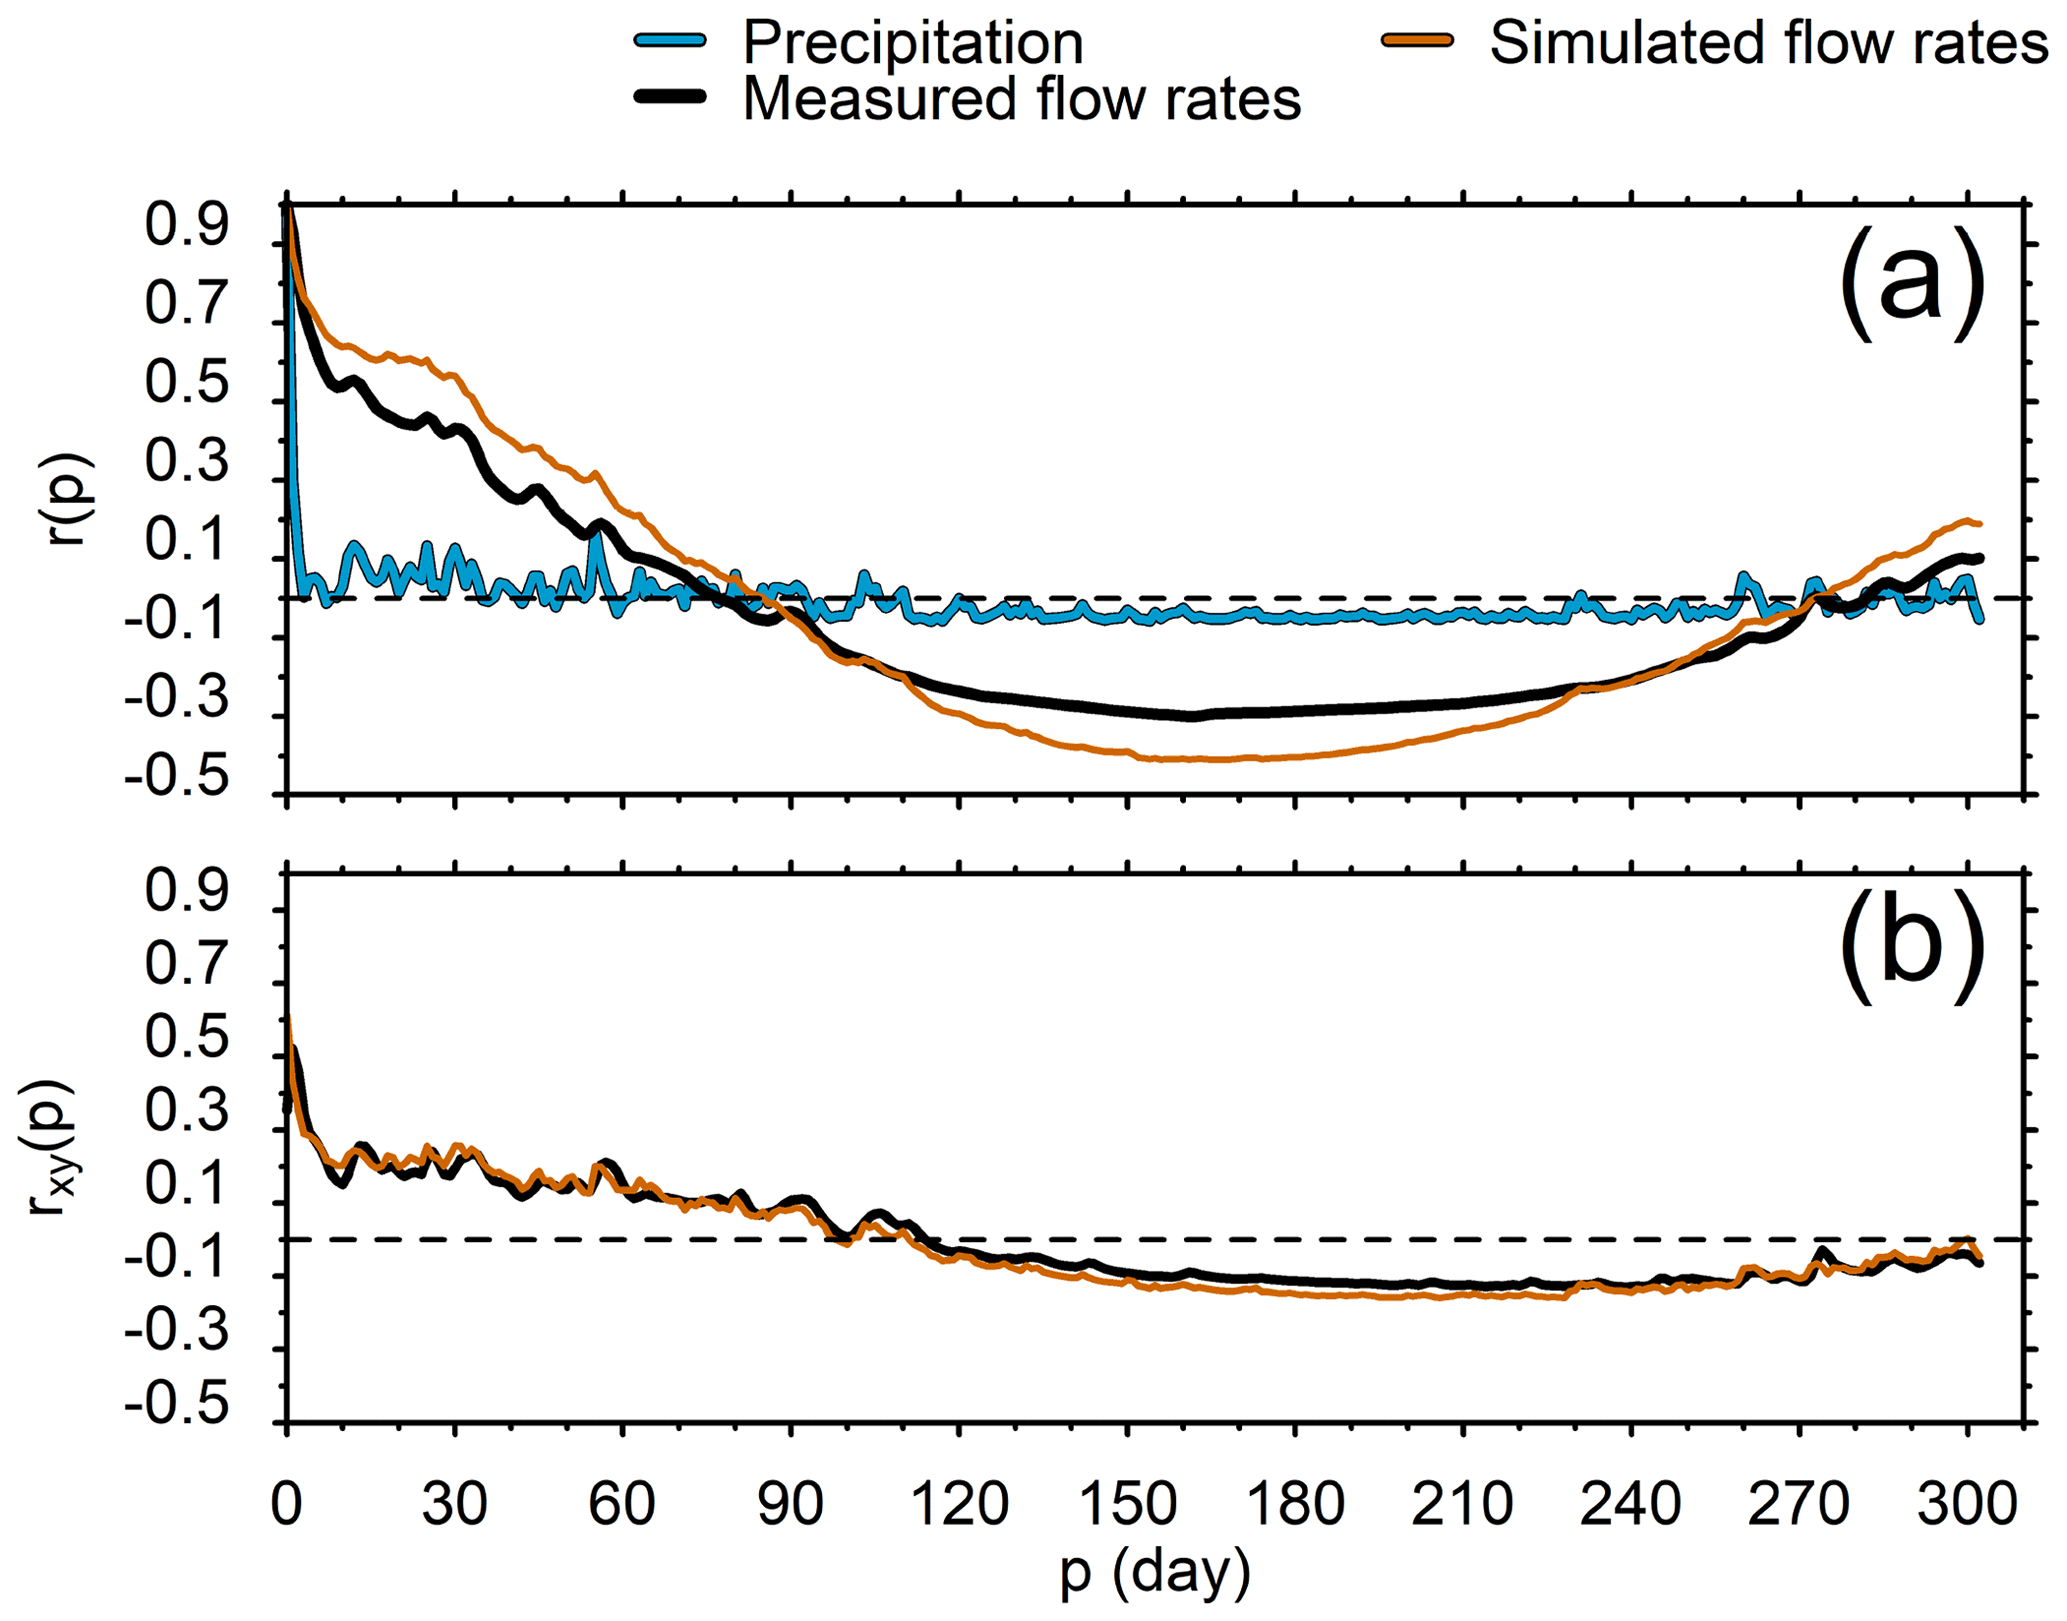
Figure 7Autocorrelation functions of precipitation, measured flow rates, and simulated flow rates (a) as well as cross-correlation functions between precipitation (input) and measured or simulated flow rates (outputs) (b). Both were performed on one-third of the 2015–2018 period ().
4.2 Simulated past flow rates
The discharge of the Qachqouch Spring for the 2015 to 2019 hydrogeological years was successfully simulated using the integrated semi-distributed linear reservoir model (Fig. 8). The model was simulated from 2012 to allow for a spin-up period before the calibration and validation time span (2015–2019). The calibrated model parameters are presented in Table 1. A satisfactory fit is observed between the simulated and the measured flow rates, with NSE =0.70 (0.60 during calibration; 0.74 during validation) and an RMSE of 1.57 m3 s−1 (1.27 m3 s−1 during calibration; 2.17 m3 s−1 during validation). The average simulated flow rate is 2.0 m3 s−1 (1.7 m3 s−1 during calibration; 3.0 m3 s−1 during validation), which is very close to the average measured flow rate of 2.1 m3 s−1 (1.7 m3 s−1 during calibration; 3.4 m3 s−1 during validation), although the calibration period did not include the exceptional year. Even though the annual recession periods are well simulated by the model, the simulated summer flow rates reach values of less than 0.1 m3 s−1 (for approximately 70 d); values that were not reached in the measured flow rates. The exceptional 2018–2019 year with high precipitation rates and an important spring flow response induces a relatively higher mean residual error. The parameters to which the model was found to be most sensitive (Table 1) are the base flow reservoirs specific yields and time constant, the fraction of percolation to the base flow reservoir (reservoir B2 from Fig. 3), and the time constant for percolation between the interflow reservoirs. The previous analyses performed on the time series allowed the model geometry (number of reservoirs and their parameters) and the ranges of these parameters to be refined during calibration, thereby reducing model uncertainty by optimizing the conceptual model on the system hydrodynamic functioning (Enemark et al., 2019).

Figure 8Measured temperature and precipitation (a) and observed and simulated spring discharge (b).
Table 1Parameterization of the hydrological model (MIKE SHE 2016), final calibration values, and sensitivity tests.
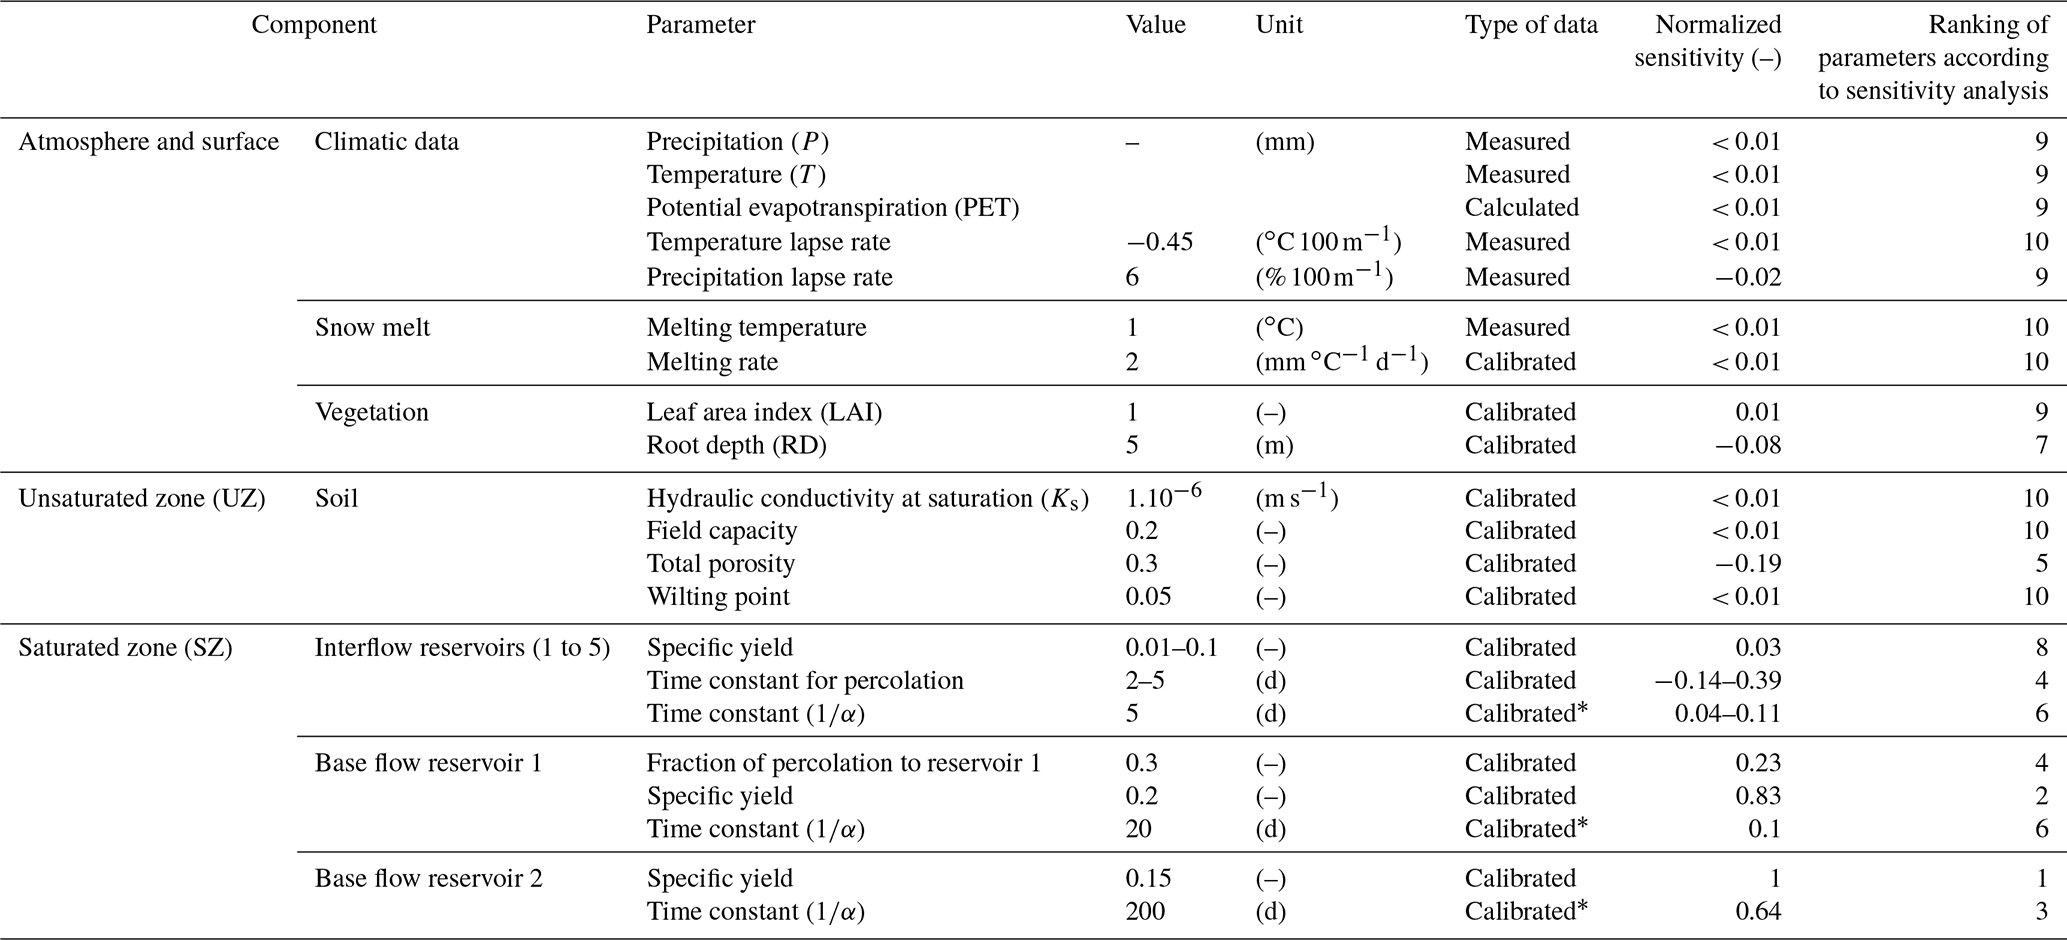
* Previously calibrated with the analyses of the time series.
Larocque et al. (2000) showed that verifying the consistency of simulated flow rates in a karst aquifer is possible by performing autocorrelation and cross-correlation analyses on the simulated values and comparing the results with the time response functions of the observed data. The autocorrelation function of the measured and simulated flow rates are similar here, with a simulated memory effect that is slightly longer (62 d) than that of the real system (50 d). The cross-correlogram of the simulated spring discharge generally fits those of the measured discharges, with similar delays (approximately 1 d) between the input (rainfall) and output (spring discharge), and a similar shape of the cross-correlation function (Fig. 7b). Therefore, the model generally reproduces both the fast and slow response of the system to infiltration well.
4.3 Simulated future responses to climate changes
The climate change conditions derived from seven potential scenarios for the study area (Table 2) have been applied over 10 consecutive years to compare the system responses in the 10th year to a baseline scenario, obtained by averaging the monitored climatic data (precipitation and temperature) on a daily basis to produce an average year (Fig. 9). The seven climate scenarios were built using the baseline scenario and applying the different climate change conditions.
Table 2Simulation results and comparison with the baseline scenario.
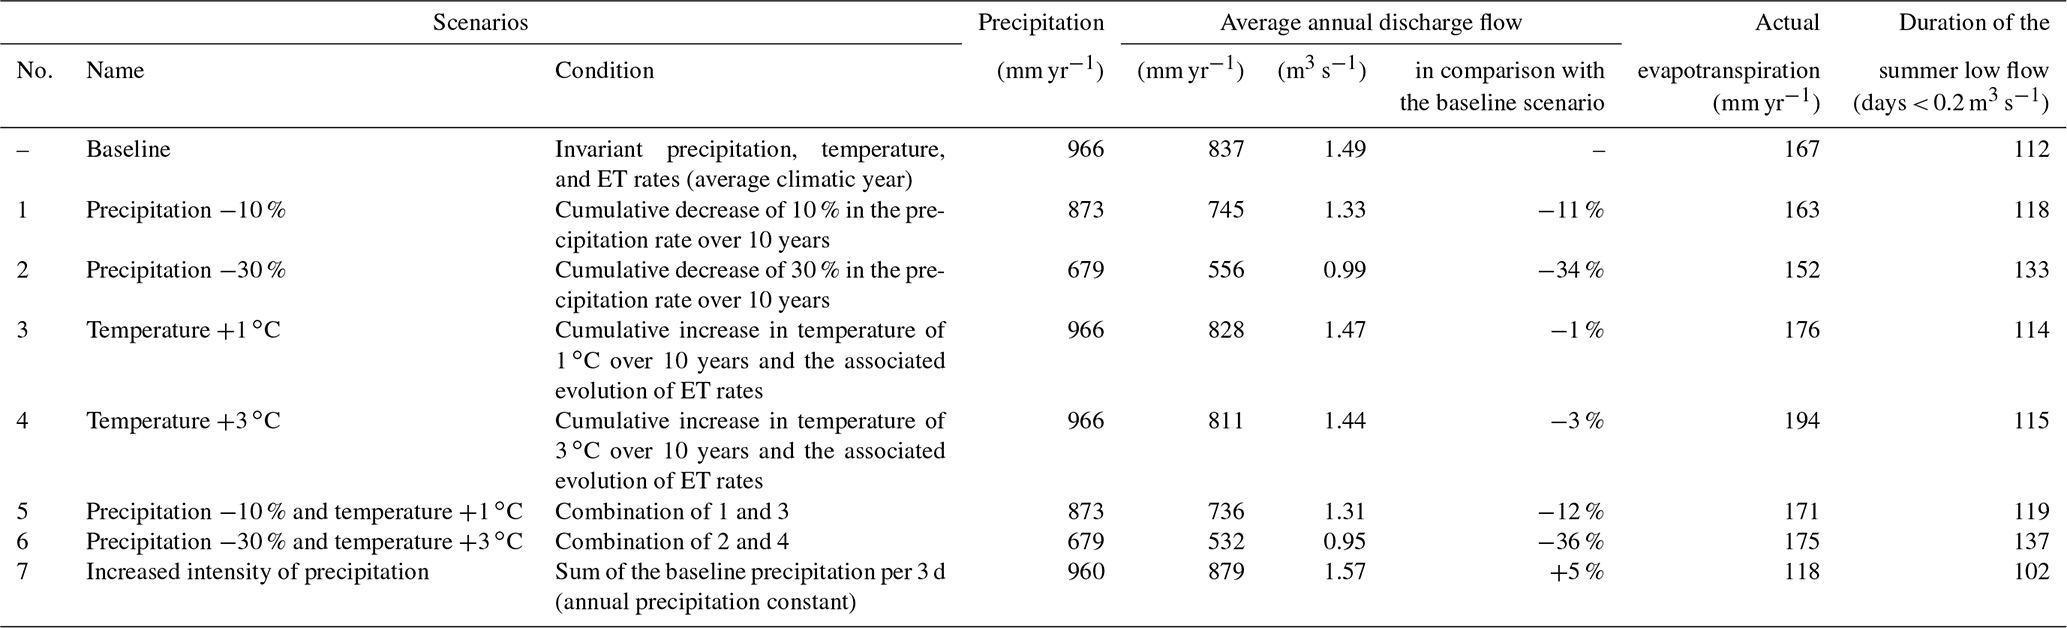
Scenarios 1 and 2, with less precipitation, lead to notably lower annual discharge flows than the baseline scenario (11 to 34 % lower; Fig. 9 and Table 2). The reductions in spring discharge for the warming scenarios (scenarios 3 and 4) are not pronounced (not represented on Fig. 9). However, combining warmer temperatures with a reduction in precipitation (scenarios 5 and 7) leads to a stronger reduction in spring flow rates (12 % to 36 % lower than for the baseline; Fig. 9 and Table 2). The scenario with intensified precipitation events (scenario 7) produces higher peak flows than the baseline scenario.
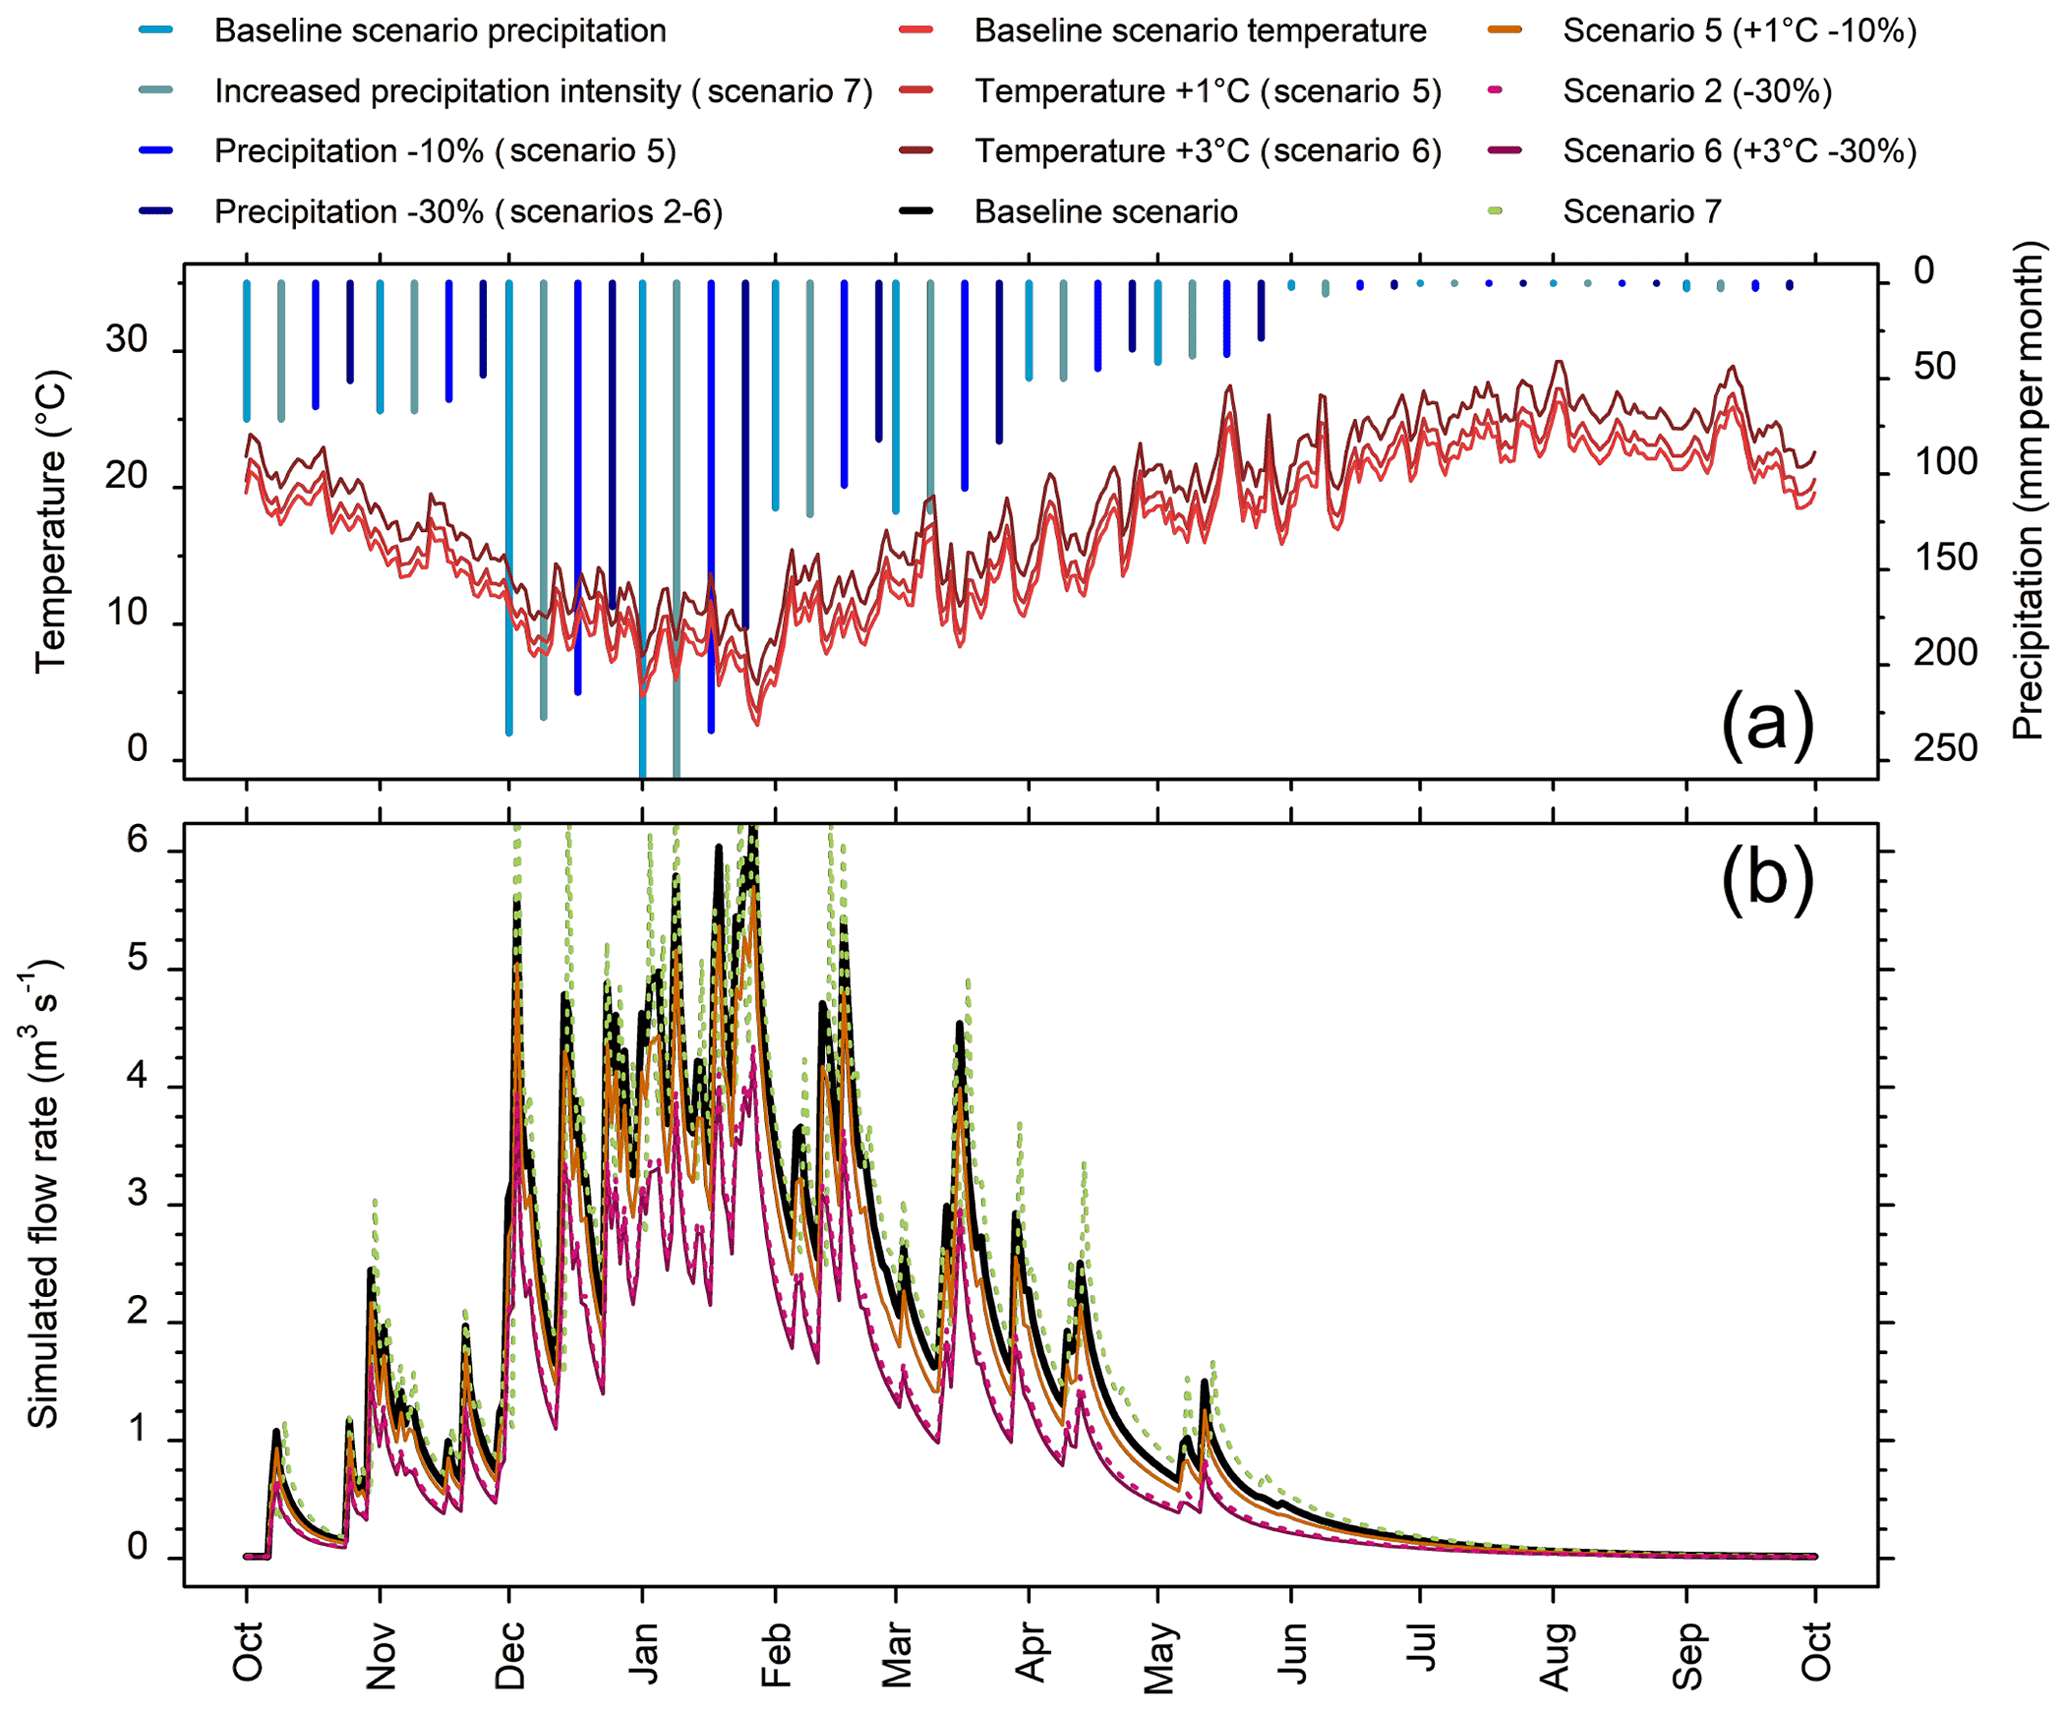
Figure 9Precipitation and temperature scenarios (a) and simulated flow rates (scenarios 1, 2, 5, 6, 7, and the baseline scenario) for the spring for the 10th hydrological year of the 2020–2030 period (b).
Although the duration of summer low flows (i.e., the number of days where discharge is lower than 0.2 m3 s−1) increases in accordance with reductions in precipitation and rising temperatures, only scenarios 2 and 6, corresponding to a 30 % reduction in precipitation, led to a notable increase in the summer low-flow duration (by more than a week per year; Table 2). Scenario 7, with intensified precipitation events, led to a shorter duration of summer low flows than for the baseline scenario, as well as to a slightly higher mean annual flow rate.
5.1 Dynamic functioning of the spring: a comparative approach
Many authors have linked spring discharge from a karstic aquifer to the functioning and geometry of the system (e.g., Fiorillo, 2014) using various methods of spring recession analysis. In this study, the flow rate return probability provided qualitative information regarding the system functioning. This method shows that this karst system stores large volumes of water during high-flow periods and releases water during the low-flow periods. This has been further investigated and confirmed via the decomposition of the spring hydrograph and the recession analyses that allowed fast and delayed infiltration components to be identified. The latter was also observed in the autocorrelation and cross-correlation functions, with a slow decrease in the correlations over time and a short delay between the input and output signals (i.e., cross-correlation peak).
These results provide a conceptual representation of the transfer function (Bailly-Comte et al., 2008; Marsaud, 1997). The classification of the spring hydrograph recessions into three categories (Fig. 4b) is interpreted as corresponding to three major reservoirs representing different hydraulic conductivity zones (Fiorillo, 2011; Kovács et al., 2005) or two different hydraulic stages of the system (Fiorillo, 2014), including a transient stage as previously modeled by Kovács and Perrochet (2008) for synthetic karst spring hydrographs. After a rainfall event, a first reservoir or zone with high hydraulic conductivity evacuates water rapidly and produces high flow rates at the Qachqouch Spring via a well-developed karstic drainage network (peak of the cross-correlation rainfall–spring discharge; Fig. 7b). Then, depending on the season, a second reservoir or zone with lower hydraulic conductivity contributes to an intermediate depletion rate. Independently of the flow periods, the slowest transfer function continuously feeds the spring base flow, an influx of water that is associated with a third reservoir or zone, with the lowest hydraulic conductivity. As a result, these depletion coefficients are useful to describe the spring discharge and can be used as calibration parameters to which the model output is highly sensitive.
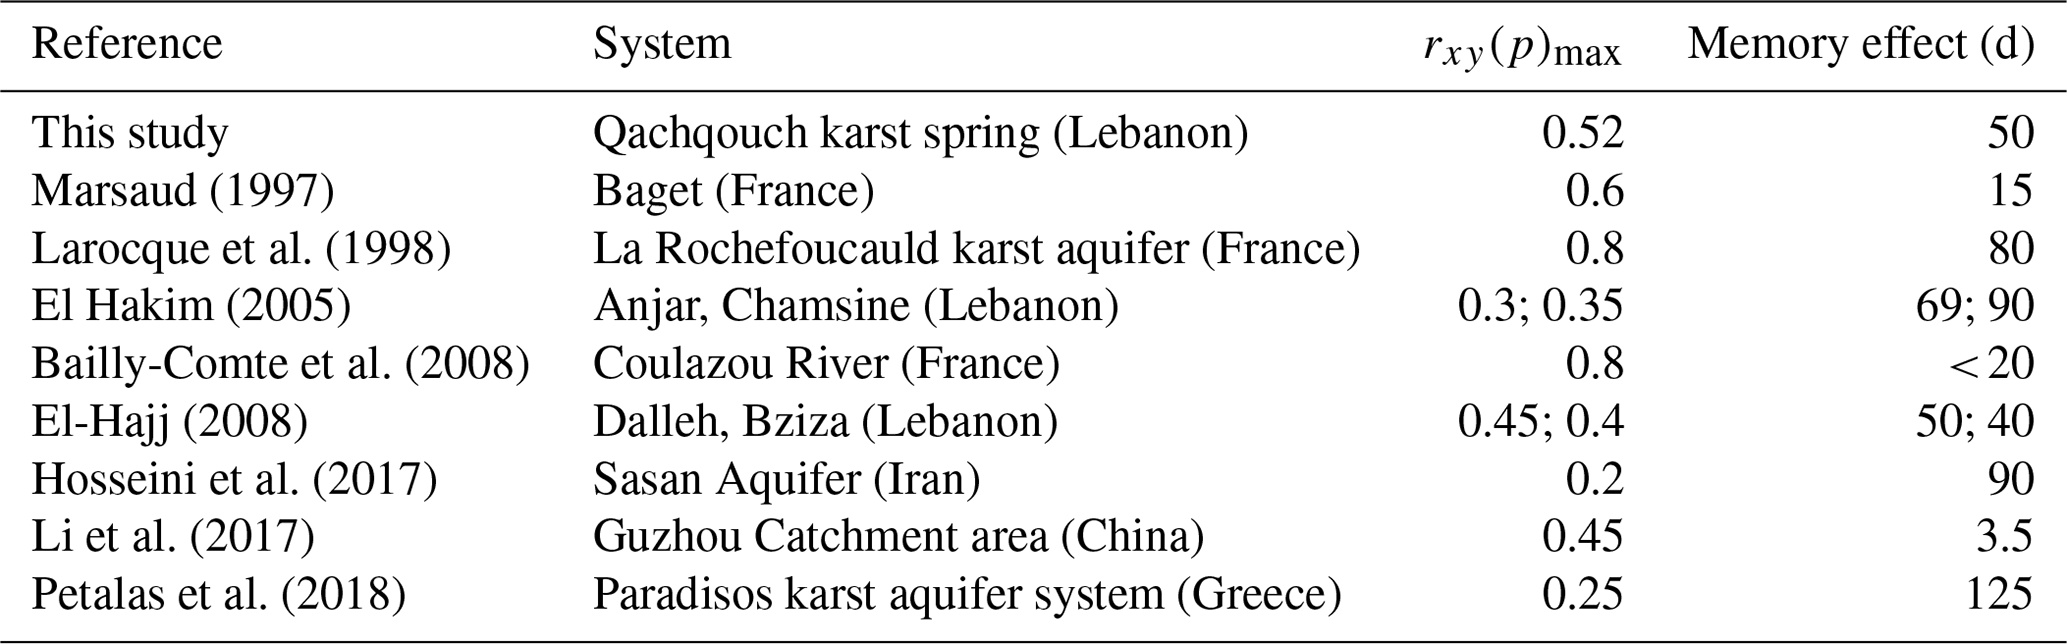
Even though the Qachqouch karst system has been reported to be less complex than that of the neighboring Jeita Spring (Doummar, 2012; Margane et al., 2018), it is still comparable to other Middle Eastern karst systems (Fig. 5). The parameters k and i, representing the extent of the phreatic zone, the regulating capacity of the system, and the type of infiltration (Bakalowicz et al., 2008; El-Hakim and Bakalowicz, 2007; Mangin, 1975), classify the Qachqouch Spring close to other Lebanese karstic aquifers. In this region, karst aquifers are characterized by their relatively thick unsaturated zone and saturated aquifer (with the sum of the respective thicknesses being greater than 1000 m), leading to a high regulating capacity with a complex drainage structure (El Hakim, 2005; El-Hakim and Bakalowicz, 2007; El-Hajj, 2008; Hosseini et al., 2017; Petalas et al., 2018; Schmidt et al., 2014). The high regulation of the spring discharge transforms the input (mostly rainfall with occasional snowmelt) into annual to multiyear cycles and, therefore, constrains the cross-correlation function between low values compared with other systems or similar values for systems in similar hydrogeological context (Table 3). This can be explained by the duality of the stable low flow during the dry season (resulting from the redistribution of rainfall events to sustain continuous flow) and the flood flow following precipitation events (high flow rates during the wet season).
Table 3Maximum cross correlation, rxy(p)max, values between the input and output signals as well as the memory effects of karstic systems reported in the literature.
5.2 Conceptual model of the Qachqouch system
Although the model adequately reproduces flow discharge, it underestimates the summer low flows. Measurements recorded during flooding of the spring gauging station might be underestimated due to errors in the discharge water level rating curve for high flow rates. Another explanation could be that the fast flow linked to a highly developed drainage system is oversimplified in this reservoir model. The thickness of the UZ, combined with its lithological heterogeneity, may contribute to the relatively stable summer low flow by allowing considerable water storage. In fact, the dolostone could be compared to low-permeability porous media drained by a high-permeability system, allowing for a large storage capacity in the upper parts of the aquifer. Furthermore, the high degree of karstification of the area, resulting from both the eustatic variations (Messinian) and the Quaternary glaciations, leads to a complex drainage system, with a probable paleo-network under the current base level. This would enhance the storage capacity of the system, as well as inducing rapid flow rate increases (Bakalowicz, 2015; Nehme et al., 2016).
Based on water chemistry and stable isotopes, a link between the intermittent Nahr el-Kalb River and the Qachqouch system has been demonstrated (Doummar and Aoun, 2018a, b); however, it is not taken into account in this study. If the simulated flow rates at the outlet are well represented, the link between the river and the aquifer is indirectly represented in the model, as the river could be considered to be an indirect source to the karst system, which depends on the same input as the model (precipitation). The river–aquifer link is probably a determining factor with respect to transport through the system.
5.3 Dynamic functioning and spring responses to potential future climatic variations
According to the simulated climate change scenarios, the climate context (semiarid) and, similarly to previous studies (Chen et al., 2018; Hartmann et al., 2012; 2015, 2017), a decrease in annual rainfall (−10 % to −30 %) could lead to lower discharge at the outlet, especially if combined with an increase in temperature (a 36 % reduction in discharged volume), meaning that total precipitation drives spring discharge. The depletion time of the karst aquifer is expected to decrease, leading to summer water shortages (flow rates of less than 0.2 m3 s−1 during the dry season) occurring earlier in the season and lasting for longer periods of time (up to more than 25 d annually). Given the uncertainty on summer low flows (simulated past flow rates lower than 0.1 m3 s−1 for the summer period, which are lower than any observed data at the outlet), the prediction of whether or not the spring would be dry for a period of time could not be ascertained with this model.
Although increasing temperatures lead to higher AET rates (Table 2), variations in temperature do not seem to significantly impact the modeled results, unlike the results for some of the springs studied in Chen et al. (2018). This can be explained by the fact that the AET rates are already close to zero during the dry season (no rain between May and early November). It is also coherent with the fact that spring flow is not substantially affected by snow melt, as catchment delineation and stable isotope data have shown (Doummar and Aoun, 2018b), unlike other major neighboring springs (Doummar et al., 2018).
The delay in the recession period and the fewer water shortage days simulated under the intensified precipitation scenario (scenario 7) are due to the distribution of more intense precipitation events at a daily time step; this leaves the simulated soil reservoir frequently dry, even during the wet season and, therefore, restricts the soil water consumption for the AET. During wet days, the AET meets the PET and the remaining water mainly goes to recharge the system. Overall, as the AET slightly decreases, recharge to the system slightly increases. It is important to emphasize that the model response to a high-intensity precipitation event would most likely change if simulations were run at an hourly time step. This is especially important when considering exceptionally intense precipitation events that cause flooding at the spring, such as the 42.5 mm recorded in 1 h on 30 October 2017, which was followed by an unusual flood at the spring for this time of the year. More work is required to include climate change scenarios with a focus on changes in rainfall distribution patterns and, especially, to include higher rainfall intensities during the flood season and less annual rainfall. However, the potential effect of rainfall intensification could be balanced out or exacerbated by the long-term evolution in catchment land use (e.g., the effects of vegetation cover drying earlier in the season, reforestation programs, and intensive landscaping). Climate change scenarios at the catchment scale should be coupled with land use evolution scenarios in the model to better understand the future functioning of the karst system.
This work aimed at acquiring new knowledge of the hydrodynamic functioning of a complex karst aquifer derived from statistical and time series correlation analyses to optimize the calibration of a semi-distributed lumped model. The model developed for the Qachqouch karst spring in Lebanon (semiarid climate) was used to assess the impact of climate change on the spring hydrodynamics to provide insight into fresh water availability. Flow rates were analyzed statistically for a better conceptualization of the system in order to allow the calibration of a semi-distributed linear reservoir model. The model was used to reproduce current conditions and to analyze the impact of dryer and warmer possible future climate conditions on flow rates.
The results show that the system has a significant storage capacity, enabling water flow to be sustained throughout the year. Although the karst aquifer has this interannual regulatory capacity, similar to that of other Middle Eastern karst systems, it also has a substantial fast-flow component due to its favorable geological context for karstification. The combination of these conditions explains the high contrast between the high flow rates observed during the wet season (higher than 10 m3 s−1) and depletion (reaching 0.20 m3 s−1) during dry months.
Data analyses allowed a conceptual model to be developed via the decomposition of the time series into three reservoirs, which helped to calibrate the model. This comprehensive approach permitted the regular spring recession rates and duration as well as the input and output correlation to be satisfactorily reproduced, even for a year with exceptional precipitation rates and even though the model had been calibrated on a short period (3 hydrological years). Based on this model, the simulation of future climate conditions has shown that the spring flow rates are mainly sensitive to rainfall (with a nonlinear response), with 36 % losses in spring flows after 10 years of a 30 % reduction in rainfall and summer low-flow periods that could be extended by 1 month. The low sensitivity to increased temperatures is an indication that the Qachqouch Spring may be more resilient to warmer conditions than it is to dryer conditions. The impact of intensified precipitation events remains uncertain. The climate change simulations provided insight into possible future spring flow conditions and will allow for the development of more accurate scenarios for long-term fresh water management. The next steps of management plans should entail local coupling of climate change scenarios (at the catchment scale) with land use evolution scenarios to improve overall future predictions, as the latter were not considered here, or the investigation of solutions to alleviate the expected future depletion of semiarid karst aquifer systems.
This work shows that calibrating a model based on time series analyses and decomposition of the spring hydrograph is an efficient methodology to enhance the quality of simulations for complex highly karstified and poorly investigated systems. This approach could be applied to other karstic systems to simulate current or future flows and is a compromise between characterization efforts and simulation results when climate change impacts have not yet been assessed.
The time series used in this study can be requested from the corresponding author.
All authors contributed to developing the approach and writing the paper. Simulations were performed by JD, and figure preparation was undertaken by ED. Based on JD's funding acquisition, data were collected by JD's team, which included ED at the time. SP and ML took on the publication fees.
The authors declare that they have no conflict of interest.
This article is part of the special issue “Changes in the Mediterranean hydrology: observation and modeling”. It is not associated with a conference.
The authors would like to thank Fouad Andari and Michel Aoun for their help during fieldwork. Roland Abourahal is thanked for providing space for the meteorological station and for facilitating local contacts. The kind support of engineer George El Kadi, Antoine Zoghbi, and the Beirut and Mount Lebanon Water Establishment is highly appreciated.
This work was funded by Joanna Doummar's USAID PEER Science project (award no. 102881; Cycle 3), and the publication fees were covered by HydroScience Montpellier and a NSERC Discovery Grant (grant no. RGPIN-2015-06744) to Marie Larocque at Université du Québec à Montréal.
This paper was edited by Lionel Jarlan and reviewed by Nico Goldscheider and one anonymous referee.
Adinehvand, R., Raeisi, E., and Hartmann, A.: A step-wise semi-distributed simulation approach to characterize a karst aquifer and to support dam construction in a data-scarce environment, J. Hydrol., 554, 470–481, https://doi.org/10.1016/j.jhydrol.2017.08.056, 2017.
Bailly-Comte, V., Jourde, H., and Pistre, S.: Transfer functions in a karst watershed using correlation and spectral analyses. Case of the Coulazou watershed, Aumelas-Thau karst system, South of France, Montpellier, p. 13, 2008.
Bailly-Comte, V., Martin, J. B., Jourde, H., Screaton, E. J., Pistre, S., and Langston, A.: Water exchange and pressure transfer between conduits and matrix and their influence on hydrodynamics of two karst aquifers with sinking streams, J. Hydrol., 386, 55–66, https://doi.org/10.1016/j.jhydrol.2010.03.005, 2010.
Bailly-Comte, V., Borrell-Estupina, V., Jourde, H., and Pistre, S.: A conceptual semidistributed model of the Coulazou River as a tool for assessing surface water–karst groundwater interactions during flood in Mediterranean ephemeral rivers, Water Resour. Res., 48, W09534, https://doi.org/10.1029/2010WR010072, 2012.
Bakalowicz, M.: Karst groundwater: a challenge for new resources, Hydrogeol. J., 13, 148–160, https://doi.org/10.1007/s10040-004-0402-9, 2005.
Bakalowicz, M.: Karst and karst groundwater resources in the Mediterranean, Environ. Earth Sci., 74, 5–14, https://doi.org/10.1007/s12665-015-4239-4, 2015.
Bakalowicz, M., Hakim, M. E., and El-Hajj, A.: Karst groundwater resources in the countries of eastern Mediterranean: the example of Lebanon, Environ. Geol., 54, 597–604, https://doi.org/10.1007/s00254-007-0854-z, 2008.
Chen, Z. and Goldscheider, N.: Modeling spatially and temporally varied hydraulic behavior of a folded karst system with dominant conduit drainage at catchment scale, Hochifen–Gottesacker, Alps, J. Hydrol., 514, 41–52, https://doi.org/10.1016/j.jhydrol.2014.04.005, 2014.
Chen, Z., Auler, A. S., Bakalowicz, M., Drew, D., Griger, F., Hartmann, J., Jiang, G., Moosdorf, N., Richts, A., Stevanovic, Z., Veni, G., and Goldscheider, N.: The World Karst Aquifer Mapping project: concept, mapping procedure and map of Europe, Hydrogeol. J., 25, 771–785, https://doi.org/10.1007/s10040-016-1519-3, 2017a.
Chen, Z., Goldscheider, N., Auler, A., Bakalowicz, M., Broda, S., Drew, D., Hartmann, J., Jiang, G., Moosdorf, N., Richts, A., Stevanovic, Z., Veni, G., Dumont, A., Aureli, A., Clos, P., and Krombholz, M.: World Karst Aquifer Map (WHYMAP WOKAM), BGR, IAH, KIT, UNESCO, https://doi.org/10.25928/b2.21_sfkq-r406, 2017b.
Chen, Z., Hartmann, A., Wagener, T., and Goldscheider, N.: Dynamics of water fluxes and storages in an Alpine karst catchment under current and potential future climate conditions, Hydrol. Earth Syst. Sci., 22, 3807–3823, https://doi.org/10.5194/hess-22-3807-2018, 2018.
Collins, M., Knutti, R., Arblaster, J., Dufresne, J.-L., Fichefet, T., Friedlingstein, P., Gao, X., Gutowski, W. J., Johns, T., Krinner, G., Shongwe, M., Tebaldi, C., Weaver, A. J., and Wehner, M.: Long-term Climate Change: Projections, Commitments and Irreversibility, in: Climate Change 2013: The Physical Science Basis. Contribution of Working Group I to the Fifth Assessment Report of the Intergovernmental Panel on Climate Change, edited by: Stocker, T. F., Qin, D., Plattner, G.-K., Tignor, M., Allen, S. K., Boschung, J., Nauels, A., Xia, Y., Bex, V., and Midgley, P. M., Cambridge University Press, Cambridge, United Kingdom and New York, NY, USA, 1029–1136, 2013.
DHI: MIKE SHE user manual, volume 1: User Guide, User manual guide, 358 pp., 2016a.
DHI: MIKE SHE user manual, volume 2: Reference Guide, User manual guide, 408 pp., 2016b.
Dörfliger, N., Crochet, Ph., Guerrin, R., Jozja, N., Marsaud, B., Mondain, P. H., Muet, P., and Plagnes, V.: Guide méthodologique – Les outils de l'hydrogéologie karstique pour la caractérisation de la structure et du fonctionnement des systèmes karstiques et l'évaluation de leur ressource, BRGM, Orléans, France, 2010.
Doummar, J.: Identification of indicator parameters for the quantitative assessment of vulnerability in karst aquifers, PhD thesis, Georg-August-Universität zu Göttingen, Göttingen, Germany, 2012.
Doummar, J. and Aoun, M.: Assessment of the origin and transport of four selected emerging micropollutants sucralose, Acesulfame-K, gemfibrozil, and iohexol in a karst spring during a multi-event spring response, J. Contam. Hydrol., 215, 11–20, https://doi.org/10.1016/j.jconhyd.2018.06.003, 2018a.
Doummar, J. and Aoun, M.: Occurrence of selected domestic and hospital emerging micropollutants on a rural surface water basin linked to a groundwater karst catchment, Environ. Earth Sci., 77, 351, https://doi.org/10.1007/s12665-018-7536-x, 2018b.
Doummar, J., Sauter, M., and Geyer, T.: Simulation of flow processes in a large scale karst system with an integrated catchment model (Mike She) – Identification of relevant parameters influencing spring discharge, J. Hydrol., 426–427, 112–123, https://doi.org/10.1016/j.jhydrol.2012.01.021, 2012.
Doummar, J., Hassan Kassem, A., and Gurdak, J. J.: Impact of historic and future climate on spring recharge and discharge based on an integrated numerical modelling approach: Application on a snow-governed semi-arid karst catchment area, J. Hydrol., 565, 636–649, https://doi.org/10.1016/j.jhydrol.2018.08.062, 2018.
Dubois, E.: Analysis of high resolution spring hydrographs and climatic data: application on the Qachqouch spring (Lebanon), Master thesis, American University of Beirut, Department of Geology, Beirut, Lebanon, available at: https://www.researchgate.net/profile/Emmanuel_Dubois5 (last access: December 2019), 2017.
Dufresne, J.-L., Foujols, M.-A., Denvil, S., Caubel, A., Marti, O., Aumont, O., Balkanski, Y., Bekki, S., Bellenger, H., Benshila, R., Bony, S., Bopp, L., Braconnot, P., Brockmann, P., Cadule, P., Cheruy, F., Codron, F., Cozic, A., Cugnet, D., Noblet, N. de, Duvel, J.-P., Ethé, C., Fairhead, L., Fichefet, T., Flavoni, S., Friedlingstein, P., Grandpeix, J.-Y., Guez, L., Guilyardi, E., Hauglustaine, D., Hourdin, F., Idelkadi, A., Ghattas, J., Joussaume, S., Kageyama, M., Krinner, G., Labetoulle, S., Lahellec, A., Lefebvre, M.-P., Lefevre, F., Levy, C., Li, Z. X., Lloyd, J., Lott, F., Madec, G., Mancip, M., Marchand, M., Masson, S., Meurdesoif, Y., Mignot, J., Musat, I., Parouty, S., Polcher, J., Rio, C., Schulz, M., Swingedouw, D., Szopa, S., Talandier, C., Terray, P., Viovy, N., and Vuichard, N.: Climate change projections using the IPSL-CM5 Earth System Model: from CMIP3 to CMIP5, Clim. Dynam., 40, 2123–2165, https://doi.org/10.1007/s00382-012-1636-1, 2013.
El-Hajj, A.: L'aquifère carbonate karstique de Chekka (Liban) et ses exutoires sous-marins. Caractéristiques hydrogéologiques et fonctionnement, PhD thesis, Université Saint-Joseph à Beyrouth, Université Montpellier II, Montpellier, France, 2008.
El Hakim, M.: Les aquifères karstiques de l'anti-Liban et du nord de la plaine de la Bekaa caractéristiques, fonctionnement, évolution et modélisation, d'après l'exemple du système karstique Anjar-Chamsine (Liban), PhD thesis, Université Saint-Joseph à Beyrouth, Université Montpellier II, Montpellier, France, 2005.
El-Hakim, M. and Bakalowicz, M.: Significance and origin of very large regulating power of some karst aquifers in the Middle East. Implication on karst aquifer classification, J. Hydrol., 333, 329–339, https://doi.org/10.1016/j.jhydrol.2006.09.003, 2007.
Enemark, T., Peeters, L. J. M., Mallants, D., and Batelaan, O.: Hydrogeological conceptual model building and testing: A review, J. Hydrol., 569, 310–329, https://doi.org/10.1016/j.jhydrol.2018.12.007, 2019.
Fiorillo, F.: Tank-reservoir drainage as a simulation of the recession limb of karst spring hydrographs, Hydrogeol. J., 19, 1009–1019, https://doi.org/10.1007/s10040-011-0737-y, 2011.
Fiorillo, F.: The Recession of Spring Hydrographs, Focused on Karst Aquifers, Water Resour. Manage., 28, 1781–1805, https://doi.org/10.1007/s11269-014-0597-z, 2014.
Fleury, P., Ladouche, B., Conroux, Y., Jourde, H., and Dörfliger, N.: Modelling the hydrologic functions of a karst aquifer under active water management – The Lez spring, J. Hydrol., 365, 235–243, https://doi.org/10.1016/j.jhydrol.2008.11.037, 2009.
Food and Agriculture Organization of the United Nations (FAO): chap. 2 – FAO Penman-Monteith equation, in Crop evapotranspiration. Guidelines for computing crop water requirements, FAO – Food and Agriculture Organization of the United Nations, Rome, Italy, 1998.
Ford, D. and Williams, P. W.: Karst hydrogeology and geomorphology, John Wiley & Sons, Chichester, England, 2007.
Forkasiewicz, M. J. and Paloc, H.: Régime de tarissement de la foux-de-la-vis (Gard) étude préliminaire, Houille Blanche, 1, 29–36, https://doi.org/10.1051/lhb/1967002, 1967.
Ghasemizadeh, R., Hellweger, F., Butscher, C., Padilla, I., Vesper, D., Field, M., and Alshawabkeh, A.: Review: Groundwater flow and transport modeling of karst aquifers, with particular reference to the North Coast Limestone aquifer system of Puerto Rico, Hydrogeol. J., 20, 1441–1461, https://doi.org/10.1007/s10040-012-0897-4, 2012.
Giorgi, F. and Lionello, P.: Climate change projections for the Mediterranean region, Global Planet. Change, 63, 90–104, https://doi.org/10.1016/j.gloplacha.2007.09.005, 2008.
Hahne, K.: Geological Map, Tectonics and Karstification in the Groundwater Contribution Zone of Jeita Spring supported by Remote Sensing – Technical Report No. 4 of Technical Cooperation Project “Protection of Jeita Spring,” Council for Development and Reconstruction (CDR), Lebanon and Federal Institute for Geosciences and Natural Resources (BGR), Germany, Hannover, 2011.
Hartmann, A., Lange, J., Vivó Aguado, À., Mizyed, N., Smiatek, G., and Kunstmann, H.: A multi-model approach for improved simulations of future water availability at a large Eastern Mediterranean karst spring, J. Hydrol., 468–469, 130–138, https://doi.org/10.1016/j.jhydrol.2012.08.024, 2012.
Hartmann, A., Wagener, T., Rimmer, A., Lange, J., Brielmann, H., and Weiler, M.: Testing the realism of model structures to identify karst system processes using water quality and quantity signatures, Water Resour. Res., 49, 3345–3358, https://doi.org/10.1002/wrcr.20229, 2013.
Hartmann, A., Goldscheider, N., Wagener, T., Lange, J., and Weiler, M.: Karst water resources in a changing world: Review of hydrological modeling approaches, Rev. Geophys., 52, 218–242, https://doi.org/10.1002/2013RG000443, 2014.
Hartmann, A., Gleeson, T., Rosolem, R., Pianosi, F., Wada, Y., and Wagener, T.: A large-scale simulation model to assess karstic groundwater recharge over Europe and the Mediterranean, Geosci. Model Dev., 8, 1729–1746, https://doi.org/10.5194/gmd-8-1729-2015, 2015.
Hartmann, A., Gleeson, T., Wada, Y., and Wagener, T.: Enhanced groundwater recharge rates and altered recharge sensitivity to climate variability through subsurface heterogeneity, P. Natl. Acad. Sci. USA, 114, 2842–2847, https://doi.org/10.1073/pnas.1614941114, 2017.
Hosseini, S. M., Ataie-Ashtiani, B., and Simmons, C. T.: Spring hydrograph simulation of karstic aquifers: Impacts of variable recharge area, intermediate storage and memory effects, J. Hydrol., 552, 225–240, https://doi.org/10.1016/j.jhydrol.2017.06.018, 2017.
IPPC: Climate Change 2014: Synthesis Report. Contribution of Working Groups I, II and III to the Fifth Assessment Report of the Intergovernmental Panel on Climate Change, Intergovernmetal Panel on Climate Change, Geneva, Switzerland, 2014.
Iván, V. and Mádl-Szőnyi, J.: State of the art of karst vulnerability assessment: overview, evaluation and outlook, Environ. Earth Sci., 76, 76–112, https://doi.org/10.1007/s12665-017-6422-2, 2017.
Jeannin, P.-Y. and Sauter, M.: Analysis of karst hydrodynamic behaviour using global approaches: a review, Bulletin d'Hydrogéologie, 16, 31–48, 1998.
Kirtman, B., Power, S. B., Adedoyin, J. A., Boer, G. J., Bojariu, R., Camilloni, I., Doblas-Reyes, F. J., Fiore, A. M., Kimoto, M., Meehl, G. A., Prather, M., Sarr, A., Schär, C., Sutton, R., van Oldenborgh, G. J., Vecchi, G., and Wang, H. J.: Near-term Climate Change: Projections and Predictability, in: Climate Change 2013: The Physical Science Basis. Contribution of Working Group I to the Fifth Assessment Report of the Intergovernmental Panel on Climate Change, edited by: Stocker, T. F., Qin, D., Plattner, G.-K., Tignor, M., Allen, S. K., Boschung, J., Nauels, A., Xia, Y., Bex, V., and Midgley, P. M., Cambridge University Press, Cambridge, United Kingdom and New York, NY, USA, 953–1028, 2013.
Kong-A-Siou, L., Cros, K., Johannet, A., Borrell-Estupina, V., and Pistre, S.: KnoX method, or Knowledge eXtraction from neural network model. Case study on the Lez karst aquifer (southern France), J. Hydrol., 507, 19–32, https://doi.org/10.1016/j.jhydrol.2013.10.011, 2013.
Kovács, A. and Perrochet, P.: A quantitative approach to spring hydrograph decomposition, J. Hydrol., 352, 16–29, https://doi.org/10.1016/j.jhydrol.2007.12.009, 2008.
Kovács, A., Perrochet, P., Király, L., and Jeannin, P.-Y.: A quantitative method for the characterisation of karst aquifers based on spring hydrograph analysis, J. Hydrol., 303, 152–164, https://doi.org/10.1016/j.jhydrol.2004.08.023, 2005.
Kristensen, K. J. and Jensen, S. E.: A Model for Estimating Actual Evapotranspiration from Potential Evapotranspiration, Hydrol. Res., 6, 170–188, 1975.
Larocque, M., Mangin, A., Razack, M., and Banton, O.: Contribution of correlation and spectral analyses to the regional study of a large karst aquifer (Charente, France), J. Hydrol., 205, 217–231, https://doi.org/10.1016/S0022-1694(97)00155-8, 1998.
Larocque, M., Banton, O., and Razack, M.: Transient-State History Matching of a Karst Aquifer Ground Water Flow Model, Groundwater, 38, 939–946, https://doi.org/10.1111/j.1745-6584.2000.tb00694.x, 2000.
Leduc, C., Pulido-Bosch, A., and Remini, B.: Anthropization of groundwater resources in the Mediterranean region: processes and challenges, Hydrogeol. J., 25, 1529–1547, https://doi.org/10.1007/s10040-017-1572-6, 2017.
Li, G., Goldscheider, N., and Field, M. S.: Modeling karst spring hydrograph recession based on head drop at sinkholes, J. Hydrol., 542, 820–827, https://doi.org/10.1016/j.jhydrol.2016.09.052, 2016.
Li, Z., Xu, X., Liu, M., Li, X., Zhang, R., Wang, K., and Xu, C.: State-space prediction of spring discharge in a karst catchment in southwest China, J. Hydrol., 549, 264–276, https://doi.org/10.1016/j.jhydrol.2017.04.001, 2017.
Mangin, A.: Etude des débits classés d'exutoires karstiques portant sur un cycle hydrologique, Année Spéléologique, 2, 283–329, 1971.
Mangin, A.: Contribution à l`étude hydrodynamique des aquifères karstiques, PhD thesis, Université de Dijon, Dijon, France, 1975.
Mangin, A.: Pour une meilleure connaissance des systèmes hydrologiques à partir des analyses corrélatoire et spectrale, J. Hydrol., 67, 25–43, https://doi.org/10.1016/0022-1694(84)90230-0, 1984.
Margane, A. and Stoeckl, L.: Monitoring of Spring Discharge and Surface Water Runoff in the Groundwater Contribution Zone of Jeita Spring – special report no. 8 of technical cooperation project “Protection of Jeita Spring,” Council for Development and Reconstruction (CDR), Lebanon and Federal Institute for Geosciences and Natural Resources (BGR), Germany, Raifoun, Germany, 2013.
Margane, A., Schuler, P., Koeniger, P., Raad, R., Abi Rizk, J., and Stoeckl, L.: Hydrogeology of the Groundwater Contribution Zone of Jeita Spring – Technical Report No.5 of Technical Cooperation Project “Protection of Jeita Spring,” Council for Development and Reconstruction (CDR), Lebanon and Federal Institute for Geosciences and Natural Resources (BGR), Germany, Raifoun, Germany, 2013.
Margane, A., Makki, I., Raad, R., Schuler, P., Rizik, J. A., Doummar, J., Königer, P., Hahne, K., and Stoeckl, L.: Hydrogeology of the Jeita Groundwater Catchment in Lebanon, Schweizerbart Science Publishers, Stuttgart, Germany, 2018.
Marsaud, B.: Structure et fonctionnement de la zone noyee des karsts a partir des resultats experimentaux, PhD thesis, Université Paris 11, Paris, France, 1997.
Mazzilli, N., Guinot, V., Jourde, H., Lecoq, N., Labat, D., Arfib, B., Baudement, C., Danquigny, C., Dal Soglio, L., and Bertin, D.: KarstMod: A modelling platform for rainfall – discharge analysis and modelling dedicated to karst systems, Environ. Modell. Softw., 122, 103927, https://doi.org/10.1016/j.envsoft.2017.03.015, 2019.
Milano, M., Ruelland, D., Fernandez, S., Dezetter, A., Fabre, J., Servat, E., Fritsch, J.-M., Ardoin-Bardin, S., and Thivet, G.: Current state of Mediterranean water resources and future trends under climatic and anthropogenic changes, Hydrolog. Sci. J., 58, 498–518, https://doi.org/10.1080/02626667.2013.774458, 2013.
Nader, F. H., Swennen, R., Ellam, R. M., and Immenhauser, A.: Field geometry, petrography and geochemistry of a dolomitization front (Late Jurassic, central Lebanon), Sedimentology, 54, 1093–1120, https://doi.org/10.1111/j.1365-3091.2007.00874.x, 2007.
Nehme, C., Jaillet, S., Voisin, C., Hellstrom, J., Gérard-Adjizian, J., and Delannoy, J.-J.: Control of cave levels in Kanaan, Kassarat and Jeita karst systems (Central Mount Lebanon, Lebanon), Z. Geomorphol., 60, 95–117, https://doi.org/10.1127/zfg/2016/0239, 2016.
Petalas, C. P., Akratos, C. S., and Tsihrintzis, V. A.: Hydrogeological Investigation of a Karst Aquifer System, Environ. Process., 5, 155–181, https://doi.org/10.1007/s40710-017-0277-0, 2018.
Sauter, M., Geyer, T., Kovács, A., and Teutsch, G.: Modellierung der Hydraulik von Karstgrundwasserleitern – Eine Übersicht: Herrn Professor Gerhard Einsele zum 80. Geburtstag gewidmet, Grundwasser, 11, 143–156, https://doi.org/10.1007/s00767-006-0140-0, 2006.
Schmidt, S., Geyer, T., Guttman, J., Marei, A., Ries, F., and Sauter, M.: Characterisation and modelling of conduit restricted karst aquifers – Example of the Auja spring, Jordan Valley, J. Hydrol., 511, 750–763, https://doi.org/10.1016/j.jhydrol.2014.02.019, 2014.
Stevanović, Z.: Characterization of Karst Aquifer, in Karst Aquifers—Characterization and Engineering, Springer, Cham, 47–125, 2015.
The requested paper has a corresponding corrigendum published. Please read the corrigendum first before downloading the article.
- Article
(7294 KB) - Full-text XML