the Creative Commons Attribution 4.0 License.
the Creative Commons Attribution 4.0 License.
 | 23 Jul 2020
Using water stable isotopes to understand evaporation, moisture stress, and re-wetting in catchment forest and grassland soils of the summer drought of 2018
Doerthe Tetzlaff
Aaron Smith
Hailong Wang
Chris Soulsby
In drought-sensitive lowland catchments, ecohydrological feedbacks to climatic anomalies can give valuable insights into ecosystem functioning in the context of alarming climate change projections. However, the dynamic influences of vegetation on spatio-temporal processes in water cycling in the critical zone of catchments are not yet fully understood. We used water stable isotopes to investigate the impacts of the 2018 drought on dominant soil–vegetation units of the mixed land use Demnitz Millcreek (DMC, north-eastern Germany) catchment (66 km2). The isotope sampling was carried out in conjunction with hydroclimatic, soil, groundwater, and vegetation monitoring. Drying soils, falling groundwater levels, cessation of streamflow, and reduced crop yields demonstrated the failure of catchment water storage to support “blue” (groundwater recharge and stream discharge) and “green” (evapotranspiration) water fluxes. We further conducted monthly bulk soil water isotope sampling to assess the spatio-temporal dynamics of water soil storage under forest and grassland vegetation. Forest soils were drier than the grassland, mainly due to higher interception and transpiration losses. However, the forest soils also had more freely draining shallow layers and were dominated by rapid young (age <2 months) water fluxes after rainfall events. The grassland soils were more retentive and dominated by older water (age >2 months), though the lack of deep percolation produced water ages >1 year under forest. We found the displacement of any “drought signal” within the soil profile limited to the isotopic signatures and no displacement or “memory effect” in d-excess over the monthly time step, indicating rapid mixing of new rainfall. Our findings suggest that contrasting soil–vegetation communities have distinct impacts on ecohydrological partitioning and water ages in the sub-surface. Such insights will be invaluable for developing sustainable land management strategies appropriate to water availability and building resilience to climate change.
- Article
(2734 KB) - Full-text XML
-
Supplement
(291 KB) - BibTeX
- EndNote


Climate change provides an urgent impetus for an improved understanding of ecohydrological interactions in areas where water is limited (Wang et al., 2012). Increasing temperatures and reduced rainfall in the growing season are affecting extensive regions (Tetzlaff et al., 2013), in some cases causing natural vegetation communities to adapt by changing their composition, distribution, and physiology (Wookey et al., 2009). Where vegetation is managed for forestry and agriculture, land use strategies may need to adapt to build resilience towards newly evolving climate regimes. This includes choice of species, crop rotation cycles, and sustainable production targets (Stoate et al., 2009). As well as constraining biomass productivity, such strategies will also have implications for the residual water available to maintain groundwater recharge, river flows, and associated ecosystem services. In summer 2018, an exceptional drought over much of Europe set new, long-term meteorological records, causing significant loss of agricultural production, water shortages, and low river flows over extensive areas (Imbery et al., 2018). This drought previewed the warmer, drier conditions that climate change is expected to deliver across much of central Europe as the 21st century progresses. For a future where water resources might become less reliable, conceptualisation of the dynamic interactions between vegetation, soils, and water fluxes from stores in various ecosystem compartments needs to be improved and is a major focus of current “critical zone” science (Penna et al., 2018). Understanding local environmental factors, like how atmospheric water demand is modulated by vegetation cover, is a prerequisite to better managing the effects of droughts (Mishra and Singh, 2010). Stable isotopes in the water molecule have been successfully used to trace water fluxes in the soil–plant–atmosphere continuum (Sprenger et al., 2017) and can reveal important process insights into ecosystem water cycling (Dubbert and Werner, 2019). Stable isotopes of hydrogen and oxygen are often seen as ideal tracers as they are an integral part of the water molecule itself. Isotopes are conservative tracers and not altered by chemical reactions, but only by mixing and fractionation. Numerous studies have applied water stable isotopes to constrain water sources and fluxes in the unsaturated zone. Complementary to hydroclimatic monitoring, stable isotopes as environmental tracers can provide insights into ecohydrological processes in the “critical zone” (Grant and Dietrich, 2017). They have been used to investigate evaporation (Allison and Barnes, 1983; Barnes and Allison, 1988), groundwater recharge (Koeniger et al., 2016), weathering influence on flow paths (Bullen and Kendall, 1998), as well as water ages (Tetzlaff et al., 2014; Sprenger et al., 2019b), plant water uptake (Rothfuss and Javaux, 2017), and the partitioning of evapotranspiration (Kool et al., 2014; Xiao et al., 2018). Highly seasonal dynamics of soil water ages and their dependency on soil water storage have further been investigated via water stable isotope modelling (Sprenger et al., 2018). Isotopes were also used to examine the influence of vegetation on soil bulk water (Oerter and Bowen, 2019; Sprenger et al., 2017) or other components like throughfall (Soulsby et al., 2017) often supplemented with xylem water isotope data (Geris et al., 2015; Brooks et al., 2010; Goldsmith et al., 2019). The development of laser-based water stable isotope analysis has enabled higher sampling throughput due to lower costs in comparison to mass spectroscopy. Further, this new technology facilitated an ongoing effort to design new techniques to measure water stable isotopes in the critical zone (Sprenger et al., 2015). However, there are still unresolved problems related to sampling (Sprenger et al., 2015) or extraction (Orlowski et al., 2016, 2018) of water from complex matrices like soil or plant tissue. Laboratory routines for the direct-equilibrium method (Wassenaar et al., 2008) use the state of isotopic equilibrium between liquid and gaseous water in a closed system to determine the isotopic signature of the liquid soil water. They have been adapted and successfully applied in several studies (e.g. Klaus et al., 2013; Sprenger et al., 2017; Stumpp and Hendry, 2012). Ongoing efforts are being made to solve various problems associated with the different methods for soil water isotope analysis, and results have to be interpreted accordingly (Gaj and McDonnell, 2019; Gralher et al., 2018; Sprenger et al., 2015). This study focuses on the Demnitz Millcreek catchment (DMC) long-term monitoring site, a mixed land use catchment located south-east of Berlin in Brandenburg, Germany. As the exceptional drought developed in summer 2018, we monitored moisture dynamics in drying soil profiles under different land cover types, falling groundwater levels, and decreasing streamflows. Crucially, we used stable isotopes from different waters in the latter stages of the drought to address the specific objectives of this study to
-
assess the development and progress of the drought and the subsequent recovery in soil water storage,
-
explore, using bulk soil water isotopes, the evolution of the evaporation signal of the drought and its “memory” effect following infiltration and mixing with new precipitation during re-wetting, and
-
discuss the implications of ecohydrological processes for the response times and recovery of hydrological stores in the DMC by combined use of hydroclimatic and isotope data.
Our study was located in the 66 km2 Demnitz Millcreek catchment (DMC) in Brandenburg, north-eastern Germany (52∘23′ N, 14∘15′ E), 55 km south-east of Berlin. This long-term study site is a tributary of the Spree River and one of the few headwaters in the region that does not originate in a lake but in a network of agricultural drainage channels. Catchment orientation is NNE–SSW with elevation from 38 to 83 m above sea level and a low average slope of less than 2 %.
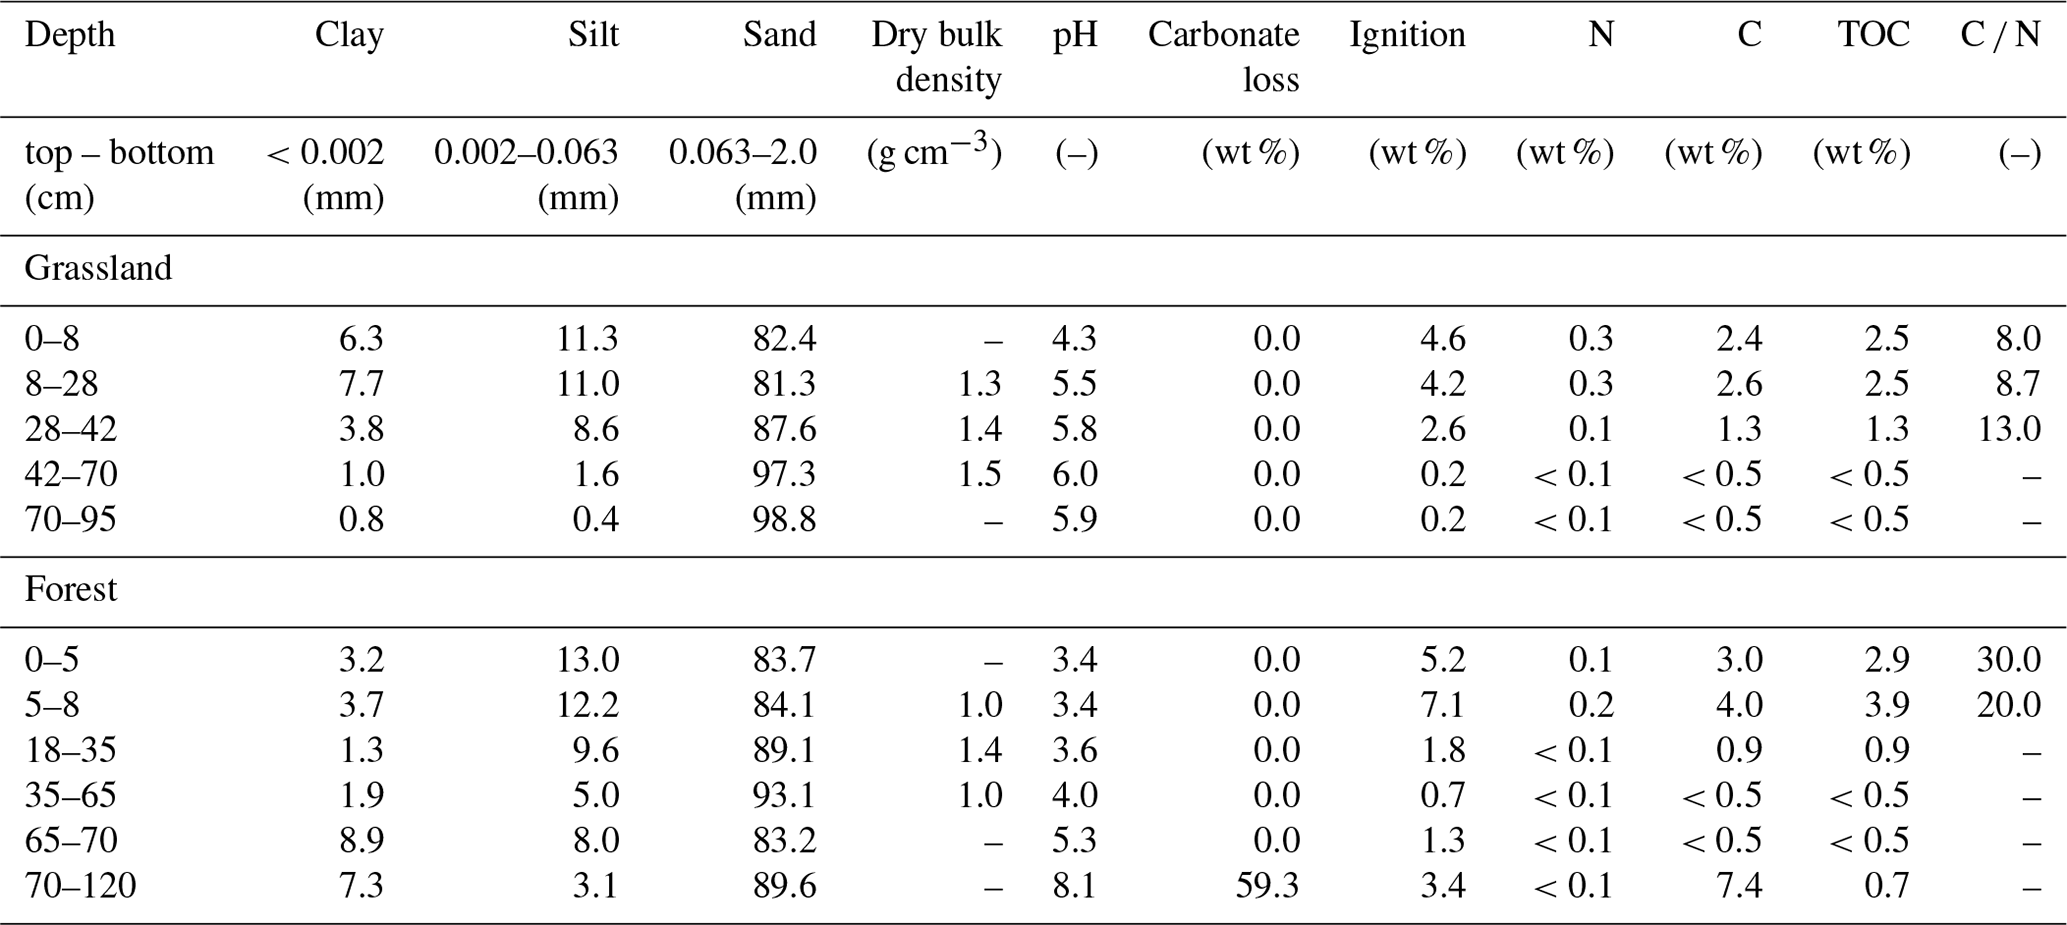
Located in the North European Plain, the geology of the catchment is strongly influenced by the Pleistocene glaciation. The catchment outlet is situated in the Berlin glacio-fluvial valley near Berkenbrück, where the DMC surface runoff drains into a small lake (Dehmsee) and subsequently into the Spree River. The geology of the upper catchment is dominated by unconsolidated sediments of ground moraine material. Important factors for nutrient cycling in this landscape are kettle hole lakes (Nitzsche et al., 2017) and wetlands (Smith et al., 2020a). The stream network is embedded in fluvial and periglacial deposits surrounded by basal tills with intermittent riparian peat fens in valley bottom areas. The northern catchment is mainly characterised by eutric soils and silty brown earth. Next to the stream, sandy Gleysols or peaty Histosols are dominant. DMC has a seasonal and strongly continental climate, with cold winters (mean air temperatures in January and July are 0.2 and 19 ∘C, respectively). Precipitation is dominated by convective summer events and low-intensity winter rain, with generally less than 10 % of the annual total occurring as snowfall. Potential evapotranspiration (PET) commonly exceeds average precipitation, and runoff coefficients are typically <10 % of annual precipitation (Smith et al., 2020a). Non-irrigated arable land (mainly winter cereals, maize) dominates the upper catchment and contributes 58 % of the area. Further downstream, the cover of mixed coniferous and deciduous forests increases. The stream traverses several peat fens that were used as pasture. Man-made connections of disconnected glacial hollows to the stream network increased the total channel length from 20 km in 1780 to 88 km at the present day (Nützmann et al., 2011) to supply mills and gain new arable land by draining. The catchment has been the subject of various studies investigating e.g. CO2 saturation (Gelbrecht et al., 1998), influences of wastewater treatment (Gücker et al., 2014), other historical anthropogenic impacts (Nützmann et al., 2011), and the impact of beaver re-colonisation (Smith et al., 2020a). This study focuses on two plots with contrasting land cover in close spatial proximity to each other (∼400 m) and the stream (Fig. 1). The two experimental plots are forested (FA) and covered by grassland (GS). FA is dominated by mature oak trees (Quercus robur) and includes other tree species such as Scots pine (Pinus sylvestris) and red oak (Quercus rubra). GS is pasture that is harvested once a year. Distance to stream differs between GS (∼15 m) and FA (∼90 m). GS has eutric Arenosol (humic, transportic) soil, whereas the FA soil is a lamellic brunic Arenosol (humic) according to the World Reference Base (WRB) classification. GS is characterised by higher clay contents in the upper soil, a higher pH, and a narrower C ∕ N ratio than FA. There is also a shift in pH at FA due to the presence of calcite at the lowest layer.
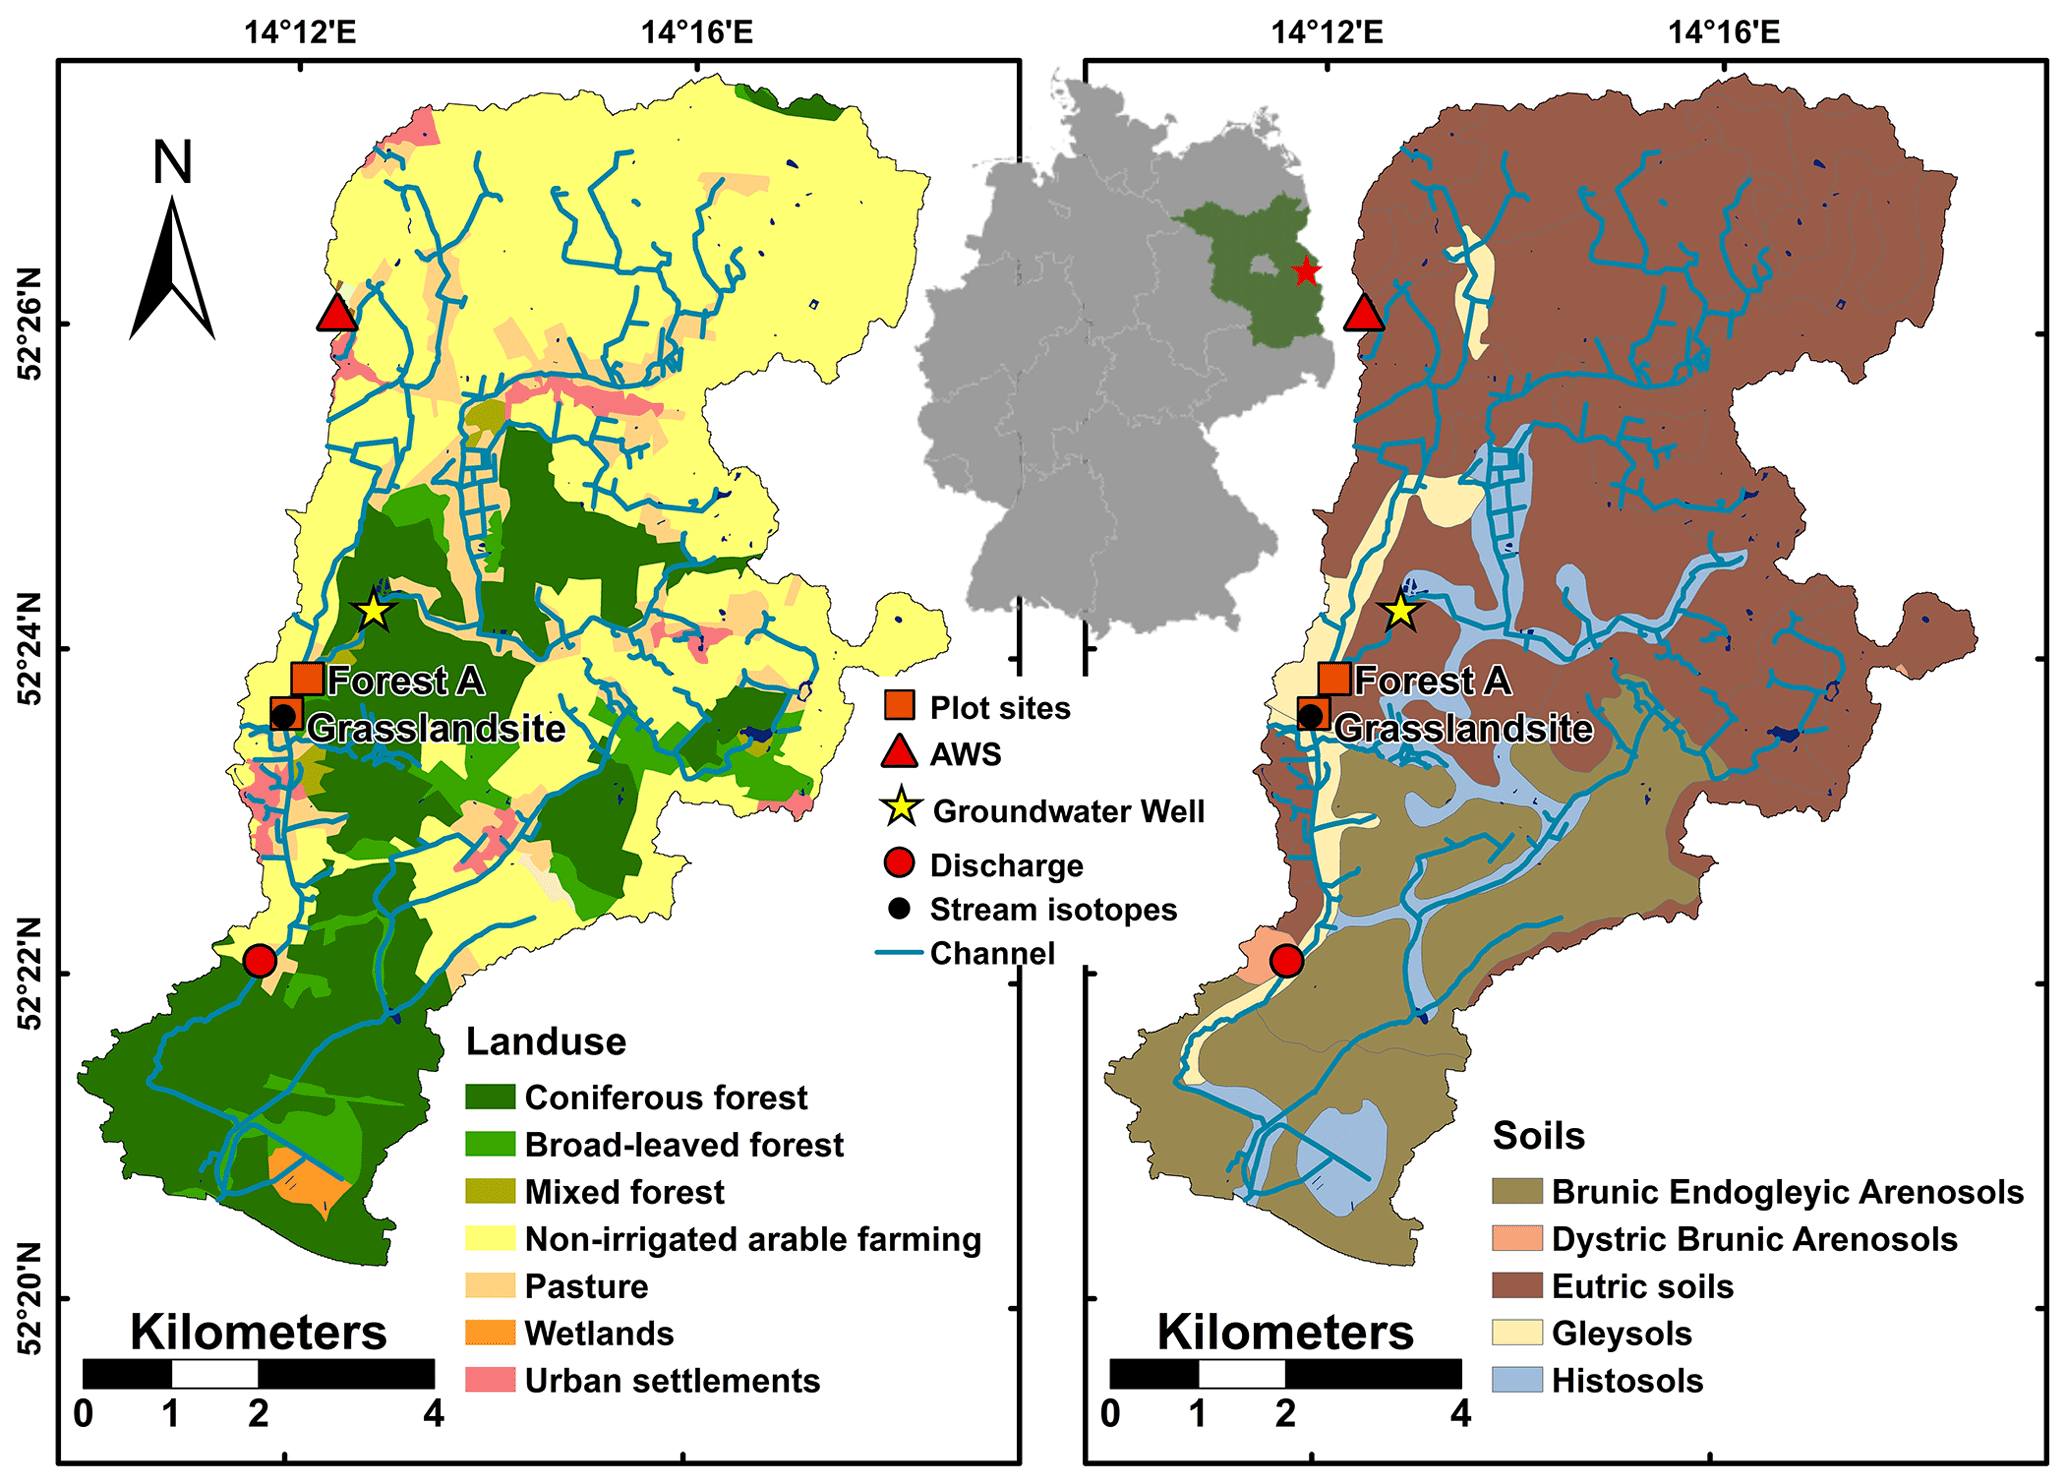
Figure 1Study site location, sampling site locations, soils, and land use (source: © GeoBasis-DE/BKG 2018; data changed) of the DMC.
Table 1Soil characteristics of the grassland and forest plot sites (sampled on 20 March 2019).
An automatic weather station, AWS (Environmental Measurement Limited, UK), located in the north-west of the catchment, was used to record meteorological data (e.g. net radiation, air temperature, precipitation, ground heat flux, relative humidity) every 15 min. To monitor transpiration rates from trees at FA, a sap-flow measuring system with 32 sets of Granier-type (Granier, 1987) sensors (Thermal Dissipation Probes, Dynamax Inc., Huston, USA) was installed in 13 trees during the growing season from 21 April to 23 October 2018. Sensors were installed at approximately 1.3 m above ground. The tree diameter was also measured at this height (DBH; mean: 76 cm; SD: 35 cm). All sensors consisted of two thermometers installed in the sapwood at 4 cm vertical distance from each other and were shielded from external sources of temperature change (e.g. radiation). The upper thermometer was heated and differences in temperature were collected hourly with a CR1000 data logger (Campbell Scientific, USA). The difference in temperature was used to calculate flux velocity and combined with the sapwood area to calculate a flux rate. Conditions of zero transpiration were determined from daily maximum temperature differences. The resulting flux rate per unit sapwood area was adjusted to the plot using a ratio of sapwood area to forest area that was established with 10 trees. Data from the AWS were used to estimate potential evapotranspiration with the FAO Penman–Monteith equation (Allen et al., 1998). To facilitate comparison, the sap-flow-derived transpiration and FAO PET were normalised by subtracting the mean (T = 1.31 mm d−1 and PET 2.53 mm d−1) and dividing the values by the standard deviation (T = 0.57 mm d−1, PET 1.20 mm d−1) derived from the overlapping period between 3 May and 18 October 2018. In addition, long-term monthly precipitation data (source: Deutscher Wetterdienst) from a nearby German Meteorological Office station (Müncheberg, 1951–February 2019) were used to quantify drought severity and temporal development using the Standardized Precipitation Index (SPI; McKee et al., 1993). The SPI was calculated for different periods (1, 3, 6, 9, and 12 months) using a gamma distribution. Volumetric soil water content and soil temperature were measured at both sites by 72 soil moisture temperature probes (SMT-100, Umwelt-Geräte-Technik GmbH, Müncheberg, Germany) at three depths (20, 60, and 100 cm) with six replicates per site. The probes recorded with a 15 min frequency and a precision of ±3 % for volumetric soil water content and ±0.2 ∘C for soil temperature. The data were averaged and aggregated to daily values to estimate soil storage in the first metre (Fig. 2) from volumetric soil moisture by weighting the upper sensors to represent 40 % of the first metre each and the lowest 20 %. One soil pit (depth >100 cm) per plot was excavated and the profile was described following common pedological procedures. Soil cores and composite samples were taken to determine further physical and chemical characteristics in the laboratory of the Technical University of Berlin (Table 1). Carbon, nitrogen, and organic carbon concentrations from soil samples were analysed in the Leibniz Institute of Freshwater Ecology and Inland Fisheries (IGB) laboratory. Daily samples of precipitation for isotope analysis were collected at the AWS with a modified ISCO 3700 (Teledyne Isco, Lincoln, USA) automatic sampling device (unshielded funnel at 1 m). Throughfall was sampled at a height of 30 cm above ground using five rain gauges (Rain gauge kit, S. Brannan & Sons, Cleator Moor, UK) which were randomly installed within 10 m at FA. Water samples in autosamplers and rain gauges were protected from evaporation by a paraffin oil layer of thickness >0.5 mm (IAEA/GNIP precipitation sampling guide V2.02 September 2014). Samples were extracted with a syringe from below the paraffin and filtered (0.2 µm, cellulose acetate) in the field and cooled until stored at 8 ∘C in the laboratory. Groundwater levels in the catchment were monitored 4-hourly using an AquiLite Beaver ATP10 pressure sensor (AquiTronic Umweltmeßtechnik GmbH, Kirchheim/Teck, Germany) with precision <0.1 % and a resolution of 1 mm. The monitoring well was installed in 2000 and screened from 3.50 m to the bottom at 5.57 m below the surface. Liquid groundwater samples for isotopic analysis were obtained by monthly manual sampling with a submersible pump (COMET-Pumpen Systemtechnik GmbH & Co. KG, Pfaffschwende, Germany). Stream water was sampled by an ISCO 3700 at 16:00 each day (to minimise ice effects) and stored in the field covered by paraffin oil in the bottle until collection and processing once a week. The stream discharge values at the Demnitz Mill were derived by using water level data derived from pressure sensors identical in construction to the groundwater sensors and a rating curve determined by Smith et al. (2020a). All liquid water samples were measured at the IGB laboratory with a Picarro L2130-i cavity ring-down water isotope analyser (Picarro, Inc., Santa Clara, CA, USA). To screen for interference from organics, the ChemCorrect software (Picarro, Inc.) was applied and contaminated samples discarded. Liquid samples were injected six times and the first three injections discarded. The standard deviation of the three used injections per sample was on average 0.04 ‰ for δ18O and 0.14 ‰ for δ2H. Isotopic composition of bulk soil water was sampled at six depths (0–5; 5–10; 10–20; 20–30; 40–60; 80–100 cm) on a monthly basis from October 2018 to February 2019 with two additional replicates per site. The unequal sampling resolution across the depth profile was chosen to enable sample throughput in the laboratory while capturing the first metre of soil and to take account of the higher heterogeneities expected in the upper soil. Initial soil bulk water sampling was conducted in September 2018 using a slightly different procedure. Here, soil sampling in the forest and grassland occurred on different dates (FA, 21 September and GS, 7 September 2018) and with higher spatial resolution at FA of 5 cm within the first 30 and 10 cm until 1 m. GS had a broader resolution (10 cm until 1 m depth). Three replicates were sampled in September 2018 until a limited depth of 30 cm in the forest and 50 cm in the grassland site. Data of the September sampling were transformed by amount weighting to be integrated in later analysis and figures. We used soil cores (∼250 cm3) in the topsoil (0–10 cm) to gain sufficient water (3 mL; Hendry et al., 2015) for the lab analysis. Soil bulk water isotopes were analysed using the direct-equilibrium (DE) routine of Wassenaar et al. (2008). Soil samples were immediately stored in sampling bags and sealed with ziplocks instantaneously. All samples were then stored sealed and thermally isolated until weighed, inflated with the headspace gas, and heat sealed in the laboratory. We used diffusion-tight metalised sample bags (CB400-420siZ, Weber Packaging, Güglingen, Germany) as established in other direct-equilibrium studies (Sprenger et al., 2015). Synthetic dry air was utilised as an inflation atmosphere to enable a posteriori correction of biogenic gas matrix changes in the headspace (Gralher et al., 2018). After introducing dry synthetic air as a headspace gas to the soil sample bags, the bags were heat sealed and equipped with an external silicone septum. Samples and three liquid standards of known isotopic composition (covering the range of expected values) were incubated for approximately 48 h under stable thermal conditions (21 ±1 ∘C) and measured by introducing the equilibrated headspace via needle and tubing to the inlet port of the cavity ring-down analyser (Picarro L2130-i). A stable plateau in water content was ensured with quality criteria for water content standard deviation (SD) < 100 ppm, δ2H (SD < 0.55 ‰), and δ18O (SD < 0.25 ‰) over 2 min. The real water content in the vapour was on average 27 350 ppm with a mean SD of 39 ppm and δ2H had a mean SD of 0.42 ‰ (for absolute corrected delta values ranging from −23.71 ‰ to −91.44 ‰) and 0.18 ‰ (range: −1.47 ‰ to 12.53 ‰) for δ18O, respectively. We calculate the non-conformance of the relation between δ2H and δ18O in the sampled water relative to the average isotopic composition of the global precipitation, introduced as the deuterium excess (d-excess ) by Dansgaard (1964). Variations in d-excess values indicate that precipitation isotopic compositions were exposed to fractionation processes before sampling of the respective water sample. Mean transit times (MTTs) in the soil were estimated using stable oxygen isotope signatures of weekly precipitation samples and monthly data of soil bulk water at different soil depths. Given the short sampling period and monthly intervals, the resulting MTTs can only be considered preliminary estimates, but these are still useful for comparing inter-site and within-profile differences. Oxygen signatures in the soil layers were simulated from precipitation inputs weighted by a gamma function representing the assumed, time-invariant transit time distribution. The gamma function was fitted by maximising the objective function using the Kling–Gupta efficiency statistic (KGE; Gupta et al., 2009) within predefined parameter ranges for the shape factor (α; 0.5 to 5) and the scale parameter (β; 2 to 50); these were set to avoid MTTs shorter than the sampling frequency. The shape of the gamma distribution enabled us to represent short- and long-term tracer input contributions (e.g. Kirchner et al., 2001) to soil bulk water. We further excluded the first two sampling dates in the upper 10 cm of both plot soils for this analysis to avoid implausible results due to tracer enrichment introduced by soil evaporation. We calculated young water fractions using the fitted sine wave method described by Von Freyberg et al. (2018), adjusting the topsoil values for the two first sampling occasions to the precipitation input for the same reasons. The young water represents the estimated fraction of water in the sampled soil depth that fell as precipitation within the last 2–3 months.
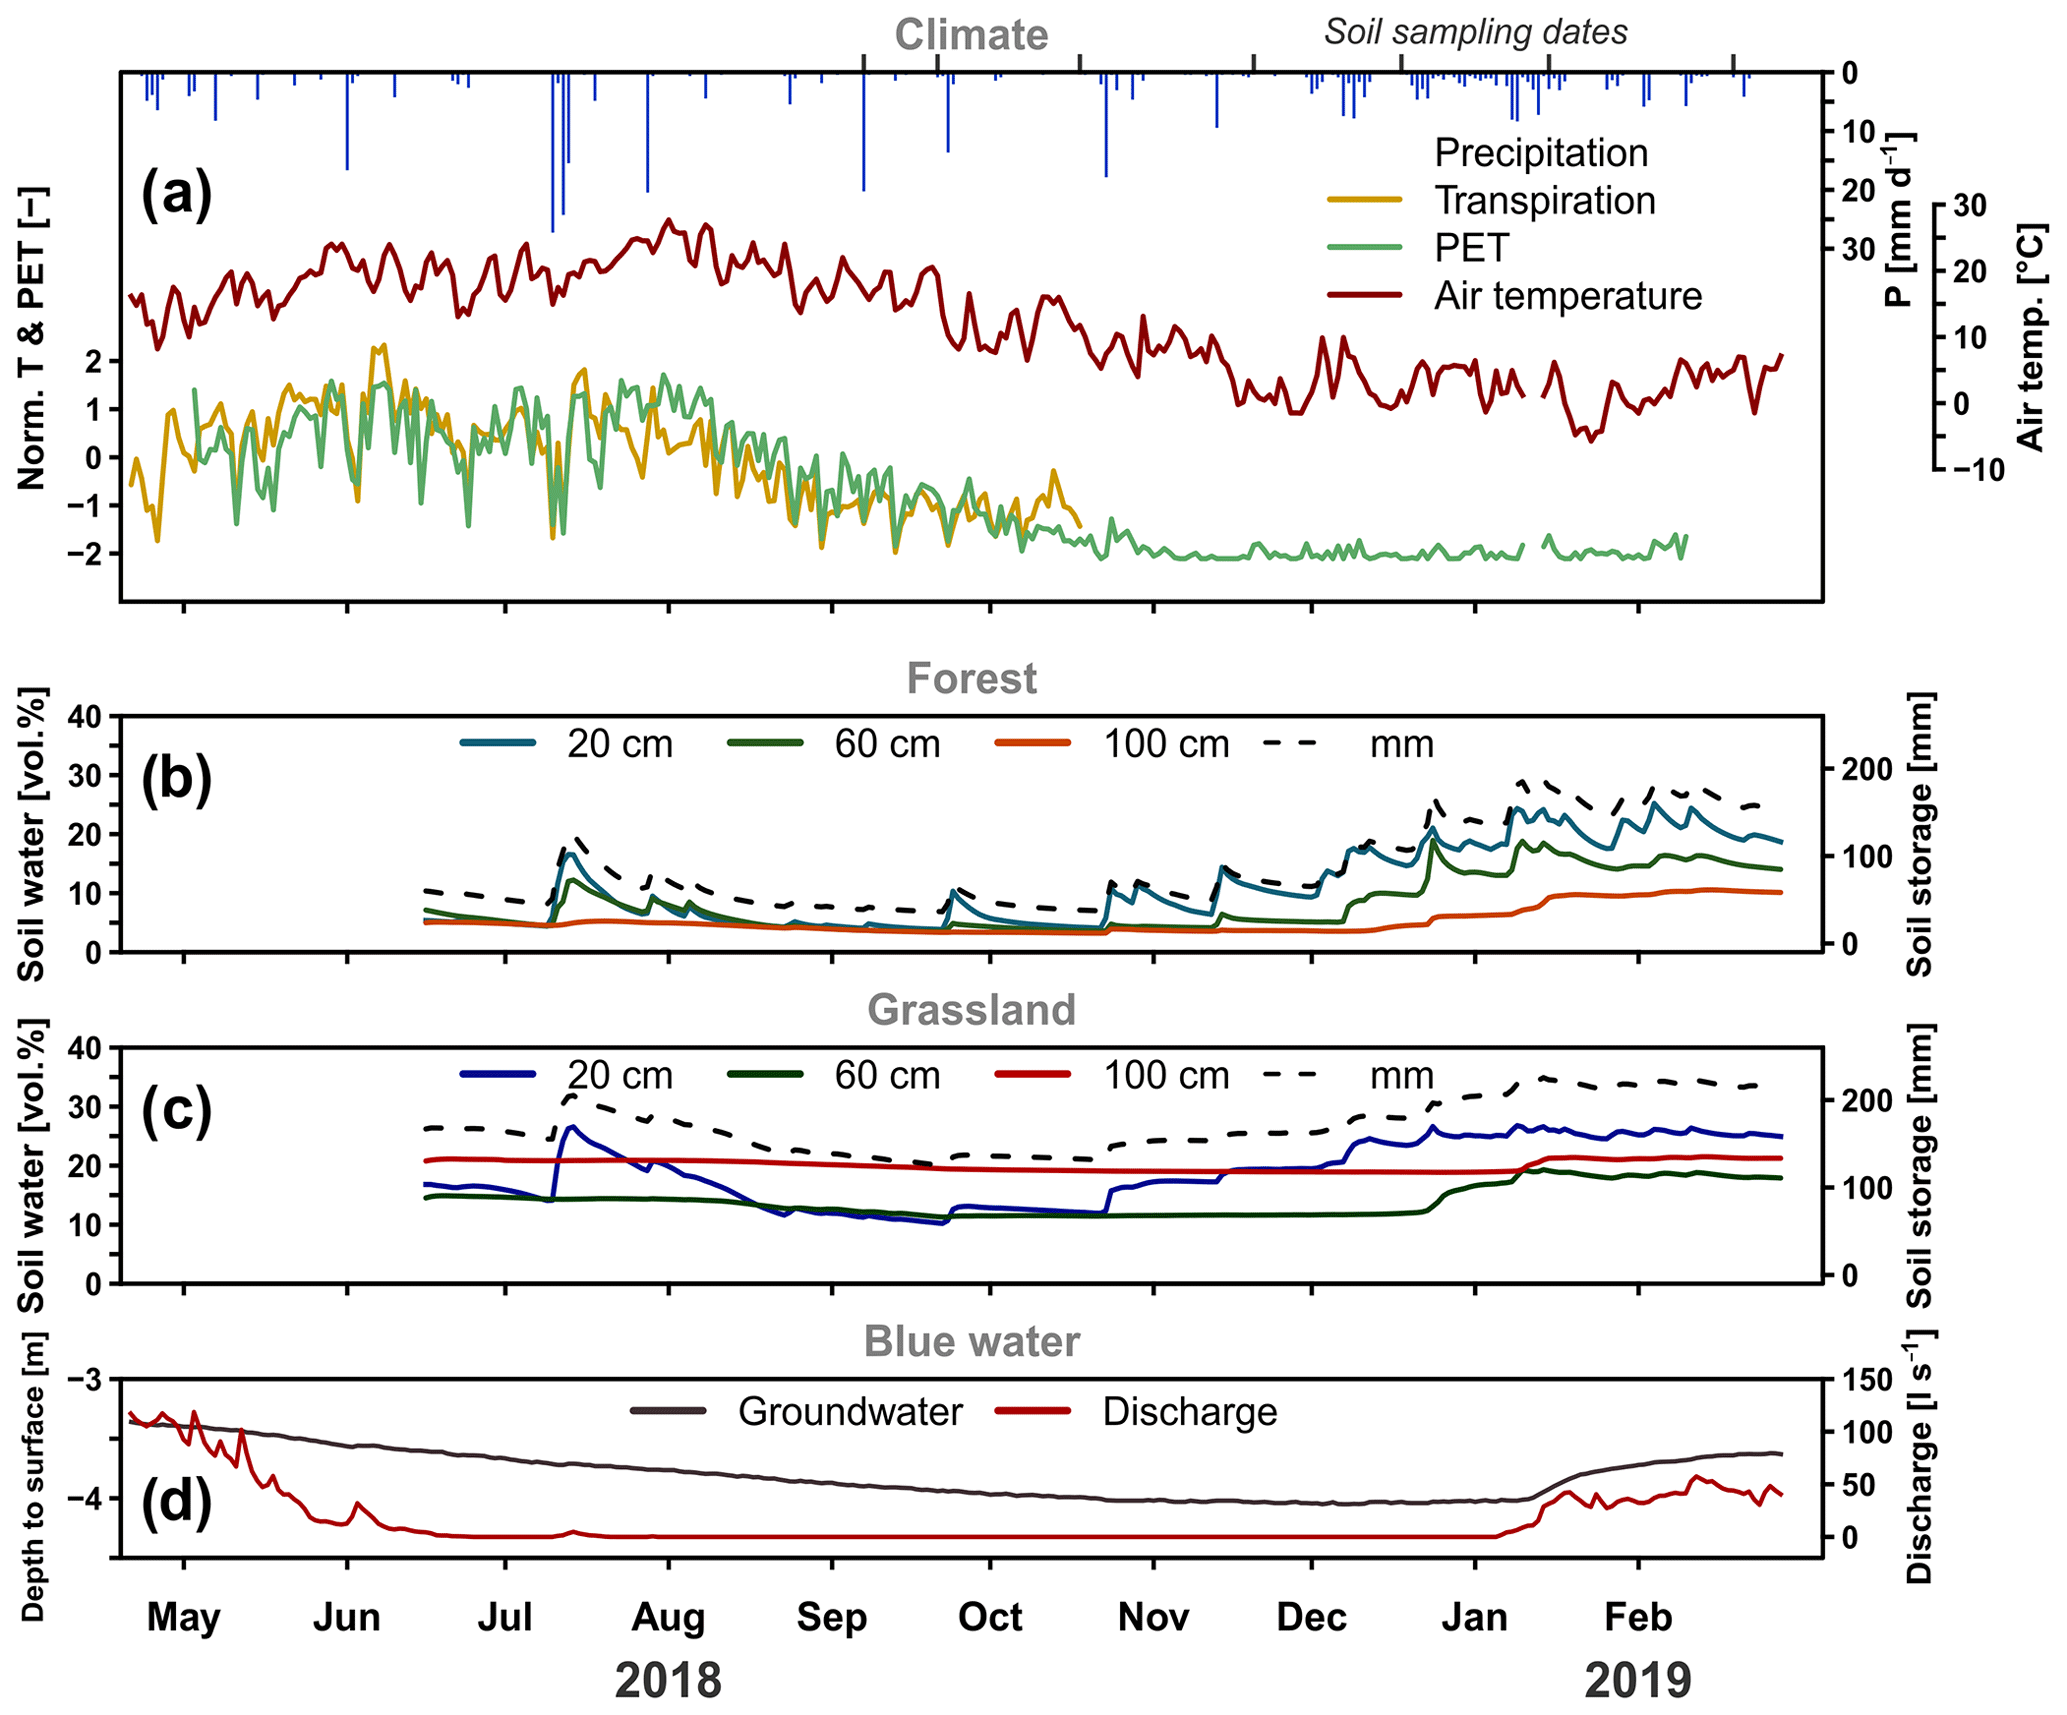
Figure 2Daily precipitation, normalised transpiration (from sap-flow sensors), normalised PET (FAO Penman–Monteith) (a), volumetric soil moisture (n=6 per three depths of the forested plot) (b), and grassland site (c) with the total soil water in millimetres (dashed line) and groundwater elevation relative to surface and discharge at the Demnitz Mill (d) for the 2018 growing season and 2019 re-wetting.
4.1 Hydroclimatic situation
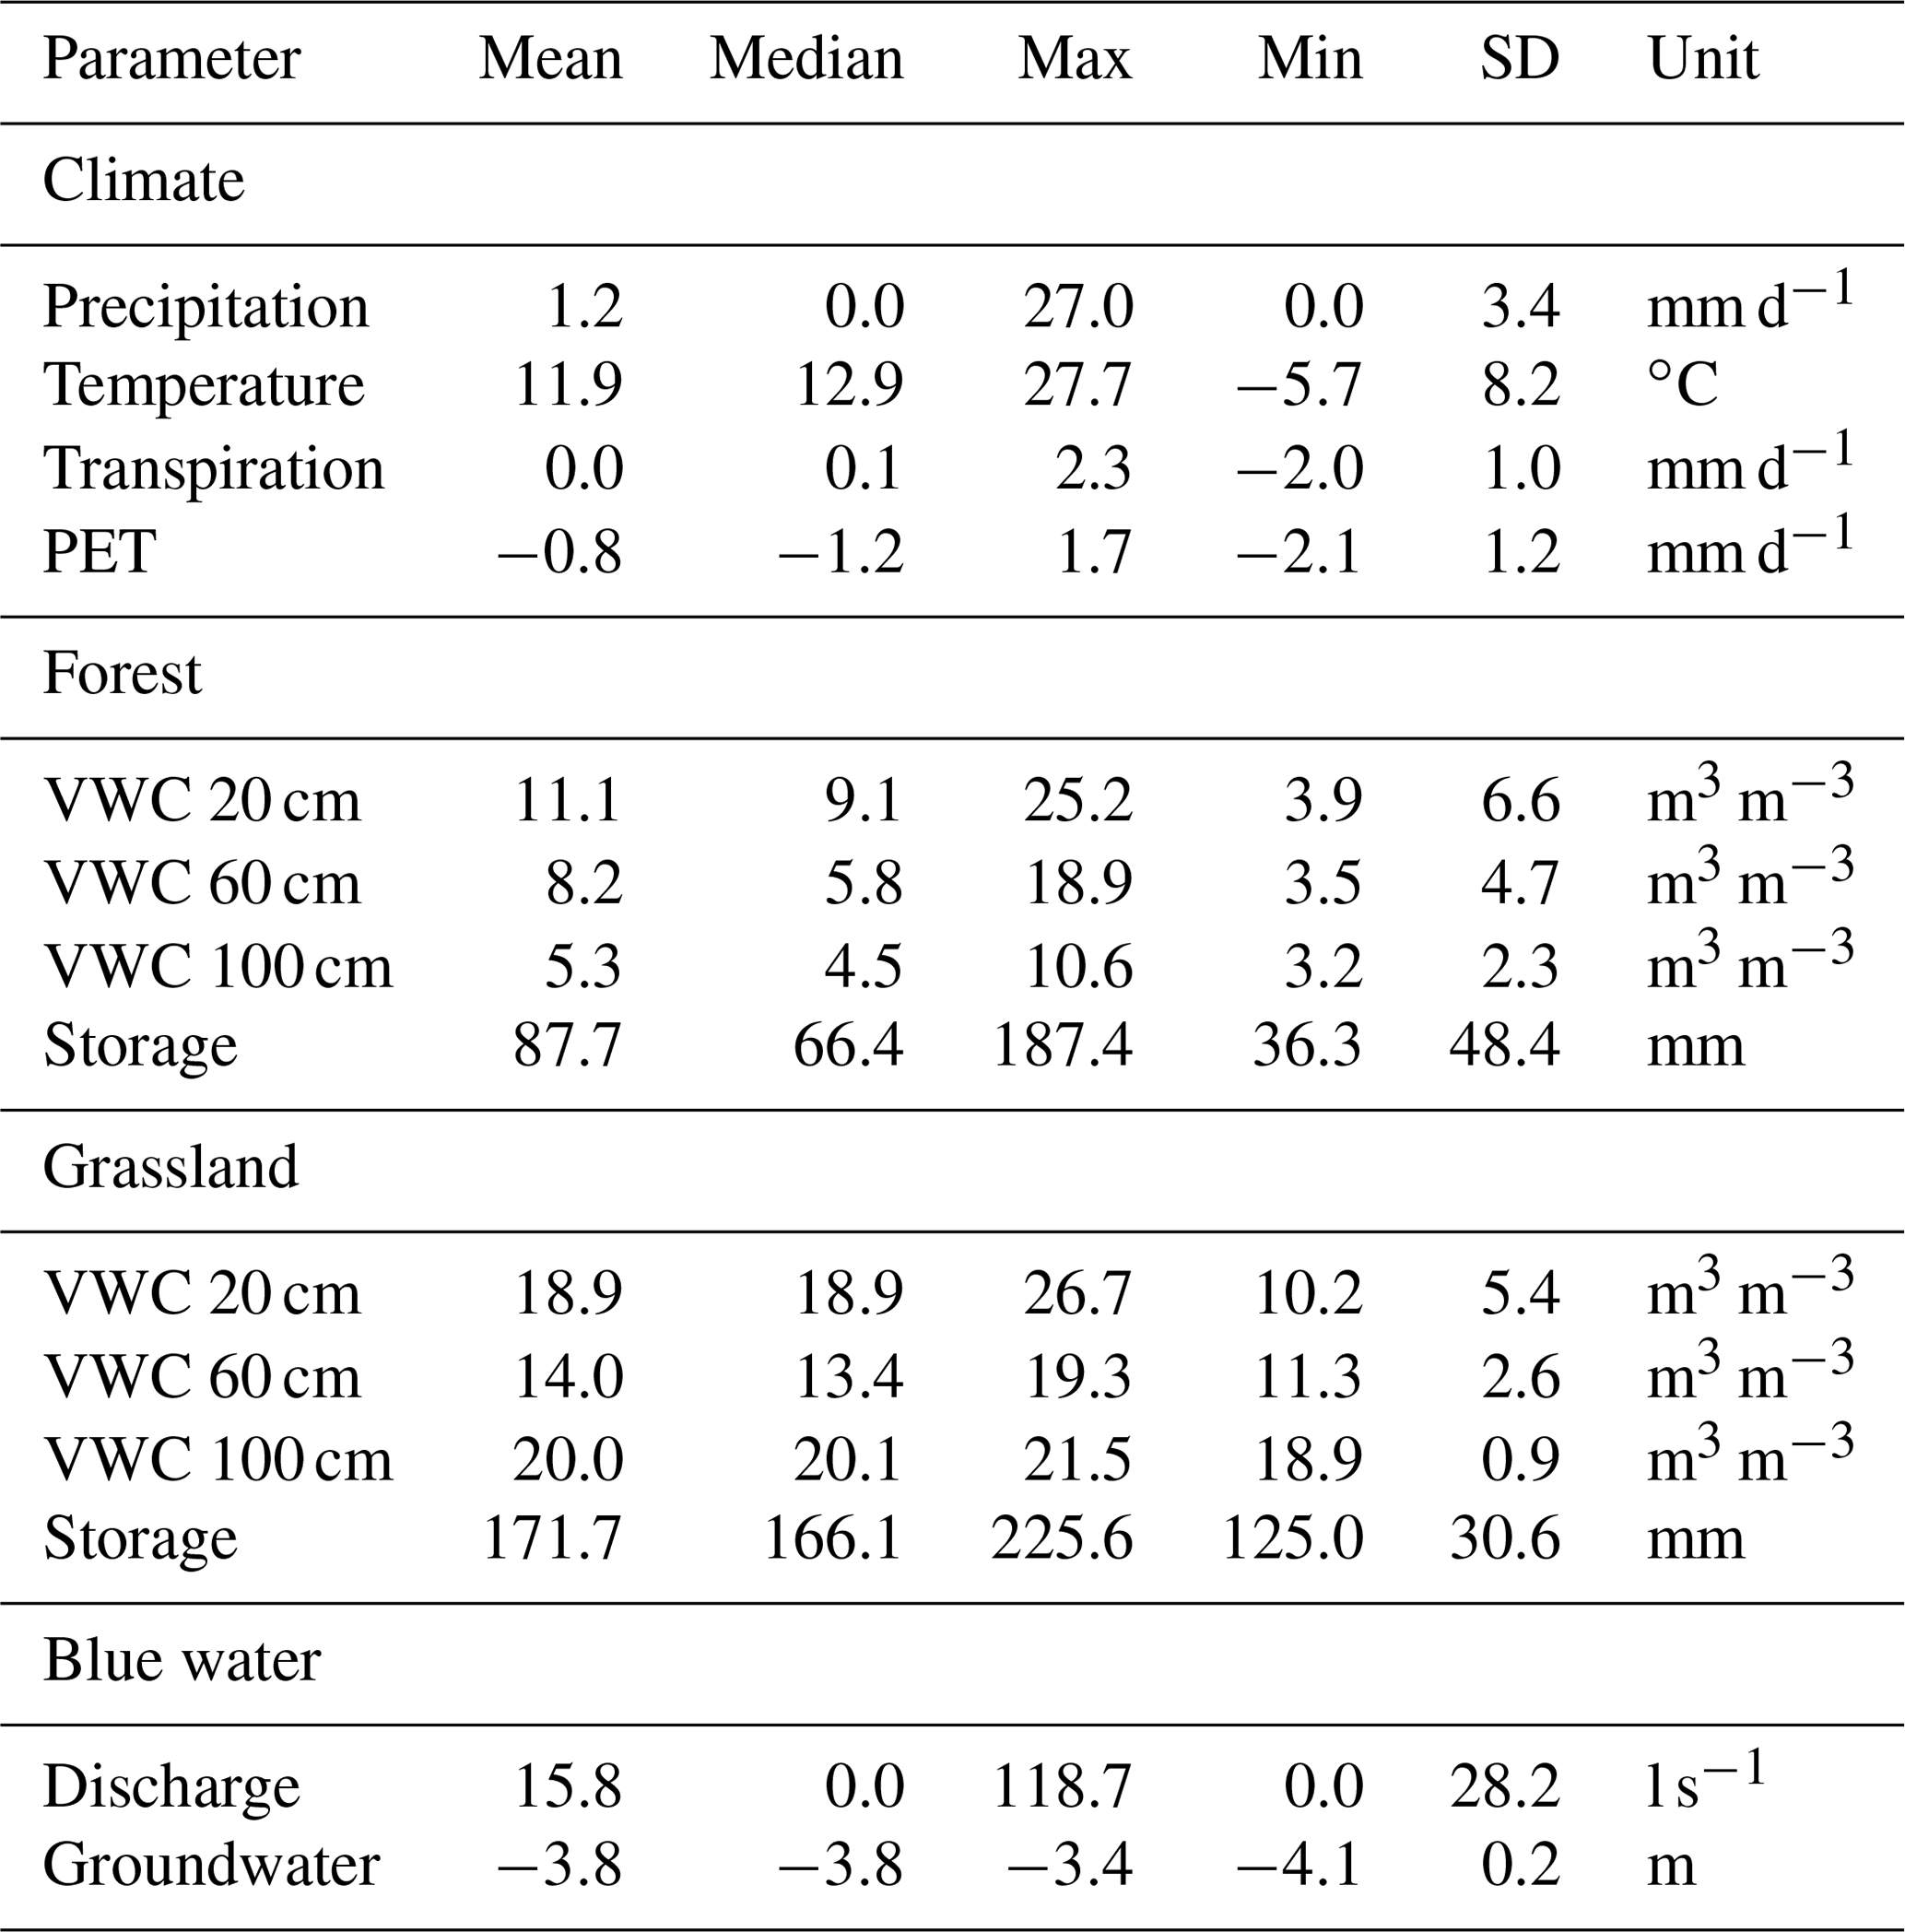
Exceptional climatic conditions during the study period, with low precipitation and high temperatures, are reflected by the SPI (Table 2). Values varied between “moderately wet” (1.0 to 1.49) and “extreme drought” (−2 and less). The different SPI time windows indicate the progression of the 2018 drought in different temporal contexts and therefore represent drought impacts on different compartments of the catchment water cycle. We found short-term monthly SPI values ranged from −2.1 (February 2018) to 1.1 (January 2018). At this, 9 out of 14 individual months showed negative precipitation anomalies (mean ). The heavy rainfall events in July 2018 resulted in an above average wet month (1 month, 0.9) which was also reflected in less negative 3- and 6-month SPI values. This effect did not persist, however, as the drought index dropped again in August. The lowering was driven by the absence of significant precipitation inputs which was reflected by negative SPI (1-month) values from August to December. Despite normal precipitation amounts, January and February 2019 still showed marked drought characteristics over the longer term in SPI 6, 9, and 12 (). Annual patterns of heavy convective precipitation events during summer and lower intensities during winter are also reflected in daily precipitation amounts (Fig. 2a). The total precipitation between 21 April 2018 and 28 February 2019 was 379 mm. Precipitation occurred on 123 of the 314 d on which the average amount was 3.1 mm d−1. Highest daily rainfall intensities were observed in the summer with a maximum of 27 mm d−1 (7 September 2018). Mean daily air temperature during the study period ranged from 27.7 ∘C in summer (1 August 2018) to −5.7 ∘C in winter (23 January 2019). Daily air temperature, normalised transpiration, and potential evapotranspiration show strong seasonal patterns with maxima during summer and minima during winter. Throughout the investigated period, dynamics of normalised transpiration closely matched the normalised PET dynamics. Volumetric water content (VWC) of the FS and GS soils (Fig. 2b and c) is given as the geometric mean () of accumulated daily values. The forest soil was notably drier than the grassland, and overall, the grassland soil showed much less variability and a lower drought effect on soil moisture than the forest site. The upper forest soil moisture content showed rapid responses to precipitation inputs. Further progression of wetting fronts to depth was damped and lagged, which resulted in decreasing SD with depth (Table 3). Soil moisture in the forest at 100 cm depth showed extremely low values (min = 3.2 vol. %) and little variation during the growing season. During early December, soil moisture values here began to rise, reaching a maximum value of 10.6 vol. % in February. In contrast to the forested site, the grassland site soil moisture (Fig. 2c) was generally higher and less dynamic at all depths. The recessions of soil moisture peaks at 20 cm were less steep than in the forest. GS soil moisture at 60 and 100 cm showed a steady and slow decline in 2018 before rising in late December and the beginning of January 2019, respectively. The observed groundwater level at the monitoring well (Fig. 2d) continuously declined during the drought, from −3.4 m at the beginning of the study to a minimum of −4 m in December. At the start of 2019, the groundwater table began rising, shortly after the deeper soil horizon moisture, and partially recovered to a level of −3.6 m at the end of the study. Around the same time as the stabilisation and rise in groundwater levels, the DMC stream began to flow again (Fig. 2d). Flows had ceased earlier in the summer (20 July 2018) as groundwater levels fell, though there was a brief response to the July rainfall that resulted in temporary discharge (27 July 2018).
Table 2SPI meteorological drought intensity values for different periods derived from historical precipitation distribution.
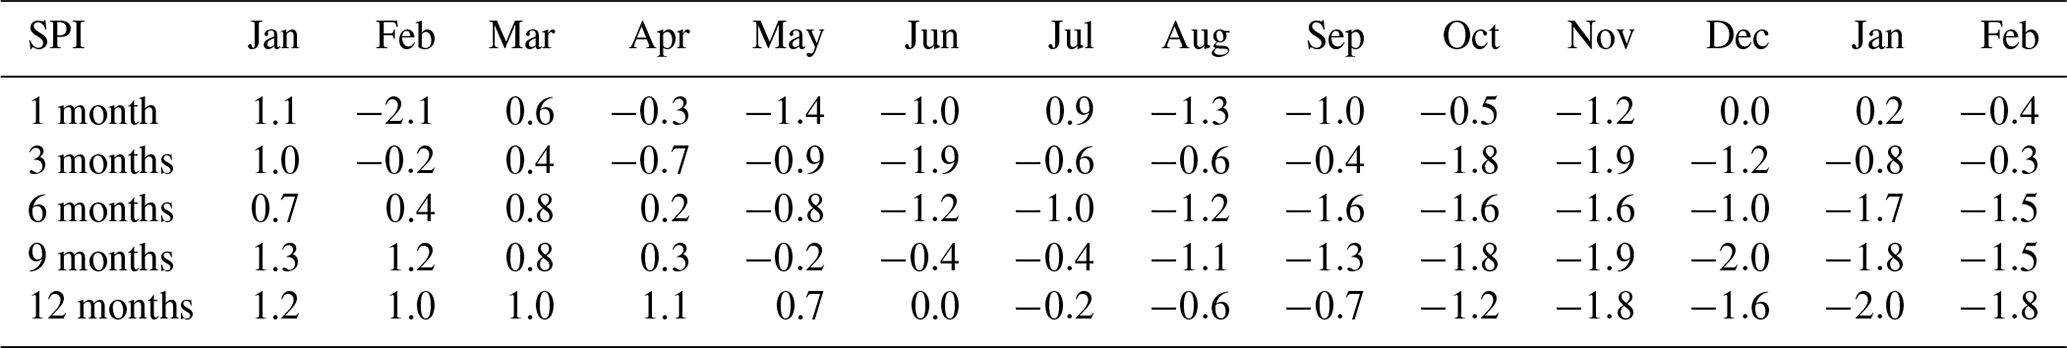
Table 3Summary statistics for the daily time series shown in Fig. 2.
4.2 Dynamics in water stable isotopes
The isotopic samples obtained from different water cycle compartments are displayed in two-dimensional isotope space (Fig. 3) supplemented by the global meteoric water line (GMWL) (Craig, 1961). Statistical characteristics are summarised in Table 4. Daily precipitation showed the highest range from being depleted in heavy isotopes ( ‰; ‰) in winter to less depleted and even enriched in oxygen relative to the Vienna Standard Mean Ocean Water (VSMOW) standard in summer (δ18O = 0.3 ‰; ). Throughfall samples showed a smaller range in δ18O (min ‰, max ‰) and δ2H (min ‰, max ‰). Summer interception derived from five throughfall samplers under the forest (11 July–29 August 2018) ranged from 8 % to 38 % (median to 17 %). In general, precipitation and throughfall samples plotted close to the GMWL. Only exceptionally heavy samples of rainfall and the five associated throughfall samples which originate from one event (4.2 mm) in early August 2018 (8 August 2019) showed pronounced deviations. Spatially distributed precipitation samples in the catchment (not in the plot) showed similar deviations for this event. The throughfall isotopic signature overall showed little impact of the forest canopy cover. This canopy effect cannot be excluded systematically, as this study did not include sampling of stemflow, though volumes of stemflow are likely small.
Table 4The number (n) and 50th (median), 5th, and 95th percentiles of δ18O and δ2H (‰ VSMOW) signatures of the sampled water cycle compartments.
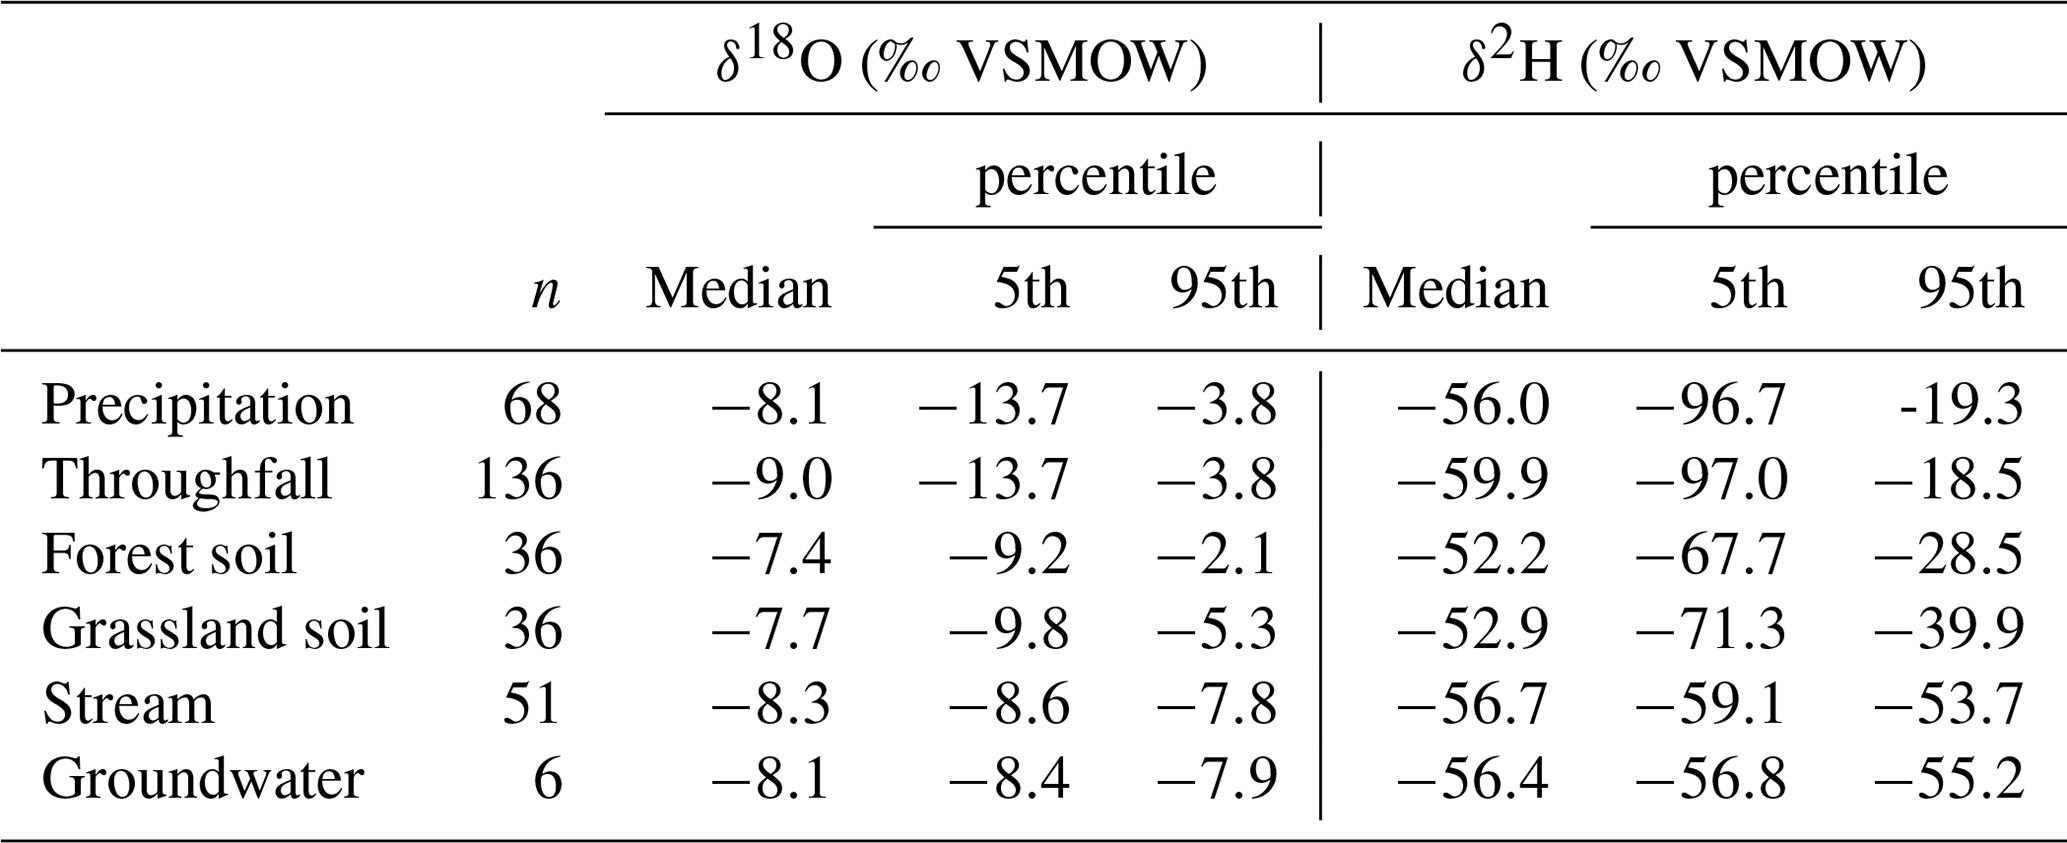
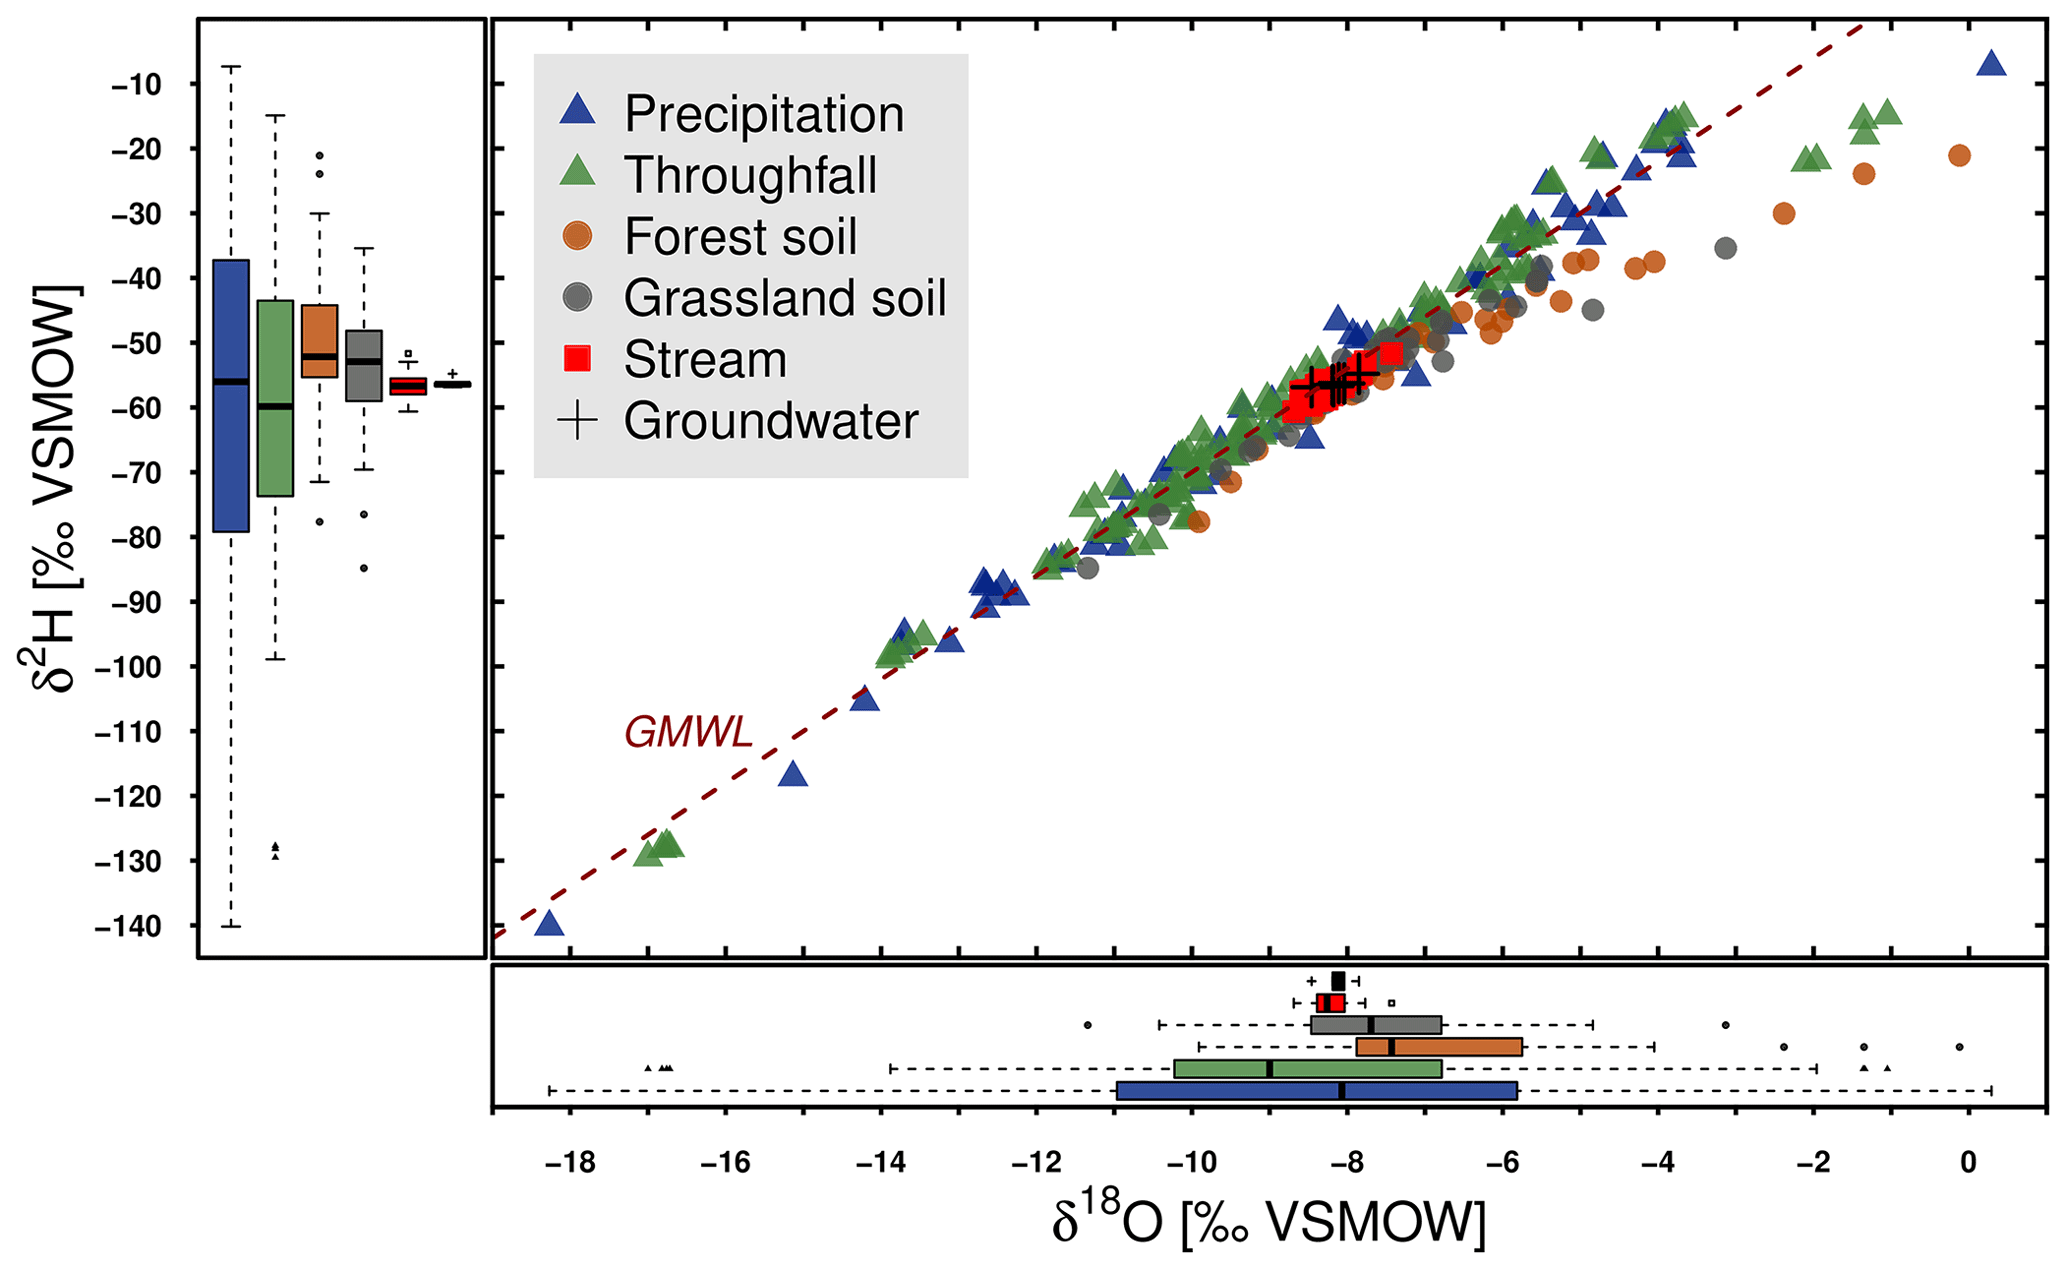
Figure 3Dual-isotope plot of DMC precipitation, throughfall, forest and grassland soil bulk water samples, as well as stream water and groundwater.
The forest and grassland soil samples exhibited substantial damping in isotopic variability relative to precipitation. They also displayed deviations from the GMWL at the more enriched end of their dual-isotopic spectrum. We found that water in forest soils had a heavier isotopic composition (Table 4) than grassland soils and more frequent deviations from the GMWL. Monthly groundwater samples showed the smallest variation with ranges in δ18O (−8.5 ‰ to −7.4 ‰) and δ2H (−56.9 ‰ to −54.8 ‰). Isotopic dynamics in daily stream water were also limited and very similar to groundwater, varying between −8.7 ‰ and −7.4 ‰ for δ18O and between −60.6 ‰ and −51.7 ‰ for δ2H and plotted close to the GMWL.
The temporal dimension displayed in Fig. 4 includes daily precipitation amounts, δ18O (a) and δ2H (b) signatures in precipitation (daily, orange), and amount-weighted mean throughfall (weekly, green) samples. A precipitation amount-weighted running mean of the 30 previous days is also shown. The greater temporal resolution of precipitation compared to throughfall (see Table 4) resulted in more variability of the isotopic signatures. Open precipitation and throughfall showed seasonal dynamics with more enriched values in both isotopes during the summer and more depleted signatures during the winter. The isotopic variations during summer were dominated by single events with high precipitation amounts. The uneven event distribution led to unsteady running means during the drought. More frequent rain events, between December and February, led to increased robustness and congruence of the running means for both isotopes in open precipitation and under canopy.
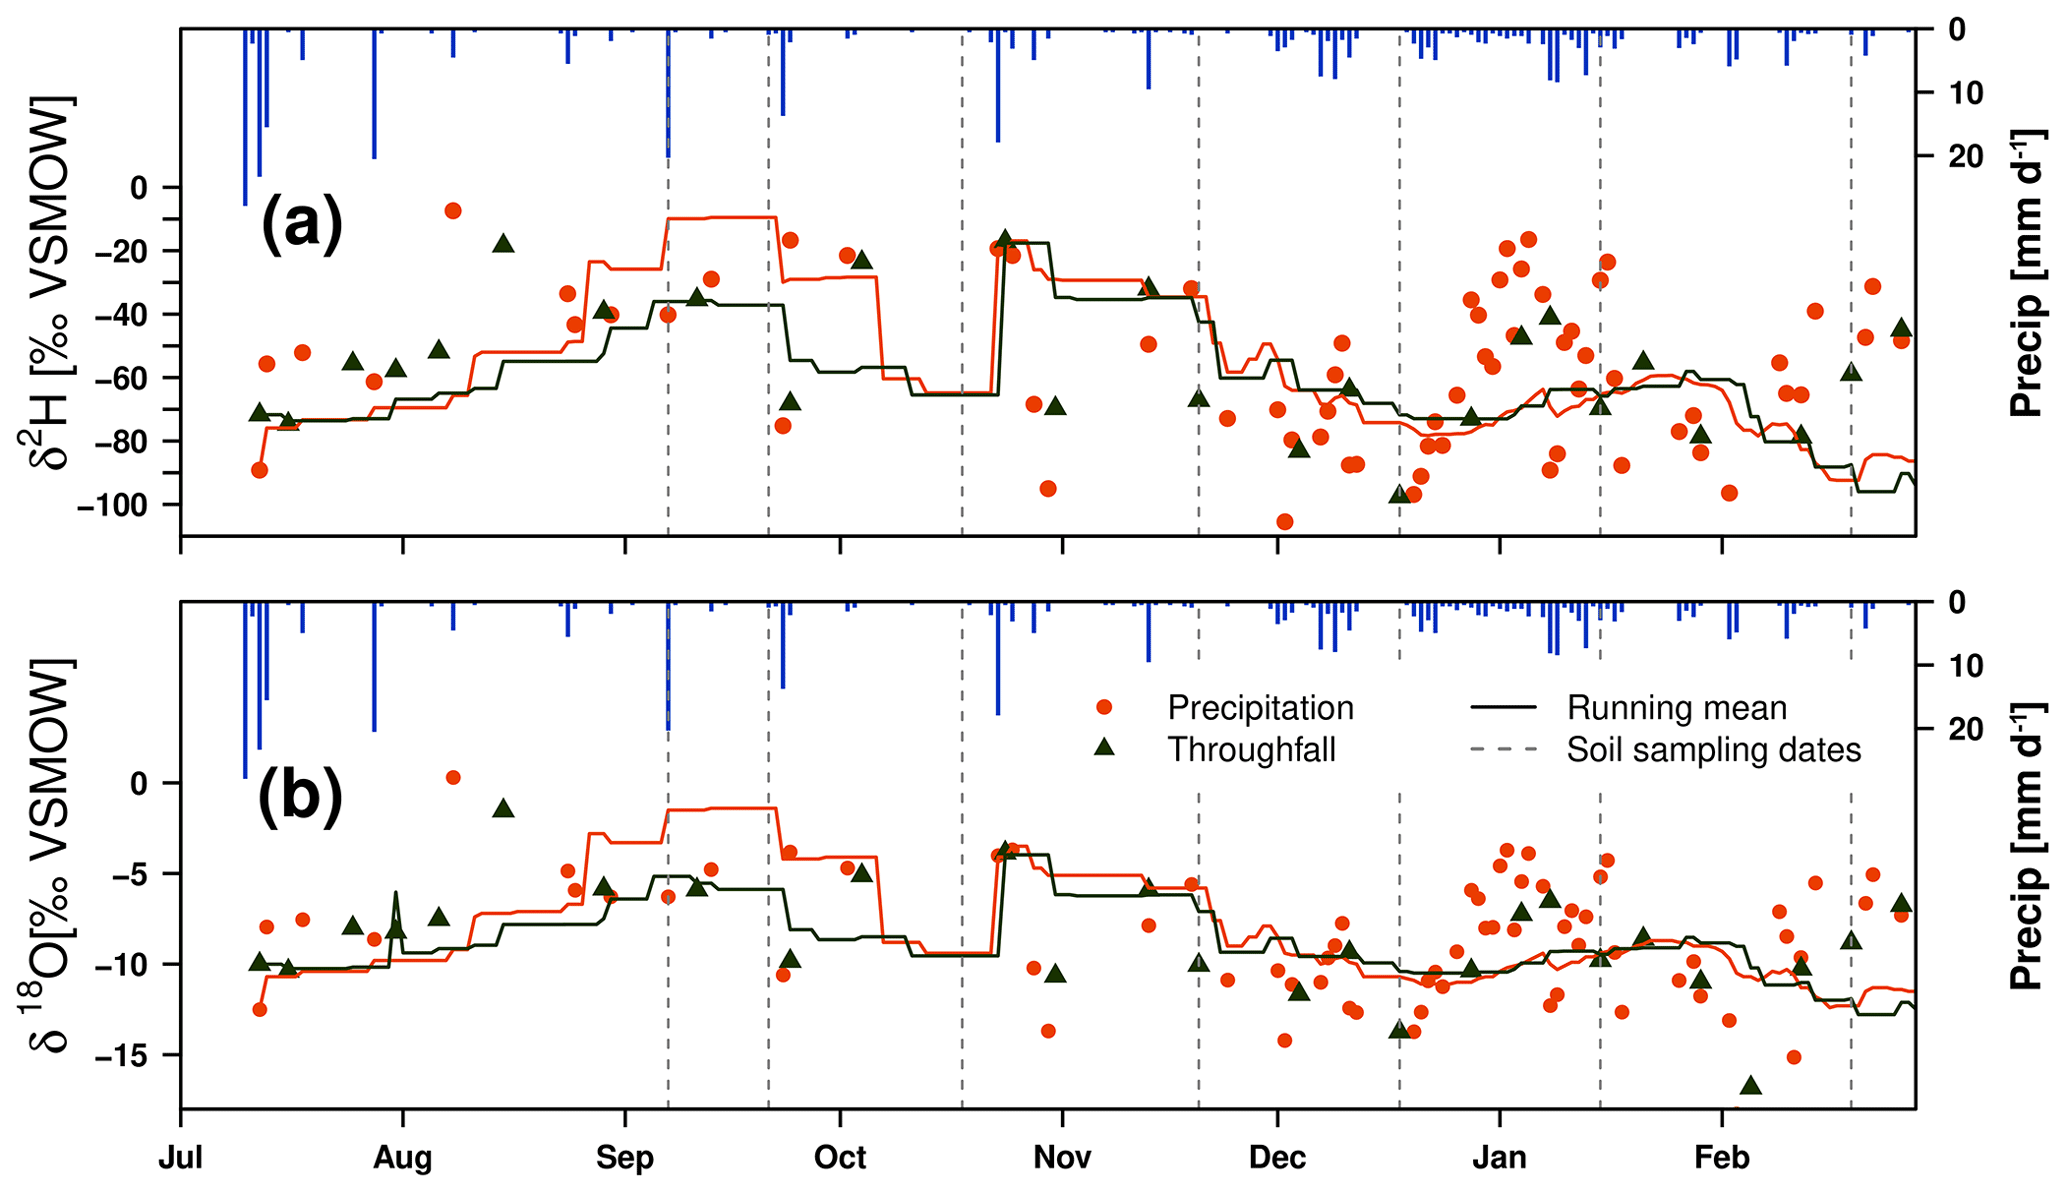
Figure 4Time series of daily precipitation amount and isotopic signature of weekly throughfall at forest A and daily precipitation and their 30 d running (volume-weighted) mean for δ2H (a) and δ18O (b), with dotted lines indicating dates of bulk soil water sampling (dashed line).
Heat maps (Fig. 5) show the changing bulk soil water isotope signatures for both land use types, which are strongly influenced by precipitation inputs (shown in Fig. 4). The geometric mean () of the replicate samples is displayed as a colour code for all sampled depths. Sampling started in September 2018 after several months of high air temperature and low precipitation when the severity of the drought became clearer (Fig. 2). Under both land use types, the upper 20 cm showed the highest variability in isotopic signatures throughout the seasons. This resulted in high SD for both isotopes and sites over all sampling dates at 2.5 cm. The SD decreased with depth (Table 5). During the October sampling, both sites still showed an enriched signal in the top 20 to 30 cm; at both FA and GS, δ18O and δ2H decreased with depth down to 50 cm. In February, increased winter precipitation input resulted in isotopically lighter water in the upper profile and a relatively more enriched signature in the deeper soil. Drought impacts on the soil bulk water by evaporation are shown by more negative values of d-excess as this metric was originally presented as an index for non-equilibrium conditions (Dansgaard, 1964). Low values in d-excess are present during the late summer and are most pronounced in the topsoil, penetrating the profiles to depths of 30 cm (FA, October) and 20 cm (GS, October), respectively. The enriched October drought signal in both isotopes for the FA and GS topsoils persisted and subsequently penetrated downwards but was damped as evident in the December sampling at 20–30 cm depth. This pattern was not visible for d-excess values; by December, variations in d-excess over the depth profile were limited under FA and GS.
Table 5Descriptive statistics (mean, median, standard deviation (SD) and percentiles: 5th, 95th) for the geometric mean (n=3) of the bulk soil water isotope samples δ18O and δ2H (‰ VSMOW) values per sites and depths for all sampling dates (n=5).
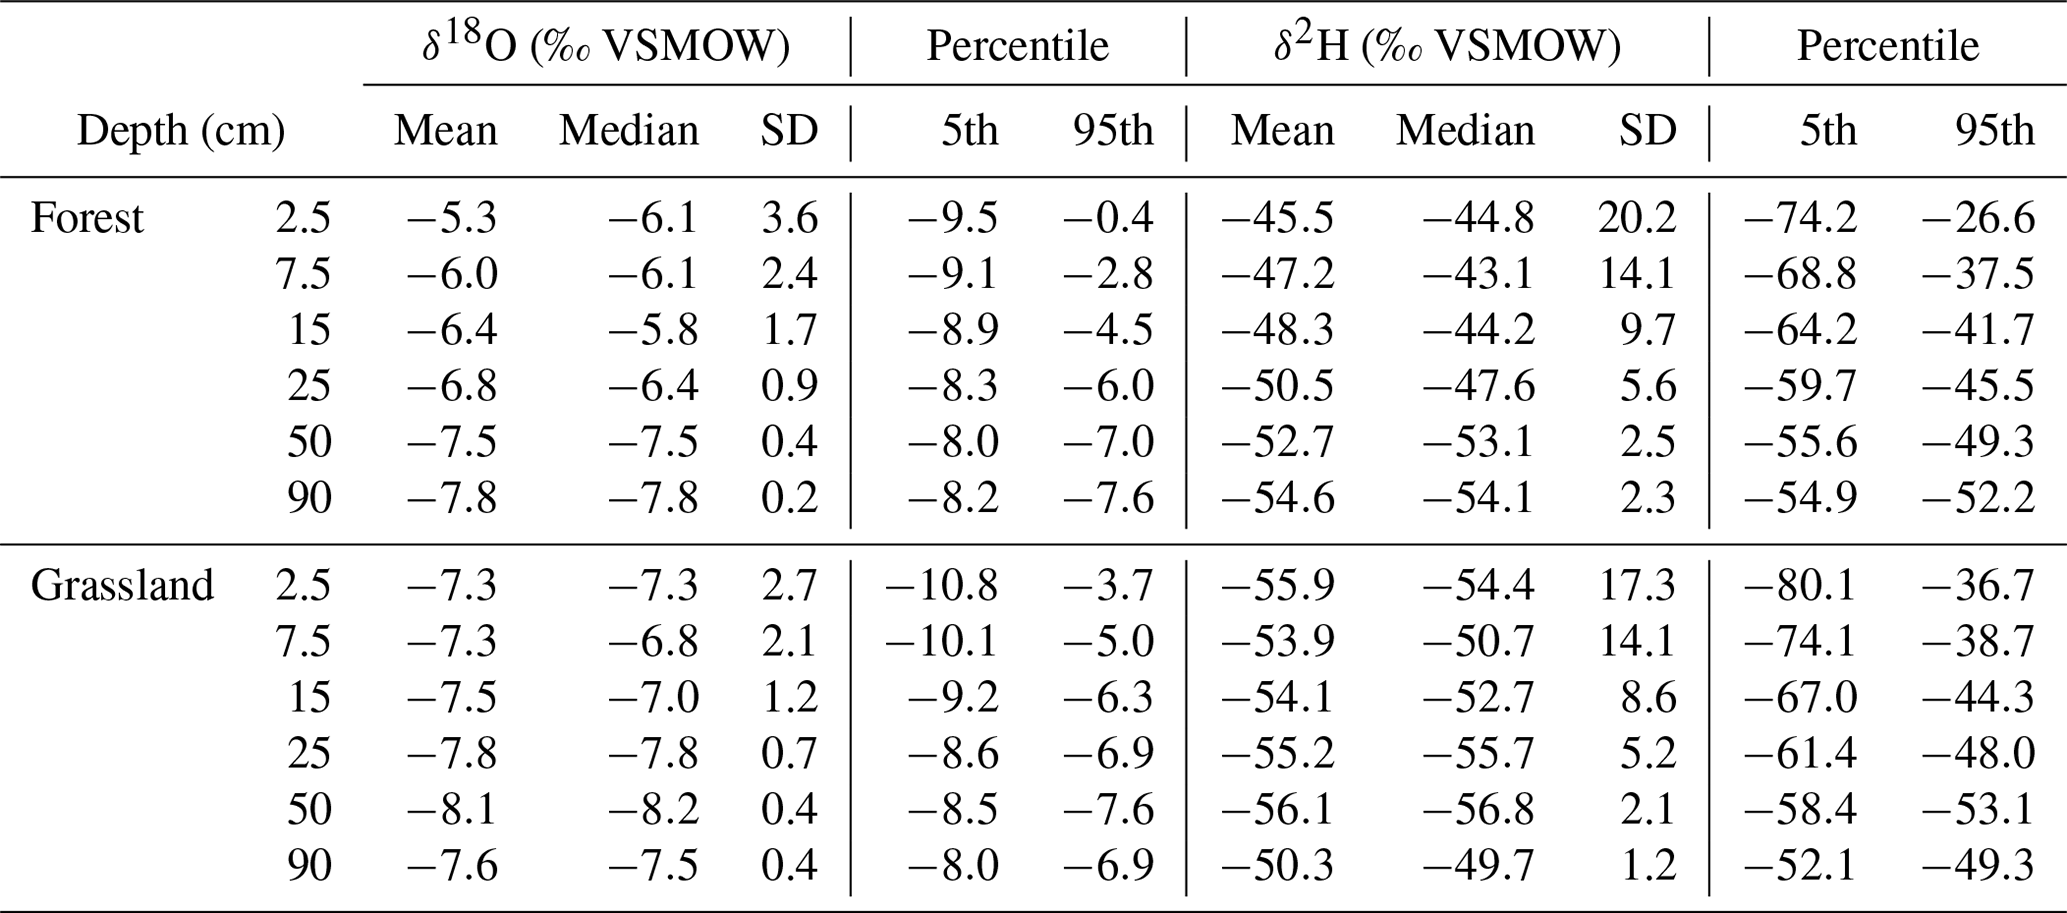

Figure 5Heat map of soil depth profiles for mean δ2H, δ18O, d-excess and gravimetric (grav.) soil moisture of three replicates at both land use classes (forest and grassland) of six monthly sampling dates. Blue to red colours indicate more to less depleted δ2H and δ18O values, declining d-excess, and grav. soil moisture values. On top, antecedent conditions of mean daily air temperature and the sum of precipitation 7 d prior to sampling are displayed in the bar chart.
Estimates of water ages and young water fractions (i.e. % of water younger than 2–3 months) are displayed in Fig. 6 and show striking differences with depth between FA and GS soil profiles. The FA young water fraction was > 75 % in the upper five soil depths and dropped dramatically to < 5 % at 90 cm depth. GS young water fractions declined more gradually with depth. Values ranged from > 75 % at the upper most soil layer down to ∼20 % at 90 cm. The method returned significant sine wave fits (Table 6) with the exception of the lowest investigated FA soil layer. The MTT of water at different depths at FA and GS showed similar variations ranging from less than a week in the topsoil to 15–20 weeks at 40 to 60 cm. Again, the fits indicated by the KGE were quite good, apart from the very upper and lower soil layers at FA. MTTs in the upper 50 cm were generally longer in GS. The increase in MTT with depth was more exponential in the FA soil, producing the most marked difference in MTT between the sites at 90 cm. While the MTT in the deeper forest soil was above 50 weeks, the GS only showed a MTT of 23 weeks. The shape of the transit time distributions spatially varied from smaller calibrated alpha values in the upper soils to higher alpha values in the lower soils at both sites. This reflects more exponential distributions of more rapid transit times fitted in the upper soil and slower, more piston flow-type distribution in the underlying depths.
Table 6Soil bulk water MTT estimates, including their α and β values, from best fits of gamma function and young water fraction (YWF) from the best sine wave fit and associated p value.
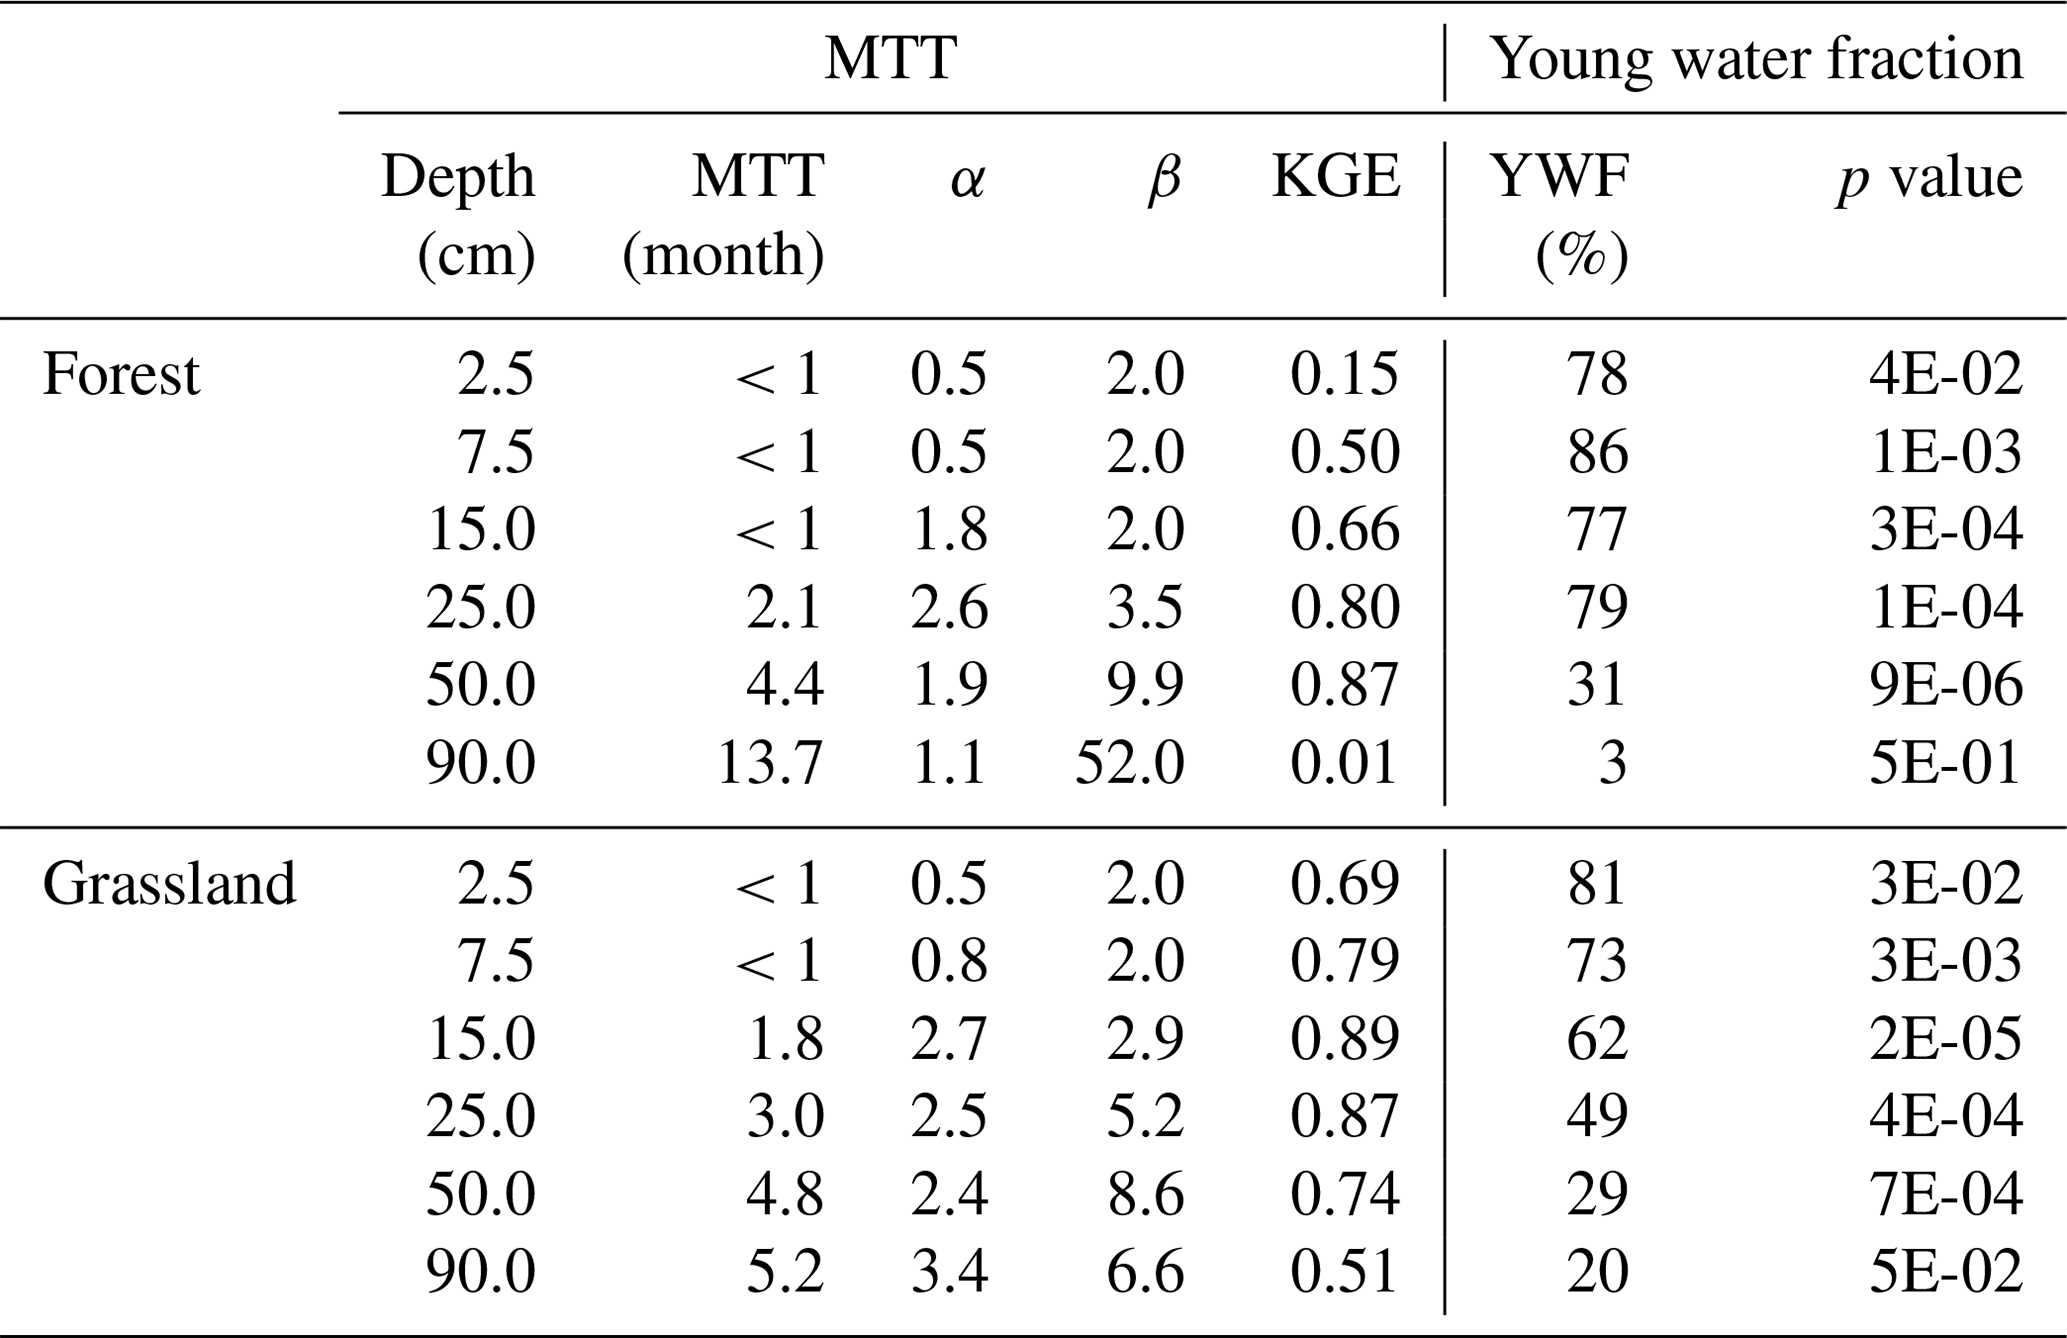
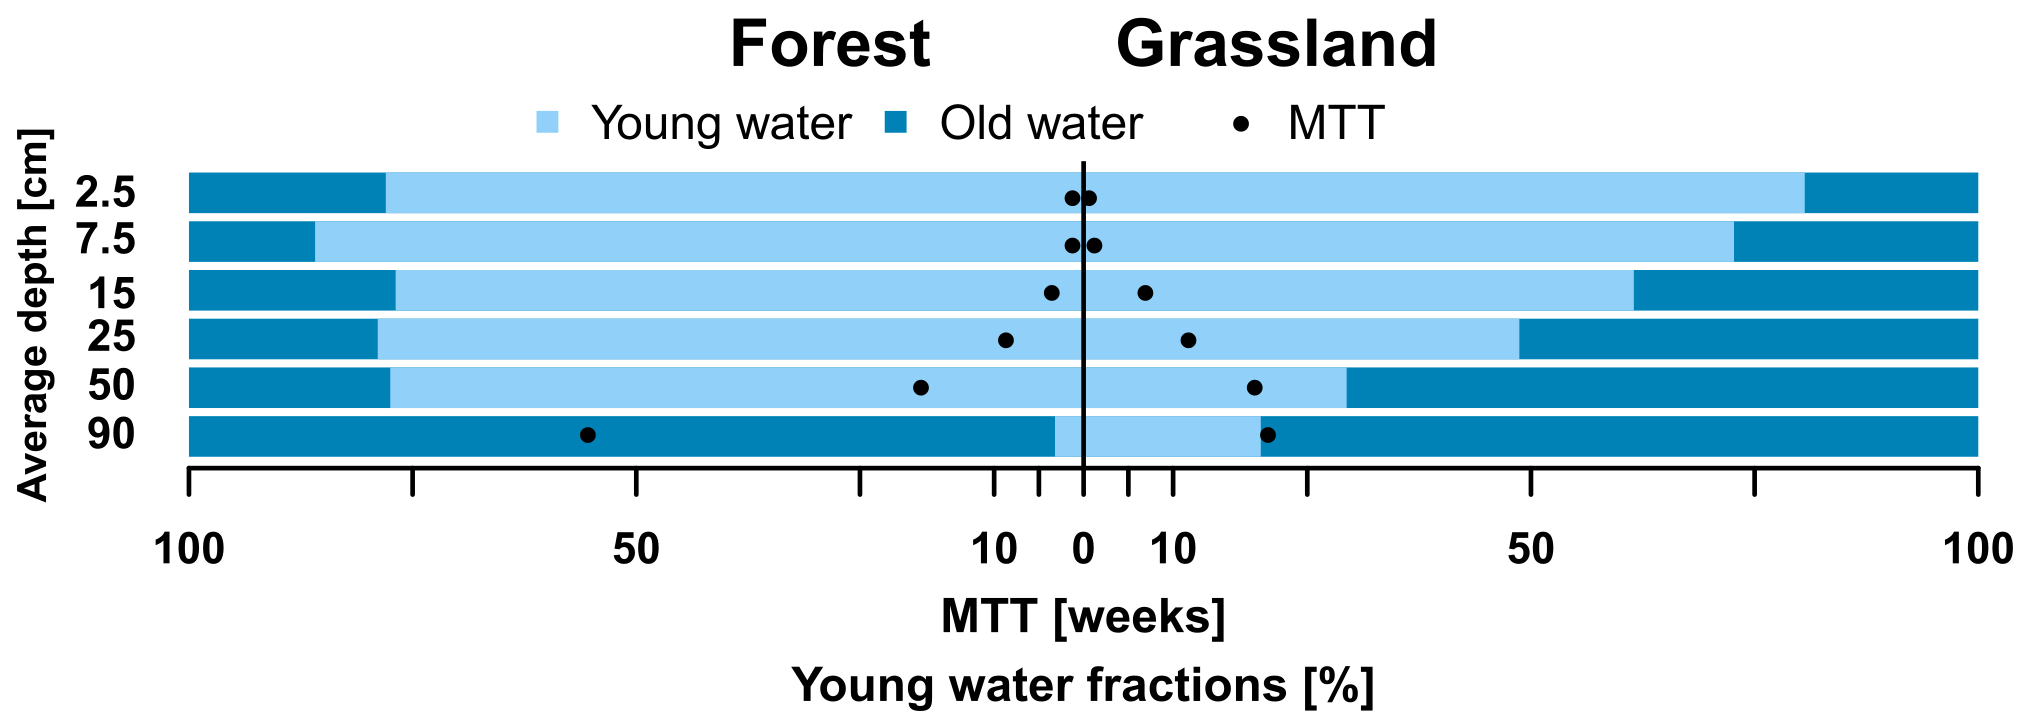
Figure 6Young water fractions (bars) and MTT (dots) per soil depths at forested and grassland sites.
Several soil layers returned the limits of the manually set parameter space for α, β, or both. Especially the upper two layers of GS and the upper three of the FA soil showed low values, resulting in MTT being less than a month. This underlines the preliminary nature of this analysis; despite this, the between and within-profile differences were insightful and broadly consistent with the more qualitative insights revealed in Fig. 5.
5.1 Drought and soil water storage
The climatic anomaly of 2018 provided us with the opportunity to study the impact of drought on different water cycle components of the Demnitz Millcreek catchment, particularly on soil water storage. Extensive personal communication with local weather-dependent farmers indicated that drought stress in the DMC left insufficient soil moisture to sustain crop demands and green water fluxes in cultivated areas, resulting in losses of agricultural yield that were up to 40 %. These numbers are applicable to the wider region of north-eastern Germany. The extreme conditions of the drought were reflected by meteorological anomalies (SPI, Table 1) and ecohydrological feedbacks (Fig. 2). The drought was characterised by low precipitation input (Fig. 2a), high temperatures (a), low soil water storage (b, c), declining groundwater levels (d), and streamflow cessation (d). Only the heavy rainfall in July prevented the drought from being much more severe, given the persistence of dry warm weather into the late autumn. We found that local observations in DMC were consistent with other, large-scale observations of the characteristics of the drought (Imbery et al., 2018). We observed differences of the drought dynamics under the FA and GS plots, which were expected considering the importance of vegetation for water cycling in the critical zone (e.g. Dubbert and Werner, 2019). Generally, soils under the forest were drier than the grassland, which likely reflects the greater interception and transpiration losses under forest that have been observed elsewhere in Brandenburg (Douinot et al., 2019). However, it is clear that differences in soil properties also result in greater moisture storage and retention in the more clay-rich upper profile of the grassland soil. Dynamics of PET and transpiration rates of oak trees (Fig. 2) imply that the trees were able to successfully sustain transpiration throughout this drought, as transpiration rates did not appear to be reduced relative to atmospheric demand (indexed by PET). Low soil water availability under the forest during drought conditions raises the question of the origin of the water transpired by oaks. Clearly, the high rainfall inputs in July, which replenished storage in the upper soil, were likely critical in enabling transpiration to continue through July and August via rapid recycling. However, oak trees may also be able to access deeper water sources (e.g. David et al., 2004) near the water table via deep roots (which were present at 1 m in the FA sampling plot). In addition, ecophysiologically based water-limitation tolerance has been observed in various oak species by Hahm et al. (2018). Heinrich et al. (2019) studied the regional impact of the 2018 drought on the lowland in north-eastern Germany. They found similar phenomena in the ecosystems, including low precipitation, streams drying out, crop yield losses, and low soil moisture content under forested sites.
5.2 Insights from water stable isotopes
Isotopes were key tools used in this study to assess the impact of the drought on different soil–vegetation assemblages. The direct equilibrium method applied used monthly destructive soil sampling to return stable isotope ratios in the soil bulk water molecules. This provided further insight into spatio-temporal patterns of water movement and mixing in the unsaturated zone (Fig. 5). Using heat maps, we were able to visualise qualitative patterns of site-specific advection and dispersion of the isotopic input signal from the soil–atmosphere interface down to 1 m. Further, the evaporation signal from the 2018 drought was apparent in the soil bulk water d-excess profiles at the forested and grassland sites in September and October. Summer soil evaporation in combination with precipitation deficits during the drought was likely the driving processes leading to the temporarily enriched (compared to recent precipitation) isotope signatures in the upper soils for September and October at both sites. The interception effects on δ18O and δ2H are limited in the Demnitz Millcreek catchment, probably mainly reflecting the precipitation characteristics and canopy structure, though the sampling interval may have masked short-term influences in rain events (Allen et al., 2017). Both sites showed a subsequent displacement and mixing of the bulk soil water isotopes signatures with incoming precipitation as re-wetting progressed in the autumn and early winter. However, the evolution of isotopic and d-excess signals in the unsaturated soil storage indicates differences between sites (Fig. 5). The forest soil being sandier and having little direct ground vegetation cover allowed a deeper penetration of the evaporation front and therefore more negative d-excess values at depths up to 30 cm. Limited transfer of d-excess effects to depths observed in this study is in accordance with findings of Sprenger et al. (2016). Lower soil moisture (and therefore water storage) in the forest (Fig. 2) likely led to a stronger Rayleigh fractionation effect on the remaining bulk soil water. Mixing with incoming precipitation resulted in moisture replenishment and rapid over-printing of the isotopic drought signal (d-excess) at both sites. We did not see a strong “memory” effect of the d-excess at individual soil depths on a monthly time step over the entire study period. The apparent contradiction between our findings and recent findings by Sprenger et al. (2019a), who reported consistently disjunct soil water pools, likely simply reflects different soil and climatic properties, leading to different hydrological pathways. Sprenger et al. (2018) described the bound soil water as water under different matric potentials. This has implications for the interpretation of interaction speeds between different water pools in the soil and their partitioning into green and blue water fluxes. Findings by Bowers et al. (2020) support the relatively fast time-dependent isotopic mixing of water held under different tensions in the matrix of sandy soils. A study in a controlled ecosystem (Evaristo et al., 2019) further highlights the importance of spatio-temporal dynamics in soil water for its partitioning and interpretation of resulting patterns.
5.3 Soil water response and travel times
We were also able to use the isotope time series to provide a first approximation of the travel times of water in the soil during the re-wetting phase. Despite the short data time series, fitting simple sine wave and gamma models (Fig. 6) provided useful insights into the spatial differences in the young water fraction and MTTs between, and within, the soil profiles of the two sites. As we sampled bulk soil water at only monthly intervals, the resulting values can only be regarded as indicative, but they capture the shift from dry to wet conditions. The upper soil layers are dominated by younger water (less than a month old) at both sites and age increases with depth (Fig. 6). Likely causes of the poor model fits of transit time distributions (TTDs) in the upper soil are evaporative fractionation and the sampling frequency being too coarse to capture the temporal resolution of these processes in the sandy soils. Furthermore, the bulk soil water sampling likely underestimates the effects of preferential flow, especially in the more heterogeneous upper horizons. Nevertheless, similar ages and differences were reported by Smith et al. (2020b) from a physically based tracer-aided ecohydrological modelling approach; this increases confidence that the results are instructive. We found a steady increase in age with depth at the grassland site and generally higher soil moisture content. These patterns were represented by higher α values in comparison to the FA site (Table 6), which implies a more piston-like flow through the soil profile. Similar patterns of increasing α values due to enhanced damping with depth in the profile were reported by Tetzlaff et al. (2014) in freely draining podzols in the Scottish Highlands. This down-profile change reflects a more consistent moisture flux to depth, which is characteristic of the grassland site. In contrast, the FA soil was more freely draining, and drier; hence, younger water could have a greater influence following rainfall events, even in the deeper soil layers. Substantially older soil water at 80 to 100 cm depth indicates more irregular groundwater recharge at the FA site, though the poor model fit here highlights the low variability in the isotopic composition of the deep forest soil and resulting uncertainty. These tracer-based inferences were supported by the soil moisture dynamics (Fig. 2b and c), which also indicated more frequent percolation to depth under grassland and a temporally limited (to winter) groundwater recharge under forest. Deeper soil bulk water that mainly represents groundwater recharge was older under the forested plot. This is in accordance with findings from tracer-aided modelling of water age dynamics under forest and grassland at another site in Brandenburg from Douinot et al. (2019). The displacement of the isotopic signal down the soil profile was not observed in d-excess, with limited “memory” effect of the drought 2018 with time and depth in both soils. But, despite the rapid recovery of the d-excess signal in the isotopic composition of bulk soil water, this was not indicative of drought recovery. With SPI values still low for longer averaging periods, the effects of the drought impact were still evident in the catchment. Streamflow did not recover until the beginning of 2019, and even then, flows were subsequently much lower than in the previous winter (Fig. 2). The dual-isotopic characteristics of groundwater (Fig. 3) suggest a well-mixed storage. The concurrence of the isotopic composition of this storage with the stream signal indicates that the DMC is a groundwater-fed stream. This is also consistent with recent analysis of the catchment flow data (Smith et al., 2020a) and is further supported by the temporal synchrony of streamflow reoccurrence and groundwater recovery (Fig. 2d). The drought intensity value (Table 2) still indicates a substantial deficit in soil and groundwater storage, reflecting incomplete re-wetting of the catchment at the end of the study period.
5.4 Wider implications
Sandy soil properties and weather-dependent farming make landscapes like the DMC vulnerable to droughts in a continental hydroclimate where dry, hot summers are likely to become more common. Understanding and managing soil moisture in the unsaturated zone of the catchment will be fundamentally important to developing land use strategies that will be resilient in the face of climatic warming. Both crops and trees (Amin et al., 2019) primarily rely on shallow soil moisture storage, and there is a clear trade-off between biological productivity, water use, and the maintenance of other ecosystem services such as groundwater recharge and river flow generation. It is important that management of croplands and forests is based on an understanding of how water is partitioned into green and blue water fluxes so that evidence-based decisions can be made that prioritise water use for the most important, sustainable societal needs. The ephemeral character of the DMC stream – which has been perennial in the past – during the drought underlined the failure in supporting blue water fluxes that can be of importance for habitat structure, connectivity, and water quality. For example, recent recolonisation of the catchments by beavers (Castor fiber) has had a major impact on flow regimes and water quality, changes that might not be sustained if the stream becomes ephemeral for longer periods (Smith et al., 2020a). The urgent need for greater understanding of water security is underlined by the alarming climate projections for the area (Lüttger et al., 2011). Climate change impacts are already cross-sectorally perceived by local land use managers in the North German Plain (Barkmann et al., 2017). The catchment failed to maintain normally expected green and blue water fluxes throughout the growing season and drought of 2018, which made ecosystem services and agricultural land use unsustainable. To improve system understanding and management strategies, further research is needed. The range of different land use types/soils has to be broadened to capture large-scale heterogeneity. Further, the obtained datasets have to be integrated in models to enable quantitative estimations, upscaling to larger areas and extrapolation in time and climatic contexts of these processes. On the basis of our work here, we would argue that insights from water stable isotopes could play a key role in this process. To exploit the potentials of water stable isotopes to gain process insight, studies on finer spatial–temporal resolutions are fundamental. Those field-based assessments in a natural setting are the basis for further evolution of water stable isotopes as tracers in hydrology. We propose that these studies should go hand in hand with methodological and model development.
We presented an assessment of the 2018 drought and associated ecohydrological feedbacks in a lowland headwater catchment in north-eastern Germany (DMC) using hydroclimatic data in conjunction with isotope-based techniques. The study focused on two plot sites with differing vegetation/soil communities during a period of water stress, when the catchment could no longer sustain blue water fluxes (e.g. streamflow) or green water needs (e.g. crop production) and the subsequent recovery. In general, the forest site “used” more water and was more freely draining and hence had drier soils. Nevertheless, the transpiration dynamics of oak trees showed some resilience towards drought conditions and appeared to meet atmospheric moisture demand. McGuire et al. (2002) calculated mean resident times under drought conditions from soil water isotopic signatures and highlighted that the results are influenced by the water extraction method (in their case zero-tension and tension lysimeters). We derived insight into the subsurface unsaturated storage dynamics by monitoring isotope ratios in bulk soil water which might be more representative of the plant-available subsurface water storage under drought conditions. Even with any limitation to this method we were able to derive a basic comparison of tentative water ages. This destructive sampling showed spatio-temporal distinctions in isotope distributions and water ages between the two sites. Water in the upper soil profile was dominated by relatively recent rainfall (< 2–3 months of age), with age increasing with depth to > 6 months. The deeper forest soil horizons appear to have only old water (∼ 1 year old). In contrast to the individual isotopic signature of soil water, which took some time to be erased by mixing with winter rainfall, no “memory” effect or displacement of the drought signal with depth was observed in d-excess. Re-occurrence of precipitation at the end of the study period revealed differences in groundwater recharge dynamics between plot sites, which was lower and more intermittent under the forest site. These patterns have potential implications for blue and green water management in such environments and should be investigated in a greater range of representative vegetation/soil units and should be included in modelling approaches (e.g. Smith et al., 2020b). This highlights the need for further research efforts on climate change and management adaptations in the critical zone of drought-sensitive lowland ecosystems, and isotopes will be useful tools in this process.
The data from the study are available from the corresponding author upon request.
The supplement related to this article is available online at: https://doi.org/10.5194/hess-24-3737-2020-supplement.
DT, CS, and LK designed the study. HW set up the sap-flow measurements and AWS helped with analysis. LK collected the data and carried out the fieldwork. AS helped with MTT analysis. LK performed the analysis and prepared the first draft of the manuscript. All the authors edited and commented on the manuscript.
The authors declare that they have no conflict of interest.
This article is part of the special issue “Water, isotope and solute fluxes in the soil–plant–atmosphere interface: investigations from the canopy to the root zone”. It is not associated with a conference.
This work was partly funded by the European Research Council (project GA 335910 VEWA). We acknowledge support by the German Research Foundation (DFG) and the Open Access Publication Fund of Humboldt-Universität zu Berlin. The authors are grateful to all colleagues involved in the sample collection (in particular Anna Wieland, Nina-Sophie Weiß, and Wiebke Lehmann), David Dubbert for support with the isotope analysis, as well as Thomas Rossoll for help with the measurement equipment. Larissa Lachmann helped with the GIS data and maps. We are thankful for on-site support and knowledge by the WLV (Wasser- und Landschaftspflegeverband Untere Spree). Michael Facklam (TU Berlin), Niko Rosskopf, and Arvid Markert (both LBGR Brandenburg) are also thanked for their help in soil sampling and characterisation.
This research has been supported by the European Research Council (grant no. VEWA (335910)).
This paper was edited by Miriam Coenders-Gerrits and reviewed by two anonymous referees.
Allen, R. G., Pereira, L. S., Raes, D., and Smith, M.: Crop evapotranspiration: Guidelines for computing crop water requirements, FAO Irrigation and drainage paper 56, Fao, 300, D05109, 1998. a
Allen, S. T., Keim, R. F., Barnard, H. R., McDonnell, J. J., and Renée Brooks, J.: The role of stable isotopes in understanding rainfall interception processes: a review, Wiley Interdiscip. Rev. Water, 4, e1187, https://doi.org/10.1002/wat2.1187, 2017. a
Allison, G. B. and Barnes, C. J.: Estimation of evaporation from non-vegetated surfaces using natural deuterium, Nature, 301, 143–145, https://doi.org/10.1038/301143a0, 1983. a
Amin, A., Zuecco, G., Geris, J., Schwendenmann, L., McDonnell, J. J., Borga, M., and Penna, D.: Depth distribution of soil water sourced by plants at the global scale: A new direct inference approach, Ecohydrology, 1–15, e2177, https://doi.org/10.1002/eco.2177, 2019. a
Barnes, C. J. and Allison, G. B.: Tracing of water movement in the unsaturated zone using stable isotopes of hydrogen and oxygen, J. Hydrol., 100, 143–176, https://doi.org/10.1016/0022-1694(88)90184-9, 1988. a
Barkmann, T., Siebert, R., and Lange, A.: Land-use experts' perception of regional climate change: an empirical analysis from the North German Plain, Clim. Change, 144, 287–301, https://doi.org/10.1007/s10584-017-2041-x, 2017. a
Bowers, W. H., Mercer, J. J., Pleasants, M. S., and Williams, D. G.: Combination of soil water extraction methods quantifies isotopic mixing of waters held at separate tensions in soil, Hydrol. Earth Syst. Sci. Discuss., https://doi.org/10.5194/hess-2019-687, in review, 2020. a
Brooks, R. J., Barnard, H. R., Coulombe, R., and McDonnell, J. J.: Ecohydrologic separation of water between trees and streams in a Mediterranean climate, Nat. Geosci., 3, 100–104, https://doi.org/10.1038/ngeo722, 2010. a
Bullen, T. D. and Kendall, C.: Tracing of Weathering Reactions and Water Flowpaths: A Multi-isotope Approach, in: Isot. Tracers Catchment Hydrol., edited by: Kendall, C. and McDonnell, J. J., chap. 18, pp. 611–646, https://doi.org/10.1016/B978-0-444-81546-0.50025-2, 1998. a
Craig, H.: Isotopic variations in meteoric waters, Science, 133, 1702–1703, 1961. a
Dansgaard, W.: Stable isotopes in precipitation, Tellus, 16, 436–468, https://doi.org/10.3402/tellusa.v16i4.8993, 1964. a, b
David, T. S., Ferreira, M. I., Cohen, S., Pereira, J. S., and David, J. S.: Constraints on transpiration from an evergreen oak tree in southern Portugal, Agric. For. Meteorol., 122, 193–205, https://doi.org/10.1016/j.agrformet.2003.09.014, 2004. a
Douinot, A., Tetzlaff, D., Maneta, M., Kuppel, S., Schulte-Bisping, H., and Soulsby, C.: Ecohydrological modelling with EcH2O-iso to quantify forest and grassland effects on water partitioning and flux ages, Hydrol. Process., 33, 2174–2191, https://doi.org/10.1002/hyp.13480, 2019. a, b
Dubbert, M. and Werner, C.: Water fluxes mediated by vegetation: emerging isotopic insights at the soil and atmosphere interfaces, New Phytol., 221, 1754–1763, https://doi.org/10.1111/nph.15547, 2019. a, b
Evaristo, J., Kim, M., van Haren, J., Pangle, L. A., Harman, C. J., Troch, P. A., and McDonnell, J. J.: Characterizing the Fluxes and Age Distribution of Soil Water, Plant Water, and Deep Percolation in a Model Tropical Ecosystem, Water Resour. Res., 55, 3307–3327, https://doi.org/10.1029/2018WR023265, 2019. a
Gaj, M. and McDonnell, J. J.: Possible soil tension controls on the isotopic equilibrium fractionation factor for evaporation from soil, Hydrol. Process., 33, 1629–1634, https://doi.org/10.1002/hyp.13418, 2019. a
Gelbrecht, J., Fait, M., Dittrich, M., and Steinberg, C.: Use of GC and equilibrium calculations of CO2 saturation index to indicate whether freshwater bodies in north-eastern Germany are net sources or sinks for atmospheric CO2, Fresenius. J. Anal. Chem., 361, 47–53, https://doi.org/10.1007/s002160050832, 1998. a
Geris, J., Tetzlaff, D., Mcdonnell, J., Anderson, J., Paton, G., and Soulsby, C.: Ecohydrological separation in wet, low energy northern environments? A preliminary assessment using different soil water extraction techniques, Hydrol. Process., 29, 5139–5152, https://doi.org/10.1002/hyp.10603, 2015. a
Goldsmith, G. R., Allen, S. T., Braun, S., Engbersen, N., González-Quijano, C. R., Kirchner, J. W., and Siegwolf, R. T.: Spatial variation in throughfall, soil, and plant water isotopes in a temperate forest, Ecohydrology, 12, e2059, https://doi.org/10.1002/eco.2059, 2019. a
Gralher, B., Herbstritt, B., Weiler, M., Wassenaar, L. I., and Stumpp, C.: Correcting for Biogenic Gas Matrix Effects on Laser-Based Pore Water-Vapor Stable Isotope Measurements, Vadose Zo. J., 17, 170157, https://doi.org/10.2136/vzj2017.08.0157, 2018. a, b
Granier, A.: Evaluation of transpiration in a Douglas-fir stand by means of sap flow measurements, Tree Physiol., 3, 309–320, 1987. a
Grant, G. E. and Dietrich, W. E.: The frontier beneath our feet Gordon, Water Resour. Res., 53, 2605–2609, https://doi.org/10.1029/eo066i003p00017-03, 2017. a
Gücker, B., Brauns, M., Pusch, M. T., Journal, S., American, N., Society, B., and June, N.: Effects of wastewater treatment plant discharge on ecosystem structure and function of lowland streams Effects of wastewater treatment plant discharge on ecosystem structure and function of lowland streams, J. North Am. Benthol. Soc., 25, 313–329, 2014. a
Gupta, H. V., Kling, H., Yilmaz, K. K., and Martinez-Baquero, G. F.: Decomposition of the Mean Squared Error & NSE Performance Criteria: Implications for Improving Hydrological Modelling, J. Hydrol., 2011, 1–9, 2009. a
Hahm, W. J., Dietrich, W. E., and Dawson, T. E.: Controls on the distribution and resilience of Quercus garryana: ecophysiological evidence of oak's water-limitation tolerance, Ecosphere, 9, e02218, https://doi.org/10.1002/ecs2.2218, 2018. a
Heinrich, I., Balanzategui, D., Bens, O., Blume, T., Brauer, A., Dietze, E., Gottschalk, P., Güntner, A., Katharina Harfenmeister, G. H., Hohmann, C., Itzerott, S., Kaiser, K., Liebner, S., Merz, B., Pinkerneil, S., Plessen, B., Sachs, T., Schwab, M. J., Spengler, D., Vallentin, C., and Wille, C.: Regionale Auswirkungen des Globalen Wandels: Der Extremsommer 2018 in Nordostdeutschland, Syst. Erde. GFZ-Journal, 9, 38–47, https://doi.org/10.2312/GFZ.syserde.09.01.6, 2019. a
Hendry, M. J., Schmeling, E., Wassenaar, L. I., Barbour, S. L., and Pratt, D.: Determining the stable isotope composition of pore water from saturated and unsaturated zone core: improvements to the direct vapour equilibration laser spectrometry method, Hydrol. Earth Syst. Sci., 19, 4427–4440, https://doi.org/10.5194/hess-19-4427-2015, 2015. a
Imbery, F., Friedrich, K., Fleckenstein, R., Kaspar, F., Ziese, M., Fildebrandt, J., and Schube, C.: Mai 2018: Zweiter monatlicher Temperaturrekord in Folge, regional mit Dürren und Starkniederschlägen, Tech. rep., DWD, available at: https://www.dwd.de/DE/leistungen/besondereereignisse/temperatur/20180604_bericht_mai2018.pdf (last acess: 22 July 2020), 2018. a, b
Kirchner, J. W., Feng, X., and Neal, C.: Catchment-scale advection and dispersion as a mechanism for fractal scaling in stream tracer concentrations, J. Hydrol., 254, 82–101, 2001. a
Klaus, J., Zehe, E., Elsner, M., Külls, C., and McDonnell, J. J.: Macropore flow of old water revisited: experimental insights from a tile-drained hillslope, Hydrol. Earth Syst. Sci., 17, 103–118, https://doi.org/10.5194/hess-17-103-2013, 2013. a
Koeniger, P., Gaj, M., Beyer, M., and Himmelsbach, T.: Review on soil water isotope-based groundwater recharge estimations, Hydrol. Process., 30, 2817–2834, https://doi.org/10.1002/hyp.10775, 2016. a
Kool, D., Agam, N., Lazarovitch, N., Heitman, J. L., Sauer, T. J., and Ben-gal, A.: A review of approaches for evapotranspiration partitioning, Agr. Forest Meteorol., 184, 56–70, 2014. a
Lüttger, A., Gerstengarbe, F.-W., Gutsch, M., Hattermann, F., Lasch, P., Murawski, A., Petraschek, J., Suckow, F., and Werner, P.: Klimawandel in der Region Havelland-Fläming, Tech. rep., 121, Potsdam-Institut für Klimafolgenforschung (PIK), 2011. a
McGuire, K. J., DeWalle, D. R., and Gburek, W. J.: Evaluation of mean residence time in subsurface waters using oxygen-18 fluctuations during drought conditions in the mid-Appalachians, J. Hydrol., 261, 132–149, https://doi.org/10.1016/S0022-1694(02)00006-9, 2002. a
McKee, T. B., Doesken, N. J., and Kleist, J.: The relationship of drought frequency and duration to time scales, in: Proceedings of the 8th Conference on Applied Climatology, vol. 17, 179–183, Boston, 1993. a
Mishra, A. K. and Singh, V. P.: A review of drought concepts, J. Hydrol., 391, 202–216, https://doi.org/10.1016/j.jhydrol.2010.07.012, 2010. a
Nitzsche, K. N., Kalettka, T., Premke, K., Lischeid, G., Gessler, A., and Kayler, Z. E.: Land-use and hydroperiod affect kettle hole sediment carbon and nitrogen biogeochemistry, Sci. Total Environ., 574, 46–56, https://doi.org/10.1016/j.scitotenv.2016.09.003, 2017. a
Nützmann, G., Wolter, C., Venohr, M., and Pusch, M.: Historical patterns of anthropogenic impacts on freshwaters in the Berlin-Brandenburg Region, Erde, 142, 41–64, 2011. a, b
Oerter, E. J. and Bowen, G. J.: Spatio-temporal heterogeneity in soil water stable isotopic composition and its ecohydrologic implications in semiarid ecosystems, Hydrol. Process., 33, 1724–1738, https://doi.org/10.1002/hyp.13434, 2019. a
Orlowski, N., Breuer, L., and Mcdonnell, J. J.: Critical issues with cryogenic extraction of soil water for stable isotope analysis, Ecohydrology, 9, 3–10, https://doi.org/10.1002/eco.1722, 2016. a
Orlowski, N., Breuer, L., Angeli, N., Boeckx, P., Brumbt, C., Cook, C. S., Dubbert, M., Dyckmans, J., Gallagher, B., Gralher, B., Herbstritt, B., Hervé-Fernández, P., Hissler, C., Koeniger, P., Legout, A., Macdonald, C. J., Oyarzún, C., Redelstein, R., Seidler, C., Siegwolf, R., Stumpp, C., Thomsen, S., Weiler, M., Werner, C., and McDonnell, J. J.: Inter-laboratory comparison of cryogenic water extraction systems for stable isotope analysis of soil water, Hydrol. Earth Syst. Sci., 22, 3619–3637, https://doi.org/10.5194/hess-22-3619-2018, 2018. a
Penna, D., Hopp, L., Scandellari, F., Allen, S. T., Benettin, P., Beyer, M., Geris, J., Klaus, J., Marshall, J. D., Schwendenmann, L., Volkmann, T. H. M., von Freyberg, J., Amin, A., Ceperley, N., Engel, M., Frentress, J., Giambastiani, Y., McDonnell, J. J., Zuecco, G., Llorens, P., Siegwolf, R. T. W., Dawson, T. E., and Kirchner, J. W.: Ideas and perspectives: Tracing terrestrial ecosystem water fluxes using hydrogen and oxygen stable isotopes – challenges and opportunities from an interdisciplinary perspective, Biogeosciences, 15, 6399–6415, https://doi.org/10.5194/bg-15-6399-2018, 2018. a
Rothfuss, Y. and Javaux, M.: Reviews and syntheses: Isotopic approaches to quantify root water uptake: a review and comparison of methods, Biogeosciences, 14, 2199–2224, https://doi.org/10.5194/bg-14-2199-2017, 2017. a
Smith, A., Tetzlaff, D., Gelbrecht, J., Kleine, L., and Soulsby, C.: Riparian wetland rehabilitation and beaver re-colonization impacts on hydrological processes and water quality in a lowland agricultural catchment, Sci. Total Environ., 699, 134302, https://doi.org/10.1016/j.scitotenv.2019.134302, 2020a. a, b, c, d, e, f
Smith, A., Tetzlaff, D., Kleine, L., Maneta, M., and Soulsby, C.: Isotope‐aided modelling of ecohydrologic fluxes and water ages under mixed land use in central Europe: the 2018 drought and its recovery, Hydrol. Process., 34, 3406–3425, https://doi.org/10.1002/hyp.13838, 2020b. a, b
Soulsby, C., Braun, H., Sprenger, M., Weiler, M., and Tetzlaff, D.: Influence of forest and shrub canopies on precipitation partitioning and isotopic signatures, Hydrol. Process., 31, 4282–4296, https://doi.org/10.1002/hyp.11351, 2017. a
Sprenger, M., Herbstritt, B., and Weiler, M.: Established methods and new opportunities for pore water stable isotope analysis, Hydrol. Process., 29, 5174–5192, https://doi.org/10.1002/hyp.10643, 2015. a, b, c, d
Sprenger, M., Leistert, H., Gimbel, K., and Weiler, M.: Illuminating hydrological processes at the soil-vegetation- atmosphere interface with water stable isotopes, Rev. Geophys., 54, 674–704, https://doi.org/10.1029/88EO01108, 2016. a
Sprenger, M., Tetzlaff, D., and Soulsby, C.: Soil water stable isotopes reveal evaporation dynamics at the soil-plant-atmosphere interface of the critical zone, Hydrol. Earth Syst. Sci., 21, 3839–3858, https://doi.org/10.5194/hess-21-3839-2017, 2017. a, b, c
Sprenger, M., Tetzlaff, D., Buttle, J., Laudon, H., Leistert, H., Mitchell, C. P., Snelgrove, J., Weiler, M., and Soulsby, C.: Measuring and Modeling Stable Isotopes of Mobile and Bulk Soil Water, Vadose Zo. J., 17, 170149, https://doi.org/10.2136/vzj2017.08.0149, 2018. a, b
Sprenger, M., Llorens, P., Cayuela, C., Gallart, F., and Latron, J.: Mechanisms of consistently disjunct soil water pools over (pore) space and time, Hydrol. Earth Syst. Sci., 23, 2751–2762, https://doi.org/10.5194/hess-23-2751-2019, 2019a. a
Sprenger, M., Stumpp, C., Weiler, M., Aeschbach, W., Allen, S. T., Benettin, P., Dubbert, M., Hartmann, A., Hrachowitz, M., Kirchner, J. W., McDonnell, J. J., Orlowski, N., Penna, D., Pfahl, S., Rinderer, M., Rodriguez, N., Schmidt, M., and Werner, C.: The Demographics of Water: A Review of Water Ages in the Critical Zone, Rev. Geophys., 57, 800–834, https://doi.org/10.1029/2018RG000633, 2019b. a
Stoate, C., Báldi, A., Beja, P., Boatman, N. D., Herzon, I., van Doorn, A., de Snoo, G. R., Rakosy, L., and Ramwell, C.: Ecological impacts of early 21st century agricultural change in Europe – A review, J. Environ. Manage., 91, 22–46, https://doi.org/10.1016/j.jenvman.2009.07.005, 2009. a
Stumpp, C. and Hendry, M. J.: Spatial and temporal dynamics of water flow and solute transport in a heterogeneous glacial till: The application of high-resolution profiles of δ18O and δ2H in pore waters, J. Hydrol., 438–439, 203–214, https://doi.org/10.1016/j.jhydrol.2012.03.024, 2012. a
Tetzlaff, D., Soulsby, C., Buttle, J., Capell, R., Carey, S. K., Laudon, H., Mcdonnell, J., Mcguire, K., Seibert, J., and Shanley, J.: Catchments on the cusp?, Structural and functional change in northern ecohydrology, Hydrol. Process., 27, 766–774, https://doi.org/10.1002/hyp.9700, 2013. a
Tetzlaff, D., Birkel, C., Dick, J., Geris, J., and Soulsby, C.: Storage dynamics in hydropedological units control hillslope connectivity, runoff generation, and the evolution of catchment transit time distributions, Water Resour. Res., 50, 969–985, https://doi.org/10.1002/2013WR014147, 2014. a, b
von Freyberg, J., Allen, S. T., Seeger, S., Weiler, M., and Kirchner, J. W.: Sensitivity of young water fractions to hydro-climatic forcing and landscape properties across 22 Swiss catchments, Hydrol. Earth Syst. Sci., 22, 3841–3861, https://doi.org/10.5194/hess-22-3841-2018, 2018. a
Wang, L., D'Odorico, P., Evans, J. P., Eldridge, D. J., McCabe, M. F., Caylor, K. K., and King, E. G.: Dryland ecohydrology and climate change: critical issues and technical advances, Hydrol. Earth Syst. Sci., 16, 2585–2603, https://doi.org/10.5194/hess-16-2585-2012, 2012. a
Wassenaar, L. I., Hendry, M. J., Chostner, V. L., and Lis, G. P.: High resolution pore water δ2H and δ18O measurements by H2O(liquid)-H2O(vapor) equilibration laser spectroscopy, Environ. Sci. Technol., 42, 9262–9267, https://doi.org/10.1021/es802065s, 2008. a, b
Wookey, P. A., Aerts, R., Bardgett, R. D., Baptist, F., Bråthen, K., Cornelissen, J. H., Gough, L., Hartley, I. P., Hopkins, D. W., Lavorel, S., and Shaver, G. R.: Ecosystem feedbacks and cascade processes: Understanding their role in the responses of Arctic and alpine ecosystems to environmental change, Glob. Chang. Biol., 15, 1153–1172, https://doi.org/10.1111/j.1365-2486.2008.01801.x, 2009. a
Xiao, W., Wei, Z., and Wen, X.: Evapotranspiration partitioning at the ecosystem scale using the stable isotope method – A review, Agric. For. Meteorol., 263, 346–361, https://doi.org/10.1016/j.agrformet.2018.09.005, 2018. a