the Creative Commons Attribution 4.0 License.
the Creative Commons Attribution 4.0 License.
 | 16 Jul 2020
Irrigation return flow causing a nitrate hotspot and denitrification imprints in groundwater at Tinwald, New Zealand
Michael Kilgour Stewart
Philippa Lauren Aitchison-Earl
Nitrate concentrations in groundwater have been historically high (N≥11.3 mg L−1) in an area surrounding Tinwald, Ashburton, since at least the mid-1980s. The local community is interested in methods to remediate the high nitrate in groundwater. To do this, they need to know where the nitrate is coming from. Tinwald groundwater exhibits two features stemming from irrigation with local groundwater (i.e. irrigation return flow). The first feature is increased concentrations of nitrate (and other chemicals and stable isotopes) in a “hotspot” around Tinwald. The chemical concentrations of the groundwater are increased by recirculation of water already relatively high in chemicals. The irrigation return flow coefficient C (irrigation return flow divided by irrigation flow) is found to be consistent with the chemical enrichments. The stable isotopes of the groundwater show a similar pattern of enrichment by irrigation return flow of up to 40 % and are also enriched by evaporation (causing a loss of about 5 % of the original water mass). Management implications are that irrigation return flow needs to be taken into account in modelling of nitrate transport through soil–groundwater systems and in avoiding overuse of nitrate fertiliser leading to greater leaching of nitrate to the groundwater and unnecessary economic cost. The second feature is the presence of “denitrification imprints” (shown by enrichment of the δ15N and values of nitrate) in even relatively oxic groundwaters. The denitrification imprints can be clearly seen because (apart from denitrification) the nitrate has a blended isotopic composition due to irrigation return flow and N being retained in the soil–plant system as organic N. The nitrate concentration and isotopic compositions of nitrate are found to be correlated with the dissolved oxygen (DO) concentration. This denitrification imprint is attributed to localised denitrification in fine pores or small-scale physical heterogeneity where conditions are reducing. The implication is that denitrification could be occurring where it is not expected because groundwater DO concentrations are not low.
- Article
(11810 KB) - Full-text XML
- BibTeX
- EndNote


Excessive nitrate concentrations in groundwater are of great concern for human health and for the environment. New Zealand drinking-water standards set a maximum acceptable value (MAV) for nitrate at 50 mg L−1 (equivalent to nitrate nitrogen of 11.3 mg L−1), based on the risk to bottle-fed babies (Ministry of Health, 2008), in line with the WHO (World Health Organization) guidelines (WHO, 2016, 2017). Hereafter in this paper “nitrate” is quantified as concentrations of nitrate N in milligrams per litre. Concerning health, the Canterbury Plains in New Zealand (Fig. 1a) has several “high-risk” areas where nitrate concentrations in shallow groundwater are above MAV most or all of the time (Scott et al., 2020). Regarding the environment, eutrophication causing hypoxia and algal blooms, due primarily to agricultural runoff of excess nutrients, is considered the most prevalent water quality problem globally (OECD, 2017). In New Zealand the N balance worsened (i.e. became more positive) more than in any other OECD (Organisation for Economic Co-operation and Development) member country between 1998 and 2009, almost entirely because of expansion and intensification of farming (OECD, 2013). The N balance is the difference between N inputs to farming systems (fertiliser and livestock manure) and N outputs (crop and pasture production); a positive N balance indicates a build-up of N and increased potential for N pollution of soil, water, and air. Pastoral farming has increased rapidly in recent years worldwide and especially in New Zealand. For example, dairy-farming acreage on the Canterbury Plains (Fig. 1a) increased from 20 000 to 190 000 ha between 1990 and 2009 (Pangborn and Woodford, 2011). Because nitrate can be toxic for aquatic life at lower levels than MAV, the New Zealand Government set a maximum median for nitrate N of 6.9 mg L−1 for river systems.
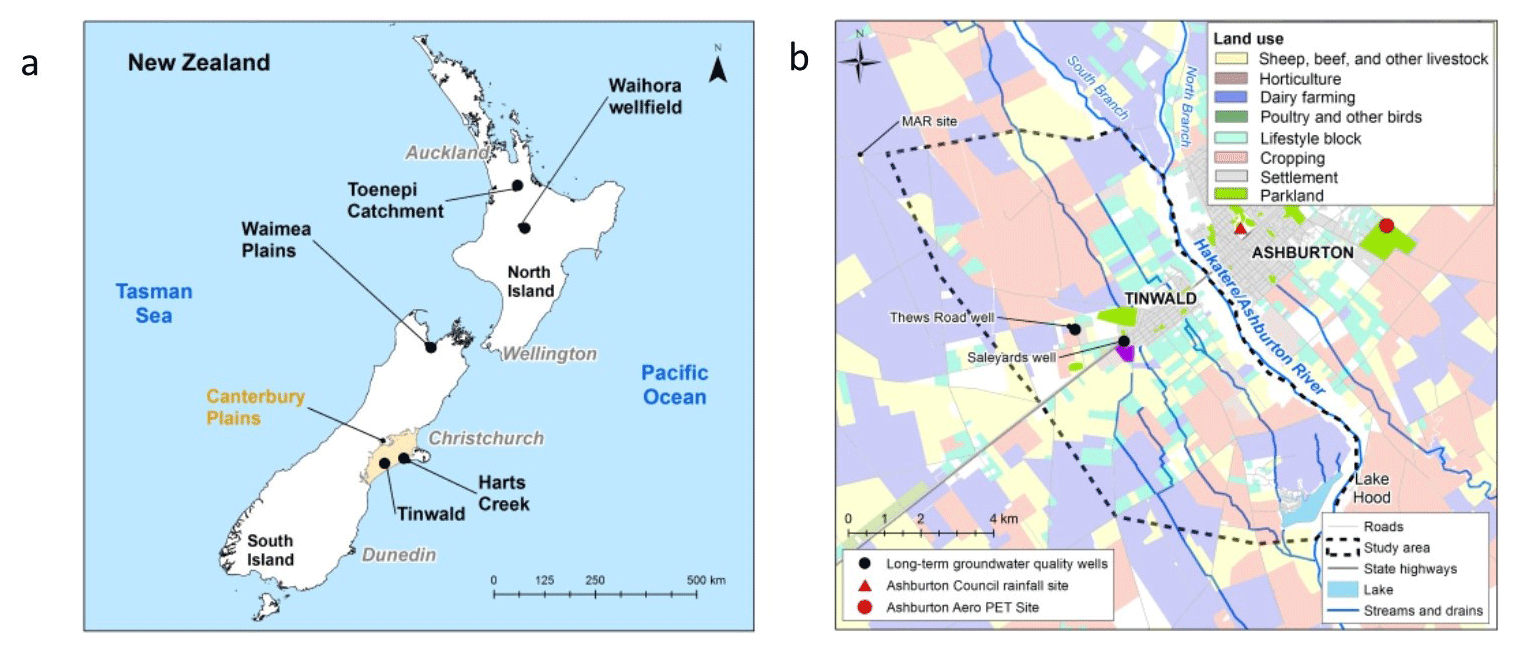
Figure 1(a) New Zealand map showing locations of Tinwald and other areas mentioned in the text. (b) Tinwald study area with simplified land usage (Agribase, 2016). Base map containing road and stream information © LINZ (2019). PET: potential evapotranspiration.
Nitrate concentrations in groundwater in the Tinwald area have historically been high, commonly greater than 11.3 mg L−1 within an area approximately 3 km wide and 11 km long (Fig. 1b). The high values are due to the history of land use in the area, but the Tinwald values are accentuated because the area is irrigated with local groundwater which has relatively high nitrate concentrations (N can have concentrations >11.3 mg L−1), whereas surrounding areas are irrigated with alpine-river water with low nitrate concentrations (N<1 mg L−1). The terms “irrigation return flow” (e.g. Chakraborty et al., 2015) and “groundwater recirculation” (Brown et al., 2011) are often applied to situations where irrigation is from water that has been pumped from the underlying aquifer. This situation is common around the world, sometimes with unrecognised effects on chemical concentrations (Sánchez Pérez et al., 2003; Park et al., 2018). An important and well-recognised example of the effects of irrigation return flow is non-point-sourced arsenic pollution in the groundwater of the Bengal basin, regarded as one of the largest public-health concerns in human history (Edmunds et al., 2015).
Irrigation return flow has important implications for water resource management as regards understanding and modelling of nitrate transport in groundwater systems. Much effort is being expended to model the effects of nitrate produced by farming practices in order to substantiate the introduction of appropriate controls on farming to protect the water supplies of downstream communities (e.g. Environmental Canterbury, 2020). Irrigation return flow can seriously distort such modelling by extending the timescale of nitrate transport by abstracting water from groundwater downstream and applying it upstream and also by adding nitrate on a second pass through the soil. This work examines the chemical and isotopic compositions of Tinwald groundwater to look for signatures attributable to irrigation return flow and how it contributes to the nitrate hotspot at Tinwald. Similar effects are expected to be important for many other locations in agricultural areas throughout the world.
Irrigation return flow also appears to contribute to an enhanced denitrification imprint in groundwater at Tinwald, where denitrification imprints are discernible in even reasonably oxic groundwaters. The stable isotopes of nitrate (15N and ) have often been used to investigate both the sources of the nitrate and its natural attenuation via denitrification (i.e. microbial reduction of nitrate) (e.g. Kendall, 1998; Wexler et al., 2014; Park et al., 2018; Spalding et al., 2019). Understanding the sources of nitrate is important for remediation of excessive nitrate concentrations as at Tinwald (Aitchison-Earl, 2019). Natural attenuation of nitrate via denitrification is a vital eco-service to the environment, and comparison of estimates of nitrate loss by leaching from the bottom of the root zone in catchments compared with the outflow of nitrate from streams shows that considerable attenuation of nitrate occurs in the vadose-zone–groundwater continuum. However, little is known about the detailed processes affecting nitrate transport and fate in this region (Clague et al., 2015; Wells et al., 2016; Stenger et al., 2018; Burbery, 2018). In summary, the objectives of this paper are to investigate the role of irrigation return flow in
-
accentuating the nitrate hotspot at Tinwald and
-
producing denitrification imprints in relatively oxic groundwaters.
2.1 Geohydrologic setting
The study area centres around the small town of Tinwald (population 3000) situated on the south bank of the Hakatere/Ashburton River and located on the large coalescing alluvial plain known as the “Canterbury Plains” (Fig. 1a). The Canterbury Plains were built up by rivers fed by glaciers over several million years. Deposition in the Tinwald area (Fig. 1b) was mainly by the South Branch Hakatere/Ashburton River and its ancestors (Barrell et al., 1996). The alluvial deposits are poorly stratified greywacke gravel dominated with silts and sands which become finer towards the coast. Oil well exploration drilling and seismic surveys of the Ashburton–Hinds areas indicate thicknesses of over 1000 m of alluvial gravels overlying marine sediments (Jongens et al., 2012).
Existing wells in the Tinwald study area are almost all less than 100 m, and over half are less than 40 m deep (Aitchison-Earl, 2019). Wells are generally screened within post-glacial (Holocene) or last-glacial (late Quaternary) deposits. Shallow wells and springs are common close to the river, within the Holocene age deposits. There is little geological impedance for movement of groundwater between shallower and deeper screened wells.
The regional groundwater flow direction is parallel to the Hakatere/Ashburton River. State Highway 1 runs through the study area (Fig. 1b) and was originally built to take advantage of drier conditions at the inland point of the old “Hinds swamp”. The swamp has been largely drained but influences soil types, with deeper, poorly drained organic soils with less leaching and greater denitrification potential located coastwards of the highway. Soils are lighter and more freely draining with greater nitrate leaching risk inland of the highway and adjacent to the Hakatere/Ashburton River (Landcare Research, 2015).
In the Tinwald study area, groundwater in two wells with depths less than 50 m had mean residence times of 12 and 63 years based on CFC (chlorofluorocarbon) and tritium measurements (Stewart et al., 2002; van der Raaij, 2013). Groundwater residence times generally increase with depth in other wells in the greater Ashburton area. A trial site for managed aquifer recharge (MAR) has been operating since 2016 just outside of the study area (Fig. 1b).
2.2 Hydrology
The closest long-term rainfall site is part of a climate station at Ashburton Council (Fig. 1b). Annual average rainfall at Ashburton Council is around 730 mm (measured between 1909 and 2017), ranging from 382 to 1147 mm. There is little seasonality in rainfall, which averages 61 mm a month. Groundwater recharge was reported by Thorpe and Scott (1999) based on lysimeter measurements of soil drainage at Winchmore (10 km north of Ashburton; Fig. 2). In the 10-year period (1961–1971), average recharge was 293.5 mm yr−1 with average rainfall of 730 mm yr−1 and potential evapotranspiration (PET) of 765 mm yr−1. Average monthly recharge was much higher in winter months (April to September). Winchmore soil is described as Lismore stony silt loam characteristic of that at Tinwald west of Highway 1 and much of the Canterbury Plains.
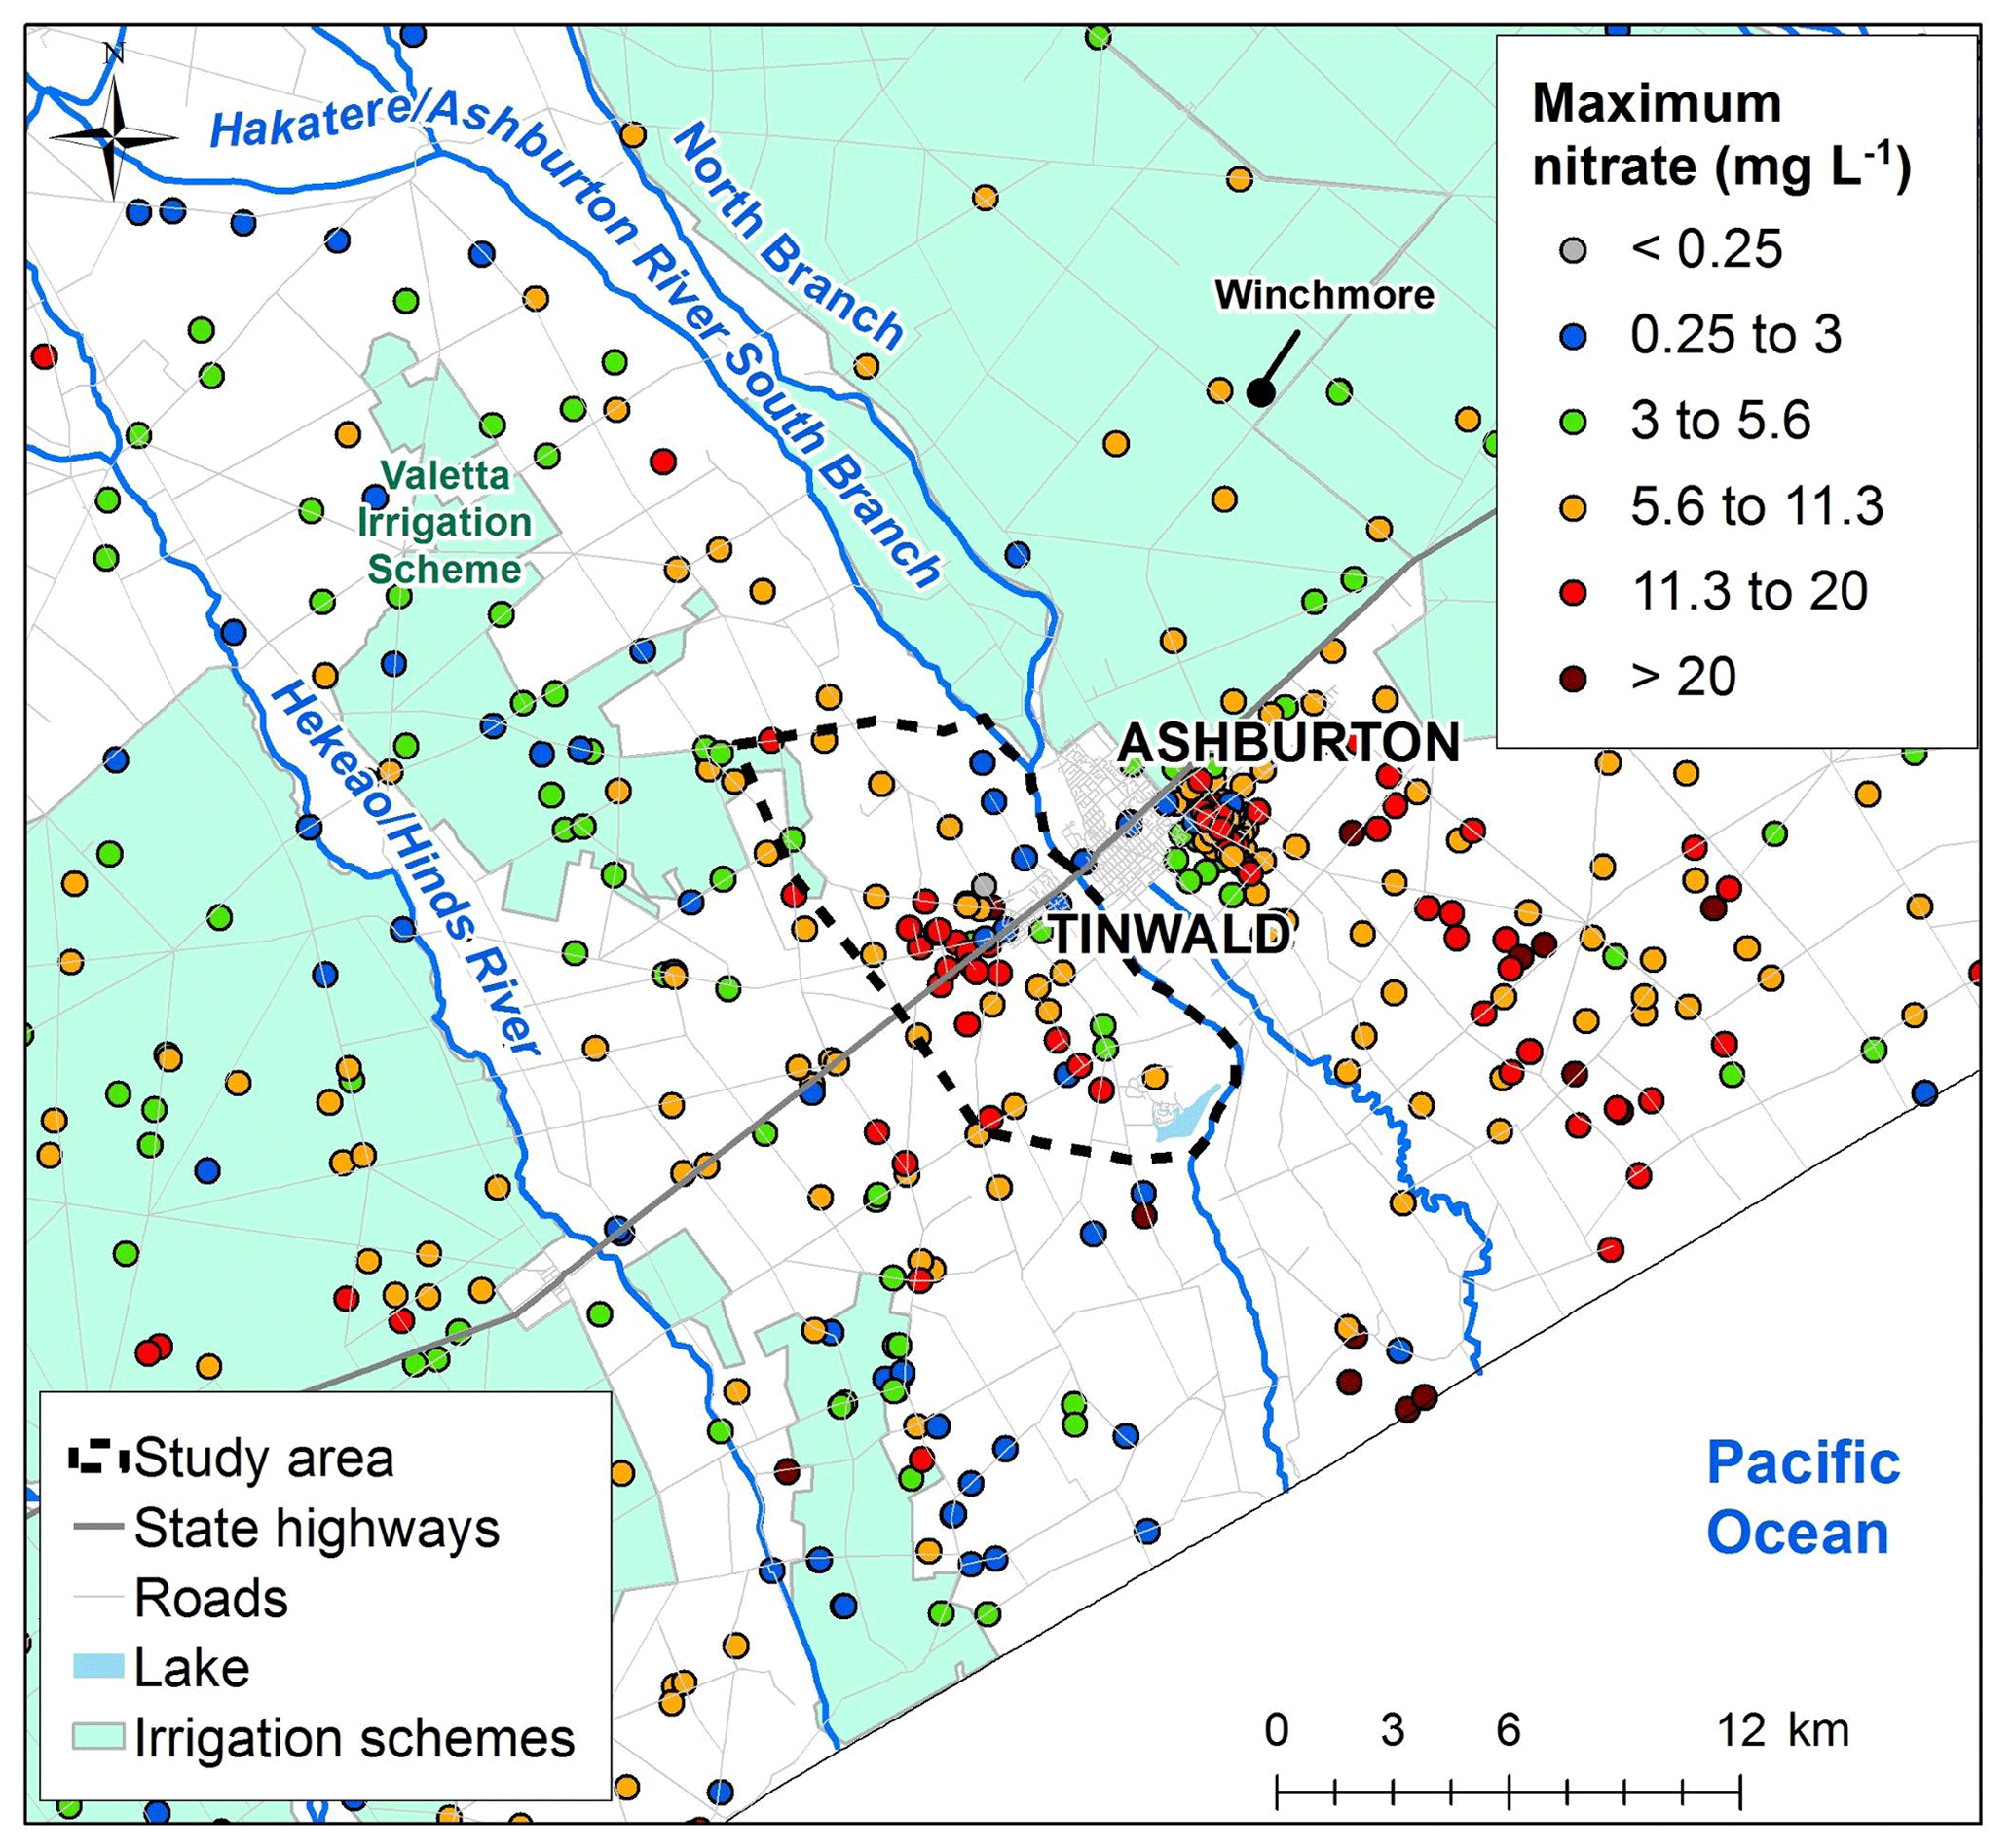
Figure 2Maximum nitrate concentrations in the greater Ashburton area from 1990 to 2017. Base map © LINZ (2019).
The Hakatere/Ashburton River has a north and south branch sourced from the Canterbury ranges which converge at the north of the study area. The Hakatere/Ashburton River interacts with local groundwater, losing and gaining water along its length. Flow is lost to groundwater from the South Branch and gains towards the confluence with the North Branch.
Springs and wetlands indicate areas where the water table is naturally close to the surface and groundwater discharge is occurring. Many springs are found in the Hakatere/Ashburton River catchment and often occur in relict river channels (Aitchison-Earl, 2000). In the study area, Carters Creek and Laghmor Creek are both sourced from springs, and there are springs above Lake Hood that flow into the lake (Fig. 1b).
2.3 Land and groundwater use
Cropping has been a major land use in the Tinwald area since at least the early 1940s (Fig. 1b; Engelbrecht, 2005). Most of the area is not part of any of the major surface water irrigation schemes, so irrigation was developed from groundwater sources within the area from the 1980s. Cultivation and fertiliser practice in cropping has an impact on the amount of nitrate that is leached from the soil to the groundwater. Winter is the most likely time for leaching to occur due to saturated soils and less nitrogen being used by crops. Nitrogen-fixing clover crops have been used less over time with an increase in commercial fertilisers (predominantly urea). Point sources of nitrate and other contaminants include septic tanks (human effluent), dairy and other animal effluent, and storm water and contaminated water.
Groundwater use in the Tinwald area is mainly for irrigation and for domestic and stock water supply. The Valetta Irrigation Scheme extends to the edge of the study area in the northwest and sources water from the braided alpine Rangitata River to the south (Figs. 2 and 4).
2.4 Nitrate concentrations
Consistently high nitrate concentrations (greater than MAV of 11.3 mg L−1) in groundwater were first identified in the Tinwald area in 2002 (Hanson, 2002). Maximum recorded nitrate concentrations from all samples between 1990 and 2017 are shown in Fig. 2. In general, lower nitrate concentrations occur close to the rivers and under and downgradient of surface water irrigation schemes (less than 1∕2 MAV of 5.6 mg L−1). This is because of dilution by river-sourced water, which is lower in nitrate. Nitrate concentrations are higher in areas with local-groundwater recharge such as Tinwald (>11.3 mg L−1). Nitrate concentrations are lower towards the coast in the old Hinds swamp southeast of State Highway 1 (SH1) (<5.6 mg L−1), where the lower nitrate concentrations are driven by reducing conditions which facilitate denitrification (Hanson and Abraham, 2010). (Note that there are elevated nitrate levels – >11.3 mg L−1 – outside the study area from the east side of Ashburton to the coast, which are the result of historic leaching from meat-processing plants and general agricultural land use. These are not part of this study.)
Nitrate concentrations have increased over time in the Tinwald area, with two long-term monitoring sites (Thews Road and Saleyards wells; Fig. 1b) having statistically significant (p<0.05) upwards trends of 0.44 and 0.29 mg L−1 yr−1 since monitoring began in 1995 (Aitchison-Earl, 2019).
3.1 Sampling
A total of 33 wells were sampled in the study area between 7 February and 14 March 2018 (Fig. 3); 13 of the wells had been sampled in 2004, and others were selected to fill gaps at a range of well depths. Groundwater levels were regionally high at the time of sampling following a sustained period of low levels (Aitchison-Earl, 2019). A large rainfall event of over 100 mm occurred during the sampling period on 21 February, leading to an increase in river flow.
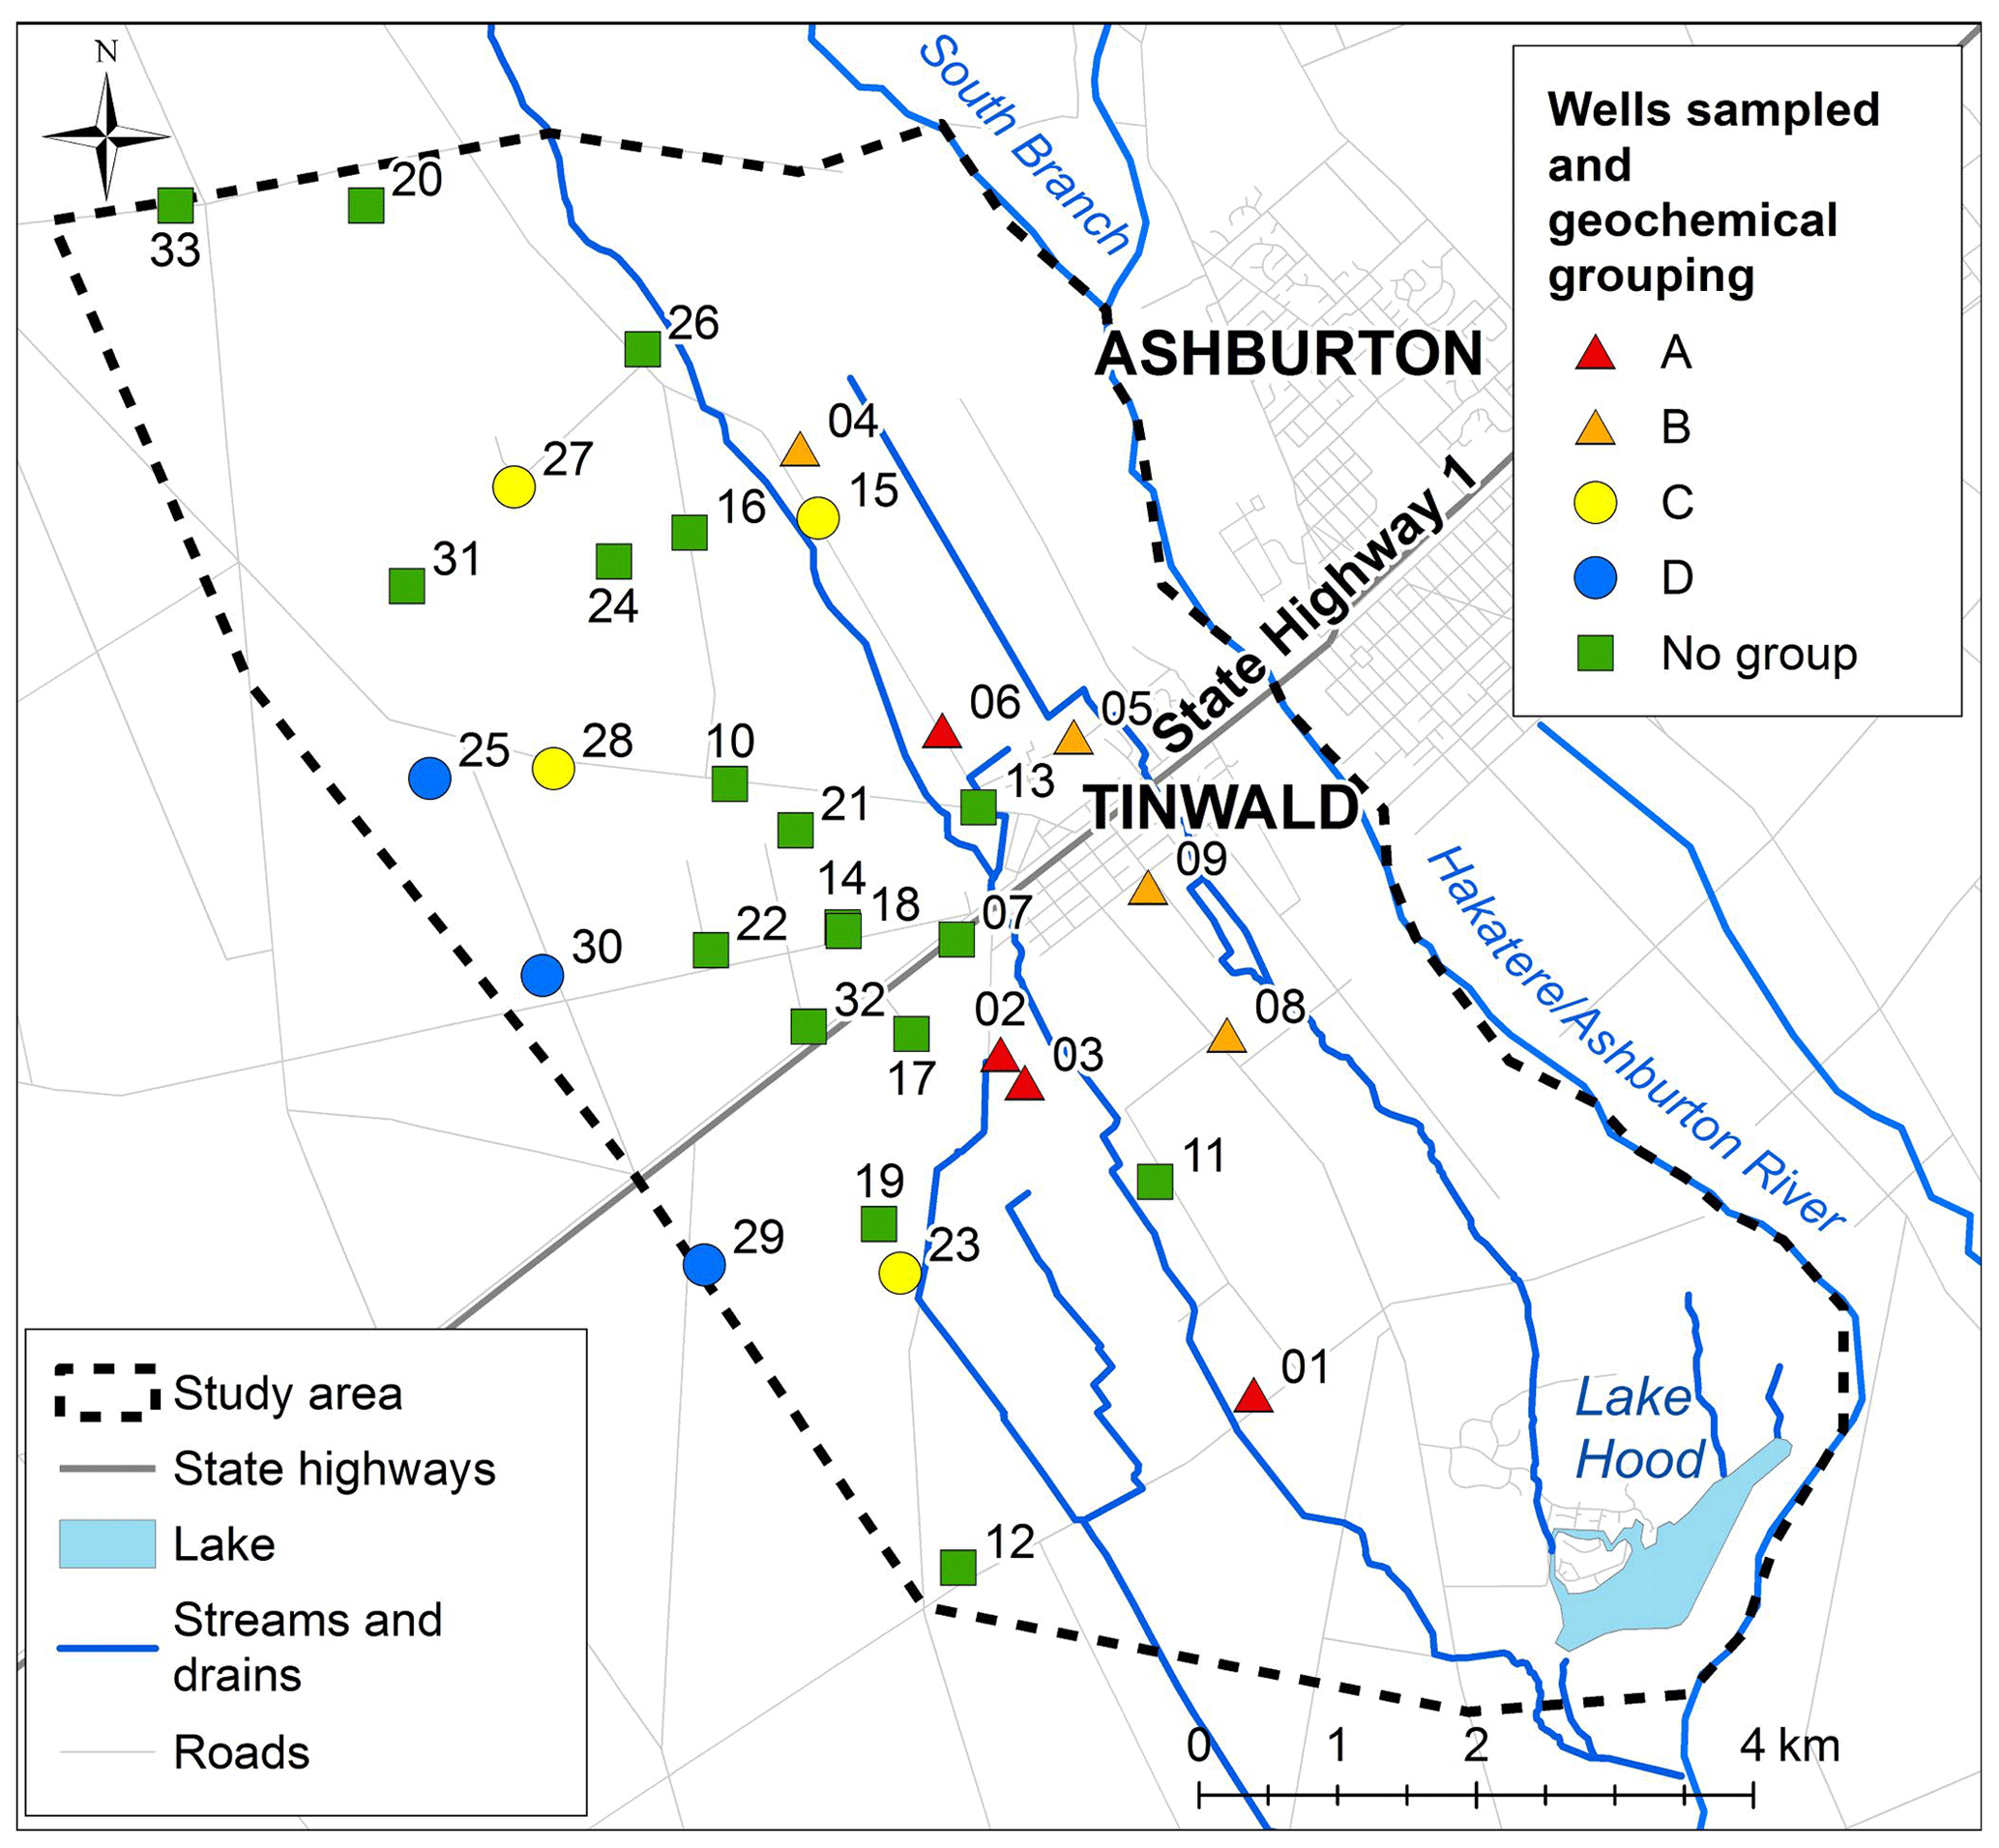
Figure 3Wells sampled in the Tinwald study area for this study. Base map © LINZ (2019).
Information on the wells is given in Table 1. Screened intervals and mid-screen depths are given for screened wells; total well depths are given where the wells have no screens. A total of 52 % of the wells had short screens (average 2 m length); 21 % had long screens (average 10 m length); and 27 % had no screens. Field measurements had stabilised for all wells before sampling. A total of 25 wells were purged of at least three well-casing volumes before sampling, and the 8 remaining wells were sampled by low-flow methods (pumps were lowered into the wells, and water was sampled after the pipes had been purged of three pipe volumes).
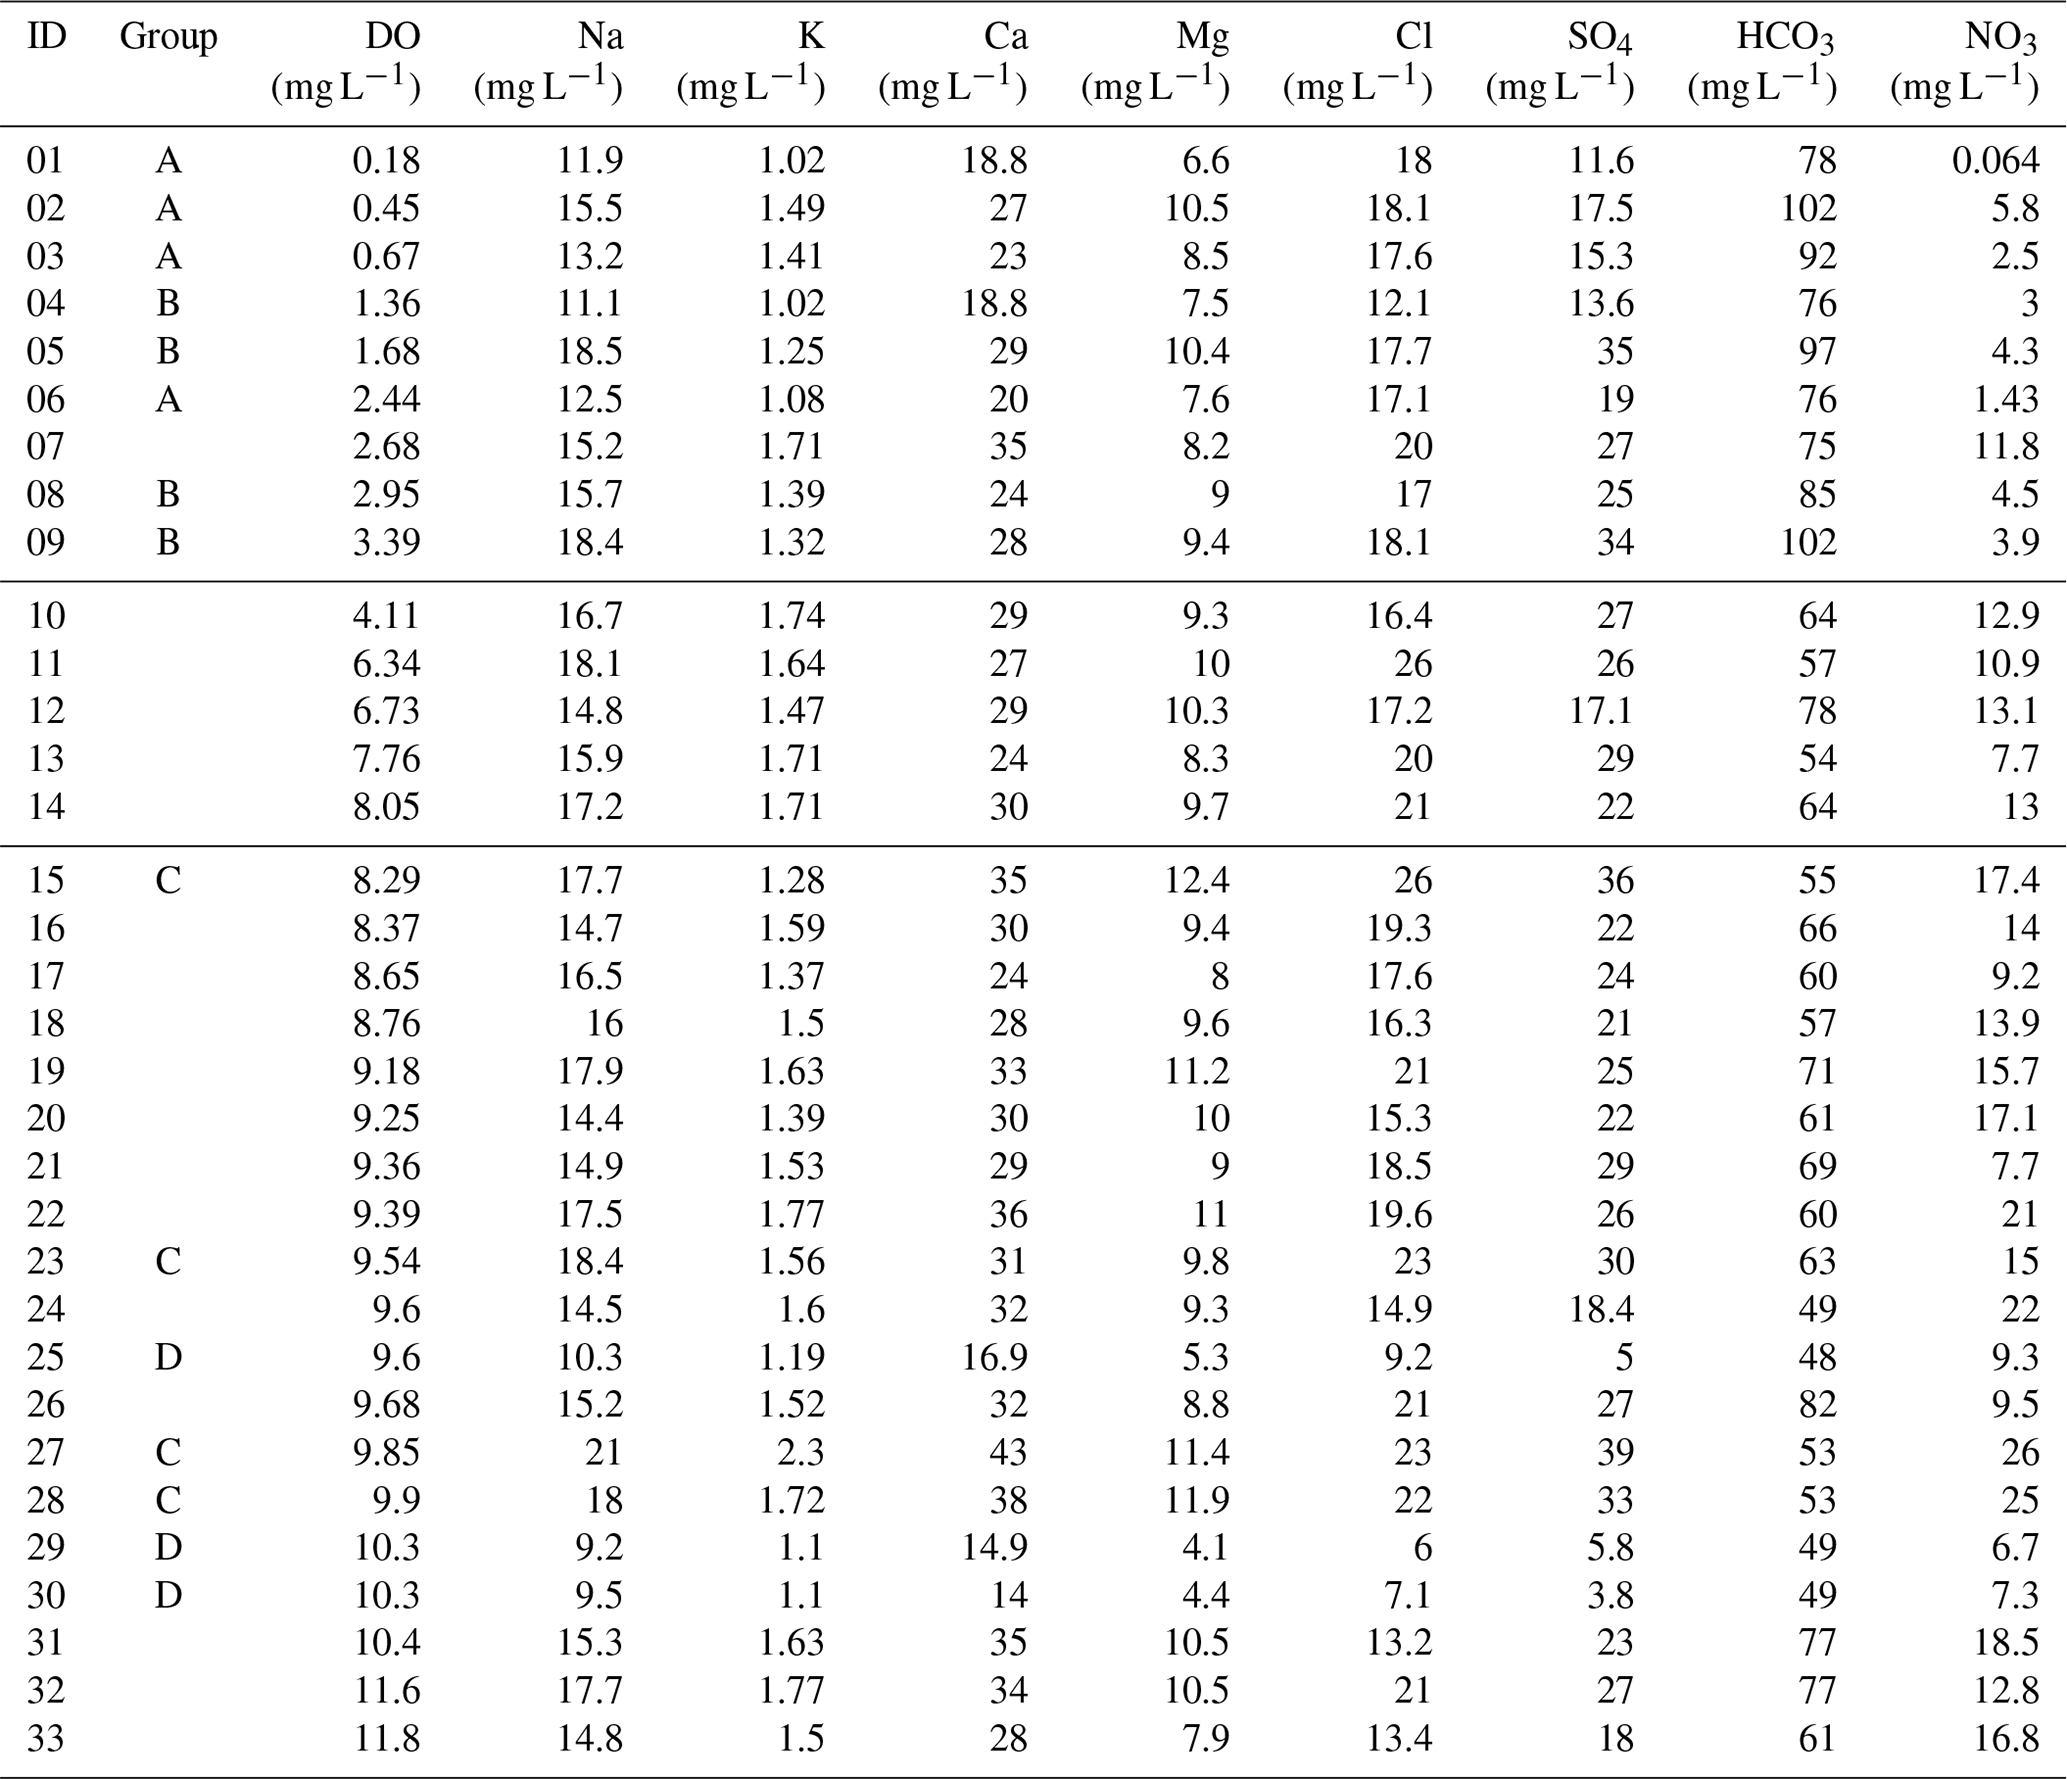
Table 1Sample and well information, field dissolved oxygen concentration (DO), and isotopes of water and nitrate. The wells are ordered from lowest to highest DO concentrations, and four groups of samples (A to D) are identified for discussion (below).
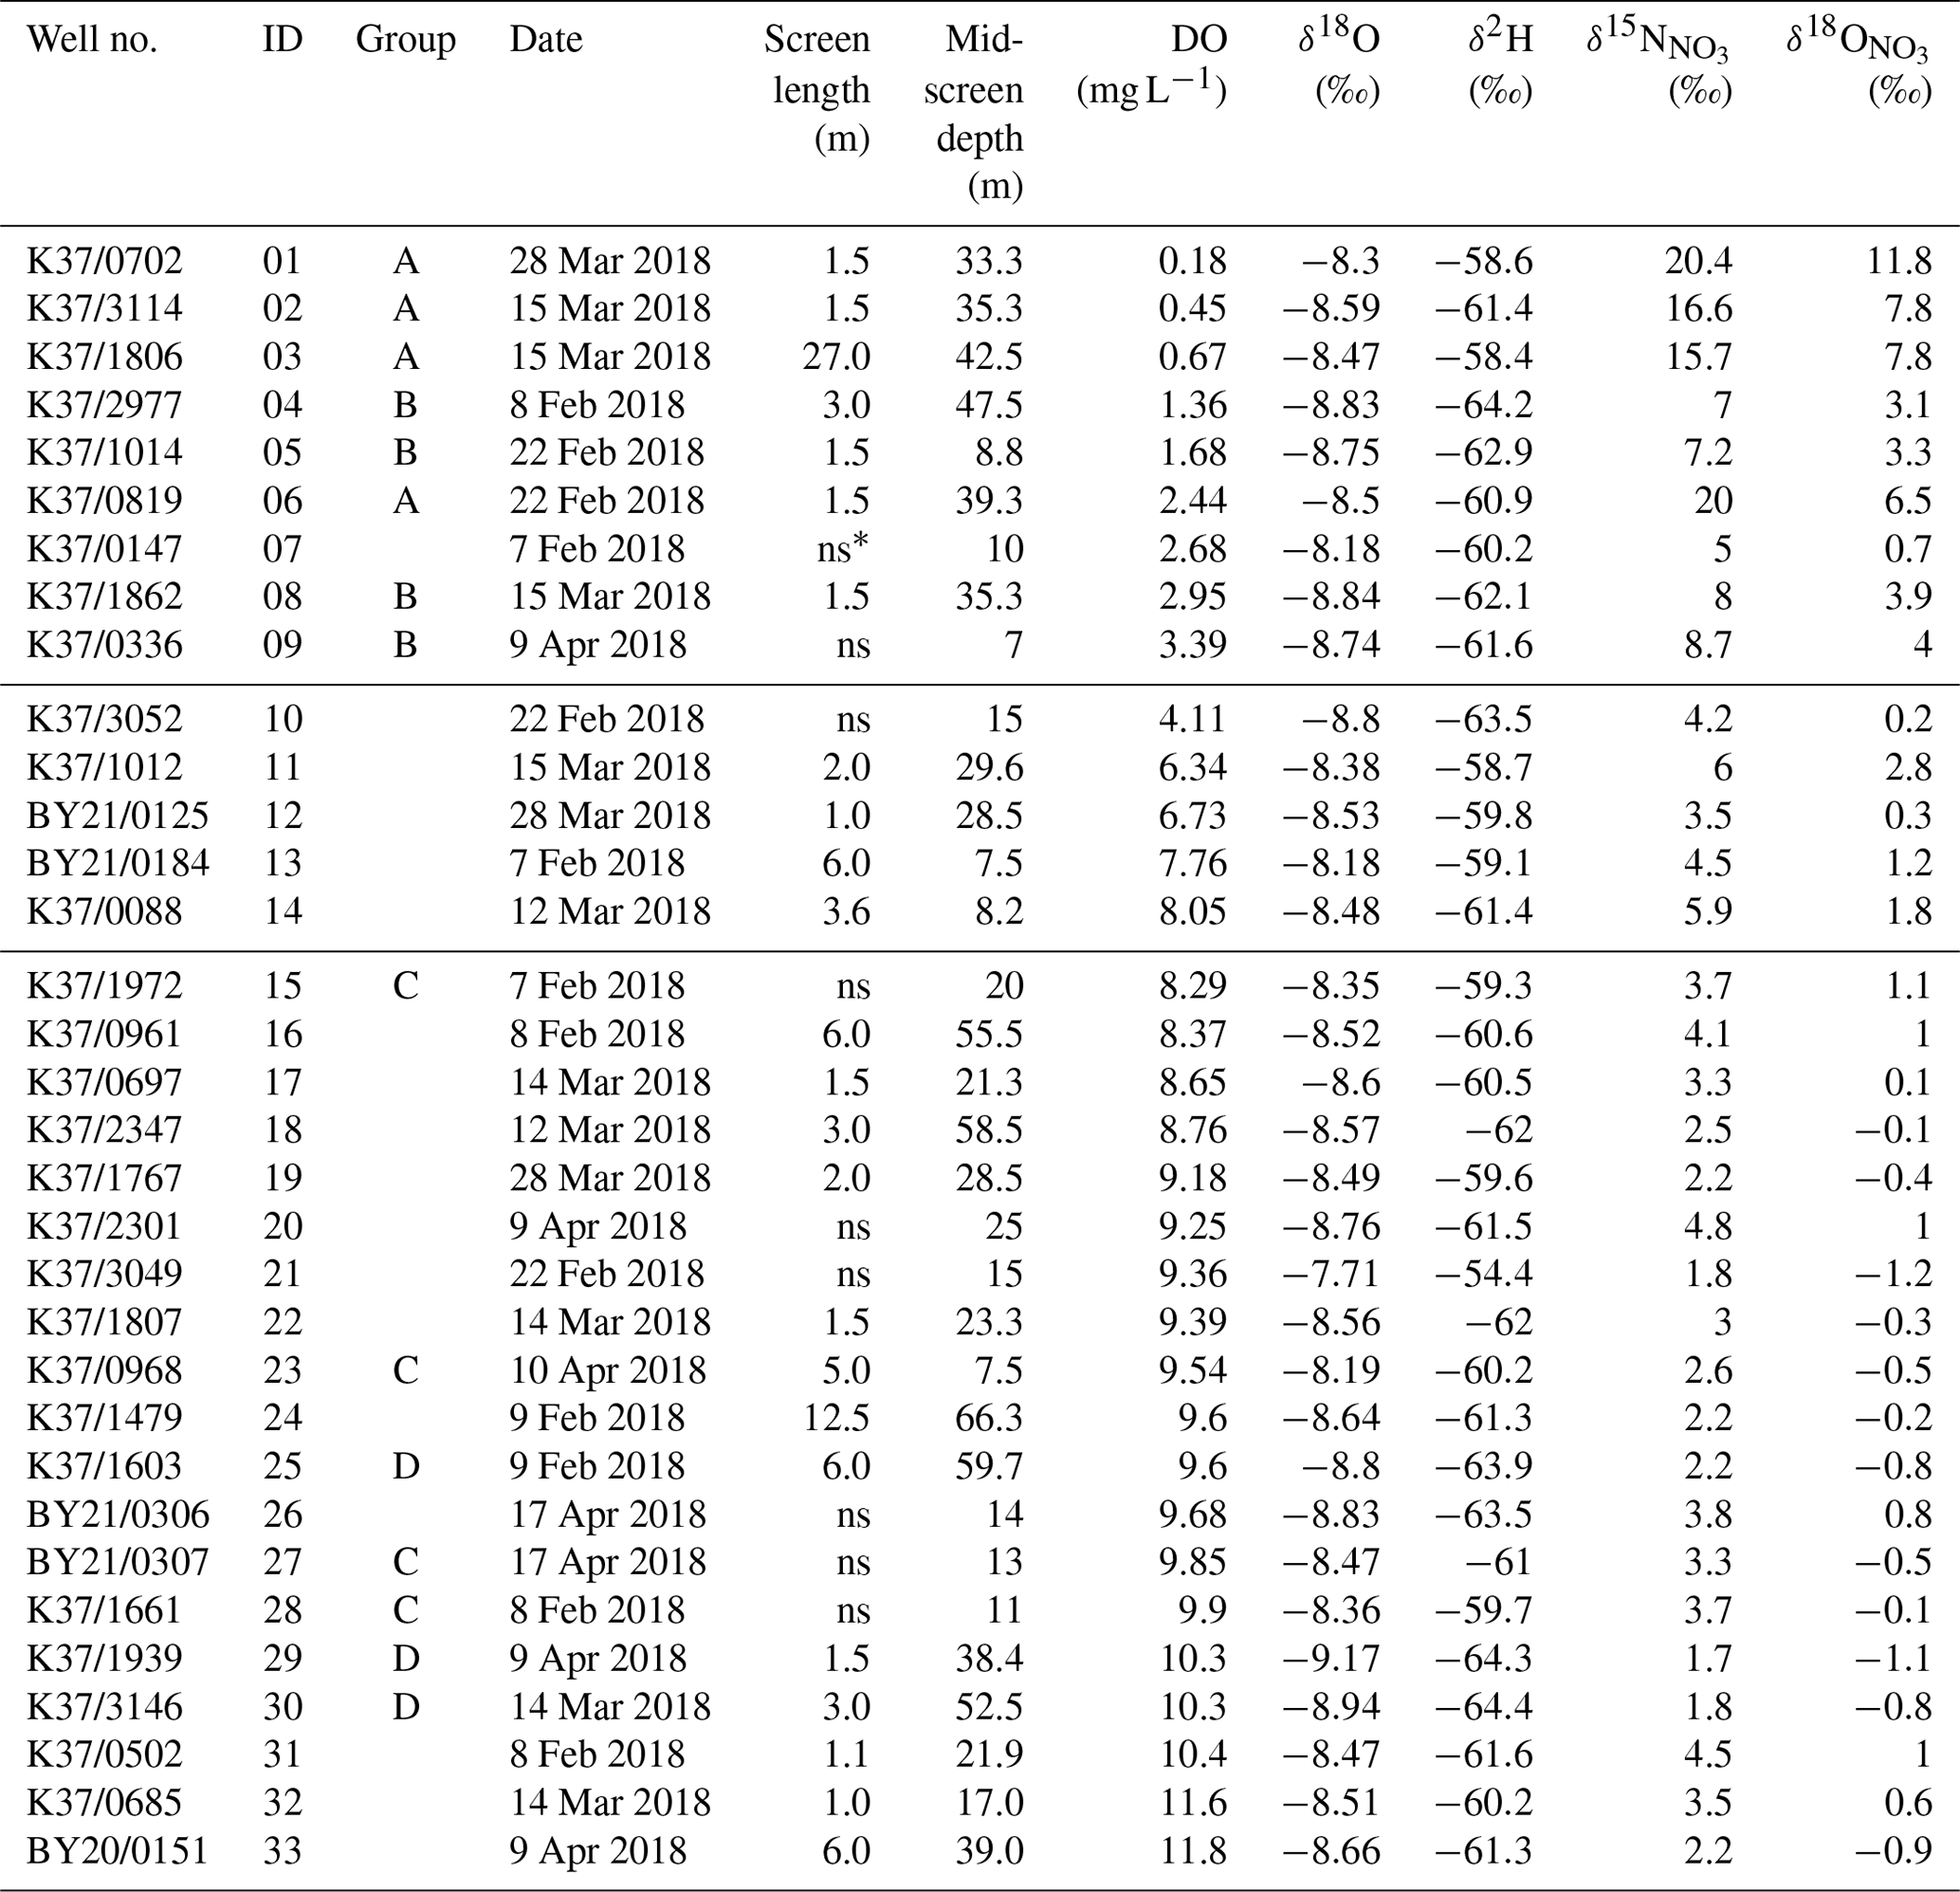
* ns means no screen. Depths for wells with no screens are total depths.
3.2 Chemical measurements
Samples were analysed for Environment Canterbury's standard suite of major ions through Hills Laboratories (Aitchison-Earl, 2019). Field measurements included dissolved oxygen (DO), pH, conductivity, temperature, and depth to groundwater. A selection of the field quantity and ion concentration results are given in Tables 1 and 2. The samples have been ordered from lowest to highest DO concentrations, and four groups of samples (A to D) are identified to aid discussion. Group A and Group B have low DO values (<4 mg L−1), with A having high δ15N (>15 ‰) and B having moderate δ15N (7 ‰–9 ‰). Group C and Group D have high DO (>8.2 mg L−1), with C having the highest and D having the lowest Cl and SO4 concentrations.
3.3 Water isotopes (δ18O and δ2H)
Water samples were analysed on an Isoprime mass spectrometer by water equilibration at 25 ∘C using an Aquaprep device for δ18O and by reduction at 1100 ∘C using a EuroVector Chrome HD elemental analyser for δ2H (GNS Science Laboratories). Results are reported with respect to VSMOW2 (Vienna Standard Mean Ocean Water). The analytical precision for this instrument is 0.2 ‰ for δ18O and 2.0 ‰ for δ2H. Results are given in Table 1.
3.4 Nitrate isotopes (δ15N and )
Nitrate samples (NO3) were converted to nitrite (NO2) using cadmium and then to nitrous oxide (N2O) using sodium azide in an acetic acid buffer. The N2O was then extracted from the water sample, passed through a series of chemical traps to remove H2O and CO2, and cryogenically trapped under liquid nitrogen. After being cryofocused in a second trap, the N2O passed through a GC (gas chromatographic) column and into an Isoprime IRMS (isotope ratio mass spectrometer) to determine its isotopic signature of nitrogen and oxygen (GNS Science Laboratories). Our method is modified from McIlvin and Altabet (2005), following personal communication with Mark Altabet. Results are reported with respect to atmospheric N2 standard (AIR) for δ15N and VSMOW for δ18O. The analytical precision for these measurements is 0.3 ‰ for δ15N and , except for samples below 0.1 mg L−1 NO3 N which may have lower precisions. Results are given in Table 1.
4.1 Groundwater chemistry
DO concentrations in the Tinwald groundwaters range from 0.18 to 11.8 mg L−1, although the majority are high and indicate relatively oxic groundwater. As noted above, the data in Tables 1 and 2 are ordered from lowest to highest DO values.
Chloride concentrations are useful to distinguish recharge sources. Chloride concentrations are highest in rainfall originating over the sea and near the coast and generally decrease with distance inland. In particular, alpine rivers (with chloride values of 0–5 mg L−1) and coastal rainfall-derived infiltration (with chloride ranging from 10 to 20 mg L−1) can be clearly distinguished (Hayward, 2002; Stewart et al., 2002). However, chloride concentrations in the Tinwald area (Fig. 4a) are greater than expected even for coastal rainfall (most are >15 mg L−1). The values are lower (0–10 mg L−1) to the northeast side of the study area near the Hakatere/Ashburton River and to the southwest.

Figure 4(a) Chloride, (b) sulfate, and (c) nitrate concentrations in the Tinwald study area (the smaller dots indicate maximum concentrations measured prior to the 2018 investigation). Base maps © LINZ (2019).
Sulfate occurs naturally in groundwater and is present in fertilisers and fungicides and so can be an indicator of human influence when concentrations are in excess of background levels as here (see Fig. 4b). As with chloride, levels in alpine rivers and low-altitude rainfall infiltration are very different, but in the case of sulfate the difference is caused by the nature of additions to the soils in the respective catchments rather than the concentrations in rainfall. Concentrations are lower on the northeast and southwest boundaries of the study area. Nitrate concentrations are shown in Fig. 4c. Nitrate concentration exceeds MAV (11.3 mg L−1) in 17 of 33 wells sampled in the study area and is over 20 mg L−1 in 4 wells. The highest nitrate concentrations cluster inland of SH1 to the west and northwest of Tinwald and underlie an area of dominant cropping land use (Fig. 1b). Nitrate is lowest on the northeast boundary of the study area (near the Hakatere/Ashburton River), where it is generally below 1∕2 MAV, 5.65 mg L−1, and lower but still over 1∕2 MAV on the southwest boundary.
To investigate possible irrigation return flow effects, we compared the concentrations of different solutes and isotopes and include the effect of evaporation as indicated by the stable water isotopes (Fig. 5a–c). Figure 5a shows water δ18O versus chloride. Higher δ18O correlates with higher chloride, but this is not due to evaporation (because the evaporation vector is not parallel to the trend). Instead the main influence is the source of the recharge because both chloride and δ18O are higher in local-groundwater recharge (e.g. Group C samples) and lower in alpine-river recharge (Group D samples). There is no effect due to DO. Sample 21 shows an extra evaporation effect.
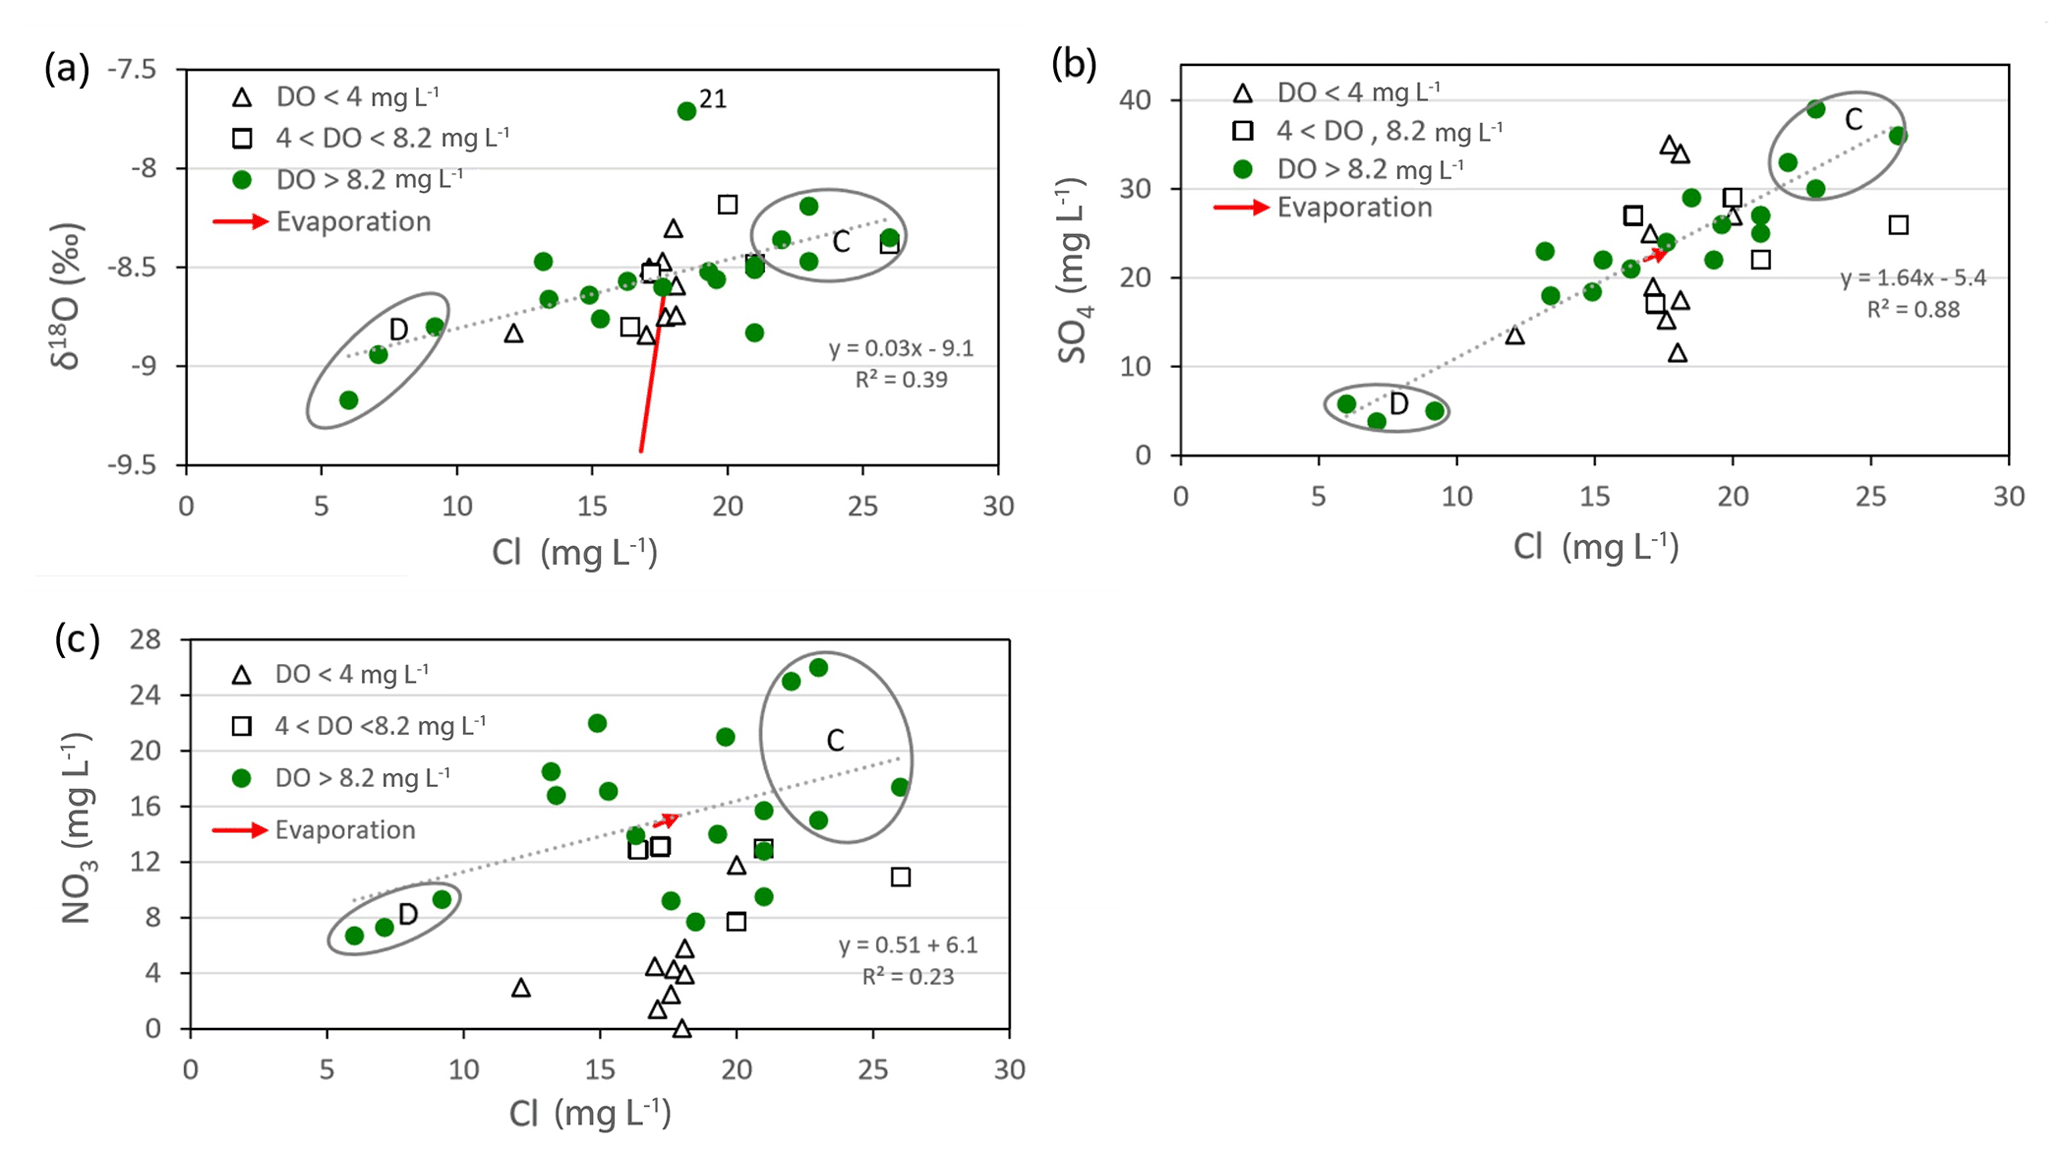
Figure 5Plots of (a) chloride versus water δ18O, (b) chloride versus sulfate, and (c) chloride versus nitrate concentrations. Group C (with land surface irrigation recharge) and Group D (alpine-river recharge) are circled. The red arrow shows the predicted effect of evaporation.
Figure 5b shows that chloride and sulfate are well correlated especially when the low-DO samples are excluded. This trend is also due to the recharge sources (see Group C and Group D samples in the figure). Evaporative enrichment is slight. The low-DO samples conform to the overall trend but are more scattered than the other samples.
Figure 5c shows that nitrate and chloride are moderately correlated due to the recharge sources (see Group C and Group D samples), but there are other processes affecting the nitrate concentrations. The low-DO waters have low nitrate concentrations, indicating that they have been partially denitrified. Evaporation has a negligible effect.
The clear message from these results is that nitrate, sulfate, and chloride concentrations are increased in areas irrigated by local groundwater compared to those irrigated by alpine-river water.
4.2 Water isotopes δ18O and δ2H
δ18O values are useful as tracers of the sources of recharge to groundwater, because rainfall recharge and rivers from alpine catchments have different isotope ratio signatures. Scott (2014) reviewed δ18O data for Canterbury and identified isotopic signatures in the Ashburton area. The Hakatere/Ashburton River has very negative δ18O with a mean of −10.1 ‰ for the South Branch and −10.7 ‰ for the North Branch. In contrast, rainfall recharge near the coast is less negative than −8 ‰, although it becomes more negative inland and is typically more negative than −8 ‰ on the upper plains. The Rangitata River, the alpine source of Valetta and other irrigation scheme water, has a mean δ18O of −9.8 ‰ (Taylor et al., 1989).
δ18O data collected in the greater Ashburton area are shown in Fig. 6. The influence of more negative Rangitata River-sourced water can be seen under the irrigation schemes. The δ18O values are less negative (red and orange dots) in the Tinwald study area. More negative values (green dots) occur on the northeast and southwest boundaries of the area, which are related to recharge from the South Branch Hakatere/Ashburton River and the Valetta Irrigation Scheme water. An area south of Tinwald near the coast (Eiffleton Irrigation Scheme) has less negative δ18O values like those observed in the Tinwald study area for probably the same reasons (irrigation return flow).
We also sampled wells for δ2H in 2018. Available evidence supports a local meteoric water line (LMWL) for Canterbury with intercept 10 ‰ (Stewart and Taylor, 1981; Taylor et al., 1989; Stewart and Morgenstern, 2001; Scott, 2014; Stewart et al., 2018); i.e. the LMWL is
Paired δ18O and δ2H data for the Tinwald study are plotted in Fig. 7. The Tinwald data plot below the LMWL and have a linear best-fit line (excluding sample 21, which has been affected by extra evaporation) given by
The slope of less than 8 for this line indicates that the waters have been affected by evaporation. A ratio of about 5 in the 2H and 18O enrichments is expected for evaporation at ambient temperatures (Stewart, 1975). It is likely that the isotopic compositions of the water would have been enriched by evaporation and/or evapotranspiration during the irrigation return flow process. Estimates of the isotopic enrichments required to explain the displacement of the average isotopic compositions of the group from the LMWL are shown by the red arrow with a slope of 5 in Fig. 7. The average isotopic composition of the samples except sample 21 (Table 1) was (−8.58, −61.2), where the bracket represents (δ18O, δ2H). The average initial composition of the samples would then have been (−9.43, −65.4), i.e. where the red arrow with a slope of 5 meets the LMWL (marked by the small red circle in Fig. 7). This degree of isotopic enrichment is obtained by evaporation of approximately 5 % of the water according to both isotopes (see the calculation in Appendix A). Uncertainty in this evaporated fraction is small because the isotopic composition of the remaining water changes rapidly with the degree of evaporation due to the form of the equation, so considerable changes of isotopic composition do not change the fraction evaporated much.
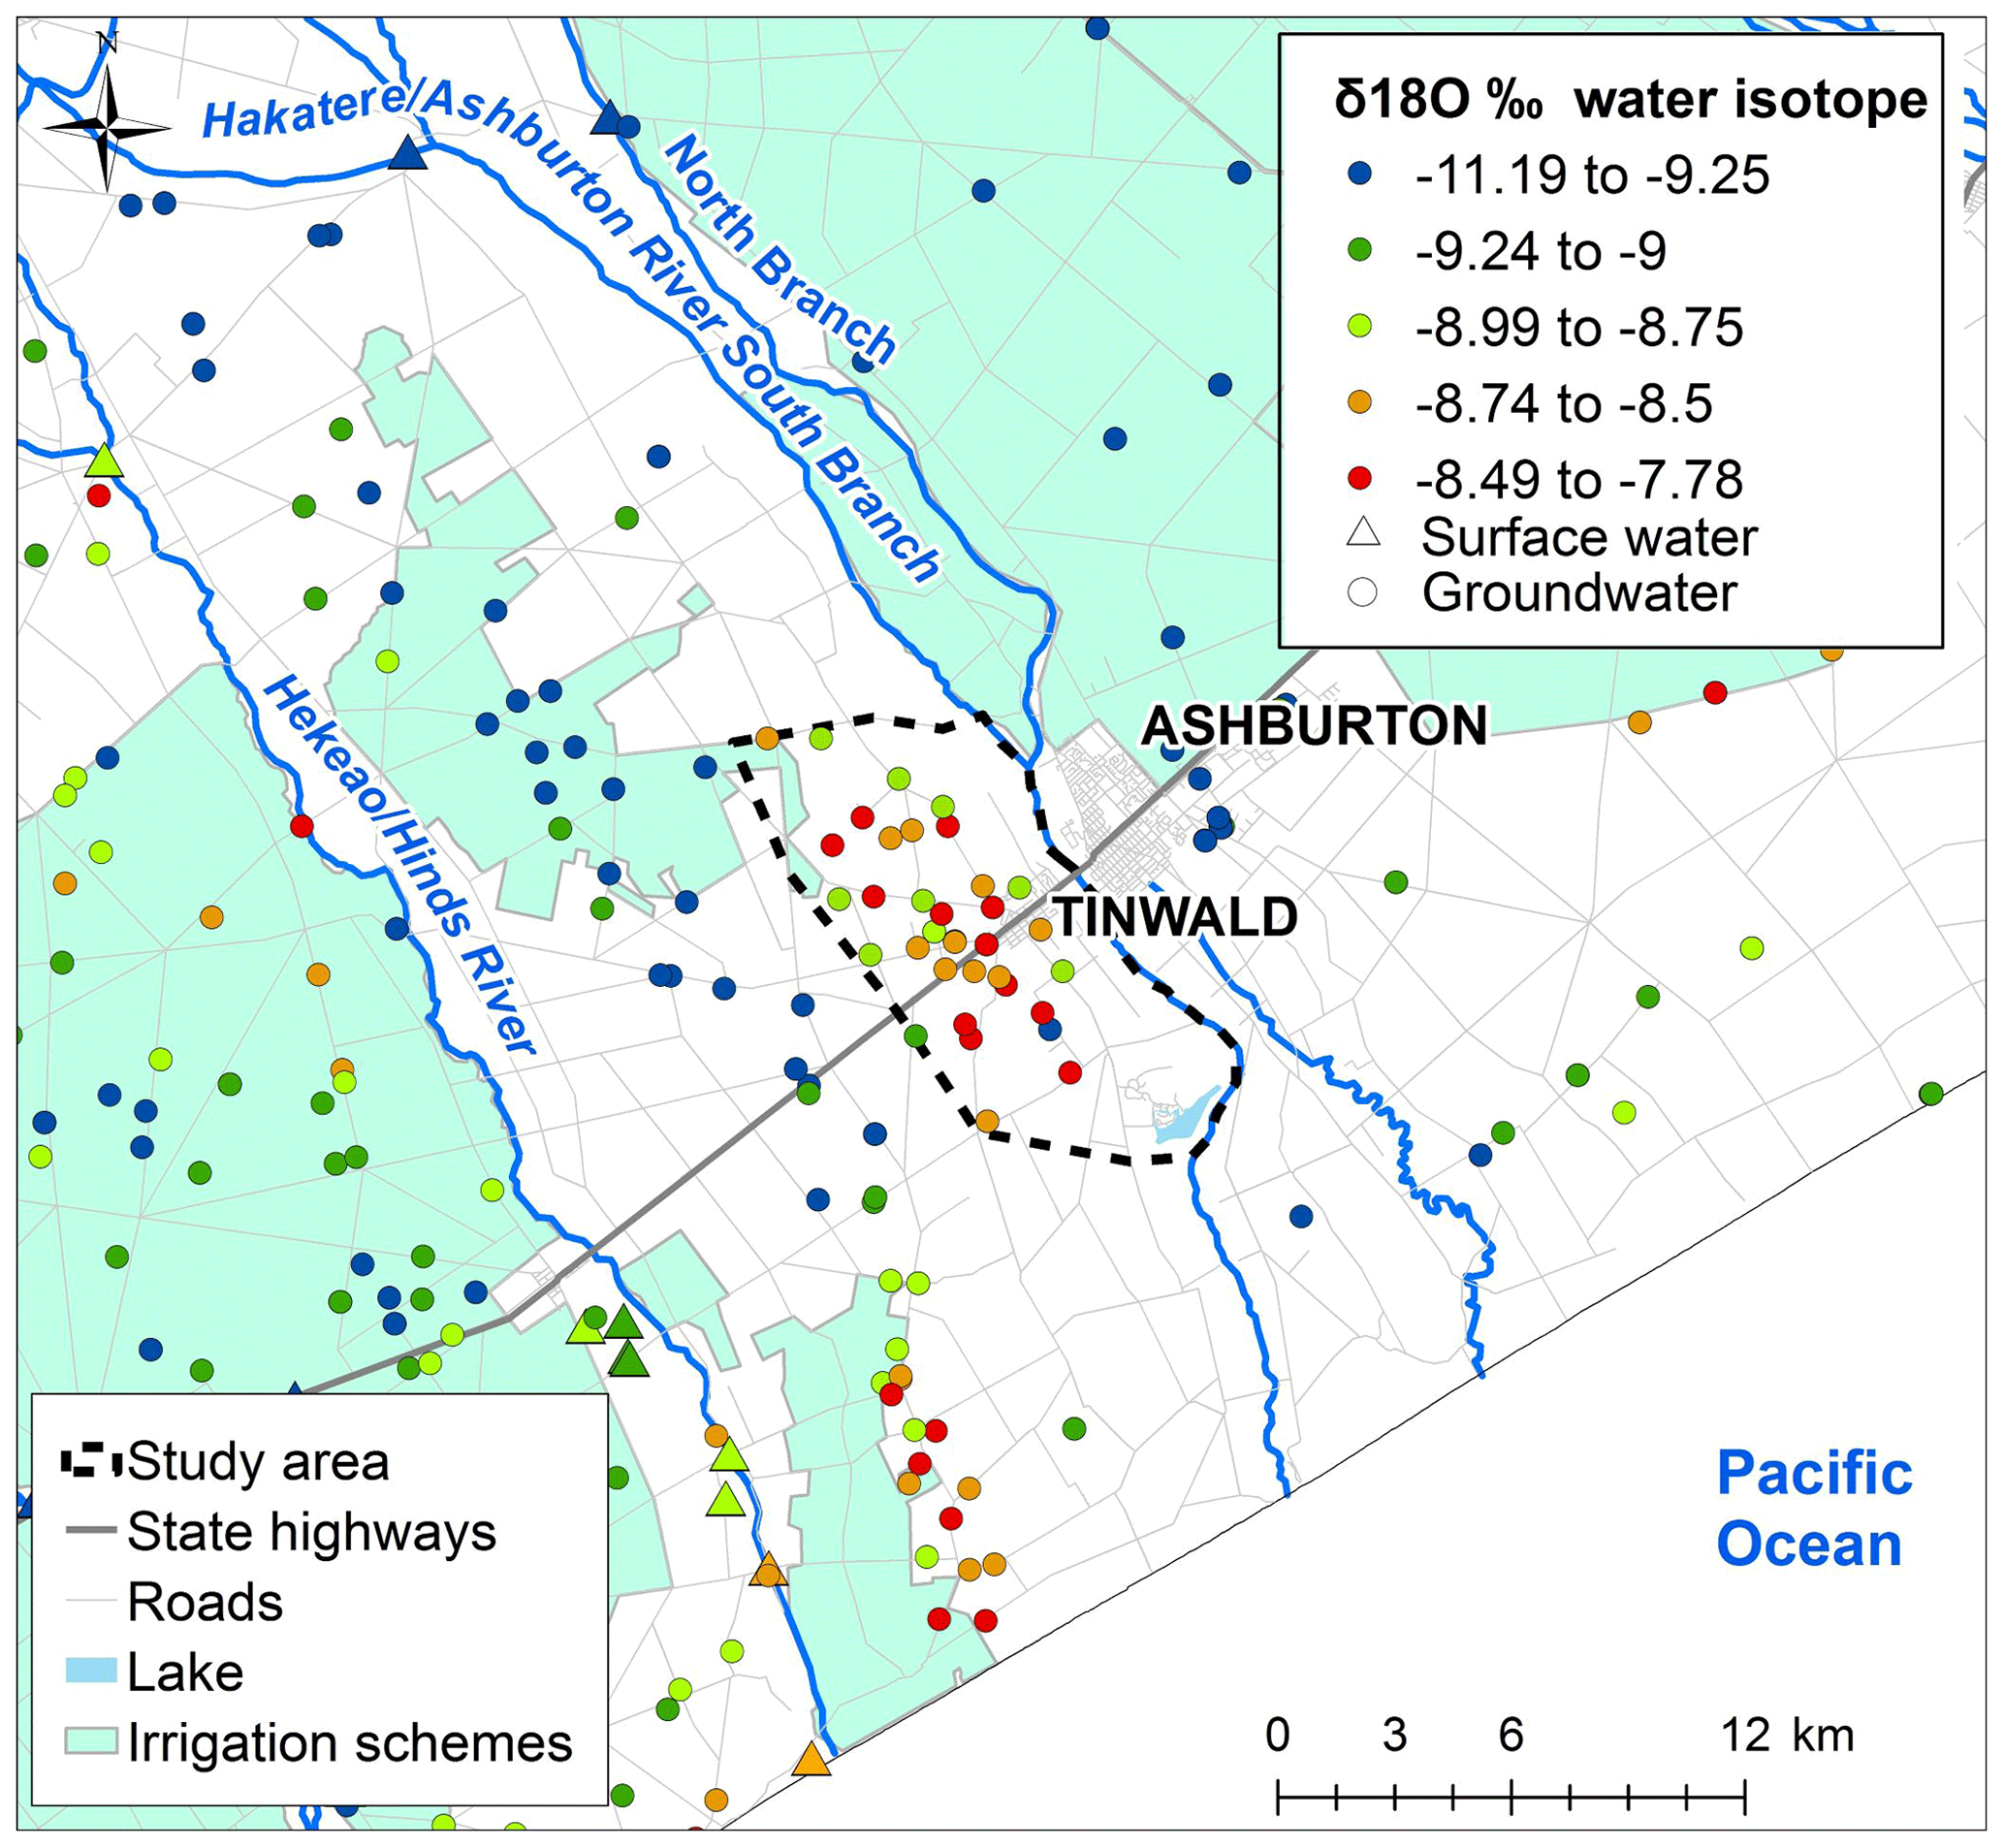
Figure 6δ18O in the Ashburton area at groundwater and surface water sites. Data outside of the Tinwald study area are mean δ18O from all available measurements; inside the study area δ18O is the single result from the current sampling. Base map © LINZ (2019).
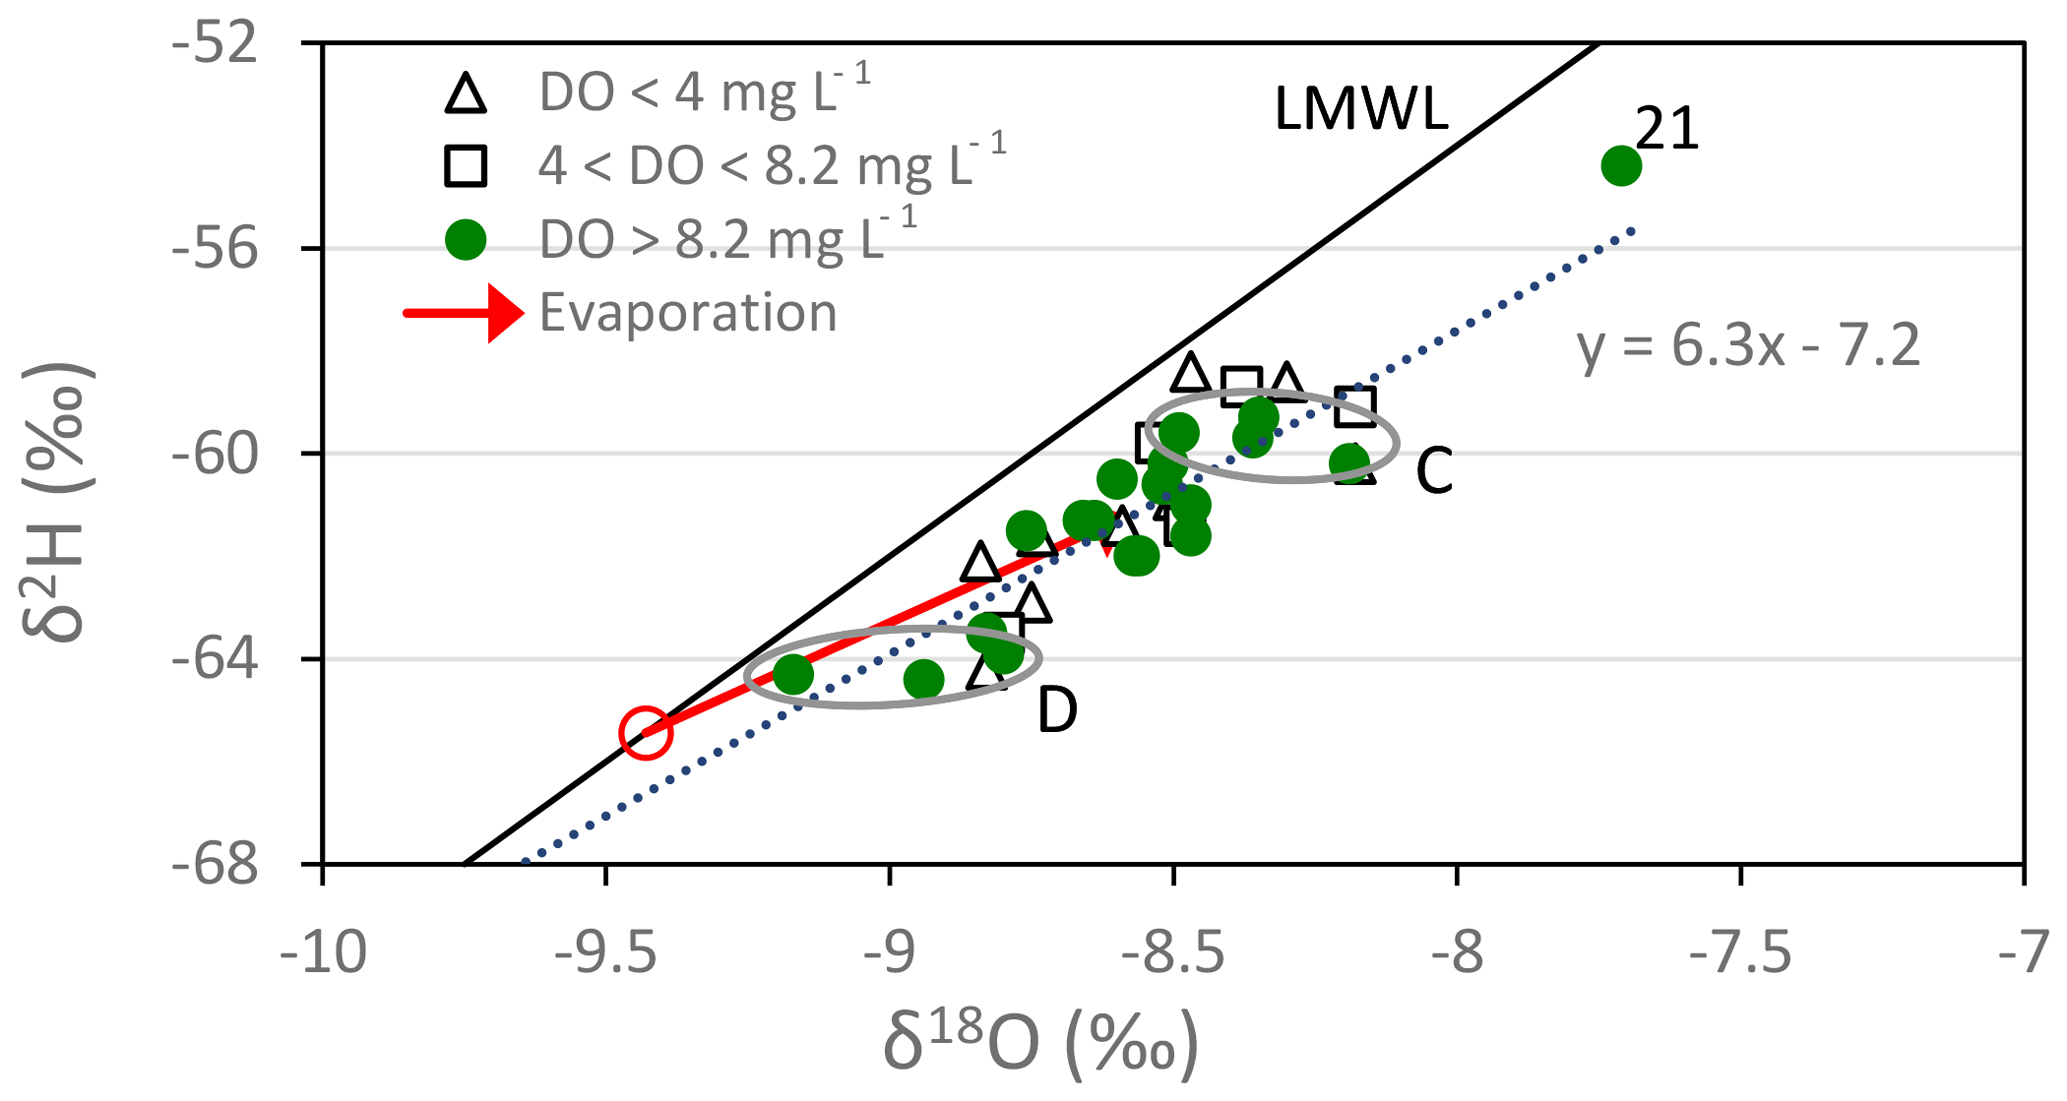
Figure 7Paired δ2H and δ18O data in the Tinwald study area. The average initial composition of the well waters is indicated by the small red circle. Group C and Group D samples are circled.
In addition, the difference in the δ18O and δ2H values of Group C and Group D is attributed to their different irrigation sources (local groundwater or alpine-river water) as observed for the chemical compositions. Assuming that both groups are affected by evaporation to the same extent, the difference between the groups compared to the difference between the irrigation sources will give an approximate measure of the irrigation input. The δ18O difference between Group C and Group D is 0.63 ‰ (Table 4), and that between the sources is 1.63 ‰, giving an irrigation input of 39 %. For δ2H it is 4.1 ‰ compared to 10.2 ‰, giving a 40 % irrigation input. These may be slight overestimates because Group C waters may be more affected by evaporation than Group D waters. (The compositions of the irrigation sources are taken as local rainfall (−8.17, −58.7) and alpine river (−9.80, −68.9).)
4.3 Nitrate isotopes δ15N and
The nitrate isotope results are given in Table 1 and plotted in Fig. 8a. The samples have symbols depending on their DO concentrations, as in previous figures. The figure displays two important features:
-
There is a very good linear relationship between the δ15N and values of the nitrate.
-
Their positions along the line depend on their DO concentrations.
The first feature is the linear relationship between the δ15N and values of the nitrate (except sample 06 and to a smaller extent samples 02 and 03). Denitrification causes increased δ values of nitrate, along with a decrease of nitrate concentration. The slope of the isotopic enrichments caused by denitrification (i.e. enrichment in divided by the enrichment in δ15N) has been reported to be in the range 0.48–0.77 (Kendall, 1998; Burns et al., 2011; Kaushal et al., 2011; Zhang et al., 2019). The line shown in Fig. 8a has a slope of 0.68 and was calculated to simulate the effect of denitrification using the Rayleigh formula to represent the process (Kendall, 1998). Similar denitrification line slopes of 0.73 and 0.75 were observed by Clague et al. (2015) and Stenger et al. (2018) respectively. The individual denitrification calculations for each of the isotopes are plotted in Fig. 8b and c (see Appendix B and Table 3). The starting point for the denitrification lines was chosen to be the average of the Group C samples. The linear relationship shows that either the various sources of nitrate all produce nitrate with the same isotopic δ values (which is contrary to what we know), or more probably nitrate leaching from the soil is blended by processes in the soil (Wells et al., 2015) and by irrigation return flow. The exceptions are sample 06 and to a lesser extent samples 02 and 03; their isotopic compositions (Fig. 8a) suggest that they initially had higher δ15N than the other samples and therefore a greater proportion of effluent nitrate.
Table 3Results of calculations of the δ15N or δ18O values of nitrate affected by denitrification. The initial nitrate concentration was 19 mg L−1, and the δ0 values were δ15N=3.1 ‰ and ‰. The enrichment factors used were ‰ and ‰. f is the fraction of nitrate remaining after denitrification.

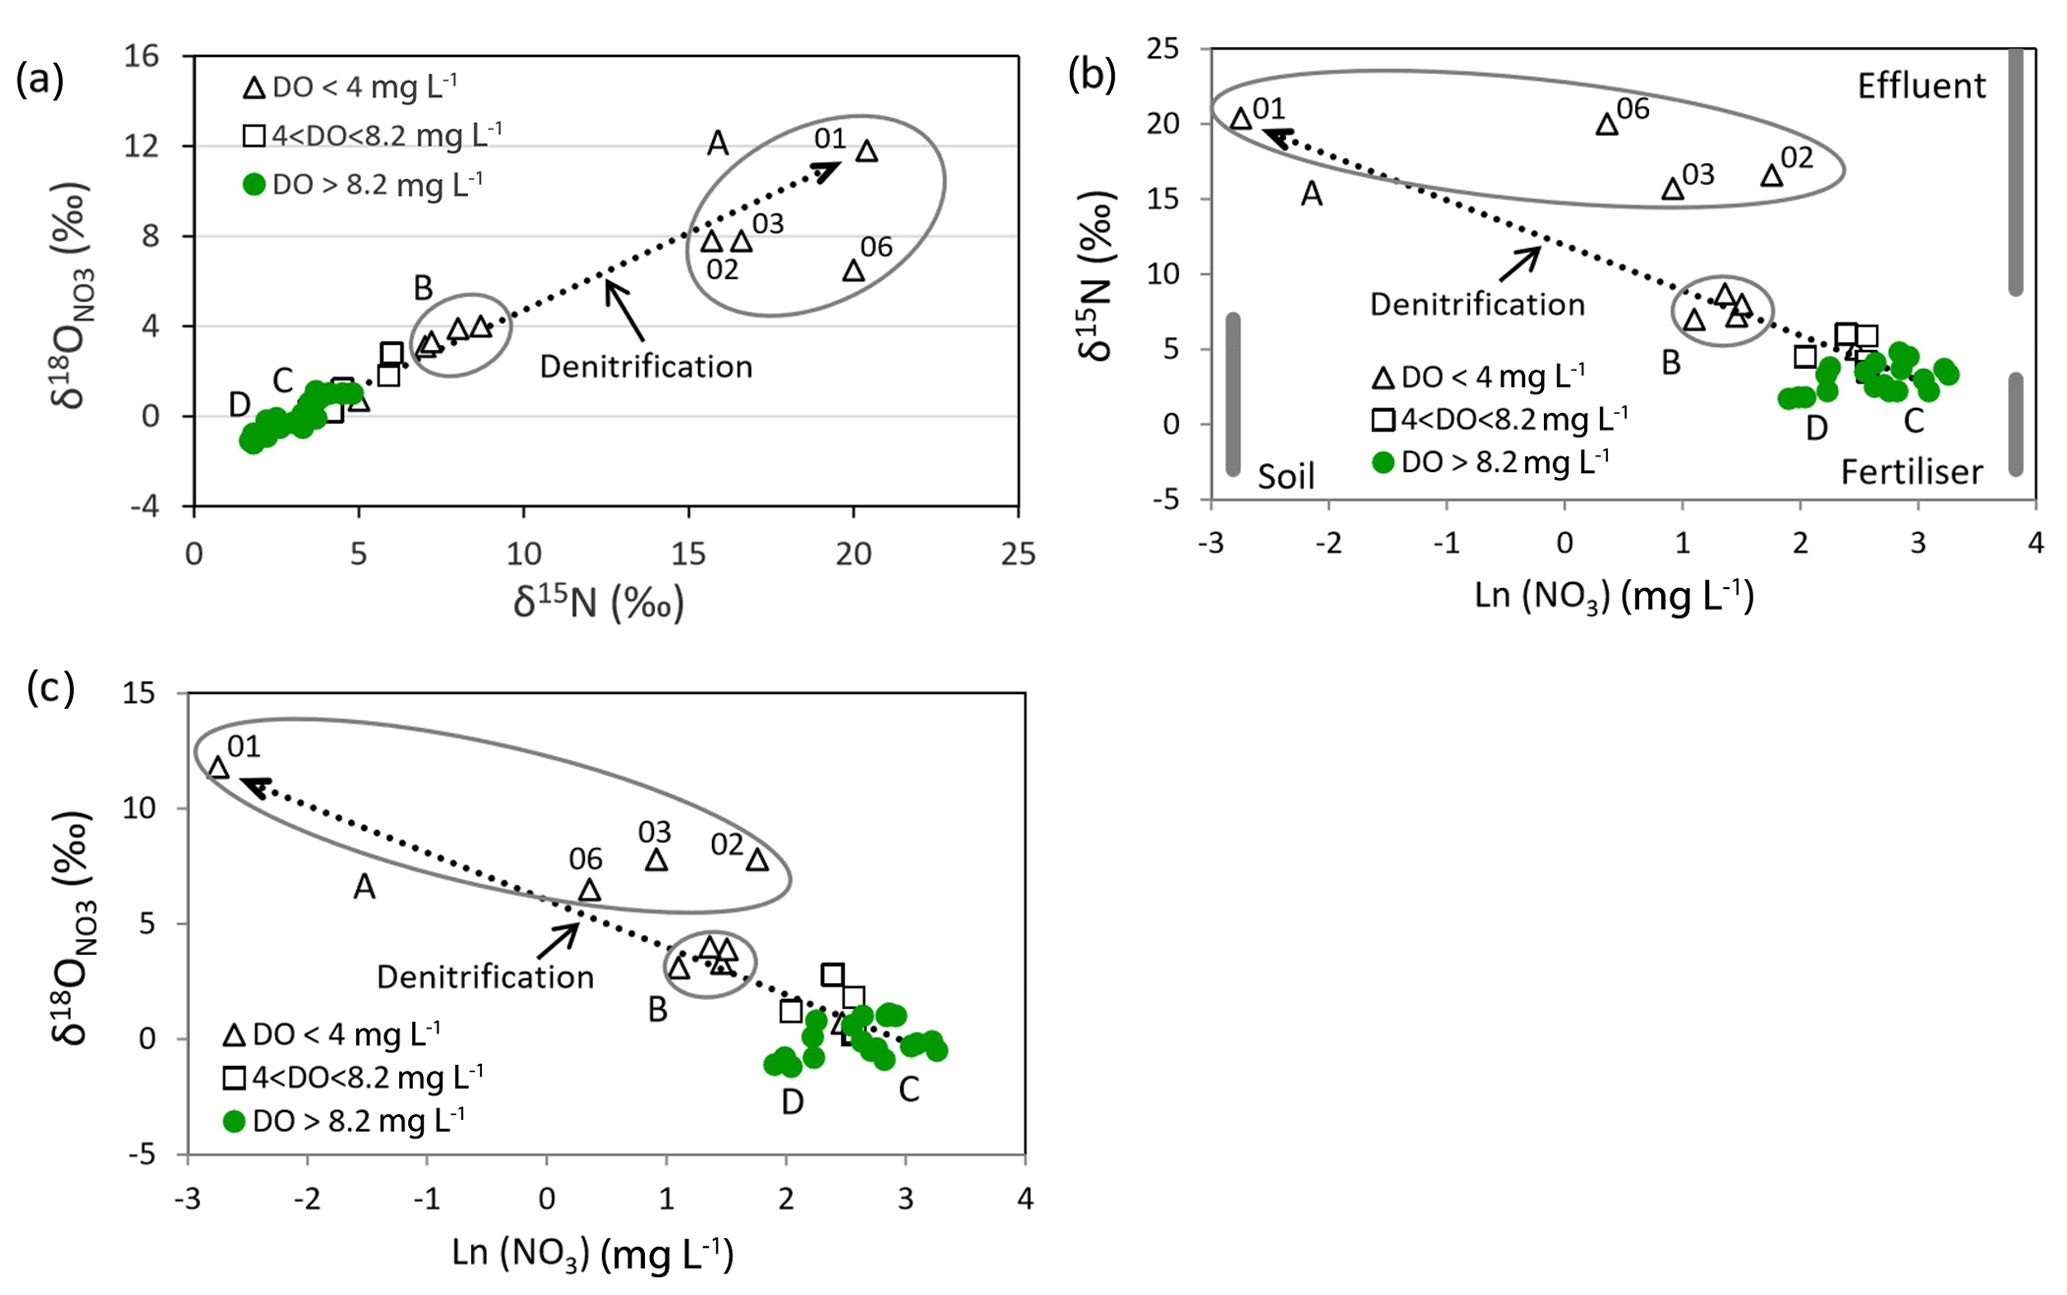
Figure 8(a) Plot of δ15N versus . Group A and Group B are circled, and Group C and Group D are indicated by letters. (b, c) Plots of δ15N and versus the natural log of the nitrate concentration.
The second feature of the figure is surprising. Denitrification is only expected to take place where DO levels are very low (e.g. <0.5 mg L−1; McMahon and Chapelle, 2008). But here denitrification effects are observed even when the DO concentrations in the groundwaters are much higher. The lowest DO range in Table 1 (with DO < 4 mg L−1, samples 01–09) includes Group A waters which have the lowest DO values and most marked denitrification effects (with δ15N values from 15 ‰ to 20 ‰), Group B waters with DO from 1.36 to 3.39 mg L−1 and δ15N values from 7 ‰ to 9 ‰, and one other well (07) that in contrast shows only minor denitrification (δ15N is 5 ‰) despite its relatively low DO (2.68 mg L−1). The intermediate-DO group (4 < DO < 8.2 mg L−1) has intermediate nitrate concentrations and shows smaller denitrification effects (δ15N values from 3.5 ‰ to 6.0 ‰, samples 10–14). The highest-DO group (with DO > 8.2 mg L−1) is nearly saturated with oxygen and shows minimal denitrification effects (δ15N values from 1.7 ‰ to 4.8 ‰, samples 15–33).
Figure 8b shows the natural log of the nitrate concentrations versus δ15N values; the natural log is used because the denitrification line will be linear on this type of plot according to the Rayleigh formula (Appendix B). The grey bands show approximate values of the δ15N values of possible nitrate sources (i.e. natural soil with δ15N of −3 ‰ to 7 ‰, inorganic fertiliser with −3 ‰ to 3 ‰, and effluent with 9 ‰ to 25 ‰; Fogg et al., 1998; Stewart et al., 2011). The Ln(NO3) values they are plotted at are schematic; we normally expect background nitrate concentrations from natural sources in soil to be about <0.7 to 1 mg L−1 (Close et al., 2001; Daughney and Reeves, 2005). Nitrogen-fixing clover is a possible source of nitrate with an isotopic composition like that of soil nitrate in pasture in Canterbury (Trevis, 2012), but we think its contribution is not large because the abundance of clover has decreased over the years as fertiliser use (particularly urea) has increased.
The enrichment factors producing the denitrification lines in Fig. 8b and c are ‰ and ‰ (Table 3). These are similar to the ranges determined by Clague et al. (2015) ( ‰ to −9.6 ‰ and ‰ to −7.2 ‰) and values by Stenger et al. (2018) ( ‰ and ‰), while Mariotti et al. (1988) gave an ε(15N) range from −5 ‰ to −8 ‰. Other authors (Kendall, 1998, and references therein) gave much larger negative values. Mariotti et al. (1988) suggested that low values may occur if denitrification occurs in dead-end pores causing a non-fractionating sink for nitrate by diffusion. Stenger et al. (2018) considered that small-scale physical heterogeneity, including the localised distribution of resident electron donors and the effect of lateral flows, was a more likely cause with their coarse-textured ignimbrite materials.
Figure 8c shows the natural log of the nitrate concentrations versus values. As with Fig. 8a and b, the denitrification line through Group C and Group B wells project to sample 01. This well is located south of Tinwald near Laghmor Creek in the Hinds swamp denitrification area. Group A wells show the greatest denitrification effects; the other samples in the group (02, 03, and 06) lie to the right of the denitrification line in Fig. 8b, indicating that they have larger proportions of effluent than the rest of the samples. Samples 02 and 03 occur downgradient of the old Tinwald Saleyards; sample 06 is northwest of SH1 in an area of lifestyle blocks adjacent to the major cropping area. It is probable that the effluent source is providing a source of dissolved organic carbon to fuel denitrification reactions in Group A wells.
Group B wells (showing moderate denitrification) are located closest to the Hakatere/Ashburton River. One sample (04) is in the cropping area, and the others (05, 08, and 09) are in areas with lifestyle blocks, which could contribute both septic tank and animal effluent to assist denitrification.
Group C wells (representative of wells irrigated by local groundwater) are distributed through the central part of the high-nitrate hotspot. They plot in the upper part of the cluster of green points in Fig. 8a and to the right in Fig. 8b and c.
Group D wells (representative of wells irrigated more by alpine-river water) are located on the southwest boundary of the study area. They plot in the lower part of the green point cluster in Fig. 8a and to the left in Fig. 8b and c.
The green points in Fig. 8 have δ15N values that are mostly within the soil nitrate or inorganic-fertiliser ranges and show little evidence of denitrification. Natural soil nitrate alone does not account for the slightly elevated nitrate concentrations in these wells, making inorganic fertiliser (or rather organic N derived from it; see discussion below) the likely dominant source.
A mixing curve between two nitrate source end members (soil nitrate and fertiliser plus effluent mixture nitrate) has been fitted to the solid green points (Appendix C). The best-fitting curves give δ15N=4.1 ‰ and ‰ for the blended nitrate source. This indicates that the source is dominated by inorganic fertiliser but has a small proportion of effluent source based on 15N (it is assumed that the highest nitrate concentrations are little affected by denitrification).
5.1 Irrigation return flow effects on chemical and isotopic concentrations
Fertilisers have been applied to much of the area between the Ashburton River and Hinds River, not just to the Tinwald study area, and rainfall applies to the whole area with contours of the δ values in rainfall decreasing inland from the coast (Stewart et al., 2002). Yet the Tinwald area shows elevated nitrate concentrations (and chloride, sulfate, etc.) compared to the surrounding areas (see Fig. 2). The difference is that the Tinwald study area is irrigated by groundwater from shallow local wells with high solute concentrations, whereas much of the rest of the area is irrigated by alpine-river water with low solute concentrations.
The irrigation return flow process is illustrated schematically in Fig. 9. Dewandel et al. (2007) defined an irrigation return flow coefficient C equal to the recharge from irrigation (i.e. irrigation return flow, IRF, divided by the irrigation flow itself, I, so that ). C is also equal to the overall recharge rate for rainfall and irrigation in our system (we omit surface runoff and lateral seepage in this treatment because both are expected to be small). (Note that drains in the area are fed mainly by groundwater.) C is used to quantify the effect of irrigation return flow on the water balance.
Table 4Average chemical and isotopic concentrations of Group C and Group D. Enrichment factors and IRF coefficients (C) for the chemicals and isotopic differences and irrigation inputs for the isotopes are given.


The average chemical concentrations of Group C and Group D are taken as representative of the Tinwald hotspot and outside groundwaters respectively (average values and standard deviations for each chemical are given in Table 4). The table also gives the enrichment factors and irrigation return flow coefficients between Group C and Group D derived from each chemical; the enrichment factor is equal to 1∕C assuming that chemicals input via rainfall and irrigation are concentrated into the recharge fraction, i.e. concentrated by the loss of actual evapotranspiration (AET). Cl mass balance has often been used to estimate recharge because it is conservative; here the enrichment factor is 3.2, and coefficient C obtained is 31 %. The SO4 enrichment factor is very large (7.0), suggesting greater fertiliser input into the Group C area soil than into the Group D area soil. The HCO3 factor is small (1.2) probably because of chemical re-equilibration as water passes through the soil in both areas. The average enrichment factor is 2.4, and coefficient C is 42 % for all of the chemicals except SO4 and HCO3. Values of coefficient C can be compared with lysimeter measurements of the recharge fraction from the nearby research station of Winchmore (Thorpe and Scott, 1999, Fig. 2); the recharge fraction is recharge divided by input (i.e. rainfall plus irrigation). Thorpe and Scott (1999) found that the recharge fraction at Winchmore was about 39 % for the average irrigation input of 200 mm yr−1, in good agreement with the chemical results above.
The δ18O and δ2H values of Group C and Group D are affected by the different irrigation water sources (local groundwater or alpine-river water) and by evaporation as described in Sect. 4.2. An irrigation input of up to 40 % is indicated by the mean isotopic compositions of Group C and Group D. Evaporation is indicated by displacement of the sample points from the LMWL in Fig. 7. An approximate calculation given in Appendix A shows that evaporation of about 5 % of the water can explain the average displacement of the points.
Irrigation return flow has important implications for management of nitrate in agriculture. An important aspect of water resource management is understanding and modelling of nitrate transport in water systems (in this case groundwater). Much effort is being expended to model the effects of nitrate produced by farming practices in order to introduce and substantiate appropriate controls on farming to protect the water supplies of downstream communities (e.g. Environmental Canterbury, 2020). Irrigation return flow can seriously distort such modelling by lengthening the timescale of nitrate transport by abstracting water from groundwater downstream and applying it upstream and by adding nitrate on a second pass through the soil.
Another effect of irrigation return flow is distortion of tracer age dating results. Tritium concentrations will not be reset by interaction with the atmosphere when irrigation water is applied to the soil, so the tritium residence times of groundwater affected by irrigation return flow will appear to be older than they really are. In contrast, CFC and SF6 residence times will be reset to zero in the soil, and groundwater residence times will reflect time since recharge. This appears to be the case for data in the Tinwald area, although data are scarce (Stewart et al., 2002).
A practical consideration is that if irrigation water already contains nitrate then too much fertiliser could be applied leading to unnecessary economic cost and greater nitrate leaching potential, if the nitrate in the groundwater is not accounted for by nutrient budgeting (e.g. Flintoft, 2015).
5.2 Nitrate dual-isotope concentrations
5.2.1 Nitrate source identification
Nitrate isotope results that have not been affected by denitrification (i.e. usually the oxic samples) potentially give information on the nitrate sources and also on the starting points for denitrification vectors. Numerous studies of the δ15N values produced by different nitrate sources have identified ranges which have differed under local conditions (e.g. Kendall, 1998; Fogg et al., 1998; Stewart et al., 2011, Fig. 8b). Results for oxic samples from recent New Zealand studies are given in Fig. 10. The rectangles show source signature fields resulting from urea fertiliser, soil N, and/or ruminant excreta at Toenepi Catchment (Clague et al., 2015); urine, urea, and/or soil N at Harts Creek (Wells et al., 2016); low-intensity animal grazing (soil N and/or manure) at Waihora wellfield (Stenger et al., 2018); two sources (inorganic fertilisers plus manure and piggery effluent) at Waimea Plains (Stewart, 2011); and inorganic fertiliser, urea, and/or manure at Tinwald (Group C and Group D; this work). Despite the variety of nitrate sources, the δ15N values generally show overlapping ranges as illustrated in Fig. 10 (except for the Waimea Plains piggery effluent source).

Figure 10Plot of the nitrate isotopic source signatures from several New Zealand studies. Red rectangle – 0.4 m suction samples at Toenepi Catchment (Clague et al., 2015). Purple rectangle – stream samples from Harts Creek (Wells et al., 2016). Blue rectangle – oxic water samples from Waihora wellfield northwest of Lake Taupo (Stenger et al., 2018). Orange double arrows – δ15N values only from groundwater in the Waimea Plains (Stewart et al., 2011) and oxic waters (Group C and Group D) from the present investigation.
Use of in combination with δ15N to identify nitrate sources has not been very successful, as illustrated in Fig. 10, where the values overlap each other. On the other hand, the combination has proven to be effective for detecting the occurrence of processes in the nitrogen cycle, such as nitrification and denitrification (Aravena and Robertson, 1998). The only distinctive source values are those expected for nitrate fertiliser (see “Nitrate fertilisers” box in Fig. 10; Xue et al., 2009; Wells et al., 2015). Many researchers have looked for such values and generally failed to find them (Kloppman et al., 2018). Instead the values observed in groundwaters are usually characteristic of soil nitrate or effluent (as illustrated in Fig. 10).
The probable answer to this failure to observe the expected high values in groundwater is that inorganic-fertiliser-derived nitrate is not directly and rapidly transferred to groundwater but is retained in the soil–plant system as organic N and only later mineralised and re-oxidised thereby becoming available for leaching to the groundwater (Somers and Savard, 2009; Wells et al., 2015; Kloppmann et al., 2018). The process of mineralisation and re-oxidation resets and also changes δ15N. The time delays in this process can be considerable (as much as several decades; Sebilo et al., 2013). This means that there will be a legacy of organic N built up in the Tinwald soil from past applications of fertiliser in addition to past soil management practices. This time delay is in addition to the time delay due to the mean residence time of the groundwater. Others have previously identified the importance of organic N in the soil – variously known as soil organic matter (SOM; Somers and Savard, 2009) or soil organic nitrogen (SON; Wells et al., 2015) – as the pool of nitrogen within the soil controlling the rate and timing of nitrate releases to groundwater. The transfer to organic N is most efficient at times of high microbial activity (spring and summer growth) and much less in low microbial activity (winter), when increased nitrate leaching to the groundwater is likely (Mengis et al., 2001; Somers and Savard, 2009).
The nitrate isotopes (Fig. 8a) show an unexpected blending of the isotopic compositions of the nitrate in the groundwater (and therefore the soil and vadose zone). This blending is considered to be due to irrigation return flow in conjunction with the action of organic N in mediating and retaining N in the soil. This has allowed the denitrification process to be identified and explored in this study and the enrichment factors for denitrification to be determined.
5.2.2 Denitrification imprint in oxic groundwater
The nitrate isotopes show clearly that denitrification is important in Tinwald groundwater (Fig. 8). Firstly, the nitrate isotopes show that the nitrate sources are blended within the soil and that inorganic fertilisers are dominant with minor effluent input. Secondly, the nitrate concentration and isotopic compositions are correlated with the DO concentrations, despite most of the groundwaters having DO concentrations greater than the levels at which denitrification can occur (McMahon and Chapelle, 2008; Rivett et al., 2008).
The correlations are displayed in Fig. 11a–c. The relationship between DO and nitrate is approximately linear (Fig. 11a) with the nitrate concentrations being more scattered at the high DO end related to the recharge sources (Group C and Group D; see earlier results). The line fitted to samples with DO < 8.2 mg L−1 and Group C samples shows an average trend reflecting denitrification. Figure 11b and c shows that δ15N and plotted against Ln(DO) also have average linear trends fitted to them related to denitrification.
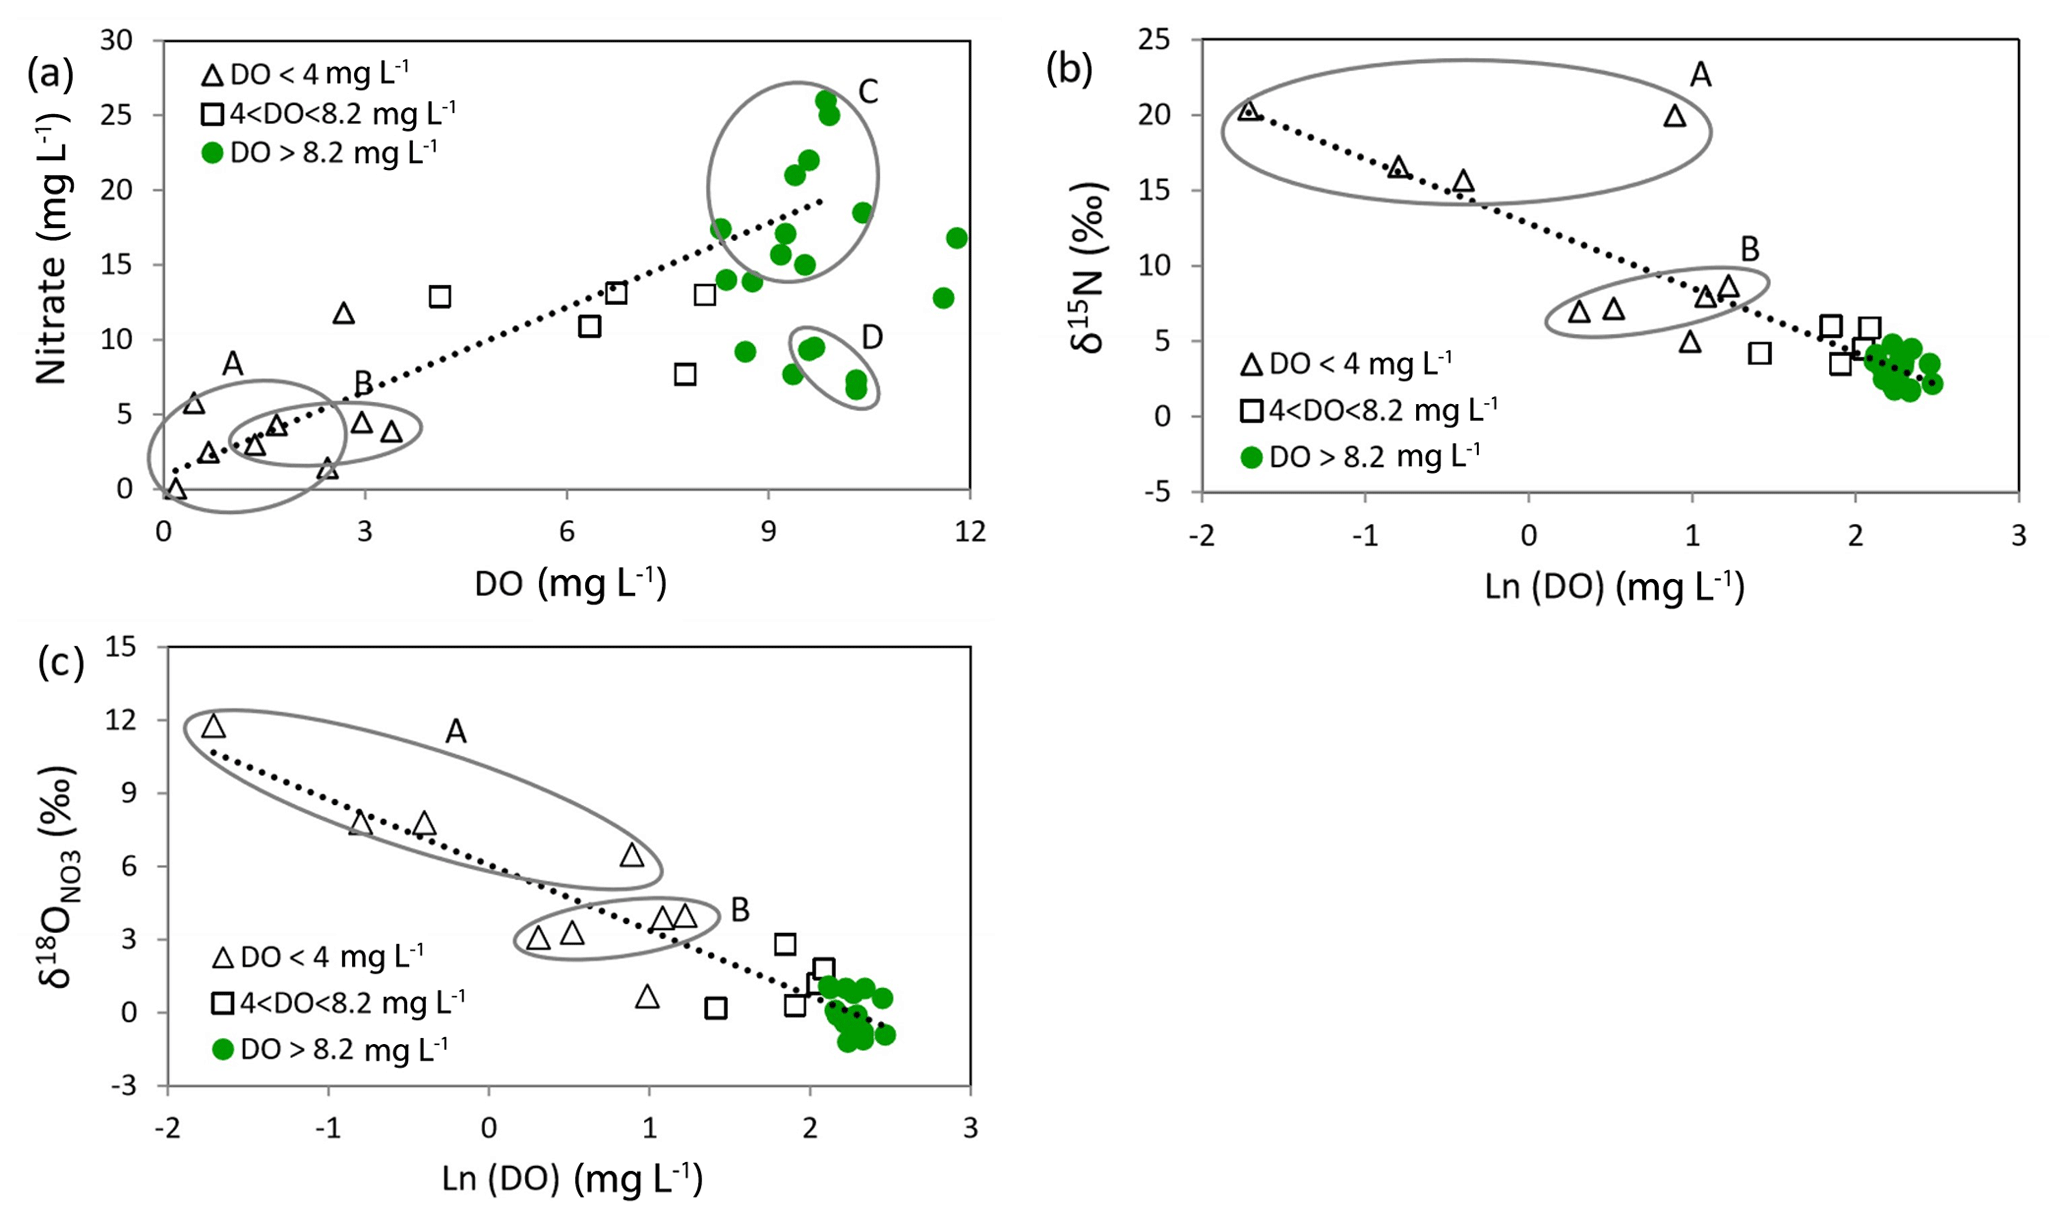
Figure 11(a) Plot of DO versus nitrate concentration. (b, c) Plots of Ln(DO) versus δ15N and .
Stenger et al. (2008) pointed out a similar situation where denitrification was inferred by unexpectedly low nitrate concentrations, but DO concentrations although varied were not particularly low. There was, however, an approximate correlation of nitrate and DO, as here. Manganese (Mn) and Iron (Fe) are other indicators of reducing conditions. Both cases (Stenger et al., 2008, and Tinwald) show the expected patterns of low nitrate concentrations when Mn and Fe are elevated (indicating very reduced conditions) and higher nitrate concentrations when Mn and Fe are very low (indicating oxidising conditions).
Several factors suggest that the denitrification imprint arises from localised denitrification in fine pores where conditions are reducing. (1) Koba et al. (1997) showed that denitrification can occur in anaerobic pockets within otherwise oxic sediments or water bodies. (2) The low values of ε(15N) and ε(18O) observed here indicate that denitrification occurs in fine pores or small-scale physical heterogeneity. (3) The occurrence of the denitrification imprint in moderately oxic waters (in which denitrification could not have occurred) means that the denitrification must have occurred in parts of the system which were much more reducing. Logically these are fine pores or inhomogeneities containing electron donors with heterotrophic bacteria.
The Tinwald study area is not in an area where the groundwater is generally reducing (Close et al., 2016), but nevertheless groundwater from some wells shows the denitrification imprints. It would appear that denitrification imprints in moderately oxic groundwater should be common, but many more nitrate isotope measurements would be required to show this.
As a final comment, there appear to be two types of pore space in the gravels at Tinwald, i.e. larger pores with mobile water and finer pores with almost stagnant water, that communicate by diffusion (e.g. Dann et al., 2009). This is likely to cause a slowing of nitrate transport and decrease of nitrate within the system as nitrate is transferred to the finer pores and denitrified.
Chemical measurements at Tinwald corroborated previous indications of an area of high nitrate concentration in the groundwater, which is accentuated by irrigation return flow in the area. During the recirculation process by spray irrigation of local groundwater, the chemical composition of the groundwater is enriched by recirculation of water already relatively high in chemicals, along with a further gain of chemicals from the soil. The irrigation return flow coefficient (C) of about 0.4 indicates a chemical enrichment factor of close to 2.6, in approximate agreement with the observed chemical enrichment factors for different elements. The stable isotopes of the groundwater show enrichment by evaporation, which can be accounted for by an average evaporative loss of about 5 % compared with the rainfall source of the water. Comparison of the isotopic compositions of groundwater in the Tinwald hotspot and outside it indicate that the irrigation input to recharge is about 40 %, in agreement with the chemical and recharge measurements. The effects of irrigation return flow are not often described but have considerable management implications, e.g. modelling of nitrate transport through soil–groundwater systems could be highly unrealistic if irrigation return flow effects are disregarded. In addition, too much fertiliser could be applied, leading to unnecessary economic cost and greater leaching of nitrate to groundwater if nitrate in irrigation water is not accounted for.
Irrigation return flow also appears to have caused a blending of the nitrates from different sources in the soil as shown by their nitrate isotope compositions. The blended source is dominated by fertiliser which has been transformed by the soil–plant system into organic N, which acts as the important soil N reservoir from which N is mineralised and oxidised during leaching, with effluent contributing to a minor extent. The blending of the different nitrate sources allowed clear identification of the denitrification process in this study. Denitrification enrichment factors of ‰ and ‰ were determined. The nitrate concentration and isotopic compositions were found to be correlated with the DO concentrations because of denitrification, despite most of the groundwaters having DO concentrations greater than the levels at which denitrification can occur. This denitrification imprint is attributed to localised denitrification in fine pores where conditions are reducing, aided by the irrigation return flow process. The implication is that denitrification could be occurring where it is not expected because groundwater DO concentrations are not low.
The fraction of water evaporated (1−f) is estimated by applying Eq. (3a) from Stewart (1975):
where δ is the enrichment due to evaporation and δend and β are given by
Here
δb is the isotopic composition of the atmospheric vapour relative to the initial composition of the water, αp and αk are the equilibrium and kinetic fractionation factors respectively between water and vapour, and h is the relative humidity.
Assuming the water composition increases from (−9.43, −65.4) to (−8.58, −61.2) due to evaporation, where the brackets signify (δ2H ‰, δ18O ‰), the isotopic enrichment relative to the initial composition of the water is (0.86, 4.5). δb and h were estimated to be (−12, −90) and 70 % respectively. With an average temperature of 15 ∘C, f was calculated to be 0.95 (or fraction of water evaporated, 1−f, was 0.05).
Chemical enrichment due to evaporation is given by
where C0 and C are the initial and final concentrations of the chemical.
The approximate Rayleigh formula (Kendall, 1998) was used to calculate the isotopic effects of denitrification on nitrate. This formula is
where δ is the δ15N or value of the nitrate remaining after the microbes have catalysed partial denitrification and δ0 is the initial isotopic composition of the nitrate. ε is the enrichment factor for the reaction, and f is the fraction of nitrate remaining after the reaction. Results of the calculation are given in Table 3.
A mixing curve between two nitrate source end members (soil nitrate and fertiliser plus effluent mixture nitrate) has been fitted to the solid green points (not plotted in the figures). The equation of the curve (Kendall, 1998) is
where δ is the δ15N or value of the sample nitrate, b is the δ15N or value of the fertiliser plus effluent nitrate, a describes the shape of the curve, and CN is the sample nitrate concentration. The best-fitting curves give δ15N=4.1 ‰ and ‰ for b (the fertiliser plus effluent nitrate).
The underlying research data are accessible from Aitchison-Earl (2019).
MKS wrote the paper with contributions from PLAE. PLAE initiated the study, gathered the data, and wrote the report (Aitchison-Earl, 2019).
The authors declare that they have no conflict of interest.
We are grateful to David Evans (Environment Canterbury) for locating and sampling from the groundwater wells. Andy Phillips (GNS Stable Isotope Laboratory) is thanked for the excellent nitrate isotope measurements.
This paper was edited by Brian Berkowitz and reviewed by two anonymous referees.
Agribase: Assure Quality, s.l. : s.n., available at: https://www.asurequality.com/services/agribase (last access: 14 July 2020), 2016.
Aitchison-Earl, P.: Springs of the Ashburton Catchment, Environment Canterbury Technical Report U04/79, Environment, Canterbury, 2000.
Aitchison-Earl, P.: Sources of nitrate in groundwater in the Tinwald, Ashburton area, Environment Canterbury Report No. R19/85, available at: https://api.ecan.govt.nz/TrimPublicAPI/documents/download/3664244 (last access: 13 July 2020), 2019.
Aravena, R. and Robertson, W.: Use of multiple isotope traces to evaluate denitrification in groundwater: study of nitrate from a large-flux septic system plume, Groundwater, 36, 975–982, 1998.
Barrell, D., Forsyth, P., and McSaveney, M.: Quaternary geology of the Rangitata Fan, Canterbury Plains, New Zealand, Institute of Geological and Nuclear Sciences Report 96/23, Institute of Geological and Nuclear Sciences, Lower Hutt, New Zealand, 1996.
Brown, K. B., McIntosh, J. C., Rademacher, L. K., and Lohse, K. A.: Impacts of agricultural irrigation recharge on groundwater quality in a basalt aquifer system (Washington, USA): a multi-tracer approach, Hydrogeol. J., 19, 1039–1051, https://doi.org/10.1007/s10040-011-0736-z, 2011.
Burbery, L.: Nitrate reactivity in groundwater: a brief review of the science, practical methods of assessment, and collation of results from New Zealand field investigations, J. Hydrol., 57, 41–69, 2018.
Burns, D. A., Boyer, E. W., Elliott, E. M., and Kendall, C.: Sources and transformations of nitrate from streams draining varying land uses: Evidence from dual isotope analysis, J. Environ. Qual., 38, 1149–1159, 2011.
Chakraborty, M., Mukherjee, A., and Ahmed, K. M.: A review of groundwater arsenic in the Bengal Basin, Bangladesh and India: from source to sink, Curr. Pollut. Rep., 1, 220–247, https://doi.org/10.1007/s40726-015-0022-0, 2015.
Clague, J. C., Stenger, R., and Clough, T. J.: Evaluation of the stable isotope signatures of nitrate to detect denitrification in a shallow groundwater system in New Zealand, Agr. Ecosyst. Environ., 202, 188–197, 2015.
Close, M. E., Rosen, M. R., and Smith, V. I.: Fate and transport of nitrates and pesticides in New Zealand's aquifers, in: Groundwaters of New Zealand, edited by: Rosen, M. R. and White, P. A., New Zealand Hydrological Society, Wellington, 185–220, 2001.
Close, M. E., Abraham, P., Humphries, B., Lilburne, L., Cuthill, T., and Wilson, S.: Predicting groundwater redox status on a regional scale using linear discriminant analysis, J. Contam. Hydrol., 191, 19–32, 2016.
Dann, R. L., Close, M. E., Flintoft, M. J., Hector, R., Barlow, H., Thomas, S., and Francis, G.: Characterization and estimation of hydraulic properties in an alluvial gravel vadose zone, Vadose Zone J., 8, 651–663, 2009.
Daughney, C. J. and Reeves, R. R.: Definition of hydrochemical facies in the New Zealand National Groundwater Monitoring Programme, J. Hydrol., 44, 105–130, 2005.
Dewandel, B., Gandolfi, J. M., de Condappa, D., and Ahmed, S.: An efficient methodology for estimating irrigation return flow coefficients of irrigated crops at watershed and seasonal scale, Hydrol. Process., 22, 1700–1712, 2007.
Edmunds, W. M., Ahmed, K. M., and Whitehead, P. G.: A review of arsenic and its impact in groundwater of the Ganges-Bramhaputra-Meghna delta, Bangladesh, Environ. Sci. Proc. Impact., 17, 1032–1046, https://doi.org/10.1039/c4em00673a, 2015.
Engelbrecht, R. L.: Land use history – Ashburton District, s.l., Report prepared for Environment Canterbury, Canterbury, 2005.
Environmental Canterbury: Canterbury Water Management Strategy, available at: https://www.ecan.govt.nz/your-region/plans-strategies-and-bylaws/canterbury-water-management-strategy/, last access: 14 July 2020.
Flintoft, M.: Nitrogen Recycling from St Leonards Drain, Report for Canterbury Regional Council, Canterbury, 2015.
Fogg, G. E., Rolston, D. E., Decker, D. L., Louie, D. T., and Grismer, M. E.: Spatial variation in nitrogen isotope values beneath nitrate contamination sources, Groundwater, 36, 418–426, 1998.
Hanson, C. R.: Nitrate concentrations in Canterbury groundwater – a review of existing data, Environment Canterbury Technical Report R02/17, Environment Canterbury, Canterbury, 2002.
Hanson, C. R. and Abraham, P.: Nitrate contamination and groundwater chemistry – Ashburton-Hinds plain, Environment Canterbury Technical Report R10/143, Environment Canterbury, Canterbury, 2010.
Hayward, S. A.: Christchurch-West Melton groundwater quality: A review of groundwater quality monitoring data from January 1986 to March 2002, Environment Canterbury Technical Report U02/47, Environment Canterbury, Canterbury, 2002.
Jongens, R., Barrell, D., Campbell, J., and Pettinga, J.: Faulting and folding beneath the Canterbury Plains identified prior to the 2010 emergence of the Greendale fault, NZ J. Geol. Geophys., 55, 169–176, 2012.
Kaushal, S. S., Groffman, P. M., Bland, L. E., Elliott, E. M., and Shields, C. A., and Kendall, C.: Tracking non-point source nitrogen pollution in human-impacted watersheds, Environ. Sci. Technol., 45, 8225–8232, 2011.
Kendall, C.: Tracing nitrogen sources and cycles in catchments, in: Isotope tracers in catchment hydrology, edited by: Kendall, C. and McDonnell, J. J., Elsevier Science, Amsterdam, the Netherlands, 519–576, 1998.
Kloppmann, W., Otero, N., Mayer, B., Sebilo, M., Gooddy, D. C., Lapworth, D., Surridge, B., Petelet, E., Flehoc, C., and Baran, N.: Limitations of the isotopic composition of nitrates as a tracer of their origin, Geophys. Res. Abstr., 20, EGU2018-2617, 2018.
Koba, K., Tokuchi, N., Wada, E., Nakajima, T., and Iwatsubo, G.: Intermittent denitrification: The application of a 15N natural abundance method to a forested ecosystem, Geochim. Cosmochim. Ac., 61, 5043–5050, 1997.
Landcare Research: Soils and climates in Canterbury: Clusters for matrix for good management Project, Prepared for Environment Canterbury, Environment Canterbury, Canterbury, 2015.
LINZ – Land Information New Zealand: Base map data for roads, rivers, and streams, available at: https://www.linz.govt.nz/ (last access: 13 July 2020), 2019.
Mariotti, A., Landreau, A., and Simon, B.: 15N isotope biogeochemistry and natural denitrification process in groundwater: Application to the chalk aquifer of northern France, Geochim. Cosmochim. Ac., 52, 1869–1878, 1988.
McIlvin, M. R. and Altabet, M. A.: Chemical conversion of nitrate and nitrite to nitrous oxide for nitrogen and oxygen isotopic analysis in freshwater and seawater, Anal. Chem., 77, 5589–5595, 2005.
McMahon, P. B. and Chapelle, F. H.: Redox processes and water quality of selected principal aquifer systems, Ground Water, 46, 259–271, 2008.
Mengis, M., Walther, U., Bernasconi, S. M., and Wehrli, B.: Limitations of using δ18O for the source identification of nitrate in agricultural soils, Environ. Sci. Technol., 35, 1840–1844, 2001.
Ministry of Health: Drinking-water Standards for New Zealand 2005, revised 2008, Ministry of Health, Wellington, 2008.
OECD: OECD Compendium of Agri-environmental Indicators, OECD Publishing, Paris, https://doi.org/10.1787/9789264186217-en, 2013.
OECD: Water resources management, in: OECD Environmental Performance Reviews: New Zealand 2017, OECD Publishing, Paris, https://doi.org/10.1787/9789264268203-11-en, 2017.
Pangborn, M. C. and Woodford, K. B.: Canterbury dairying – A study in land use change and increasing production, in: Congress Proceedings: 18th International Farm Management Congress, Methven, New Zealand, 81–87, available at: http://ifmaonline.org/contents/pr-canterbury-dairying-a-study-in-land-use-change-and (last access: 13 July 2020), 2011.
Park, Y., Kim, Y., Park, S.-K., Shin, W.-J., Lee, K.-S.: Water quality impacts of irrigation return flow on stream and groundwater in an intensive agricultural watershed, Sci. Total Environ., 630, 859–868, 2018.
Rivett, M. O., Buss, S. R., Morgan, P., Smith, J. W. N., and Bemment, D. B.: Nitrate attenuation in groundwater: A review of biogeochemical controlling processes, Water Res., 42, 4215–4232, 2008.
Sánchez Pérez, J. M., Antiguedadb, I., Arratec, I., and García-Linares, C.: The influence of nitrate leaching through unsaturated soil on groundwater pollution in an agricultural area of the Basque country: a case study, Sci. Total Environ., 317, 173–187, 2003.
Scott, L.: Review of Environment Canterbury's oxygen-18 data, ECan Technical Report R14/128, Environment Canterbury, Canterbury, 2014.
Scott, L., Scott, M., and Wilkins, B.: Risk Maps of Nitrate in Canterbury Groundwater. Environment Canterbury Technical Report R20/18, Environment Canterbury, Canterbury, 2020.
Sebilo, M., Mayer, M., Nicolardot, B., Pinay, G., and Mariotti, M.: Long-term fate of nitrate fertilizer in agricultural soils, P. Natl. Acad. Sci. USA, 110, 18185–18189, 2013.
Somers, G. and Savard, M. M.: Stable ifcsotopes of nitrate reveal the important role of soil organic matter in mediating nitrogen transfer to groundwater with implications for consequences of climate change, in: GeoHalifax2009, 20–23 September 2009, Halifax, Nova Scotia, Canada, 1515–1522, 2009.
Spalding, R. F., Hirsh, A. J., Exner, M. E., Little, N. A., and Kloppenborg, K. L.: Applicability of the dual isotopes δ15 and δ18O to identify nitrate in groundwater beneath irrigated cropland, J. Contam. Hydrol., 220, 128–135, 2019.
Stenger, R., Barkle, G., Burgess, C., Wall, A., and Clague, J.: Low nitrate contamination of shallow groundwater in spite of intensive dairying: the effect of reducing conditions in the vadose zone-aquifer continuum, J. Hydrol., 47, 1–24, 2008.
Stenger, R., Clague, J. C., Morgenstern, U., and Clough, T. J.: Vertical stratification of redox conditions, denitrification and recharge in shallow groundwater on a volcanic hillslope containing relict organic matter, Sci. Total Environ., 639, 1205–1219, 2018.
Stewart, M. K.: Stable isotope fractionation due to evaporation and isotopic exchange of falling water drops: Applications to atmospheric processes and evaporation of lakes, J. Geophys. Res., 80, 1133–1146, 1975.
Stewart, M. K. and Morgenstern, U.: Age and source of groundwater from isotope tracers, in: Groundwaters of New Zealand, edited by: Rosen, M. R. and White, P. A., New Zealand Hydrological Society Inc., Wellington, 161–183, 2001.
Stewart, M. K. and Taylor, C. B.: Environmental isotopes in New Zealand hydrology. Part 1. Introduction: The role of oxygen-18, deuterium and tritium in hydrology, NZ J. Sci., 24, 295–311, 1981.
Stewart, M. K., Trompetter, V., van de Raaij, R.: Age and source of Canterbury plains groundwater, Environment Canterbury Report U02/30, Environment Canterbury, Cantberbury, 2002.
Stewart, M. K., Stevens, G., Thomas, J., van de Raaij, R., and Trompetter, V.: Nitrate sources and residence times of groundwater in the Waimea Plains, Nelson, J. Hydrol., 50, 313–338, 2011.
Stewart, M. K., Morgenstern U., Tsujimura, M., Gusyev, M. A., Sakakibara, K., Imaizumi, Y., Rutter, H., van der Raaij, R. W., Etheridge, E., Scott, L., and Cox, S. C.: Mean residence times and sources of Christchurch springs, J. Hydrol., 57, 81–94, 2018.
Taylor, C. B., Wilson, D. D., Brown, L. J., Stewart, M. K., Burdon, R. J., and Brailsford, G. W.: Sources and flow of North Canterbury Plains groundwater, New Zealand, J. Hydrol., 106, 311–340, 1989.
Thorpe, H. R. and Scott, D. M.: An evaluation of four soil moisture models for estimating natural ground water recharge. J. Hydrol., 38, 179–209, 1999.
Trevis, I. A.: Assessing and tracking nitrate contamination from a point source and the effects on the groundwater systems in Mid Canterbury, New Zealand, MSc Thesis, University of Canterbury, Christchurch, New Zealand, 2012.
van der Raaij, R. W.: Groundwater age determination of Ashburton District Council water supply wells, GNS Science Consultancy Report 2013/80, GNS Science Consultancy, Lower Hutt, New Zealand, 2013.
Wells, N. S., Baisden, W. T., and Clough, T. J.: Ammonia volatilisation is not the dominant factor in determining the soil nitrate isotopic composition of pasture systems, Agr. Ecosyst. Environ., 199, 290–300, https://doi.org/10.1016/j.agee.2014.10.001, 2015.
Wells, N. S., Baisden, W. T., Horton, T., and Clough, T. J.: Spatial and temporal variations in nitrogen export from a New Zealand pastoral catchment revealed by stream water nitrate isotopic composition, Water Resour. Res., 52, 2840–2854, 2016.
Wexler, S. K., Goodale, C. L., McGuire, K. J., Bailey, S. W., and Groffman, P. M.: Isotopic signals of summer denitrification in a northernhardwood forested catchment, P. Natl. Acad. Sci. USA, 111, 16413–16418, 2014.
WHO – World Health Organization: Nitrate and nitrite in drinking-water: Background document for development of WHO Guidelines for drinking-water quality, World Health Organization, Geneva, 2016.
WHO – World Health Organization: Guidelines for drinking-water quality, 4th Edn., incorporating the 1st addendum, World Health Organization, Geneva, 2017.
Xue, D. J., Botte, J., De Baets, B., Accoe, F., Nestler, A., Taylor, P., Van Cleemput, O., Berglund, M., and Boeckx, P.: Present limitations and future prospects of stable isotope methods for nitrate source identification in surface- and groundwater, Water Res., 43, 1159–1170, 2009.
Zhang, Y., Shi, P., Song, J., and Li, Q.: Application of nitrogen and oxygen isotopes for source and fate identification of nitrate pollution in surface water: A review, Appl. Sci., 9, 18, https://doi.org/10.3390/app9010018, 2019.
- Abstract
- Introduction
- Background
- Methods
- Results
- Discussion
- Conclusions
- Appendix A: Isotopic effect of evaporation on water
- Appendix B: Isotopic effect of denitrification on nitrate
- Appendix C: Isotopic effect of mixing of two sources of nitrate
- Data availability
- Author contributions
- Competing interests
- Acknowledgements
- Review statement
- References
hotspotsin nitrate concentrations in groundwater and
denitrification imprintswhere nitrate concentrations are reduced by denitrification although the dissolved oxygen concentration is not low. The work is highly significant for modelling of nitrate transport through soil–groundwater systems, for understanding denitrification processes, and for managing fertilizer application to land.
- Abstract
- Introduction
- Background
- Methods
- Results
- Discussion
- Conclusions
- Appendix A: Isotopic effect of evaporation on water
- Appendix B: Isotopic effect of denitrification on nitrate
- Appendix C: Isotopic effect of mixing of two sources of nitrate
- Data availability
- Author contributions
- Competing interests
- Acknowledgements
- Review statement
- References