the Creative Commons Attribution 4.0 License.
the Creative Commons Attribution 4.0 License.
 | 08 Jun 2020
Partitioning growing season water balance within a forested boreal catchment using sap flux, eddy covariance, and a process-based model
Kersti Haahti
Pantana Tor-ngern
Jinshu Chi
Eliza Maher Hasselquist
Hjalmar Laudon
Samuli Launiainen
Matthias Peichl
Jörgen Wallerman
Niles J. Hasselquist
Although it is well known that evapotranspiration (ET) represents an important water flux at local to global scales, few studies have quantified the magnitude and relative importance of ET and its individual flux components in high-latitude forests. In this study, we combined empirical sapflux, throughfall, and eddy-covariance measurements with estimates from a process-based model to partition the water balance in a northern boreal forested catchment. This study was conducted within the Krycklan catchment, which has a rich history of hydrological measurements, thereby providing us with the unique opportunity to compare the absolute and relative magnitudes of ET and its flux components to other water balance components. During the growing season, ET represented ca. 85 % of the incoming precipitation. Both empirical results and model estimates suggested that tree transpiration (T) and evaporation of intercepted water from the tree canopy (IC) represented 43 % and 31 % of ET, respectively, and together were equal to ca. 70 % of incoming precipitation during the growing season. Understory evapotranspiration (ETu) was less important than T and IC during most of the study period, except for late autumn, when ETu was the largest ET flux component. Overall, our study highlights the importance of trees in regulating the water cycle of boreal catchments, implying that forest management impacts on stand structure as well as climate change effects on tree growth are likely to have large cascading effects on the way water moves through these forested landscapes.
- Article
(3116 KB) - Full-text XML
-
Supplement
(1007 KB) - BibTeX
- EndNote


In the hydrological cycle, water enters terrestrial ecosystems mainly through precipitation (P). This water leaves terrestrial ecosystems either through evapotranspiration (ET) back to the atmosphere or as stream runoff (Q). At a global scale, ET accounts for ca. 60 % of the annual terrestrial P (Oki and Kanae, 2006), yet the relative importance of ET varies considerably among different biomes, ranging between 55 % and 80 % of incoming P (Peel et al., 2010). Understanding this variation in ET is crucial, as the difference between incoming P and ET represents the available water in terrestrial ecosystems, which in turn has cascading effects on streamflow (Karlsen et al., 2016; Koster and Milly, 1997), groundwater recharge (Githui et al., 2012), and the ecosystem carbon cycle (Wang et al., 2002; Öquist et al., 2014).
Boreal forests cover ca. 12 million km2 of land area and represent the second largest biome behind tropical forests (Bonan, 2008). Given their large size, boreal forests regulate water and energy fluxes over a vast area and thus play an important role in global hydrology and climatology (Bonan, 2008; Baldocchi et al., 2000; Chen et al., 2018). Boreal forests also play an important role in the global carbon cycle (Goodale et al., 2002), sequestering ca. 0.5 Pg of carbon annually and storing approximately one-third of the global terrestrial carbon (Bradshaw and Warkentin, 2015; Pan et al., 2011). However, few studies have partitioned the water balance in boreal forests (Talsma et al., 2018; Peel et al., 2010; Tor-ngern et al., 2018). In the ones that have, ET has been shown to represent 45 %–85 % of incoming P (Peel et al., 2010).
Such large variation in ET across and within biomes may in part be explained by the fact that ET represents two fundamentally different water flux pathways in terrestrial ecosystems: (1) transpiration (T) through stomata of plants and (2) evaporation from wet surfaces. These two pathways are controlled in different ways and to varying degrees by environmental factors and thus are likely to respond differently to changes in environmental conditions and vegetation dynamics. Specifically, T occurs mainly during the growing season and is thus governed by plant physiological processes, whereas evaporation occurs throughout the year and is strongly controlled by vapor pressure deficit, surface wetness, and aerodynamic conductance (Katul et al., 2012). Thus, quantifying the magnitude and spatiotemporal variation of T and evaporation separately is crucial to better understanding how water moves through boreal forest landscapes.
Research investigating the biotic and abiotic controls on ET has a long history, dating back centuries (Katul et al., 2012; Brutsaert, 1982). However, efforts to separately estimate T and evaporation began in the 1970s (see Kool et al., 2014) and ever since there has been an increasing number of studies partitioning ET (Stoy et al., 2019; Schlesinger and Jasechko, 2014). There are a number of different approaches and methodologies to partition ET into its individual flux components (Kool et al., 2014), including empirical measurements (Mitchell et al., 2009; Cavanaugh et al., 2011; Good et al., 2014; Sutanto et al., 2014) as well as a number of different process-based models (Sutanto et al., 2012; Stoy et al., 2019; Launiainen et al., 2015). Each of these different approaches have their advantages and disadvantages, and it has been shown that the relative contribution of different ET flux components differs depending on the approach used (Schlesinger and Jasechko, 2014). It has therefore been highlighted that the use of multiple methods is desirable to more accurately partition ET into its individual flux components (Stoy et al., 2019).
At a global scale, it was recently estimated that T represents 80 % to 90 % of terrestrial ET (Jasechko et al. 2013). The high estimate of T ∕ ET reported by Jasechko et al. (2013) has been strongly contested (Coenders-Gerrits et al., 2014), with a more conservative estimate of T representing ca. 60 % of ET being more generally accepted (Wei et al., 2017; Schlesinger and Jasechko, 2014). Most studies typically partition ET at the stand or plot scale without considering the broader hydrological cycle (e.g., Cienciala et al., 1997; Grelle et al., 1997; Wang et al., 2017; Ohta et al., 2001; Iida et al., 2009; Hamada et al., 2004; Maximov et al., 2008; Warren et al., 2018; Schlesinger and Jasechko, 2014). We are aware of only a few investigations that have partitioned ET at the catchment scale (Telmer and Veizer 2000; Sakkolat et al. 2013), and thus we have few empirical data about how T compares to other water fluxes (i.e., streamflow) in the terrestrial hydrological cycle.
Transpiration can be further partitioned between canopy trees and understory vegetation. Few studies have measured understory T, yet the ones that have suggest that understory T represents a small fraction of total T (Kulmala et al., 2011; Palmroth et al., 2014), but the contribution is strongly dependent on canopy tree structure (Constantin et al., 1999; Baldocchi et al., 1997; Domec et al., 2012). Similarly, total evaporation can be partitioned into evaporation of precipitation intercepted by canopy trees (IC) and evaporation from the forest floor, which includes evaporation from non-stomatal surfaces, bare ground, and open water. At a global scale, IC represents roughly 20 % of incoming P (Wang et al., 2007), and in many forested ecosystems IC represents a substantial portion of total evaporation (Barbier et al., 2009; Gu et al., 2018). By separating T and evaporation into their different flux components, it is possible to directly assess the important role trees play in the terrestrial hydrological cycle.
In this study, we use a combination of empirical data derived from eddy-covariance and sapflux measurements as well as rain gauges collecting open sky and throughfall precipitation to partition ET into its individual flux components during a single growing season in a northern boreal headwater catchment. Additionally, we used a multi-layer, multi-species soil–vegetation–atmosphere transfer model (APES model based on Launiainen et al., 2015) as an independent approach to partition ET. In doing so, the main objectives of this study were to (i) constrain the absolute and relative magnitudes of ET flux components by using both empirical data and model simulations and (ii) to explore how they vary during the course of the growing season. This study was conducted within the Krycklan catchment, which has a rich history of hydrological measurements (see Laudon et al., 2013; Laudon and Sponseller, 2018), thereby providing us with the unique opportunity to compare different ET flux components to other water balance components (i.e., streamflow) as well as to directly assess the important role trees play in the boreal hydrological cycle.
2.1 Study site
The study was conducted in the 14 ha C2 subcatchment (64.26∘ N, 19.77∘ E) within the 68 km2 Krycklan catchment study area (Laudon et al., 2013) in northern Sweden (Fig. 1). The Krycklan catchment study area is unique as it is one of the oldest long-term catchment monitoring sites at northern latitudes, with continuous hydrological and meteorological measurements dating back to the early 1980s (Laudon et al., 2017). The 30-year mean annual temperature in Krycklan (1986–2015) is 2.1 ∘C, with the highest mean monthly temperature in July and the lowest temperature in January (14.6 and −8.6 ∘C, respectively). Mean annual precipitation is 619 mm yr−1, with the majority (ca. 60 %) falling in the form of rain. Soils within the C2 subcatchment are dominated by glacial till (84 %), predominately of stony, sandy texture on gneiss and granite. There is considerable variation in the thickness of the humus layer, yet the average is 8 cm (Odin, 1992). The average slope is 6 % and the outlet of the C2 subcatchment is located at 243 m a.s.l.

Figure 1Location of the study area in northern Sweden. (a) The outline of Sweden with the location of the Arctic Circle for reference. (b) The boundary of the 68 km2 Krycklan catchment with various subcatchments in different colors; C2 subcatchment in yellow. Throughfall (TF) measurements were made ca. 1 km from the C2 subcatchment and are shown on this map (blue circle). (c) High-resolution aerial photograph with 5 m contour intervals (white line) and the C2 subcatchment boundary (yellow line). Sap flow measurements were made at three nodes (green circles) and all environmental and eddy-covariance data were taken from the ICOS tower (yellow circle). (d) Picture of the forest stand with understory vegetation that is characteristic of the C2 subcatchment.
The C2 subcatchment is completely covered by an old growth (> 100 years) mixed forest stand of Picea abies (61 %), Pinus sylvestris (34 %), and Betula (5 %) (Laudon et al. 2013). The understory consists of a continuous layer of bilberry (Vaccinium myrtillus), lingonberry (Vaccinium vitis idaea), and mosses (Pleurozium schreberi and Hylocomium splendens) with no bare ground. Aside from the small (< 0.5 m wide) headwater stream, there is no open water within the C2 subcatchment. Similar forest stands extend to the east and west of the C2 subcatchment boundaries by several hundred meters (Fig. 1c). Within the C2 subcatchment, there is also the Integrated Carbon Observation System (ICOS) Svartberget ecosystem–atmosphere station which provides data on greenhouse gas, water, and energy fluxes as well as meteorological, vegetation, and soil environmental variables (http://www.icos-sweden.se/station_svartberget.html, last access: 3 January 2018). Our study period was the growing season of 2016. The water balance and ET partitioning were restricted to July–October due to measurement availability. The 2016 year was a typical year in terms of precipitation and stream runoff (Supplement Fig. S1).
2.2 Measurements of the water balance components
We used the hydrological mass balance approach in combination with empirical measurements of vertical and horizontal water fluxes to quantify the water balance components within the C2 subcatchment. The mass balance equation is
where ds∕dt is the change in soil water storage per unit area and Q is stream runoff. ET was measured using the eddy-covariance technique and partitioned into components as
where canopy tree T was determined using sapflow sensors and evaporation of intercepted P from the tree canopy (IC) was determined as the difference between open sky precipitation and water collected on an event basis in rain gauges placed below the canopy (see below). Understory evapotranspiration (ETu) was not directly measured in this study, but was instead calculated as
Because IC was estimated on an event basis, our estimate of ETu was for the entire growing season. Daily stream runoff (Q) was calculated as daily discharge, obtained from the Svartberget data portal (https://franklin.vfp.slu.se/, last access: 2 August 2018), per catchment area. Change in soil water storage (ds∕dt), which includes groundwater recharge, was calculated as the residual of the hydrological mass balance (Eq. 1).
Environmental data used in this study included open sky precipitation (T200BM Geonor Inc., New Jersey, USA), air temperature and relative humidity (MP102H Rontronic AG, Switzerland), wind speed (METEK uSonic3 Class-A, Meteorologische Messtechnik GmbH, Germany), atmospheric pressure (PTB210 Vaisala Inc., Finland), incoming shortwave and longwave radiation (CNR4 Kipp & Zonen B.V., Netherlands), photosynthetically active radiation (PAR; SQ-110 Apogee Instruments Inc., Utah, USA), as well as soil temperature and moisture measured at 0.05 m depth (Thermocouple, Type E Campbell Scientific Inc., Utah, USA). All environmental data were obtained from the ICOS portal, Svartberget station (http://www.icos-sweden.se/data.html, last access: 3 January 2018).
ET was obtained from the ICOS-Svartberget eddy-covariance (EC) system installed at 32.5 m above the ground. The EC instrumentation consists of a 3D ultrasonic anemometer (METEK uSonic3 Class-A, Meteorologische Messtechnik GmbH, Germany) for measuring wind components (u, v, w) and an enclosed infrared gas analyzer (LI-7200, LI-COR Biosciences, USA) for measuring CO2 and H2O concentrations. The 10 Hz raw data were processed in the EddyPro® software (version 6.2.0, LI-COR Biosciences, USA) to obtain the 30 min averaged fluxes. A detailed description of the EC data processing and quality control can be found in Chi et al. (2019). In brief, the half-hourly ET data were corrected for changes in the storage term which was estimated from concentration profile measurements at several levels (4, 10, 15, 20, 25, and 30 m) between the forest ground and the measurement height. ET data were then filtered based on the EddyPro quality check flagging policy which includes tests on steady state and developed turbulent conditions based on Mauder and Foken (2004), advection effects (Wharton et al., 2009), wind distortion, power failure, and site maintenance activities. Gaps in the half-hourly ET data were filled based on empirical relationships between ET and net radiation using the REddyProcWeb online tool (Wutzler et al., 2018). Based on the Kljun footprint model (Kljun et al., 2015), the EC footprint (90 %) covers a measurement area of ∼0.5 km2 with a mean upwind fetch of ∼400 m surrounding the tower. The uncertainty in the EC-based ET was estimated by the Monte Carlo simulation (Richardson and Hollinger, 2007).
Evaporation of intercepted P from the tree canopy (IC) was determined by subtracting throughfall (TF) from open sky P:
Previous research within the Krycklan catchment has shown that during the growing season stemflow is negligible in forest stands dominated by P. sylvestris and P. abies (Venzke, 1990) and is consequently omitted in this study. Measurements of TF were made 1 km from the study subcatchment (Fig. 1b) by installing 25 rain gauges in a similar mature mixed coniferous forest stand. The design of rain gauges followed WMO (Bidartondo et al., 2001) requirements, which included a stable rim with a sharp edge, an orifice area of 200 cm2, hydrophobic plastic material, and a narrow entrance to the receiving container to prevent evaporation. To test custom-made gauges, three of them were installed next to a standardized precipitation collector, Geonor T200BM (Geonor Inc., New Jersey, USA), at the Svartberget field station for the entire period and the difference in captured rain was always less than 3 %. Measurements of TF were made between the beginning of July and the end of October 2016. Water was collected from individual rain gauges immediately after each rain event, resulting in event-based IC estimates (Gash, 1979). Spatial canopy density data acquired from airborne laser scanning (ALS) were used in the FUSION software (McGaughey, 2012) to characterize the canopy structure above each throughfall collector (2 m radius around each collector). We found that the absolute deviation of ALS height measurements from overall median height (ElevMADmedium) showed the highest correlations with IC and could explain 77 % of the variation in seasonal IC (Table S1 in the Supplement). IC within the C2 subcatchment was estimated as a weighted average of the 25 throughfall collectors. The weighting was based on the ElevMADmedium around each throughfall collector and the frequency distribution of this metric within the entire C2 subcatchment. To quantify the uncertainty of event-based IC, we grouped throughfall collectors into five groups based on ElevMADmedium and calculated the standard deviation for each group and event. To eliminate potential differences between open sky P within the C2 subcatchment and sampling plot, we estimated the fraction of seasonal interception loss and multiplied that value by cumulative precipitation at the study catchment.
Canopy tree transpiration (T) was estimated using sapflux measurements. Within the EC footprint area, we selected three locations (hereafter referred to as nodes) to measure T (Fig. 1c). Within each node (25 m radius), we selected 20 trees (10 Pinus sylvestris and 10 Picea abies) that represented the diameter distribution of the entire C2 subcatchment forest stand. Although Betula spp. is also present within the C2 subcatchment, they contribute less than 5 % of the basal area, and we therefore focused on the two dominant conifer species (Laudon et al., 2013).
Sapflux density (JS, g m s−1) was measured at breast height (1.3 m above ground) using custom-made heat dissipation-type sapflow sensors (Granier, 1987). Each pair of sensors consisted of heated and non-heated probes made from 19-gauge hypodermic needles with metallic, sensing parts cut into 20 mm length. These sensors were installed on the selected trees with 10–15 cm spacing between probes and all sensors were covered with reflective insulation to reduce external temperature influences. To account for azimuthal (Oren et al., 1999; Lu et al., 2000; James et al., 2002; Tateishi et al., 2008) variation in JS, we installed sensors on the northern, eastern, southern, and western sides of the stems in six of the selected trees from all nodes (n=3 per species). We also installed sensors at four 20 mm interval depths from the inner bark (i.e., 0–20, 20–40, 40–60, and 60–80 mm) in a subset of tree species to account for radial variation in JS (Phillips et al., 1996; Ford et al., 2004; Oishi et al., 2008). Data of temperature difference between the two probes were collected as 30 min averages of voltage difference (ΔV, mV) using a data logger (CR1000, Campbell Scientific, Logan, UT, USA) which was set to record data every 30 s. The collected data were converted to JS using the empirical equation (Granier, 1987)
where ΔVm is the maximum voltage difference under zero flow conditions which occur at night and when vapor pressure deficit is low. We employed the Baseliner program version 4.0 (Oishi et al., 2016) to convert the ΔV data to JS. This accounts for nocturnal fluxes resulting from nighttime transpiration and water recharge in stems by selecting the highest daily ΔV to represent ΔVm. The selection criteria for determining ΔVm were conditions when (1) the average, minimum 2 h vapor pressure deficit is less than 0.02 kPa, thus ensuring negligible transpiration, and when (2) the standard deviation of the four highest values is less than 0.5 % of the mean of these values, therefore ensuring that water storage change above the sensor height is negligible compared to JS.
To determine daily T (mm d−1), we first integrated JS over 24 h as daily JS (JSD, g cm d−1) to avoid issues related to tree water storage and measurement errors (Phillips and Oren, 1998). Then, we tested JSD variations within sapwood areas in the trees and found insignificant azimuthal variation (p≥0.23) but significant variation along sapwood depth (p < 0.001). Accordingly, we performed a scaling based on the radial variation of JSD. First, we evaluated the relationship between the outermost JSD at 0–20 mm (JSD, 0–20 mm) sapwood depth and DBH and found no significant effects of stem size on JSD, 0–20 mm in either species (p≥0.1). Therefore, we averaged JSD, 0–20 mm across all sampled trees and used the data for scaling. Next, we calculated the ratios between JSD at inner sapwood depths (i.e., 20–40, 40–60, and 60–80 mm) and JSD, 0–20 mm during the study period. Because there was no significant relationship between the ratios and stem size (p≥0.16), we averaged the ratios across all trees for each species in each day and used the daily specific ratios between JSD in the inner sapwood depths and the outermost JSD (JSD, 0–20 mm) for scaling. Sapwood area (AS, cm2) for each tree species (P. sylvestris and P. abies) was estimated from allometric equations derived from > 20 tree cores taken at breast height for each tree species in 2017. Tree cores were taken from individual trees representing the full range of stem diameter distribution at the site and stained with alcohol iodine solution (Eades, 1937) to record the depth of active sapwood, thereby allowing the estimation of AS of all trees. For scaling, we first estimated the weighted average JSD of each species (JSD,species, g cm−2 d−1) using data from the three nodes by
i is the sapwood depth from the inner bark, i.e., 0–20, 20–40, 40–60, and 60–80, and > 80 mm, JSD,i is the average daily sapflux density for each layer and calculated as the product of the averaged ratios, JSD, 0–20 mm, AS,i is the sapwood area of layer i, and AS,all is the total sapwood area of all trees of the species from all nodes. Then, using this weighted average JSD by species, the canopy transpiration of the C2 subcatchment (T, mm d−1) was estimated using the sapwood area index (SAI, m m) of each species, which was derived from data from seven permanent forest inventory plots located within the C2 subcatchment.
where 10 is the unit conversion factor. Regarding methodological considerations, the most common criticism of the heat dissipation method for sapflux measurement is that it underestimates the flux (Sun et al., 2012; Steppe et al., 2010). However, according to the analysis of 54 data from global pine forests in Tor-ngern et al. (2017), estimates from other sapflux measurement methods showed no particular bias from those with the heat dissipation one as used in this study. In addition, it has previously been shown that radial variation of sapflux density and tree size were more important than species in scaling from single-point sapflux measurements to stand transpiration (Hernandez-Santana et al., 2015), both of which were considered in our analysis. In this study, uncertainty of daily transpiration is represented by standard deviation of T within the seven permanent forest inventory plots.
2.3 Modeling ET partitioning and water balance
We used a slightly modified version of the APES soil–vegetation–atmosphere transfer model (Launiainen et al., 2015) to partition ET and the water balance within the C2 subcatchment during the studied growing season. APES simulates coupled water, energy, and carbon cycles in a forest ecosystem consisting of a multi-layer, multi-species tree stand, understory vegetation, and a bryophyte layer on the forest floor above a multi-layer soil profile. In APES, the canopy is conceptualized as a layered horizontally homogeneous porous medium characterized by a leaf-area density (LAD, m2 leaves m−3) distribution. The model solves the transfer and absorption of shortwave and longwave radiation (Zhao and Qualls, 2005, 2006) and the transport of scalars (air temperature, H2O, CO2) and momentum among canopy layers (here n=100). Partitioning of rainfall between interception and throughfall, as well as the energy balance of wet leaves, are also solved for each canopy layer (Watanabe and Mizutani, 1996). The canopy LAD distribution is the superposition of LAD distributions for each plant type considered (e.g., main tree species and understory vegetation). Each plant type can have its unique physiological properties (i.e., parameter values) regulating phenology, photosynthetic capacity, and stomatal conductance.
In APES, the coupled leaf gas and energy exchange is calculated separately for sunlit and shaded leaves of each plant type and canopy layer using well-established photosynthesis–stomatal conductance theories (Medlyn et al., 2011; Farquhar et al., 1980) and leaf energy balance (Launiainen et al., 2015). A separate forest floor component describes water, energy, and CO2 dynamics in the bryophyte layer (Kieloaho and Launianen, 2018; Launiainen et al., 2015). The model thus allows description of the impact of microclimatic gradients along the canopy and partitioning of water fluxes between canopy layers and tree species as well as between understory T and evaporation.
To model the coupled water–energy–carbon cycles, with specific focus on ET partitioning, the vegetation and soil characteristics at the C2 subcatchment were assumed to be horizontally homogenous. The LAD distributions for the main tree species (Picea abies, Pinus sylvestris, and Betula pendula) were estimated based on stand inventories from seven forest plots (10 m radius) within the C2 subcatchment. The frequency distributions of diameter at breast height for each species were converted into needle/leaf biomass and canopy height using allometric equations in Marklund (1988) and Näslund (1936), respectively. The LAD profiles were then derived by applying crown-shaped models of Tahvanainen and Forss (2008) and the specific leaf area values reported in Harkonen et al. (2015). As there are many uncertainties in estimating LAI based on diameter at breast height alone, the one-sided stand leaf area index (LAItot) was further scaled to match the LAI estimated from optical measurements done by the LAI-2200C Plant Canopy Analyzer. The measured LAILicor=2.75 m2 m−2 (Selin, 2019) was corrected for clumping using a correction factor 1.6–1.9 (Stenberg et al., 1994), resulting in LAItot between 4.4 and 5.2 m2 m−2. The normalized LAD distributions of each plant type and stand are shown in Fig. S2. In the simulations, understory LAIunder was 0.4–0.8 m2 m−2 and the bryophyte layer characterized as feather moss. A full list of model parameters is provided in Tables S2 and S3.
As forcing variables, the model uses time-averaged (here half-hourly) meteorological variables at a reference level above the canopy. These include P, downwelling longwave radiation, direct and diffuse photosynthetically active and near-infrared radiation, wind speed (or friction velocity), atmospheric pressure, air temperature, and mixing ratios of H2O and CO2. We used measured soil moisture and soil temperature at the depth of 0.05 m as lower boundary conditions for the model. The half-hourly forcing data were obtained from the Svartberget ICOS station when available, while meteorological measurements from Degerö ICOS station (at 15 km distance) were used in gap filling. Precipitation records from Degerö were corrected to match the daily precipitation measured at another station (at 1 km distance from the C2 center) before using them for gap filling.
We simulated the period from May to October 2016 and included parameter uncertainty through parameter ranges for LAItot, LAIunder, maximum carboxylation rate (Vcmax) at 25 ∘C, and interception capacity (see Tables S2 and S3). To assess model performance, model results were evaluated at a half-hourly time interval against ecosystem fluxes (net shortwave and longwave radiation, latent heat, sensible heat, and gross primary productivity) observed at the ICOS-Svartberget EC tower (Chi et al., 2019). Performance test against the simulation results for the center of the parameter space showed a good agreement between modeled and measured variables (Fig. S3). Net shortwave radiation and longwave radiation were predicted with good accuracy, while sensible heat flux was slightly overestimated and latent heat flux consequently underestimated. Model results of ET components were analyzed on a daily or rain-event-based time interval and compared against corresponding estimates derived from empirical measurements.
Meteorological conditions during the 2016 growing season (Fig. 2) were similar to long-term averages. The highest daily mean temperatures were in the middle of July (ca. 20 ∘C), followed by a gradual decrease to around 0 ∘C at the end of October. As observed for air temperature, PAR peaked at the end of July and then decreased to less than 20 W m−2 at the end of October. Daily vapor pressure deficit (VPD) ranged between 0 and 1.5 kPa, with a notable peak in the middle of July, which also corresponded to a peak in air temperature. Total precipitation over the study period was 226 mm, with a strong peak in early August and another at the end of September. These rain events also resulted in peaks in stream runoff (Fig. 2c).
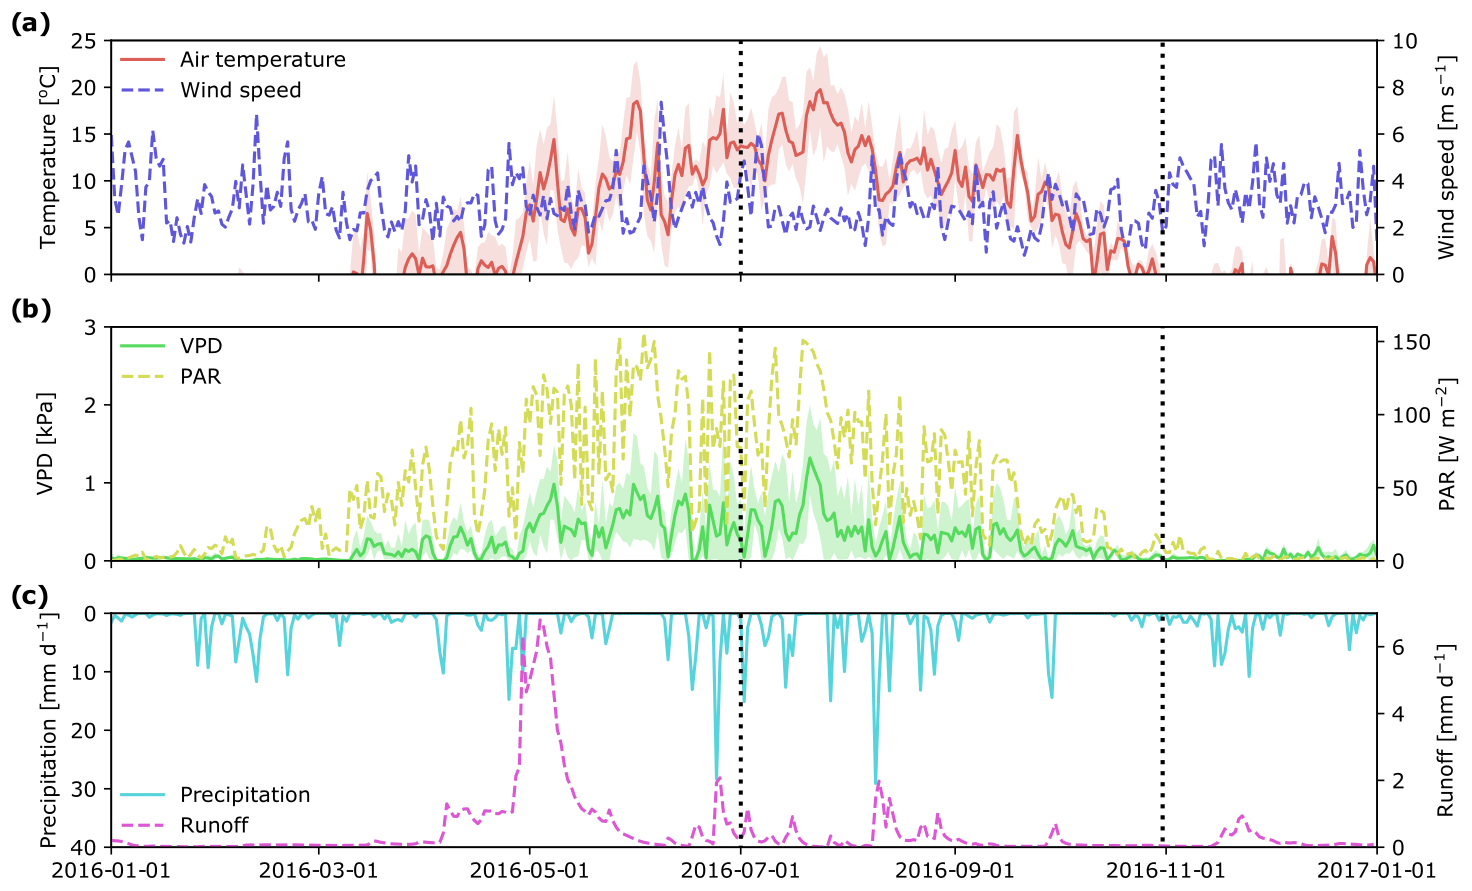
Figure 2Mean daily hydro-meteorological variables at the Krycklan C2 subcatchment during 2016: air temperature and wind speed (a); vapor pressure deficit, VPD, and photosynthetically active radiation, PAR (b); precipitation and stream runoff (c). Beginning and end of the study period are marked with vertical dotted lines. Shaded areas for air temperature and VPD show minimum and maximum values during a day.
3.1 Daily variability of ET and its components
Over the study period, daily ET varied between 0 and 4 mm d−1 depending on the weather conditions (Fig. 3a). Except for a very short time period following a large rain event on 9 August, ET was always higher than Q. In general, there was good agreement between empirical and modeled estimates of ET (R2=0.79; p < 0.001; Fig. 3a). Yet during a 1-week period in July modeled estimates of ET were 30 % higher than measurement ET, which also corresponded to the time period of high IC (Fig. 3d).
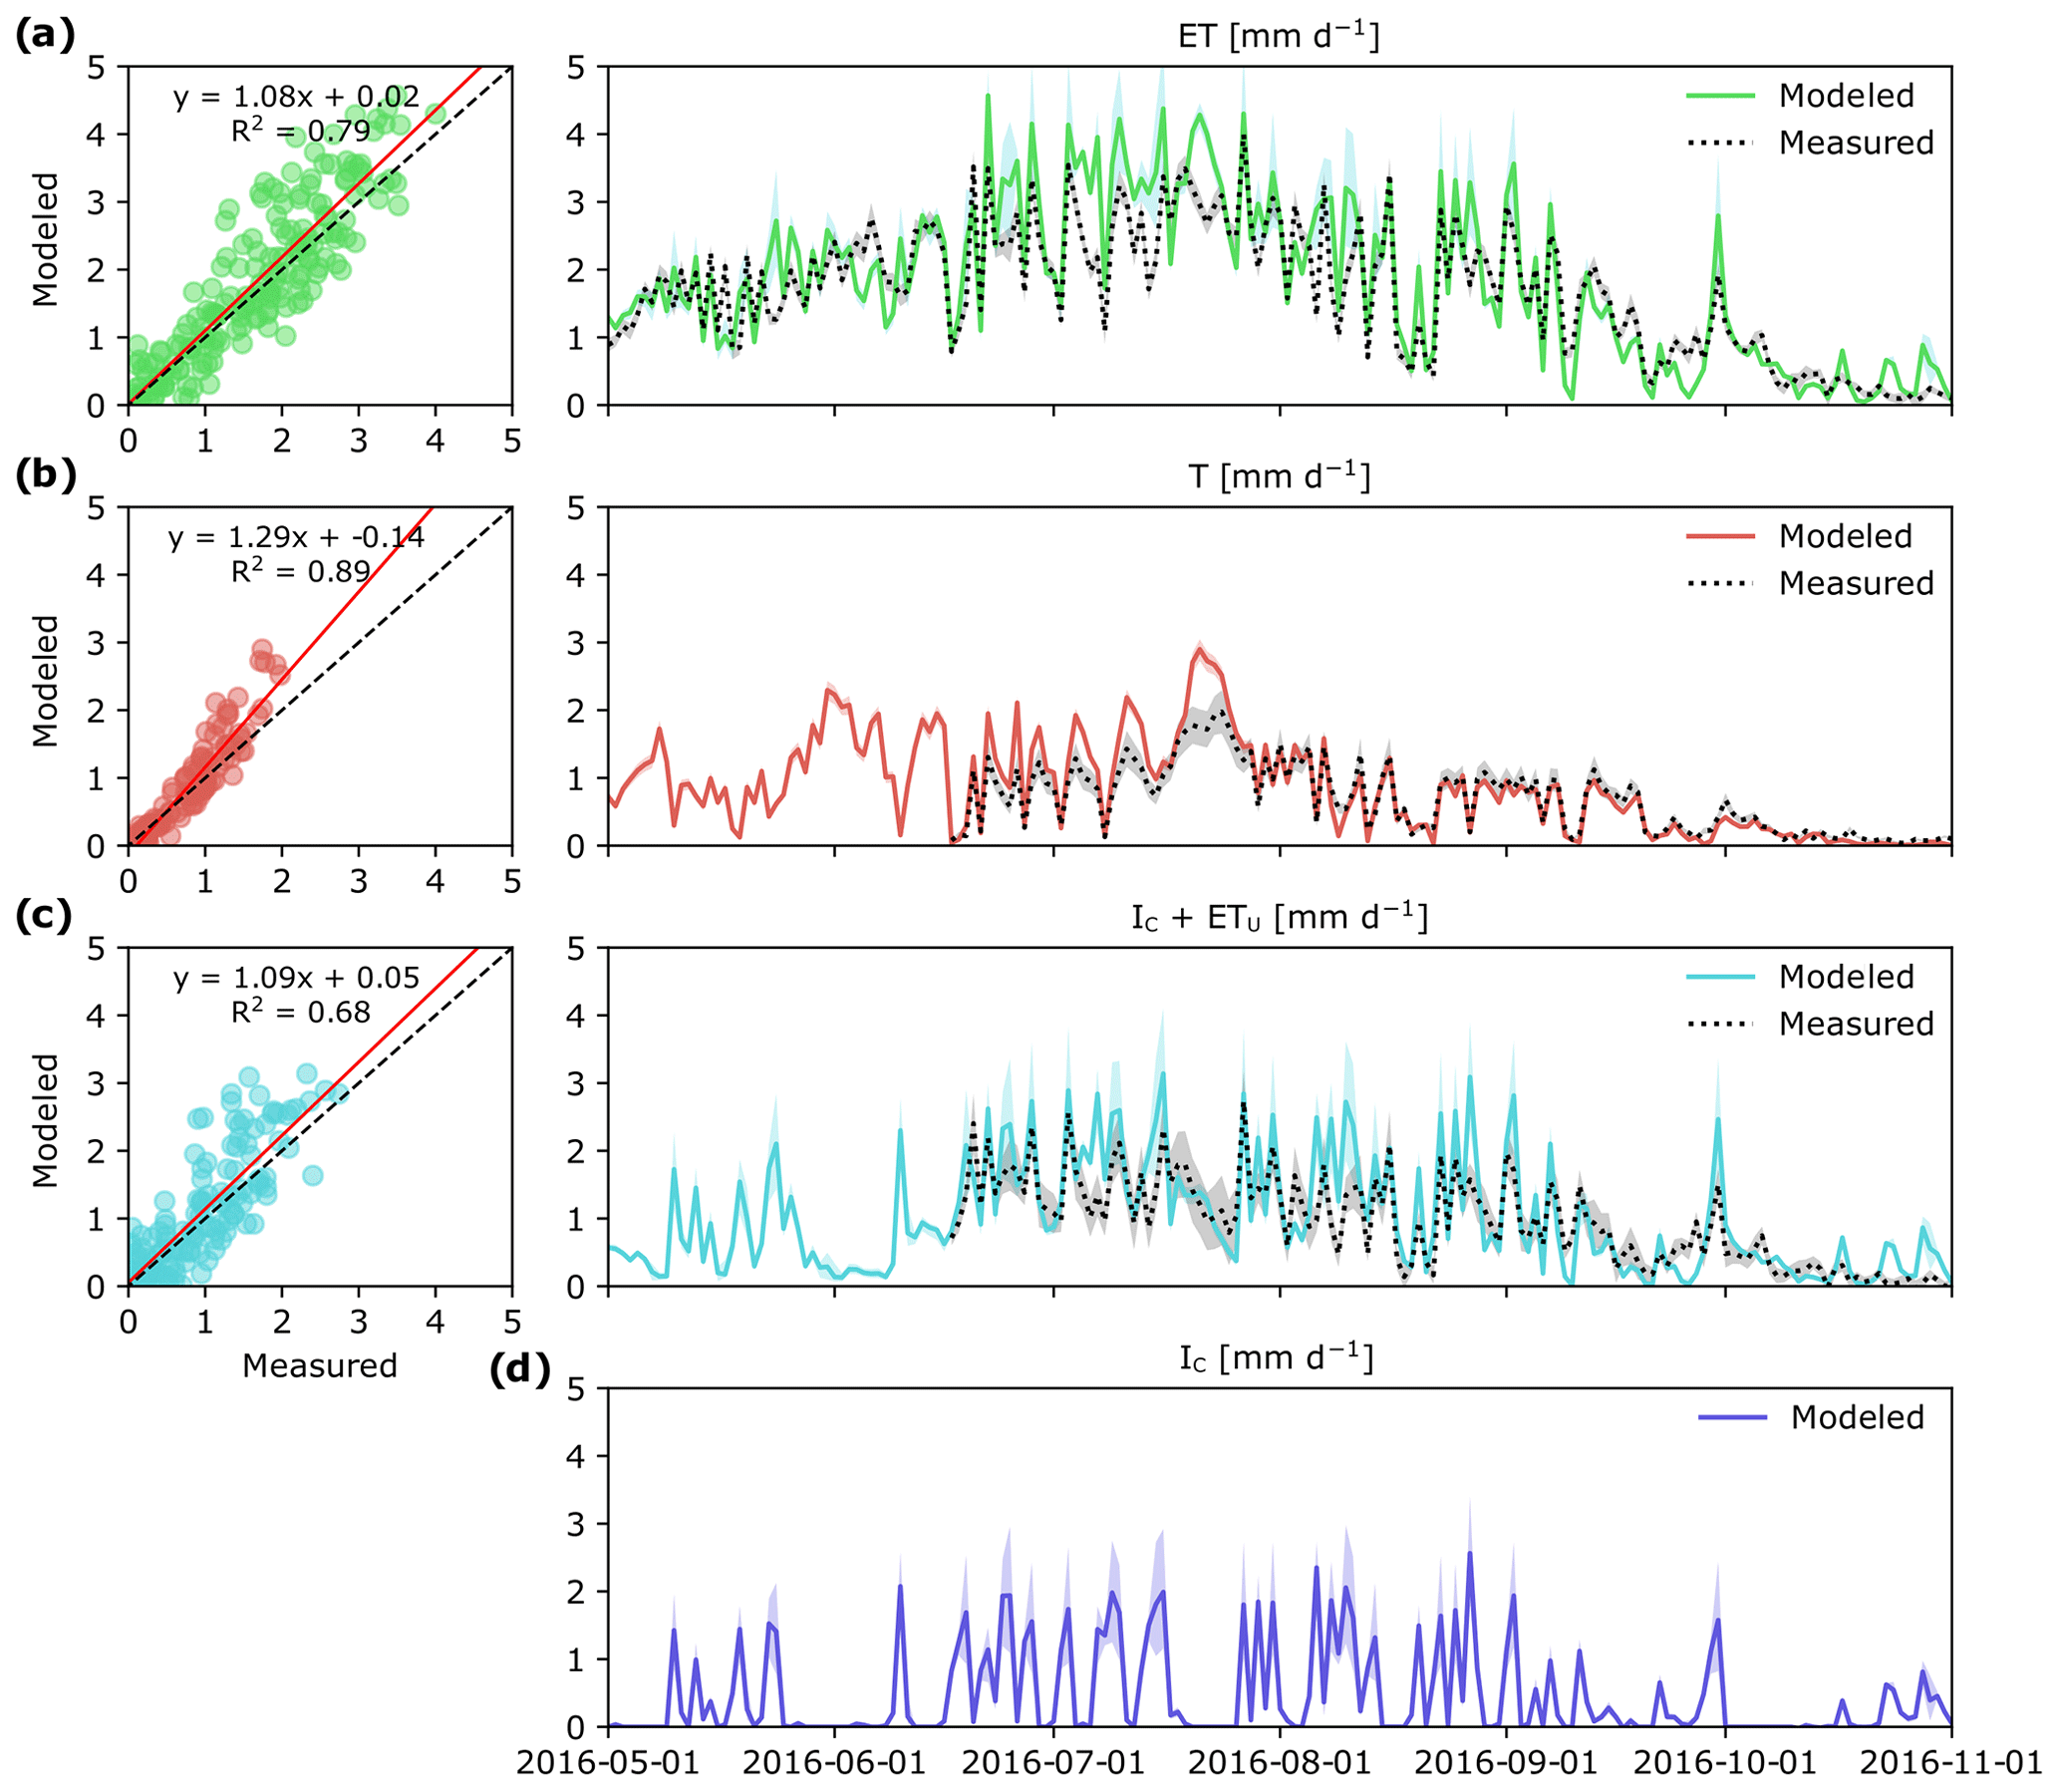
Figure 3Measured and modeled evapotranspiration ET (a) and its component fluxes: canopy transpiration, T (b), evaporation of intercepted P in the tree canopy and understory evapotranspiration, IC+ ETu (c), and modeled canopy interception evaporation, IC (d) in a boreal forest catchment during the 2016 growing season. Colored shaded areas show simulation results for the whole parameter space and gray shaded areas represent uncertainty in measurements. Panels (a)–(c) show correlation between daily modeled and measured values. Measured IC+ ETu in panel (c) was determined as the difference between total ET and T.
Canopy transpiration (T) was the largest ET flux component, and during 88 % of the study period it alone was higher than Q (Fig. 3b). Maximum daily values of T were reached during the latter half of July, and during this time, the contribution of T to ET was 80 %. During summer months (JJA) and the first half of September, daily T was on average 0.93 mm d−1, but later substantially decreased to < 0.2 mm d−1. Overall, modeled estimates of T were tightly correlated with T based on sapflow measurements (R2=0.89; p < 0.001), although the patterns of modeled and measured T diverged during 1 week in July (Fig. 3b).
Modeled estimates of intercepted P in the tree canopy together with understory evapotranspiration (IC+ ETu) followed a similar pattern to the measured data, which here were computed as the difference between ET and T (Fig. 3c). Regardless of the approach used, IC+ ETu had the highest variability throughout the study period (Fig. 3c), mainly because IC (Fig. 3d) is highly dependent on the frequency of rain events and the effect of other weather conditions like daily temperature and VPD.
Comparison of measured and modeled event-based IC showed high correlation (R2=0.76; Fig. 4a). However, modeled IC values were slightly higher than measured for small rain events, whereas the opposite was true for large rain events (Fig. 4a). Uncertainty of both measured and modeled IC increased with the amount of precipitation (Fig. 4b, c).

Figure 4Measured and modeled event-based evaporation of P in the tree canopy (IC) (a) and relationship between precipitation and measured IC (b) and modeled IC (c). Cumulative plot of precipitation and IC based on the two different approaches (d). Error bars and shaded areas show simulation results for whole parameter space and uncertainty range in measurements.
3.2 Water balance and ET partitioning
During the growing season, the C2 subcatchment received 226 mm of P and released only 28 mm of water as stream runoff. Based on EC measurements, ET represented 86 % of P during the study period (194±16 mm), which was similar to model estimates that showed ET represented 96 % of P (217±18 mm) during the study period (Fig. 5). Regardless of the approach used, T was the largest ET flux component, representing 44 % and 41 % of ET based on empirical measurements and model estimates, respectively. IC represented roughly 34 % (measured) and 28 % (modeled) of ET. When combining T and IC, trees were responsible for 78 % of ET when using empirical data and 69 % based on the model approach. The modeled ETu was slightly higher than that estimated as a residual of measured water balance components (31 % vs. 22 % of ET, respectively).
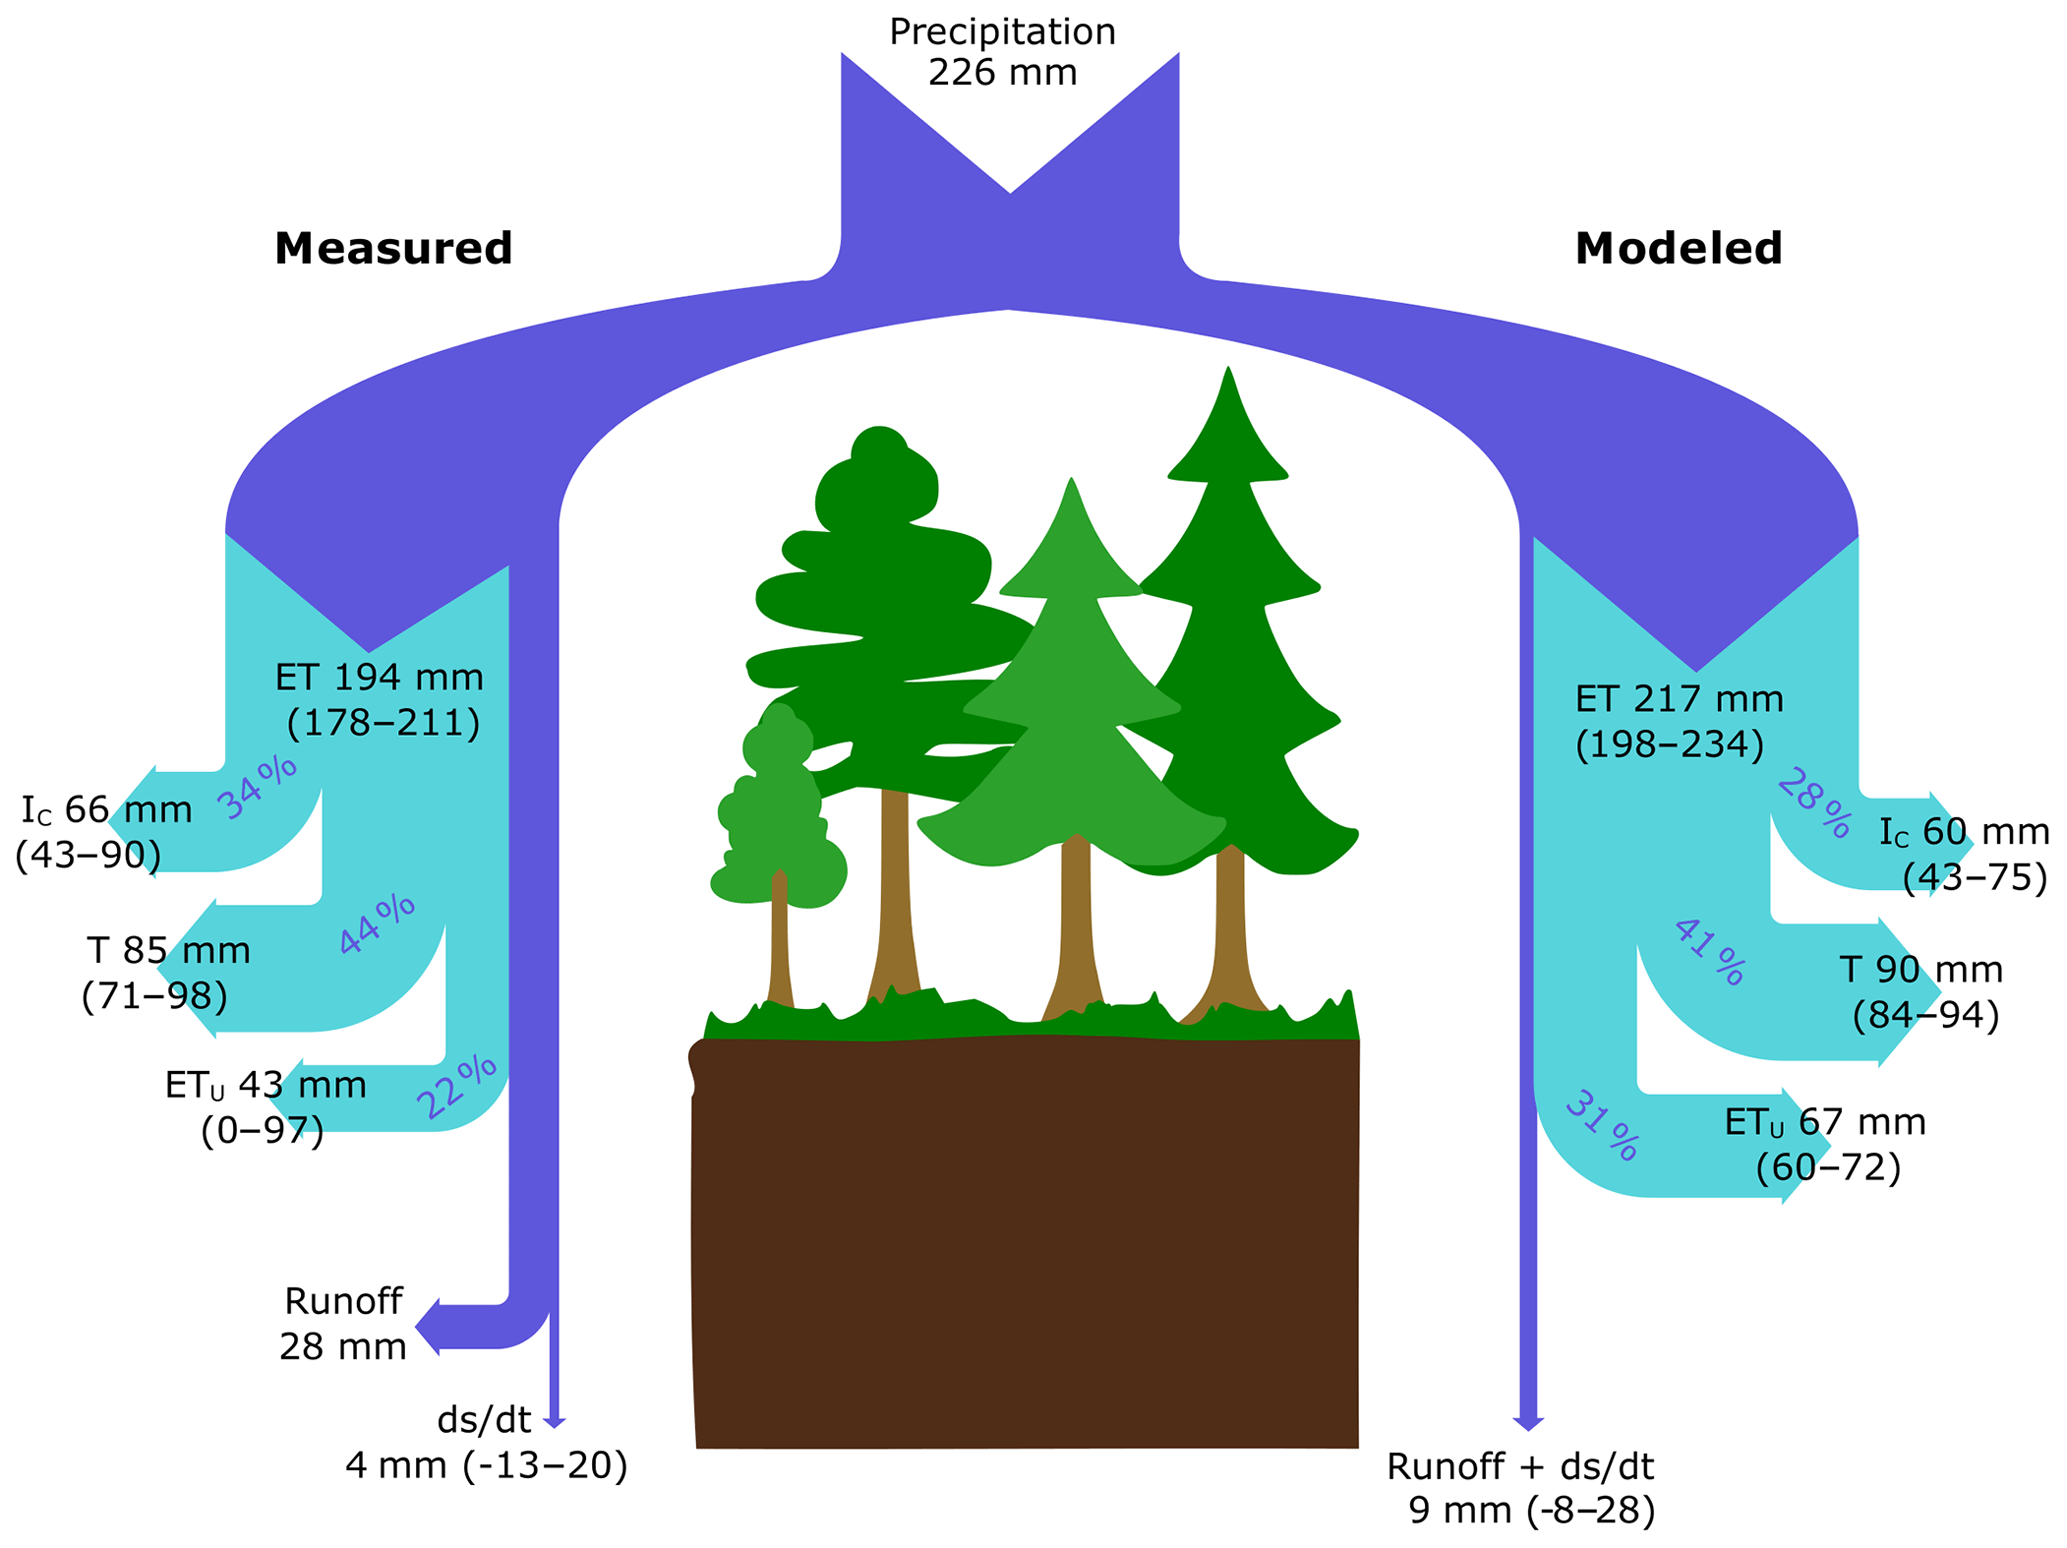
Figure 5Partitioning of water fluxes based on empirical measurements (left-hand side) and model simulation (right-hand side) in a coniferous boreal catchment during the 2016 growing season (July–October). Values for each flux are presented as mean absolute values (mm) with upper and lower boundaries shown in parentheses. The percentages give the relative contribution of ET components to total ET.
In this study, we used both empirical measurements and a process-based model to partition ET into its individual flux components and assessed how these different fluxes varied during the course of a single growing season in a northern boreal catchment. Both the empirical results and model estimates highlighted the importance of ET during the growing season, with ET representing ca. 85 % of the incoming P during the study period. Moreover, the results demonstrated that canopy trees are the main driver of ET fluxes during the growing season, as canopy transpiration and evaporation of intercepted rainfall from the canopy jointly represented 69 %–78 % of ET depending on the approach used. Our findings clearly highlight the important role canopy trees play in the boreal hydrological cycle during the growing season and stress the need to better understand the effect of trees and their response to forest management practices and a changing climate.
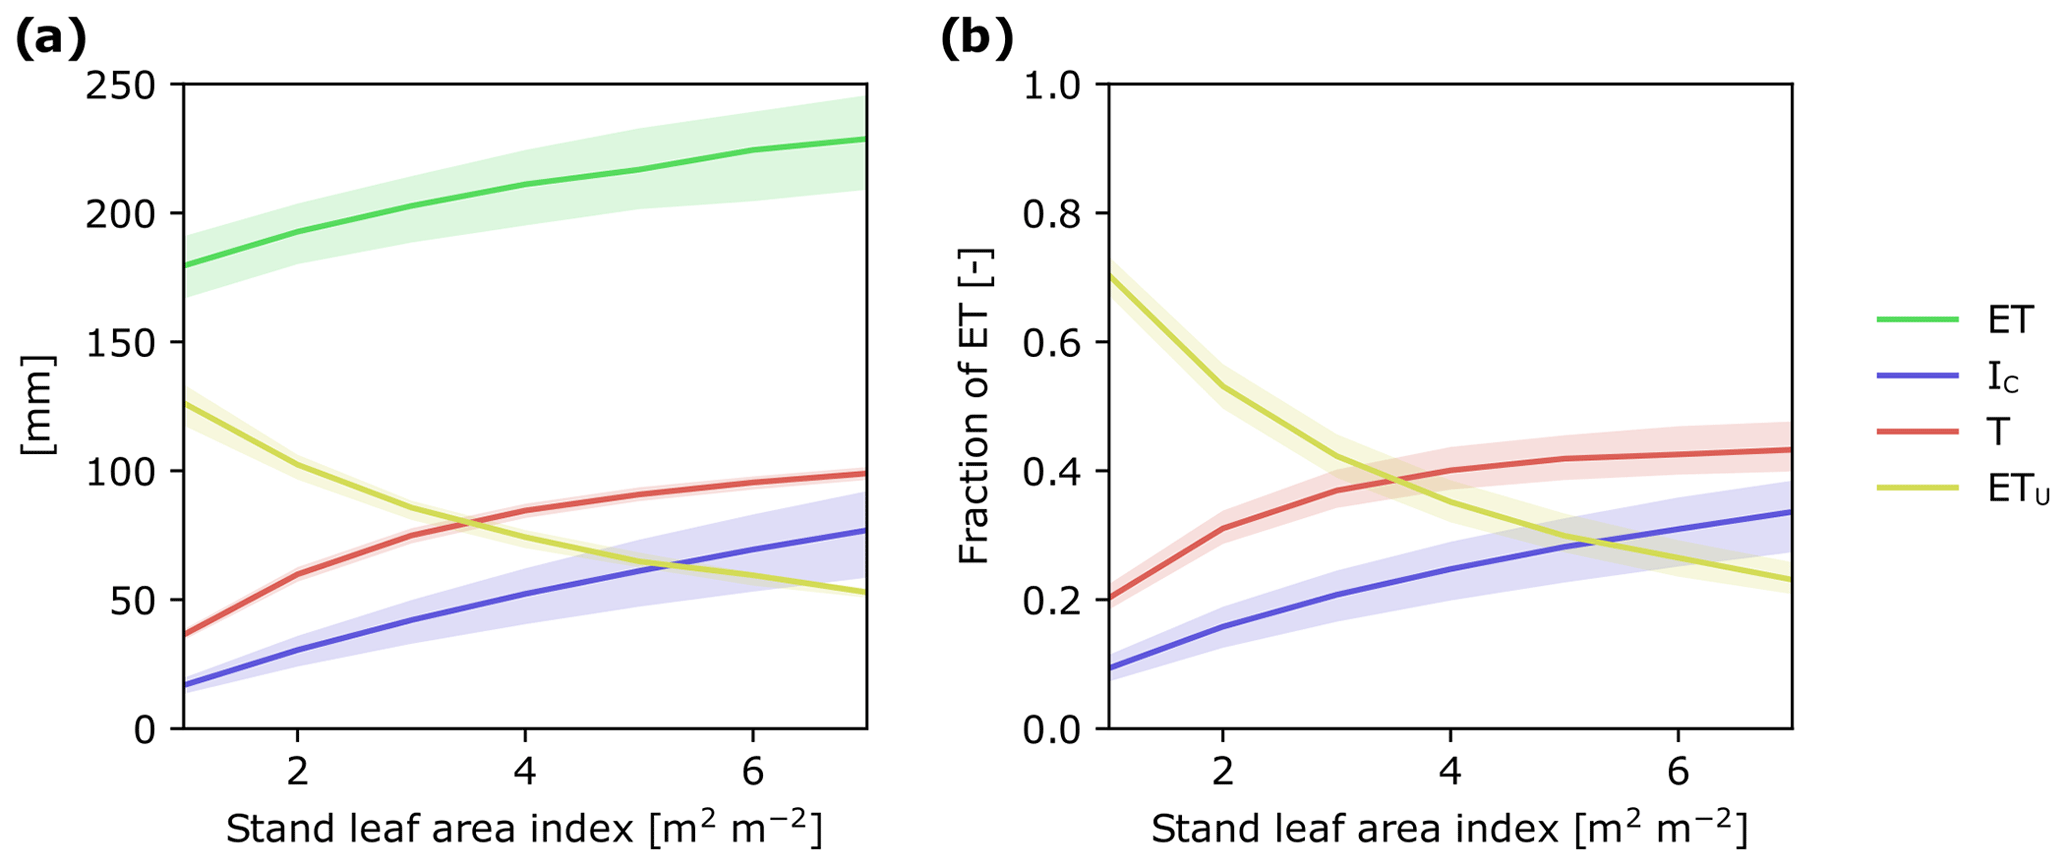
Figure 6Modeled response of ET and its flux components to changes in stand LAI: (a) as cumulative water fluxes and (b) as a fraction of ET during July–October 2016. In simulations, weather forcing and relative LAD profiles were kept constant and stand LAI varied from 1 to 7 m2 m−2. The shaded ranges correspond to model parameter ranges (see Tables S2 and S3).
The strong seasonal variation in the relative importance of different water balance components in northern latitude catchments is well known, with stream runoff being the main water flux during snowmelt in spring. Within the Krycklan catchment, roughly 40 % of annual stream runoff occurs as a response to snowmelt (Ågren et al., 2012), when trees are relatively inactive (Tor-ngern et al., 2017). In this study, we found that ET becomes the dominant water flux after spring flood has ceased, and during the growing season it was 7 times greater than stream runoff (Figs. 2c, 3a). In our study, combining P with modeled estimates of ET and measured stream runoff results in a negative water balance (P < ET + Q) during the growing season. This is in agreement with other studies in boreal forests, which have found a negative water balance during the growing season (Wang et al., 2017; Tor-ngern et al., 2018; Sarkkola et al., 2013). Such asynchrony in the relative importance of different water balance components might be even more pronounced in a future climate when higher air temperatures and less frequent, albeit more intense, precipitation events can be expected (IPCC, 2018). One future scenario is earlier snowmelt and less snow accumulation during winter as a result of higher air temperatures (Byun et al., 2019), which would result in earlier peak stream runoff, thereby reducing the annual amount of water available for tree growth during the growing season (Barnett et al., 2005). This, in turn, could have cascading effects on forest productivity (Barber et al., 2000; Silva et al., 2010), tree mortality (Peng et al., 2011), and the overall carbon balance in boreal forests (Ma et al., 2012).
Our results further highlight that T was the largest individual water flux during the growing season, representing ca. 40 % of incoming precipitation. Our cumulative T estimates during the study period (85–90 mm) were similar in magnitude to previous observations in other boreal forests (Grelle et al., 1997; Sarkkola et al., 2013). When compared to ET, T contributed ca. 45 % (Fig. 5), which is also consistent with earlier findings in boreal forest (Sarkkola et al., 2013; Wang et al., 2017; Ohta et al., 2001), yet lower than the global average of ca. 60 % (Wei et al., 2017; Schlesinger and Jasechko, 2014). However, it is known that the ratio of T ∕ ET varies considerably among different ecosystems as well as within the same ecosystem (Evaristo et al., 2015; Wei et al., 2017; Peel et al., 2010). Such variation in T ∕ ET may be the result of differences in study location and duration, its spatial scale, forests stand structure, climatic conditions, as well as the method used (Schlesinger and Jasechko, 2014). It is important to point out that the two approaches (i.e., empirical measurements and modeling) gave similar estimates of T in terms of both overall magnitude (Fig. 5) and seasonal dynamics (Fig. 3b), thereby giving us confidence in the important role canopy tree T plays in the boreal hydrological cycle.
In general, cumulative IC was the second largest water flux during the study period (Fig. 5). The importance of IC is not surprising, as IC has been shown to account for more than 30 % of seasonal P in a wide range of temperate and boreal coniferous forests (Barbier et al., 2009). In a previous study at the Krycklan catchment, we found that evaporation of intercepted snow in the tree canopy represents ca. 30 % of winter (November–March) precipitation (Kozii et al., 2017). Thus, IC represents the largest ET component when expressed on an annual timescale as there is negligible T during the winter months (Tor-ngern et al., 2017). In our study, IC was calculated for each rain event, and it is important to point out that the fraction of P lost via IC (i.e., IC∕P) during a single rain event varies in response to the magnitude and intensity of P (Gash, 1979; Linhoss and Siegert, 2016; Rutter et al., 1971; Zeng et al., 2000). The highest IC∕P are expected to occur during light rainfall events in a dry canopy, whereas IC∕P decreases with increasing rain amount and intensity as well as when water storage capacity in the canopy is reduced by intercepted water from previous precipitation events. Thus, projected changes in the amount and frequency of rainfall in northern latitude ecosystems (IPCC, 2014) could drastically alter IC and, in turn, strongly affect the amount of water available to plants, stream runoff, and other downstream processes.
Previous studies in boreal forests have shown that understory evapotranspiration (ETu) represented 10 %–50 % of ET (Constantin et al., 1999; Iida et al., 2009; Kelliher et al., 1998; Suzuki et al., 2007; Launiainen et al., 2005; Launiainen, 2010), which is consistent with our finding in this study. Although ETu was in general less important than T and IC during the entire study period, it is worth pointing out that ETu was the largest ET flux component in late autumn. Using the APES model, we were able to further partition ETu into forest floor evaporation and understory transpiration. During the study period, model-predicted forest floor evaporation was 57 mm, representing 85 % of total ETu, suggesting that evaporation of water from the moss layer may play an important role in the boreal hydrological cycle, especially in late autumn (Bond-Lamberty et al., 2011; Suzuki et al., 2007). However, ETu was the component flux that showed the greatest difference between the two approaches, which stresses the need for additional studies to better quantify ETu and its partitioning.
By combining T and IC, we are able to show that trees are directly responsible for ca. 75 % of ET during the growing season. This finding is consistent with other studies in needle-leaved evergreen forests in boreal and temperate regions that have shown that T and IC together represent 55 % to 83 % of ET (Gu et al., 2018). Taken together, there is increasing evidence highlighting the important role trees play in the boreal hydrological cycle. Consequently, forest management practices that alter forest stand structure could have large cascading effects on the way water moves through these landscapes (Greiser et al., 2018). For instance, thinning reduces basal area and LAI of the remaining stand, whereas nitrogen fertilization in boreal forests promotes greater aboveground carbon allocation, leading to an increase in LAI (Lim et al., 2015), and can also positively affect leaf photosynthetic efficiency and transpiration (Walker et al., 2014). To assess how forest management practices may affect ET as well as the relative importance of its component fluxes, we ran the APES model with canopy LAI values ranging from 1 to 7 m2 m−2. Over this LAI range, ET for the study period increased by ca. 50 mm (Fig. 6a). Figure 6 also enabled us to identify thresholds in canopy LAI where the dominant ET component changes. For example, in sparse coniferous stands with LAI less than 3 m2 m−2, understory evapotranspiration appears as the dominant ET component flux, whereas in forest stands with LAI greater than 3 m2 m−2 transpiration becomes the dominant component (Fig. 6b). Understanding how LAI influences ET and its component fluxes provides an opportunity to assess how different forest management practices may affect the movement of water in forested landscapes. This, in turn, could assist in the development of more sustainable management practices (Stenberg et al., 2018; Sarkkola et al., 2013).
This study is unique in that it used empirical measurements and a process model approach to partition the water balance in a northern boreal catchment. In general, the two different approaches yielded similar results and showed that ET was the main water flux during the growing season, representing ca. 85 % of incoming P. Moreover, our results highlight the important role trees play in the boreal hydrological cycle, as canopy T and evaporation of intercepted P from the tree canopy (IC) together represented ca. 75 % of ET during the growing season. Thus, forest management practices that alter forest stand structure, such as commercial thinning, continuous cover forestry, and clear cutting, are likely to have large cascading effects on the way water moves through these forested landscapes. However, it is important to recognize that this study was limited to a single growing season. It is reasonable to assume that changes in climatic conditions could also alter the magnitude and relative importance of different water balance components. Thus, further studies are needed to better understand how forest management practices and environmental conditions influence ET and its individual flux components in order to identify more sustainable forest management practices in a changing climate.
Sapflux data are archived in the sapfluxnet database (https://github.com/sapfluxnet/sapfluxnet-public/wiki; Poyatos, 2017). Data on greenhouse gas, water, and energy fluxes as well as meteorological and environmental data used for model forcing are available through the ICOS portal, Svartberget station (http://www.icos-sweden.se/station_svartberget.html; Linderson, 2019). Model source code is available upon request from Kersti Haahti.
The supplement related to this article is available online at: https://doi.org/10.5194/hess-24-2999-2020-supplement.
NK, NJH, PT, RO, and HL worked on the conceptualization of the research goals. NK, NJH and PT installed, collected and, with the help of RO, analyzed the sapflux data; KH and SL performed the modelling; JC and MP were responsible for processing the eddy-covariance data; EMH and JW provided the forest canopy data that were acquired by airborne laser scanning. NK and NJH wrote the paper with contributions from all the others.
The authors declare that they have no conflict of interest.
We thank the research staff at Svartberget and ICOS Sweden for their help in the establishment and collection of data presented in this paper.
This research has been supported by the Swedish Research Council (VR, grant no. 2015-04791), the Knute and Alice Wallenberg Foundation (grant no. 2015.0047), the Academy of Finland (decisions 310203 and 296116), the Swedish Research Council, contributing research institutes to the Swedish Integrated Carbon Observation System (ICOS-Sweden) Research Infrastructure, the Swedish Infrastructure for Ecosystem Science (SITES), and the Erkko Visiting Professor Programme of the Jane and Aatos Erkko 375th Anniversary Fund through the University of Helsinki.
This paper was edited by Ryan Teuling and reviewed by Natalie Ceperley, Miria Coenders-Gerrits, and one anonymous referee.
Ågren, A. M., Haei, M., Blomkvist, P., Nilsson, M. B., and Laudon, H.: Soil frost enhances stream dissolved organic carbon concentrations during episodic spring snow melt from boreal mires, Glob. Change Biol., 18, 1895–1903, https://doi.org/10.1111/j.1365-2486.2012.02666.x, 2012.
Baldocchi, D., Kelliher, F. M., Black, T. A., and Jarvis, P.: Climate and vegetation controls on boreal zone energy exchange, Glob. Change Biol., 6, 69–83, https://doi.org/10.1046/j.1365-2486.2000.06014.x, 2000.
Baldocchi, D. D., Vogel, C. A., and Hall, B.: Seasonal variation of energy and water vapor exchange rates above and below a boreal jack pine forest canopy, J. Geophys. Res.-Atmos., 102, 28939–28951, https://doi.org/10.1029/96jd03325, 1997.
Barber, V. A., Juday, G. P., and Finney, B. P.: Reduced growth of Alaskan white spruce in the twentieth century from temperature-induced drought stress, Nature, 405, 668–673, https://doi.org/10.1038/35015049, 2000.
Barbier, S., Balandier, P., and Gosselin, F.: Influence of several tree traits on rainfall partitioning in temperate and boreal forests: a review, Ann. Forest Sci., 66, 602, https://doi.org/10.1051/forest/2009041, 2009.
Barnett, T. P., Adam, J. C., and Lettenmaier, D. P.: Potential impacts of a warming climate on water availability in snow-dominated regions, Nature, 438, 303–309, https://doi.org/10.1038/nature04141, 2005.
Bidartondo, M. I., Ek, H., Wallander, H., and Soderstrom, B.: Do nutrient additions alter carbon sink strength of ectomycorrhizal fungi?, New Phytol., 151, 543–550, https://doi.org/10.1046/j.1469-8137.2001.00180.x, 2001.
Bonan, G. B.: Forests and climate change: Forcings, feedbacks, and the climate benefits of forests, Science, 320, 1444–1449, https://doi.org/10.1126/science.1155121, 2008.
Bond-Lamberty, B., Gower, S. T., Amiro, B., and Ewers, B. E.: Measurement and modelling of bryophyte evaporation in a boreal forest chronosequence, Ecohydrology, 4, 26–35, https://doi.org/10.1002/eco.118, 2011.
Bradshaw, C. J. A. and Warkentin, I. G.: Global estimates of boreal forest carbon stocks and flux, Global Planet. Change, 128, 24–30, https://doi.org/10.1016/j.gloplacha.2015.02.004, 2015.
Brutsaert, W. B.: Evaporation into the atmosphere: theory, history and applications, Kluwer Academic, Dordrecht, the Netherlands, 1982.
Byun, K., Chiu, C. M., and Hamlet, A. F.: Effects of 21st century climate change on seasonal flow regimes and hydrologic extremes over the Midwest and Great Lakes region of the US, Sci. Total Environ., 650, 1261–1277, https://doi.org/10.1016/j.scitotenv.2018.09.063, 2019.
Cavanaugh, M. L., Kurc, S. A., and Scott, R. L.: Evapotranspiration partitioning in semiarid shrubland ecosystems: a two-site evaluation of soil moisture control on transpiration, Ecohydrology, 4, 671–681, https://doi.org/10.1002/eco.157, 2011.
Chen, D., Loboda, T. V., He, T., Zhang, Y., and Liang, S. L.: Strong cooling induced by stand-replacing fires through albedo in Siberian larch forests, Sci. Rep.-UK, 8, 4821, https://doi.org/10.1038/s41598-018-23253-1, 2018.
Chi, J. S., Nilsson, M. B., Kljun, N., Wallerman, J., Fransson, J. E. S., Laudon, H., Lundmark, T., and Peichl, M.: The carbon balance of a managed boreal landscape measured from a tall tower in northern Sweden, Agr. Forest Meteorol., 274, 29–41, https://doi.org/10.1016/j.agrformet.2019.04.010, 2019.
Cienciala, E., Kučera, J., Lindroth, A., Čermák, J., Grelle, A., and Halldin, S.: Canopy transpiration from a boreal forest in Sweden during a dry year, Agr. Forest Meteorol., 86, 157–167, https://doi.org/10.1016/S0168-1923(97)00026-9, 1997.
Coenders-Gerrits, A. M. J., van der Ent, R. J., Bogaard, T. A., Wang-Erlandsson, L., Hrachowitz, M., and Savenije, H. H. G.: Uncertainties in transpiration estimates, Nature, 506, E1–E2, https://doi.org/10.1038/nature12925, 2014.
Constantin, J., Grelle, A., Ibrom, A., and Morgenstern, K.: Flux partitioning between understorey and overstorey in a boreal spruce/pine forest determined by the eddy covariance method, Agr. Forest Meteorol., 98–9, 629–643, 1999.
Domec, J.-C., Sun, G., Noormets, A., Gavazzi, M. J., Treasure, E. A., Cohen, E., Swenson, J. J., McNulty, S. G., and King, J. S.: A Comparison of Three Methods to Estimate Evapotranspiration in Two Contrasting Loblolly Pine Plantations: Age-Related Changes in Water Use and Drought Sensitivity of Evapotranspiration Components, Forest Sci., 58, 497–512, https://doi.org/10.5849/forsci.11-051, 2012.
Eades, H. W.: Iodine as an indicator of sapwood and heartwood, Forest. Chron., 13, 470–477, https://doi.org/10.5558/tfc13470-3, 1937.
Evaristo, J., Jasechko, S., and McDonnell, J. J.: Global separation of plant transpiration from groundwater and streamflow, Nature, 525, 91–94, https://doi.org/10.1038/nature14983, 2015.
Farquhar, G. D., von Caemmerer, S., and Berry, J. A.: A biochemical model of photosynthetic CO2 assimilation in leaves of C3 species, Planta, 149, 78–90, https://doi.org/10.1007/bf00386231, 1980.
Ford, C. R., McGuire, M. A., Mitchell, R. J., and Teskey, R. O.: Assessing variation in the radial profile of sap flux density in Pinus species and its effect on daily water use, Tree Physiol., 24, 241–249, https://doi.org/10.1093/treephys/24.3.241, 2004.
Gash, J. H. C.: Analytical model of rainfall interception by forests, Q. J. Roy. Meteor. Soc., 105, 43–55, https://doi.org/10.1002/qj.49710544304, 1979.
Githui, F., Selle, B., and Thayalakumaran, T.: Recharge estimation using remotely sensed evapotranspiration in an irrigated catchment in southeast Australia, Hydrol. Process., 26, 1379–1389, https://doi.org/10.1002/hyp.8274, 2012.
Good, S. P., Soderberg, K., Guan, K., King, E. G., Scanlon, T. M., and Caylor, K. K.: δ2H isotopic flux partitioning of evapotranspiration over a grass field following a water pulse and subsequent dry down, Water Resour. Res., 50, 1410–1432, https://doi.org/10.1002/2013WR014333, 2014.
Goodale, C. L., Apps, M. J., Birdsey, R. A., Field, C. B., Heath, L. S., Houghton, R. A., Jenkins, J. C., Kohlmaier, G. H., Kurz, W., Liu, S. R., Nabuurs, G. J., Nilsson, S., and Shvidenko, A. Z.: Forest carbon sinks in the Northern Hemisphere, Ecol. Appl., 12, 891–899, https://doi.org/10.2307/3060997, 2002.
Granier, A.: Evaluation of transpiration in a Douglas-Fir stand by means of sap flow measurements, Tree Physiol., 3, 309–319, 1987.
Greiser, C., Meineri, E., Luoto, M., Ehrlen, J., and Hylander, K.: Monthly microclimate models in a managed boreal forest landscape, Agr. Forest Meteorol., 250, 147–158, https://doi.org/10.1016/j.agrformet.2017.12.252, 2018.
Grelle, A., Lundberg, A., Lindroth, A., Morén, A. S., and Cienciala, E.: Evaporation components of a boreal forest: variations during the growing season, J. Hydrol., 197, 70–87, https://doi.org/10.1016/S0022-1694(96)03267-2, 1997.
Gu, C., Ma, J., Zhu, G., Yang, H., Zhang, K., Wang, Y., and Gu, C.: Partitioning evapotranspiration using an optimized satellite-based ET model across biomes, Agr. Forest Meteorol., 259, 355–363, https://doi.org/10.1016/j.agrformet.2018.05.023, 2018.
Hamada, S., Ohta, T., Hiyama, T., Kuwada, T., Takahashi, A., and Maximov, T. C.: Hydrometeorological behaviour of pine and larch forests in eastern Siberia, Hydrol. Process., 18, 23–39, https://doi.org/10.1002/hyp.1308, 2004.
Harkonen, S., Lehtonen, A., Manninen, T., Tuominen, S., and Peltoniemi, M.: Estimating forest leaf area index using satellite images: comparison of k-NN based Landsat-NFI LAI with MODIS-RSR based LAI product for Finland, Boreal Environ. Res., 20, 181–195, 2015.
Hernandez-Santana, V., Hernandez-Hernandez, A., Vadeboncoeur, M. A., and Asbjornsen, H.: Scaling from single-point sap velocity measurements to stand transpiration in a multispecies deciduous forest: uncertainty sources, stand structure effect, and future scenarios, Can. J. Forest Res., 45, 1489–1497, https://doi.org/10.1139/cjfr-2015-0009, 2015.
Iida, S., Ohta, T., Matsumoto, K., Nakai, T., Kuwada, T., Kononov, A. V., Maximov, T. C., van der Molen, M. K., Dolman, H., Tanaka, H., and Yabuki, H.: Evapotranspiration from understory vegetation in an eastern Siberian boreal larch forest, Agr. Forest Meteorol., 149, 1129-1139, https://doi.org/10.1016/j.agrformet.2009.02.003, 2009.
IPCC: Climate Change 2014: Synthesis Report, Contribution of Working Groups I, II and III to the Fifth Assessment Report of the Intergovernmental Panel on Climate Change, Geneva, Switzerland, 151, 2014.
IPCC: Global Warming of 1.5 ∘C. An IPCC Special Report on the impacts of global warming of 1.5 ∘C above pre-industrial levels and related global greenhouse gas emission pathways, in the context of strengthening the global response to the threat of climate change, sustainable development, and efforts to eradicate poverty, edited by: Masson-Delmotte, V., Zhai, P., Pörtner, H.-O., Roberts, D., Skea, J., Shukla, P. R., Pirani, A., Moufouma-Okia, W., Péan, C., Pidcock, R., Connors, S., Matthews, J. B. R., Chen, Y., Zhou, X., Gomis, M. I., Lonnoy, E., Maycock, T., Tignor, M., and Waterfield, T., in press, 2018.
James, S. A., Clearwater, M. J., Meinzer, F. C., and Goldstein, G.: Heat dissipation sensors of variable length for the measurement of sap flow in trees with deep sapwood, Tree Physiol., 22, 277–283, https://doi.org/10.1093/treephys/22.4.277, 2002.
Jasechko, S., Sharp, Z. D., Gibson, J. J., Birks, S. J., Yi, Y., and Fawcett, P. J.: Terrestrial water fluxes dominated by transpiration, Nature, 496, 347–350, https://doi.org/10.1038/nature11983, 2013.
Karlsen, R. H., Grabs, T., Bishop, K., Buffam, I., Laudon, H., and Seibert, J.: Landscape controls on spatiotemporal discharge variability in a boreal catchment, Water Resour. Res., 52, 6541–6556, https://doi.org/10.1002/2016wr019186, 2016.
Katul, G. G., Oren, R., Manzoni, S., Higgins, C., and Parlange, M. B.: Evaporation: A process driving mass transport and energy exchange in the soil-plant-atmosphere-climet system, Rev. Geophys., 50, RG3002, https://doi.org/10.1029/2011rg000366, 2012.
Kelliher, F. M., Lloyd, J., Arneth, A., Byers, J. N., McSeveny, T. M., Milukova, I., Grigoriev, S., Panfyorov, M., Sogatchev, A., Varlargin, A., Ziegler, W., Bauer, G., and Schulze, E. D.: Evaporation from a central Siberian pine forest, J. Hydrol., 205, 279–296, https://doi.org/10.1016/S0022-1694(98)00082-1, 1998.
Kieloaho, A.-J. and Launianen, S.: Effects of functional traits of bryophyte layer on water cycling and energy balance in boreal and arctic ecosystems, EGU General Assembly Conference, 11786, 2018.
Kljun, N., Calanca, P., Rotach, M. W., and Schmid, H. P.: A simple two-dimensional parameterisation for Flux Footprint Prediction (FFP), Geosci. Model Dev., 8, 3695–3713, https://doi.org/10.5194/gmd-8-3695-2015, 2015.
Kool, D., Agam, N., Lazarovitch, N., Heitman, J. L., Sauer, T. J., and Ben-Gal, A.: A review of approaches for evapotranspiration partitioning, Agr. Forest Meteorol., 184, 56–70, https://doi.org/10.1016/j.agrformet.2013.09.003, 2014.
Koster, R. D. and Milly, P. C. D.: The interplay between transpiration and Runoff formulations in land surface schemes used with atmospheric models, J. Climate, 10, 1578–1591, 1997.
Kozii, N., Laudon, H., Ottosson-Lofvenius, M., and Hasselquist, N. J.: Increasing water losses from snow captured in the canopy of boreal forests: A case study using a 30 year data set, Hydrol. Process., 31, 3558–3567, https://doi.org/10.1002/hyp.11277, 2017.
Kulmala, L., Pumpanen, J., Kolari, P., Muukkonen, P., Hari, P., and Vesala, T.: Photosynthetic production of ground vegetation in different-aged Scots pine (Pinus sylvestris) forests, Can. J. Forest Res., 41, 2020–2030, https://doi.org/10.1139/x11-121, 2011.
Laudon, H. and Sponseller, R. A.: How landscape organization and scale shape catchment hydrology and biogeochemistry: insights from a long-term catchment study, Wiley Interdisciplinary Reviews-Water, 5, e1265, https://doi.org/10.1002/wat2.1265, 2018.
Laudon, H., Taberman, I., Agren, A., Futter, M., Ottosson-Lofvenius, M., and Bishop, K.: The Krycklan Catchment Study-A flagship infrastructure for hydrology, biogeochemistry, and climate research in the boreal landscape, Water Resour. Res., 49, 7154–7158, https://doi.org/10.1002/wrcr.20520, 2013.
Laudon, H., Spence, C., Buttle, J., Carey, S. K., McDonnell, J. J., McNamara, J. P., Soulsby, C., and Tetzlaff, D.: Save northern high-latitude catchments, Nat. Geosci., 10, 324–325, https://doi.org/10.1038/ngeo2947, 2017.
Launiainen, S.: Seasonal and inter-annual variability of energy exchange above a boreal Scots pine forest, Biogeosciences, 7, 3921–3940, https://doi.org/10.5194/bg-7-3921-2010, 2010.
Launiainen, S., Rinne, J., Pumpanen, J., Kulmala, L., Kolari, P., Keronen, P., Silvola, E., Pohja, T., Hari, P., and Vesala, T.: Eddy covariance measurements of CO2 and sensible and latent heat fluxes during a full year in a boreal pine forest truck-space, Boreal Environ. Res., 10, 569–588, 2005.
Launiainen, S., Katul, G. G., Lauren, A., and Kolari, P.: Coupling boreal forest CO2, H2O and energy flows by a vertically structured forest canopy – Soil model with separate bryophyte layer, Ecol. Modell., 312, 385–405, https://doi.org/10.1016/j.ecolmodel.2015.06.007, 2015.
Lim, H., Oren, R., Palmroth, S., Tor-ngern, P., Morling, T., Nasholm, T., Lundmark, T., Helmisaari, H. S., Leppalammi-Kujansuu, J., and Linder, S.: Inter-annual variability of precipitation constrains the production response of boreal Pinus sylvestris to nitrogen fertilization, Forest Ecol. Manage., 348, 31–45, https://doi.org/10.1016/j.foreco.2015.03.029, 2015.
Linderson, M.-L.: Integrated Carbon Observation System (ICOS), available at: http://www.icos-sweden.se/station_svartberget.html, last access: 3 January 2019.
Linhoss, A. C. and Siegert, C. M.: A comparison of five forest interception models using global sensitivity and uncertainty analysis, J. Hydrol., 538, 109–116, https://doi.org/10.1016/j.jhydrol.2016.04.011, 2016.
Lu, P., Muller, W. J., and Chacko, E. K.: Spatial variations in xylem sap flux density in the trunk of orchard-grown, mature mango trees under changing soil water conditions, Tree Physiol., 20, 683–692, 2000.
Ma, Z. H., Peng, C. H., Zhu, Q. A., Chen, H., Yu, G. R., Li, W. Z., Zhou, X. L., Wang, W. F., and Zhang, W. H.: Regional drought-induced reduction in the biomass carbon sink of Canada's boreal forests, P. Natl. Acad. Sci. USA, 109, 2423–2427, https://doi.org/10.1073/pnas.1111576109, 2012.
Marklund, L. G.: Biomassafunktioner för tall, gran och björk i Sverige, Sveriges lantbruksuniversitet, Institutionen för skogstaxering, 1988.
Mauder, M. and Foken, T.: Documentation and instruction manual of the eddy covariance software package TK2, Universität Bayreuth, Bayreuth, Germany, 1–67, 2004.
Maximov, T., Ohta, T., and Dolman, A. J.: Water and energy exchange in East Siberian forest: A synthesis, Agr. Forest Meteorol., 148, 2013–2018, https://doi.org/10.1016/j.agrformet.2008.10.004, 2008.
McGaughey, R. J.: FUSION/LDV: Software for LIDAR Data Analysis and Visualization. February 2012 – FUSION Version 3.01, United States Department of Agriculture, Forest Service, 2012.
Medlyn, B. E., Duursma, R. A., Eamus, D., Ellsworth, D. S., Prentice, I. C., Barton, C. V. M., Crous, K. Y., De Angelis, P., Freeman, M., and Wingate, L.: Reconciling the optimal and empirical approaches to modelling stomatal conductance, Glob. Change Biol., 17, 2134–2144, https://doi.org/10.1111/j.1365-2486.2010.02375.x, 2011.
Mitchell, P. J., Veneklaas, E., Lambers, H., and Burgess, S. S. O.: Partitioning of evapotranspiration in a semi-arid eucalypt woodland in south-western Australia, Agr. Forest Meteorol., 149, 25–37, https://doi.org/10.1016/j.agrformet.2008.07.008, 2009.
Näslund, M.: Skogsförsöksanstaltens gallringsförsök i tallskog, in: Meddelanden från Statens skogsförsöksanstalt, 29, 1936.
Odin, H.: Climate and conditions in forest soils during winter and spring at Svartberget Experimental Forest Station, Swedish University of Agricultural sciences, Uppsala, 50, 1992.
Ohta, T., Hiyama, T., Tanaka, H., Kuwada, T., Maximov, T. C., Ohata, T., and Fukushima, Y.: Seasonal variation in the energy and water exchanges above and below a larch forest in eastern Siberia, Hydrol. Process., 15, 1459–1476, https://doi.org/10.1002/hyp.219, 2001.
Oishi, A. C., Oren, R., and Stoy, P. C.: Estimating components of forest evapotranspiration: A footprint approach for scaling sap flux measurements, Agr. Forest Meteorol., 148, 1719–1732, https://doi.org/10.1016/j.agrformet.2008.06.013, 2008.
Oishi, A. C., Hawthorne, D. A., and Oren, R.: Baseliner: An open-source, interactive tool for processing sap flux data from thermal dissipation probes, SoftwareX, 5, 139–143, https://doi.org/10.1016/j.softx.2016.07.003, 2016.
Oki, T. and Kanae, S.: Global Hydrological Cycles and World Water Resources, Science, 313, 1068–1072, https://doi.org/10.1126/science.1128845, 2006.
Öquist, M. G., Bishop, K., Grelle, A., Klemedtsson, L., Köhler, S. J., Laudon, H., Lindroth, A., Ottosson Löfvenius, M., Wallin, M. B., and Nilsson, M. B.: The Full Annual Carbon Balance of Boreal Forests Is Highly Sensitive to Precipitation, Environ. Sci. Technol. Lett., 1, 315–319, https://doi.org/10.1021/ez500169j, 2014.
Oren, R., Phillips, N., Ewers, B. E., Pataki, D. E., and Megonigal, J. P.: Sap-flux-scaled transpiration responses to light, vapor pressure deficit, and leaf area reduction in a flooded Taxodium distichum forest, Tree Physiol., 19, 337–347, 1999.
Palmroth, S., Bach, L. H., Nordin, A., and Palmqvist, K.: Nitrogen-addition effects on leaf traits and photosynthetic carbon gain of boreal forest understory shrubs, Oecologia, 175, 457–470, https://doi.org/10.1007/s00442-014-2923-9, 2014.
Pan, Y. D., Birdsey, R. A., Fang, J. Y., Houghton, R., Kauppi, P. E., Kurz, W. A., Phillips, O. L., Shvidenko, A., Lewis, S. L., Canadell, J. G., Ciais, P., Jackson, R. B., Pacala, S. W., McGuire, A. D., Piao, S. L., Rautiainen, A., Sitch, S., and Hayes, D.: A Large and Persistent Carbon Sink in the World's Forests, Science, 333, 988–993, https://doi.org/10.1126/science.1201609, 2011.
Peel, M. C., McMahon, T. A., and Finlayson, B. L.: Vegetation impact on mean annual evapotranspiration at a global catchment scale, Water Resour. Res., 46, W09508, https://doi.org/10.1029/2009wr008233, 2010.
Peng, C. H., Ma, Z. H., Lei, X. D., Zhu, Q., Chen, H., Wang, W. F., Liu, S. R., Li, W. Z., Fang, X. Q., and Zhou, X. L.: A drought-induced pervasive increase in tree mortality across Canada's boreal forests, Nat. Clim. Change, 1, 467–471, https://doi.org/10.1038/nclimate1293, 2011.
Phillips, N. and Oren, R.: A comparison of daily representations of canopy conductance based on two conditional time-averaging methods and the dependence of daily conductance on environmental factors, Ann. Sci. Forest., 55, 217–235, https://doi.org/10.1051/forest:19980113, 1998.
Phillips, N., Oren, R., and Zimmermann, R.: Radial patterns of xylem sap flow in non-, diffuse- and ring-porous tree species, Plant Cell Environ., 19, 983–990, https://doi.org/10.1111/j.1365-3040.1996.tb00463.x, 1996.
Poyatos, R.: Sapfluxnet Project, available at: https://github.com/sapfluxnet/sapfluxnet-public/wiki, last access: 27 September 2017.
Richardson, A. D. and Hollinger, D. Y.: A method to estimate the additional uncertainty in gap-filled NEE resulting from long gaps in the CO2 flux record, Agr. Forest Meteorol., 147, 199–208, https://doi.org/10.1016/j.agrformet.2007.06.004, 2007.
Rutter, A. J., Kershaw, K. A., Robins, P. C., and Morton, A. J.: A predictive model of rainfall interception in forests, 1. Derivation of the model from observations in a plantation of Corsican pine, Agr. Meteorol., 9, 367–384, https://doi.org/10.1016/0002-1571(71)90034-3, 1971.
Sarkkola, S., Nieminen, M., Koivusalo, H., Lauren, A., Ahti, E., Launiainen, S., Nikinmaa, E., Marttila, H., Laine, J., and Hokka, H.: Domination of growing-season evapotranspiration over runoff makes ditch network maintenance in mature peatland forests questionable, Mires Peat, 11, 1–11, 2013.
Schlesinger, W. H. and Jasechko, S.: Transpiration in the global water cycle, Agr. Forest Meteorol., 189, 115–117, https://doi.org/10.1016/j.agrformet.2014.01.011, 2014.
Selin, L.: Modeling LAI using remote sensing data sources, Institutionen för skoglig resurshushållning, Sveriges lantbruksuniversitet, 2019.
Silva, L. C. R., Anand, M., and Leithead, M. D.: Recent Widespread Tree Growth Decline Despite Increasing Atmospheric CO2, Plos One, 5, e11543, https://doi.org/10.1371/journal.pone.0011543, 2010.
Stenberg, L., Haahti, K., Hokka, H., Launiainen, S., Nieminen, M., Lauren, A., and Koivusalo, H.: Hydrology of Drained Peatland Forest: Numerical Experiment on the Role of Tree Stand Heterogeneity and Management, Forests, 9, 645, https://doi.org/10.3390/f9100645, 2018.
Stenberg, P., Linder, S., Smolander, H., and Flowerellis, J.: Performance of the LAI-2000 plant canopy analyzer in estimating leaf-area index of some Scots Pine stands, Tree Physiol., 14, 981–995, https://doi.org/10.1093/treephys/14.7-8-9.981, 1994.
Steppe, K., De Pauw, D. J. W., Doody, T. M., and Teskey, R. O.: A comparison of sap flux density using thermal dissipation, heat pulse velocity and heat field deformation methods, Agr. Forest Meteorol., 150, 1046–1056, https://doi.org/10.1016/j.agrformet.2010.04.004, 2010.
Stoy, P. C., El-Madany, T. S., Fisher, J. B., Gentine, P., Gerken, T., Good, S. P., Klosterhalfen, A., Liu, S., Miralles, D. G., Perez-Priego, O., Rigden, A. J., Skaggs, T. H., Wohlfahrt, G., Anderson, R. G., Coenders-Gerrits, A. M. J., Jung, M., Maes, W. H., Mammarella, I., Mauder, M., Migliavacca, M., Nelson, J. A., Poyatos, R., Reichstein, M., Scott, R. L., and Wolf, S.: Reviews and syntheses: Turning the challenges of partitioning ecosystem evaporation and transpiration into opportunities, Biogeosciences, 16, 3747–3775, https://doi.org/10.5194/bg-16-3747-2019, 2019.
Sun, H. Z., Aubrey, D. P., and Teskey, R. O.: A simple calibration improved the accuracy of the thermal dissipation technique for sap flow measurements in juvenile trees of six species, Trees-Struct. Funct., 26, 631–640, https://doi.org/10.1007/s00468-011-0631-1, 2012.
Sutanto, S. J., Wenninger, J., Coenders-Gerrits, A. M. J., and Uhlenbrook, S.: Partitioning of evaporation into transpiration, soil evaporation and interception: a comparison between isotope measurements and a HYDRUS-1D model, Hydrol. Earth Syst. Sci., 16, 2605–2616, https://doi.org/10.5194/hess-16-2605-2012, 2012.
Sutanto, S. J., van den Hurk, B., Dirmeyer, P. A., Seneviratne, S. I., Röckmann, T., Trenberth, K. E., Blyth, E. M., Wenninger, J., and Hoffmann, G.: HESS Opinions “A perspective on isotope versus non-isotope approaches to determine the contribution of transpiration to total evaporation”, Hydrol. Earth Syst. Sci., 18, 2815–2827, https://doi.org/10.5194/hess-18-2815-2014, 2014.
Suzuki, K., Kubota, J., Yabuki, H., Ohata, T., and Vuglinsky, V.: Moss beneath a leafless larch canopy: influence on water and energy balances in the southern mountainous taiga of eastern Siberia, Hydrol. Process., 21, 1982–1991, https://doi.org/10.1002/hyp.6709, 2007.
Tahvanainen, T. and Forss, E.: Individual tree models for the crown biomass distribution of Scots pine, Norway spruce and birch in Finland, Forest Ecol. Manage., 255, 455–467, https://doi.org/10.1016/j.foreco.2007.09.035, 2008.
Talsma, C. J., Good, S. P., Jimenez, C., Martens, B., Fisher, J. B., Miralles, D. G., McCabe, M. F., and Purdy, A. J.: Partitioning of evapotranspiration in remote sensing-based models, Agr. Forest Meteorol., 260, 131–143, https://doi.org/10.1016/j.agrformet.2018.05.010, 2018.
Tateishi, M., Kumagai, T., Utsumi, Y., Umebayasi, T., Shiiba, Y., Inoue, K., Kaji, K., Cho, K., and Otsuki, K.: Spatial variations in xylem sap flux density in evergreen oak trees with radial-porous wood: comparisons with anatomical observations, Trees-Struct. Funct., 22, 23–30, https://doi.org/10.1007/s00468-007-0165-8, 2008.
Telmer, K. and Veizer, J.: Isotopic constraints on the transpiration, evaporation, energy, and gross primary production Budgets of a large boreal watershed: Ottawa River Basin, Canada, Global Biogeochem. Cy., 14, 149–165, https://doi.org/10.1029/1999GB900078, 2000.
Tor-ngern, P., Oren, R., Oishi, A. C., Uebelherr, J. M., Palmroth, S., Tarvainen, L., Ottosson-Lofvenius, M., Linder, S., Domec, J. C., and Nasholm, T.: Ecophysiological variation of transpiration of pine forests: synthesis of new and published results, Ecol. Appl., 27, 118–133, https://doi.org/10.1002/eap.1423, 2017.
Tor-ngern, P., Oren, R., Palmroth, S., Novick, K., Oishi, A., Linder, S., Ottosson-Lofvenius, M., and Nasholm, T.: Water balance of pine forests: Synthesis of new and published results, Agr. Forest Meteorol., 259, 107–117, https://doi.org/10.1016/j.agrformet.2018.04.021, 2018.
Venzke, J. F.: Beiträge zur Geoökologie der borealen Landschaftszone. Geländeklimatologische und pedologische Studien in Nord-Schweden, Verlag Ferdinand Schöningh, Paderborn, Germany, 1990.
Walker, A. P., Beckerman, A. P., Gu, L. H., Kattge, J., Cernusak, L. A., Domingues, T. F., Scales, J. C., Wohlfahrt, G., Wullschleger, S. D., and Woodward, F. I.: The relationship of leaf photosynthetic traits – V-cmax and J(max) – to leaf nitrogen, leaf phosphorus, and specific leaf area: a meta-analysis and modeling study, Ecol. Evol., 4, 3218–3235, https://doi.org/10.1002/ece3.1173, 2014.
Wang, D., Wang, G., and Anagnostou, E. N.: Evaluation of canopy interception schemes in land surface models, J. Hydrol., 347, 308–318, https://doi.org/10.1016/j.jhydrol.2007.09.041, 2007.
Wang, H., Tetzlaff, D., Dick, J. J., and Soulsby, C.: Assessing the environmental controls on Scots pine transpiration and the implications for water partitioning in a boreal headwater catchment, Agr. Forest Meteorol., 240–241, 58–66, https://doi.org/10.1016/j.agrformet.2017.04.002, 2017.
Wang, S., Grant, R. F., Verseghy, D. L., and Andrew Black, T.: Modelling carbon-coupled energy and water dynamics of a boreal aspen forest in a general circulation model land surface scheme, Int. J. Climatol., 22, 1249–1265, https://doi.org/10.1002/joc.776, 2002.
Warren, R. K., Pappas, C., Helbig, M., Chasmer, L. E., Berg, A. A., Baltzer, J. L., Quinton, W. L., and Sonnentag, O.: Minor contribution of overstorey transpiration to landscape evapotranspiration in boreal permafrost peatlands, Ecohydrology, 11, e1975, https://doi.org/10.1002/eco.1975, 2018.
Watanabe, T. and Mizutani, K.: Model study on micrometeorological aspects of rainfall interception over an evergreen broad-leaved forest, Agr. Forest Meteorol., 80, 195–214, https://doi.org/10.1016/0168-1923(95)02301-1, 1996.
Wei, Z., Yoshimura, K., Wang, L., Miralles, D. G., Jasechko, S., and Lee, X.: Revisiting the contribution of transpiration to global terrestrial evapotranspiration, Geophys. Res. Lett., 44, 2792-2801, https://doi.org/10.1002/2016GL072235, 2017.
Wharton, S., Schroeder, M., Paw U, K. T., Falk, M., and Bible, K.: Turbulence considerations for comparing ecosystem exchange over old-growth and clear-cut stands for limited fetch and complex canopy flow conditions, Agr. Forest Meteorol., 149, 1477–1490, https://doi.org/10.1016/j.agrformet.2009.04.002, 2009.
Wutzler, T., Lucas-Moffat, A., Migliavacca, M., Knauer, J., Sickel, K., Šigut, L., Menzer, O., and Reichstein, M.: Basic and extensible post-processing of eddy covariance flux data with REddyProc, Biogeosciences, 15, 5015–5030, https://doi.org/10.5194/bg-15-5015-2018, 2018.
Zeng, N., Shuttleworth, J. W., and Gash, J. H. C.: Influence of temporal variability of rainfall on interception loss. Part I. Point analysis, J. Hydrol., 228, 228–241, https://doi.org/10.1016/s0022-1694(00)00140-2, 2000.
Zhao, W. and Qualls, R. J.: A multiple-layer canopy scattering model to simulate shortwave radiation distribution within a homogeneous plant canopy, Water Resour. Res., 41, W08409, https://doi.org/10.1029/2005WR004016, 2005.
Zhao, W. and Qualls, R. J.: Modeling of long-wave and net radiation energy distribution within a homogeneous plant canopy via multiple scattering processes, Water Resour. Res., 42, W08436, https://doi.org/10.1029/2005WR004581, 2006.