the Creative Commons Attribution 4.0 License.
the Creative Commons Attribution 4.0 License.
 | 28 May 2020
A novel data-driven analytical framework on hierarchical water allocation integrated with blue and virtual water transfers
Liming Yao
Zhongwen Xu
Huijuan Wu
Xudong Chen
In this study a novel data-driven analytical framework is proposed for cooperative strategies that ensure the optimal allocation of blue and virtual water transfers under different hydrological and economic conditions. A Stackelberg–Nash–Harsanyi equilibrium model is also developed to deal with the hierarchical conflicts between the water affairs bureau and multiple water usage sectors and overcome problems associated with water scarcity and uneven distribution. It was found that cooperative blue and virtual water transfer strategies could save water and improve utilization efficiency without harming sector benefits or increasing the ecological stress. Data-driven analyses were employed to simulate the hydrological and economic parameters, such as available water, crop import price and water market price under various policies. By adjusting the hydrological and economic parameters, it was found that the optimal allocation and transfer strategies were more sensitive to hydrological factors than economic factors. It was also found that cooperative blue/virtual water transfers respond to market fluctuations. Overall, the proposed framework provides sustainable management for physical and virtual water supply systems under future hydrological and economic uncertainties.
- Article
(3201 KB) - Full-text XML
- BibTeX
- EndNote


Extreme climatic and hydrological conditions have increased water-scarcity pressure. Several Chinese provinces, mostly in northern China, now suffer from severe water scarcity for almost 7 months each year (Zhuo et al., 2016; Cai, 2008), with the relatively high crop provisioning in southern China further aggravating the problems in northern China (e.g. Xinjiang, Heilongjiang, Guangxi, Hunan, Hebei, and Inner Mongolia) (Wang et al., 2014). This pattern has led to a paradox whereby water-intensive crops are being exported from water-insufficient northern China to water-rich southern China, and to enable this crop production, water resources are being transferred from water-rich southern China to water-scarce northern China. However, the South-to-North Water Transfer Project should not be seen as a long-term approach to reduce northern Chinese water shortages (Chen et al., 2017). In the light of the above problems, this paper examined two important issues: blue water transfers to reallocate water between sectors and decrease water usage vulnerability; and virtual water transfers to decrease water stress and modify water-use structures under an international trading environment.
District irrigation in many countries usually involves two different hierarchical structures: a water affairs bureau and water usage sectors. Previous studies have employed stochastic dynamic, multi-objective programming models to resolve the conflicting objectives in water allocation problems (Zeng et al., 2017; Xu et al., 2018, 2019). However, these models have neglected dynamic feedback mechanisms possibly existing in different hierarchical structures, resulting in solutions that do not maximize benefits at the system scale. Instead, game theory, which originated with the pioneering work of Neuman and Morgenstern (1944), was a successful alternative tool used for analysing strategic interactions among different hierarchical decision makers (Madani, 2010; Ye et al., 2018). We recall some typical game-theoretical models from water resource management relating to our work, as shown in Table 1. In a water allocation context, considering the conflict of two hierarchical stakeholders through strategic interaction is vital, and hence a Stackelberg game is used to solve water allocation problems having stakeholders in different positions.
However, as there are multiple followers, a major problem is equitably and sustainably allocating the limited water resources to the various water-use sectors, agricultural, industrial, domestic and ecological, and deciding whether any excess water can be transferred to other sectors. Under government guidance, regional sector usage managers have the right to reallocate/sell their surplus water to other sector managers, with the transfer prices decided through negotiations between the transfer participants (Dai et al., 2017; Ahmadi et al., 2019; Wang, 2018). Multi-objective programming has been extensively used to resolve water allocation conflicts of competing water usage sectors (Sedghamiz et al., 2018a; Brown et al., 2015). Nash (1953) proposed a two-player bargaining game for cooperative resource sharing, after which Harsanyi (1959, 1963) and Sedghamiz et al. (2018b) generalized the Nash solution from a two-player bargaining game to an n-player game, which was more suitable for the multiple-stakeholder non-cooperative situation. In this paper, during the water transfer process, an n-person Nash–Harsanyi bargaining model is developed, which also considers the water withdrawal and reallocation process among sectors. To the best of our knowledge, there have been few studies that have applied game theory to resolve two different conflicts within an irrigation district that include a leader (water affairs bureau) in the dominant position and multiple followers (water usage sectors) or that have developed a suitable bilevel model to solve the problem.
Blue water transfers allow for water transfers between sectors, and virtual water transfers (embedded in the crops) (Zhuo et al., 2016) allow for water transfers between countries. Therefore, it is possible that importing water-intensive goods (particularly crops) rather than producing them domestically could conserve water resources and drive economic development in the exporting countries (Shtull-Trauring and Bernstein, 2018; Jiang and Marggraf, 2015). Virtual water, which was first introduced by Allan (1993), refers to the water embedded in a product in a virtual form (Liu et al., 2009). Virtual water transfers, therefore, allow for the redistribution of water resources between countries, which means that water-scarce countries can conserve their own water resources, while water-sufficient countries can obtain greater economic benefits by selling their surplus water (Liu et al., 2015a, b) to water-scarce countries. In this study, blue water and virtual water are jointly considered within an irrigation district to completely resolve water-scarcity problems, as an increase in crop imports could lead to a decrease in local production, which could significantly reduce local agricultural incomes, and an increase in crop exports could lead to local water and ecological stress. Determining the optimal blue and virtual water transfers is thus of great importance. While there have been several studies on the evolution of the virtual water trade (Lamastra et al., 2017; Duarte et al., 2016; Chen et al., 2017), its influence (Mohammadikanigolzar et al., 2014) and its determinants (Zhuo et al., 2016), no comprehensive systematic method has been developed to determine optimal virtual water transfers.
Therefore, to provide a new, unstructured alternative to sectoral water demand satisfaction, the first objective is to determine an optimal blue/virtual water transfer and water allocation strategy. In addition to accurately quantifying the blue water transfers between the sectors, this paper also determines the optimum imported crop quantity to preserve farmer enthusiasm in the importing country and the optimum exported crop quantity to ensure water sufficiency in the exporting country. The second innovation in this paper is the use of game theory within a bilevel framework to determine the blue/virtual water transfers and sectoral water allocations, which has rarely been applied to irrigation district analyses. Previous research in this area and the analysis techniques applied are given in Table 1. Because this problem cannot be modelled using conventional methods, a novel Stackelberg–Nash–Harsanyi equilibrium model is developed that jointly considers the blue/virtual water transfers and the sectoral water allocations within a hierarchical decision-making structure. In this way, equilibrium can be achieved through the strategic interactions between the water affairs bureau and the water usage sectors, with the competing water usage sectors not only making sustainability decisions that target their own benefits, but also allowing blue water transfers to improve overall water usage system efficiency.
Dai et al. (2017)Jiang and Marggraf (2015)Shtull-Trauring and Bernstein (2018)Ahmadi et al. (2019)Fu et al. (2018)Xu et al. (2018)Sedghamiz et al. (2018b)Sedghamiz et al. (2018c)Guo et al. (2012)Sedghamiz et al. (2018a)Wang et al. (2008)
As is known, bilevel optimization techniques are intrinsically complex to solve, referring to the research results of Hossein et al. (2018) and Wei et al. (2017). In regard to a solution, Eichfelder (2010) presented several new solutions for general multi-objective bilevel optimization problems using an optimistic approach. In other studies, different methods such as particle swarm optimization and artificial neural networks have been used to solve bilevel water exchange decision-making problems in eco-industrial parks (Ramos, 2016) and product engineering (Liu et al., 2017b). However, these techniques have seldom been applied to practical water allocation cases due to their complexity. In this paper, a bargaining weights method, a Nash–Harsanyi solution method, and a genetic algorithm (GA) are combined to solve the proposed model.
Overall, the main results and contributions in this study are summarized as follows.
Contribution 1: by incorporating blue and virtual water transfers, the developed model further relieves water-scarcity stress, offers insights into crop planting and import/export quantities, and allows for the application of different strategies based on changing hydrological and market conditions. Overall, therefore, the model has positive effects on the water stress index, water usage efficiency and sectoral vulnerabilities, and saves water and land through its consideration of international transactions. Water usage efficiency between the three sectors was found to increase because of the crop planting plan modifications, blue water transfers.
Contribution 2: a novel game-theory model based on the Stackelberg game and Nash–Harsanyi equilibrium was developed to resolve the “leader–followers” and “competing followers” conflicts through strategic interaction. It was found that the total consumption using a two-stage optimization model was generally higher than when using our proposed model and was therefore detrimental to water conservation.
2.1 Study area
The Hetao irrigation district has been facing a conflict between north–south crop export requirements and water scarcity. Chinese irrigation districts, which produce more than 75 % of the grain consumed in China, have become increasingly important in ensuring both China's food security and its socioeconomic development (Wang et al., 2005). As studies on small and specific irrigation districts have proved to be more significant than national studies in resolving water-scarcity problems, the Hetao irrigation district was chosen as the case study area to (1) optimize the agricultural, domestic and industrial sector water withdrawals in a planning year; (2) optimize the virtual water quantities to be imported and exported under the international trading environment; and (3) optimize the blue water quantities to be transferred under a water market environment. This study therefore provides water reallocation perspectives, assists in alleviating local water scarcity, and promotes sustainable socioeconomic-environmental development.

Figure 1Hetao irrigation district longitude–latitude projection image © Google Maps.
The Hetao irrigation district (Fig. 1) is an agricultural production and trade area in western Inner Mongolia, China (40∘13′–42∘28′ N, 105∘12′–109∘53′ E), that has five counties (Dengkou, Hanghou, Linhe, Wuyuan, and Qianqi) and an irrigated area of 5.74×10³ km2, the water for which comes mainly from the Yellow River. The main problems facing the Hetao irrigation district are continually increasing water requirements and severely constrained freshwater resources. The agricultural activities in this region consume approximately 93 % of the total regional water consumption (Feng et al., 2012), and while it has a continental monsoon climate, there is little and erratically distributed rain (130–215 mm, with 70 % falling in July, August, and September) and an annual potential evaporation of 2100–2300 mm (Liu et al., 2015a, b; Wang et al., 2005). As the Hetao irrigation district is close to several port cities, key crops are imported from Russia and other countries, which helps relieve some of the water consumption stress.
2.2 Water trading background
The water trading environment considers both blue and virtual water trading. Blue water is the surface or groundwater that evaporates during production processes, while virtual water is the volume of water needed to produce a certain commodity (Allan, 1993). After each sector (e.g. domestic, industrial or agricultural) has been granted initial water withdrawal rights, blue water can be directly transferred from one sector to another using conveyance infrastructure. Virtual water, which is calculated based on the crop exports or import volume sums, is indirectly transferred from one country to another embedded in the traded crops. In this study, three crops are considered: wheat, maize and sunflower.
Water pricing is a key component of current water policy reforms in China as it is believed that reasonable pricing reform can guide water transfers; that is, reasonable transaction prices can control water use and market participation. Generally, water rights trading takes place between two participants, who together negotiate a suitable price. Therefore, in this study, the unit price of the water trade is based on the buyer's willingness to pay and the seller's reservation sales price (Erfani et al., 2014). Therefore, the price is determined as the weighted sum of the willingness to pay the price and the reservation sales price, that is, the negotiated price, as follows:
where is the degree of willingness to pay by the two trading participants, or the decision makers, pi is the water price set by the leader for water withdrawal, PTI is the price of the water transferred to the industrial sector, and PTD is the price of the water transferred to the domestic sector.
3.1 Notations
The following notations are used to develop the model.
Indexes: k: crop indicators, k=1 for wheat, k=2 for maize, k=3 for sunflower;
i: water usage indicator, i=1 for agricultural sector, i=2 for industrial sector, i=3 for domestic sector, i=4 for ecological sectors. Parameters:
pi: water price set by the leader for sectoral water uses, RMB m−3;
ERWi: economic return per unit of water consumption in sectors, , RMB m−3;
ERPk: economic return from agricultural product exports, i=1, where , RMB kg−3; ck: economic costs because of agricultural product imports, RMB kg−1;
TC: transaction cost per unit of water resource from the agricultural sector to the industrial or domestic sectors, RMB m−3; μ: the irrigation coefficient, which presents the utilization effectiveness of irrigation water;
A: total available area for crop planting, hm2;
ϕind: the gross industrial output value, RMB;
Rk: effective rainfall, mm d−1;
β: coefficient for efficient rainfall;
Pk: actual rainfall, mm d−1;
ϖk: crop k consumption per unit in the Hetao irrigation area, kg per person per year). Auxiliary variables (continuous variables): AW: maximum volume of available water in Hetao irrigation district, m3 yr−1;
PTI: price of water transfers to industrial sector, RMB m−3;
PTD: price of water transfers to domestic sector, RMB m−3;
θ: degree of willingness to pay of the two trading participants; if θ=0.5, it means the average of the willingness to pay of the two trading participants; wk: water irrigation for crop k, m3 yr−1; Wk represents the blue and green water components in crop k, m3 hm−2 yr−1);
yk represents the crop yield per unit of irrigation area, kg hm−2 yr−1
lk: total yield of crop k, kg yr−1; VWk: virtual water content of crop k, m3 kg−1; A1k: area allocated to crop k, hm2 yr−1
di: water demand of sectors, , m3 yr−1
d1k: water demand of crops in agricultural sector, , m3 yr−1; ϕpop: per capita disposable income, RMB;
POP: population in the Hetao irrigation area. Decision variables (continuous variables): Xi: initial water rights in sectors, , determined by the upper-level decision maker, m3 yr−1;
EMk: quantity of product exports, determined by the upper-level decision maker, kg yr−1; IMk: quantity of product imports from international trade, determined by the upper-level decision maker, kg yr−1;
WTI: water transfer from agricultural sector to industrial sector, determined by the lower-level decision makers, m3 yr−1; WTD: water transfer from agricultural sector to domestic sector, determined by the lower-level decision makers, m3 yr−1; x1k: water irrigated to crop k in the agricultural sector, determined by the lower-level decision maker, , m3 yr−1.
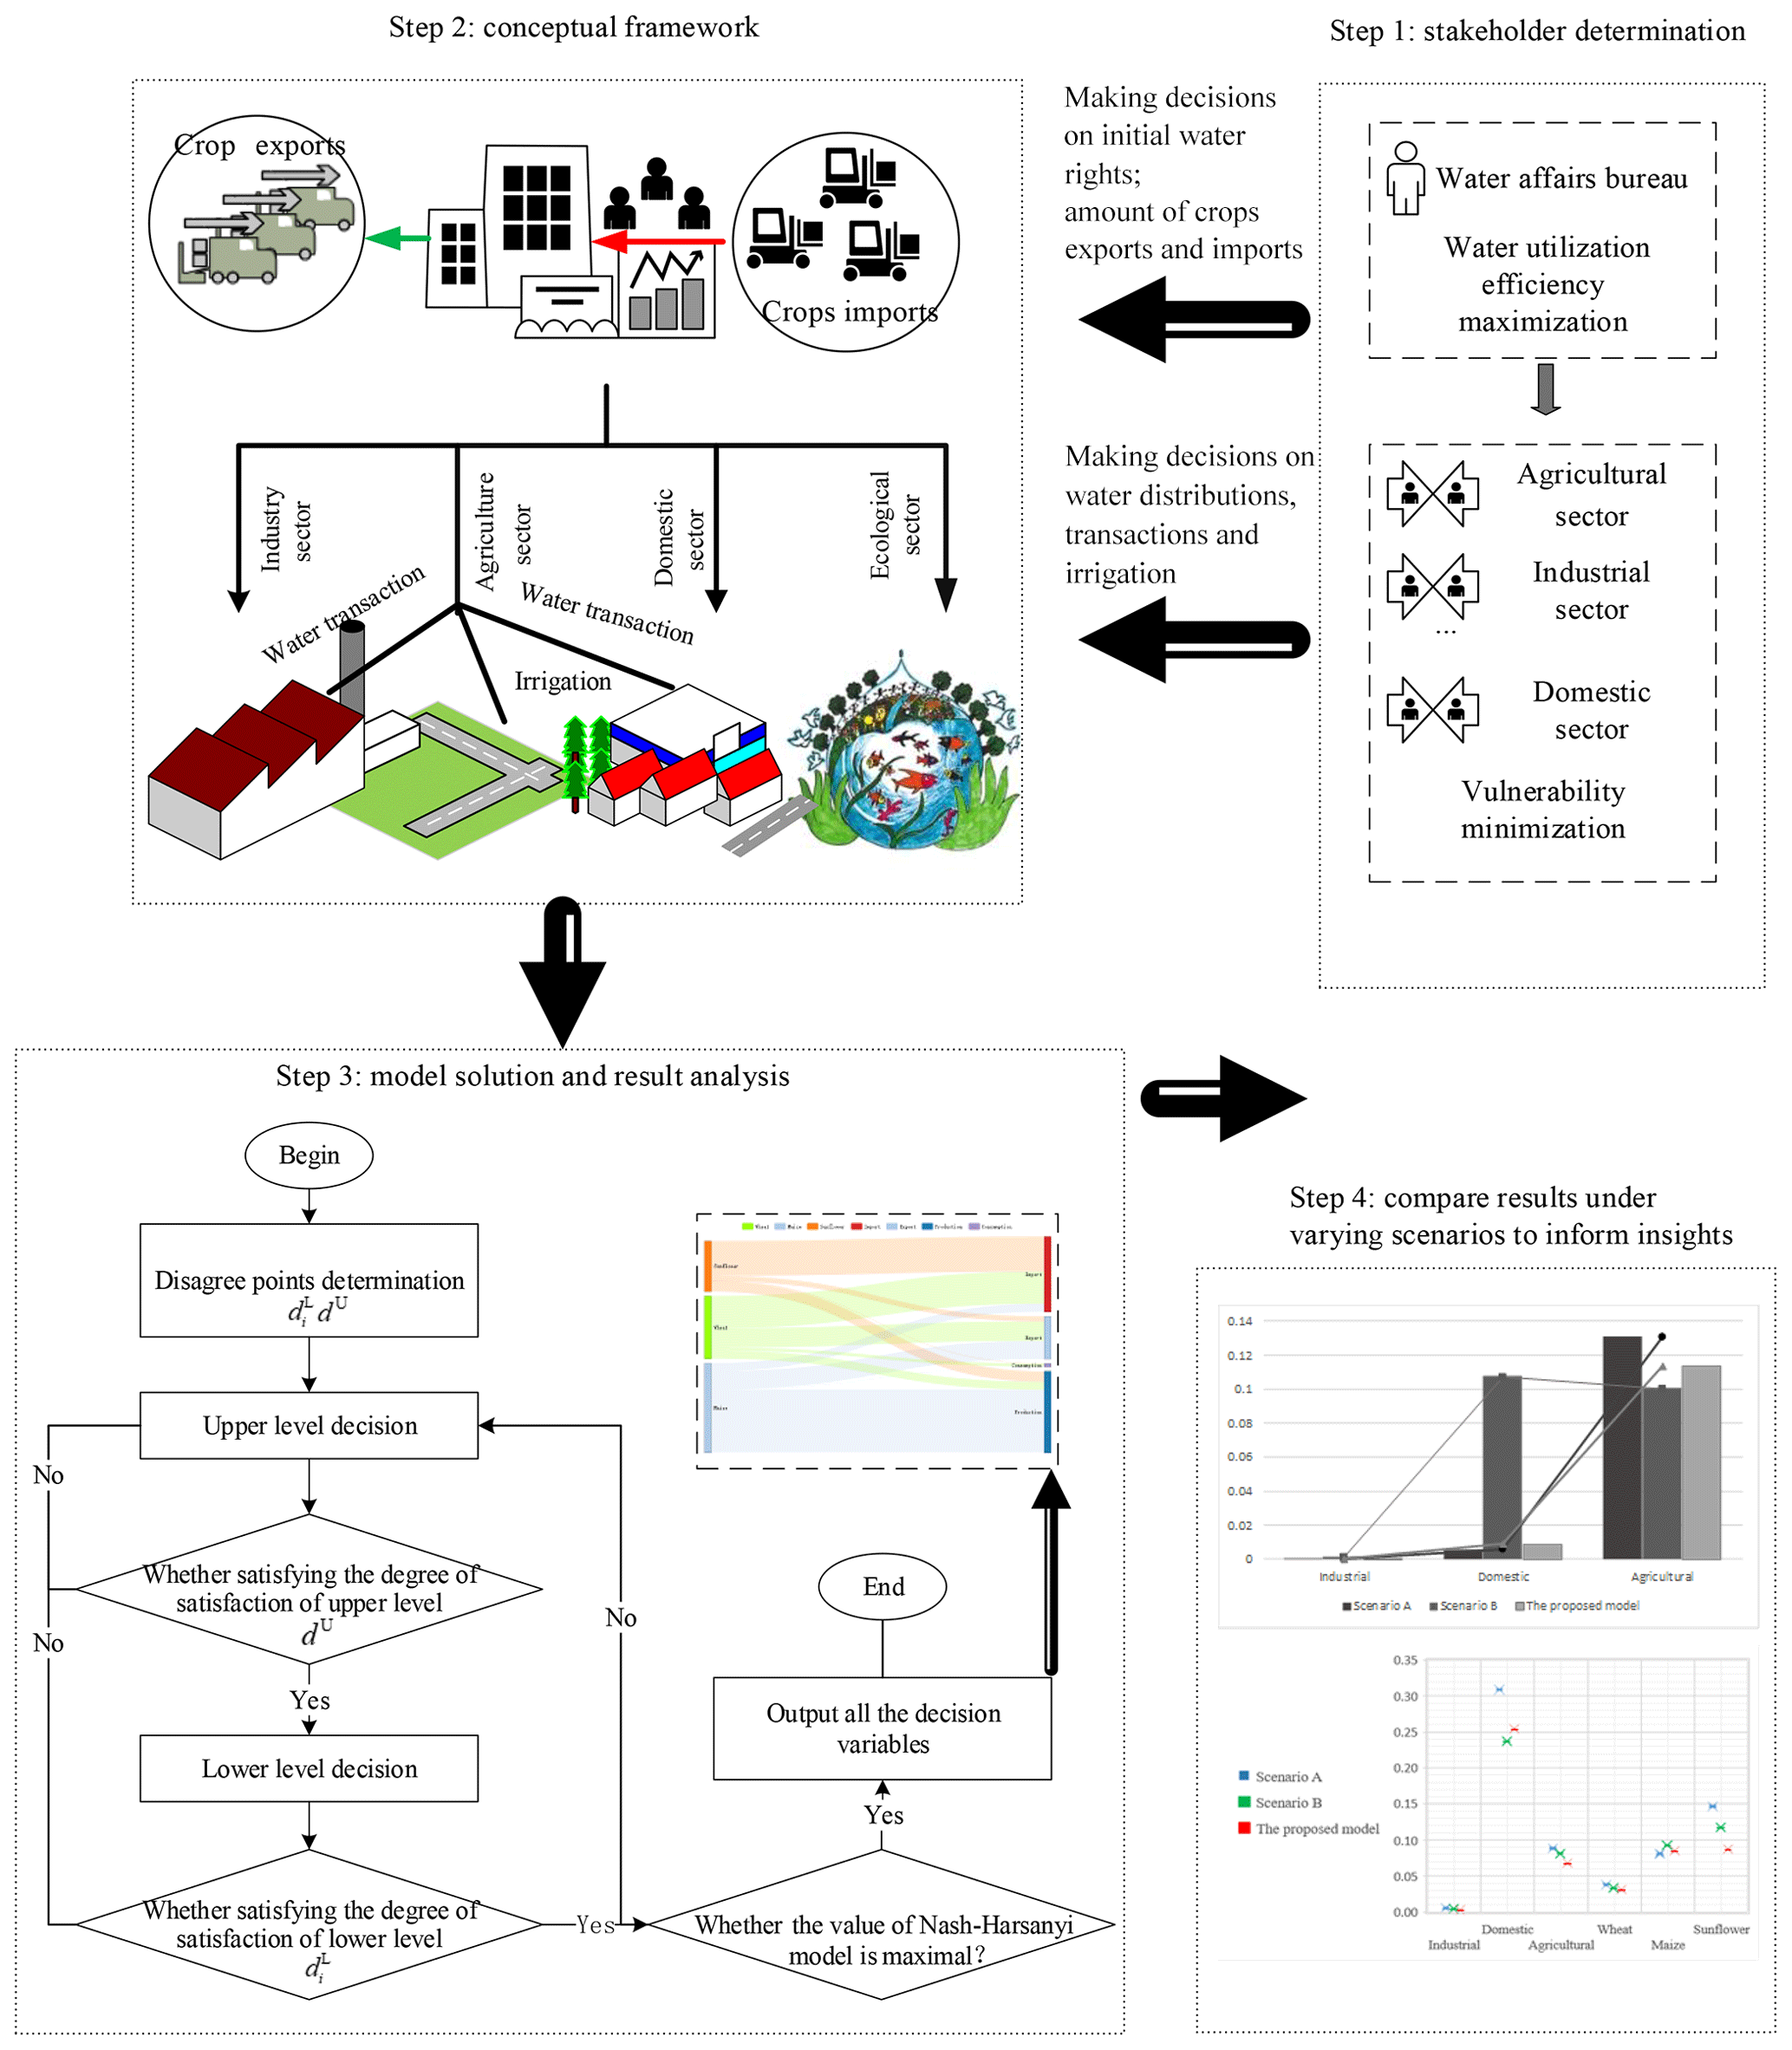
3.2 Bilevel water allocation system framework
Figure 2 gives a complete description of the four steps covered in this study. First, the water allocation system stakeholders are identified, after which the conceptual water allocation framework is constructed (Fig. 3). The proposed model is then applied to a real-world case study and decisions made on the water allocations, crop irrigation, international imports, inter-regional exports and blue water transfer quantities. Finally, to determine the most appropriate approach for future water sustainability, multiple scenarios are examined.
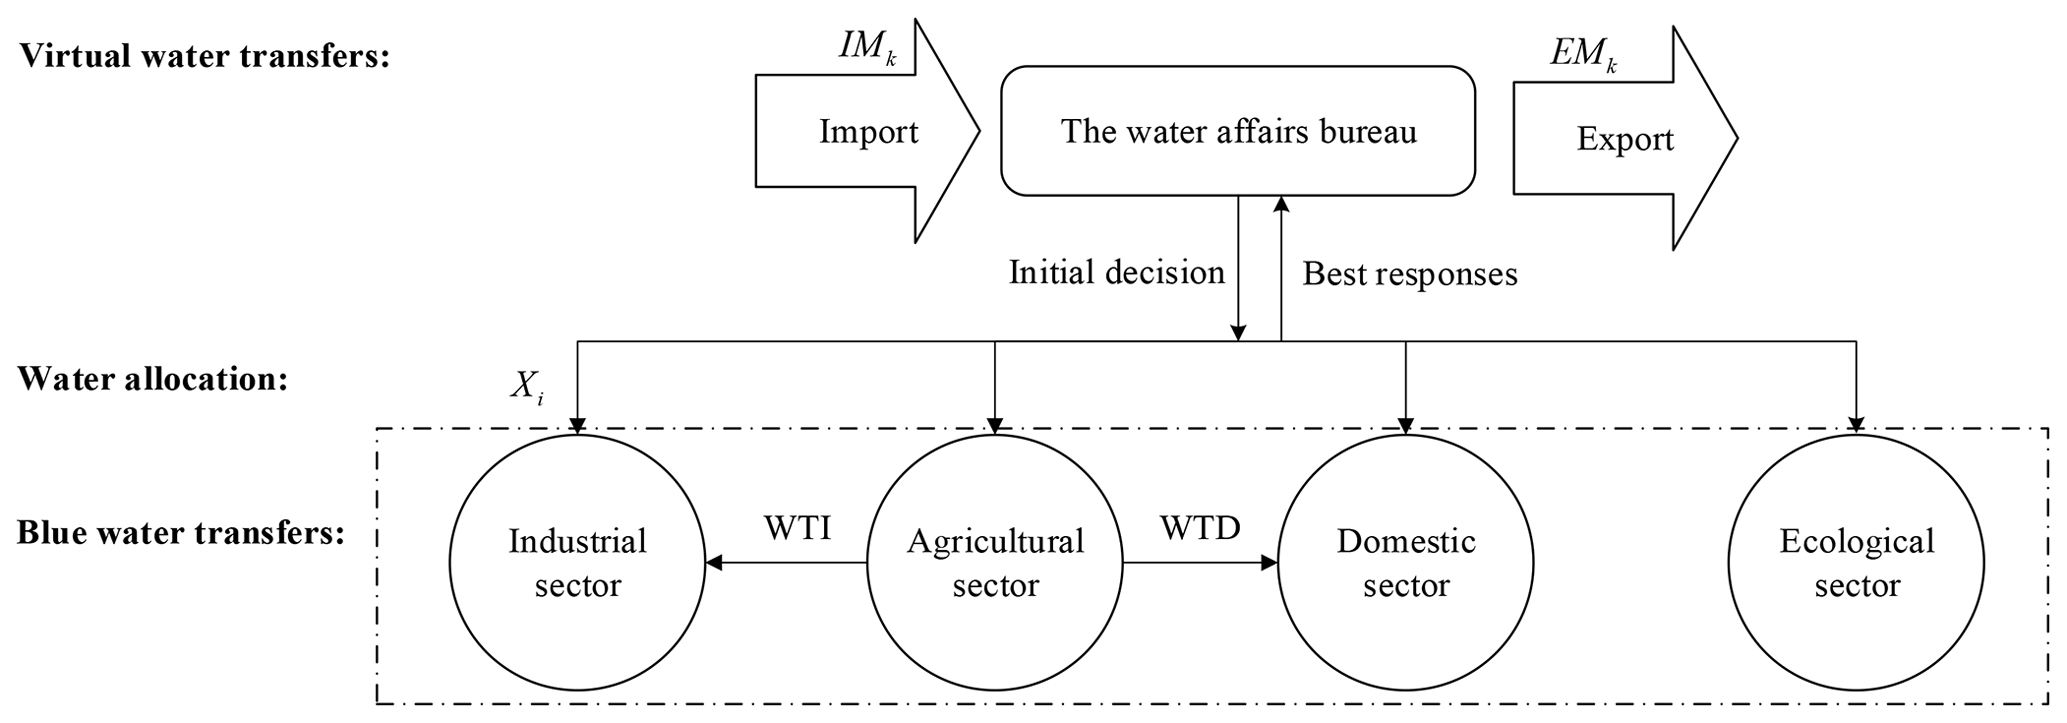
Driven by a traditional water resource management process (Harsanyi, 1963), this study constructs a bilevel framework that has one leader, the water affairs bureau, and multiple followers, the water usage sectors, as shown in Fig. 3. Two games are included in the framework: a Stackelberg game between the leader and followers in which the water affairs bureau (the leader) takes the leading role in allocating the water resources, moves first and has complete information about the followers' possible reactions, and the water usage sectors (the followers), who react after being given the leader's strategy; and a Nash–Harsanyi bargaining solution between multiple followers in which the n followers make corresponding decisions based on the leader's decisions (Fu et al., 2018).
The following section outlines the mathematical model formulation. As water resource management allocation in Chinese irrigation districts usually involves a single leader and several followers, it is suitable for a Stackelberg–Nash–Harsanyi equilibrium model application. The model was developed based on the following assumptions.
Assumption 1: regions with water deficits can import agricultural products from neighbouring countries that have surplus water.
Assumption 2: the water market is available for all the sectors, with the water trading prices being defined as the average willingness to pay of the participants.
Assumption 3: in semiarid and arid regions, as the water is scarce relative to the available land, it is assumed that land availability does not constrain crop decisions.
3.3 Objective functions
To ensure both economic benefits and water demand satisfaction in the different sectors, the water affairs bureau seeks to maximize the water resource system's water utilization efficiency, as shown in Eq. (2). To achieve economic development, the leader also needs to determine the crop quantities to be exported or imported, and the followers need to independently minimize their own vulnerabilities.
Under a water-scarce environment, the leader focuses more on water utilization efficiency. Therefore, a fractional linear programming model (Eq. 2) is employed to reflect the water utilization efficiency, in which the imported crops and the water transfer costs are considered when determining total economic benefits.
where Re is the total economic returns from the agricultural, industrial and domestic sectors, as shown in Model (3). (p1×x1k)), and represent the economic returns in the different sectors. ERWk is the economic return per unit of water consumed by the crops, ERPk is the economic return from the agricultural product exports, where . In addition, , and are respectively the export returns, import costs and transaction costs, where ck is the economic cost due to agricultural product imports, and TC is the transaction cost per unit of water resource unit transferred from the agricultural sector to the industrial or domestic sector.
The lower-level decision makers are the water usage sectors' managers that independently minimize their own vulnerabilities. Vulnerability is related to the water demand and the water supply and is the extent to which the water allocation system can or cannot cope with water scarcity or water abundance (floods). In this way, the allocation strategy is expected to have the ability to meet the “water demands” while avoiding the waste of water. And thus, the vulnerability, which is denoted as , is assessed from the demand loss degree (FDD) and the supply loss degree (FEL), as shown in Eqs. (5)–(15). An F equal to 0 means that the water resource system is stable in the planned period. When F has a value greater than 0, this reflects poor management and water allocation and therefore greater vulnerability.
where ωDD and ωEL are the weights for the demand loss degree and supply loss degree in the different sectors, .
3.4 Model constraints
Specific constraints reflect the real-world practice management rules and behaviours. The objective function (2) is subject to constraints (16)–(19), and constraint (21) characterizes the feasible region on the lower level.
3.4.1 Available water constraint
The water withdrawals for the three sectors cannot exceed the initial water in the irrigation district.
3.4.2 Price constraint
The benefits need to be considered when deciding on internal sectoral transactions. When the water demand in the industrial or domestic sectors is greater than the available water withdrawal, the water usage sector needs to buy water from the water market; conversely, a manager can sell extra water in the water market if such water trading leads to greater benefits than using the water to irrigate crops. Nevertheless, the transaction price cannot exceed the water withdrawal price.
3.4.3 Ecological water requirements
To guarantee sustainable development in the whole river basin, the minimum ecological water requirements must be satisfied across the whole river basin.
3.4.4 Export and import balance equation
The annual export volume plus the grain consumption should be smaller than the total grain yield plus the annual import volume. Equation (19) is the import–export balance equation, POPϖk is the total consumption in the irrigation area, POP is the Hetao irrigation area population, ϖk is the annual crop k consumption per unit in the Hetao irrigation area, and lk is the crop yield, which is determined based on the water allocated to the different crops on the lower level.
3.4.5 Planting area constraint
The land area allocated to the different crops in a given cropping season must not exceed the total cultivatable area (denoted by A) in that season, as shown in constraint (21), in which .
3.5 Solution procedure
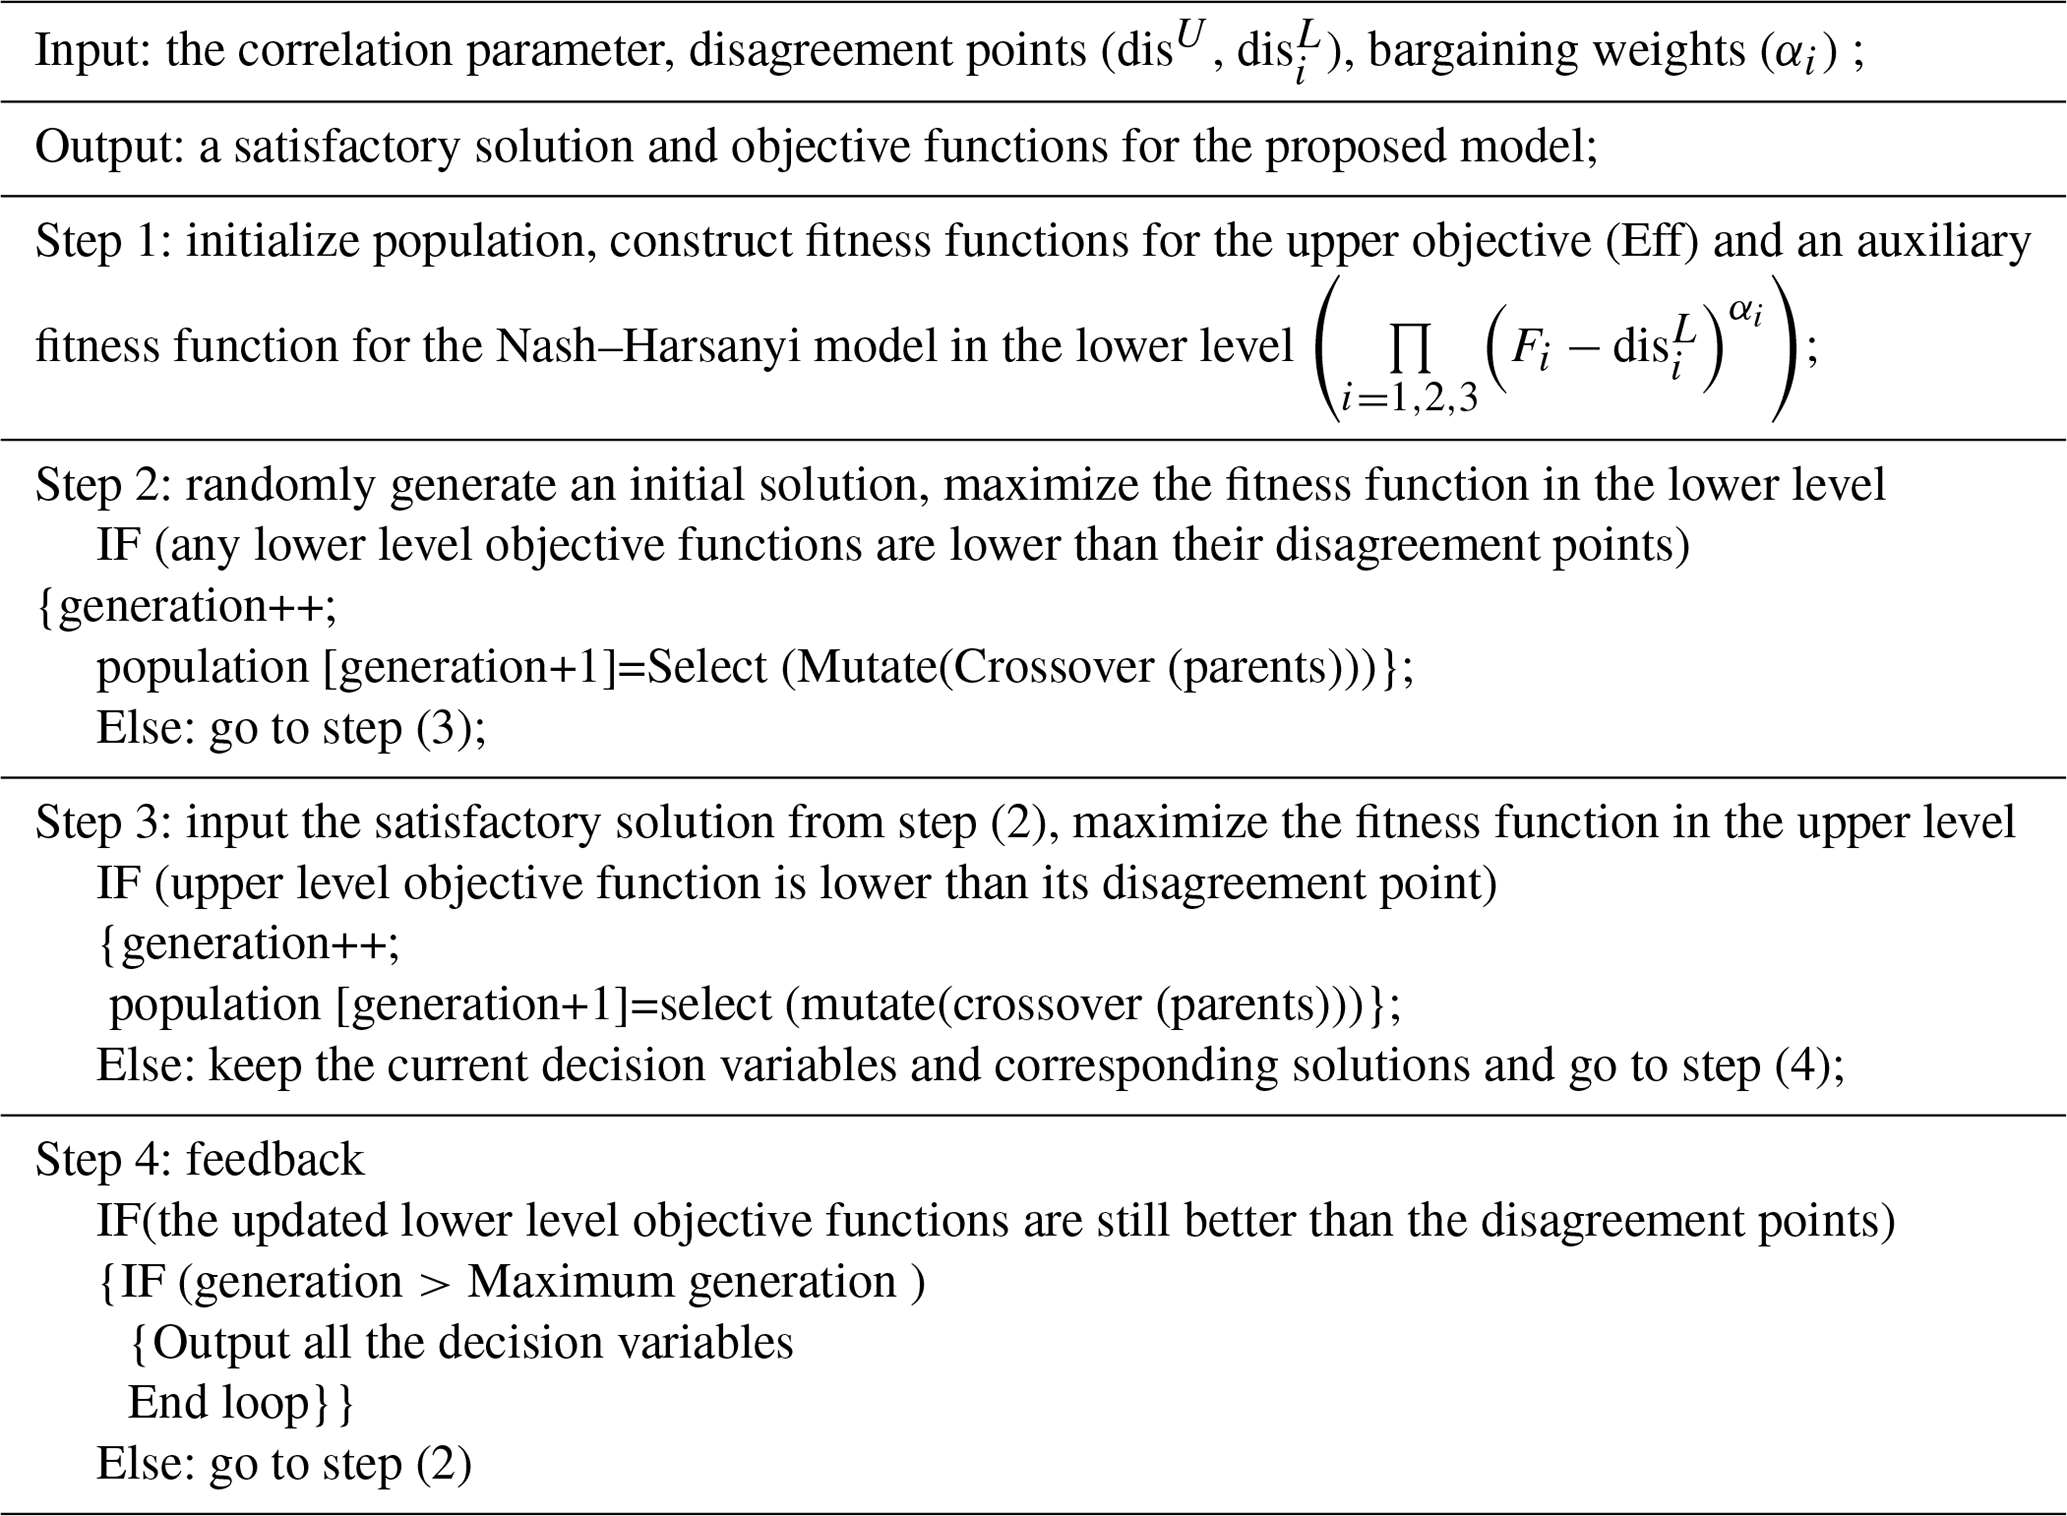
There are two types of games in this solution procedure: the game between the leader and the followers, and the game between the followers. The leader makes virtual water or blue water transfer decisions, and the followers decide on their own rights to water withdrawal and irrigation. Therefore, a compromised solution is needed between the upper- and lower-level decision makers. Figure 4 illustrates the four steps for the Stackelberg–Nash–Harsanyi bargaining process, and Table B1 in the Appendix shows a pseudo code for solving the Stackelberg–Nash–Harsanyi bargaining process.
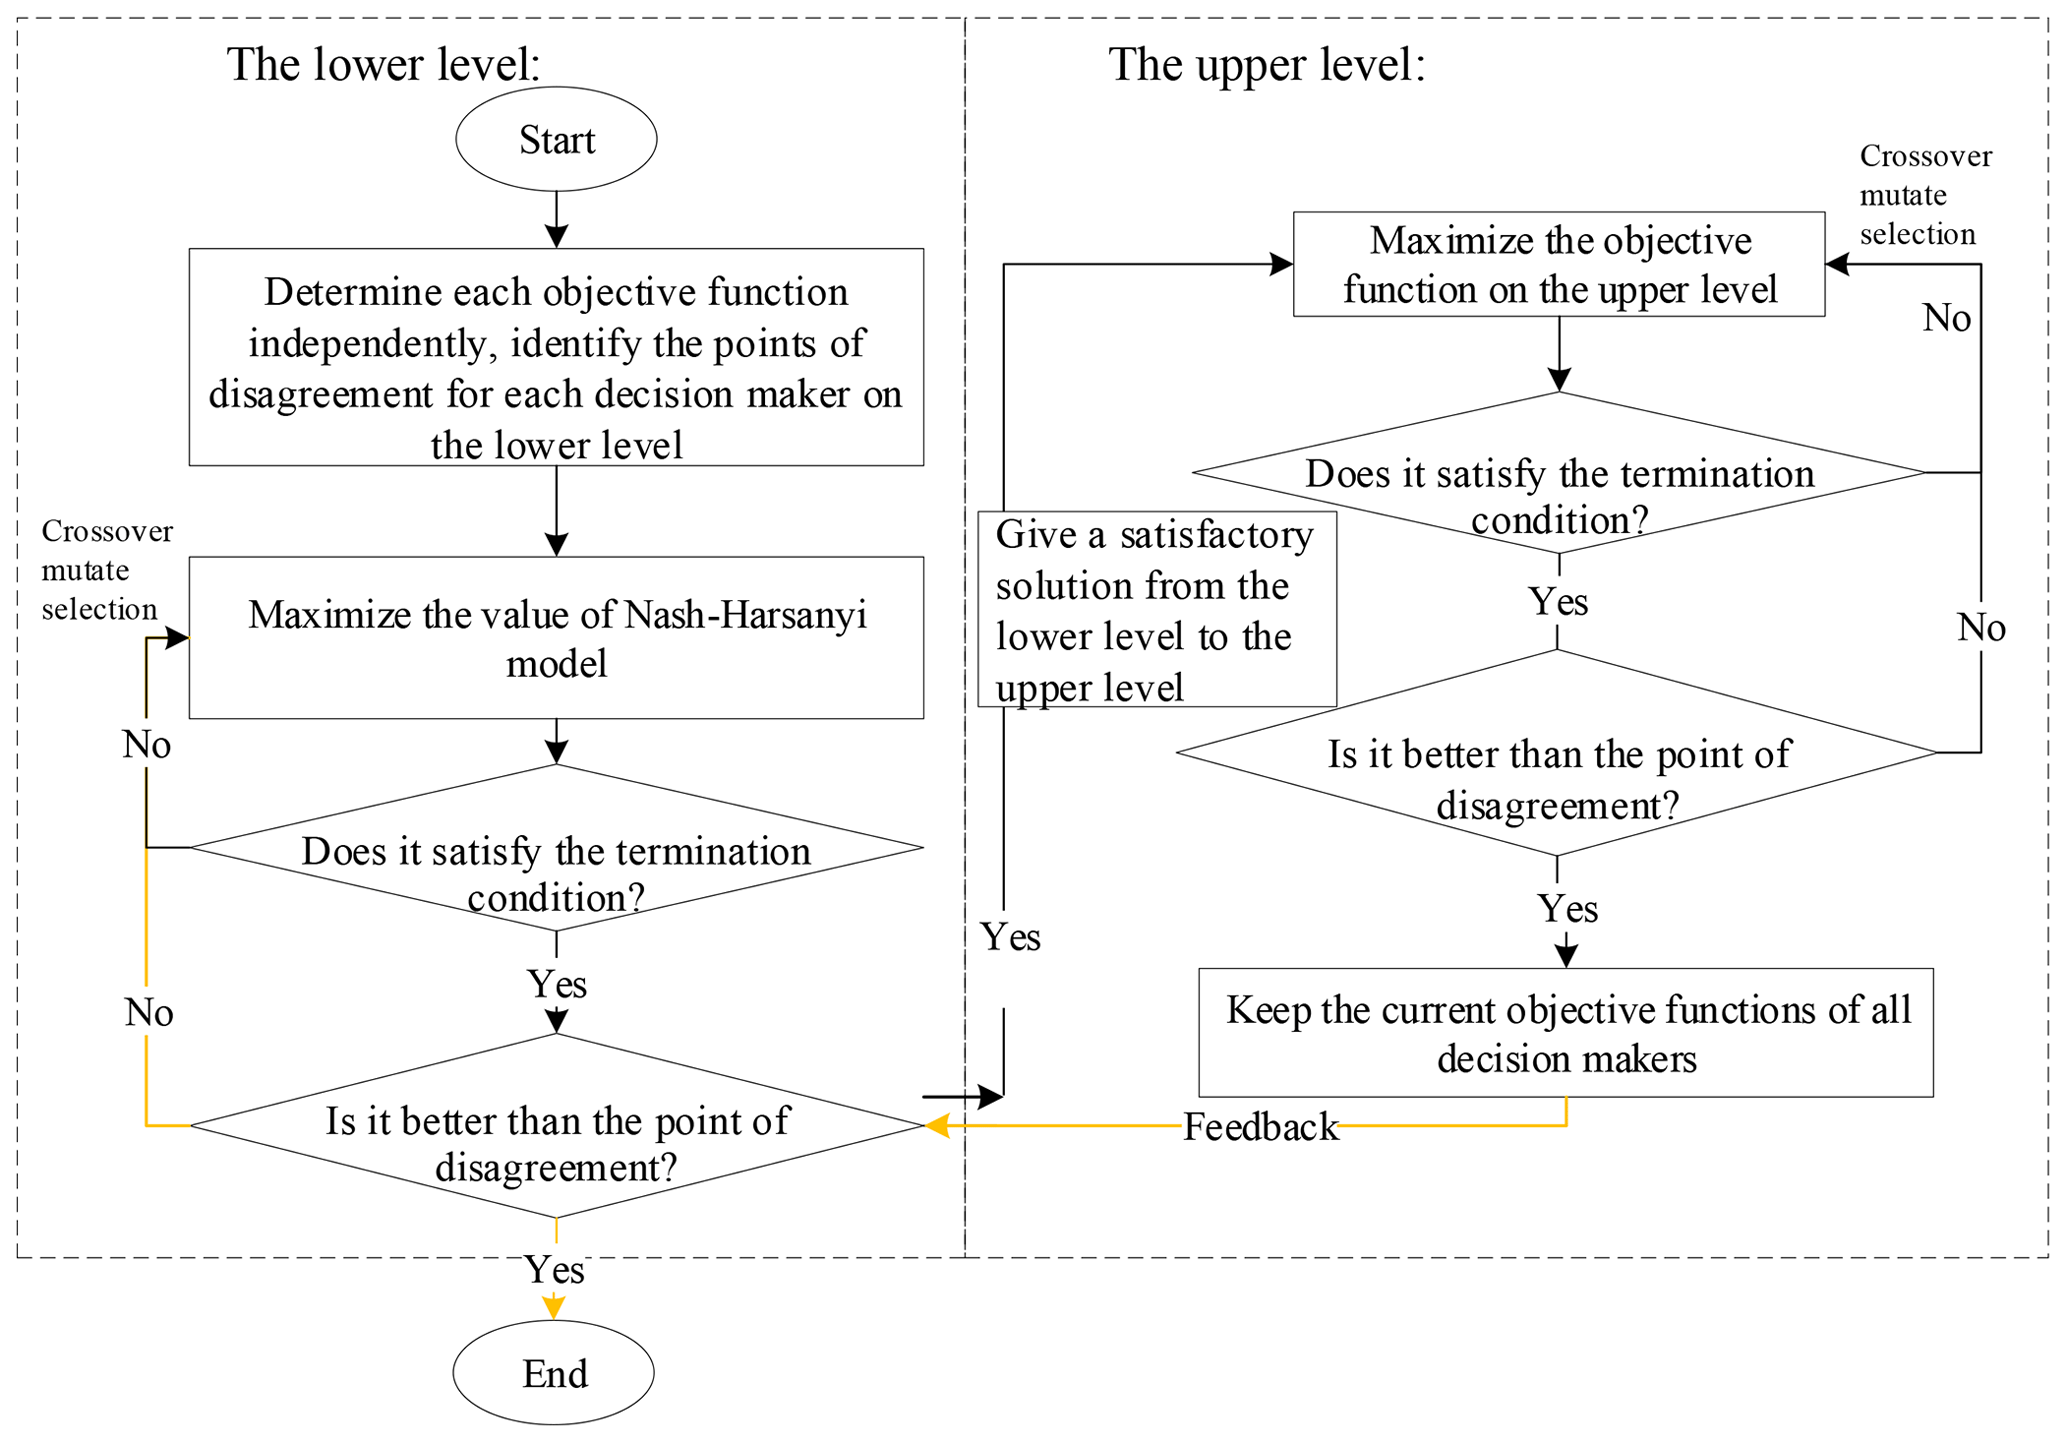
Step 1: determine the disagreement points (disU, dis) and the bargaining weights (αi) for the decision makers on each level and randomly generate an initial solution.
Step 2: maximize the value by selecting the level objective functions that are better than the respective disagreement points, determine whether the termination condition is satisfied and, if yes, go to Step 3; otherwise, continue to add generations.
Step 3: maximize the upper-level objective function on the premise that it is better than the disagreement point, determine whether the termination condition is satisfied, and if yes, output all decision variables, and go to Step 4; otherwise, continue to add generations.
Step 4: determine whether the lower-level objective function is still better than the disagreement points and, if yes, end the loop; otherwise, go back to Step 2.
Combined with the practical problem described in this paper, the vector for the disagreement points is defined as the maximum vulnerability for the followers and the minimum water utilization efficiency from the leader. Specifically, the disagreement point is calculated as follows.
The leader's individual best and least solutions obtained by the GA method are x1k; Effmax) and , where
Similarly, the best and least solutions of the followers are and respectively, where
The lower tolerance limits ) for achieving the goal levels of the leader and follower can be defined as disagreement points (denoted as disU, dis) for the decision makers on each level. Then, the additional constraints for each level are added so that each objective function value is better than the disagreement point respectively (Eff>disU, with ); that is, the disagreement point presents the worst result that the decision maker was unwilling to accept.
The bargaining weights, which reflect each follower's degree of importance, are defined based on water demand elasticity. For the demand principle, the formula for calculating the water demand elasticity level is , and then each follower's bargaining weight under the demand principle is calculated as . In this study, the disagreement points disU and dis are set to 33 and 0.3 respectively. The bargaining weights are respectively defined as and 0.3. The solving algorithm is coded in MATLAB R2017a.
4.1 Economic parameters
The main data sources are based on the Bayna Noaoer Yearbook, the Hetao irrigation district statistical data and some published papers. The outputs for each sector per unit of water (ERWi) are ERW1=2.34 RMB m−3, ERW2=109.96 RMB m−3, and ERW3=131.17 RMB m−3 (Liu, 2016). From http://price.h2o-china.com/ (last access: August 2018) and the Development and Reform Commission and Department of Water Resources' agricultural water price adjustment programmes, the price of water is determined to be p1=0.103, p2=3.85, and p3=4.40 in 2020. The prices of crops (wheat, maize and sunflower) imported from other countries are determined according to the average import prices of agricultural crops over the years, that is, c1=2.58, c2=1.50, and c3=4.10 RMB kg−1. The water transfer price, θ, is set equal at 0.5, and the water transfer prices are PTI=1.98 and PTD=2.25. The transfer cost TC=1.00 RMB m−3 is based on http://cwex.org.cn/lising/ (last access: August 2018). The consumptions of each crop in 2020 are predicted to be 1.22×10⁸, 1.73×10⁷ and 2.90×10⁵ kg respectively.
4.2 Hydrological parameters and water demand analysis
Using the data extracted from the BayanNur Water Resources Bulletin from 2012 to 2015 and based on Eqs. (A4)–(A7), η is 0.574, KD is 6.9×10⁶ (R2=0.978), θ is −0.858, and KI is 8.9×10¹⁶ (R2=0.835). μ is the irrigation coefficient, which presents the utilization effectiveness of irrigation water, and its value is 0.487 in 2020 (Wang et al., 2017; Wang, 2017). Three representative crops (wheat, maize and sunflower) are chosen because these crops constitute a large share of the total production in the area. The water demand and virtual water content of these crops are calculated based on Eqs. (A4)–(A7). Water demand in each sector is predicted respectively, , , and . Moreover, the annual water demand in the ecological sector for sediment scouring will be 1.64×10⁸ m3 in 2020 (Wang et al., 2017; Wang, 2017). More initial data are present in Appendix D.
4.3 Optimal virtual water trade
This study considers both the inter-regional and international transactions (virtual water transfers) and then incorporates and quantifies water transfers in the form of virtual water when optimizing the import and export process. Table 2 shows the optimal amounts of inter-regional export and international import trade and verifies the corresponding saved irrigation water (the virtual water embedded in imported crops) and area (the virtual land that would have been planted if crops had not been imported).
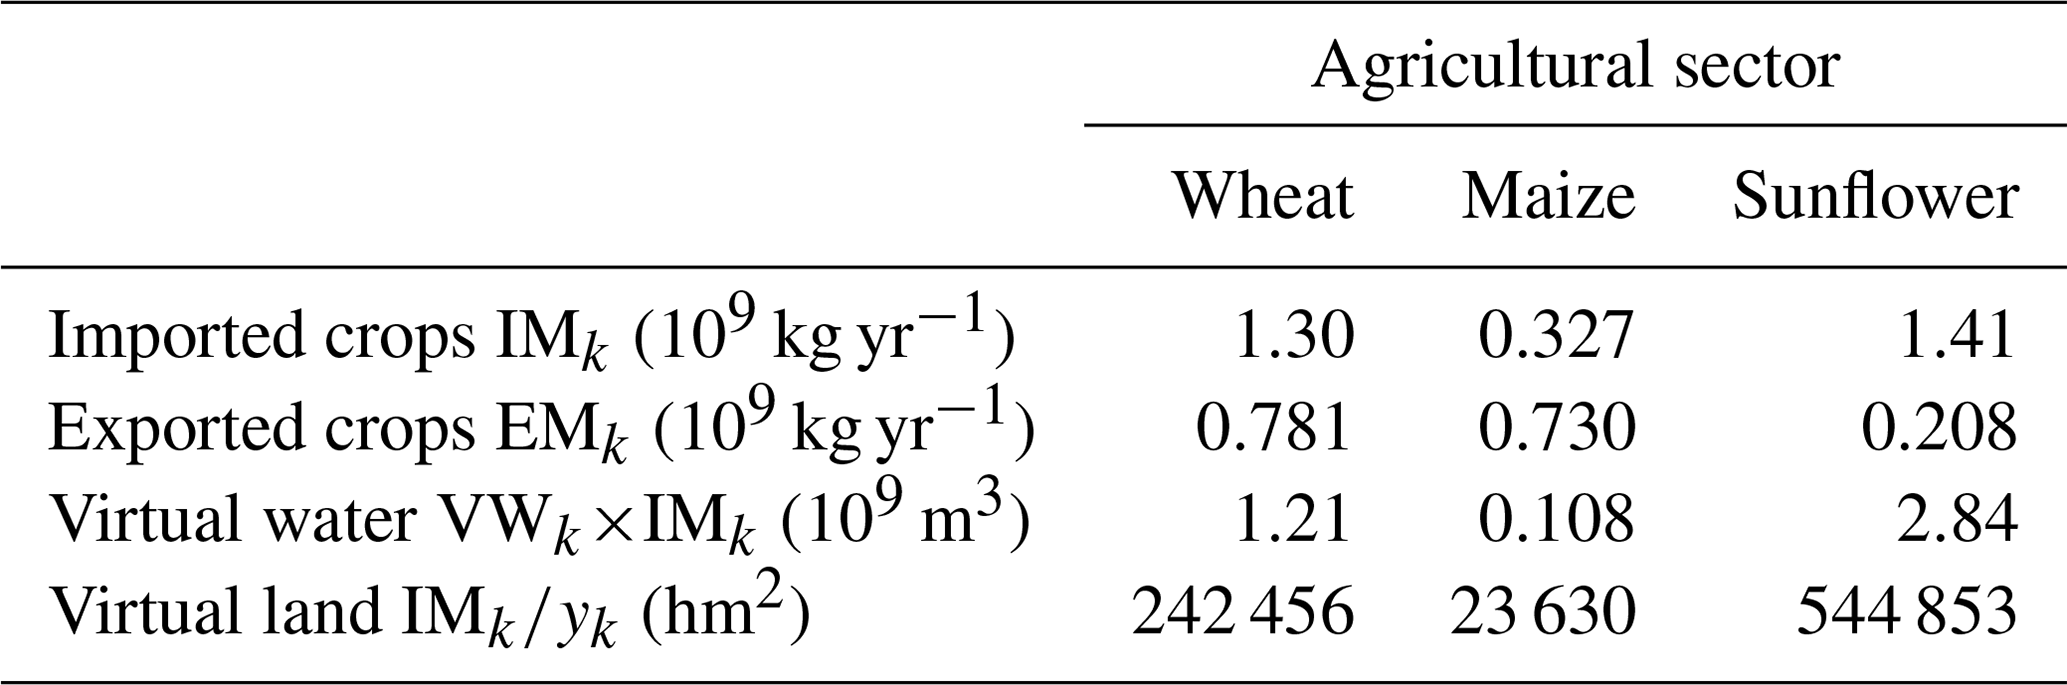
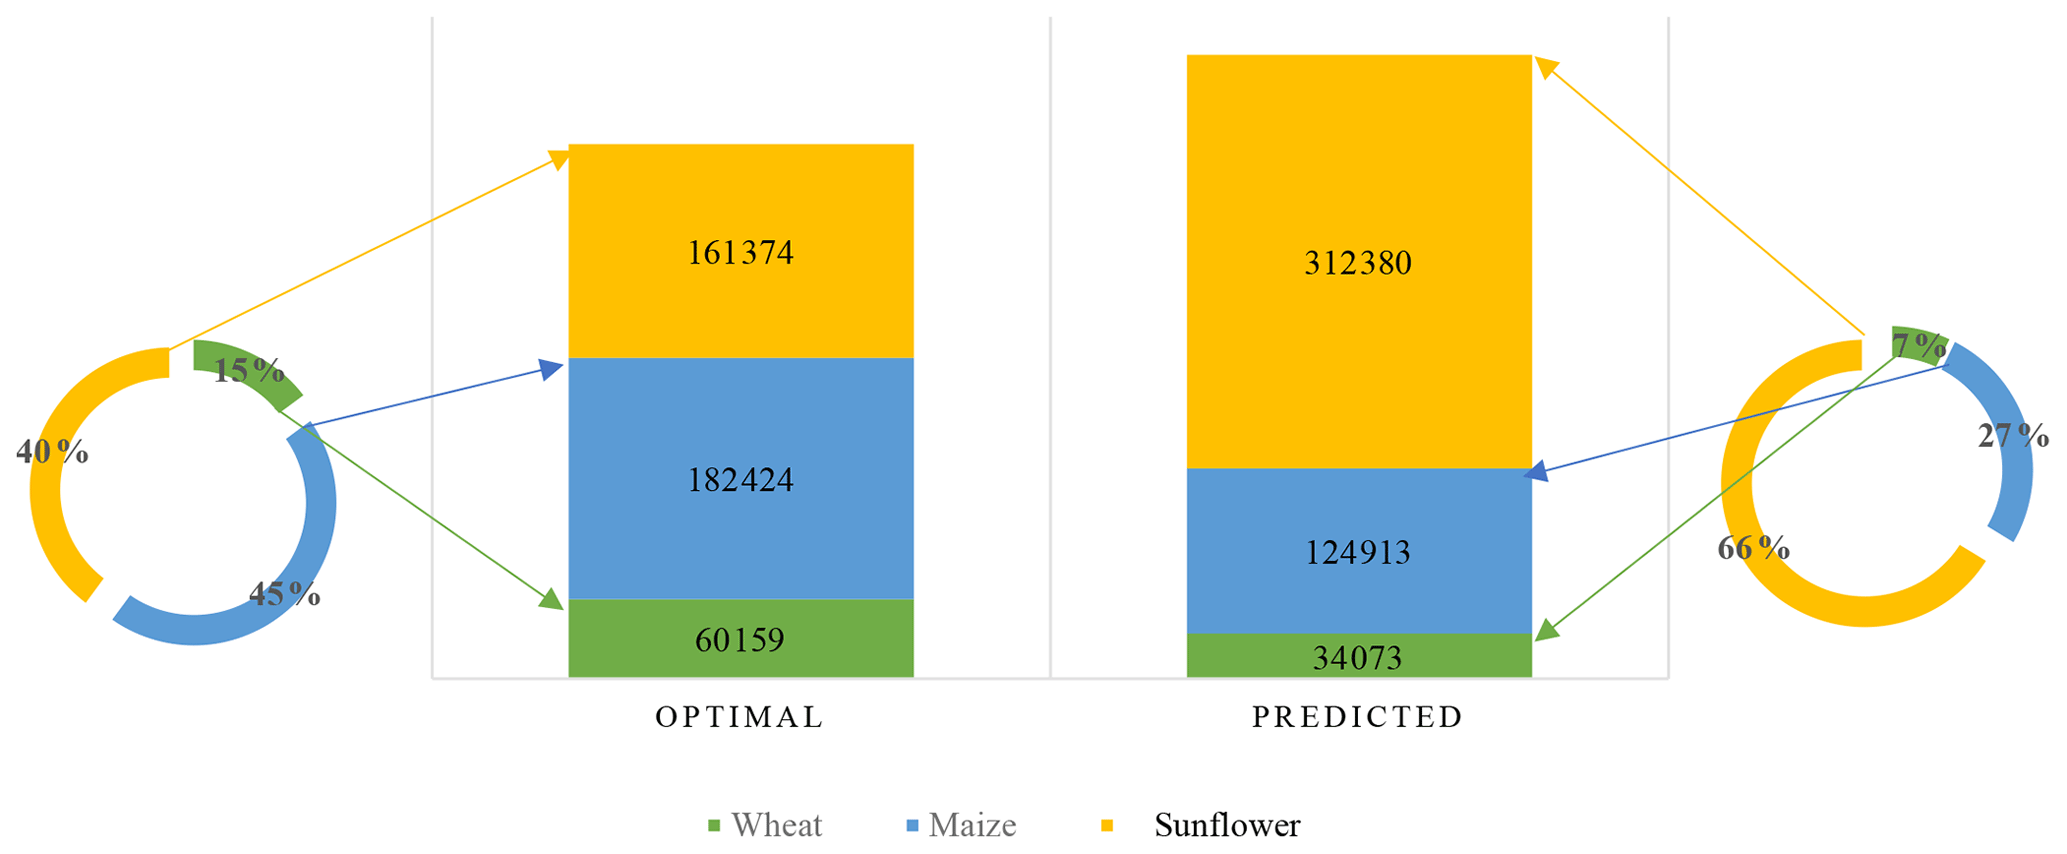
From VWk×IMk, the total virtual water in the imported crops was calculated as 4.16×10⁹ m3, which would save 75.64 % of the total available water in this area. The quantification of the land savings calculated by IMk∕yk is also shown in Table 2. A comparison with the national 2020 land-use planning is shown in Fig. 5. The results illustrate the differences between the optimal solutions from the proposed model and the expected national land-use planning. Specifically, if international imports were allowed, the total land needed for crops could be reduced by 16.7 %, and to satisfy the wheat, maize and other food crop requirements, the land needed for growing sunflowers would decrease significantly. Therefore, the results clearly reflect the water-use and land-use planning differences and how optimizing previous planting structures can improve water utilization efficiency.
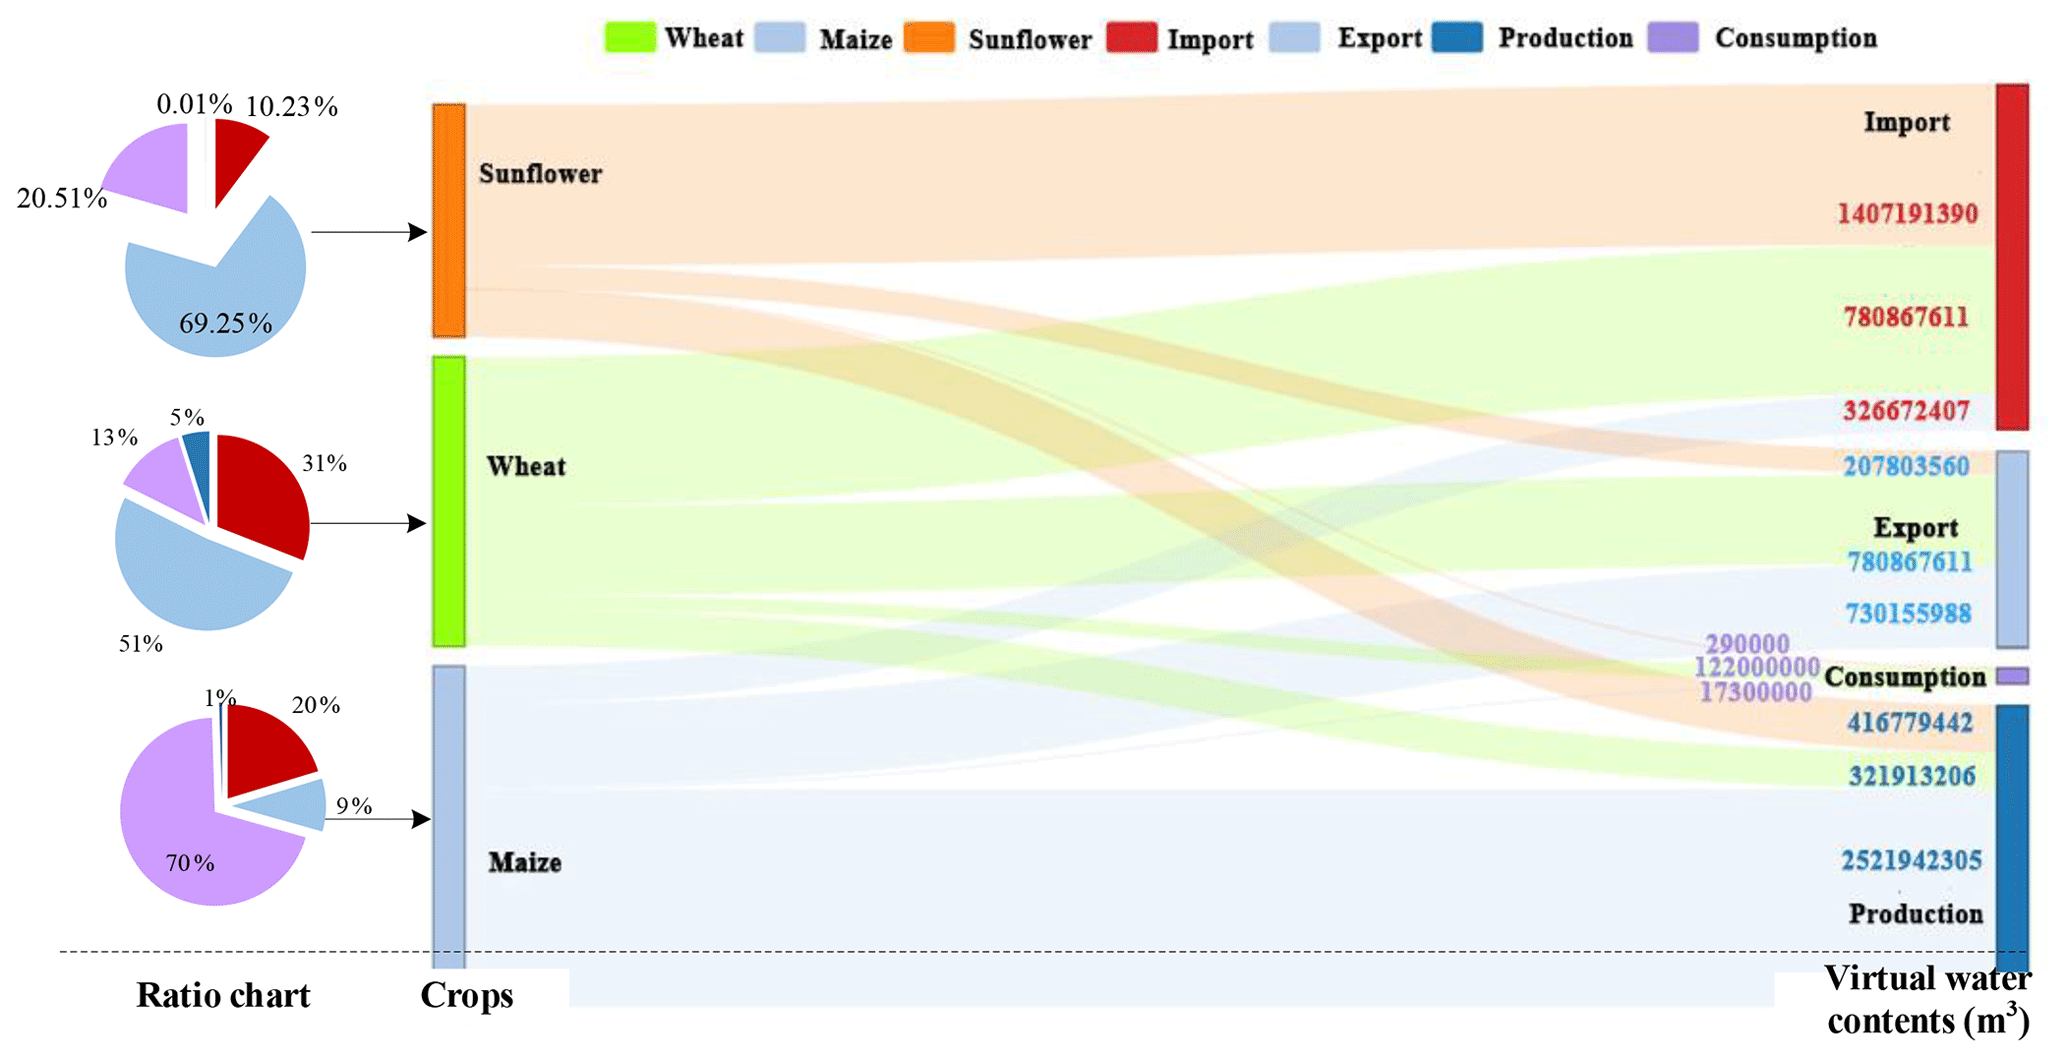
The crop proportions for each form (production, import, export and consumption) are shown on the left of Fig. 6, and the virtual water content is shown on the right. As can be seen, as the crop consumption in this district is far less than the crops produced, particularly sunflower, the surplus crops from the Hetao irrigation area can be sold to southern China. The light blue rectangle shows the total water embedded in the exported sunflower, wheat and maize, and the red rectangle shows the total water embedded in the imported sunflower, wheat and maize.
4.4 Irrigation, industrial and domestic water consumptions and blue water transfers
Certain differences should be allowed when supplying limited water to sectors. As the model also maximizes the overall water utilization efficiency from the perspective of the system, an equilibrium between the multiple sectors is not always exactly equal when seeking to satisfy the water demand of each sector.

Table 3 gives an example of a compromised solution to water allocations, transfers, and crop irrigation. More initial water is allocated to the agricultural sector, followed by the domestic sector and the industrial sector, which conforms to actual practices. Through the water market (blue and virtual water transfers), blue water is transferred from the agricultural sector to the industrial or domestic sector: 13.6×10⁶ m3 of water is transferred from the agricultural sector to the industrial sector and 1.07×10⁹ m3 of water is transferred from the agricultural sector to the domestic sector, which improves the objective functions on both the upper and lower levels.
The agricultural sector has the largest gap between water supply and demand, followed by the industrial sector; however, the water demand in the domestic sector is satisfied. We conclude that the reason is that more water-intensive crops are imported. In addition, with more sunflower being imported, saved water is allocated to sectors whose water utilization efficiency is higher. Overall, the above analysis verifies that the proposed model not only assists in optimizing water resource allocations, but also assists in land-use planning based on water utilization efficiency maximization and vulnerability minimization. Therefore, it is suggested that when there is insufficient water, blue water can be transferred to the industrial and domestic sectors from the agricultural sector to enhance water utilization efficiency and achieve greater economic benefits, and virtual water imported to save irrigation water consumption.
This section explores the reasons why virtual and blue water transfers should be conducted together and the effects available water, market prices and import prices have on the water allocations in the different sectors under future uncertainty.
5.1 Main reasons for water stress
Before developing long-term future water plans, it is vital to determine which sector is the largest contributor to regional water stress. A blue water-scarcity (BWS) index can be calculated from a production perspective, as shown in Eq. (26). BWS1, BWS2 and BWS3 respectively represent blue water scarcity in the agricultural, industrial and domestic sectors. , and are chosen to represent the blue water consumption. Liu et al. (2017a) conclude that water stress in an area is low if the ratio of the water consumption to availability is less than 0.07, is medium if the ratio is 0.15–0.3 and is high if the ratio is greater than 0.3.
The BWS in the Hetao irrigation district is 0.47 after the optimization, indicating high water stress, with the BWS values for the agricultural, industrial, and domestic sectors being 0.068, 0.003, and 0.254, which indicates that the domestic sector is the largest contributor to the regional water stress. Analysis indicates that the main reasons for these results are an increase in the population and therefore more water being needed for daily needs.
5.2 The importance of coalitional utilization of blue and virtual water transfers
Virtual water and blue water transfers have a significantly positive effect on water allocation systems. Previous research has not optimized water allocation problems by simultaneously incorporating virtual and blue water transfers. The following discusses the importance of including virtual water transfers (in terms of international imports and inter-regional exports) and blue water transfers from four perspectives: objective functions, total water consumption, import/export structures, and water stress.
Scenario A: comparison to the model (Eq. C1) without considering virtual water transfers.
Scenario B: comparison to the model (Eq. C2) without considering blue water transfers.
Three compromise solutions are shown in Table 4. As can be seen, the proposed model has the highest water utilization efficiency, followed by Scenario A, with the lowest being Scenario B, which proves that blue water transfers improve water utilization efficiency. Specifically, when blue water transfers are included, both agricultural and industrial sector vulnerabilities are reduced; however, the virtual water transfers have a positive effect on the industrial and domestic sectors' vulnerability, but not on the agricultural sector's vulnerability. Therefore, the analysis indicates that the inclusion of water transfers enables greater water consumption in sectors that use less water to produce greater economic benefits, which is in line with the conclusions in Liu and Yang (2012)'s research that virtual water transfers potentially reduce the degree of crop self-sufficiency.
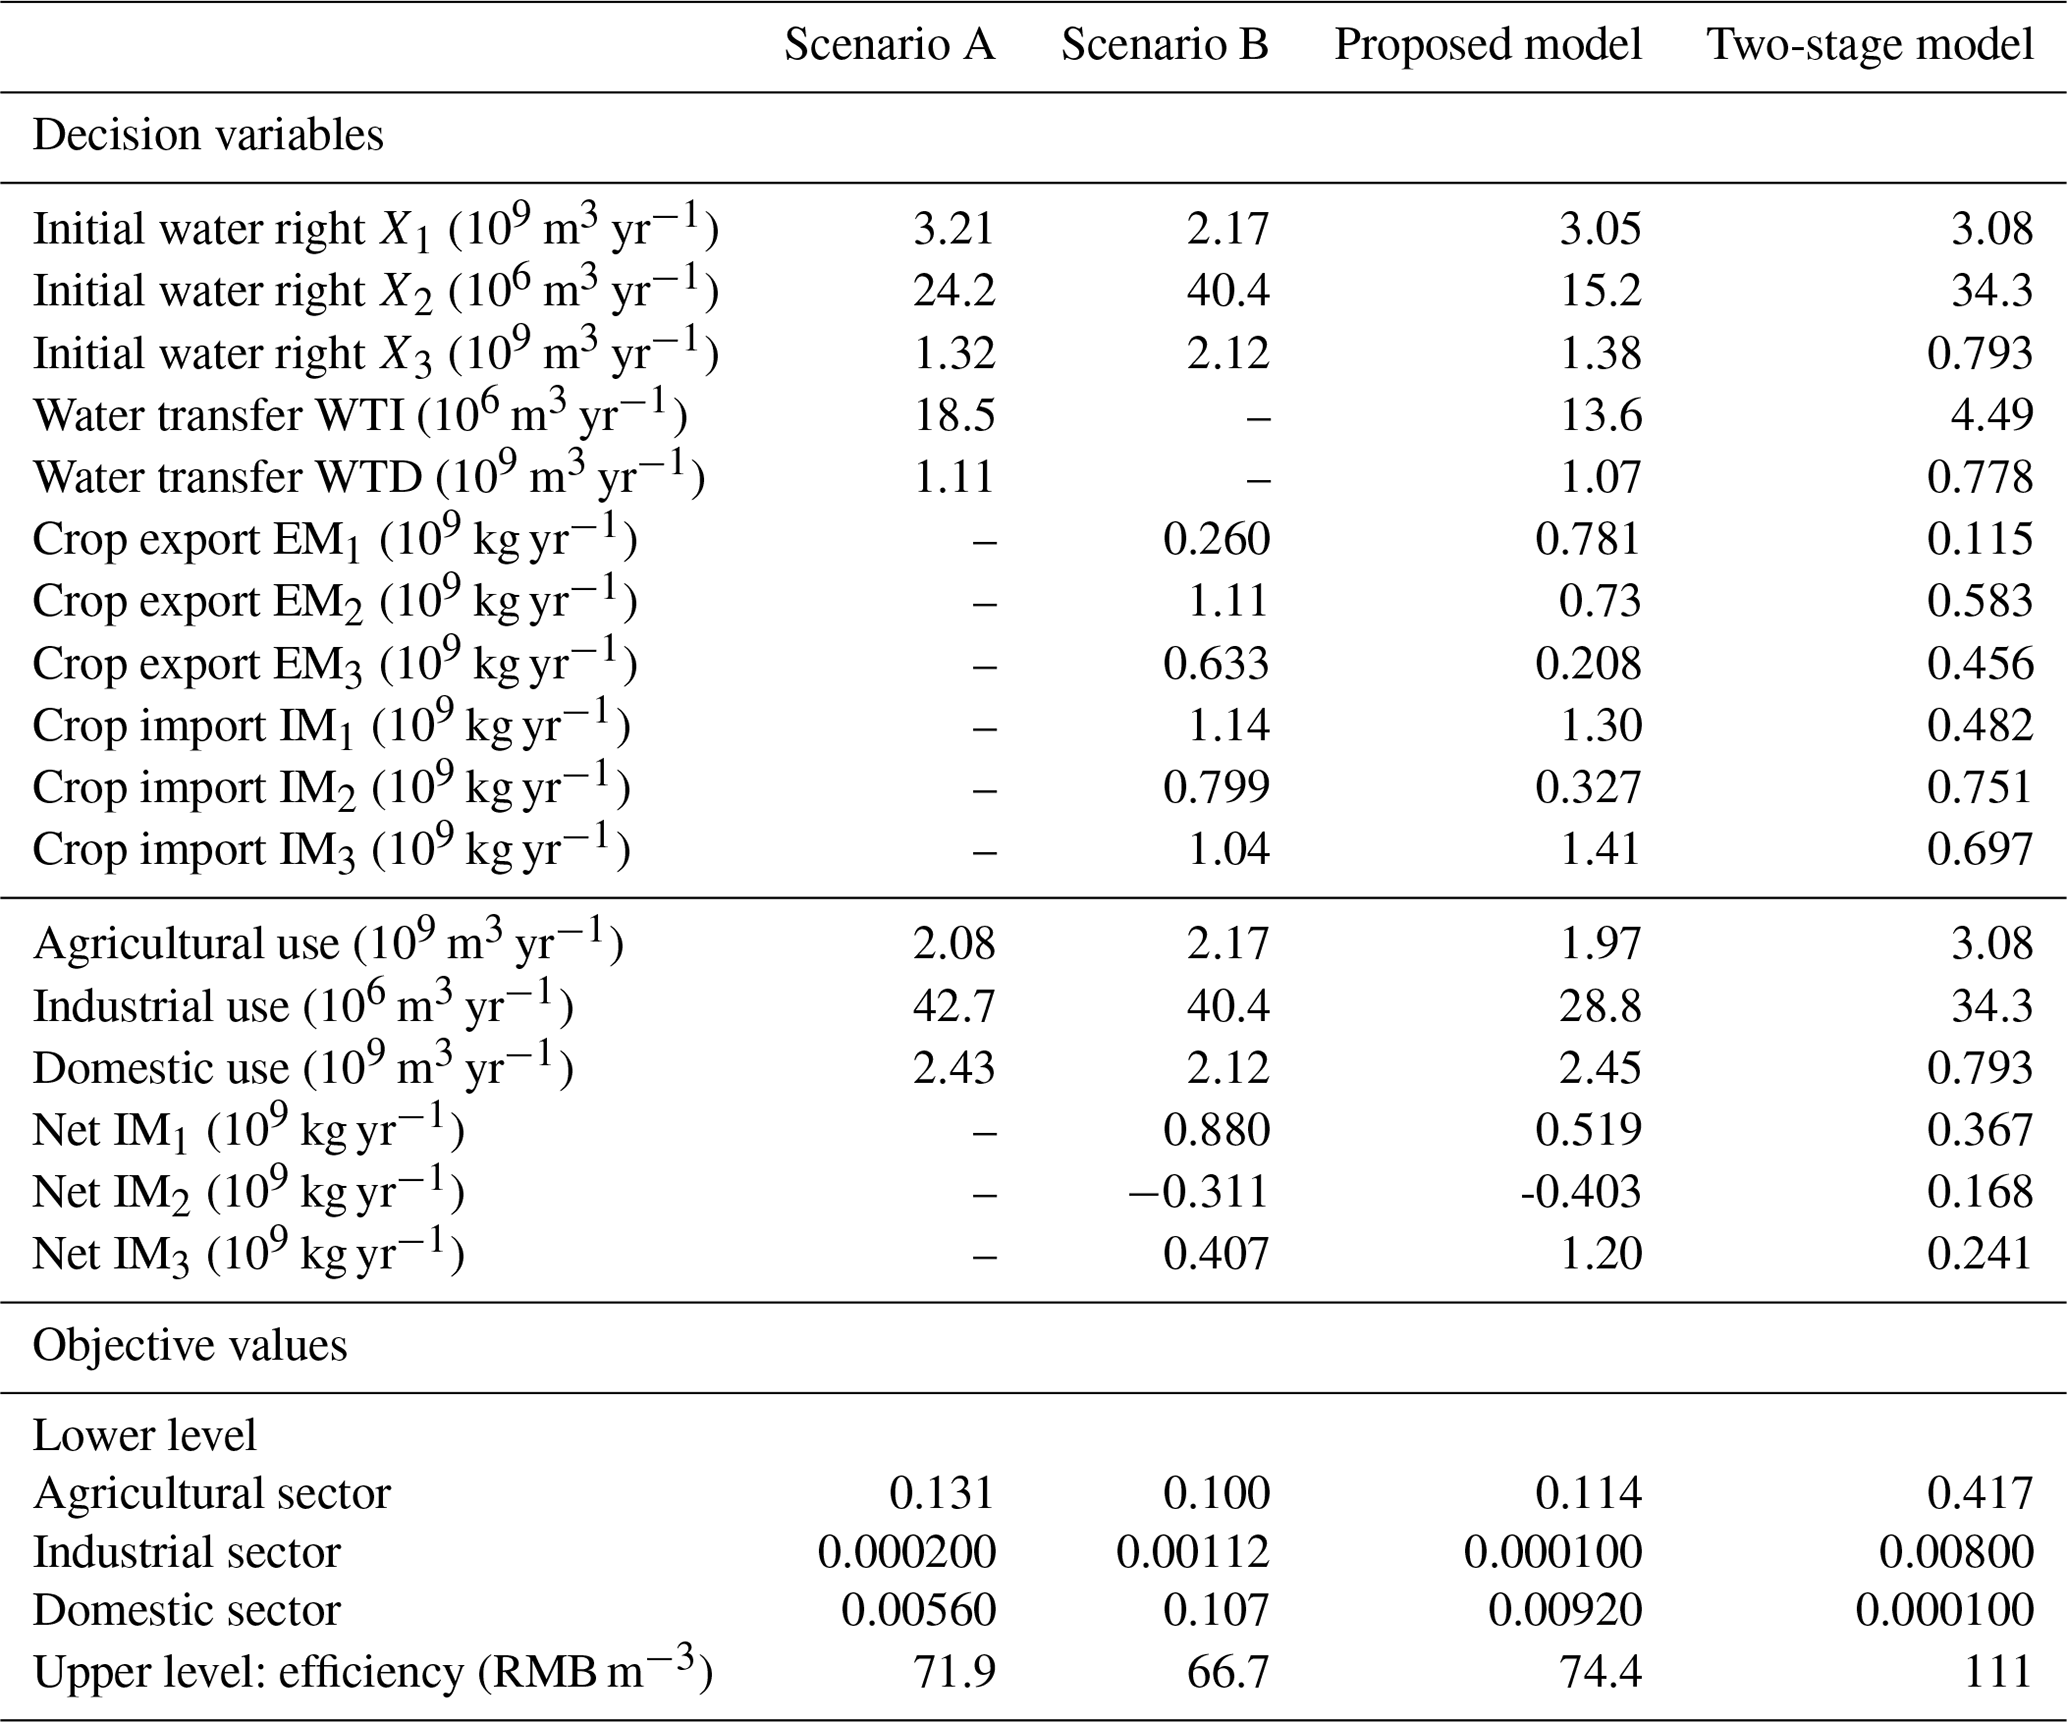
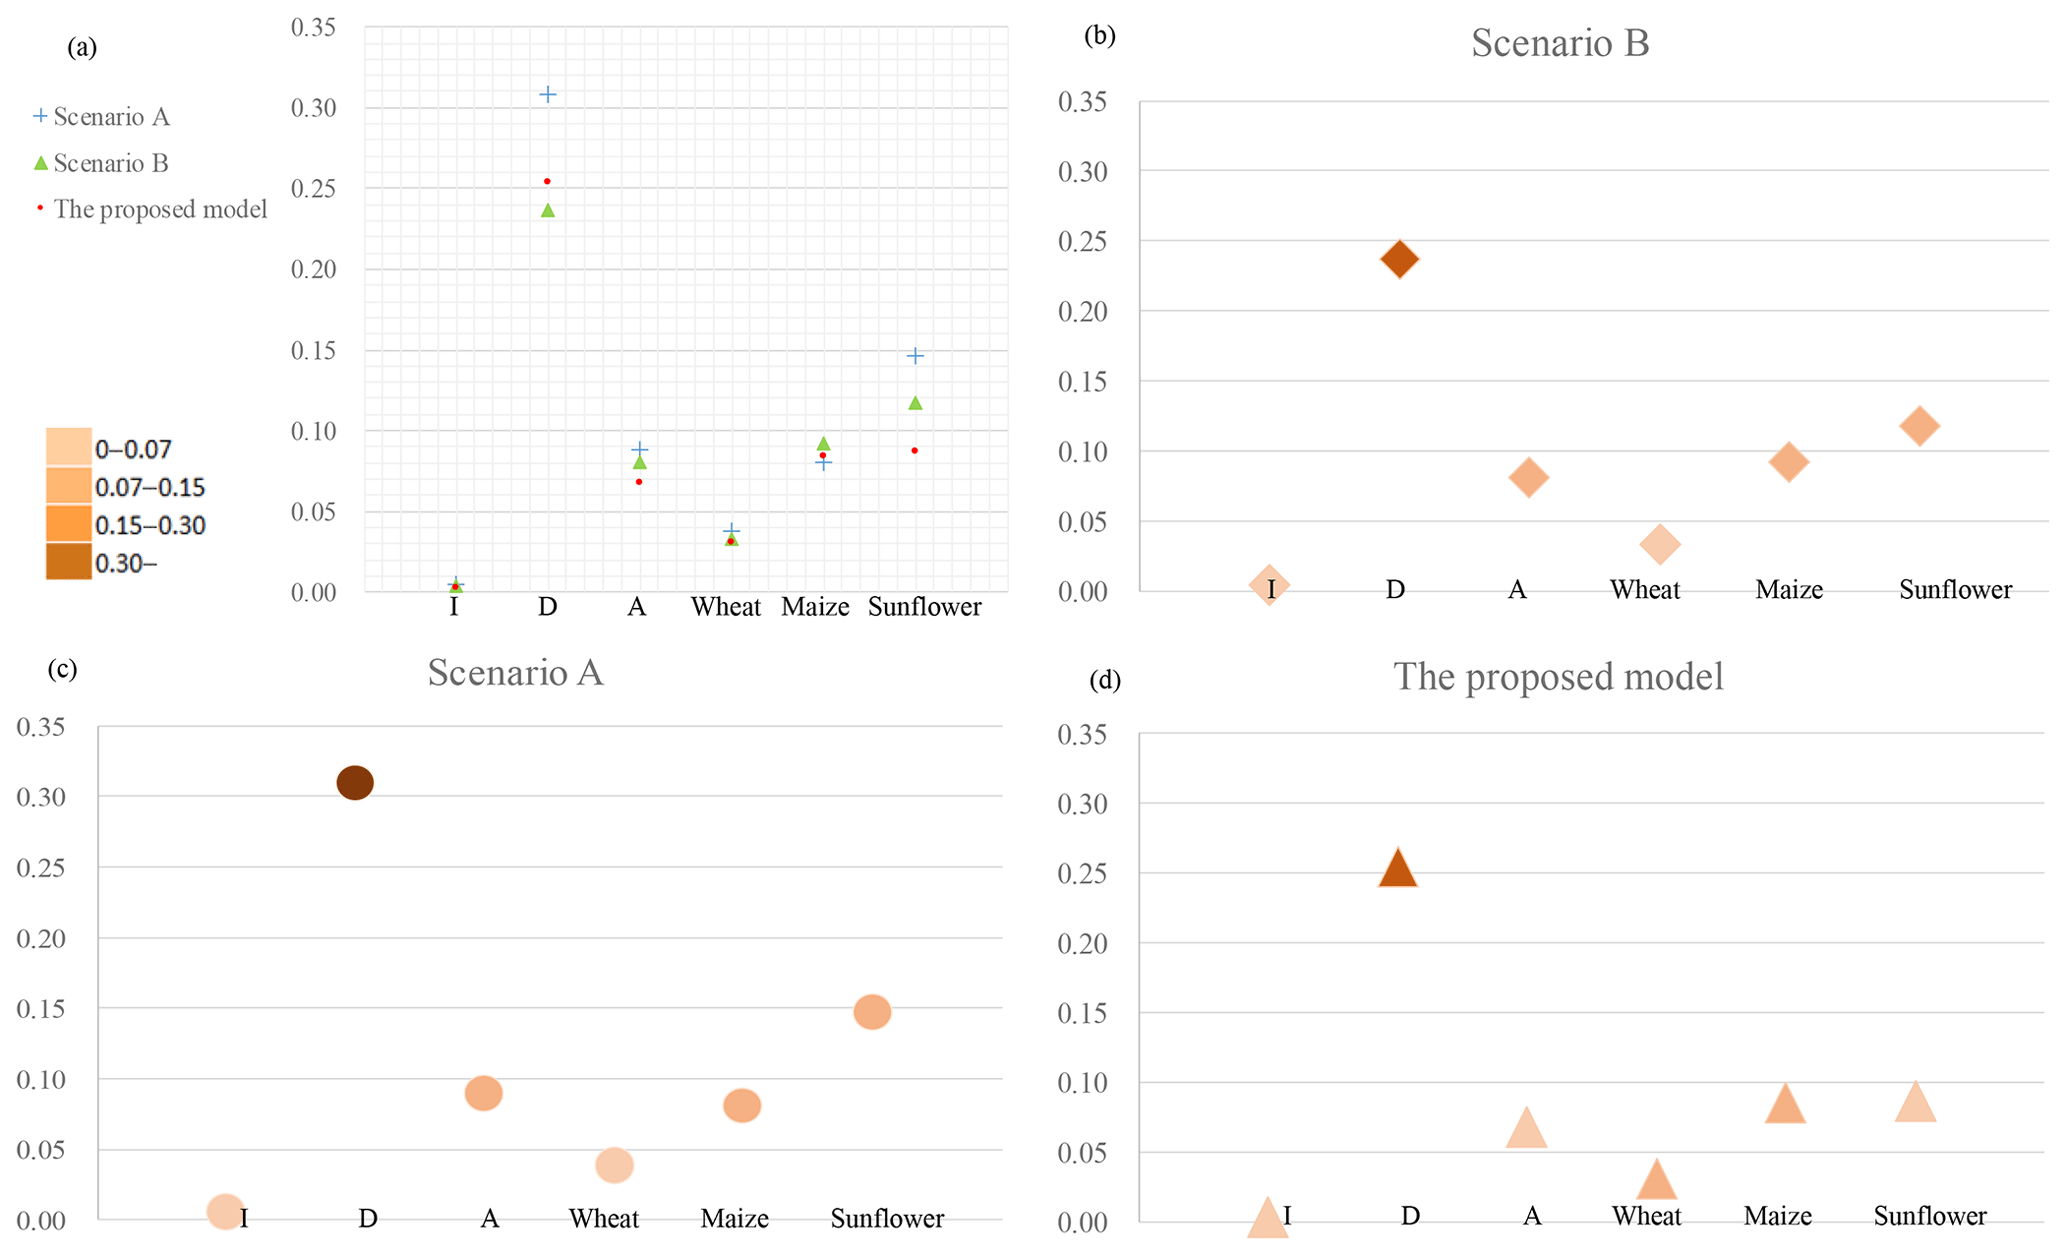
Figure 7Water stress comparisons. (a) Total water stress; (b) Scenario B water stress; (c) Scenario A water stress; (d) water stress in the proposed model (I: industrial sector, D: domestic sector, A: agricultural sector).
Compared with Scenario A, the total water consumption calculated using the proposed model decreased from 4.55×10⁹ to 4.45×10⁹ m3. Specifically, the industrial and agricultural sectors receive fewer initial water rights, the domestic sector receives more initial water rights, and the blue water transfer value declines from 1.13×10⁹ to 1.09×10⁹ m3. Therefore, the proposed model is able to appropriately reduce the water transfer quantities and thereby minimize the ecological and economic losses. In comparison, in Scenario B, the total water consumption calculated using the proposed model increases from 4.33×10⁹ to 4.45×10⁹ m3. Specifically, the international import and inter-regional export structures change, with greater quantities of wheat and sunflowers and lesser quantities of maize being imported, and greater quantities of wheat and lesser quantities of sunflower and maize being exported to neighbouring regions. In general, when the blue water transfers are considered, there is a positive effect on water utilization efficiency and a reduction in sector vulnerability.
The water stress under different scenarios is then calculated, as shown in Fig. 7. Figure 7a shows the degree to which the water stress is relieved after the optimization, with the water stress under Scenario A being greater than the water stress under the other two scenarios, which indicates that the inclusion of virtual water transfers can alleviate water stress. The water stress values in the different sectors are then compared, as illustrated in Fig. 7b–d, which indicates that the consideration of blue water transfers decreases industrial and agricultural sector consumption stresses and the inclusion of virtual water transfers decreases water stress in all the sectors. Therefore, as shown, both virtual water and blue water transfers should be considered in future water management planning.
5.3 Importance of the hierarchical strategic interaction
One of the most widely used water resource allocation models has been the two-stage optimization model. In comparison, the Stackelberg game between the leader and followers in this study is fully considered as the strategic interactions are considered before the final determination of the compromise solution. Therefore, to further illustrate the superiority of the proposed model, it is compared with a two-stage model that has the same objective functions for each stage decision maker, the results for which are shown in Table 4.
As can be seen, the total consumption determined using the two-stage optimization model is mostly higher than in the proposed model. To be specific, we find that under the two-stage model the domestic water sector receives significantly less water compared to the proposed model; by contrast, the industrial sector and agricultural sector receive more water. In the first stage of the two-stage optimization model, the initial water rights and virtual water transfers for the sector users are determined by maximizing the water utilization efficiency, and following the decisions in the first stage, in the second stage, the followers decide on their water withdrawal and blue water transfer quantities based on the asymmetric Nash–Harsanyi game model. The comparison of the amount of inter-regional exports and international imports indicates that the trade scale is squeezed, which is not suitable for a region that sends grain from northern China to southern China. In addition, the increase in sector vulnerability could result in unsustainable irrigation district development.
Because the proposed model includes the strategic interactions, this cannot be ignored by the decision makers. Generally, the main reason for the strong discriminatory power in the developed model is that as it is able to deal with the conflicts between the leader and followers, it can produce a more realistic water allocation strategy.
5.4 Sensitivity analysis
The extended Fourier amplitude sensitivity test (EFAST) is used to analyse the allocation results when the crop import prices, available water, or water demand change, with the solutions being assessed using two robustness measures: minimum water utilization efficiency and maximum sectoral vulnerability.
5.4.1 Future uncertainty due to changing available water
Available water is affected by precipitation, which in turn reflects a wet or dry hydrological environment. In this section, to assist decision makers in understanding the overall water allocation and utilization strategies, the available water is assumed to increase/decrease by a 20 % interval.
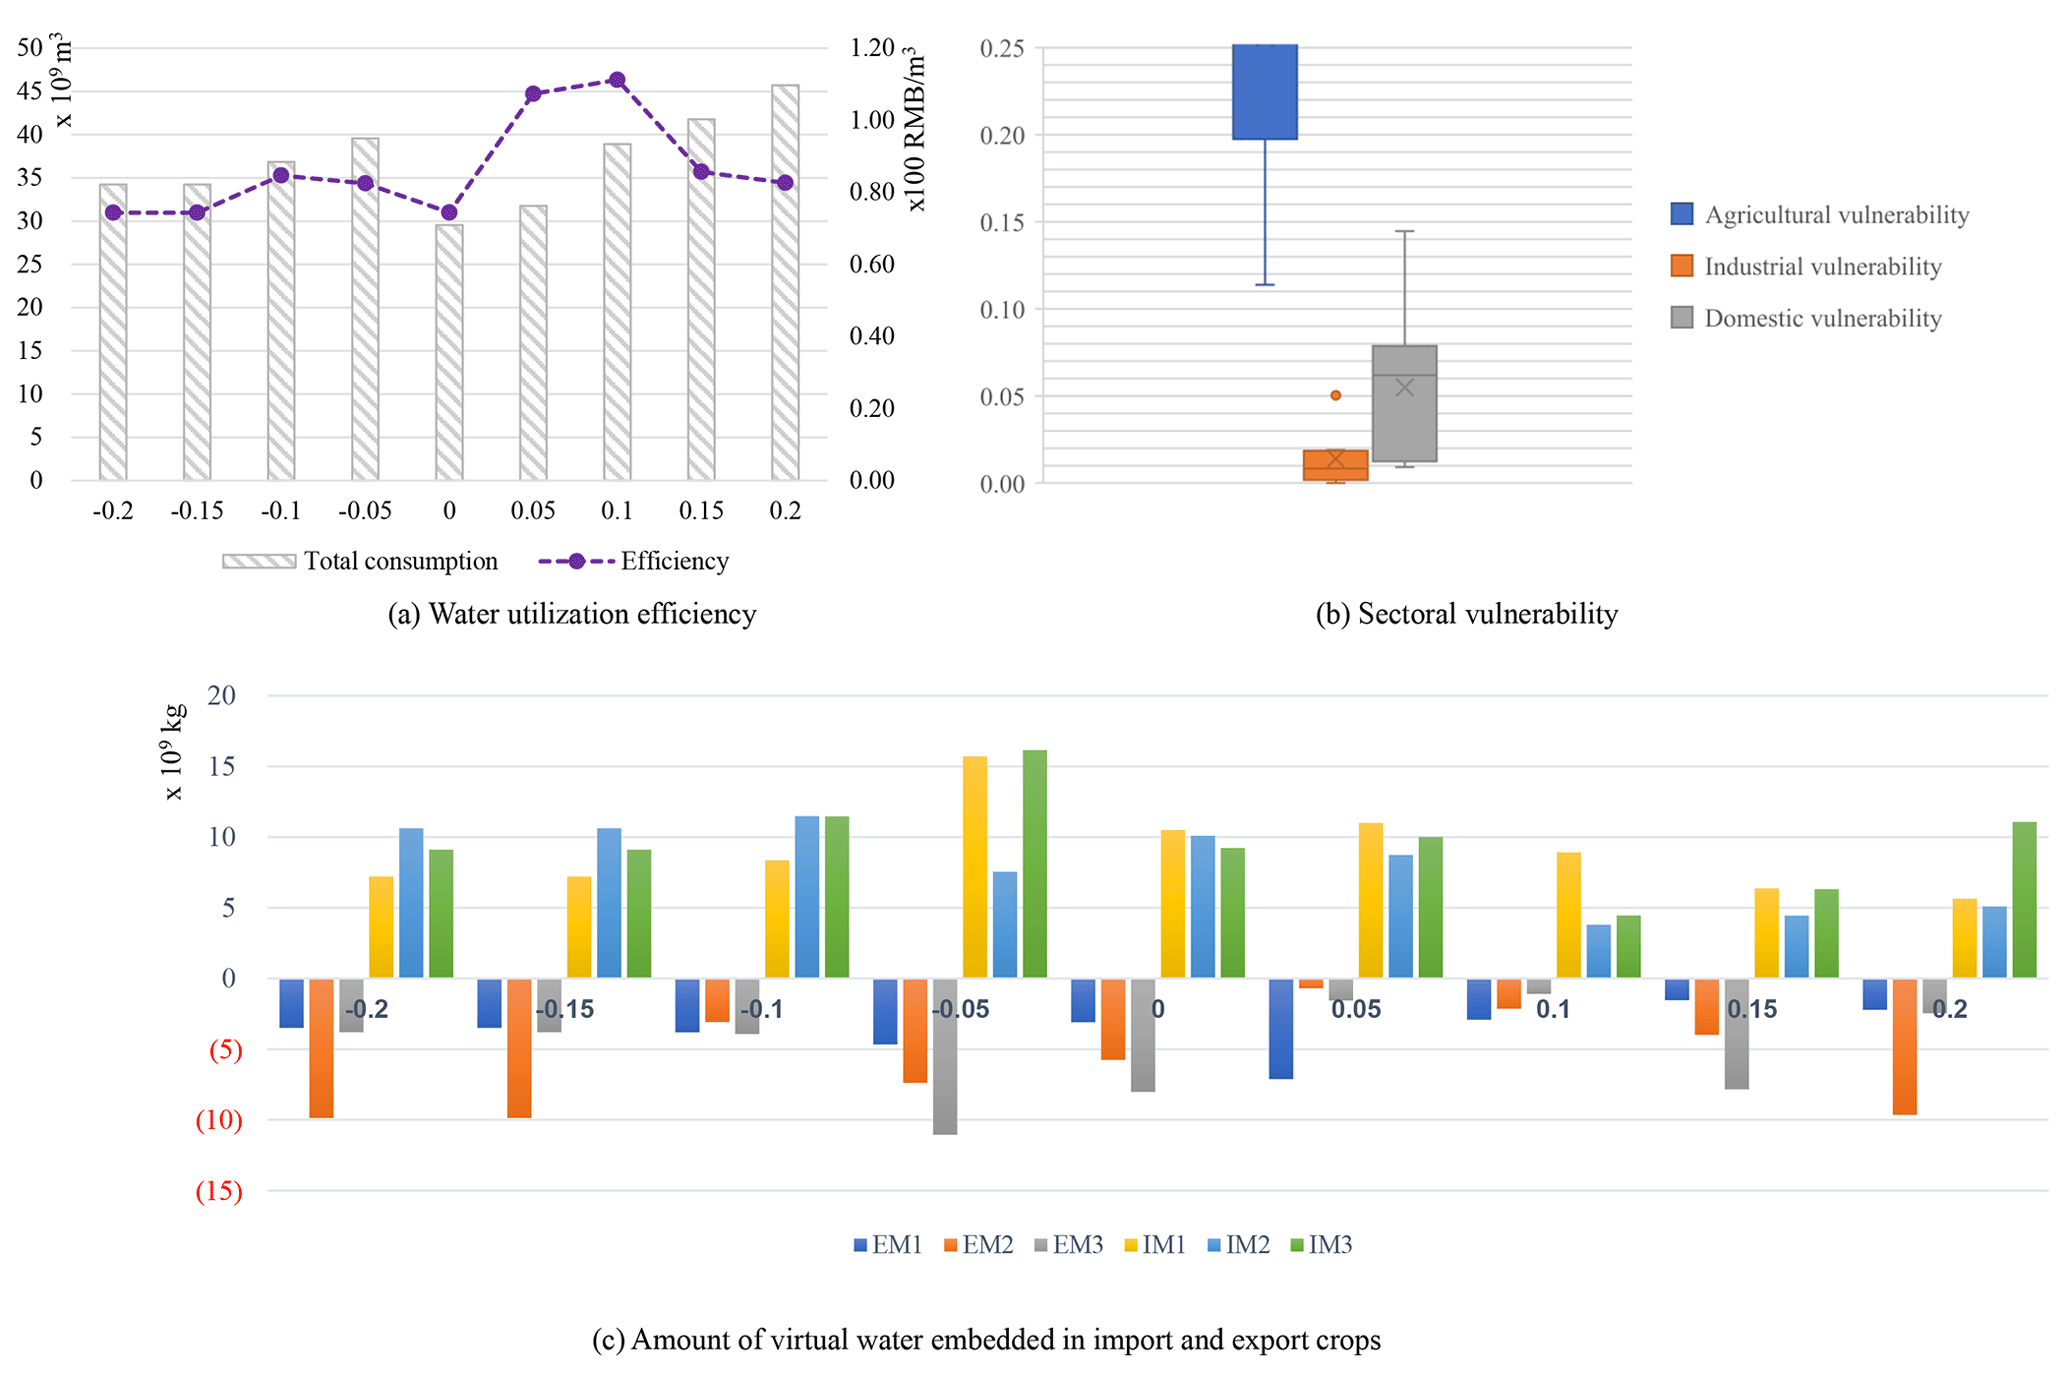
Figure 8Sensitivity analysis of available water (in Fig. 8c virtual water embedded in export crops is shown below the x axis, while virtual water embedded in import crops is shown above the x axis).
To quantify the available water sensitivity and determine the reactions to varying the model parameters, several scenarios are conducted and tested, the optimal responses and objective function values from which are shown in Fig. 8. As can be seen, when the amount of available water decreases, the water utilization efficiencies fluctuate slightly, thus verifying the model robustness. When the amount of available water increases, the utilization efficiency fluctuates with an increase in total water consumption, and in both cases, the vulnerability values are within an acceptable range. Therefore, the results indicate that after considering the blue and virtual water transfers, water allocation and import/export strategies could be used to adapt to varying available water quantities.
5.4.2 Future uncertainty due to sectoral water demand
Policies that encourage water-conserving irrigation techniques, improve resident water conservation awareness, focus on the construction of water reuse schemes, better manage water-use mechanisms, and expand water conservation investments could reduce water demand in each sector by 10 % to 20 %. Therefore, in this section, seven scenarios are analysed, including one with no change (the results from the proposed model). To monitor the performance and assess the actions relevant to each scenario, the results presented in Table 5 are analysed. If there is a decrease in agricultural water demand, water utilization efficiency would improve, and total consumption would decrease. As can be seen in Table 5, the proposed model demonstrates robustness when the agricultural and industrial sectors' parameters change, but the robustness is weak when the domestic water demand changes.
Table 5Objective values and total consumption for the 10 % and 20 % reductions in water demand.
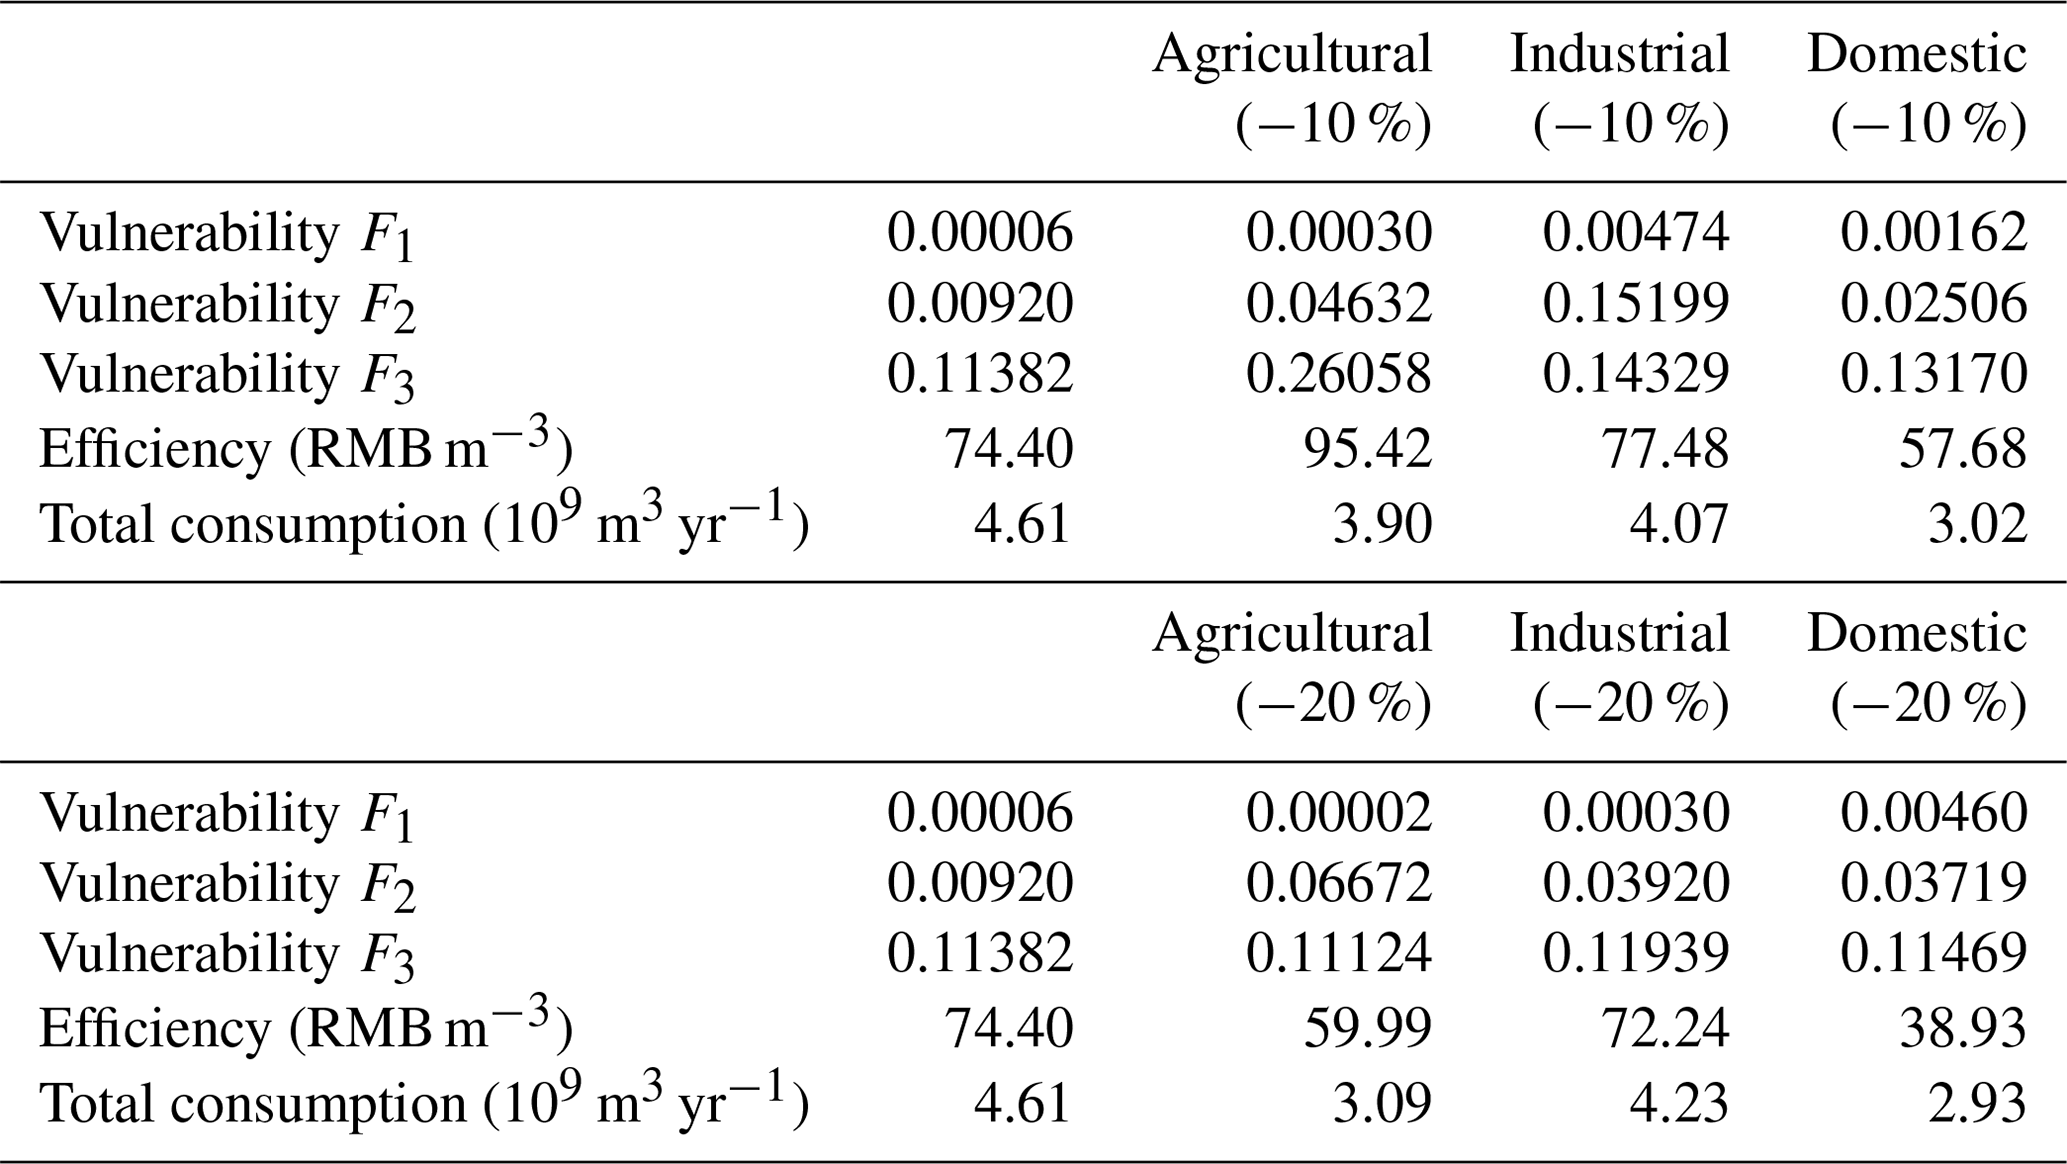
The parametric sensitivity analysis information could be useful when deciding on future water conservation and sustainable development investments. For example, modifying irrigation frequency and adopting a single irrigation strategy could be operative policies to reduce irrigation quantities while achieving acceptable crop yields. In line with Zou and Liu (2014)'s research and the results from the proposed model, it can be seen that there is an “inverse U-shaped relationship” between industrial water demand, industrial added value and the industrial water-recycling rate. Water conservation in the industrial sector is observed to have a positive effect on economic development only when the industrial added value/water-recycling rate has surpassed a certain value, which indicates that any reductions in industrial water demand should be accompanied by industrial structural adjustments and industrial water-recycling rate improvements. The suggested strategies for the domestic sector include incentive policies to encourage households to reduce domestic water consumption and policies to guarantee sustainable water utilization and reduce total consumption.
5.4.3 Future uncertainty due to import crop prices
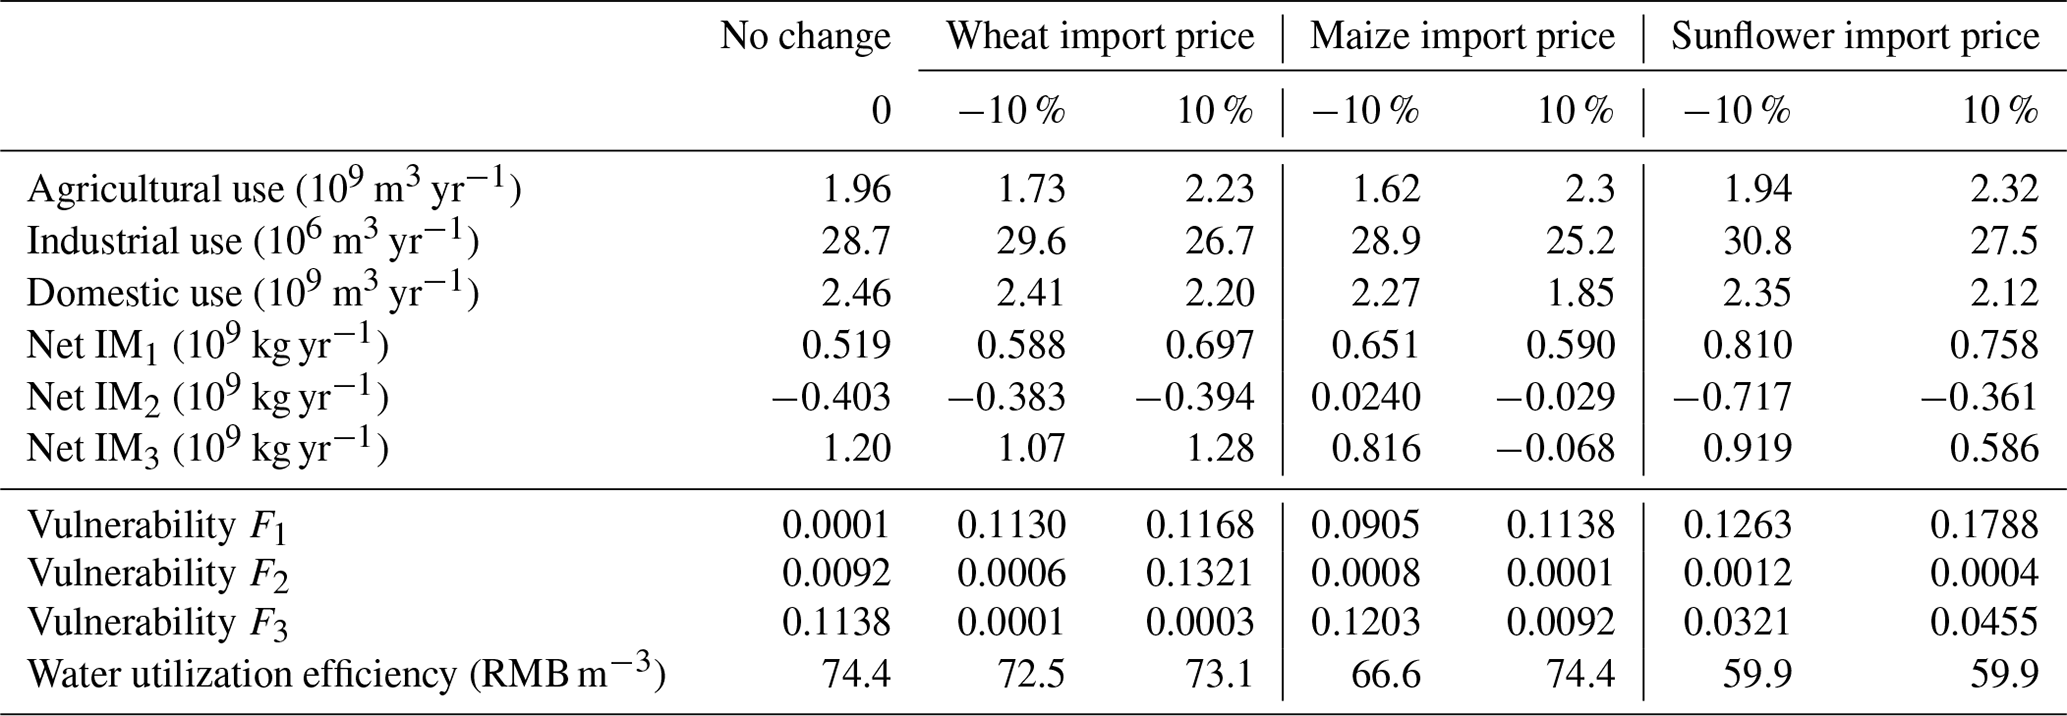
Imported crop prices are increased/decreased by 10 % and input into the model to analyse the effect on water allocation, withdrawal and transfer processes. Table 6 shows the optimal solution for water use and net imports, from which it can be seen that with a price change in the importing crops, there are minimal changes in the water utilization efficiency and vulnerability, which indicates that the proposed model is comparatively robust to import price changes; however, it is more sensitive to the virtual water price variations for sunflower, followed by maize and wheat.

5.4.4 Future uncertainty due to market prices
We define the parameter θ as 0.5, which presents the average of willingness to pay of the two trading participants, and then we obtain an optimal solution to water use and transfers. We probe deeper by changing the values of θ and analyse the effects of blue water transfer price on solutions. An increase in θ indicates a higher willingness to buy at the buyer's price, and a decrease in θ indicates a higher willingness to trade at the seller's price. Table 7 indicates that the optimized decision variables are less sensitive to a change in the market prices and further verifies that the proposed model is robust to market prices.
In this study, a novel model based on Stackelberg–Nash–Harsanyi game theory was proposed to analyse a water reallocation problem that included water transfers and crop transactions. To describe the realistic water allocation, withdrawal and transaction processes, a bilevel framework with one leader and multiple followers was employed in which the water affairs bureau was in the leader position and multiple water usage sectors were in the follower positions. Vulnerability, which included the demand loss degree (caused by deficient water withdrawal) and supply loss degree (caused by excess water withdrawal), was the lower-level objective, with the water utilization efficiency across the whole system being maximized on the upper level. Blue and virtual water transfers, which are mechanisms that can essentially relieve uneven water distribution, were included in this study based on the idea that blue water can be reallocated to industrial and domestic sectors to develop water-saving agriculture and that virtual water in crops can be quantified to optimize inter-regional exports and international imports.
To verify the feasibility and practicality of the developed model, a real-world application was conducted in the Hetao irrigation district in northern China. It was found that the water demand in the domestic sector was first satisfied, followed by the agricultural and industrial sectors, with the blue water transfers providing an opportunity for each sector to achieve efficient water utilization, and the virtual water transfers providing a new opportunity for water conservation and land use. To be specific, some initial water rights were transferred from the agricultural sector to the industrial and domestic sectors, and key crops, and particularly water-intensive crops (e.g. wheat and sunflower), were imported from other countries rather than being grown domestically. To demonstrate the superiority of the developed model, two comparative scenarios were considered: one without virtual water transfers and the other limiting blue water transfers. The analysis in Scenario A highlighted the importance of virtual water transfers in alleviating water usage stress, and the analysis in Scenario B verified that blue water transfers reduced the vulnerability in each sector and demonstrated how inter-regional exports, international imports and blue water transfers could result in higher water utilization efficiencies in all three sectors.
Several scenarios also assessed changes in the environment and water-conservation strategies, including one without changes (the results from the proposed model). These sensitivity analyses not only proved the robustness of the proposed model, but also determined the potential adjustments that could be made in water usage sector allocation strategies to alleviate regional water stress, eliminate the negative impacts caused by the crop trade, ensure regional food security, and develop sustainable irrigation.
This work focused on water allocation in a bilevel framework and conducted a case study in an irrigation district. Given that we explored only one leader and multiple followers, there are possibilities for multiple leaders and multiple followers in future research. Further, a macroscopic analysis between China and foreign countries could also be interesting.
A1 Virtual water content
This study provides detailed quantitative information on crop imports and exports. The principle for assessing the virtual water content (denoted by , m3 kg−1) of a food was proposed by the Food and Agriculture Organization (FAO) as the amount of water per unit of food that is consumed during the production process Zeng et al. (2012), as shown in Eq. (A1).
where effective rainfall over the crop-growing period is denoted as Rk (mm) and irrigated water is denoted as wk (mm). μ is the irrigated coefficient, which presents the utilization effectiveness of irrigation water. Wk (m3 hm−2), calculated by , presents the water components in crop k, which consist of effective irrigated water and rainfall. The value of 10 is used to convert millimetres to m3 hm−2. yk (kg hm−2) represents the crop yield per irrigation area unit. As rainfall is an additional supplement for crop water demands, in addition to evapotranspiration (ET), water irrigation quantities are somewhat influenced by the effective rainfall in different seasons in addition to evapotranspiration (ET), as shown below.
The accumulated ET over the crop-growing period is shown in Eq. (A2). ET0 is the reference evapotranspiration of a standard crop, which can be calculated by the FAO Penman–Monteith function (Allan, 1998; Su et al., 2014). β is the coefficient for efficient rain, which presents the proportion of total rainfall that infiltrates into the soil profile and does not contribute to deep percolation, while Pk is the actual rainfall (Patwardhan et al., 1990).
A2 Agricultural water demand
Agricultural water demand is the sum of the crops' demand for water, as calculated in Eqs. (A4) and (A5), for which several representative crops were chosen.
where d1k is the water demand of crops in the agricultural sector and Ak is the area allocated to crop k.
A3 Domestic water demand
Domestic water demand includes all water consumed in a given period for all residential purposes, e.g. in-house water use for kitchens, laundry and baths, and outside uses in gardens. The domestic water demand can be determined based on population and income growth projections (Cai, 2002; Young and Haveman, 1985). From many studies on water demand, it was concluded that per capita disposable income was a key influence on water demand; therefore, a power function between water demand and water price was determined.
where KD is a constant, ϕpop is the per capita disposable income, and η is the demand income elasticity coefficient.
A4 Industrial water demand
The projection of industrial water demand depends upon income (gross industrial output value). Through the data obtained from the BayanNur Water Resources Bulletin, future industrial water demand is projected as follows:
where KI is the constant, ϕind is the gross industrial output value, and θ is the demand income elasticity coefficient.
A5 Ecological water demand
The water demands for environmental protection and ecological systems are assumed to be constant at the present stage of the study, and these values are determined by the local government based on the consideration of current water use and climate change.
A pseudo code for solving the Stackelberg–Nash–Harsanyi bargaining process is shown in Table B1.
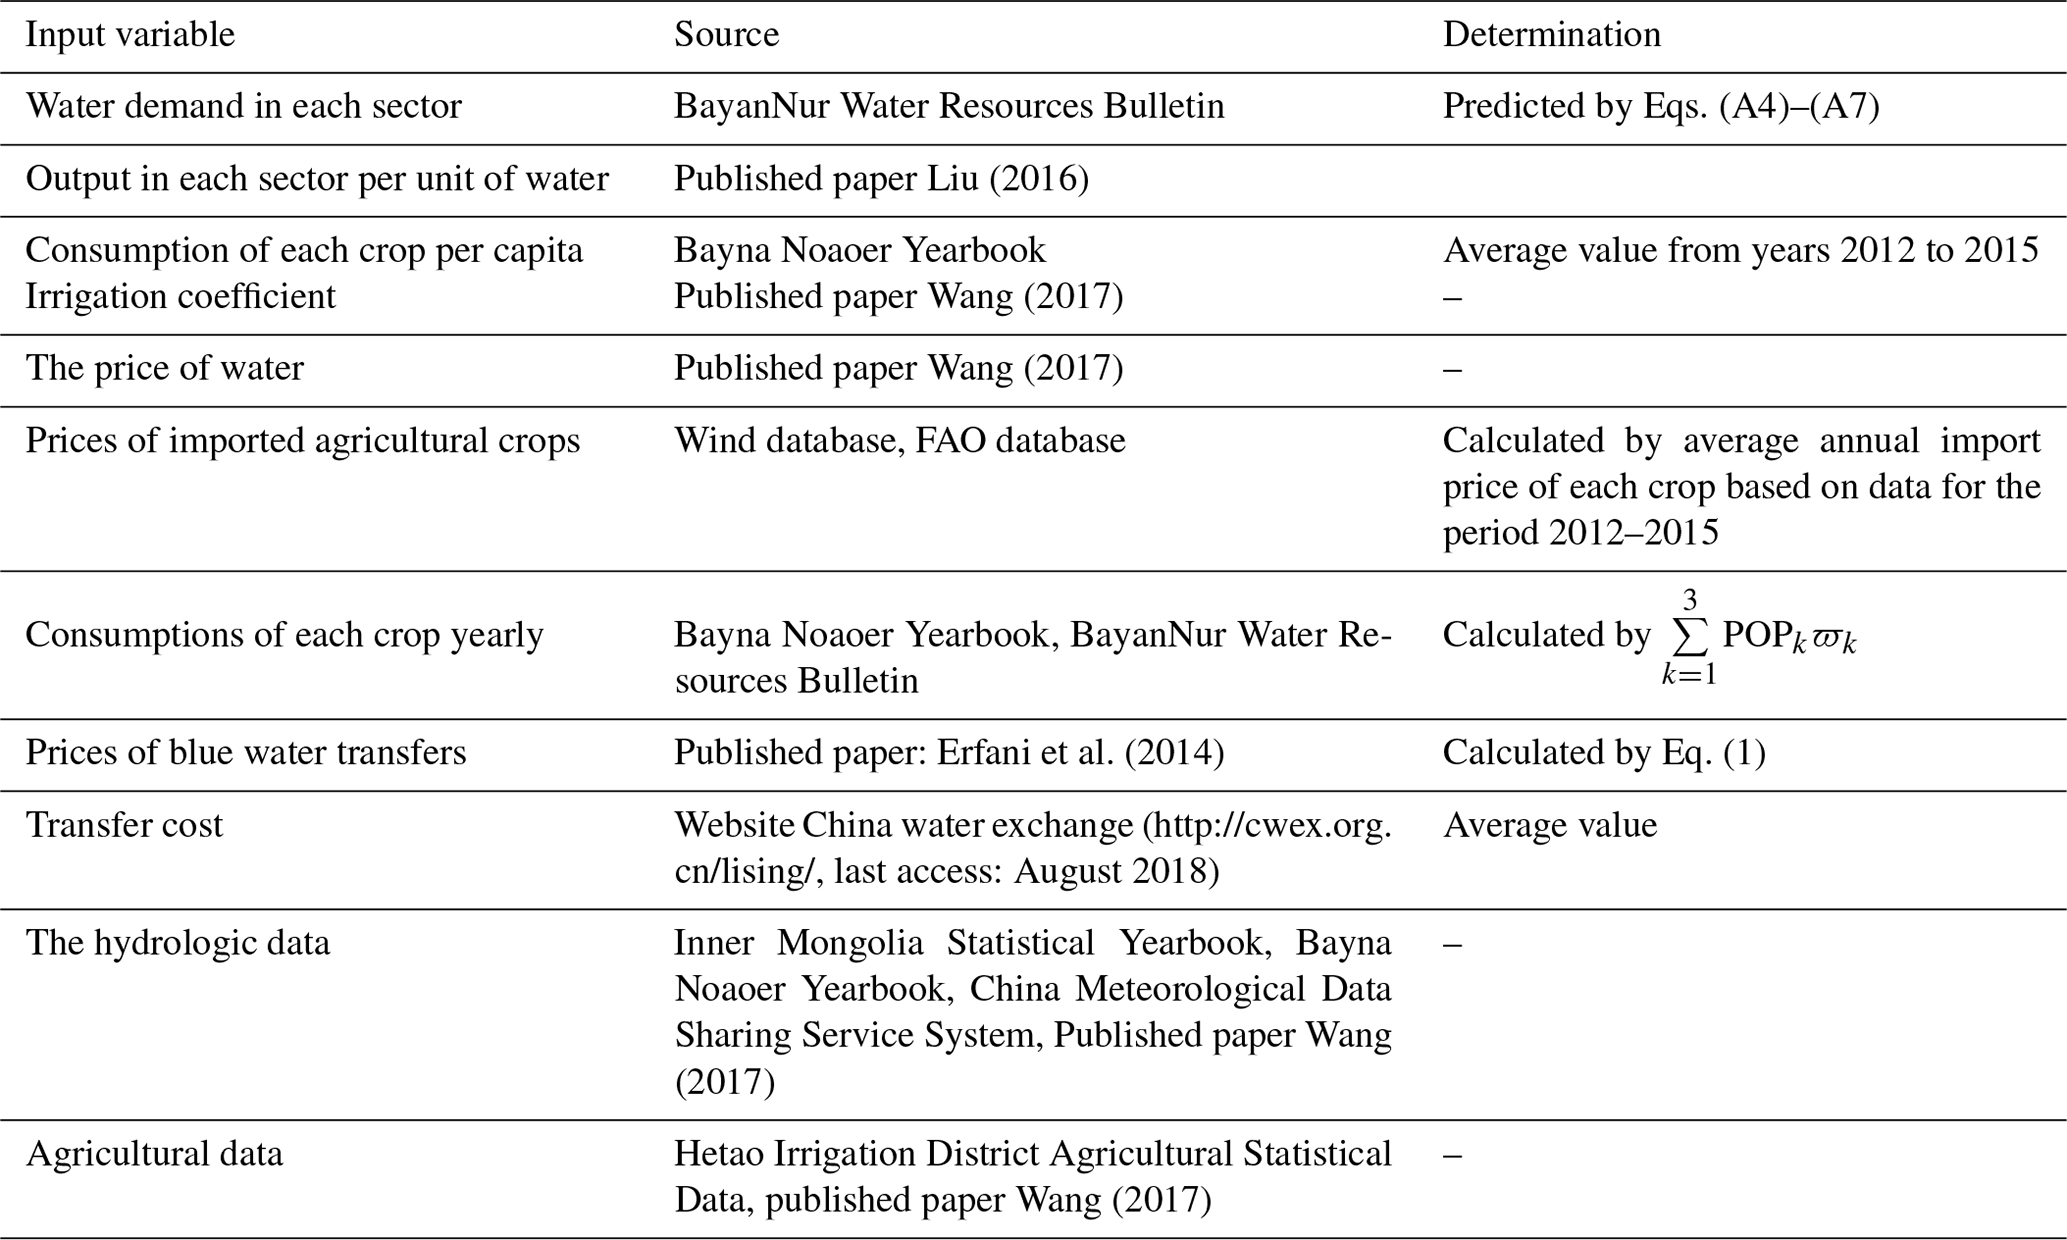
Data sets used in this paper are listed in Table D1.
All of the authors helped to conceive and design the analysis. ZX and XC developed the model and wrote the paper. LY and HW contributed to the data collection and the writing of the paper.
The authors declare that they have no known competing financial interests or personal relationships that could have appeared to influence the work reported in this paper.
The main data sources for the solution are based on the Bayna Noaoer Yearbook, Hetao irrigation district statistical data, the BayanNur Water Resources Bulletin and some published papers. Table D1 provides a general overview of the input variables, data sources and determination in this study. Some are cited from the website and published papers directly, and others are predicted by relative equations based on historical data.
We thank those that have given constructive comments and feedback to help improve this paper. Support was provided by the National Natural Science Foundation of China (grant no. 71771157).
This research has been supported by the National Natural Science Foundation of China (grant no. 71771157) and the Sichuan University (grant nos. skqx201726 and 2019hhs-19).
This paper was edited by Pieter van der Zaag and reviewed by Muhammad Hashim and one anonymous referee.
Ahmadi, A., Zolfagharipoor, M. A., and Afzali, A. A.: Stability analysis of stakeholders' cooperation in inter-basin water transfer projects: A case study, Water Resour. Manag., 33, 1–18, 2019. a, b
Allan, J. A.: Virtual Water: A Strategic Resource Global Solutions to Regional Deficits, Groundwater, 36, 545–546, 1998. a
Allan, J. A.: Fortunately there are substitutes for water otherwise our hydro-political futures would be impossible, Priorities for water resources allocation and management, 13, 26, 1993. a
Brown, C., Lund, J., Cai, X., Reed, P. M., Zagona, E., Ostfeld, A., Hall, J., Characklis, G., Yu, W., and Brekke, L.: The future of water resources systems analysis: Toward a scientific framework for sustainable water management, Water Resour. Res., 51, 6110–6124, 2015. a
Cai, X.: Global water demand and supply projections, Part 1: A modeling approach, Water Int., 27, 159–169, 2002. a
Cai, X.: Water stress, water transfer and social equity in Northern China–Implications for policy reforms, J. Environ. Manage., 87, 14–25, 2008. a
Chen, W., Wu, S., Lei, Y., and Li, S.: China's water footprint by province, and inter-provincial transfer of virtual water, Ecol. Indic., 74, 321–333, 2017. a, b
Dai, X., Han, Y., Zhang, X., Chen, J., and Li, D.: Development of a water transfer compensation classification: A case study between China, Japan, America and Australia, Agr. Water Manage., 182, 151–157, 2017. a, b
Duarte, R., Pinilla, V., and Serrano, A.: Understanding agricultural virtual water flows in the world from an economic perspective: A long term study, Ecol. Indic., 61, 980–990, 2016. a
Eichfelder, G.: Multiobjective bilevel optimization, Math. Program., 123, 419–449, 2010. a
Erfani, T., Binions, O., and Harou, J. J.: Simulating water markets with transaction costs, Water Resour. Res., 50, 4726–4745, 2014. a, b
Feng, K., Siu, Y., Guan, D., and Hubacek, K.: Assessing regional virtual water flows and water footprints in the Yellow River Basin, China: A consumption based approach, Appl. Geogr., 32, 691–701, 2012. a
Fu, J. S., Zhong, P., Zhu, F., Chen, J., Wu, Y., and Xu, B.: Water resources allocation in transboundary river based on asymmetric Nash-Harsanyi leader-follower game model, Water, 10, 270, 2018. a, b
Guo, X., Hu, T., Tao, Z., and Lv, Y.: Bilevel model for multi-reservoir operating policy in inter-basin water transfer-supply project, J. Hydrol., 424–425, 252–263, 2012. a
Harsanyi, J. C.: A bargaining model for the cooperative n-person game, Contrib. Theor. Game., 4, 325–355, 1959. a
Harsanyi, J. C.: A simplified bargaining model for the n-person cooperative game, Int. Econ. Rev., 4, 194–220, 1963. a, b
Hossein, Z., Hamid, A., and Mohammad, H. N.: Influential third party on water right conflict: A Game Theory approach to achieve the desired equilibrium (case study: Ilam dam, Iran), J. Environ. Manage., 214, 283–294, 2018. a
Jiang, W. and Marggraf, R.: Bilateral virtual water trade in agricultural products: A case study of Germany and China, Water Int., 40, 483–498, 2015. a, b
Lamastra, L., Miglietta, P., Toma, P., Leo, F., and Massari, S.: Virtual water trade of agri-food products: Evidence from Italian-Chinese relations, Sci. Total Environ., 5, 474–482, 2017. a
Liu, D.: Development and application of coupling model of water right transfer and virtual water compensation in irrigation district, Northwest Agriculture & Forestry University, 2016 (in Chinese). a, b
Liu, J. and Yang, W.: Water sustainability for China and beyond, Science, 337, 649–650, 2012. a
Liu, J., Zehnder, A., and Yang, H.: Global consumptive water use for crop production: The importance of green water and virtual water, Water Resour. Res., 45, 641–648, 2009. a
Liu, J., Sun, S., Wu, P., Wang, Y., and Zhao, X.: Inter-county virtual water flows of the Hetao irrigation district, China: A new perspective for water scarcity, J. Arid Environ., 119, 31–40, 2015a. a, b
Liu, J., Sun, S., Wu, P., Wang, Y., and Zhao, X.: Evaluation of crop production, trade, and consumption from the perspective of water resources: A case study of the Hetao irrigation district, China, for 1960–2010, Sci. Total Environ., 505, 1174–1181, 2015b. a, b
Liu, J., Wang, Y., Yu, Z., Cao, X., Tian, L., Sun, S., and Wu, P.: A comprehensive analysis of blue water scarcity from the production, consumption, and water transfer perspectives, Ecol. Indic., 72, 870–880, 2017a. a
Liu, X., Du, G., Jiao, R. J., and Xia, Y.: Product line design considering competition by bilevel optimization of a Stackelberg–Nash game, IISE T., 49, 768–780, 2017b. a
Madani, K.: Game theory and water resources, J. Hydrol., 381, 225–238, 2010. a
Mohammadikanigolzar, F., Ameri, J., and Motee, N.: Virtual water trade as a strategy to water resource management in Iran, J. Water Resour. Protect., 6, 141–148, 2014. a
Nash, J.: Two Person Cooperative Games, Econometrica, 21, 128–140, 1953. a
Neuman, J. and Morgenstern, O.: Theory of Games and Economic Behavior, Princeton University Press, Princeton, USA, 1944. a
Patwardhan, A. S., Nieber, J. L., and Johns, E. L.: Effective Rainfall Estimation Methods, J. Irrig. Drain. Eng., 116, 182–193, 1990. a
Ramos, M.: Bilevel optimization of Eco-Industrial parks for the design of sustainable resource networks, PhD thesis, Institut National Polytechnique de Toulouse, Toulouse, 2016. a
Sedghamiz, A., Heidarpour, M., Nikoo, M. R., and Eslamian, S.: A game theory approach for conjunctive use optimization model based on virtual water concept, Civil Eng. J., 4, 1315–1325, 2018a. a, b
Sedghamiz, A., Nikoo, M. R., Heidarpour, M., and Sadegh, M.: Developing a non-cooperative optimization model for water and crop area allocation based on leader-follower game, J. Hydrol., 567, 51–59, 2018b. a, b
Sedghamiz, A., Reza, N., Heidarpour, M., and Sadegh, M.: Developing a Non-Cooperative Optimization Model for Water and Crop Area Allocation Based on Leader-follower Game, J. Hydrol., 567, 51–59, 2018c. a
Shtull-Trauring, E. and Bernstein, N.: Virtual water flows and water-footprint of agricultural crop production, import and export: A case study for Israel, Sci. Total Environ., 622, 1438–1447, 2018. a, b
Su, X., Li, J., and Singh, V. P.: Optimal allocation of agricultural water resources based on virtual water subdivision in shiyang river basin, Water Resour. Manage., 28, 2243–2257, 2014. a
Wang, H.: Structural adjustment mechanism, water conservation and ecological conservation, available at: http://paper.people.com.cn/rmrb/html/2018-10/21/nw.D110000renmrb_20181021_1-10.htm, last access: 21 Octobor 2018 (in Chinese). a
Wang, L., Fang, L., and Hipel, K. W.: Basin-wide cooperative water resources allocation, Eur. J. Oper. Res., 190, 798–817, 2008. a
Wang, X., Lu, Q., and Gao, Q.: Study on the volumes of water diverted from the yellow river to the irrigated area in the great bend of the yellow river, Arid Zone Res., 22, 146–151, 2005. a, b
Wang, Y.: Systematic calculation of irrigation water use and total amount analysis of agricultural water use in Hetao irrigation area, Yangzhou University, Yangzhou, 2017 (in Chinese). a, b, c, d, e, f
Wang, Y., Wu, P., Zhao, X., and Engel, B.: Virtual water flows of grain within China and its impact on water resource and grain security in 2010, Ecol. Eng., 69, 255–264, 2014. a
Wang, Y., Liu, D., Cao, X. C., Yang, Z., Song, J., Chen, D., and Sun, S.: Agricultural water rights trading and virtual water export compensation coupling model: A case study of an irrigation district in China, Agr. Water Manage., 180, 99–106, 2017. a, b
Wei, F., Jing, Z., Wu, P., and Wu, Q.: A Stackelberg game approach for multiple energies trading in integrated energy systems, Appl. Energ., 200, 315–329, 2017. a
Xu, Y., Fu, X., and Qin, J.: Qualifying coordination mechanism for cascade-reservoir operation with a new game-theoretical methodology, Water, 10, 1857, 2018. a, b
Xu, Z., Yao, L., Zhou, X., Moudi, M., and Zhang, L.: Optimal irrigation for sustainable development considering water rights transaction: A Stackelberg-Nash-Cournot equilibrium model, J. Hydrol., 575, 628–637, 2019. a
Ye, Q., Li, Y., Zhuo, L., Zhang, W., Xiong, W., Wang, C., and Wang, P.: Optimal allocation of physical water resources integrated with virtual water trade in water scarce regions: A case study for Beijing, China, Water Res., 129, 264–276, 2018. a
Young, R. A. and Haveman, R. H.: Economics of water resources: A survey, Handbook of Natural Resource and Energy Economics, 2, 465–529, 1985. a
Zeng, X., Huang, G., Zhang, J., Li, Y., You, L., Chen, Y., and Hao, P.: A stochastic rough-approximation water management model for supporting sustainable water-environment strategies in an irrigation district of arid region, Stoch. Environ. Res. Risk A., 31, 2183–2200, 2017. a
Zeng, Z., Liu, J., Koeneman, P. H., Zarate, E., and Hoekstra, A. Y.: Assessing water footprint at river basin level: a case study for the Heihe River Basin in northwest China, Hydrol. Earth Syst. Sci., 16, 2771–2781, https://doi.org/10.5194/hess-16-2771-2012, 2012. a
Zhuo, L., Mekonnen, M., and Hoekstra, A.: The effect of inter-annual variability of consumption, production, trade and climate on crop-related green and blue water footprints and inter-regional virtual water trade: A study for China (1978–2008), Water Res., 94, 73–85, 2016. a, b, c
Zou, Q. and Liu, X.: Research on Industrial Water Demand Forecasting Model and its Application in China, Applied Mech. Mater., 675, 976–981, 2014. a
- Abstract
- Introduction
- Study area and water trading background
- Methods
- Data and results
- Discussion
- Conclusions
- Appendix A: Water demand computation
- Appendix B: Pseudo code
- Appendix C: Comparative models
- Appendix D: Data collection
- Data availability
- Author contributions
- Competing interests
- Acknowledgements
- Financial support
- Review statement
- References