the Creative Commons Attribution 4.0 License.
the Creative Commons Attribution 4.0 License.
 | 16 Jan 2020
A multi-environmental tracer study to determine groundwater residence times and recharge in a structurally complex multi-aquifer system
Cornelia Wilske
Axel Suckow
Ulf Mallast
Christiane Meier
Silke Merchel
Broder Merkel
Stefan Pavetich
Tino Rödiger
Georg Rugel
Agnes Sachse
Stephan M. Weise
Christian Siebert
Despite being the main drinking water resource for over 5 million people, the water balance of the Eastern Mountain Aquifer system on the western side of the Dead Sea is poorly understood. The regional aquifer consists of fractured and karstified limestone – aquifers of Cretaceous age, and it can be separated into a Cenomanian aquifer (upper aquifer) and Albian aquifer (lower aquifer). Both aquifers are exposed along the mountain ridge around Jerusalem, which is the main recharge area. From here, the recharged groundwater flows in a highly karstified aquifer system towards the east and discharges in springs in the lower Jordan Valley and Dead Sea region. We investigated the Eastern Mountain Aquifer system for groundwater flow, groundwater age and potential mixtures, and groundwater recharge. We combined 36Cl ∕ Cl, tritium, and the anthropogenic gases SF6, CFC-12 (chlorofluorocarbon) and CFC-11, while using CFC-113 as “dating” tracers to estimate the young water components inside the Eastern Mountain Aquifer system. By application of lumped parameter models, we verified young groundwater components from the last 10 to 30 years and an admixture of a groundwater component older than about 70 years. Concentrations of nitrate, simazine (pesticide), acesulfame K (ACE-K; artificial sweetener) and naproxen (NAP; drug) in the groundwater were further indications of infiltration during the last 30 years. The combination of multiple environmental tracers and lumped parameter modelling helped to understand the groundwater age distribution and to estimate recharge despite scarce data in this very complex hydrogeological setting. Our groundwater recharge rates support groundwater management of this politically difficult area and can be used to inform and calibrate ongoing groundwater flow models.
- Article
(2240 KB) - Full-text XML
- BibTeX
- EndNote


About 20 % of the Earth's land surface is covered by carbonate karst or sulfate aquifers and serves as the primary water resource for at least 25 % of the world's population. In addition, about a fifth of the world's karst systems are in (semi-)arid areas, whose water scarcity is aggravated by strong population growth (Ford and Williams, 2007). Karst systems represent abundant but highly variable water resources whose extremely heterogeneous and anisotropic flow behaviour prevents exact predictions regarding mass transport and the usable water quantities (Bakalowicz, 2005). Nevertheless, the water balance meets the basic requirement for sustainable management and protection of any water resource.
Environmental tracers play an important role in sustainable water management strategies because they allow for estimating the groundwater age distribution with depth, and together with simple lumped parameter models they can be used to quantify groundwater infiltration rates (Vogel, 1967; Solomon et al., 1995; IAEA, 2006). Especially in karst aquifers, wide ranges of residence times are observable due to the strongly heterogeneous hydraulic system, allowing water to rapidly flow through conduits and fractures and very slowly flow through the small pores of the matrix. That leads to large heterogeneities in the groundwater age distribution, hence requiring the application of multiple tracers to constrain the age distribution, especially in karst. We define young groundwater as having measurable concentrations of anthropogenic tracers, thus a mixing component recharged after about 1950, while in old groundwater these tracers are not detectable (e.g. Plummer et al., 1993; Cook and Herczeg, 2000). The atmospheric tracer CFC-11 (chlorofluorocarbon), CFC-12, CFC-113, SF6 (sulfur hexafluoride) and 36Cl ∕ Cl and tritium from bomb tests or anthropogenic organic trace pollutants like pesticides, sweeteners or drugs are increasingly used as tracers of young groundwater (IAEA 2006). Gas tracers like CFCs and SF6 move through the unsaturated zone primary by diffusion, leading to a time lag at the water table compared to the atmosphere (Cook and Solomon, 1995; Cook et al., 1995). A time lag is also possible for the water bound tracers tritium and 36Cl, since the advection through the unsaturated zone may take decades (Suckow et al., 1993; Lin and Wei, 2006), and in infiltration areas dominated by sand or clay, water-bound tracers are generally slower than gas tracers (Solomon et al., 1992; Cook et al., 1995). This can be very different in karst systems, where preferential flow in karst “tubes” allows for a fast recharge to the groundwater table, and fluctuations of groundwater level may allow for further gas exchange thereafter.
The deconvolution of measured tracer concentrations into recharge rates therefore needs modelling. If the age of water would be known as function of depth, any flow model could be directly constrained, and the recharge rates could be deduced. However, the “idealized groundwater age”, which is often understood as the time span an imaginary water parcel needs between infiltrating at the groundwater surface and being sampled at a well or spring (Suckow, 2014a) is not directly measurable. In addition, groundwater mixes both along its natural flow through the aquifer and during sampling in the well. Therefore, simple lumped parameter models (LPMs) are used to interpret the measured tracer concentrations as mean residence times (MRTs) via a convolution integral, which in combination with the underlying assumptions on the flow system allow for deducing recharge rates. We applied the piston flow model (PM), the dispersion model (DM) and the partial exponential model (PEM) to approximate the age distribution in our groundwater samples.
In our study, the Eastern Mountain Aquifer (EMA) system in the western Dead Sea catchment is the pivotal water resource for some million people in the West Bank and Israel. An unequal distribution of borehole information leads to poor and limited data for studying that aquifer system. Previous studies considered age dating tracers to quantify water movement and flow velocity within the EMA and associated aquifers. Paul et al. (1986) and Yechieli et al. (1996) studied 36Cl ∕ Cl to detect very old groundwater brines in the Dead Sea area. In contrast young-age dating tracers such as tritium or anthropogenic trace gases (CFCs and SF6) were used to quantify the duration of water flow from recharge areas to the springs (Lange, 2011). Environmental tracer investigations of the main Cretaceous aquifers (Upper Cenomanian and Albian) in the western Dead Sea catchment attempted to quantify the duration of water flow from the recharge area to the springs in the mountain region uphill of the Dead Sea coast. The young-age dating tracers demonstrated a large young groundwater fraction with a mean residence time of less than 30 years in the springs of the mountain region and fast connections to the recharge area. All previous studies together show large heterogeneities in the groundwater age distribution (Avrahamov et al., 2018).
In this study we combine for the first time in this area bomb-derived 36Cl, anthropogenic organic trace substances and environmental tracers like tritium, CFCs, SF6 in combination with lumped parameter models to interpret the distribution of these tracers to quantify recharge. Małoszewski and Zuber (1982, 1993, 1996) have shown that LPMs are a useful tool for interpreting tracer data obtained at separate sampling sites when it is not possible to use distributed parameter models, as the latter require more detailed and often unavailable knowledge about distributed parameters for the investigated system. In detail this work aims (i) to validate young rainwater input and short groundwater travel times via karst conduits, related to rapid flow paths from the recharge area; (ii) to quantify the time lag of gas tracers in the unsaturated zone; (iii) to quantify groundwater mixing of groundwater components with different ages via lumped parameter models; and (vi) to estimate groundwater recharge and support calculations of future groundwater resource development.
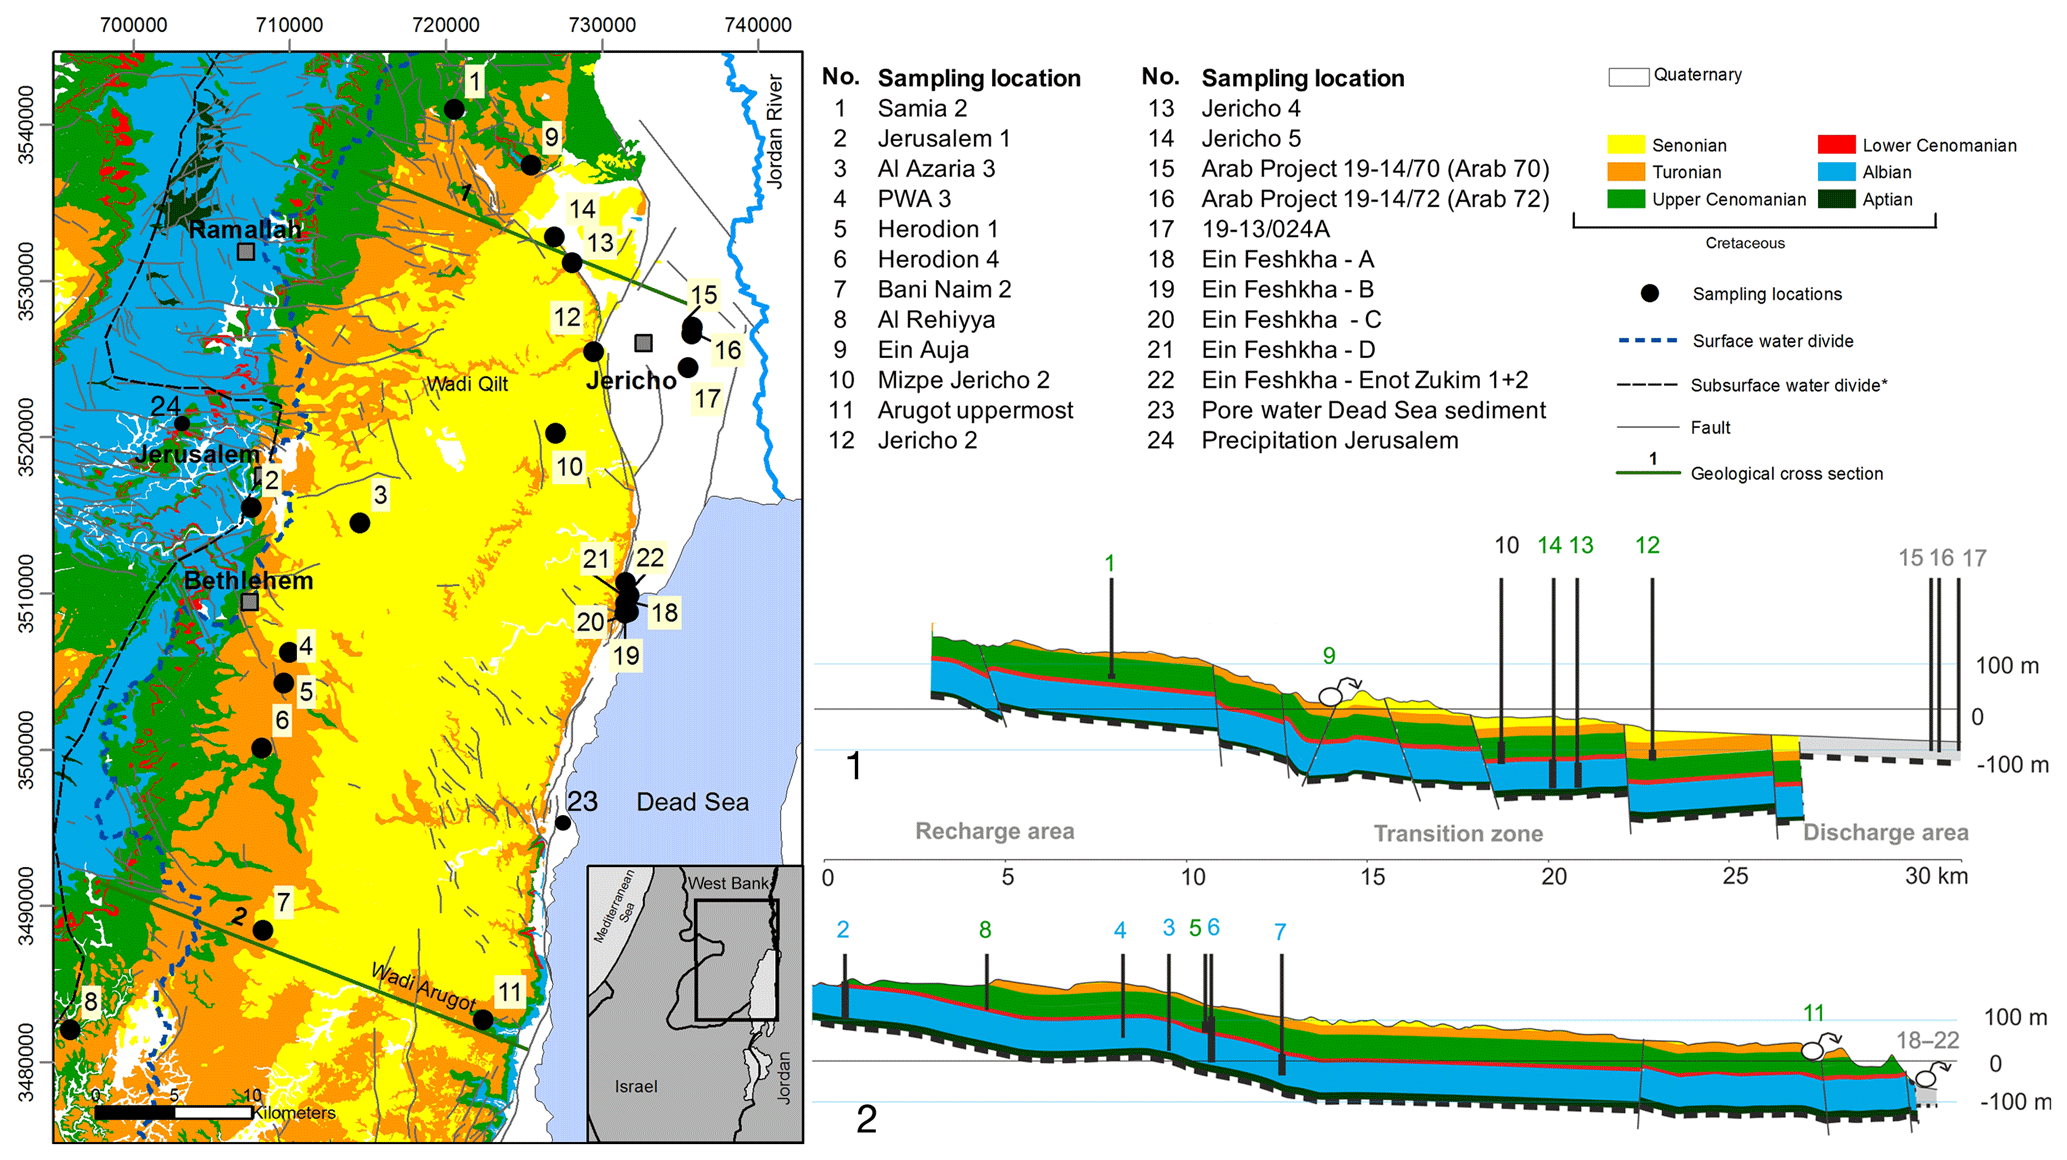
Figure 1The location of the study site including geological information based on Begin (1974), Mor and Burg (2000), Raz (1986), Roth (1973), Shachnai (2000), Sneh and Avni (2011), and Sneh and Roth (2012). Universal Transverse Mercator (UTM) coordinates: UTM WGS84 Z36N.
1.1 Study area
The study area, which represents the western surface drainage basin of the Dead Sea, is embedded in a region that is morphologically and geologically dominated by the tectonic processes associated with the Jordan–Dead Sea rift, active since the late Oligocene (Garfunkel et al., 1981; Rosenfeld and Hirsch, 2005). The western rift fault separates the Cretaceous aquifer formations that form the graben shoulder from the deeply subsided graben and its Quaternary filling. In addition, rift tectonics induced a series of faults within the western graben shoulder, resulting in down-faulted blocks, which find their surface expression in a strong morphological gradient. Within less than 25 km, the land surface drops from +800 m m.s.l. in the west to sea level at the rift margin, with a terminal step to −430 m m.s.l. at the Dead Sea in the east (Fig. 1).
The semi-arid-to-arid Mediterranean climate leads to precipitation during the winter season, with a strong decline from west to east due to which the study area can be divided into three hydrological zones: (i) the recharge area in the upland that receives annually up to 580 mm of precipitation; (ii) the transition zone occupying the hillsides of the upland down to the rift margin, receiving 100–400 mm yr−1 and (iii) the major discharge area of groundwater in the lower Jordan Valley–Dead Sea area, receiving less than 100 mm yr−1 of precipitation.
The graben shoulder hosts a thick aquifer system that is mainly built of fractured and layered karstified Upper Cetaceous limestone and dolostone, which are overlain by a Senonian chalky aquitard. A marly aquiclude (Lower Cenomanian) divides the system into a lower aquifer (Albian) and upper aquifer (Upper Cenomanian). Impervious beds in the upper aquifer permit the development of a perched and locally important aquifer (Turonian), being built of homogenous and fissured limestones and holding springs, which emerge in deeply incised valleys within the transition zone (e.g. Wadi Qilt springs; Fig. 2). While all aquifer units are recharged in the mountain area, the natural discharge of the two regional aquifers occurs through springs at the base of the graben shoulders, where the groundwater leaves the aquifers and approaches the prevalently impervious Quaternary graben filling.
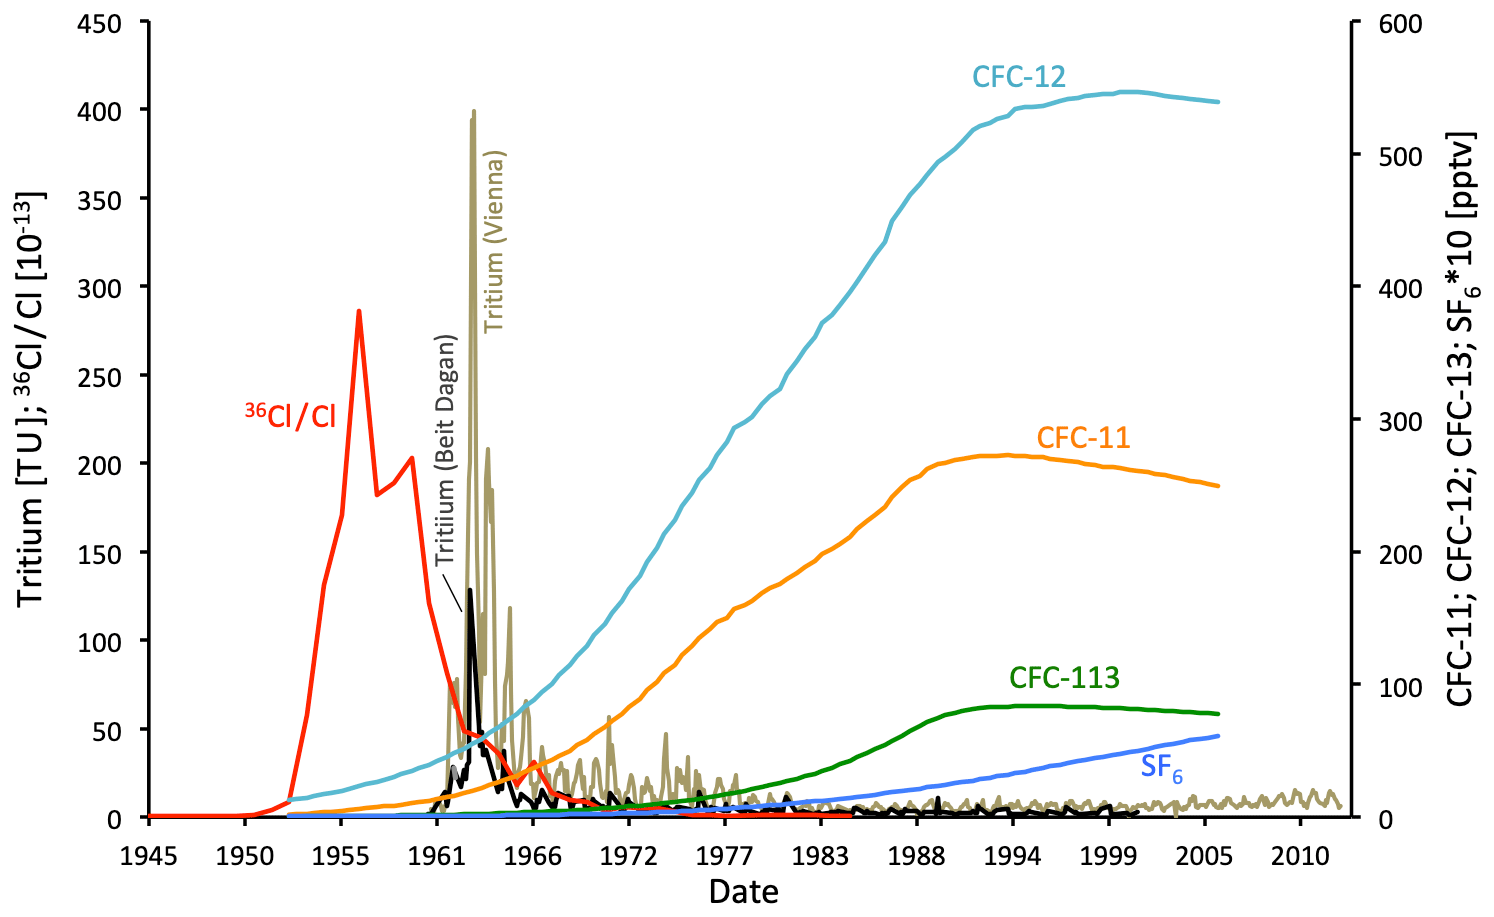
Figure 2Atmospheric input curves of 36Cl ∕ Cl (36Cl obtained from Dye-3 ice core; Synal et al., 1990), SF6 and CFCs (Plummer et al., 2006) and decay-corrected Tritium in rain water of Beit Dagan and Vienna (IAEA/WMO, 2019).
Subsequently, groundwater emerges along the shore in spring clusters, forming ecologically important oases such as Ein Feshkha. Where groundwater can percolate into the Quaternary sediments; they intensely dissolve the evaporite minerals contained within (halite, anhydrite and aragonite) and get saline on their flow path to the lake shore. In addition, the chemical and isotopic composition of approaching fresh groundwaters is systematically modified by an admixing of brines, already in the vicinity of the major rift fault (Katz and Kolodny, 1989; Stein et al., 1997; Ghanem, 1999; Yechieli, 2000; Klein-BenDavid et al., 2004; Khayat et al., 2006a, b; Möller et al., 2007; Siebert et al., 2014; Starinsky and Katz, 2014). Groundwater recharge rates are controlled by climate conditions and have been investigated earlier to force regional groundwater models (Guttman et al., 2004; Yellin-Dror et al., 2008; Gräbe et al., 2013; Schmidt et al., 2014), which allowed for a detailed insight into the regional groundwater flow dynamics (Laronne Ben-Itzhak and Gvirtzman, 2005; Sachse, 2017).
Human groundwater abstraction takes place mainly in the mountain ridge inside the recharge area and along the transition to the Jordan Valley. This unequal distribution of the sampling possibilities led to a data scarcity for the entire central area of the aquifer, which is also visible in Fig. 1.
2.1 Fundamentals of the method
Age distributions of young groundwater can be characterized by applying anthropogenic trace gases like CFC-11, CFC-12, CFC-113 and SF6 in lumped parameter models if an input function is available. For the last 6 decades, that function has been derived for gas tracers from (i) their known concentrations in the atmosphere (Fig. 2), (ii) the observation that they are well mixed in the atmosphere and (iii) the observation that their solubility at the temperature of recharge is known from Henry's law (Plummer and Busenberg 2000). The large-scale production of CFC-11 and CFC-12 (both used as cooling fluid) started in the early 1940s, while the production of CFC-113 only started in the 1960s. Inevitably they leaked into the environment, with atmospheric concentrations rising until the 1990s, when their moratorium took effect. Another industrial gas SF6, widely used as an electrical insulator, has been detectable in the atmosphere since 1960s with still exponentially rising concentrations. Atmospheric concentrations of SF6 and the CFCs for the period 1953–2006 (Fig. 2) are derived from Plummer et al. (2006). Since gas solubility in recharging precipitation depends on temperature and atmospheric pressure, the average air temperature of the winter season in the study area (15 ∘C) was used for the former and an altitude of 700 m m.s.l., which is the average altitude of the infiltration area, was used for the latter. The rain water salinity was set to 0 ‰ since rain water is low mineralized.
Tritium (3H) is the naturally occurring isotope of hydrogen and is mainly produced by fast secondary neutrons from cosmic radiation. It decays to 3He with a half-life of 12.32±0.02 years (Lucas and Unterweger, 2000), making 3H usable for groundwater age dating in a time frame of <40 years (e.g. Schlosser et al., 1988; Solomon et al., 1992; Cook and Solomon, 1997; Sültenfuß and Massmann, 2004), including quantifying changes of measured 3He ∕4He ratios in groundwater. At the study area, observations of tritium in precipitation (Global Network of Isotopes in Precipitation stations Beersheba, Beit Dagan and Tirat Yael; GNIP; IAEA/WMO, 2019) were available only for 1960–2001, while input data are required until 2014. We therefore applied tritium data from the Vienna station, Austria (IAEA/WMO, 2019), which are adjusted to the longitudinal and latitudinal difference by a factor of 0.4 to match the stations in Israel (Fig. 2). For the synoptic tracer plots the decay correction is set to 31 October 2013. The pre-bomb input value for tritium was set to a mean tritium concentration of 3 TU obtained from the GNIP database (IAEA/WMO, 2019).
36Cl is produced naturally via cosmic-ray and solar protons induced by nuclear reactions of argon in the atmosphere and 35Cl in marine aerosols (Alvarado et al., 2005). However, comparable to 3H, the atmospheric concentration of “bomb” 36Cl peaked during the 1950s as an effect of nuclear weapon tests and was washed out from the atmosphere by the end of the 1960s. The 36Cl bomb peak precedes the tritium peak by half a decade. The 36Cl input curve for our study area (Fig. 2) was obtained from Iceland ice core measurements from Synal et al. (1990), which were corrected to the location of the study area by applying a latitudinal correction with a factor of 3, according to Heikkilä et al. (2009), who modelled 36Cl fallout for different latitudes. Natural “pre-bomb” concentrations of 36Cl ∕ Cl were assumed to be 10−14, which is based on 36Cl ∕ Cl in rainwater, sampled during the winter of 2014–2015 with an average value of 36Cl ∕ Cl = .
Most studies to estimate groundwater age with a 36Cl base with a half-life of 36Cl (0.301±0.015 Myr) (Nica et al., 2012) consider time frames > 100 000 years (Davis et al., 1983; Bentley et al., 1986; Love et al., 2000; Mahara et al., 2012; Müller et al., 2016). Studies using 36Cl from the atmospheric bomb peak to estimate the groundwater age of the last decades are much less frequent (Alvarado et al., 2005; Tosaki et al., 2007, 2010; Lavastre et al., 2010; Rebeix et al., 2014).
Anthropogenic organic trace pollutants in groundwater are associated with nutrition, medication, or agricultural and industrial development. During the last decades, artificial sweeteners have played an important role as a surrogate in the nutrition industry. Particularly acesulfame K (ACE-K) has been used since the 1990s and is stable against wastewater treatment (WWT) processes, making it an ideal tracer for domestic wastewater. A second chemical marker for human intake is naproxen (NAP), widely applied as an anti-inflammatory drug since the 1980s. Though NAP is partly eliminated during WWT and may be adsorbed along flow paths to sediments (Chefetz et al., 2008; Yu et al., 2008; Teijón et al., 2013), it occurs in effluents of sewage plants and increasingly in natural waters (Arany et al., 2013). Contrasting that, ACE-K is hydrophilic (e.g. Buerge and Poiger, 2011) and inert against degradation, which makes it a valuable substance to trace transport from the recharge towards the discharge area. In addition to the urban indicators, pesticide traces in groundwater were used to identify the agricultural contributions to the water resources. Simazine, which has been available since the 1950s, is one of the most applied herbicides and absorbs into soil where it may be eliminated though bacterial degradation. However, the use of simazine has been phased out in Israel since 2012–2014 (Berman et al., 2014). Nitrate is another indicator for anthropogenic input, whose distribution in groundwater originates from the nitrification of NH4 during WWT and fertilizer excess in agriculture.
2.2 Sampling and analytical methods
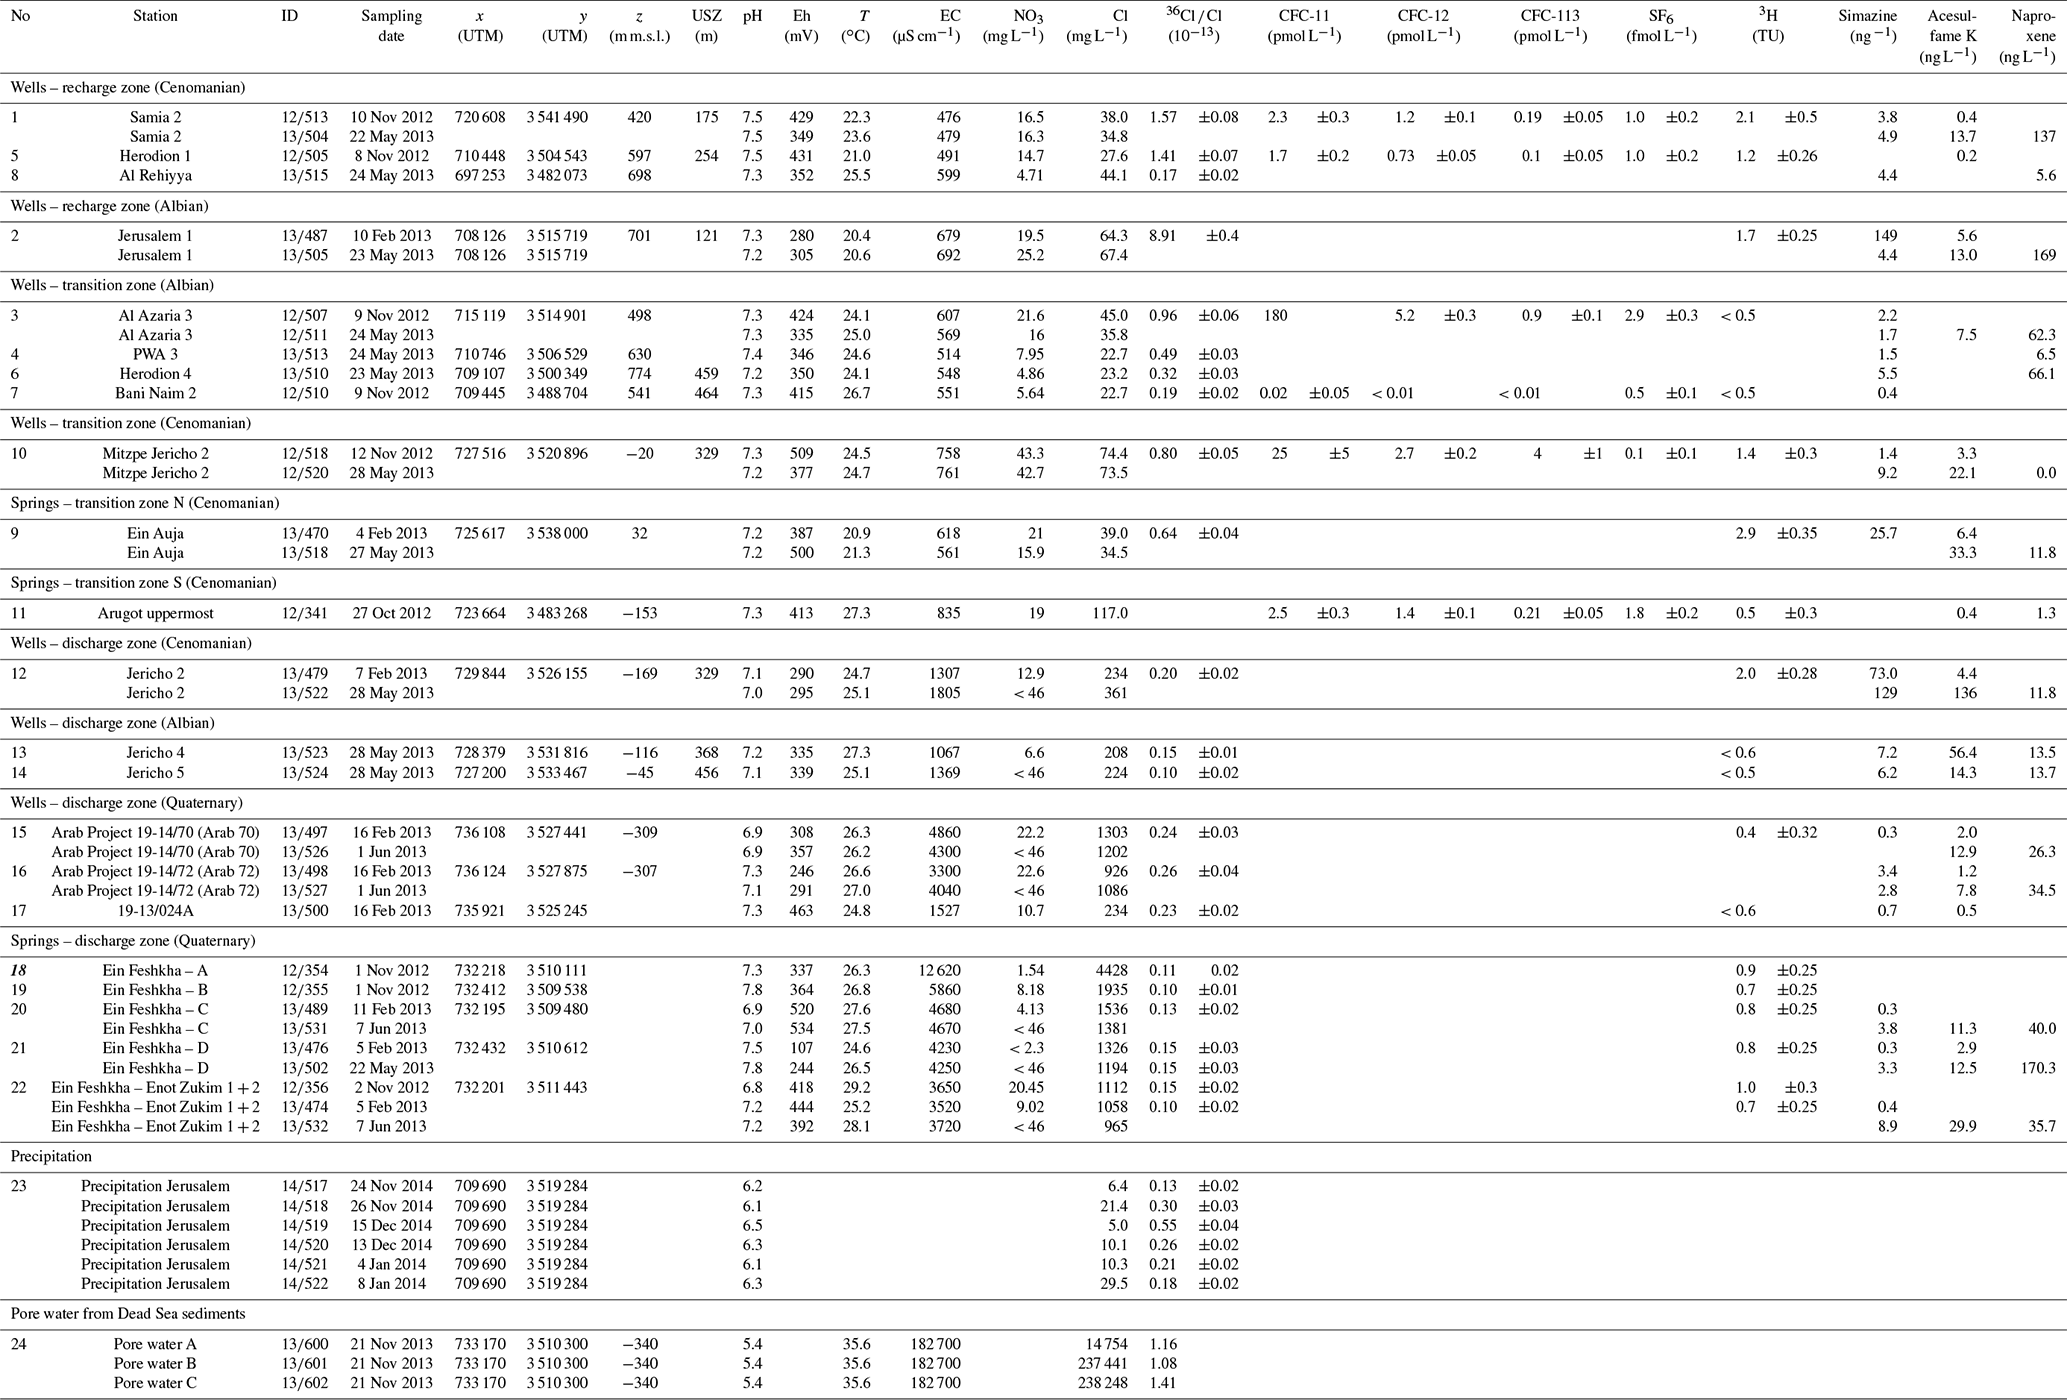
In the study area, 22 groundwater samples were taken from springs and active wells (sampling locations in Fig. 1 and Table 1) after reaching stable conditions for temperature, electrical conductivity and pH. Major anion samples were filled into high-density polyethylene (HDPE) bottles after passing a 0.45 µm cellulose acetate filter. Samples for cations were acidified using HNO3. Samples for 36Cl analyses are filled into 500 mL HDPE bottles, which have been specifically pre-cleaned using ultrapure HNO3. Samples for 36Cl analyses were acidified with HNO3. Following the methodology described in Oster et al. (1996), sampling for CFCs and SF6 was performed using glass bottles fully submerged in tins, filled with sampling water. Tritium samples were collected in 500 mL HDPE bottles. Organic trace elements were sampled in pre-cleaned, methanol-flushed 1000 mL brown glass bottles with the use of a glass microfiber filter (0.7 µm).
Table 1Sampling locations and analytic results. USZ: unsaturated zone (thickness); Eh: redox potential; T: temperature; EC: electrical conductivity.
Major element analyses in water samples were performed at the Helmholtz Centre for Environmental Research (UFZ) by using matrix-adjusted inductively coupled plasma optical emission spectroscopy (ICP-AES, Spectro Arcos) for Na+, K+, Ca2+, Mg2+ and Sr2+ and by using ion chromatography (ICS-2000, Dionex) for Cl−, Br− and . Bicarbonate was determined in situ by titration. Analyses of 36Cl were carried out in the Helmholtz-Zentrum Dresden-Rossendorf at the accelerator mass spectrometry (AMS) facility DREsden AMS (DREAMS) (Akhmadaliev et al., 2013). The main preparation steps consist of (i) the precipitation of chloride by adding an AgNO3 solution (10 %) and subsequent dissolution of the AgCl in NH4aq; (ii) the separation of chlorides from sulfates by co-precipitation of BaSO4 with BaCO3 (CO2 from air) using a saturated BaNO3 solution and filtration through a syringe filter made of polyvinylidene fluoride (pore size: 0.45 µm); and (iii) the re-precipitation of AgCl in the filtrate with nitric acid. 36Cl is measured with AMS relative to the stable Cl isotopes, 35Cl and 37Cl (Pavetich et al., 2014; Rugel et al., 2016), and is given as the ratio of ) (termed 36Cl ∕ Cl in the text). All data are normalized to the standards of SM-Cl-12 and SM-Cl-13 (Merchel et al., 2011).
Tritium sample preparation and measurement were conducted by the isotope hydrology group at UFZ, following the preparation steps of Trettin et al. (2002) by first enriching a 400 mL water sample electrolytically and measuring it via liquid scintillation counting with a detection limit of 0.5 TU.
CFCs and SF6 were analysed in the Spurenstofflabor Dr. Harald Oster (Wachenheim, Germany) by gas chromatography (Bullister and Weiss, 1988; Oster et al., 1996). Measurements of organic trace elements were conducted with high-pressure liquid chromatography mass spectrometry (HPLC-MS) at the UFZ. To transport the samples to the lab, organic components were stabilized by solid phase extraction (SPE) on cartridges containing a polar-modified polystyrene–divinylbenzene copolymer (Chromabond Easy, Macherey-Nagel). At the lab, analytes were eluted with methanol and measured with HPLC-MS/MS (Agilent 1000, Agilent Technologies, Germany; coupled with an API2000 mass spectrometer, AB Sciex, Germany). Limits of detections are 1, 0.6 and 0.3 µg L−1 for naproxen, acesulfame K and simazine, respectively. Analytical results are given in Table 1.
2.3 Lumped parameter model “LUMPY”
LPMs are pre-defined analytical solutions of simplified flow systems. They describe the tracer output mathematically with a convolution integral that combines the tracer input history, weighed with the age distribution valid for the flow system in question (Maloszewski and Zuber, 1982, 2002).
Mathematically all lumped parameter models for steady-state flow systems with a time-variable tracer input are convolution integrals (Eq. 1).
where t is the calendar time, t′ is the transit time of the tracer, Cout is the output concentration, Cin is the input concentration and g(t′) is the weighting function or system response function. All weighting functions of all models are normalized, following Eq. (2).
The mean residence time is the main fitting parameter, while some models (e.g. dispersion model) require additional parameters like the (i) Péclet number, (ii) top and bottom of the screened section or (iii) saturated thickness of the aquifer. Input data are (i) regional atmospheric tracer input curves and (ii) selected hydrogeological characteristics such as the infiltration temperature and elevation.
In this study the LPM code LUMPY (Suckow, 2012) was used to implement the convolution integral for flow systems that can be described by the piston flow model, the exponential model (including the partial exponential model) and the dispersion model.
The PM describes the movement of a water parcel along a defined flow path from the aquifer surface towards the spring or well filter, neglecting any mixing, dispersion or diffusion. The DM characterizes transport influenced by dispersion and advective flow. The relative magnitude of both is expressed as the Péclet number Pe (Eq. 3).
where l is the flow length of the system under consideration, ν is the velocity and D is the dispersion constant (Huysmans and Dassargues, 2005). In our model approach, best fits were obtained by applying a Péclet number of 30, characterizing a dominantly advective transport.
The PEM is related to the exponential model (EM). Based on homogenous infiltration into a homogeneous aquifer as in Vogel (1967), the PEM describes mixing of those flow lines reaching the filter screen of a well. In the special case where the filter screen extends over the whole thickness of the aquifer the PEM is equivalent to the exponential model, and the MRT (mean residence time of the sample) is the only fitting parameter. The mathematical equation of DM, EM and PEM are described in Maloszewski and Zuber (1982, 2002) and Jurgens et al. (2016), respectively.
2.3.1 Parameterization and model setup of LUMPY
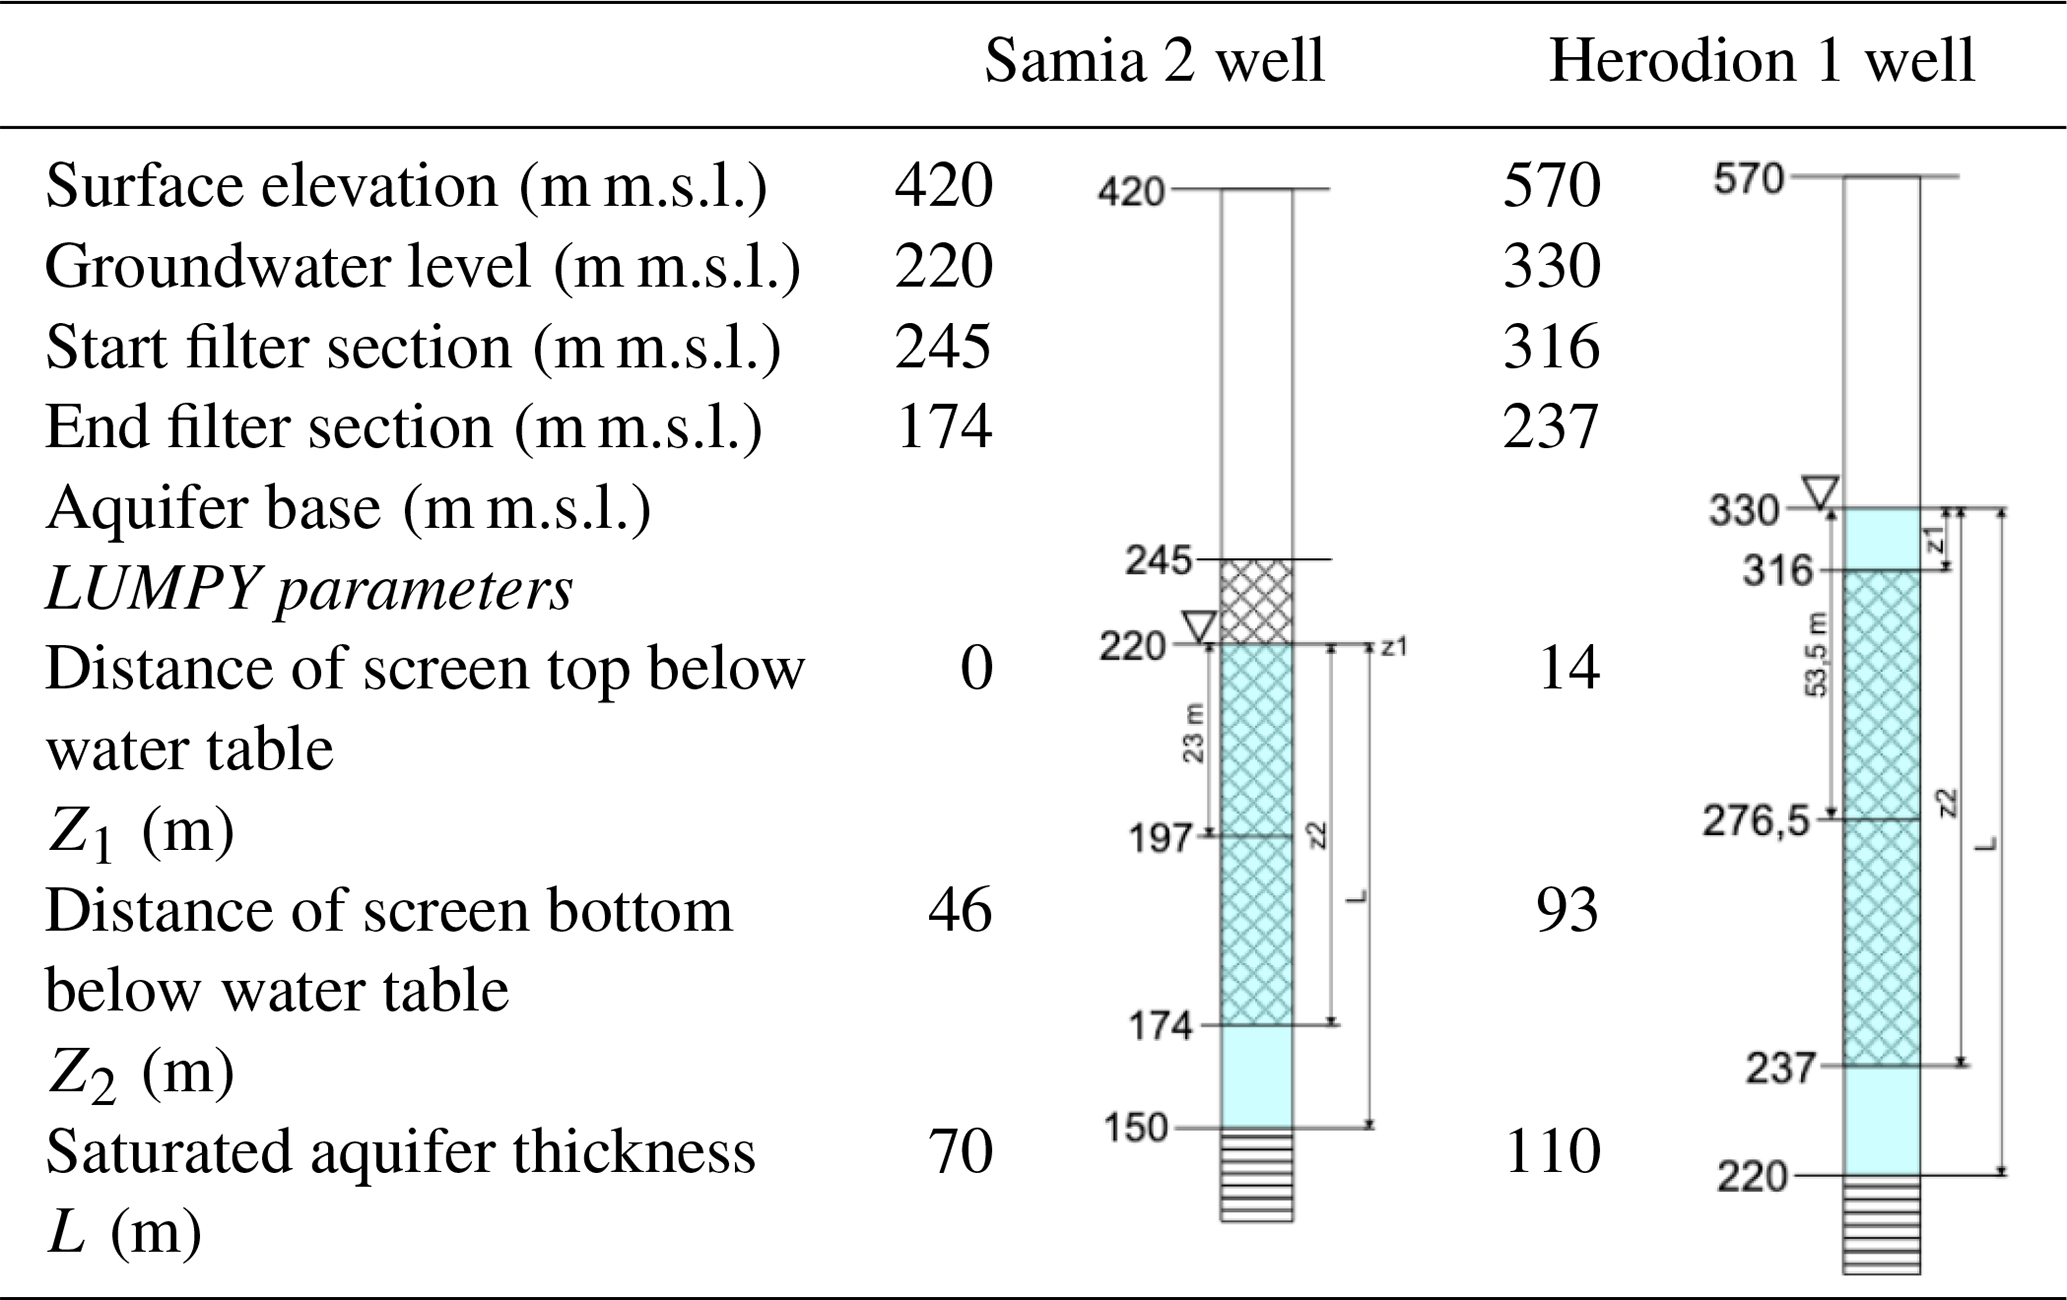
To parameterize the unsaturated (vadose) zone in the recharge area, characteristic wells (Samia 2 and Herodion 1) were used (Table 2).
Table 2Summary of DM, PM and PEM parameters for the wells Samia 2 and Herodion 1. Schematic graphs illustrate parameters and their individual levels in metres m.s.l. along both boreholes; the water-filled (saturated) part of the aquifer is indicated in blue; the screen section is indicated by a checkered pattern; and the aquitard is indicated by a striped pattern.
Influence of a thick unsaturated zone
Gas tracers like CFCs and SF6 predominantly pass the unsaturated (vadose) zone in the gas phase, posing certain problems for their interpretation. In unsaturated zones of less than 5m thickness, the gas composition of soil air resembles that of the atmosphere (Cook and Solomon, 1995; Engesgaard et al., 2004). However, a time lag may occur for the diffusive transport of CFCs and SF6 through thick unsaturated zones of porous aquifers (Cook and Solomon, 1995). This time lag is a function of the tracer diffusion coefficients, tracer solubility in water and moisture content (Weeks et al., 1982; Cook and Solomon, 1995). A time lag always results in a gas tracer age older than the time of groundwater recharge. In fractured (or karstic) aquifers, however, the time lag may be much shorter (e.g. Darling and Gooddy, 2007; Gooddy et al., 2006) resulting in ages of CFCs or SF6 measurements obtained from groundwater which effectively represent residence time of groundwater since recharge approached the groundwater table, without a time lag and as if the tracer were transported within the saturated zone only. The present study aims to estimate travel times in the thick unsaturated zone (Cook and Solomon, 1995; Plummer et al., 2006) by estimating the time lag as the relative difference in mean residence time between gas and water-bound tracers, applying both, water-bound tracers (3H and 36Cl) and gas tracers (CFCs and SF6). In particular, the wells Samia 2 and Herodion 1 of the Upper Cenomanian are selected in order to consider wells close to the recharge area with a thick unsaturated zone of 200–240 m (Table 2). They are in the eastern part of the recharge zone (Fig. 1), where the limestone is intensely fissured vertically and partly karstified.
2.3.2 Well construction, aquifer data and the calculation of recharge rates
The convolution integral of the partial exponential model can be further constrained by the well construction data like (saturated) depth to the top of the screen, the screen length and saturated aquifer thickness (Jurgens et al., 2016). These data were taken from the construction logs of the investigated production wells (Table 2).
Based on the estimated MRT of the applied lumped parameter models DM, PM and PEM, recharge rates can be estimated. However, the formulas to apply differ slightly between the different models. The following Eq. (4) allows for calculating the recharge rate R for the PEM (Vogel, 1967; Jurgens et al., 2016):
where ϕ is the porosity of the aquifer, L is the saturated aquifer thickness and the MRT is valid for the whole aquifer (which is an output in LUMPY derived from the fitted MRT for the sample and using the well parameters Z1, Z2 and L in Table 2).
As for the DM and PM, L is the distance from the groundwater surface to the depth of the centre of the screened section of the well. Depth to the centre of the water-filled screen section from groundwater level is 23 m for Samia 2 and 53.5 m for Herodion 1 (Table 2). As for the DM, not the MRT but the peak time, is used, which is also an output of LUMPY, being calculated by applying Eq. (5) (Suckow, 2014b).
Tracer transport in karst areas is influenced by double porosity effects, particularly a retardation of the tracer can be assumed due to diffusive loss into the adjacent limestone of the fissures. A correction of calculated MRTs and recharge rates may be possible applying a retardation factor (Eq. 6) (Maloszewski et al., 2004; Purtschert et al., 2013).
where ∅tot ist the total porosity and ∅eff is the effective porosity. An assumed porosity in the carbonate karst aquifers may vary between <2 % (representing the open fissures and solution pipes) to 20 % (total pore space in the aquifer rock).
Groundwater recharge was also estimated using the chloride mass balance (CMB) method, which was successfully applied elsewhere (Eriksson and Khunakasem, 1969; Allison and Hughes, 1978; Wood and Sanford, 1995; Purtschert et al., 2013; Crosbie et al., 2018) and which assumes Cl input to groundwater originates from Cl concentration in precipitation, which becomes enriched due to evaporation only (Eq. 7).
The formula consists of the mean annual precipitation P and the chloride concentrations in precipitation ClP and groundwater ClGW in mg L−1. The mean annual precipitation in the recharge area is about 550 mm. The average long-term Cl content in rain water is ca. 5 mg L−1 (Herut et al., 1992), while it reaches 28 and 35–38 mg L−1 in the groundwaters of wells Herodion 1 and Samia 2, respectively.
The 36Cl ∕ Cl ratios in precipitation, which fall in the recharge area, are assumed to have been stable since the 1980s, as indicated by rainwater samples collected during the winter of 2014–2015, which show 36Cl ∕ Cl ratios of to , resembling results from the early 1980s (Herut et al., 1992). Contrastingly, the tritium concentration in precipitation continuously declined to about 4–6 TU today (IAEA/WMO, 2019). Fitting the hydrogeological trichotomy of the study area well, analytical results (Table 2) resemble the regional situation and group according to the individual aquifers (Fig. 3).
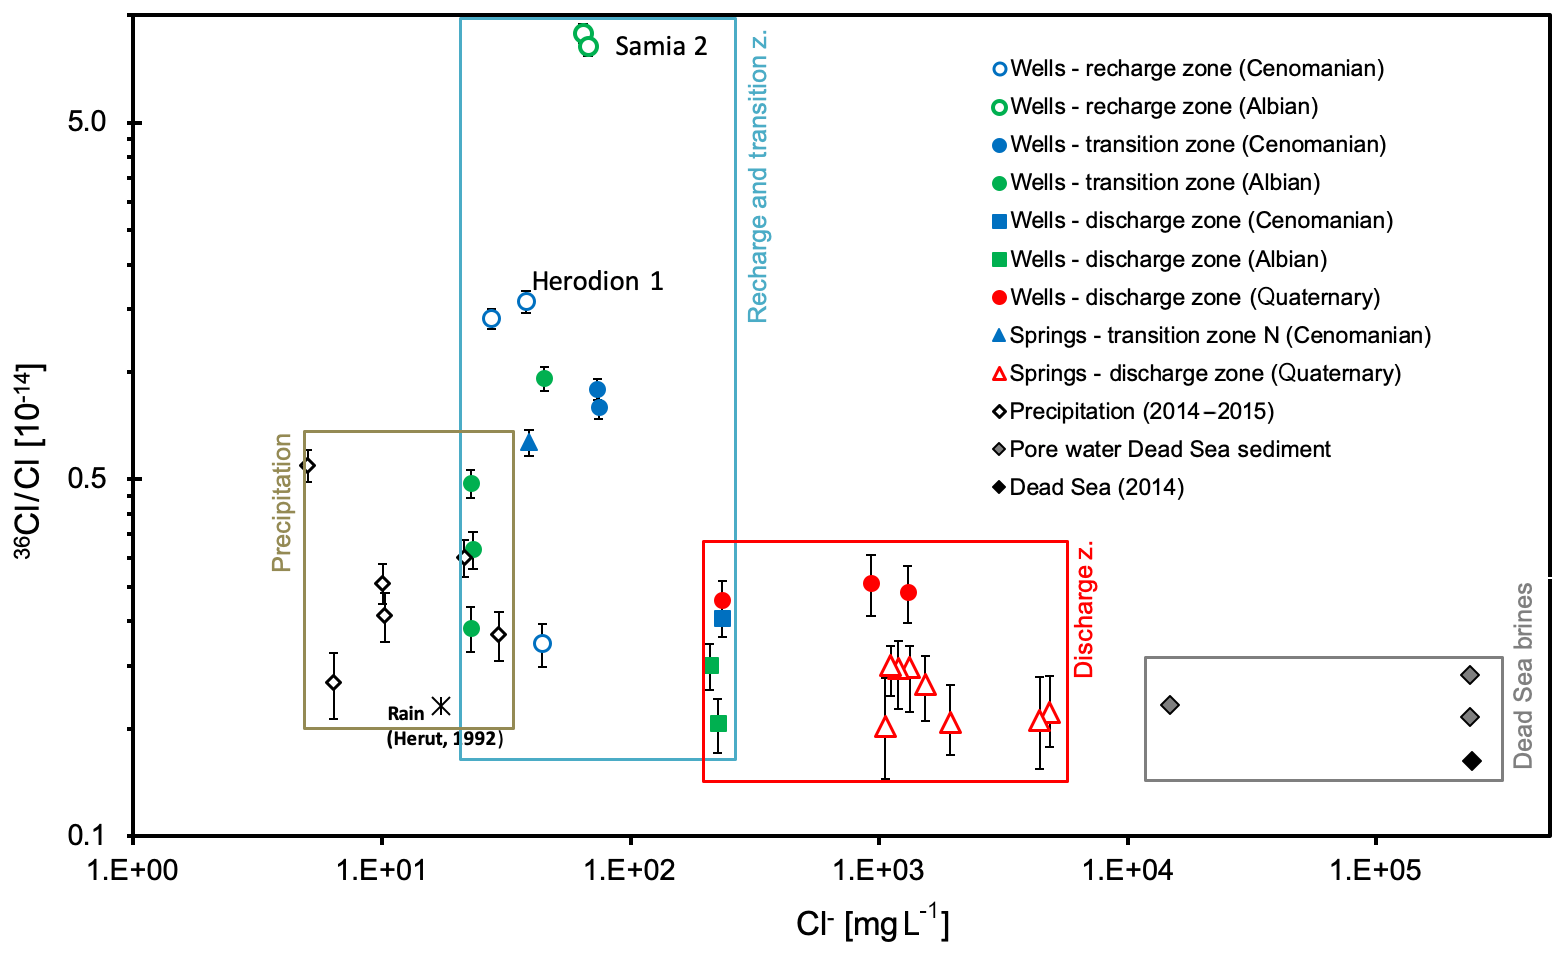
Figure 3Results of 36Cl ∕ Cl vs. chloride concentrations in the investigation area in log scale.
3.1 Recharge area
In the wells Samia 2 and Herodion 1, representative for the recharge area of the Upper Cenomanian aquifer, tritium concentrations of 2.1 and 1.2 TU as well as 36Cl ∕ Cl values of and , respectively, are observable. Further south, in the well Al Rehiyya, groundwater in the aquifer show lower 36Cl ∕ Cl and 3H values of and <0.5 TU, respectively. The gas tracer concentration in that part of the aquifer is low but detectable and showed fmol L−1, CFC-11 = 2.3±0.3 pmol L−1, CFC-12 = 1.2±0.1 pmol L−1 and CFC-113 = 0.19±0.05 pmol L−1 in Samia 2 and comparable values in Herodion 1 (Table 1). The well Jerusalem 1, which represents the Lower Cenomanian aquifer extract groundwater, showed 3H concentrations (1.7 TU) as low as those observable in the upper aquifer, but it had much higher 36Cl ∕ Cl values ().
3.2 Transition zone
Groundwater, emerging from the perched Turonian aquifer (Ein Auja) and from the Upper Cenomanian aquifer (Mizpe Jericho 2), shows a low 36Cl ∕ Cl ratio of and and 3H concentrations of 2.9 and 1.4 TU, respectively. The well Mizpe Jericho 2 stands out due to its high CFC contents, reaching values of CFC-11 = 25 pmol L−1 and CFC-113 = 4 pmol L−1, higher than possible in equilibrium with the atmosphere (4.5 and 0.5 pmol L−1, respectively). Further south, the Arugot spring discharges in the upper Arugot Valley, about 300 m above the Dead Sea from the Upper Cenomanian aquifer, closely to the brim of the graben flank but within the transition zone. The emerging groundwater is high in SF6 (2.1 fmol L−1), CFC-11 (3.8 pmol L−1) and CFC-12 (1.8 pmol L−1) but contains very low 3H (0.5 TU), suggesting a well-developed karst network which allows for sufficient gas exchange of older groundwater with recent atmosphere along its flow path.
Groundwater in the Albian aquifer (wells PWA 3, Herodion 4 and Bani Naim 3) has a low concentration regarding CFCs, SF6 and 3H (<1 TU) and shows low 36Cl ∕ Cl ratios of 1.9–. An exception is well Azaria 3, at the edge between the recharge and transition zones, which shows a higher 36Cl ∕ Cl value ( than recent precipitation, much less tritium (0.5 TU) and high concentrations of CFC-12 (5.2 pmol L−1), which are again, well above values in equilibrium with the atmosphere (max 2.3 pmol L−1).
3.3 Discharge area
Groundwater from the Upper Cenomanian aquifer (Jericho 2) shows similarly low 36Cl ∕ Cl ratios of and 2 TU similar to groundwater upstream in the transition zone. In groundwaters pumped in Jericho 4 and 5 from the Albian aquifer, 36Cl ∕ Cl and 3H contents are even lower: 1.03– and <0.6 TU, respectively. These low 36Cl ∕ Cl values might result from admixing brines, which are abundant within the rift. It becomes evident in the groundwater of Ein Feshkha, where interstitial brines () hosted in the interstitial space of the Quaternary sediment, get leached by approaching fresh groundwaters and cause the lowest observable 36Cl ∕ Cl values of 1.01–.
Brackish groundwaters from the Arab wells 19-13/24A, 19-14/70 and 19-14/72, which are drilled in the graben sediments east of Jericho, show 36Cl ∕ Cl values of 2.29–, higher than the ratios in (i) fresh groundwaters from both Cretaceous aquifers (Jericho 2, 4 and 5) and (ii) Ein Feshkha, and hence, these refer to a different source of salinization.
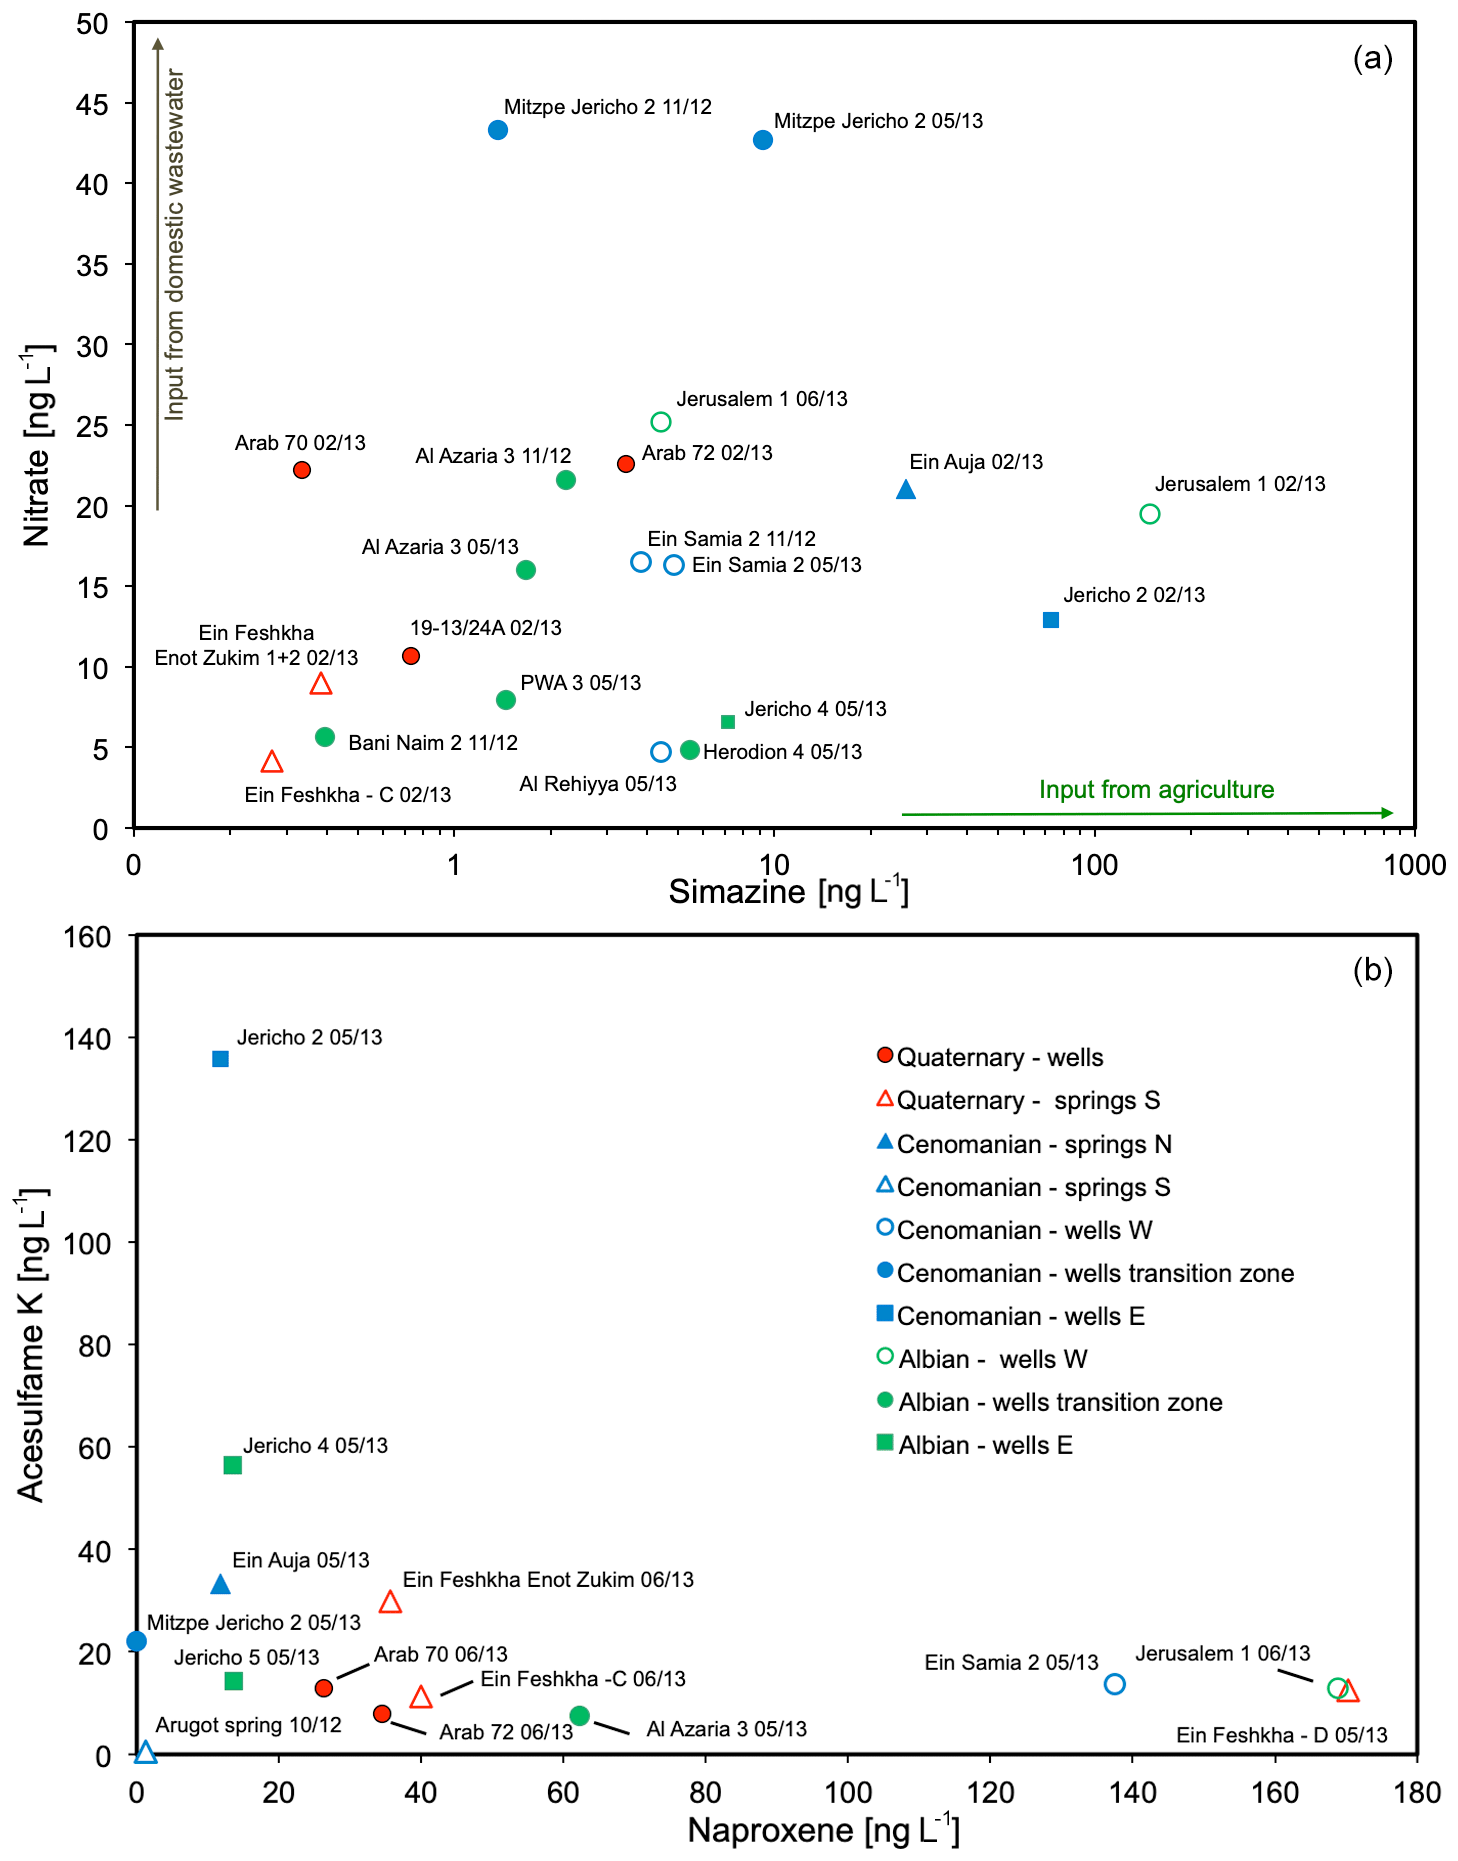
Figure 4Cross plots of (a) NO3 and simazine in sampled waters, suggesting different sources of both pollutants; the blue and green lines respectively bracket coloured spaces and indicate the fields in which samples from Upper Cenomanian and Albian aquifer plot are taken; and (b) acesulfame K and naproxen are indicators for wastewater (treated and untreated) in the sampled waters. Legend for both figures is given in (b).
In general, the following patterns can be extracted from the hydrochemical and tracer data:
- i.
spring water of the Upper Cenomanian (Ein Auja) contains groundwater infiltrated after the era of atmospheric bomb testing, indicated by tritium and 36Cl ∕ Cl values comparable with recent rain water;
- ii.
groundwater of the Upper Cenomanian close to the recharge area shows 36Cl ∕ Cl ratios higher than recent rain combined with low tritium contents, possibly referring to admixtures of water from the early fission bomb testing but before thermonuclear devices;
- iii.
along the flow path and in the lower aquifer 36Cl ∕ Cl values are shifted to lower ratios due to admixture of saline water, with the end-member being brine similar to the Dead Sea probably admixed as pore water from earlier higher sea-levels;
- iv.
the lower aquifer shows detectable admixtures of young water only in the vicinity of Jerusalem and Bethlehem, demonstrated by tritium and 36Cl ∕ Cl;
- v.
springs in the south (Ein Feshkha and Arugot) are free of tritium and show background 36Cl ∕ Cl ratios indicating no recent recharge, although SF6 and CFC values are high, as recent gas exchange in karst structures may have reset the SF6 and CFC “clocks”.
Anthropogenic organic trace substances simazine, NAP and ACE-K are detectable in trace concentrations in nearly all sampled wells of the upper and lower aquifer (Fig. 4), indicating input younger than 40 years. Combining nitrate contents with concentrations of the herbicide simazine in the sampled groundwaters allows for distinguishing between the origin of , either from domestic wastewater or from agriculture (Fig. 4a). All groundwaters show positive correlations between nitrate and simazine, while there is no clear systematic trend observable that is specific for one of the aquifers nor a specific region. Studying the samples according to aquifers suggests that groundwater in the Upper Cenomanian aquifer is more strongly influenced by wastewater inflow than groundwaters in the Albian aquifer. Groundwater from Mizpe Jericho 2, with high (43 mg L−1) values at comparably low simazine concentrations clearly underlines the contribution of wastewater. Contrastingly, groundwaters from Jericho 2 and Jerusalem 1 may refer to a higher contribution from agriculture.
Looking at ACE-K and NAP as pure wastewater indicators (Fig. 4b), two distinctly opposite trends are distinguishable. Trend 1 is characterized by very low NAP concentrations and high concentrations of ACE-K as observable in the wells Jericho 4 (56 ngL̇−1) and Jericho 2 (136 ng L−1). The opposite trend is found in Ein Feshkha spring D, Jerusalem 1 and Samia 2, with high NAP concentrations (170, 168 and 137 ng L−1, respectively) at low ACE-K concentrations (<20 ng L−1). If one excludes Ein Feshkha, NAP concentrations decrease from the recharge area (Jerusalem 1 and Samia 2) to the discharge area (Jericho 2 and 4), most probably due to adsorption onto the aquifer matrix along the flow path. As for Ein Feshkha D, the NAP contamination here is comparably high in the recharge area and much larger than the NAP contents in Ein Feshkha C and Enot Zukim. This suggests a significantly shorter residence time of the contaminant in the aquifer, which requires a source much closer to the spring, probably a leakage in the treated wastewater (TWW) pipeline, passing the area just upstream of the spring. The only groundwater without any anthropogenic contamination is the Arugot spring.
The patterns observed for the different measured substances deliver a heterogenous picture of the study area. Starting at the top, a shallow perched aquifer system with short residence times is indicated for the Ein Auja spring based on a high 36Cl ∕ Cl ratio (), tritium content (2.9 TU) and low mineralization like recent precipitation.
In the recharge area of the Cenomanian and Albian aquifers, clear indications for a contribution of recharge enriched with 36Cl from nuclear-bomb tests is observable in freshwater wells (Cl content <67 mg L−1) Jerusalem 1, Herodion 1 and Samia 2, which show 36Cl ∕ Cl values of 1.4–, which are much larger than in precipitation from after 1980 (). Furthermore, gas tracer results in Herodion 1 and Samia 2 imply that the aquifer contains groundwater recharged after 1960. Organic pollutants concretize it even more. High simazine content in Jerusalem 1 and high loads of NAP in Samia 2 and Jerusalem 1 indicate significant contamination through a young water fraction in both aquifers, the Upper Cenomanian and the Albian.
Within the transition zone, the wells Al Azaria 3 (Albian) and Mizpe Jericho 2 (Upper Cenomanian) show 36Cl ∕ Cl values still larger than in precipitation from the last four decades, indicating at least similar or even older recharge periods than of groundwater in the recharge zone. However, high concentrations of CFC-11 and ACE-K in Mizpe Jericho 2 and high concentrations of CFC-12 and NAP in Al Zaria 3 also show a significant contribution of the young (waste-)water fraction to these wells. Contrastingly, anthropogenic gas tracers are close to or even below the limit of detection in groundwater samples from Albian aquifer at the wells PWA 3, Herodion 4 and Bani Naim 3, indicating no freshwater input from the last decades and travel times longer than 70 years. A similar figure results from taking these three wells and forming a N–S transect through the Albian aquifer in the mountain range: their low 36Cl ∕ Cl ratios, which are well within the range of recent precipitation, decrease from north to south, while chloride remains stable. Since the 3H content is below the limit of detection (<0.5 TU), the observed groundwaters are considered to be mainly pre-bomb water and hence older than 6–7 decades.
In the southern part of the study area, survey stations are even rarer. However, the well Al Rehiyya shows very low 36Cl ∕ Cl and low 3H values, indicating either unmixed pre-bomb water or the dilution of recent precipitation with much older water possibly originating from aquifer parts even further southwards. The latter is promoted by results from numerical flow modelling, which indicate an SW–NE-directed upstream flow (Laronne Ben-Itzhak and Gvirtzman, 2005; Gräbe et al., 2013). Negligible concentrations of NAP, ACE-K and simazine in Arugot spring water, which emerges at the furthest end of the southern transition zone, show no anthropogenic contamination by wastewater. This leads to the assumption that open karst conduits allow for efficient exchange with the atmosphere along the subsurface flow of the spring water, resulting in CFC-11 and CFC-12 content in equilibrium with the atmosphere.
Groundwaters from the Albian (Jericho wells 4 and 5) and from Upper Cenomanian (Jericho 2) in the discharge area are characterized by values. While the former are free of tritium, Jericho 2 shows 2 TU, indicating at least a fraction of younger water. Since the well Jericho 2 is drilled directly at the mouth of the Qilt Valley, we assume that the young water fraction may reach the well through rapid infiltration through fractures and karst conduits within the valley. The young water fraction in Jericho 2 is also proven by a high simazine and ACE-K concentration in the groundwater of that well.
Low 36Cl ∕ Cl ratios in the wells drilled into the Quaternary section east of Jericho (ca. ) and in the Ein Feshkha springs (ca. ) refer to the enrichment of fresh groundwater with different sources of salinity, showing low 36Cl ∕ Cl ratios. The brackish wells east of Jericho are known to draw groundwater from the Upper Cenomanian aquifer (Khayat et al., 2006a), which passes the graben fault and enters into the sediment body, where it may leach abundant evaporitic minerals. It also contains water from agricultural irrigation and wastewater as confirmed by high NO3 concentrations, the presence of simazine and occasionally remarkable ACE-K content.
Contrastingly, Dead Sea brines, which get released from the sedimentary body, mix in Ein Feshkha with approaching fresh groundwaters from the graben shoulder. The low 3H (<1 TU) values in Ein Feshkha indicate the age of the admixing Dead Sea brine to be before 1960. During that time, lake level was at −390 m m.s.l. and higher (Hassan and Klein, 2002). At the time, Dead Sea brine infiltrated into the shallow lake bed, where nowadays the observed springs emerge, at an elevation of −392 to −395 m m.s.l. However, the Ein Feshkha springs C and D and Enot Zukim receive young water fractions, since NAP and ACE-K contents in the former are as high as in groundwater in the recharge zone (Jerusalem 1) and in the latter at least enhanced.
The next section will exemplify a more detailed modelling of mean residence times with transient tracers where the data allow for this approach. This was possible only on two wells. The wells of the Albian aquifer in the transition zone are not interpreted using LPM due to contamination with CFCs (e.g. Al Azaria 3 and Table 1) or very low concentrations of anthropogenic gases (e.g. Bani Naim 3). If the measured concentrations of the anthropogenic trace gases CFCs and SF6 are much higher than expected from the solubility equilibrium with the atmosphere, this is regarded as contamination (e.g. Mizpe Jericho 2). The tritium concentrations of 1.5 and 2 TU in Mizpe Jericho 2 and Jericho 2, respectively, indicate a reasonable fraction of recent rain. Due to the continuous outflow of the springs along the coastline and chemical mixing patterns of the spring water, it is assumed that there is also a connection to the water resources of the Lower Cretaceous aquifer, which could provide water with longer residence times. All springs in the discharge area (e.g. Ein Feshkha) have values less than 0.5 TU and a 36Cl ∕ Cl value of . However, the organic tracers ACE-K, simazine and NAP are also detectable also in these springs. Their values in Ein Feshkha are between 5 to 30 times above the detection limit (Table 1 and Sect. 2.2). Since the input function of the organic tracers, cannot be quantified, the fraction of young water, representing that concentration cannot be calculated. This discrepancy (no tritium and no anthropogenic 36Cl but including organic tracers) can be understood by quantifying the detection limit of “young water” that tritium allows: recent rain in the area has 4 TU, so a value of <0.5 TU is equivalent to less than 12 % of recent rain. This implies the young end-member in the mixture must have a concentration of ACE-K, simazine and NAP > 10 times higher than that measured in the groundwater samples. A more precise quantification of the young water fraction in these springs is only possible with either a lower detection limit for tritium (e.g. determination of 3H via ingrowth with a detection limit of 0.005 TU) (Bayer et al., 1989; Beyerle et al., 2000; Sültenfuß et al., 2009) or a precise quantification of the input of ACE-K, simazine and NAP. Both are beyond the scope of the present study.
4.1 Lumped parameter modelling: delay of gas tracer in the unsaturated zone
The detailed lumped parameter modelling of tritium, 36Cl ∕ Cl and the gas tracers was performed only for the wells Samia 2 and Herodion 1 since only for these there is a consistent data set for all tracers (Table 1). Earlier interpretation of groundwater hydraulics based on groundwater level measurements determined a very fast transfer velocity of the water phase through karst holes to the groundwater table (Jabreen et al., 2018). LPM was therefore done in several steps. First a mean residence time in agreement with measured values for tritium and the bomb spike of 36Cl ∕ Cl values was derived. Then a delay for the gas tracers CFCs and SF6 was derived assuming a simple piston flow transport to describe the residence time of these tracers in the unsaturated zone. Once the delay created an agreement between the water-bound tracer tritium and 36Cl ∕ Cl values with the gas tracers CFC-11, CFC-12, CFC-113 and SF6, the mean residence time in the saturated zone was investigated using the PM, DM and PEM to describe flow in the saturated zone. From the MRT in the saturated zone, groundwater recharge was estimated in a final step and compared with results from the CMB method and earlier numerical groundwater models.
Results for tritium and 36Cl ∕ Cl values fit to MRT of about 10 years in the saturated zone using the PM, the dispersion model results for a 20-year MRT and for the partial exponential model 16- and 20-year MRTs are estimated (Table 4). These estimated MRT values of the water-bound tracers then allowed for determining the gas delay in the unsaturated zone. For every applied model (PM, PEM and DM) the gas delay is estimated using the calculated model curve of the water-bound tracers and using the delay as a parameter to fit the gas tracer measurements of Samia 2 and Herodion 1. This resulted in specific gas delays for every concentration of the CFCs and SF6, exemplified for CFC-12 in Fig. 5 and provided for all gas tracers in Table 3.
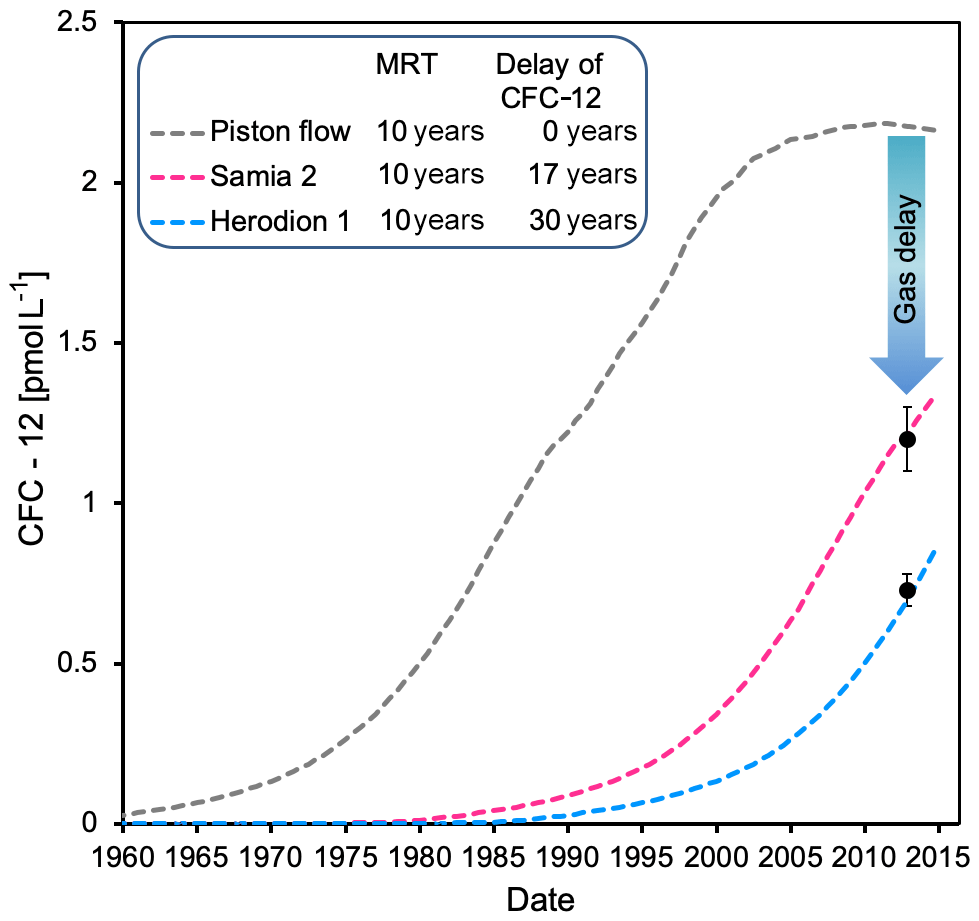
Figure 5In a CFC-12 vs. time plot, a piston flow model with an MRT of 10 years obtained from the water-bound tracer tritium and 36Cl ∕ Cl fits the CFC-12 measurements with a gas delay of 17 years for Samia 2 and 30 years for Herodion 1.
Table 3Summary of gas delay in the unsaturated zone for each gas tracer and the different models. PM: piston flow model; DM: dispersion model; PEM: partial exponential model. For the parameters of the PEM, see Table 2.
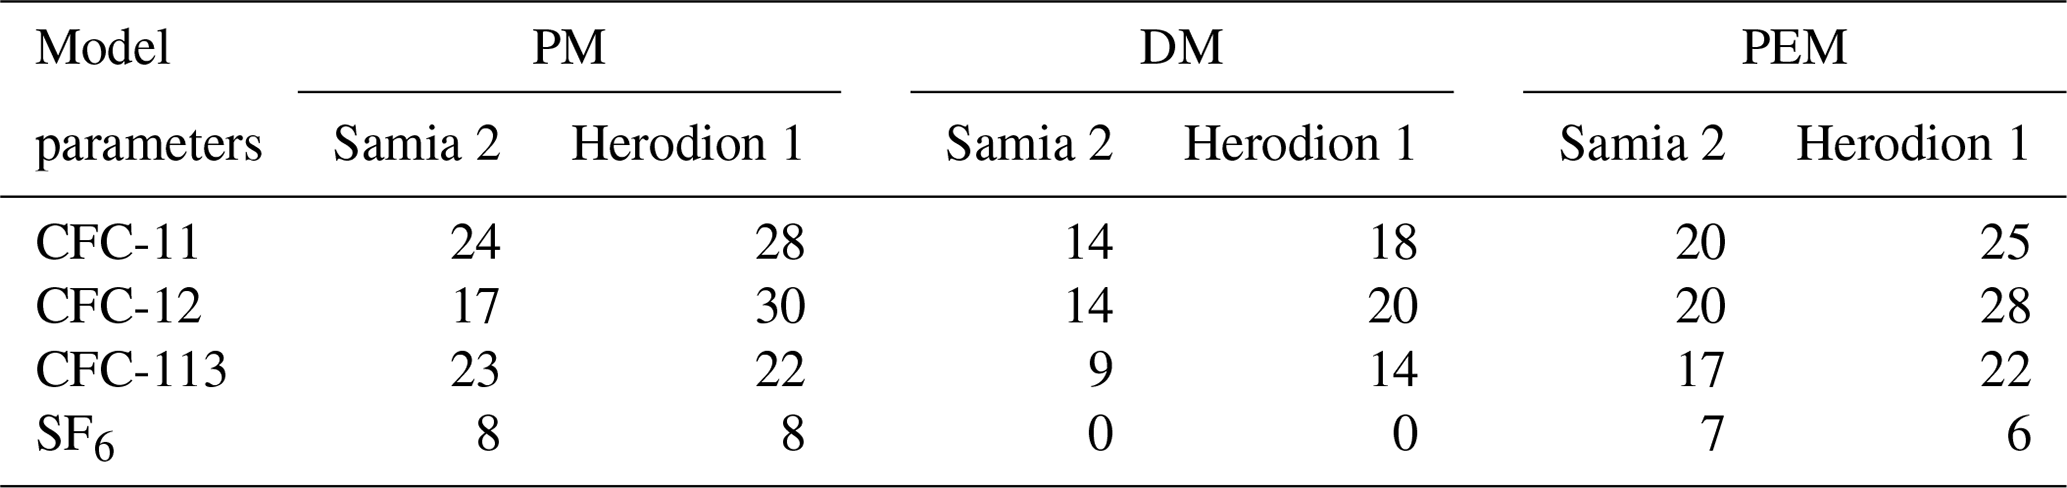
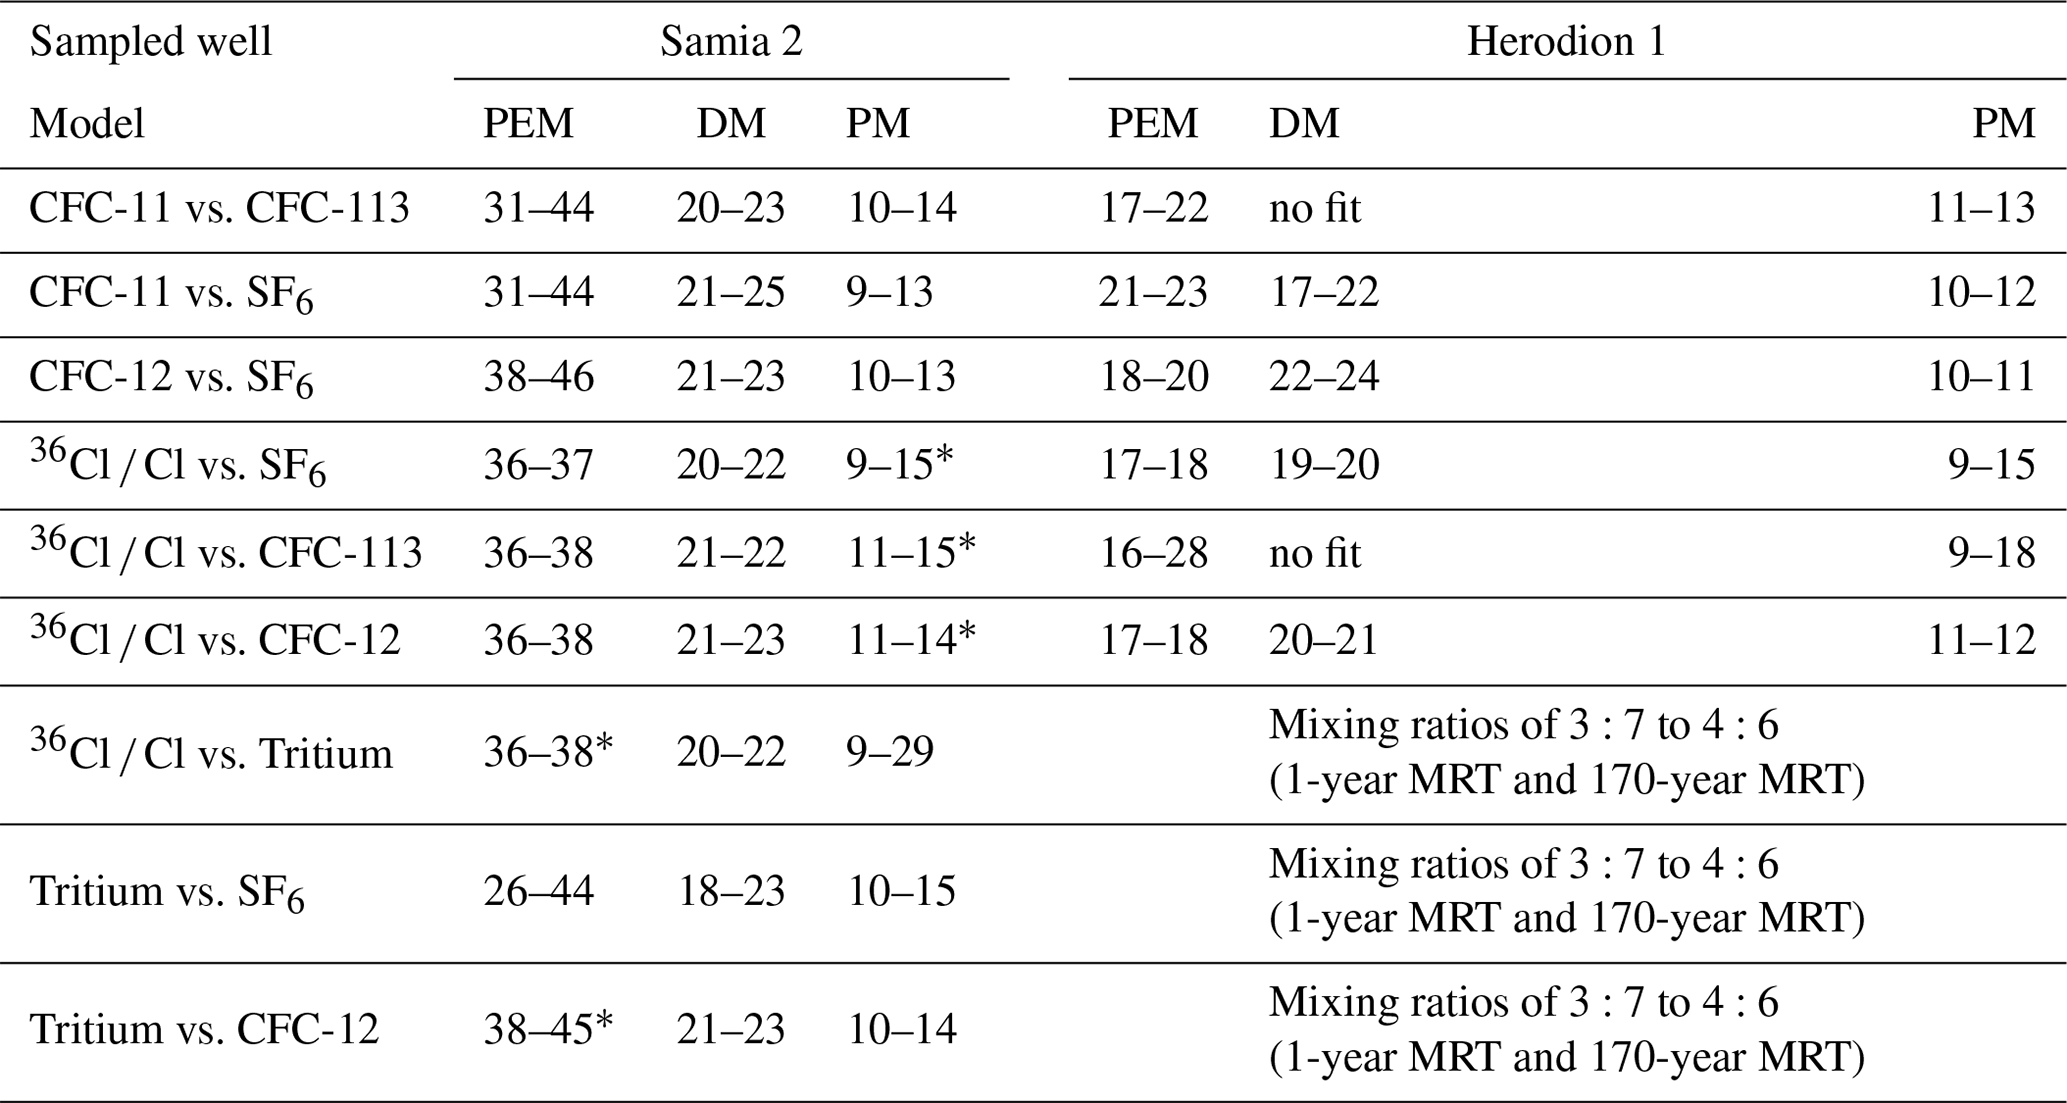
Table 4Summary of modelled MRTs of Samia 2 and Herodion 1 extracted from different tracer combinations. PM: piston flow model; DM: dispersion model; PEM: partial exponential model. * Estimated fit.
Estimates for every model result in different gas delays are related to the MRT of water-bound tracers in the wells Samia 2 and Herodion 1 (Table 3). The delays of the CFCs are comparable to each other and differ from 14 to 24 years for Samia 2 (Fig. 5) and from 14 to 30 years for Herodion 1 over all calculated models. The gas delay in Samia 2 is lower than in Herodion 1, which is reasonable regarding the thicker unsaturated zone in Herodion 1 (Table 2). Ideally the transport of gas tracers in the subsurface would result in similar delays for all gas tracers (Cook and Solomon, 1995). The delay determined for SF6 was significantly lower than for the CFCs (Table 3), indicating higher concentrations of SF6 as compared to the expectation from the CFC model results. This could be a result of biological degradation of the CFCs in the upper part of the unsaturated karst zone or from considerable excess air, which influences SF6 much more than the CFCs. A decision between these two processes is possible determining excess air independently measuring the concentrations of all noble gases, which were not available in the present study.
4.2 Lumped parameter modelling: mean residence times in the saturated zone
In the next step, the determined gas delays of the gas tracers (Table 3) in the unsaturated zone were used to estimate the MRT of the water-bound tracers and the gas tracers in the saturated zone. Only the gas delay allowed for a fit to the measurement combination of the gas tracer concentrations and the water tracer results of Samia 2 in the time range of 10 to 15 years for the MRT for the piston flow model, 17 to 28 years for the MRT for the dispersion model and 26 to 46 years for the partial exponential model (Table 4). Comparing the different model approaches, estimates of the saturated MRT systematically increase in the sequence of PM to DM to PEM in both wells, which is a result of the increasing amount of dispersion and mixing in these models.
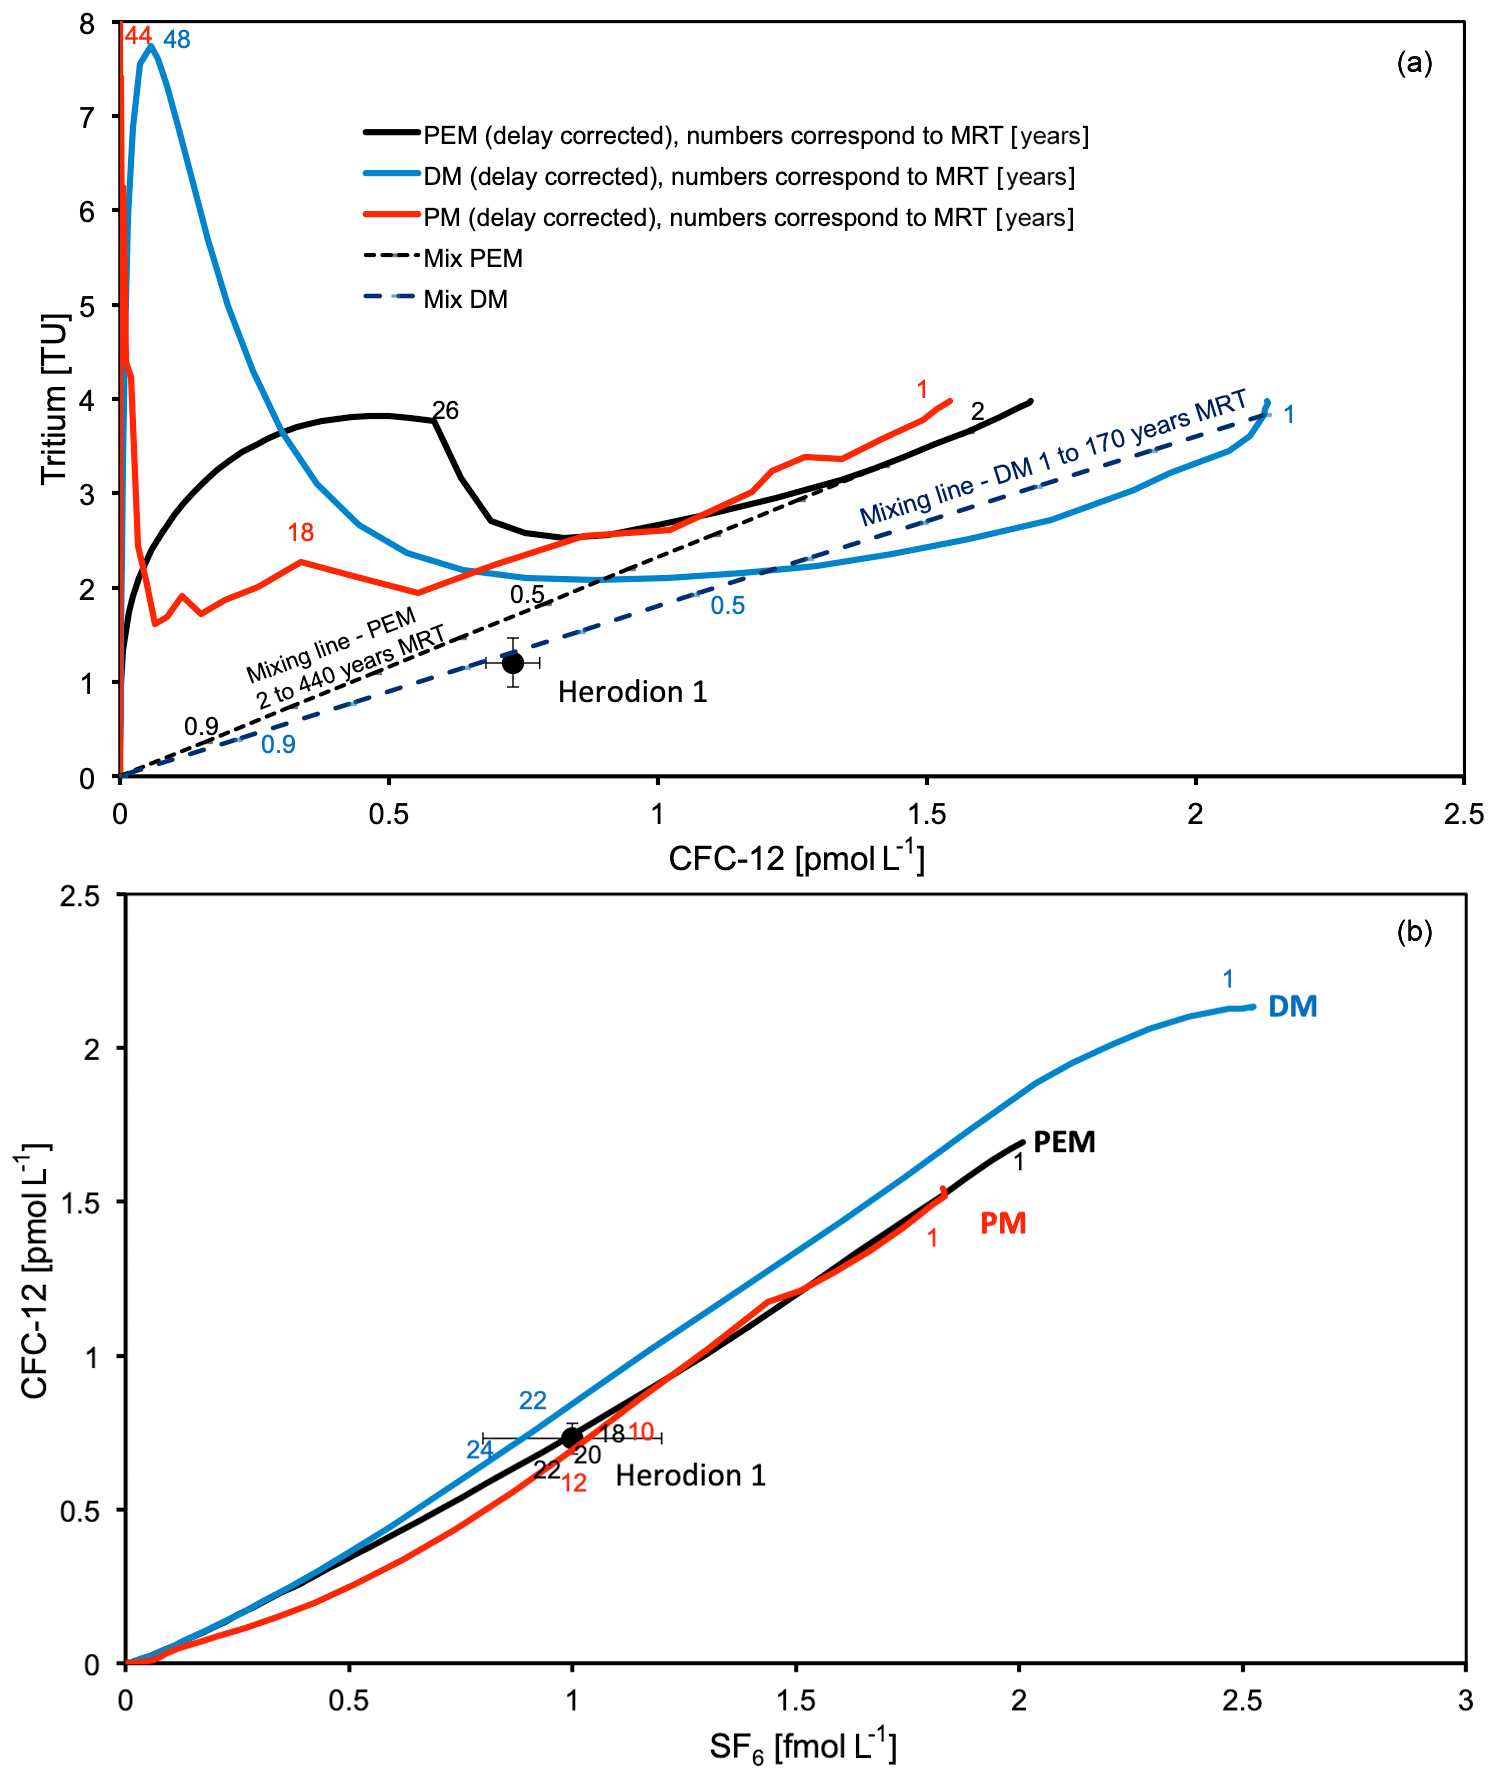
Figure 6Modelling results for groundwater from the Herodion 1 well, applying PM (red), PEM (black) and DM (blue) and (a) tritium vs. CFC-12 and (b) CFC-12 vs. SF6. The calculated delays of CFC-12 are 30, 20, and 28 years according to the models PM, DM and PEM, respectively (ref. Table 3).
In contrast to Samia 2, it was not possible to fit the results of Herodion 1 without an admixture of tracer-free old water. With and without delay the lumped parameter curves do not fit the measurements of the lower tritium concentration in Herodion 1 (1.2 TU), whereas they do for Samia 2. The well Herodion 1 is situated in the recharge zone, but it is also in the lower part of the Upper Cenomanian aquifer. The model results therefore indicate an admixture of at least one older water component ascending from the Albian aquifer and diluting the younger tritium concentrations. This can be described with a mixing line of two end-members, which fits the tritium measurement of Herodion 1 (Fig. 6).
4.3 Recharge rates and dual porosity
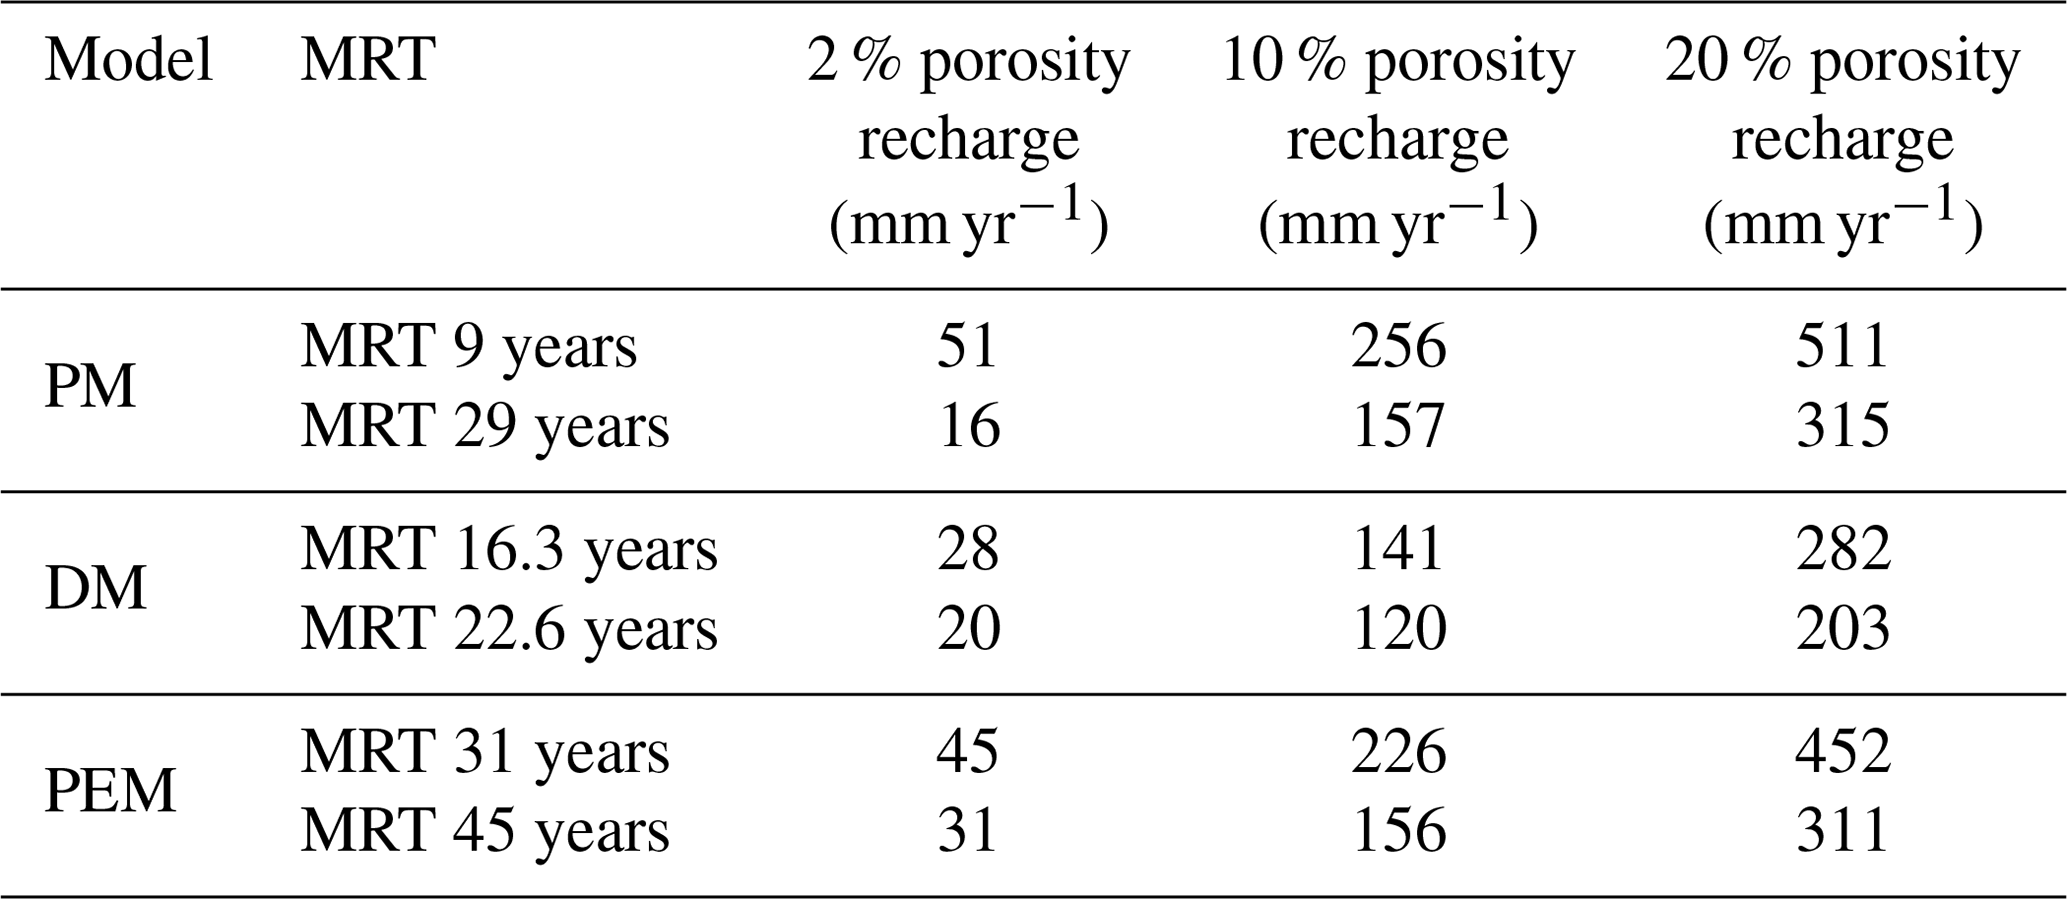
The mean residence times resulting from the lumped parameter models PM, DM and PEM in Table 4 were used to calculate recharge rates according to Eqs. (4) and (5). Within a single LPM the MRT have uncertainties in the range of 50 %, and this uncertainty increases to approximately a factor of 2 if all models are regarded as equally probable (Table 4). Therefore, a major uncertainty for the calculation of recharge results from the unknown porosity of the karst aquifer, which is estimated to be somewhere between 2 % and 20 %, creating an additional uncertainty of a factor of 10. It is therefore useful to consider whether this uncertainty can be further restricted.
Table 5Results of recharge rates (mm yr−1) based on the maximum and minimum of the estimated MRT (years) obtained from PM, DM and PEM for Samia 2.
Recharges rates from chloride mass balance highly depend on the value used for chloride in precipitation since the chloride concentration in the Cenomanian aquifer for youngest groundwater (tritium > 1.5 TU) varies only by 22 % between 28 and 44 mg L−1 (Table 1). The Cl− values measured in precipitation during the present study vary between 5 and 30 mg L−1 resulting in a spread between 62 and 375 mm yr−1 for the recharge derived from CMB according to Eq. (7), assuming an average precipitation amount of 550 mm yr−1. This is comparable to recharge rates used in numerical flow modelling studies of the eastern groundwater catchment at the Dead Sea, which estimated 124–292 mm yr−1 (Guttman, 2000) and 100–300 mm yr−1 (Gräbe et al., 2013) in the mountainous recharge area.
Tracer-derived recharge values compare best with the recharge estimates from CMB and numerical modelling if a porosity of 10 % is assumed (Table 5). The tracer-derived values for 20 % porosity are in the range of 40 % to 100 % of the mean annual precipitation of Jerusalem, and especially the latter value seems unrealistically high. The highest values originate from the PM and the PEM. The PM neglects mixing and retardation along the flow path completely, which of course is the least probable assumption. The PEM, however, considers mixing in the well, but it relies on the flow system being extremely homogeneous, as in the “Vogel” aquifer (Vogel, 1967; Jurgens et al., 2016). A few preferential flow paths can easily disturb this picture towards smaller MRT values and thus larger recharge values. An indication of why the tracer-derived recharge values using 2 % porosity are unrealistically low comes from the hydrogeology of the karst aquifer itself. The 2 % porosity can be attributed to structural fractures and macropores in the limestone, which account for the rapid reaction of the groundwater surface to precipitation events (Jabreen et al., 2018). However, according to Eq. (5) the tracers are not expected to indicate this flow, but they would be retarded by diffusion of the tracer into and out of the rock matrix (Maloszewski et al., 2004; Purtschert et al., 2013; Suckow et al., 2019). This means the tracers never “see” only the 2 % fracture and macropore space of the karst but also at least a part of the total rock matrix with its total porosity of 20 %. If the effective porosity in the karst system is 2 % and the total porosity is 20 %, the retardation factor according to Eq. (5) would be 10. Applied to the lumped parameter models, this retardation means that the calculated MRT values are too old, and the calculated recharge rates with 2 % porosity are too low.
The present study derived groundwater flow patterns, mixing end-members, transport times and recharge estimates in the upper and lower Cretaceous aquifers of the EMA between the recharge area around the central mountain ridge and the discharge zones close to the lower Jordan Valley and the Dead Sea, shared by Israel and Palestine. This was possible, despite a very low number of measurements and a complicated karst hydrogeological setting, using a powerful combination of multiple lines of evidence from hydrogeology, hydrochemistry, anthropogenic organic trace substances and classical environmental age-dating tracers like tritium, CFCs, SF6 and 36Cl ∕ Cl values. The present study is one of presently only a handful demonstrating the useful application of atmospheric bomb-test-derived 36Cl to study groundwater movement. The lower Cretaceous aquifer was found to be basically free of tritium and other anthropogenic environmental tracers like CFCs, SF6 and bomb-derived 36Cl and, therefore, it has groundwater transport times larger than 50 years. Groundwater in the upper Cretaceous aquifer contains anthropogenic trace substances, indicating time scales of groundwater flow of a few decades and shows clear indications of preferential flow paths as expected for karstified groundwater systems. In two springs the combination of several environmental tracers (3H, bomb-derived 36Cl, CFC-11, CFC-12, CFC-113 and SF6) allowed for estimates of the mean residence time in the saturated zone, gas transfer delays in the unsaturated zone and mixing ratios with older groundwater. These estimates were confirmed by anthropogenic substances from agriculture (nitrate and pesticides like simazine), pain killers (naproxen) and sweeteners (acesulfame K). Calculated recharge rates based on MRT estimates compare well with chloride mass balance and numerical flow modelling. The multi-tracer methodology presented here is applicable in other data-sparse areas with complex hydrogeology (karst or fractured) with or without anthropogenic influence.
The data on which the study is based are given in the paper (Table 1).
CW, TR, BM and CS outlined and conducted field work. SM, SP and GR conducted AMS measurements. CW, ASu and CS analysed the data. BM, TR, UM, CM, ASa and SMW were involved in discussion process. CW, ASu and CS wrote the paper. All authors revised the paper and approved the final version.
The authors declare that they have no conflict of interest.
This article is part of the special issue “Environmental changes and hazards in the Dead Sea region (NHESS/ACP/HESS/SE inter-journal SI)”. It does not belong to a conference.
The authors are grateful for the support of the project, which was partly covered by the SUMAR project and funded by the German Ministry of Education and Research (grant code: 02WM0848) and the DESERVE Virtual Institute (grant code VH-VI527), which is itself funded by the Helmholtz Association of German Research Centres. We wish to thank Yossi Yechieli (GSI) for hosting and fruitful discussions, Avner Ayalon (GSI) for sampling recent precipitation, Joseph Guttman (Mekorot) for fruitful discussions and access to Mekorot wells and Marwan Hadidoun (PWA) for enabling sampling at PWA wells. We also thank the Israel Hydrological Survey for providing support and well data. Parts of this research were carried out at the Ion Beam Center at the Helmholtz-Zentrum Dresden-Rossendorf e.V., a member of the Helmholtz Association. We hence thank Santiago Miguel Enamorado Baez, René Ziegenrücker and the DREAMS operator team for supporting the AMS measurements. The authors thank Joseph Guttman and Nathan A. Sheffer for their constructive reviews and Efrat Morin for efficiently handling the paper.
This research has been supported by the Helmholtz Association (grant no. VH-VI527), the Federal Ministry of Education and Research (BMBF; grant no. 02WM0848) and the BMBF-MOST (grant no. YSEP111).
The article processing charges for this open-access
publication were covered by a Research
Centre of the Helmholtz Association.
This paper was edited by Efrat Morin and reviewed by Joseph Guttman and Nathan A. Sheffer.
Akhmadaliev, S., Heller, R., Hanf, D., Rugel, G., and Merchel, S.: The new 6MV AMS-facility DREAMS at Dresden, Nucl. Instrum. Meth. Phys. Res. Sect. B, 294, 5–10, 2013.
Allison, G. and Hughes, M.: The use of environmental chloride and tritium to estimate total recharge to an unconfined aquifer, Soil Res., 16, 181–195, 1978.
Alvarado, J. C., Purtschert, R., Hinsby, K., Troldborg, L., Hofer, M., and Kipfer, R., Aeschbach-Hertig, W., and Arno-Synal, H.: 36Cl in modern groundwater dated by a multi-tracer approach (3H∕3He, SF6, CFC-12 and 85Kr): A case study in quaternary sand aquifers in the Odense Pilot River Basin, Denmark, Appl. Geochem., 20, 599–609, 2005.
Arany, E., Szabó, R. K., Apáti, L., Alapi, T., Ilisz, I., Mazellier, P., Dombi, A., and Gajda-Schrantz, K.: Degradation of naproxen by UV, VUV photolysis and their combination, J. Hazard. Mater., 262, 151–157, 2013.
Avrahamov, N., Yechieli, Y., Purtschert, R., Levy, Y., Sültenfuß, J., Vergnaud, V., and Burg, A.: Characterization of a carbonate karstic aquifer flow system using multiple radioactive noble gases (3H-3He, 85Kr, 39Ar) and 14C as environmental tracers, Geochim. Cosmochim. Ac., 242, 213–232, 2018.
Bakalowicz, M.: Karst groundwater: a challenge for new resources, Hydrogeol. J., 13, 148–160, 2005.
Bayer, R., Schlosser, P., Bönisch, G., Rupp, H., Zaucker, F., and Zimmek, G.: Performance and blank components of a mass spectrometric system for routine measurement of helium isotopes and tritium by the 3He ingrowth method, Sitzungsberichte der Heidelberger Akademie der Wissenschaften, Mathematisch-naturwissenschaftliche Klasse, 5, 241–279, 1989.
Begin: Geological map of Israel, Jericho, Sheet 9-III, , with Explanatory Notes, Geological Survey of Israel, Jerusalem, 1974.
Bentley, H. W., Phillips, F. M., Davis, S. N., Habermehl, M. A., Airey, P. L., Calf, G. E., Elmore, D., Gove, H. E., and Torgersen, T.: Chlorine 36 Dating of Very Old Groundwater 1. The Great Artesian Basin, Australia, Water Resour. Res., 22, 1991–2001, 1986.
Berman, T., Isabella, K., and Shay, R.: Environmental Health in Israel 2014, Ministry of Health, Jerusalem, 2014.
Beyerle, U., Aeschbach-Hertig, W., Imboden, D. M., Baur, H., Graf, T., and Kipfer, R.: A Mass Spectrometric System for the Analysis of Noble Gases and Tritium from Water Samples, Environ. Sci. Technol., 34, 2042–2050, 2000.
Buerge, I. J. and Poiger, T.: Acesulfame: from sugar substitute to wastewater marker, CHIMIA Int. J. Chem., 65, 176, 2011.
Bullister, J. and Weiss, R.: Determination of CCl3F and CCl2F2 in seawater and air, Deep-Sea Res. Pt. A, 35, 839–853, 1988.
Chefetz, B., Mualem, T., and Ben-Ari, J.: Sorption and mobility of pharmaceutical compounds in soil irrigated with reclaimed wastewater, Chemosphere, 73, 1335–1343, 2008.
Cook, P. G., and Herczeg, A. L. (Eds.): Environmental Tracers in Subsurface Hydrology, Kluwer Academic Press, Boston, Massachussetts, 552 pp., 2000.
Cook, P. G. and Solomon, D. K.: Transport of atmospheric trace gases to the water table: Implications for groundwater dating with chlorofluorocarbons and krypton 85, Water Resour. Res., 31, 263–270, 1995.
Cook, P. G. and Solomon, D. K.: Recent advances in dating young groundwater: chlorofluorocarbons, 3H3He and 85Kr, J. Hydrol., 191, 245–265, 1997.
Cook, P. G., Solomon, D. K., Plummer, L. N., Busenberg, E., and Schiff, S. L.: Chlorofluorocarbons as Tracers of Groundwater Transport Processes in a Shallow, Silty Sand Aquifer, Water Resour. Res., 31, 425–434, 1995.
Crosbie, R. S., Peeters, L. J. M., Herron, N., McVicar, T. R., and Herr, A.: Estimating groundwater recharge and its associated uncertainty: Use of regression kriging and the chloride mass balance method, J. Hydrol., 561, 1063–1080, 2018.
Darling, W. G. and Gooddy, D. C.: Assessing the applicability of global CFC and SF6 input functions to groundwater dating in the UK, Sci. Total Environ., 387, 353–362, 2007.
Davis, S. N., Bentley, H. W., Phillips, F. M., and Elmore, D.: Use of cosmic-ray produced radionuclides in hydrogeology, EOS Earth Space Sci. News, 64, 283, 1983.
Engesgaard, P., Højberg, A. L., Hinsby, K., Jensen, K. H., Laier, T., Larsen, F., Busenberg, E., and Plummer, L. N.: Transport and Time Lag of Chlorofluorocarbon Gases in the Unsaturated Zone, Rabis Creek, Denmark, Vadose Zone J., 3, 1249–1261, 2004.
Eriksson, E. and Khunakasem, V.: Chloride concentration in groundwater, recharge rate and rate of deposition of chloride in the Israel Coastal Plain, J. Hydrol., 7, 178–197, 1969.
Ford, D. and Williams, P.: Introduction to Karst, Karst Hydrogeology and Geomorphology, The Atrium, Southern Gate, Chichester, West Sussex, England, 1–8, 2007.
Garfunkel, Z., Zak, I., and Freund, R.: Active faulting in the Dead Sea Rift, Tectonophysics, 80, 1–26, 1981.
Ghanem, M.: Hydrogeology and hydrochemistry of the Faria drainage basin/West Bank, 1999, Inst. für Geologie, Bergakademie Technical University of Freiberg, Freiberg, 1999.
Gooddy, D. C., Darling, W. G., Abesser, C., and Lapworth, D. J.: Using chlorofluorocarbons (CFCs) and sulphur hexafluoride (SF6) to characterise groundwater movement and residence time in a lowland Chalk catchment, J. Hydrol., 330, 44–52, 2006.
Gräbe, A., Rödiger, T., Rink, K., Fischer, T., Sun, F., Wang, W., Siebert, C., and Kolditz, O.: Numerical analysis of the groundwater regime in the western Dead Sea escarpment, Israel and West Bank, Environ. Earth Sci., 69, 571–585, 2013.
Guttman, J.: Multi-lateral project B: hydrogeology of the eastern aquifer in the Judea Hills and Jordan Valley, Report 468, Mekorot Water Company, Tel Aviv, Israel, 36 pp., 2000.
Guttman, Y., Flexer, A., Hötzl, H., Bensabat, J., Ali, W., and Yellin-Dror, A.: A 3-D hydrogeological model in the arid zone of Marsaba-Feshchah region, Israel, 1510–1513, 2004.
Hassan, M. A. and Klein, M.: Fluvial adjustment of the Lower Jordan River to a drop in the Dead Sea level, Geomorphology, 45, 21–33, https://doi.org/10.1016/S0169-555X(01)00187-8, 2002.
Heikkilä, U., Beer, J., Feichter, J., Alfimov, V., Synal, H.-A., Schotterer, U., Eichler, A., Schwikowski, M., and Thompson, L.: 36Cl bomb peak: comparison of modeled and measured data, Atmos. Chem. Phys., 9, 4145–4156, https://doi.org/10.5194/acp-9-4145-2009, 2009.
Herut, B., Starinsky, A., Katz, A., Paul, M., Boaretto, E., and Berkovits, D.: 36Cl in chloride-rich rainwater, Israel, Earth Planet. Sc. Lett., 109, 179–183, 1992.
Huysmans, M. and Dassargues, A.: Review of the use of Péclet numbers to determine the relative importance of advection and diffusion in low permeability environments, Hydrogeol. J., 13, 895–904, 2005.
IAEA: Use of Chlorofluorocarbons in Hydrology. A Guidebook, International Atomic Energy Agency, Vienna, 2006.
IAEA/WMO: Global Network of Isotopes in Precipitation, The GNIP Database, available at: http://www.iaea.org/water, last access: 12 January 2019.
Jabreen, H., Wohnlich, S., Banning, A., Wisotzky, F., Niedermayer, A., and Ghanem, M.: Recharge, geochemical processes and water quality in karst aquifers: Central West Bank, Palestine, Environ. Earth Sci., 77, 261, https://doi.org/10.1007/s12665-018-7440-4, 2018.
Jurgens, B. C., Böhlke, J. K., Kauffman, L. J., Belitz, K., and Esser, B. K.: A partial exponential lumped parameter model to evaluate groundwater age distributions and nitrate trends in long-screened wells, J. Hydrol., 543, 109–126, 2016.
Katz, A. and Kolodny, N.: Hypersaline brine diagenesis and evolution in the Dead Sea-Lake Lisan system (Israel), Geochim. Cosmochim. Ac., 53, 59–67, 1989.
Khayat, S., Hoetzl, H., Geyer, S., and Ali, W.: Hydrochemical investigation of water from the Pleistocene wells and springs, Jericho area, Palestine, Hydrogeol. J., 14, 192–202, 2006a.
Khayat, S., Hoetzl, H., Geyer, S., Ali, W., Knoller, K., and Strauch, G.: Sulphur and oxygen isotopic characters of dissolved sulphate in groundwater from the Pleistocene aquifer in the southern Jordan Valley (Jericho area, Palestine), Isotop. Environ. Health Stud., 42, 289–302, 2006b.
Klein-BenDavid, O., Sass, E., and Katz, A.: The evolution of marine evaporitic brines in inland basins: The Jordan-Dead Sea Rift valley, Geochim. Cosmochim. Ac., 68, 1763–1775, 2004.
Lange, T: Tracing Flow and Salinization Processes at selected Locations of Israel and the West Bank – the Judea Group Aquifer and the Shallow Aquifer of Jericho, PhD thesis, Technische Universtät Freiberg, Freiberg, 2011.
Laronne Ben-Itzhak, L. and Gvirtzman, H.: Groundwater flow along and across structural folding: an example from the Judean Desert, Israel, J. Hydrol., 312, 51–69, 2005.
Lavastre, V., Salle, C. L. G. L., Michelot, J.-L., Giannesini, S., Benedetti, L., Lancelot, J., Lavielle, B., Massault, M., Thomas, B., Gilabert, E., Bourlès, D., Clauer, N., and Agrinier, P.: Establishing constraints on groundwater ages with 36Cl, 14C, 3H, and noble gases: A case study in the eastern Paris basin, France, Appl. Geochem., 25, 123–142, 2010.
Lin, R. and Wei, K.: Tritium profiles of pore water in the Chinese loess unsaturated zone: Implications for estimation of groundwater recharge, J. Hydrol., 328, 192–199, 2006.
Love, A., Herczeg, A. L., Sampson, L., Cresswell, R. G., and Fifield, L. K.: Sources of chloride and implications for 36Cl dating of old groundwater, southwestern Great Artesian Basin, Australia, Water Resour. Res., 36, 1561–1574, 2000.
Lucas, L. L. and Unterweger, M. P.: Comprehensive review and critical evaluation of the half-life of Tritium, J. Res.-Nat. Inst. Stand. Technol., 105, 541–550, 2000.
Mahara, Y., Ohta, T., Kubota, T., Miyakawa, K., Hasegawa, T., Habermehl, M., and Fifield, L.: New dating method: Groundwater residence time estimated from the 4He accumulation rate calibrated by using cosmogenic and subsurface-produced 36Cl, in: EPJ Web of Conferences, 24, 03002, https://doi.org/0.1051/epjconf/20122403002, 2012.
Małoszewski, P. and Zuber, A.: Determining the turnover time of groundwater systems with the aid of environmental tracers: 1. Models and their applicability, J. Hydrol., 57, 207–231, 1982.
Małoszewski, P. and Zuber, A.: Tracer experiments in fractured rocks: Matrix diffusion and the validity of models, Water Resour. Res., 29, 2723–2735, 1993.
Małoszewski, P. and Zuber, A.: Lumped parameter models for interpretation of environmental tracer data, in: Manual on the mathematical models in isotope hydrogeology, IAEA – International Atomic Energy Agency, Vienna, 9–59, 1996.
Maoszewski, P. and Zuber, A.: Manual on lumped parameter models used for the interpretation of environmental tracer data in groundwaters, 2002.
Maloszewski, P., Stichler, W., and Zuber, A.: Interpretation of environmental tracers in groundwater systems with stagnant water zones, Isotop. Environ. Health Stud., 40, 21–33, 2004.
Merchel, S., Bremser, W., Alfimov, V., Arnold, M., Aumaître, G., Benedetti, L., Bourlès, D. L., Caffee, M., Fifield, L. K., Finkel, R. C., Freeman, S. P. H. T., Martschini, M., Matsushi, Y., Rood, D. H., Sasa, K., Steier, P., Takahashi, T., Tamari, M., Tims, S. G., Tosaki, Y., Wilcken, K. M., and Xu, S.: Ultra-trace analysis of 36Cl by accelerator mass spectrometry: an interlaboratory study, Anal. Bioanal. Chem., 400, 3125–3132, 2011.
Möller, P., Rosenthal, E., Geyer, S., and Flexer, A.: Chemical evolution of saline waters in the Jordan-Dead Sea transform and in adjoining areas, Int. J. Earth Sci., 96, 541–566, 2007.
Mor, U. and Burg, A.: Geological map of Israel, Mizpe Shalem, Sheet 12-III, , Geological Survey of Israel, Jerusalem, 2000.
Müller, T., Osenbrück, K., Strauch, G., Pavetich, S., Al-Mashaikhi, K. S., Herb, C., Merchel, S., Rugel, G., Aeschbach, W., and Sanford, W.: Use of multiple age tracers to estimate groundwater residence times and long-term recharge rates in arid southern Oman, Appl. Geochem., 74, 67–83, 2016.
Nica, N., Cameron, J., and Singh, B.: Nuclear Data Sheets for A=36, Nucl. Data Sheets, 113, 1–155, 2012.
Oster, H., Sonntag, C., and Münnich, K. O.: Groundwater age dating with chlorofluorocarbons, Water Resour. Res., 32, 2989–3001, 1996.
Paul, M., Kaufman, A., Magaritz, M., Fink, D., Henning, W., Kaim, R., Kutschera, W., and Meirav, O.: A new 36Cl hydrological model and 36Cl systematics in the Jordan River/Dead Sea system, Nature, 321, 511–515, 1986.
Pavetich, S., Akhmadaliev, S., Arnold, M., Aumaître, G., Bourlès, D., Buchriegler, J., Golser, R., Keddadouche, K., Martschini, M., Merchel, S., Rugel, G., and Steier, P.: Interlaboratory study of the ion source memory effect in 36Cl accelerator mass spectrometry, Nucl. Instrum. Meth. Phys. Res. Sect. B, 329, 22–29, 2014.
Plummer, L. N. and Busenberg, E.: Chlorofluorocarbons, in: Environmental Tracers in Subsurface Hydrology, edited by: Cook, P. G. and Herczeg, A. L., Kluwer Academic Press, Boston, Massachussetts, 441–478, 2000.
Plummer, L. N., Michel, R. L., Thurman, E. M., and Glynn, P. D.: Environmental tracers for age dating young ground water, in: Regional Ground-Water Quality, edited by: Alley, W. M., Van Nostrand Reinhold, New York, 255–294, 1993.
Plummer, L., Busenberg, E., and Cook, P.: Principles of chlorofluorocarbon dating, in: Use of chlorofluorocarbons in hydrology: A guidebook, IAEA, Vienna, 2006.
Purtschert, R., Yokochi, R., and Sturchio, N.: Krypton-81 dating of old groundwater, in: chap. 5, Isotope methods for dating old groundwater, IAEA, Vienna, 2013.
Raz, E.: Geological map of Israel, En-Gedi, Sheet 16-I, , Geological Survey of Israel, Jerusalem, 1986.
Rebeix, R., Le Gal La Salle, C., Mayer, A., Finkel, R., Claude, C., Sültenfuß, J., and Simler, R.: 36Cl deposition rate reconstruction from bomb pulse until present: A study based on groundwater records, Appl. Geochem., 50, 199–208, 2014.
Rosenfeld, A. and Hirsch, F.: The Cretaceous of Israel, Geol. Framew. Levant, 2, 393–436, 2005.
Roth, I.: Geological Map of Israel, Wadi el Qilt, Sheet 12-I, , with Explanatory Notes, Geol. Surv. Israel, Jerusalem, 1973.
Rugel, G., Pavetich, S., Akhmadaliev, S., Enamorado Baez, S. M., Scharf, A., Ziegenrücker, R., and Merchel, S.: The first four years of the AMS-facility DREAMS: Status and developments for more accurate radionuclide data, Nucl. Instrum. Meth. Phys. Res. Sect. B, 370, 94–100, 2016.
Sachse, A.: Hydrological and hydro-geological model of the Western Dead Sea catchment, Israel and West Bank, PhD Thesis, TU Dresden, Dresden, Germany, available at: https://nbn-resolving.org/urn:nbn:de:bsz:14-qucosa-222296 (last access: 13 January 2020), 2017.
Schlosser, P., Stute, M., Dörr, H., Sonntag, C., and Münnich, K. O.: Tritium/3He dating of shallow groundwater, Earth Planet. Sc. Lett., 89, 353–362, 1988.
Schmidt, S., Geyer, T., Guttman, J., Marei, A., Ries, F., and Sauter, M.: Characterisation and modelling of conduit restricted karst aquifers – Example of the Auja spring, Jordan Valley, J. Hydrol., 511, 750–763, 2014.
Shachnai, E.: Geological map of Israel, Ramallah, Sheet 8-IV, , The Israel Geological Survey, Jerusalem, 2000.
Siebert, C., Rödiger, T., Mallast, U., Gräbe, A., Guttman, J., Laronne, J. B., Storz-Peretz, Y., Greenman, A., Salameh, E., Al-Raggad, M., Vachtman, D., Zvi, A. B., Ionescu, D., Brenner, A., Merz, R., and Geyer, S.: Challenges to estimate surface- and groundwater flow in arid regions: The Dead Sea catchment, Sci. Total Environ., 485–486, 828–841, 2014.
Sneh, A. and Avni, Y.: Geological map of Israel, Jerusalem, Sheet 11-II, , Geological Survey of Israel, Jerusalem, 2011.
Sneh, A. and Roth, Y.: Geological map of Israel, Hevron, Sheet 11-IV, , Geological Survey of Israel, Jerusalem, 2012.
Solomon, D. K., Poreda, R., Schiff, S., and Cherry, J.: Tritium and helium: 3 as groundwater age tracers in the Borden aquifer, Water Resour. Res., 28, 741–755, 1992.
Solomon, D. K., Poreda, R. J., Cook, P. G., and Hunt, A.: Site Characterization Using 3H∕3He Ground-Water Ages, Cape Cod, MA, Groundwater, 33, 988–996, 1995.
Starinsky, A.and Katz, A.: The Story of Saline Water in the Dead Sea Rift – The Role of Runoff and Relative Humidity, in: Dead Sea Transform Fault System: Reviews, Modern Approaches in Solid Earth Sciences, edited by: Garfunkel, Z., Ben-Avraham, Z., and Kagan, E., Springer, the Netherlands, 2014.
Stein, M., Starinsky, A., Katz, A., Goldstein, S. L., Machlus, M., and Schramm, A.: Strontium isotopic, chemical, and sedimentological evidence for the evolution of Lake Lisan and the Dead Sea, Geochim. Cosmochim. Ac., 61, 3975–3992, 1997.
Suckow, A.: Lumpy – an interactive lumped parameter modeling code based on MS access and MS excel, EGU General Assembly 2012, Geophys. Res. Abstr., 14, EGU2012-2763, 2012.
Suckow, A.: The age of groundwater – Definitions, models and why we do not need this term, Appl. Geochem., 50, 222–230, 2014a.
Suckow, A.: Lumpy – Lumped Parameter Modelling of Age Distributions using up to two Parallel Black Boxes, Software Manual, Leibniz Institute for Applied Geophysics (LIAG), S3, Geochronology and Isotope Hydrology, Hannover, 2014b.
Suckow, A., Sonntag, C., Gröning, M., and Thorweihe, U.: Groundwater recharge in the Umm Kedada Basin, NW-Sudan, derived from environmental isotopes of soil moisture in samples collected from deep dug wells, in: Geoscientific Research in Northeast Africa, edited by: Thorweihe, U. and Schandelmeier, H., Balkema, Rotterdam, 1993.
Suckow, A., Deslandes, A., Raiber, M., Taylor, A. R., Davies, P., Gerber, C., and Leaney, F.: Reconciling contradictory environmental tracer ages in multi-tracer studies to characterise the aquifer and quantify deep groundwater flow, Hydrogeol. J., https://doi.org/10.1007/s10040-019-02042-8, in press, 2019.
Sültenfuß, J. and Massmann, G.: Dating with the 3He-tritium-method: an example of bank filtration in the Oderbruch region, Grundwasser, 9, 221–234, 2004.
Sültenfuß, J., Roether, W., and Rhein, M.: The Bremen mass spectrometric facility for the measurement of helium isotopes, neon and tritium in water, Isotop. Environ. Health Sci. (Isotopenpraxis), 45, 83–95, 2009.
Synal, H. A., Beer, J., Bonani, G., Suter, M., and Wölfli, W.: Atmospheric transport of bomb-produced 36Cl, Nucl. Instrum. Meth. Phys. Res. Sect. B, 52, 483–488, 1990.
Teijón, G.,Candela, L., Sagristá, E., and Hidalgo, M.: Naproxen adsorption–desorption in a sandy aquifer matrix: characterisation of hysteretic behavior at two different temperature values, Soil Sediment Contam.: Int. J., 22, 641–653, 2013.
Tosaki, Y., Tase, N., Massmann, G., Nagashima, Y., Seki, R., Takahashi, T., Sasa, K., Sueki, K., Matsuhiro, T., Miura, T., Bessho, K., Matsumura, H., and He, M.: Application of 36Cl as a dating tool for modern groundwater, Nucl. Instrum. Meth. Phys. Res. Sect. B, 259, 479–485, 2007.
Tosaki, Y., Massmann, G., Tase, N., Sasa, K., Takahashi, T., Matsushi, Y., Tamari, M., Nagashima, Y., Bessho, K., and Matsumura, H.: Distribution of 36Cl∕Cl in a river-recharged aquifer: Implications for the fallout rate of bomb-produced 36Cl, Nucl. Instrum. Meth. Phys. Res. Sect. B, 268, 1261–1264, 2010.
Trettin, R., Knöller, K., Loosli, H., and Kowski, P.: Evaluation of the sulfate dynamics in groundwater by means of environmental isotopes, Isotop. Environ. Health Stud., 38, 103–119, 2002.
Vogel, J. C.: Investigation of groundwater flow with radiocarbon, Isotopes in Hydrology, Vienna, 355–368, 1967.
Weeks, E. P., Earp, D. E., and Thompson, G. M.: Use of atmospheric fluorocarbons F-11 and F-12 to determine the diffusion parameters of the unsaturated zone in the Southern High Plains of Texas, Water Resour. Res., 18, 1365–1378, 1982.
Wood, W. W. and Sanford, W. E.: Chemical and isotopic methods for quantifying ground-water recharge in a regional, semiarid environment, Groundwater, 33, 458–468, 1995.
Yechieli, Y.: Fresh-Saline Ground Water Interface in the Western Dead Sea Area, Groundwater, 38, 615–623, 2000.
Yechieli, Y., Ronen, D., and Kaufman, A.: The source and age of groundwater brines in the Dead Sea area, as deduced from 36Cl and 14C, Geochim. Cosmochim. Ac., 60, 1909–1916, 1996.
Yellin-Dror, A., Guttman, J., Flexer, A., Hötzl, H., Ali, W., and Bensabat, J.: 3.3.2. 3-D Hydrogeological model of the Marsaba-Feshkha region, The Water of the Jordan Valley: Scarcity and Deterioration of Groundwater and its Impact on the Regional Development, Springer-Verlag, Berlin, Heidelberg, 287 pp., 2008.
Yu, Z., Peldszus, S., and Huck, P. M.: Adsorption characteristics of selected pharmaceuticals and an endocrine disrupting compound – Naproxen, carbamazepine and nonylphenol – on activated carbon, Water Res., 42, 2873–2882, 2008.