the Creative Commons Attribution 4.0 License.
the Creative Commons Attribution 4.0 License.
 | 11 May 2020
The pantropical response of soil moisture to El Niño
Kurt C. Solander
Brent D. Newman
Alessandro Carioca de Araujo
Holly R. Barnard
Z. Carter Berry
Damien Bonal
Mario Bretfeld
Benoit Burban
Luiz Antonio Candido
Rolando Célleri
Jeffery Q. Chambers
Bradley O. Christoffersen
Matteo Detto
Wouter A. Dorigo
Brent E. Ewers
Savio José Filgueiras Ferreira
Alexander Knohl
L. Ruby Leung
Nate G. McDowell
Gretchen R. Miller
Maria Terezinha Ferreira Monteiro
Georgianne W. Moore
Robinson Negron-Juarez
Scott R. Saleska
Christian Stiegler
Javier Tomasella
Chonggang Xu
The 2015–2016 El Niño event ranks as one of the most severe on record in terms of the magnitude and extent of sea surface temperature (SST) anomalies generated in the tropical Pacific Ocean. Corresponding global impacts on the climate were expected to rival, or even surpass, those of the 1997–1998 severe El Niño event, which had SST anomalies that were similar in size. However, the 2015–2016 event failed to meet expectations for hydrologic change in many areas, including those expected to receive well above normal precipitation. To better understand how climate anomalies during an El Niño event impact soil moisture, we investigate changes in soil moisture in the humid tropics (between ±25∘) during the three most recent super El Niño events of 1982–1983, 1997–1998 and 2015–2016, using data from the Global Land Data Assimilation System (GLDAS). First, we use in situ soil moisture observations obtained from 16 sites across five continents to validate and bias-correct estimates from GLDAS (r2=0.54). Next, we apply a k-means cluster analysis to the soil moisture estimates during the El Niño mature phase, resulting in four groups of clustered data. The strongest and most consistent decreases in soil moisture occur in the Amazon basin and maritime southeastern Asia, while the most consistent increases occur over eastern Africa. In addition, we compare changes in soil moisture to both precipitation and evapotranspiration, which showed a lack of agreement in the direction of change between these variables and soil moisture most prominently in the southern Amazon basin, the Sahel and mainland southeastern Asia. Our results can be used to improve estimates of spatiotemporal differences in El Niño impacts on soil moisture in tropical hydrology and ecosystem models at multiple scales.
- Article
(6333 KB) - Full-text XML
-
Supplement
(4262 KB) - BibTeX
- EndNote


The El Niño–Southern Oscillation (ENSO) is one of the major coupled ocean–atmosphere modes of variability internal to the Earth system operating on interannual timescales (Jones et al., 2001). ENSO refers to basin-wide changes in the air–sea interaction associated with changes in the sea surface temperatures (SSTs) of the tropical Pacific region. Depending on the directionally of the SST deviation, ENSO events are classified in two modes: El Niño, or the warm mode, when unusually warm water exists in the eastern tropical Pacific Ocean off the South American coast and La Niña, or the cool mode, when anomalously cool water pools exist in approximately the same location (Trenberth, 1997). Associated impacts on weather and climate over terrestrial areas are variable but typically strongest in the low-latitude and some of the mid-latitude regions of North and South America, eastern Africa, Asia and Australia (Ropelewski and Halpert, 1989); however, the influence of ENSO on weather and climate has been detected around the globe outside of these regions through teleconnection (Iizumi et al., 2014). Although we bring up ENSO here to highlight the mode duality of this climate feature, the focus of our study presented here is solely on the El Niño mode of ENSO.
An important factor that controls the teleconnection in climate and weather patterns caused by El Niño is the magnitude of the given El Niño event. Of the 39 El Niño events that have occurred since 1952, those occurring in 1972–1973, 1982–1983, 1997–1998 and 2015–2016 are categorized as “super El Niño” events (Hong et al., 2014). Although occurring at a much lower frequency than a non-super El Niño event, these events account for a disproportionately large amount of the global climate anomalies associated with El Niño. There is debate as to whether or not the 2015–2016 event can be classified as a super El Niño based on the lack of specific features that characterize a super El Niño including strong far-eastern Pacific SST anomalies, unusually high global SSTs, reduced outgoing longwave radiation (OLR), and weaker surface wind and sea surface height in the eastern Pacific (Hameed et al., 2018). We use the definition put forth by Hong et al. (2014) that defines a super El Niño as one with Niño-3 SST anomalies greater than one standard deviation above others in the instrumental record (Trenberth, 1997), coupled with a Southern Hemispheric transverse circulation that is robust relative to that of other El Niños. The 2015–2016 event fits the super El Niño classification using this definition (Huang et al., 2016; Chen et al., 2017).
Prediction of the climatic or hydrologic response over the land surface from an El Niño has proved to be difficult even during a super El Niño event. For example, none of the 25 forecasts of precipitation patterns produced from various models could accurately predict precipitation over the western US during the 2015–2016 El Niño event (Wanders et al., 2017). Indeed, Wanders et al. (2017) reported that less than half of the forecasts predicted the directionality of precipitation changes correctly. An evaluation of the three most recent super El Niños revealed that although drought during January to March (JFM) was widespread over the entire Amazon basin during the 1982–1983 and 1997–1998 events, during the 2015–2016 event the western half of the basin actually got wetter (Jiménez-Muñoz et al., 2016). The authors indicate that spatial differences in the SST anomaly during JFM 2015–2016 relative to other super El Niños may have contributed to this anomaly (e.g., Yu and Zou, 2013).
Given the diversity of El Niño impacts on precipitation, it is not clear how land surface hydrology at a global scale may be influenced by El Niño and whether such an influence may be more region-specific even in tropical areas that are close to the El Niño source region where impacts are generally expected to be more pronounced (Schubert et al., 2016). This lack of understanding is reflected in substantial multi-spatial and temporal-scale errors in ENSO impacts on hydrology in models (Zhuo et al., 2016). Of the land surface hydrologic variables, soil moisture is of particular interest due to the scarcity of observations available to properly evaluate its response to El Niño (Gruber et al., 2018), particularly in the low-latitude tropics (Dorigo et al., 2011), as opposed to the more well studied response of precipitation over the same region (Ropelewski and Halpert, 1989; Dai and Wigley, 2000; Chou et al., 2009; Huang and Chen, 2017; Xu 2017). Moreover, understanding soil moisture variability to macroclimatic events is useful because of its role in partitioning the energy fluxes at the Earth's surface (Seneviratne et al., 2010), as well as its importance as a driver of tropical biomass productivity (Raddatz et al., 2007) and ecosystem responses within Earth system models (ESMs; Green et al., 2019).
Several additional factors highlighted in previous studies contribute to the uncertainty of how soil moisture will respond to El Niño for different areas. A study in which soil moisture anomalies were regressed against the Southern Oscillation Index (SOI), one of the indices of ENSO intensity, revealed that within the tropics, soil moisture typically decreases during El Niño events, with notable exceptions occurring in extreme southern Africa and parts of South America (Miralles et al., 2014). However, much of the data used in the analysis from the tropics were actually missing because they were derived from active and passive microwave satellite sensors that fail to penetrate the ground beneath dense rainforests, resulting in substantial data gaps throughout the tropical regions (Liu et al., 2012; Dorigo et al., 2017). Another study used a coupled biosphere–hydrology model simulation and determined that soil moisture decreased in the Amazon basin during the 2015–2016 super El Niño with more acute reductions occurring in the northeastern part of the basin (van Schaik et al., 2018). Given that the study did not assess changes over the region during other super El Niño events, it is unclear if a similar spatial pattern emerges during El Niños that are comparable in magnitude.
Building on these previous studies, we evaluate the soil moisture response to El Niño within the humid tropics from 1979 to 2016 with a focus on three super El Niño events. We concentrate our assessment on soil moisture because of its strong controls on energy and water exchanges at the land–atmosphere interface and because it represents the main source of water for natural and cultivated vegetation (Prigent et al., 2005). Soil moisture data for the analysis were derived from the monthly Global Land Data Assimilation System (GLDAS) products at 1 ∘ resolution, which are spatially continuous across the globe since January 1979 (Rodell et al., 2004). The continuous temporal resolution of this data product satisfies one of our goals by enabling the evaluation of the soil moisture response across the three super El Niños, 1982–1983, 1997–1998 and 2015–2016, which has never before been done. The continuous spatial coverage of GLDAS enables analysis of the soil moisture response across all tropical regions, including dense rainforests, which was limited to less densely forested areas in studies reliant on remote sensing (e.g., Miralles et al., 2014).
GLDAS data were downloaded from the Giovanni online data system, which is maintained by the National Aeronautics and Space Administration Goddard Earth Sciences Data and Information Services Center (NASA GES DISC; Acker and Leptoukh, 2007). Data from GLDAS are derived from precipitation gauge records, satellite data, radar precipitation observations and various outputs from numerical models (Rodell et al., 2004). We used 1979–2016 monthly data from all four GLDAS land surface models (LSMs) including the Variable Infiltration Capacity (VIC) model (Liang et al., 1994), Community Land Model (CLM; Dai et al., 2003), Noah LSM (NOAH; Ek et al., 2003) and Mosaic LSM (MOSAIC; Koster and Suarez, 1996). GLDAS soil moisture data are used as the basis for this analysis because soil moisture estimates from the four individual GLDAS LSMs capture the range of variability in other similar global soil moisture data products at the locations of the in situ data that were used in this study and described in Table 1 (Fig. 1). Other data products in this comparison include the fifth-generation European Centre for Medium-Range Weather Forecasts (ECMWF) reanalysis soil moisture product (ERA5; Copernicus Climate Change Service (C3S), 2017), the Modern-Era Retrospective analysis for Research and Applications, Version 2 (MERRA2; Gelaro et al., 2017), and the Global Land Evaporation Amsterdam Model (GLEAM) (Miralles et al., 2011; Martens et al., 2017). All three datasets have a spatial resolution of 0.25∘. To avoid the integration of results from different climate zones, which are likely to show a dissimilar soil moisture response, we targeted only GLDAS pixels considered to be part of the humid tropics by creating a mask using data from the Köppen–Geiger climate classification system (Kottek et al., 2006) obtained from the Spatial Data Access Tool (SDAT; ORNL DAAC, 2017a). The mask was used in conjunction with the monthly soil moisture estimates to isolate changes specific to the tropical climate zone.
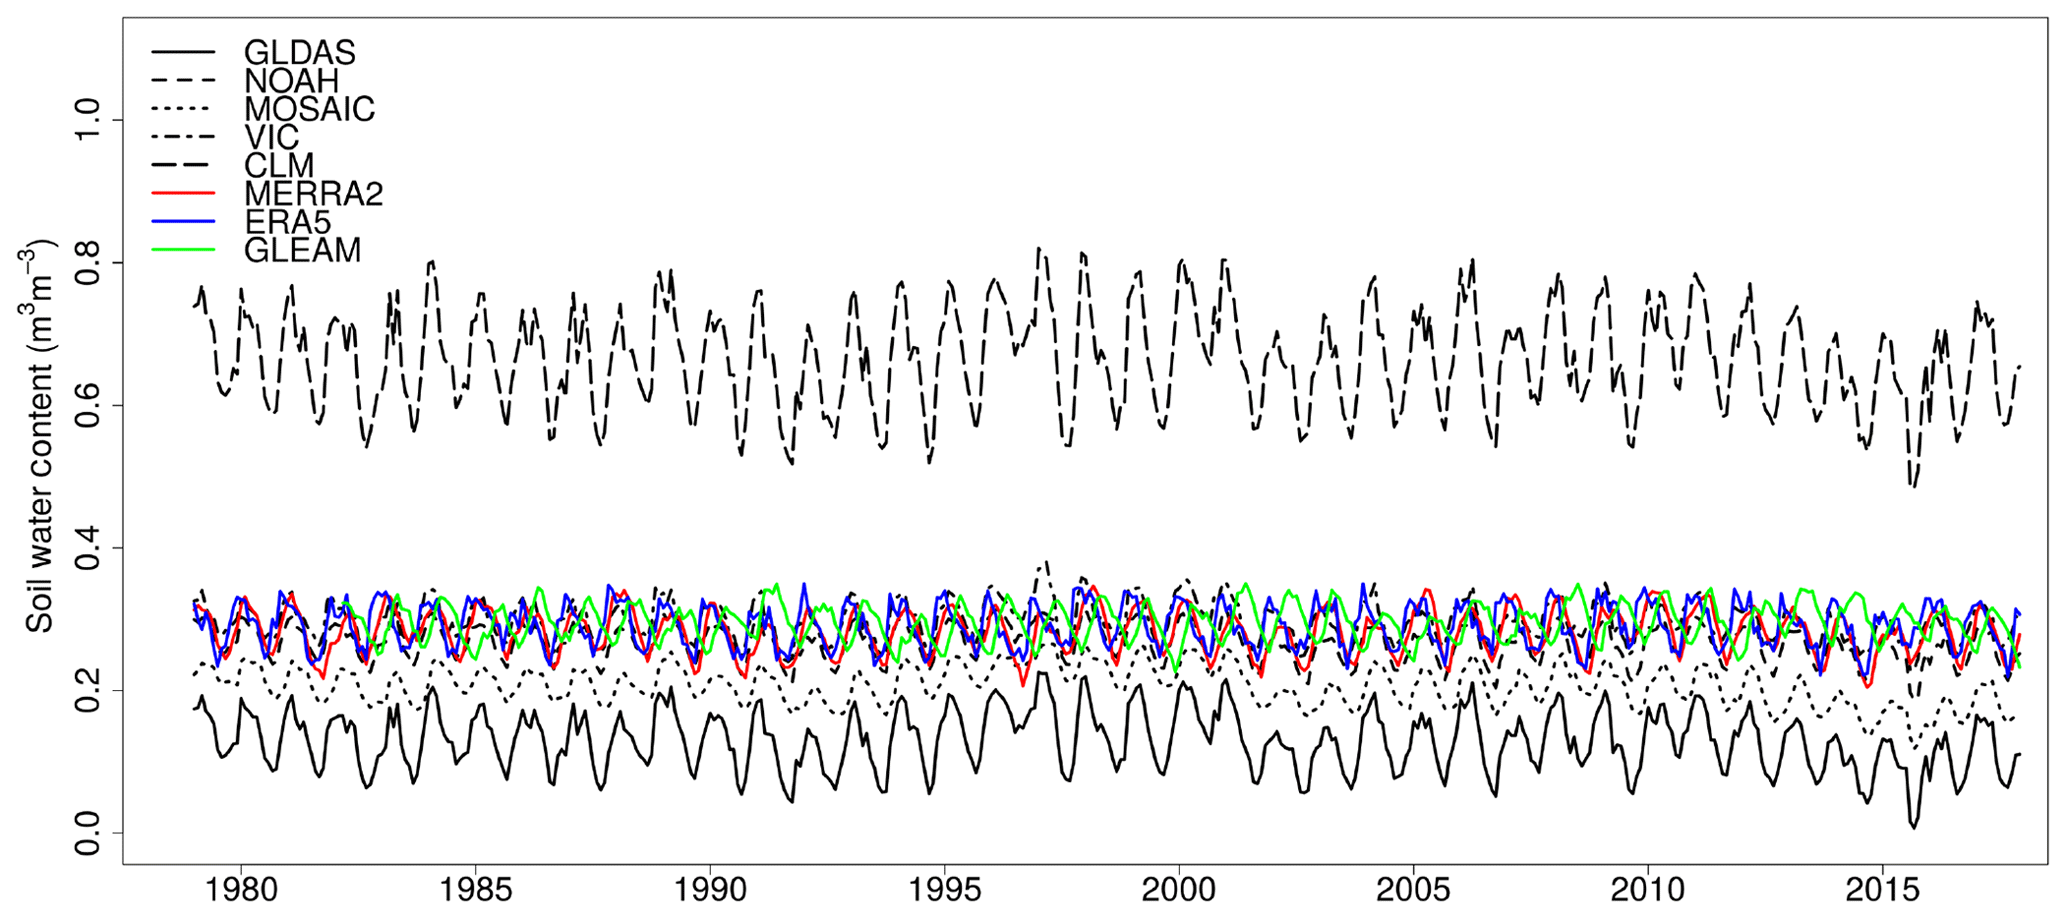
Figure 11979–2017 monthly time series of mean soil moisture across all in situ data locations shown in Table 1 for multiple data products including the GLDAS multimodel mean (black, solid), MERRA2 (red, solid), ERA5 (blue, solid) and GLEAM (green, solid), as well as the individual land surface models that make up GLDAS NOAH (black, short dash), MOSAIC (black, dot), VIC (black, dash dot) and CLM (black, long dash). Note that the GLEAM time series starts in 1980.
Table 1Information on geospatial location, record length and monitoring instruments used for in situ observations that were used in the analysis.
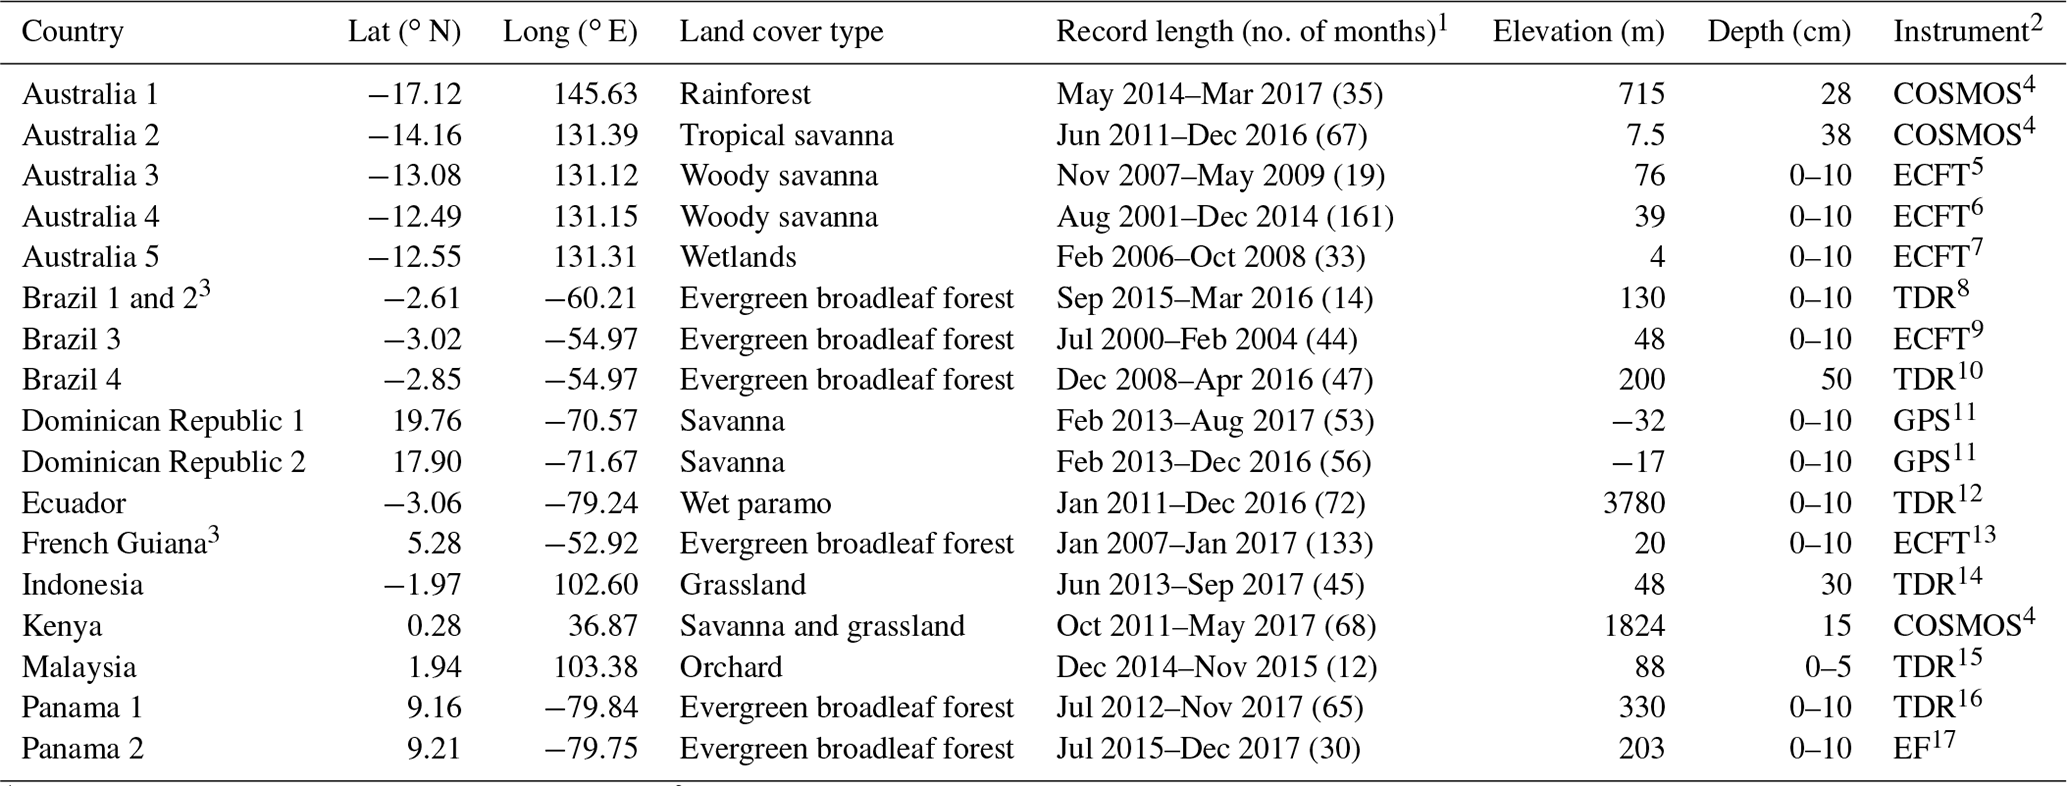
1 Data are not necessarily temporally continuous for every location. 2 COSMOS: cosmic neutron probe; ECFT: eddy covariance flux tower; EF: electromagnetic field; GPS: global positioning system; TDR: time domain reflectometry. 3 Comprised of two sites at these coordinates. 4 Köhli et al. (2015). 5 Beringer et al. (2011). 6 Beringer et al. (2007). 7 Beringer et al. (2013). 8 Jardine et al. (2019). 9 Goulden et al. (2004). 10 Wu et al. (2016). 11 Larson et al. (2008). 12 Ochoa-Sánchez et al. (2018). 13 Bonal et al. (2008), and see Acknowledgements. 14 Meijide et al. (2018), and see Acknowledgements. 15 Kang et al. (2016). 16 Rubio and Detto (2017). 17 Bretfeld et al. (2018).
In addition to the four data products mentioned above, we also considered using the European Space Agency Climate Change Initiative (ESA CCI) global soil moisture product (Dorigo et al., 2017). However, because this product is derived from observations from satellite microwave sensors that have difficulty retrieving data beneath dense rainforest canopies, ESA CCI soil moisture estimates within the tropics were too sparse to reliably determine the spatially continuous soil moisture response to El Niño across all tropical regions (e.g., Liu et al., 2012).
Soil moisture is represented in each of the four GLDAS LSMs in a sequence of subsurface layers up to a maximum of 3 to 10 layers. Each subsurface layer represented in GLDAS varies in depth up to an aggregated, multilayer maximum depth of 3.5 m among the four models. We only used data from the uppermost group of soil layers within each model closest to a depth of 0–10 cm. This was done to target the near-surface soil moisture response to El Niño, as the El Niño signature in soil moisture at shallow depths is likely to be more prominent and the largest number of in situ observations that are available for comparison to the GLDAS estimates also come from the near-surface zone. We used the ensemble mean at 0–10 cm depth from the four models because the ensemble is considered to provide a more robust representation of reality (Tebaldi and Knutti, 2007).
Soil moisture estimates from GLDAS were validated through comparison to in situ observations across 16 sites spanning five continents (Table 1). These data were accessed through a variety of sources including the Cosmic-ray Soil Moisture Observing System (COSMOS; Köhli et al., 2015), United States Department of Agriculture Soil Climate Analysis Network (SCAN; Schaefer et al., 2007), Plate Boundary Observatory (PBO; Larson et al., 2008), International Soil Moisture Network (ISMN; Dorigo et al., 2011, 2013), several FLUXNET sites (Goulden et al., 2004; Beringer et al., 2007; Bonal et al., 2008; Beringer et al., 2011, 2013) and other individual data collaborators who have made their data available for use in this study. Data from the individual GLDAS LSMs were interpolated to the same depths as the in situ data shown in Table 1 using cubic spline and linear interpolation prior to ensemble averaging and comparison with the in situ data. When interpolating data from CLM, which includes soil moisture estimates for 10 distinct subsurface layers, cubic spline interpolation was used. Linear interpolation was used for the other three GLDAS models, which include soil moisture estimates from either three or four distinct subsurface layers where cubic spline interpolation would have been less appropriate. The GLDAS data were compared to in situ data using the linear relationship shown in Eq. (1).
where SMI is the in situ soil moisture observation (%), β0 is the y intercept (%), β1 is the slope and SMG is the GLDAS ensemble soil moisture estimate (%). The coefficients of the linear relationship in Eq. (1) were used to provide a bias-corrected estimate of soil moisture from GLDAS that was more representative of the near-surface in situ soil moisture observations. The bias-corrected estimates are compared to in situ observations to assess how the application of the bias-correction method improves the representation of soil moisture at the point scale.
In situ soil moisture observations were compared to corresponding GLDAS soil moisture estimates at co-located depths for pixels that encompassed the in situ observation. In some situations, adjacent pixels were used if data from the co-located GLDAS pixels were missing, e.g., over lands adjacent to inland water bodies or oceans, due to the coarse resolution of the GLDAS dataset. The same data comparison was made after removing data from one site in Ecuador and another from Australia. In situ observations from these sites were not likely to be representative of the GLDAS data at 1 ∘ resolution given that the sites where data were collected are either located at a high elevation of 3780 m or seasonally flooded wetland where the subsurface soil is frequently saturated. Observations from one site in Brazil were also removed due to poor agreement between observations and GLDAS data relative to other sites.
The comparison of soil moisture from GLDAS to in situ point-based measurements does have an inherent scale mismatch. For example, measurements at an individual site may not necessarily represent soil moisture conditions at the scale of a GLDAS pixel due to heterogeneities in land cover, soil or topography. However, given the previously noted challenges regarding the dearth of large-scale moisture measurements in the tropics, the site-based data represent the best available source of actual soil moisture content in this region. Scale mismatch effects are also moderated by use of multiple sites spanning multiple continents. Site-based measurements of soil moisture considered to be outliers in terms of how they compare to the co-located GLDAS pixel soil moisture estimate are examined further in the discussion section.
The soil moisture response to El Niño for the three super El Niño events of 1982–1983, 1997–1998 and 2015–2016 was calculated by taking the difference in the GLDAS soil moisture during the El Niño mature phase of October to December (OND) and January to March (JFM) from the long-term 1979–2016 climatological monthly mean (Eqs. 2 and 3).
where SM is the 3-month mean GLDAS soil moisture during the mature phase (either OND or JFM) of the focal year for three super El Niños (1982–1983, 1997–1998 and 2015–2016) and n indicates the total number of monthly estimates used in the analysis from 1979 to 2016.
k-Means cluster analysis was used to determine groups of pixels representing the soil moisture anomaly with a similar magnitude and direction of change during OND and JFM across the three super El Niño events. Clustering was based on the ΔSM for OND and JFM that was calculated using Eqs. (2) and (3). Prior to conducting the analysis, the ΔSM values were rescaled to have a mean of 0 and standard deviation of 1. The mean and standard deviation of OND and JFM ΔSM within each clustered region was then used to assess the consistency of soil moisture response for different clustered regions.
The number of clusters used in the k-means cluster analysis was set to four. This number was selected based on results from a suite of tests used to determine the optimal number of clusters using the R package “NbClust” (version 3.0; Charrad et al., 2014). Each test uses a set of criteria to generate a score for the proposed number of clusters (ranged between 4 and 10). We used only tests where the optimal number of clusters was based on which proposed number of clusters had the maximum or minimum score so that the proposed cluster groups could be ranked accordingly. The mean ranking for all tests across all periods (OND and JFM for three super El Niños) was then used to determine the optimal number of clusters (Table 2).
Table 2Mean ranking of proposed cluster groups across OND and JFM during three super El Niños for tests used in the R package NbClust (version 3.0). Low scores denote the highest ranking. CCC: cubic clustering criterion; Cindex: clustering index; SDindex: scattered distance index; SDbw: scattered density.
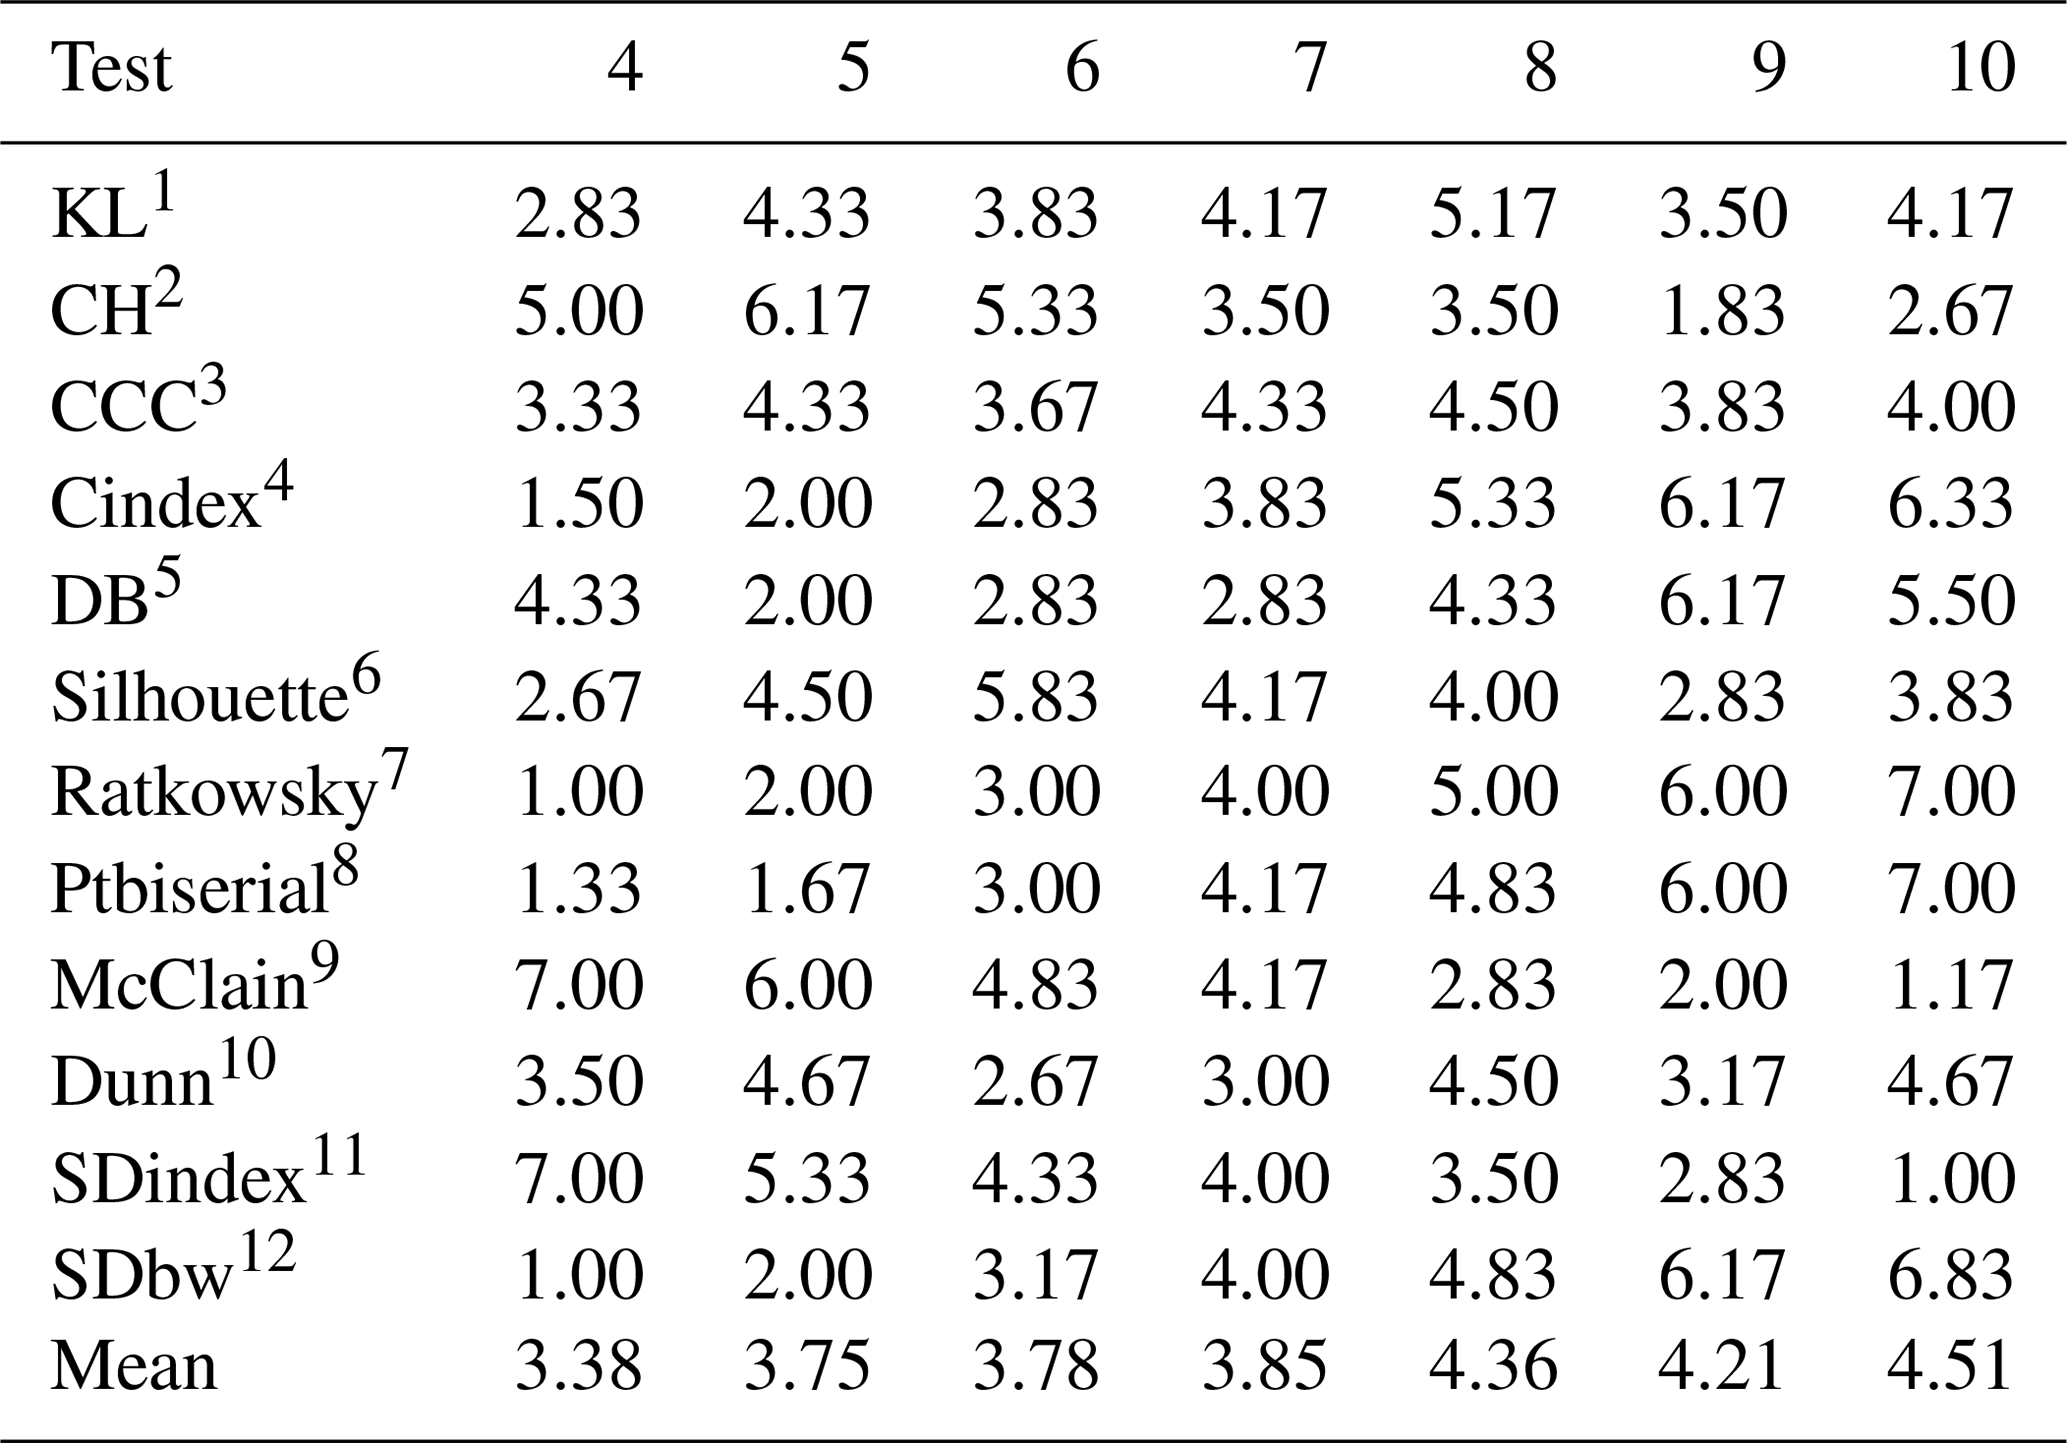
1 Krzanowski and Lai (1988). 2 Calinski and Harabasz (1974). 3 Sarle (1983). 4 Hubert and Levin (1976). 5 Davies and Bouldin (1979). 6 Rousseeuw (1987). 7 Ratkowksy and Lance (1978). 8 Milligan (1981, 1980). 9 McClain and Rao (1975). 10 Dunn (1974). 11 Halkidi et al. (2000). 12 Halkidi and Vazirgiannis (2001).
The response of precipitation and evapotranspiration (also obtained from GLDAS) to El Niño was also determined to compare against the soil moisture responses. The precipitation and evapotranspiration responses (ΔP and ΔET) to the three super El Niños are calculated following the same metric for the soil moisture responses (ΔSM) shown in Eqs. (2) and (3). The OND and JFM ΔSM is compared to ΔP and ΔET for the three super El Niños and plotted on maps as the ΔSM : ΔP and ΔSM : ΔET ratios. The pixel-wide mean ΔSM : ΔP and ΔSM : ΔET ratios and standard deviations for each of the four clustered regions during OND and JFM are also summarized.
The relationship between soil moisture and El Niño is further evaluated by calculating the Pearson correlation coefficient (r) between the 1979–2016 GLDAS monthly soil moisture and the monthly Niño-3.4 index (Trenberth, 1997; Bunge and Clarke, 2009) for all GLDAS pixels in the humid tropics. The Niño-3.4 index is a variant of the Niño-3 index region in that it is centered further west (120–170∘ W vs. 90–150∘ W) at the same latitude range (5∘ N–5∘ S). The Niño-3.4 index data were downloaded from the National Oceanic and Atmospheric Administration (NOAA) Oceanic and Atmospheric Research–Earth System Research Laboratories–Physical Sciences Division (OAR–ESRL–PSD), Boulder, Colorado, website at http://www.esrl.noaa.gov/psd (last access: 24 October 2017). The mean correlation was calculated and summarized for the same regions that were derived from the cluster analysis. The same correlation analysis was conducted using the soil moisture response, which lagged by up to 6 months for the four clustered regions during OND and JFM. Because this failed to increase the amount of variability in soil moisture estimates that could be explained by the Niño-3.4 index over any of the clustered regions by more than 1 %, we only present correlation results with no lag.
Finally, we calculated the soil moisture response to El Niño for the tropics using the bias-corrected estimates of GLDAS soil moisture that were derived from the comparisons with the in situ soil moisture data. We compare this to the unbiased estimates to determine the spatial variability in the magnitude of mismatch between these two estimates. Given the limited number of in situ observations that were available to generate the bias-corrected estimates, we use this only to highlight regions where a higher density of soil moisture observations might be necessary to improve the accuracy of the soil moisture response to El Niño derived from GLDAS.
GLDAS soil moisture estimates were validated against all in situ soil moisture estimates as well as through the removal of three outliers (Fig. 2). The exclusion of the Ecuador, Australia and Brazil data resulted in an overall reduction in the number of observations by 15 % but dramatic improvement in the r2 between GLDAS and in situ estimates from 0.03 to 0.54. Comparison of these datasets following the removal of outliers reveals a consistent positive bias in the GLDAS soil moisture estimates relative to in situ observations. Consequently, the equation from the best-fit linear regression line (Eq. 1) was used to reduce the bias in the GLDAS estimates (Fig. 2). The use of the bias-corrected soil moisture estimates from GLDAS resulted in a mean reduction of RMSE across all sites by 69 % (Fig. 3). The resulting RMSE and r2 coefficient of determination across these sites ranged from 0.03 to 0.24 (mean =0.08) and 0.00 to 0.88 (mean =0.45), respectively (Fig. 4). Although the bias correction applied to GLDAS soil moisture shown in Figs. 2 and 3 was able to substantially reduce the RMSE between in situ observations and GLDAS estimates, the overall performance of GLDAS in terms of r2 is still mixed. Of the in situ sites that were evaluated, 10 had an r2 > 0.4, while 4 had an r2 < 0.1 (Fig. 4).
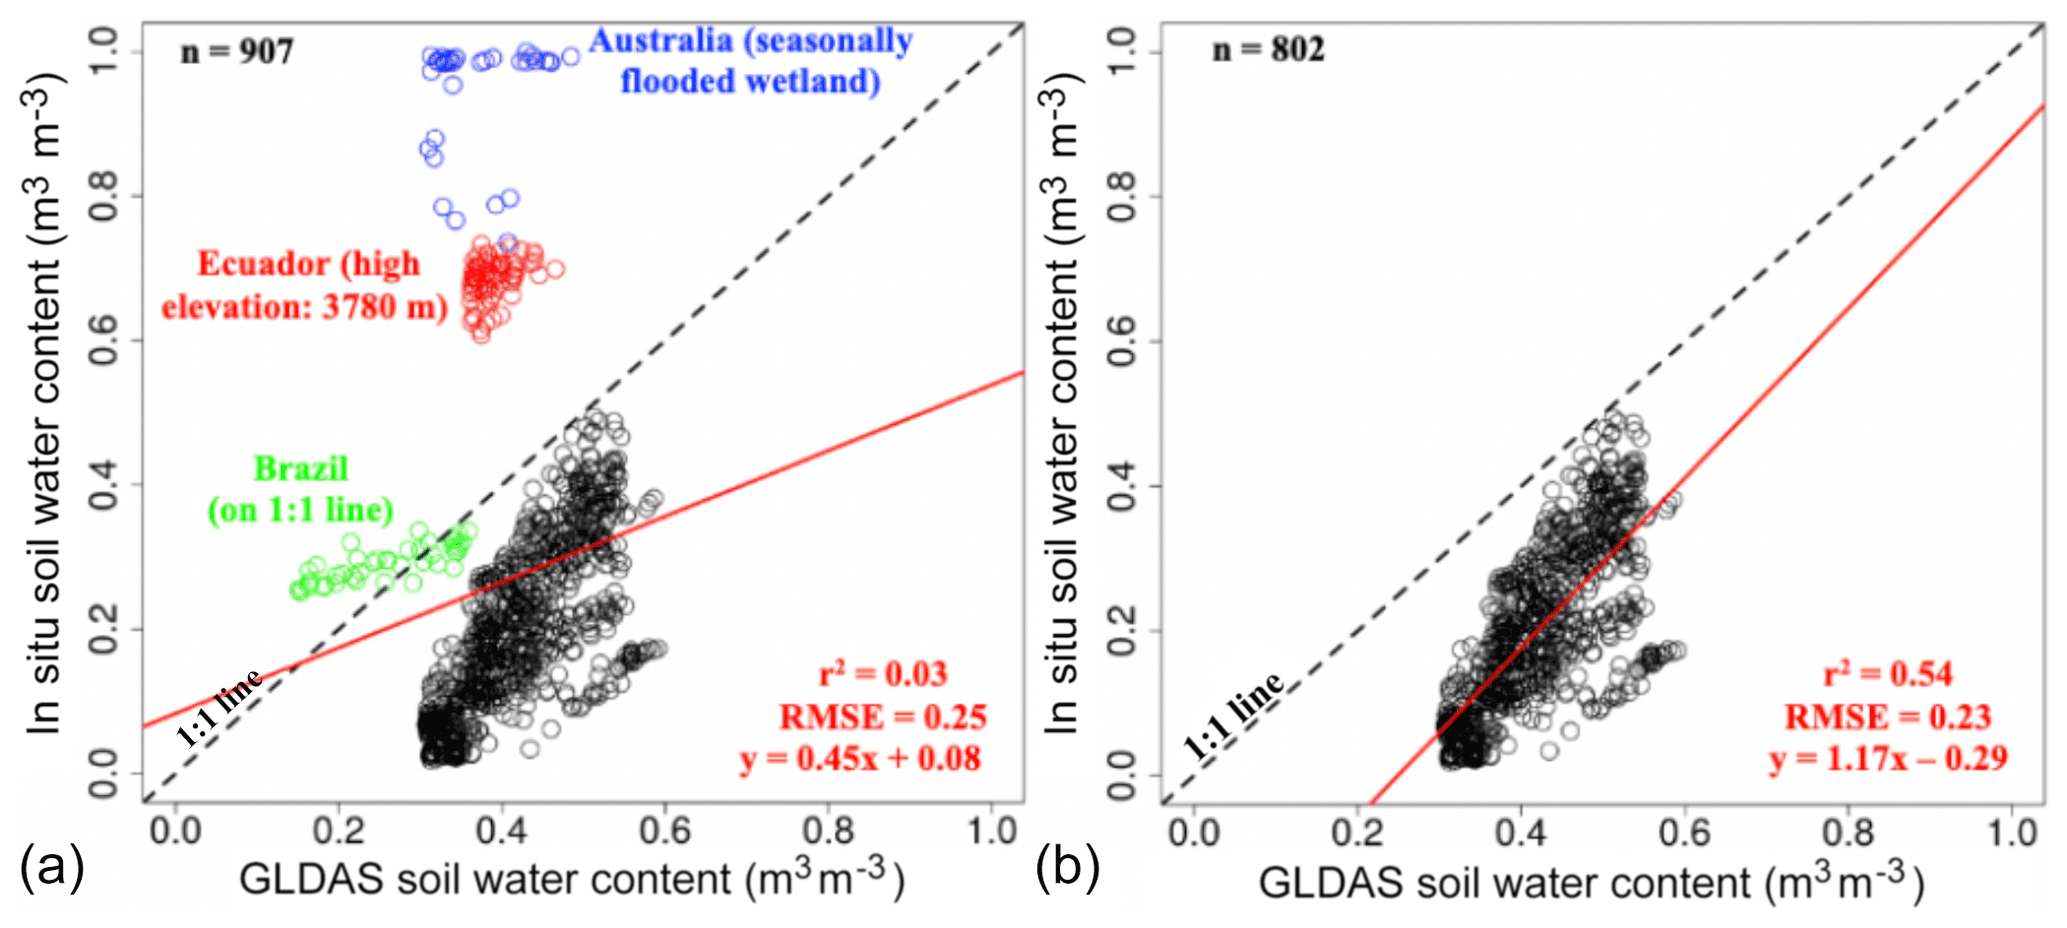
Figure 2In situ soil moisture vs. GLDAS soil moisture during October to December (OND) and January to March (JFM) for El Niño years 1982–1983, 1997–1998 and 2015–2016. Each circle corresponds to one in situ data point in space and time. The left panel includes data from all 18 sites shown in Table 1, with data from Australia, Ecuador and Brazil highlighted in blue, red and green, respectively. The right panel shows the same information with the Ecuador, Australia and Brazil site data removed. The blue dashed line and red solid line represent the 1:1 line and the regression line, respectively.
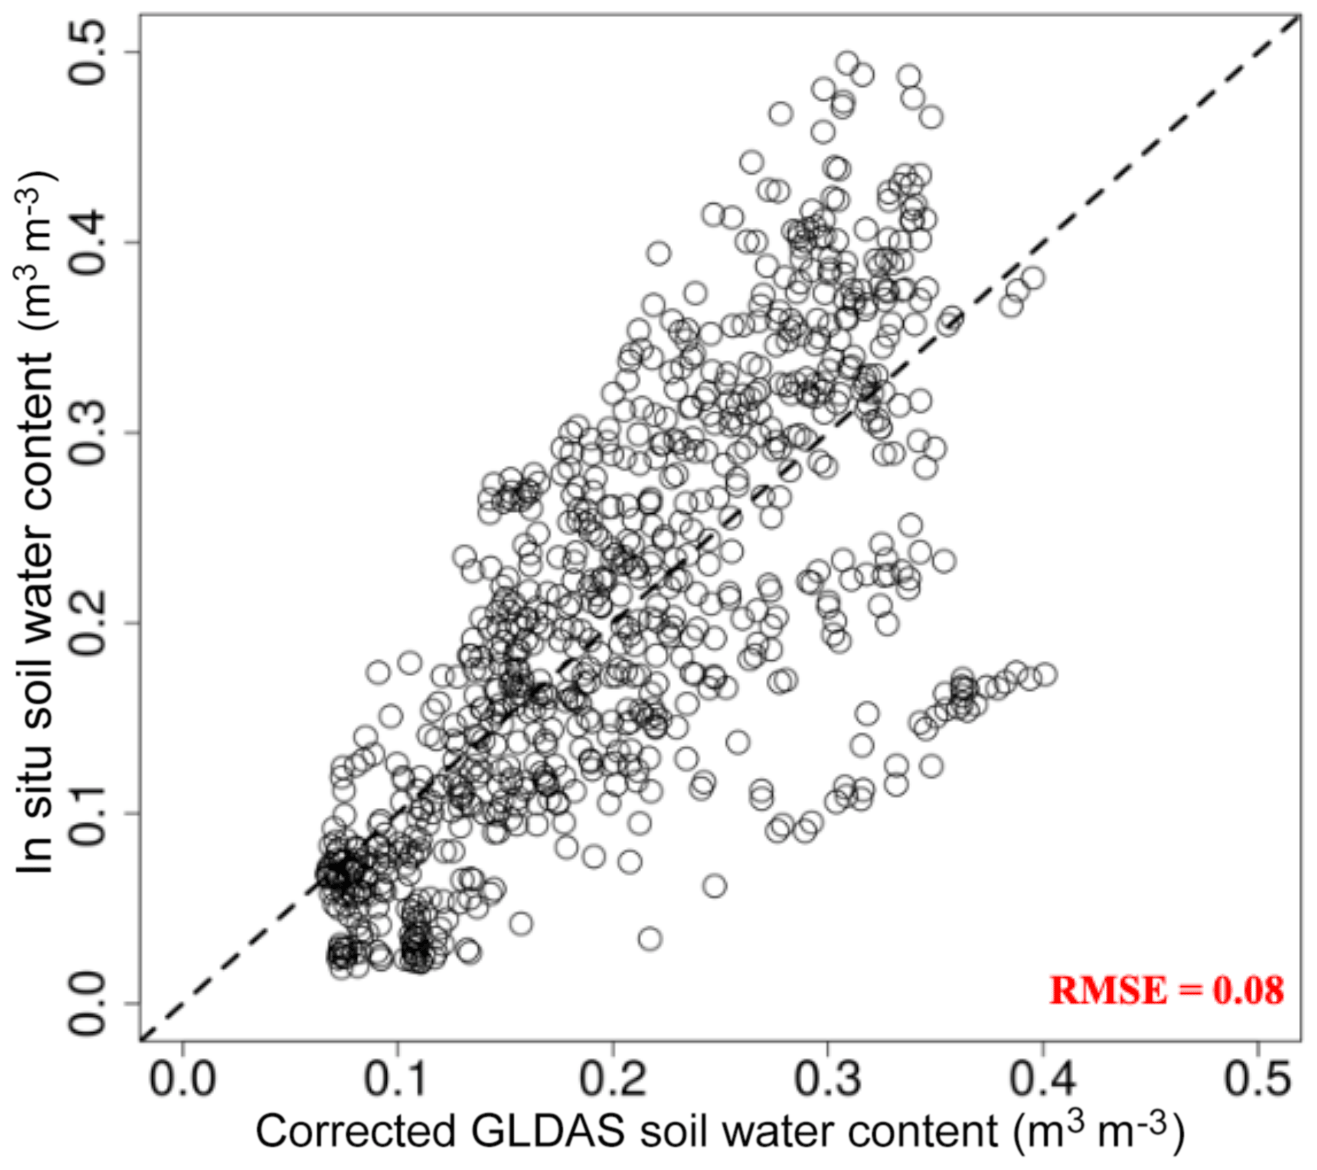
Figure 3Bias-corrected soil moisture estimates from GLDAS relative to in situ soil moisture observations for all sites with the mean RMSE shown in red.

Figure 4Bias-corrected estimate from GLDAS (black line) and in situ observation (red line) of soil water content for 16 individual locations in the humid tropics. RMSE and r2 coefficient of determination for each location are also shown.
Given the bias observed in the GLDAS soil moisture product relative to in situ data over the available record, we also compared soil moisture estimates from GLDAS to in situ data only during the mature phase 2015–2016 super El Niño event to confirm that a similar bias occurred during this period. The variability of in situ estimates captured by GLDAS differed by no more than 2 % when considering only the peak El Niño months of the 2015–2016 event, thereby demonstrating that the variability in bias between the two periods was minimal. Given the higher number of observations when all months were used (e.g., n=802 vs. only n=67), we chose to base the bias-corrected estimate on the comparison made using all available months of data to incorporate a greater number of observations into the analysis.
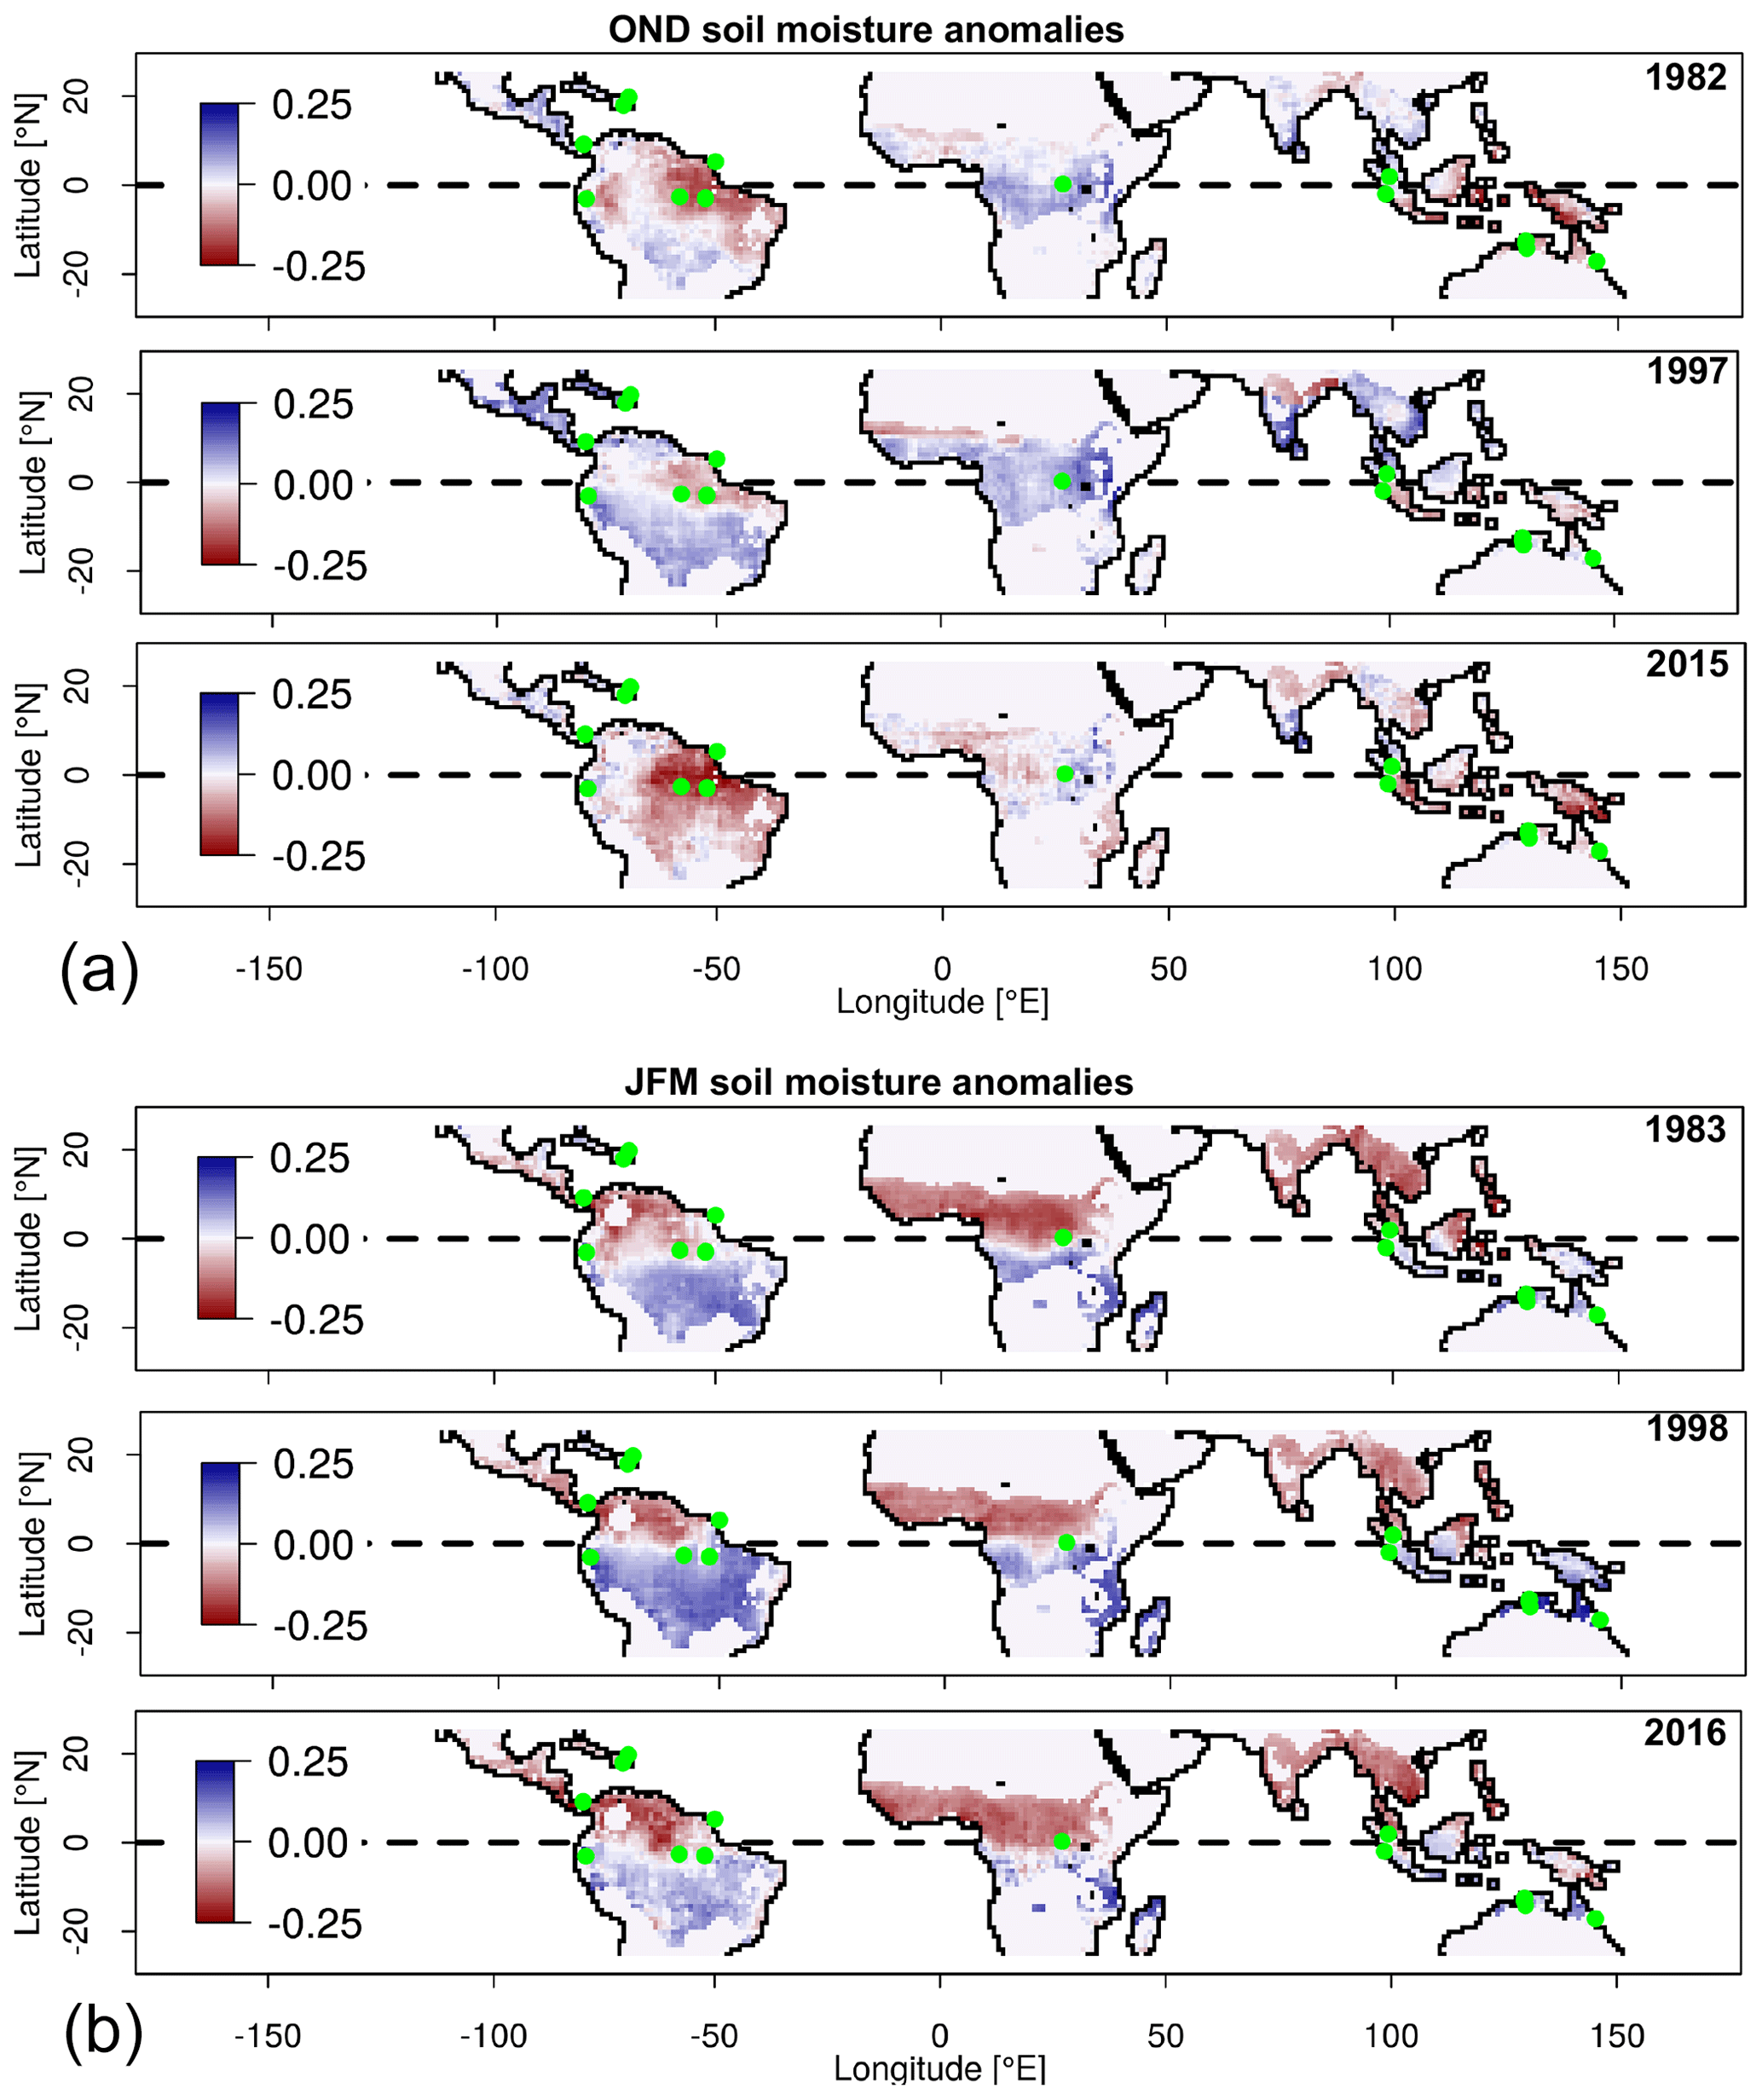
Figure 5(a) October-to-December (OND) change in bias-corrected GLDAS soil moisture anomalies during the super El Niño years 1982, 1997 and 2015 relative to the previous years. Anomalies relative to the 1979–2016 period. (b) Same as (a) but for January to March (JFM) in 1983, 1998 and 2016.
Our results of bias-corrected GLDAS soil moisture changes over regions derived from the cluster analysis show that the most consistent and strongest decreases in OND soil moisture during the three super El Niño events occurred over the northeastern Amazon basin and maritime southeastern Asia (Fig. 5a). Regions with the largest and most consistent increases in OND soil moisture over the three events include eastern and southern equatorial Africa, Latin America and southern India. Notably, the positive anomalies are much larger in 1982 and 1997 than in 2016. During the late mature phase of El Niño (JFM), the strongest and most consistent decreases in soil moisture during the three super El Niño events were centered north of the Equator, while consistent increases largely occurred south of the Equator (Fig. 5b). This pattern holds more or less consistent across the three major land masses of South America, Africa and Asia–Australia. The largest overall increase in soil moisture was centered over the southern Amazon basin. Similar to the changes observed during OND, the positive anomalies tended to be larger during the two earlier El Niños of 1983 and 1998.
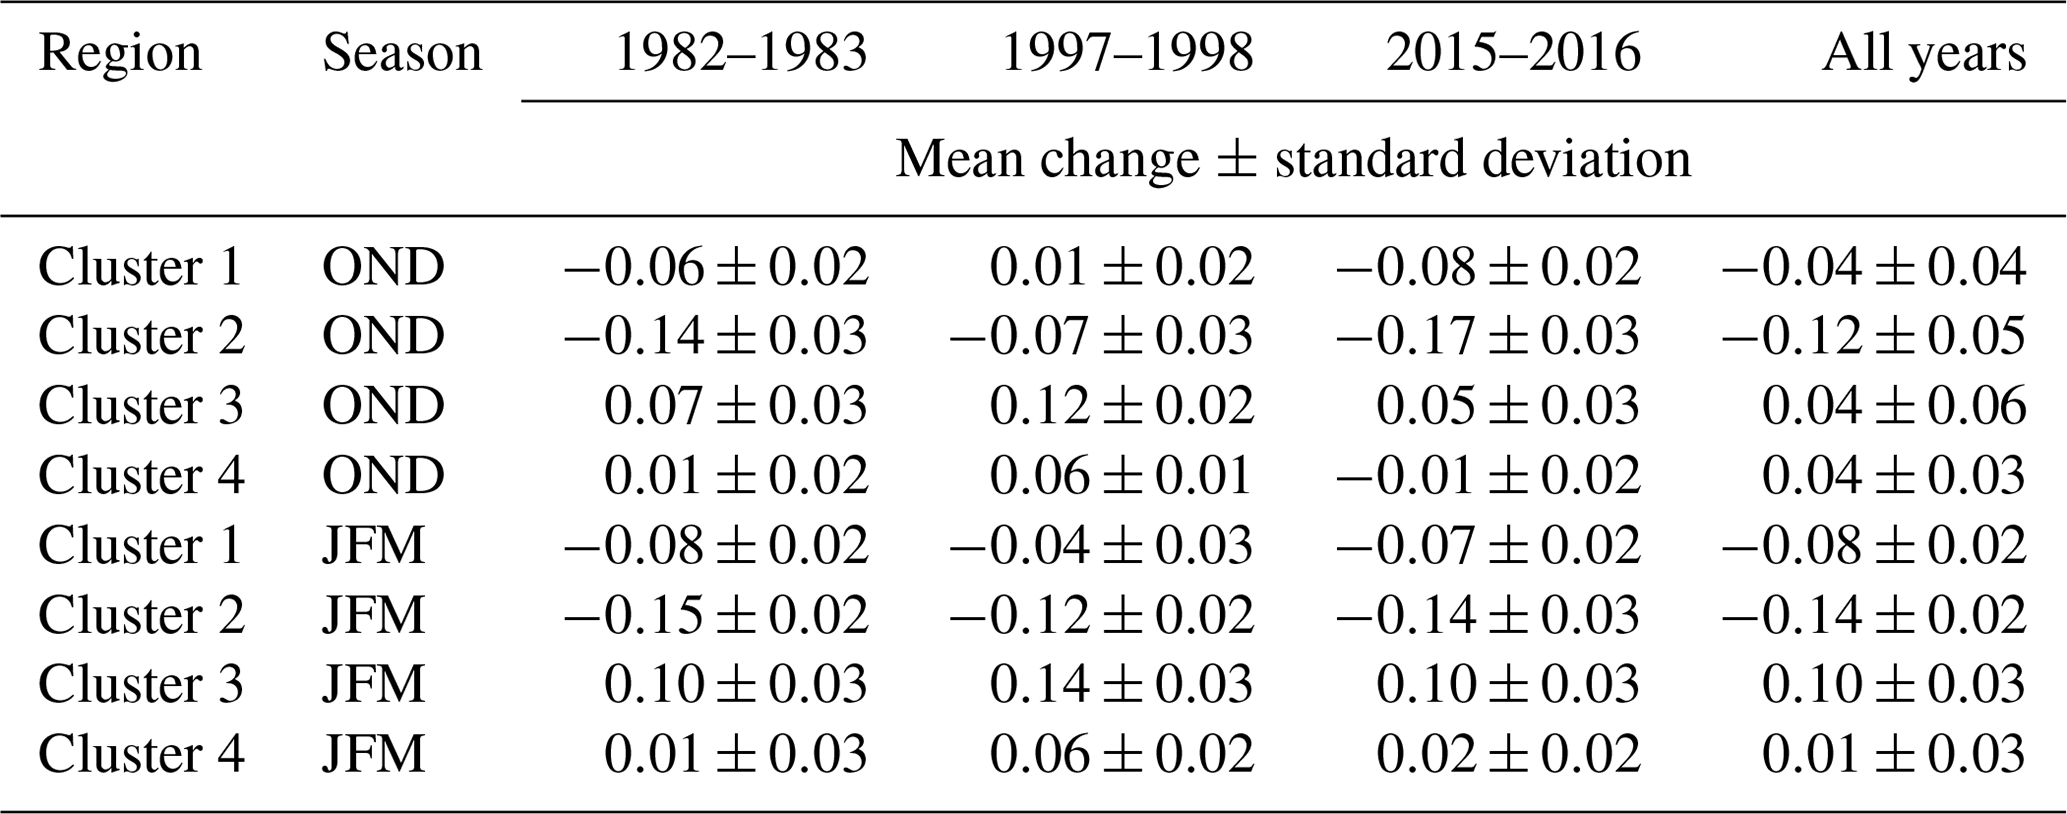
Four clusters are shown for each of the OND (Fig. 6a) and JFM (Fig. 6b) periods. The cluster with the highest soil moisture increases is Cluster 3 followed by Cluster 4, while the highest soil moisture decreases are found in Cluster 2 followed by Cluster 1. The overlap of the cluster results during OND confirm the locations of the largest, most consistent soil moisture decreases (denoted by Cluster 2) over the northeastern Amazon basin and increases (denoted by Cluster 3) over eastern Africa, Latin America and southern India (Fig. 6a). The mean decrease in soil moisture over the Cluster 2 region during OND varied between −0.07 to −0.17 over the three super El Niño events, while the mean increase in soil moisture over the Cluster 3 region varied between 0.03 to 0.07 (Table 3). During JFM the cluster results show decreases centered north of the Equator and increases south of the Equator with smaller overall coverage of Cluster 3 occurring in 2016 (Fig. 6b). The overlap of the cluster results during JFM confirm the locations of the largest, most consistent soil moisture decreases (denoted by Cluster 2) over the northeastern Amazon basin and increases (denoted by Cluster 3) over eastern Africa and the southern Amazon basin (Fig. 6b). The mean decrease in the Cluster 2 region during JFM varied between −0.12 to −0.15 over the three super El Niño events, while the mean increase in Cluster 3 varied between 0.10 to 0.14 (Table 3).
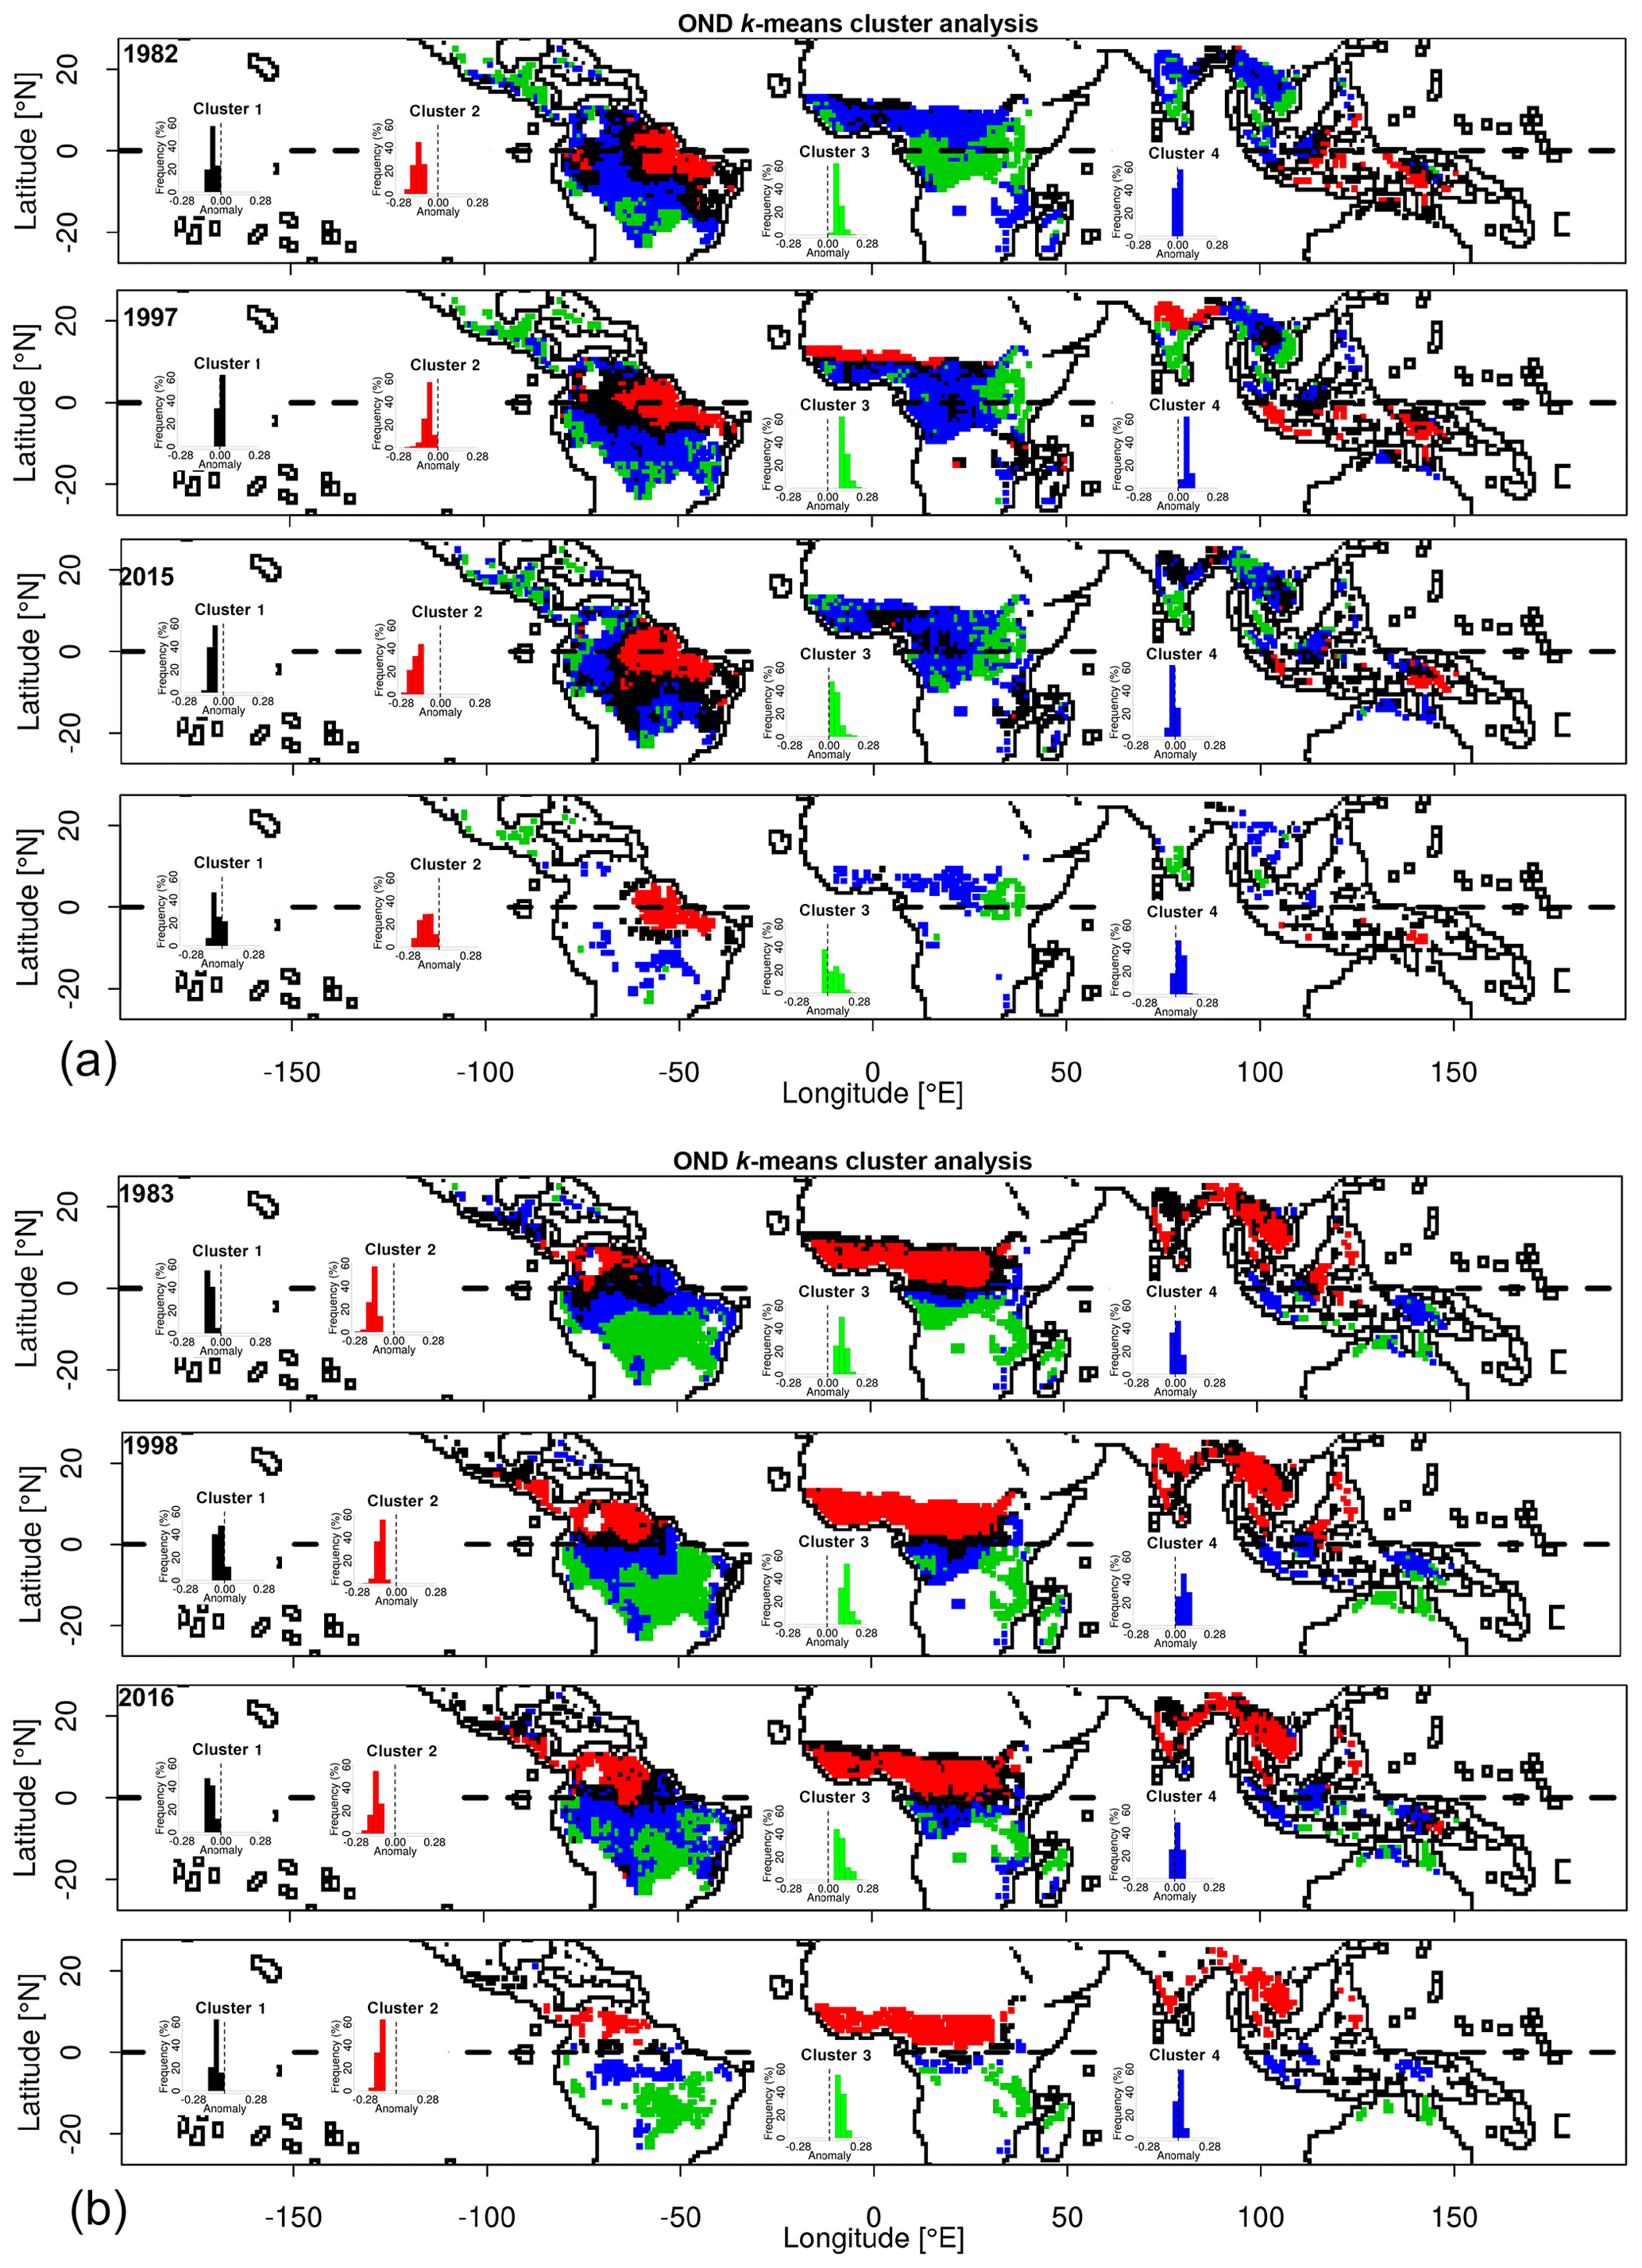
Figure 6(a) k-Means cluster analysis results for the October-to-December (OND) 1982, 1997 and 2015 El Niño events and the overlap of the three periods. Corresponding histograms of soil moisture anomalies for each of the four clusters are also shown. Anomalies relative to the 1979–2016 period. (b) Same as (a) but for January to March (JFM) in 1983, 1998 and 2016.
Table 3Mean and standard deviation of October-to-December (OND) and January-to-March (JFM) change in the soil moisture for clustered regions in the humid tropics. Statistics computed using OND and JFM bias-corrected GLDAS soil moisture anomalies during El Niño years 1982–1983, 1997–1998 and 2015–2016 and all 3 years relative to the 1979–2016 mean.
The change in the bias-corrected GLDAS soil moisture during El Niño is generally tracking that of precipitation based on the ratio of ΔSM to ΔP. Both ΔSM to ΔP were normalized by their respective 1979-to-2016 mean value prior to calculating the ratio (Fig. 7a and b). Major exceptions to precipitation tracking soil moisture occurred in the Cluster 4 region where the mean direction of change in precipitation was opposite that of soil moisture during all OND El Niño events of OND and JFM 1983 and 1998 (Table 4). Many of these anomalies are attributed to the lack of agreement between precipitation and the soil moisture direction of change occurring in the southern Amazon basin, Latin America and equatorial Africa including the Sahel. An amplified soil moisture response, particularly in the Sahel during OND 1997 and the southern Amazon basin during OND 1997 and 2015, may be an indication of an important role of land–atmosphere interactions and/or temperature effects.

Figure 7(a) Ratio of bias-corrected GLDAS soil-moisture-to-precipitation change computed using October-to-December (OND) anomalies during El Niño years 1982–1983, 1997–1998 and 2015–2016 relative to previous years. Anomalies relative to the 1979–2016 period. (b) Same as (a) but for January to March in 1983, 1998 and 2016.
Table 4Mean and standard deviation of October-to-December (OND) and January-to-March (JFM) change in the soil-moisture-to-precipitation ratio for the same regions shown in Table 3. Statistics computed using OND and JFM bias-corrected GLDAS soil moisture anomalies during El Niño years 1982–1983, 1997–1998 and 2015–2016 and all 3 years relative to the 1979–2016 mean.
Similarly, changes in the bias-corrected GLDAS soil moisture is in general tracking that of evapotranspiration based on the ratio of ΔSM to ΔET (Fig. 8a and b). Many of the same exceptions to this pattern that were noted with precipitation were also observed here: the mean direction of change in evapotranspiration was opposite to that of soil moisture primarily in the Cluster 4 region during all periods except JFM 2016 (Table 5). The lack of agreement in the direction of evapotranspiration and soil moisture change is also strongest in the southern Amazon basin, Latin America and equatorial Africa including the Sahel, particularly during OND 1997 and JFM 1998. Amplification of soil moisture relative to evapotranspiration also occurred, especially in the southern Amazon basin and equatorial Africa during OND 1997 and JFM 1998.
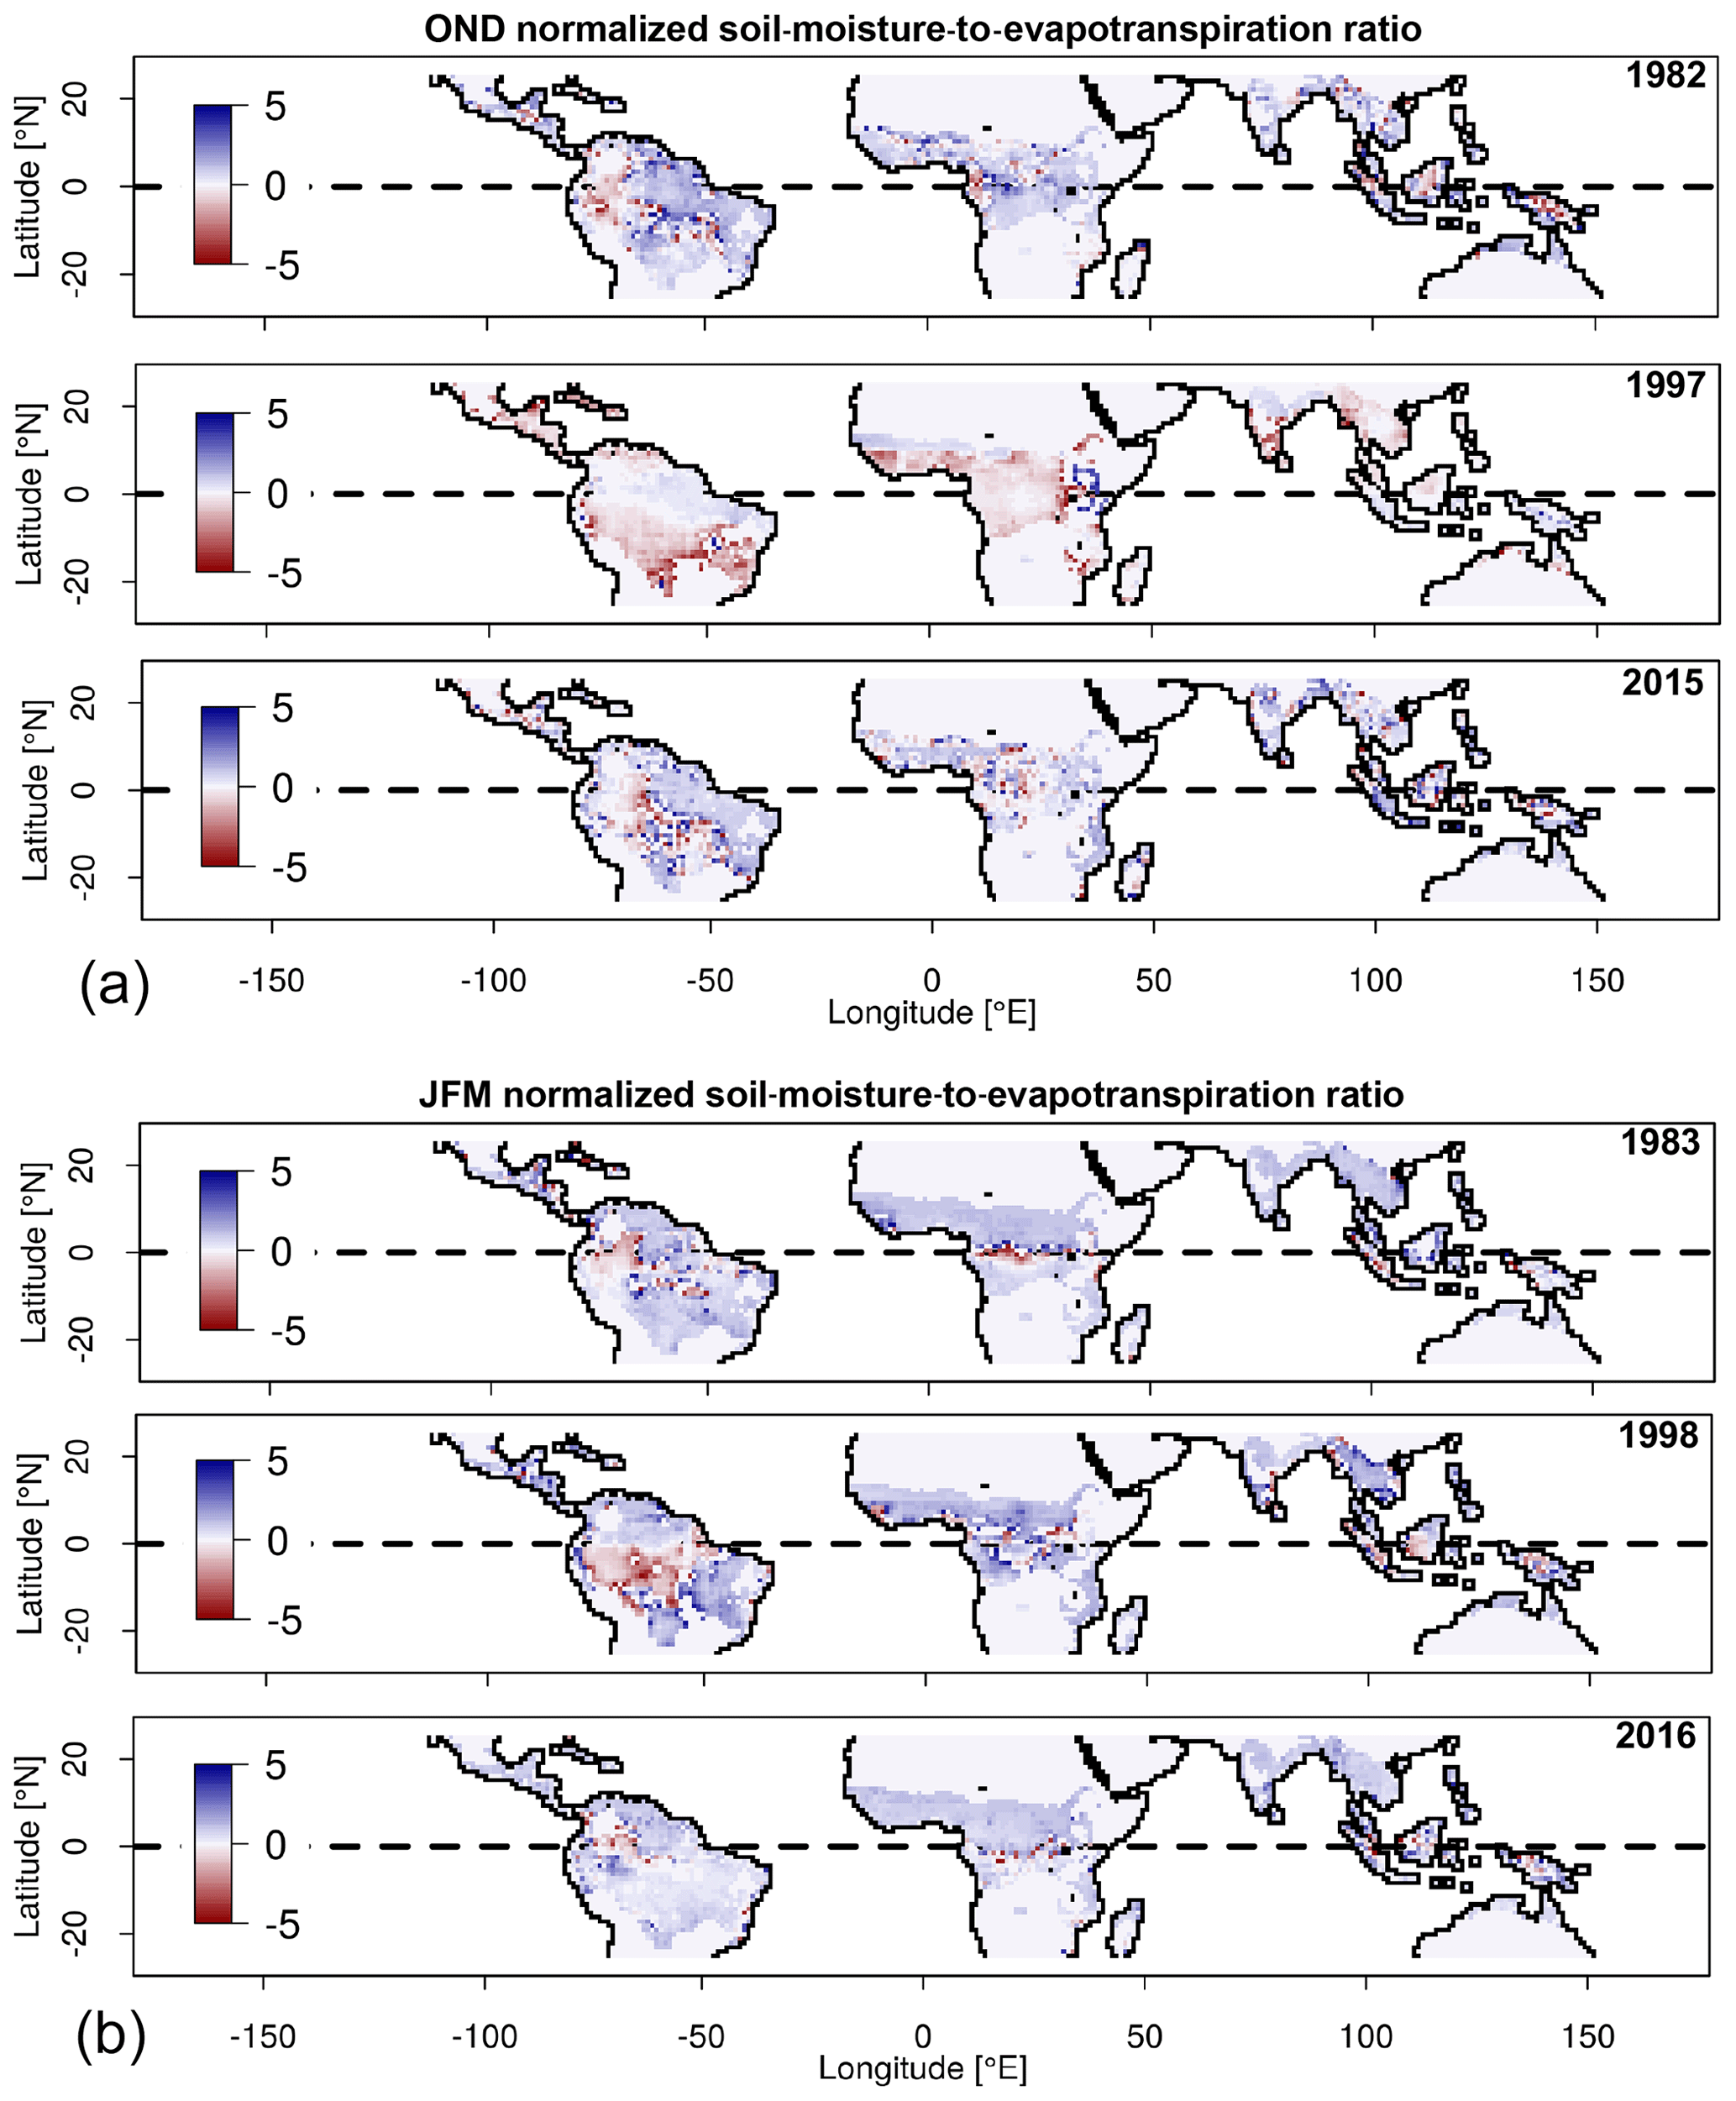
Figure 8(a) Ratio of bias-corrected GLDAS soil-moisture-to-evapotranspiration change computed using October-to-December (OND) anomalies during El Niño years 1982–1983, 1997–1998 and 2015–2016 relative to previous years. Anomalies relative to the 1979–2016 period. (b) Same as (a) but for January to March in 1983, 1998 and 2016.
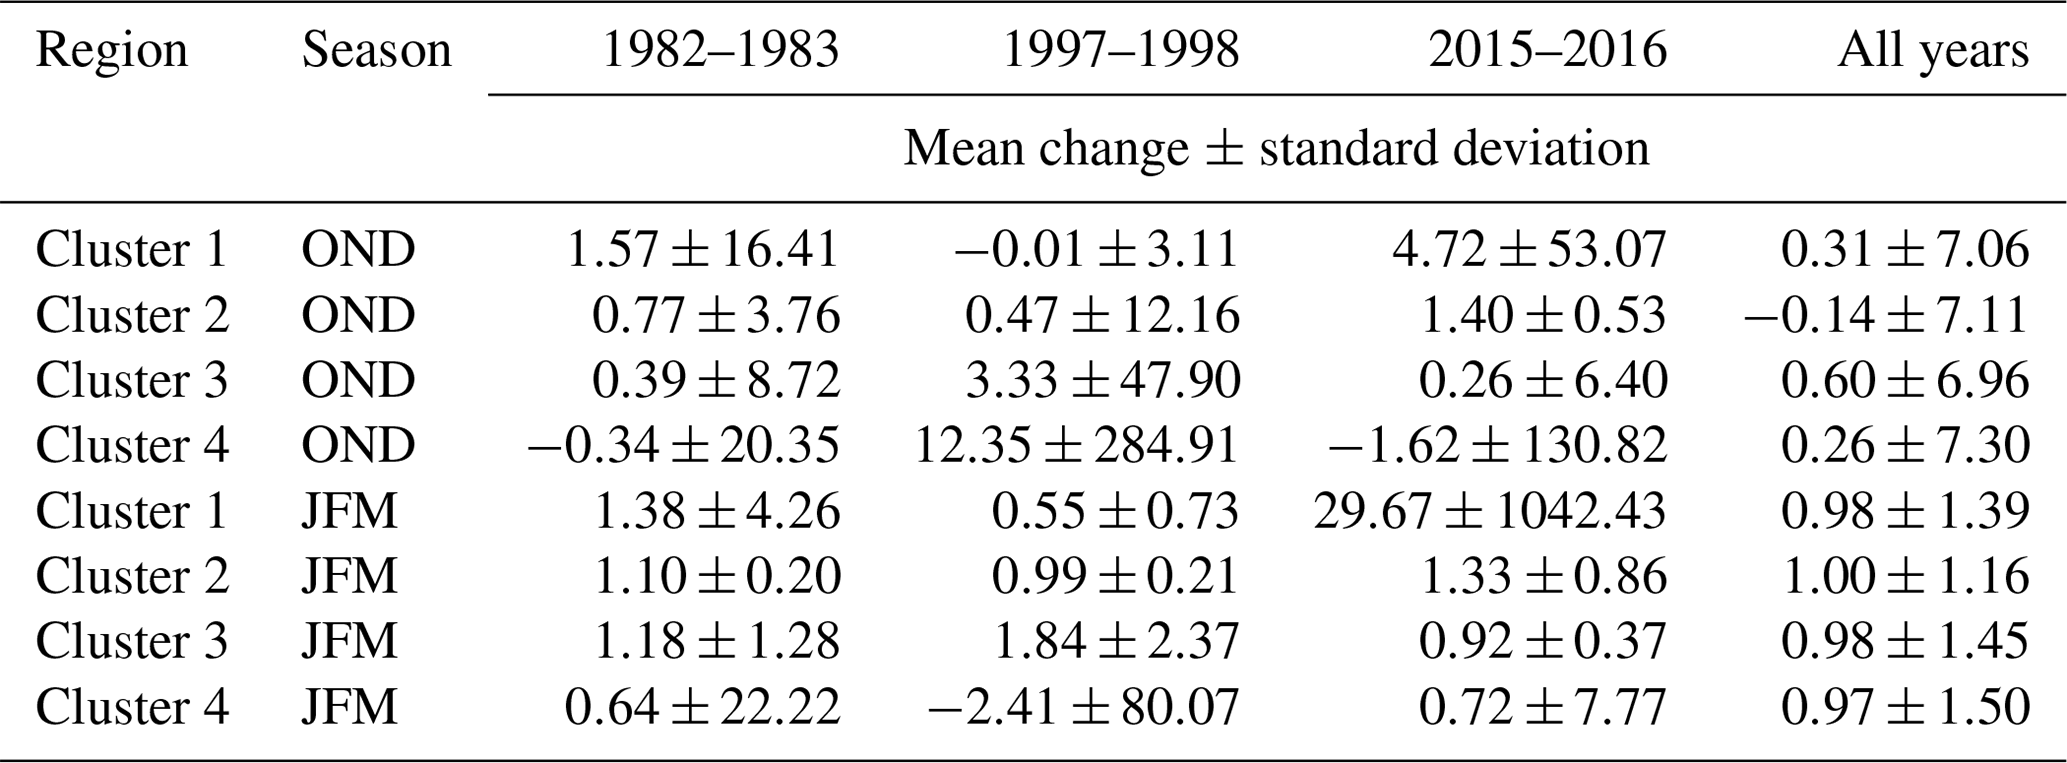
Table 5Mean and standard deviation of October-to-December (OND) and January-to-March (JFM) change in the soil-moisture-to-evapotranspiration ratio for the same regions shown in Table 3. Statistics computed using OND and JFM bias-corrected GLDAS soil moisture anomalies during El Niño years 1982–1983, 1997–1998 and 2015–2016 and all 3 years relative to the 1979–2016 mean.
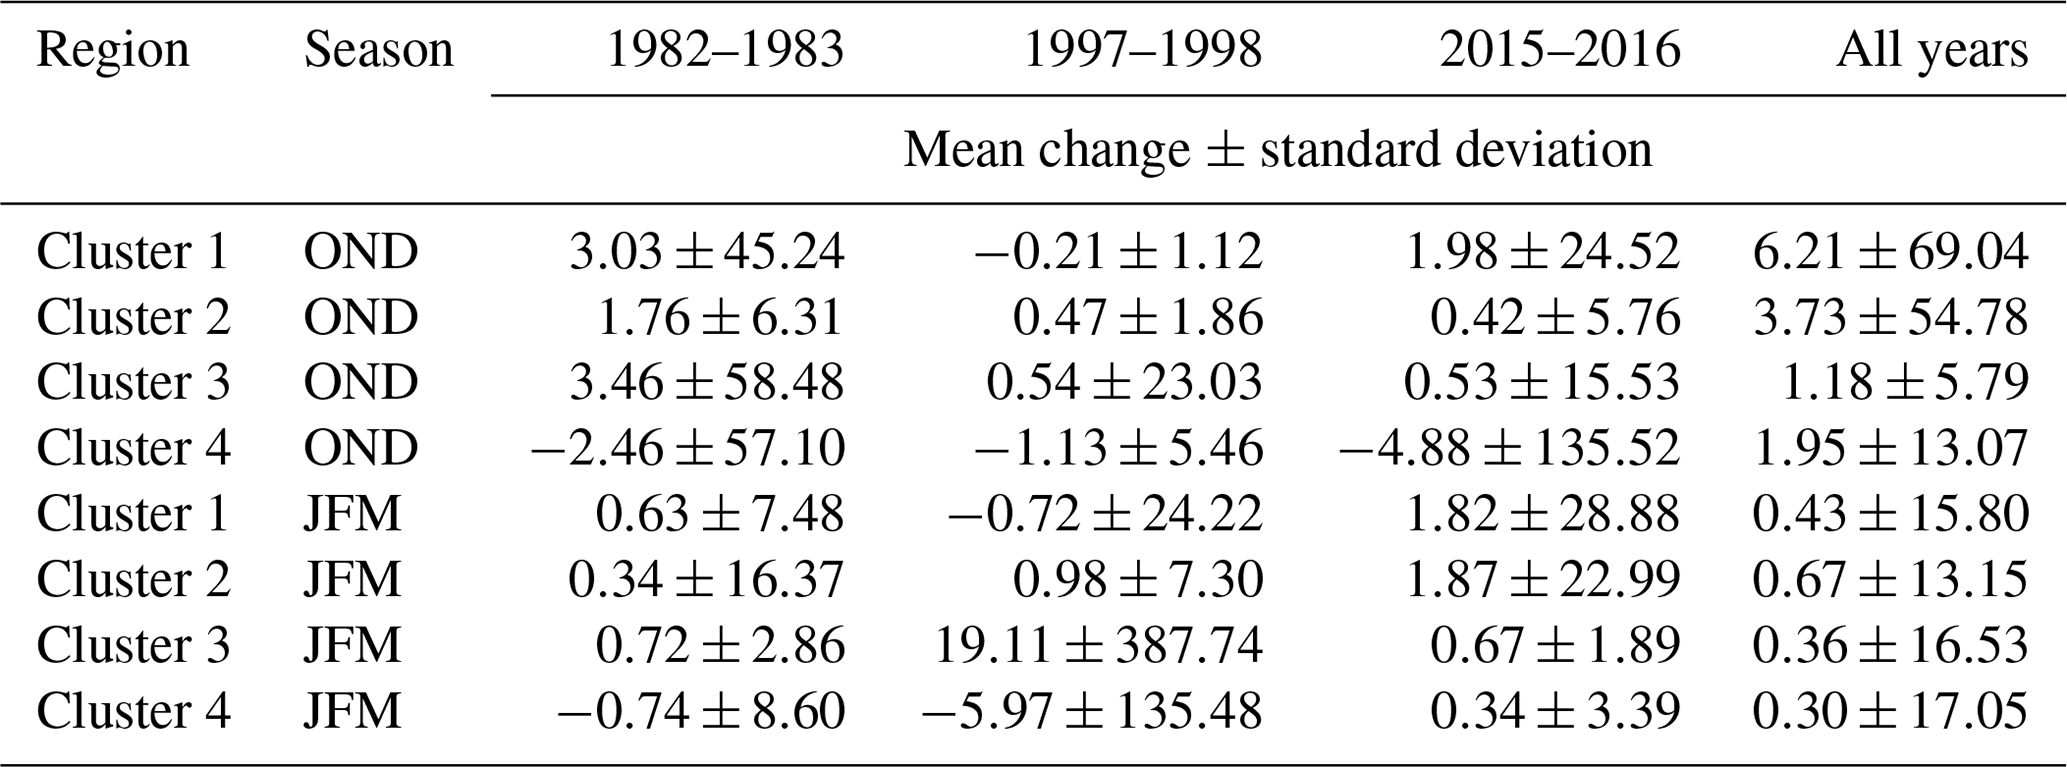
Table 6Mean and standard deviation of 1979–2016 GLDAS soil moisture correlation with the Niño-3.4 index for the same regions shown in Table 3.
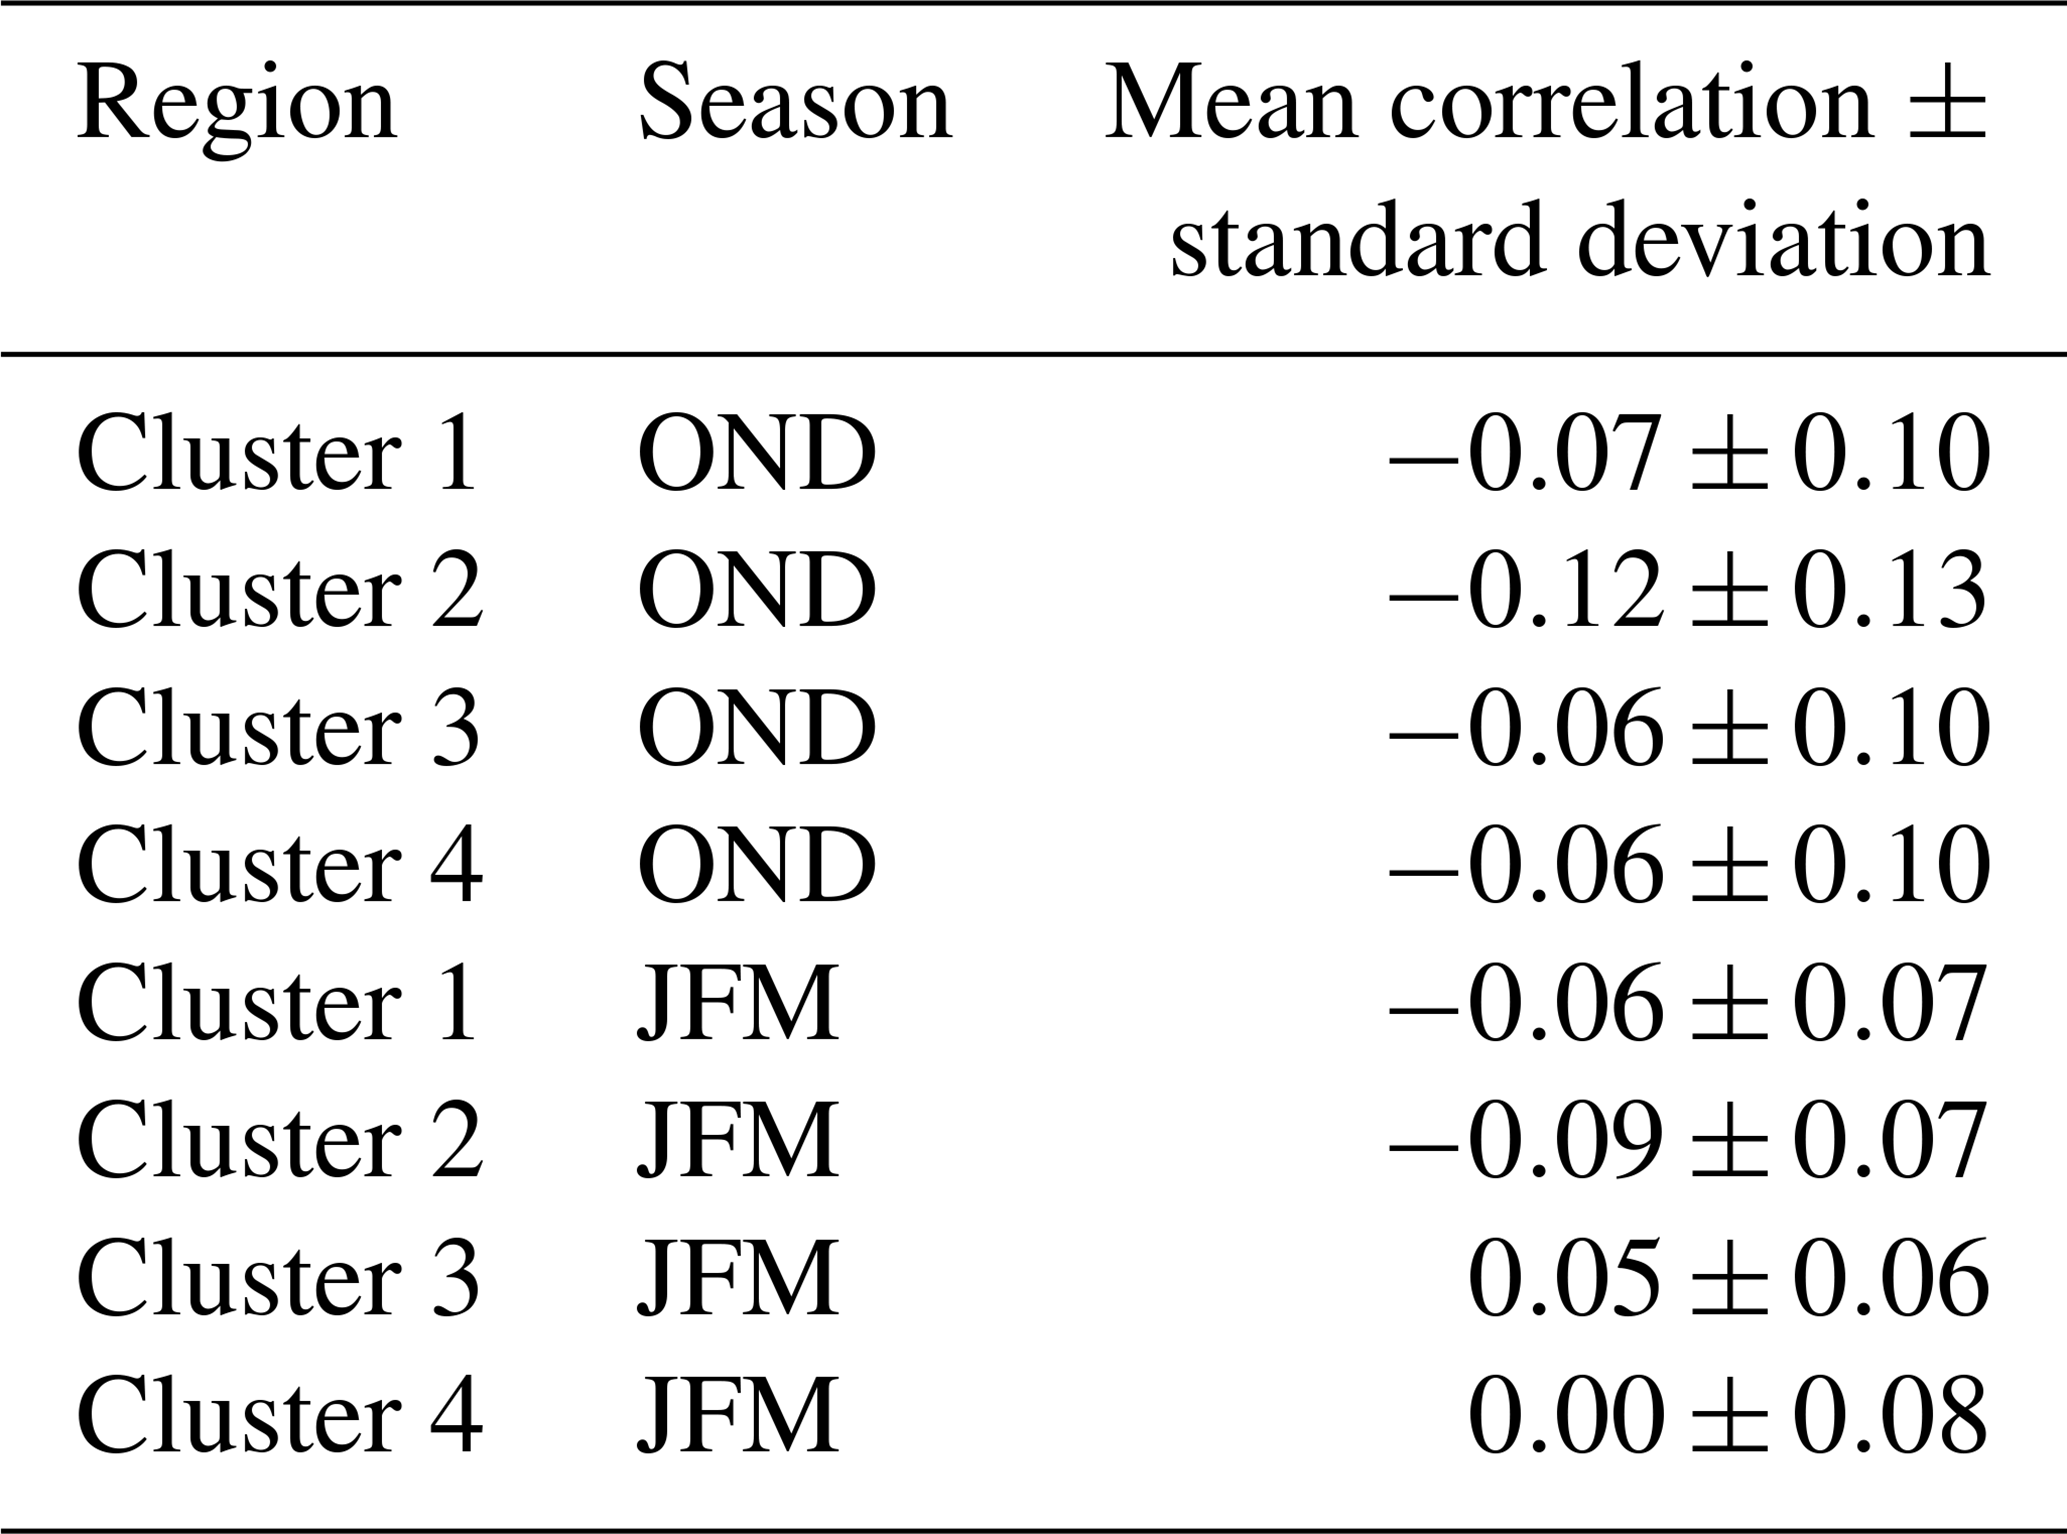
The Pearson correlation coefficient (r) between the bias-corrected GLDAS soil moisture and the Niño-3.4 index for the humid tropics across the 38-year record is provided in Fig. 9. In most regions, there is an inverse relationship indicating the occurrence of El Niño leads to decreased soil moisture within the tropics. The mean correlation over the clustered regions are provided in Table 6, which indicates that the strongest mean negative correlations of −0.12 and −0.09 occurred in Cluster 2 during OND and JFM, respectively. The Cluster 2 group includes the Amazon basin, the Sahel, southeastern Asia and maritime southeastern Asia, many of which were also shown to have the strongest and most consistent decreases in soil moisture during the super El Niños. The strongest positive correlation of 0.05 occurred in Cluster 3 during JFM, which includes the southern Amazon basin, eastern Africa and northern Australia. These same regions also had the strongest and most consistent increases in soil moisture during the super El Niños.
Changes in the non-bias-corrected GLDAS OND and JFM soil moisture anomalies are those that correspond to Figs. 5–9 and are included in the Supplement (Figs. S1–S5). For both OND and JFM, the application of the bias-corrected estimate effectively led to a strengthening of the change in soil moisture anomalies relative to the original GLDAS estimates. The strengthening of the magnitude generally falls between −0.05 and +0.05 with higher values occurring in regions where the original change in soil moisture anomaly magnitude is higher in Fig. 5a and b, such as the northeastern Amazon basin and eastern Africa.
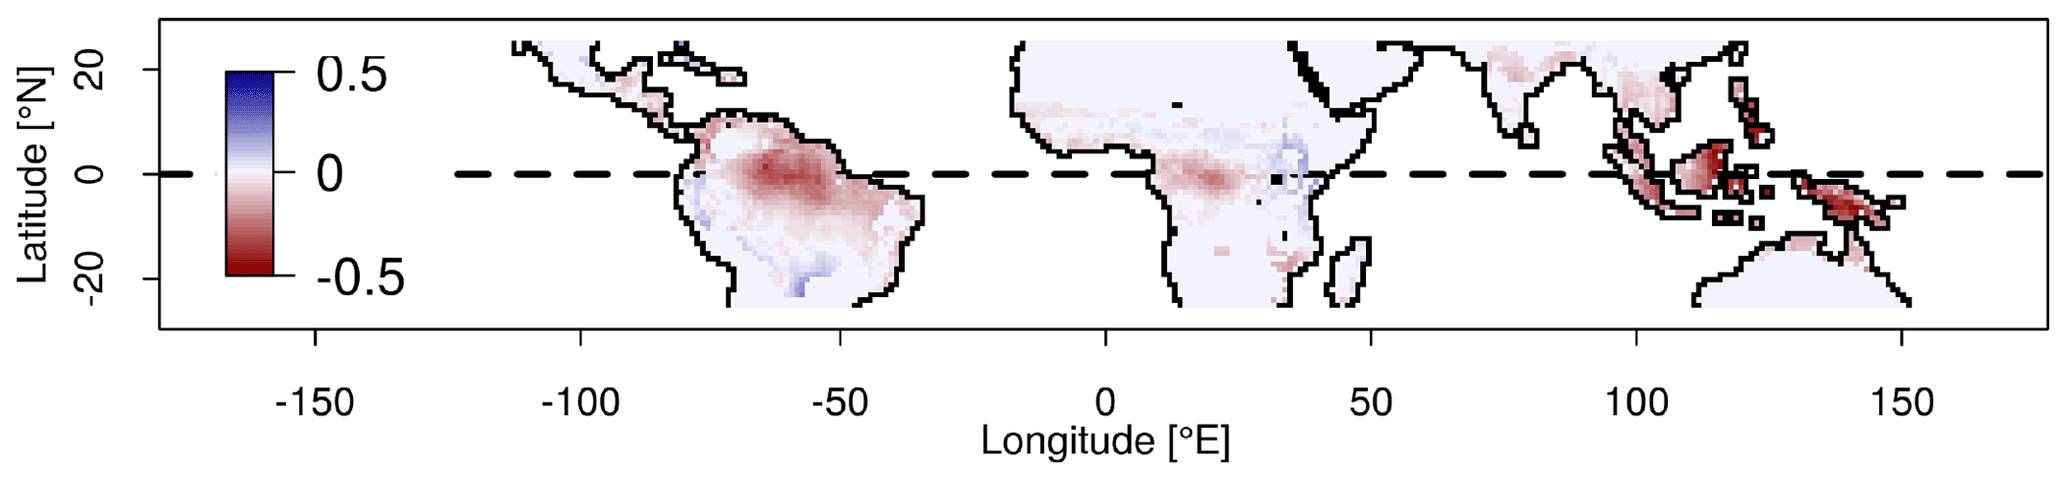
Figure 9Pearson correlation coefficient between bias-corrected GLDAS soil moisture and the Niño-3.4 index from 1979 to 2016. Colors indicate regions where the mean correlation was negative (red) and positive (blue).
Our findings generally agree with Miralles et al. (2014), who also reported a decrease in soil moisture over the eastern Amazon basin, the Sahel, mainland southeastern Asia and northern Australia, as well as an increase over eastern Africa. Similar to van Schaik et al. (2018), we found more acute reductions in soil moisture over the northeastern part of the Amazon basin during OND, but the center of these reductions shifted further west during JFM. This is shown in Fig. 5a and b as well as Cluster 2 in Fig. 6a and b, which indicates the decrease in the soil moisture anomaly which reached a maximum of 0.28 over the Cluster 2 region. However, our methods allowed for a spatially continuous estimate across regions as well as an assessment of soil moisture across seasons (e.g., OND vs. JFM) while focusing on super El Niño events. As a result, we found several key differences in the soil moisture response to El Niño relative to previous studies. Specifically, this includes increases in the soil moisture anomaly of up to 0.24 over Latin America during OND, decreases in the soil moisture anomaly of up to 0.28 over the Sahel during OND, decreases in the soil moisture anomaly of up to 0.28 over maritime regions of southeastern Asia during both OND and JFM, and increases in the soil moisture anomaly of up to 0.24 over southern India during OND and northern Australia during JFM.
The southern Amazon basin stuck out as one region where the direction or magnitude of change in soil moisture did not necessarily match that of precipitation or evapotranspiration. This may in part be due to the distinction in climate impacts between the northern and southern Amazon basins during an El Niño event. The northern Amazon basin is influenced by displacement of the Intertropical Convergence Zone (ITCZ) and changes in the Hadley cell positioning during this time, which forces the ITCZ northward resulting in a reduction of rainfall (Marengo, 1992). However, the southern Amazon basin is primarily dependent on the South Atlantic Conversion Zone (SACZ), which is not as influenced by El Niño. In general, during the peak El Niño season the intensification of the SACZ enhances the southerly flow of low-level jets (LLJs). Circulation blockages produced by the Andes help to channelize and intensify the LLJs over the southern Amazon basin, resulting in LLJs having primary control on temperature and precipitation regimes within the region during the austral summer. Consequently, the southern Amazon basin actually experiences more rain during this time, but the predictability of the timing and magnitude of this sequence events and associated impacts on rainfall is generally lower than that of El Niño for the northern Amazon basin (Marengo et al., 2002, 2004). Moreover, rainfall processes in the southern Amazon basin depend on the displacement of cold fronts and mesoscale circulation patterns, which occur at the synoptic scale. Thus, the lack of agreement between precipitation and evapotranspiration change with soil moisture change in this region occurs because of the strong impacts of atmospheric processes that originate outside of this region (Silva Dias et al., 2002).
The spatial patterns we identified indicate that the relationship between soil moisture and El Niño is more nuanced than what is revealed from the correlation of soil moisture with the Niño-3.4 index. Although this analysis still indicates that much of South America, mainland southeastern Asia and nearby islands respond most strongly to El Niño, the pixels with stronger correlations do not precisely align with the regions identified where the most consistent directional change during the three super El Niño events was observed. For example, weak correlations () between soil moisture and the Niño-3.4 index were identified throughout the Sahel, Latin America and mainland southeastern Asia during both OND and JFM, despite portions of these regions showing a consistent positive or negative change in soil moisture during super El Niño events. Several factors might be contributing to this issue. First, as shown in Fig. 5, the Sahel shows more widespread increases in soil moisture during OND but decreases during JFM. Thus, the inverse weak correlation in this region might be occurring due to contrasting changes in soil moisture brought on by El Niño during the first and second halves of the peak El Niño season. Second, we targeted the three most recent super El Niños to evaluate the tropical soil moisture response, while the Niño-3.4 index does not distinguish between the magnitude or type (e.g., central Pacific or eastern Pacific) of El Niño (Kao and Yu, 2009; Yu and Zou, 2013). As such, the correlations shown in Fig. 8 are more representative of mean El Niño conditions, while the soil moisture changes depicted in Fig. 5a and b are representative of super El Niño conditions. We refrained from conducting the correlation between soil moisture and the Niño-3.4 index using only months when the three super El Niños occurred because this would severely limit the number of observations available for use in the analysis. Another potential issue is related to the accuracy of the GLDAS soil moisture response to El Niño for the tropics, which was dealt with through comparison to in situ observations.
The large disagreement between in situ and bias-corrected GLDAS soil moisture for some locations is likely to be the result of a mismatch in scale between these two datasets. As a result, GLDAS pixels with greater topography, land cover or soil heterogeneity are less likely to match in situ observations. For instance, in the Manaus region of the central Amazon basin, soils can vary from greater than 90 % clay on plateaus to greater than 90 % sand in valleys at a horizontal distance of only 500 m, and the soil moisture can vary from over 100 % in this span (Chauvel et al., 1987; Tomasella et al., 2008; Cuartas et al., 2012). During dry periods such as those that typify a peak super El Niño event for this region, strong variations in soil moisture have been detected at depths of up to 5 m (Broedel et al., 2017). Because the maximum soil depth represented by GLDAS is restricted to more shallow soil layers, the soil moisture variability represented in GLDAS for this region should be taken with caution. Ideally, multiple in situ observations at greater soil depths could be used for comparison to each GLDAS pixel that was tested, but this level of data coverage is generally not available for soil moisture, particularly in tropical regions (Brocca et al., 2017). Although GLDAS also includes a 0.25∘ soil moisture product, the higher-spatial-resolution data only include estimates from one model and do not provide estimates from all three of the most recent super El Niños.
The spatial patterns exhibited in Figs. 7 and 8 highlight some important soil moisture feedbacks during El Niño that may be related to seasonal changes in precipitation recycling, which is known to be a particularly important process for moisture generation over the Amazon basin (Eltahir and Bras, 1994, 1996). For example, there was a large region over the southern Amazon basin where precipitation and evapotranspiration were inversely related to soil moisture during OND, and the location of this disagreement generally shifted further north towards the Equator during JFM. Likewise, over Africa, there was a large region where precipitation and evapotranspiration were inversely related to soil moisture centered north of the Equator during OND, but the location of this disagreement shifted south of the Equator during JFM. Negative feedbacks among these variables occur either where soils are close to saturation and additional soil moisture is more likely to result in runoff than increases in evapotranspiration and precipitation or where soils are so dry that additional moisture is less likely to cause a corresponding increase in evapotranspiration or precipitation due to soil moisture suctioning (Seneviratne et al., 2010; Yang et al., 2018). It is more likely that the latter process is occurring over the Amazon basin, while the former is occurring over equatorial Africa, given the seasonal occurrence of dry and wet soil moisture conditions shown over these regions in Fig. 5. Moreover, strong El Niños are frequently associated with a negative phase of the Atlantic dipole that displaces the Inter Tropical Convergence Zone northward, which favors drier conditions over the Amazon basin and wetter conditions over sub-Saharan Africa (Hastenrath and Heller, 1977). The displacement of the ITCZ and Pacific warming in Peru also weakens trade winds over the Amazon basin, which serves to limit moisture transport from the Atlantic towards the Amazon basin, further drying out this region (Satyamurty et al., 2013). The end result of these changes are negative ratios shown in Figs. 7 and 8, potentially highlighting weaker precipitation recycling that shifts north from OND to JFM over the Amazon basin but south from OND to JFM over equatorial Africa. When precipitation recycling weakens, a greater proportion of atmospheric moisture over these regions will be derived from further away over the ocean rather than locally over land.
Several strategies exist that can increase confidence in soil moisture estimates from data products like GLDAS. First, in situ observations of soil moisture need to improve in both space and time to evaluate and constrain the land surface models used in GLDAS. The distribution of soil moisture observations is much lower in tropical regions than other areas (Brocca et al., 2017), which is not surprising given the dearth of hydrologic observations available from developing countries in tropical regions (Alsdorf et al., 2007) coupled with the reported decrease in hydrologic monitoring across sites worldwide (McCabe et al., 2017). In addition, increased participation in contributing in situ soil moisture data to online databases such as FLUXNET (ORNL DAAC, 2017b) and ISMN (Dorigo et al., 2011, 2013) would help alleviate the limited access to observational datasets.
Satellite observations of soil moisture can also be used to fill this gap, but a number of issues exist with historical satellite-derived estimates of soil moisture. Substantial biases exist in retrieval algorithms (Entekhabi et al., 2010), and direct estimates are that restricted to shallow soil depths are of limited value when soil moisture at greater depths is needed (McCabe et al., 2017). Such shortcomings have encouraged investigations into the relative influence of vegetation, soil and topography on soil moisture dynamics to better upscale point-based measurements of soil moisture to larger, remotely sensed scales (Gaur and Mohanty, 2016). Algorithms have been developed to interpolate shallow subsurface estimates of soil moisture to the root zone, but a recent global evaluation of the accuracy of the algorithms being used for this purpose to generate Soil Moisture Active Passive (SMAP) Level 4 data was limited to 17 sites, with only one occurring within the tropical climate zone (Reichle et al., 2017). Moreover, satellite radar used to observe soil moisture from many historical missions fails to penetrate dense rainforest canopies, making this data of limited use for many tropical regions. Another issue with satellites is the limited lifetime of the mission coupled with the lack of follow-on missions that would enable extension of the observation record so that impacts from cyclical climate events like ENSO that occur on decadal timescales can be adequately assessed. As a result, data are often combined from multiple missions to extend satellite records, which can introduce additional error (Gruber et al., 2019). Access to more spatially and temporally continuous global soil moisture data from satellites or assimilation products is thus paramount to improve the spatial and temporal resolution of soil moisture estimates and enable better prediction of soil moisture behavior over long timescales (Brocca et al., 2017).
Lastly, the current GLDAS product is produced mainly by running offline land surface models forced with atmospheric data from a combination of rain gauge, satellite, and radar precipitation estimates and outputs (e.g., radiation) from numerical prediction models. Uncertainties and biases in the land models and forcing data can contribute importantly to uncertainties and biases in the GLDAS soil moisture (Piao et al., 2013). Future products that assimilate in situ and remotely sensed observations of terrestrial energy and water storages such as soil moisture and snow and fluxes such as evapotranspiration, sensible heat flux and runoff will likely further improve the quality of GLDAS soil moisture for a better characterization of impacts from El Niño (e.g., Albergel et al., 2012; Gruber et al., 2018). This has important implications for understanding water resources and plant response to ENSO events, given the role of soil moisture in climate extremes due to feedbacks with the atmosphere (Seneviratne et al., 2010).
We describe the response of soil moisture in the humid tropics to El Niño while focusing on impacts from the three most recent super El Niños of 1982–1983, 1997–1998 and 2015–2016 using bias-corrected soil moisture estimates from GLDAS. The largest and most consistent reductions in the soil moisture anomaly of up to 0.28 occurred over the northern Amazon basin and the maritime regions of southeastern Asia, Indonesia and New Guinea. The soil moisture response is largely consistent with the precipitation and evapotranspiration responses, as indicated by the overwhelmingly positive ratio of soil moisture change to both precipitation and evapotranspiration change over the same period in regions with a consistent soil moisture response. Some notable exceptions include the Sahel and southern Amazon basin, where a greater number of pixels show that the direction of change for soil moisture is opposite that of precipitation and evapotranspiration. The soil moisture change was amplified relative to precipitation and evapotranspiration in these areas particularly during OND, suggesting that the soil moisture response may be amplified through land–atmosphere interactions and/or the temperature response and differing climate patterns between the northern and southern Amazon basins. Indeed, land–atmosphere interactions have been suggested to play more of an important role in the regional water cycle over the Amazon basin and Sahel (e.g., Koster et al., 2004; Wang et al., 2013; Levine et al., 2019), so their role in the soil moisture response to El Niño deserves more investigation over these regions in the future.
The comparison of GLDAS estimates to in situ data from 16 reference sites to gauge the utility of these estimates in large-scale models reveals a considerable variability in the performance of GLDAS among the different sites. Although some of the poor performance can invariably be explained by a mismatch in the scale of in situ observations to the coarse, 1∘ resolution of GLDAS, improvements in the availability of ground-based soil moisture observations and access to more data from temporally continuous, global soil-moisture-observing satellite missions that allow for estimates beneath dense rainforest canopies are necessary to improve upon these estimates by constraining land model estimates through data assimilation. Such an effort will be useful to increase the accuracy of tropics hydrology and ecosystem models to make better predictions of El Niño impacts on land surface hydrology.
In situ data that were used for this research are available at the Next-Generation Ecosystem Experiments (NGEE) – Tropics data archive (https://ngt-data.lbl.gov/; NGEE, 2020). All data that were used were cited in Table 1 or credit was given in Acknowledgements. Global soil moisture data products used in this study are publicly available at the following locations: GLDAS at https://disc.gsfc.nasa.gov/datasets?page=1&keywords=GLDAS (NASA, 2020a); ERA5 at https://cds.climate.copernicus.eu/cdsapp#!/dataset/reanalysis-era5-single-levels?tab=overview (ECMWF, 2020); MERRA2 at https://disc.gsfc.nasa.gov/datasets?keywords=22MERRA-222&page=1&source=Models2FAnalyses MERRA-2 (NASA, 2020b); and GLEAM at https://www.gleam.eu/#downloads (ESA CCI, 2020).
The supplement related to this article is available online at: https://doi.org/10.5194/hess-24-2303-2020-supplement.
KCS led and designed the research, performed analytical calculations, created figures, and wrote the paper. BDS assisted in research design and edited the paper. ACA contributed data. HRB contributed data and edited the paper. ZCB contributed data and edited the paper. DB contributed data. MB contributed data. BB contributed data. LAC contributed data. RC contributed data. JQC provided research funding and discussed the results. BOC contributed data and edited the paper. MD contributed data and edited the paper. WAD edited the paper and contributed to the research plan. BEE contributed data. SJFF contributed data. AK contributed data and edited the paper. LRL edited the paper. NGM edited the paper. GRM contributed data and edited the paper. MTFM contributed data. GWM contributed data and edited the paper. RNJ contributed data and edited the paper. SRS contributed data. CS contributed data. JT contributed data and edited the paper. CX assisted in research design and edited the paper.
The authors declare that they have no conflict of interest.
This project was supported as part of the Next-Generation Ecosystem Experiments – Tropics, funded by the United States Department of Energy Office of Science Office of Biological and Environmental Research through the Terrestrial Ecosystem Science program. Data obtained from French Guiana were recorded thanks to an “investissement d'avenir” grant from the Agence Nationale de la Recherche (CEBA no. ANR-10-LABX-25-01; ARBRE no. ANR-11-LABX-0002-01). Data obtained from one of the Panama sites were recorded thanks to an award from the National Science Foundation (NSF; no. 1360305). In situ data collected from Indonesia were made possible by the Deutsche Forschungsgemeinschaft (DFG; German Research Foundation; project no. 192626868 of SFB 990) and the Ministry of Research and Technology/National Research and Innovation Agency (Ministry of Research, Technology and Higher Education; Ristekdikti) in the framework of the collaborative German–Indonesian research project CRC 990. We would also like to thank Charu Varadharajan and Emily Robles for providing valuable assistance with database access and guidance on data storage during the course of this research. The Pacific Northwest National Laboratory is operated for the Department of Energy by Battelle Memorial Institute (contract no. DE-AC05-76RL01830).
This research has been supported by the U.S. Department of Energy, Office of Science (grant for Next-Generation Ecosystem Experiments – Tropics).
This paper was edited by Roger Moussa and reviewed by two anonymous referees.
Acker, J. G. and Leptoukh, G.: Online analysis enhances use of NASA earth science data, EOS T. AGU, 88, p. 14 and 17, 2007.
Albergel, C., Rosnay, P., Gruhier, C., Muñoz-Sabater, J., Hasenauer, S., Isaksen, L., Kerr, Y., and Wagner, W.: Evaluation of remotely sensed and modelled soil moisture products using global ground-based in situ observations, Remote Sens. Environ., 118, 215–226, 2012.
Alsdorf, D. E., Rodríguez, E., and Lettenmaier, D. P.: Measuring surface water from space, Rev. Geophys., 1–24, 2007.
Beringer, J., Hutley, L. B., Tapper, N. J., and Cernusak, L. A.: Savanna fires and their impact on net ecosystem productivity in North Australia, Glob. Change Biol., 13, 990–1004, 2007.
Beringer, J., Hacker, J., Hutley, L. B., Leuning, R., Arndt, S. K., Amiri, R., Bannehr, L., Cernusak, L. A., Grover, S., Hensley, C., Hocking, D., Isaac, P., Hizbullah, J., Kanniah, K., Livesley, S., Neininger, B., Paw U, K. T., Sea, W., Straten, D., Tapper, N., Weinmann, R., Wood, S., and Zegelin, S.: Special – Savanna patterns of energy and carbon integrated across the landscape, B. Am. Meteorol. Soc., 92, 1467-1485, 2011.
Beringer, J., Livesley, S. J., Randle, J., and Hutley, L. B.: Carbon dioxide fluxes dominate the greenhouse gas exchanges of a seasonal wetland in the wet-dry tropics of northern Australia, Agr. Forest Meteorol., 182–183, 239–247, 2013.
Bonal, D., Bosc, A., Ponton, S., Goret, J-Y., Burban, B., Gross, P., Bonnefond, J.-M., Elbers, J., Longdoz, B., Epron, D., Guehl, and J.-M., Granier, A.: Impact of severe dry season on net ecosystem exchange in the Neotropical rainforest of French Guiana, Glob. Change Biol., 14, 1917–1933, 2008.
Bretfeld, M., Ewers, B. E., and Hall, J. S.: Plant water use responses along secondary forest succession during the 2015–2016 El Niño drought in Panama, New Phytol., 219, 885–899, 2018.
Brocca, L., Ciabatta, L., Massari, C., Camici, S., and Tarpanelli, A.: Soil moisture for hydrological applications: open questions and new opportunities, Water, 9, 1–20, 2017.
Broedel, E., Tomasella, J., Cândido, L. A., and Randow, C. V.: Deep soil water dynamics in an undisturbed primary forest in central Amazonia: differences between normal years and the 2005 drought, Hydrol. Process., 31, 1749–1759, 2017.
Bunge, L. and Clarke, A. J.: A verified estimation of the El Niño Index Niño-3.4 since 1877, J. Climate, 22, 3979–3992, 2009.
Caliński, T. and Harabasz, J.: A dendrite method for cluster analysis, Commun. Stat.-Theor. M., 3, 1–27, 1974.
Charrad, M., Ghazzali, N., Boiteau, V., and Niknafs, A.: NbClust: An R package for determining the relevant number of clusters in a data set, J. Stat. Softw., 61, 1–36, 2014.
Chauvel, A., Lucas, Y., and Boulet, R.: On the genesis of the soil mantle of the region of Manaus, Central Amazonia, Brazil, Experientia, 43, 234–241, 1987.
Chen, L., Li, T., Wang, B., and Wang, L.: Formation mechanism for 2015/16 super El Niño, Sci. Rep.-UK, 7, 1–10, 2017.
Chou, C., Huang, L.-F., Tu, J.-Y., Tseng, L., and Hsueh, Y.-C.: El Niño impacts on precipitation in the western North Pacific-East Asian Sector, J. Climate, 22, 2039–2057, 2009.
Copernicus Climate Change Service (C3S): ERA5: Fifth generation of ECMWF atmospheric reanalyses of the global climate, Copernicus Climate Change Service Climate Data Store (CDS), 10 April 2019, available at: https://cds.climate.copernicus.eu/cdsapp#!/dataset/reanalysis-era5-single-levels?tab=overview (last access: 1 May 2018), 2017.
Cuartas, L. A., Tomasella, J., Nobre, A. D., Nobre, C. A., Hodnett, M. G., Waterloo, M. J., de Oliveira, S. M., von Randow, R. C., Trancoso, R., and Ferreira, M.: Distributed hydrological modeling of a micro-scale rainforest watershed in Amazonia: model evaluation and advances in calibration using the new HAND terrain model, J. Hydrol., 462–463, 15–27, 2012.
Dai, A. and Wigley, T. M. L.: Global patterns of ENSO-induced precipitation, Geophys. Res. Lett., 27, 1283–1286, 2000.
Dai, Y., Zeng, X., Dickinson, R. E., Baker, I., Bonan, G. B., Bosilovich, M. G., Denning, A. S., Dirmeyer, P. A., Houser, P. R., Niu, G., Oleson, K. W., Schlosser, C. A., and Yang, Z.-L.: The common land model (CLM), B. Am. Meteorol. Soc., 84, 1013–1024, 2003.
Davies, D. L. and Bouldin, D. W.: A cluster separation measure, IEEE T. Pattern Anal., 1, 224–227, 1979.
Dorigo, W. A., Wagner, W., Hohensinn, R., Hahn, S., Paulik, C., Xaver, A., Gruber, A., Drusch, M., Mecklenburg, S., van Oevelen, P., Robock, A., and Jackson, T.: The International Soil Moisture Network: a data hosting facility for global in situ soil moisture measurements, Hydrol. Earth Syst. Sci., 15, 1675–1698, https://doi.org/10.5194/hess-15-1675-2011, 2011.
Dorigo, W. A., Xaver, A., Vreugdenhil, M., Gruber, A., Hegyiová, A., Sanchis-Dufau, A.D., Zamojski, D., Cordes, C., Wagner, W., and Drusch, M.: Global automated quality control of in-situ soil moisture data from the International Soil Moisture Network, Vadose Zone J., 12, 1–21, https://doi.org/10.2136/vzj2012.0097, 2013.
Dorigo, W., Wagner, W., Albergel, C., Albrecht, F., Balsamo, G., Brocca, L., Chung, D., Ertl, M. Forkel, M., Gruber, A. Haas, E., Hamer, P. D., Hirschi, M., Ikonen, J., de Jeu, R., Kidd, R., Lahoz, W., Liu, Y. Y., Miralles, D., Mistelbauer, T., Nicolai-Shaw, N., Parinussa, R., Pratola, C., Reimer, C., van der Scalie, R., Seneviratne, S.I., Smolander, T., and Lecomte, P.: ESA CCI Soil Moisture for improved Earth system understanding: State-of-the-art and future directions, Remote Sens. Environ., 203, 185–215, 2017.
Dunn, J.: Well separated clusters and optimal fuzzy partitions, J. Cybernetics, 4, 95–104, 1974.
Ek, M. B., Mitchell, K. E., Lin, Y., Rogers, E., Grunmann, P. Koren, V., Gayno, G., and Tarpley, J. D.: Implementation of Noah land surface model advances in the National Centers for Environmental Prediction operational mesoscale Eta model, J. Geophys. Res., 108, 1–16, 2003.
Eltahir, E. A. B. and Bras, R. L.: Precipitation recycling in the Amazon basin, Q. J. Roy. Meteorol. Soc., 120, 861–880, 1994.
Entekhabi, D., Reichle, R. H., Koster, R. D., and Crow, W. T.: Performance metrics for soil moisture retrievals and application requirements, J. Hydrometeorol., 11, 832–840, 2010.
European Center for Medium-Range Weather Forecasts (ECMWF): Fifth generation reanalysis from ECMWF (ERA5), available at: https://cds.climate.copernicus.eu/cdsapp#!/dataset/reanalysis-era5-single-levels?tab=overview, last access: 1 May 2020.
European Space Agency Climate Change Initiative (ESA CCI): Global Land Evaporation Amsterdam Model (GLEAM), available at: https://www.gleam.eu/#downloads, last access: 1 May 2020.
Gaur, N. and Mohanty, B. P.: Land-surface controls on near-surface soil moisture dynamics: traversing remote sensing footprints, Water Resour. Res., 52, 6365–6385, 2016.
Gelaro, R., McCarty, W., Suárez, M. J., Todling, R., Molod, A., Takacs, L., Randles, C. A., Darmenov, A., Bosilovich, M. G., Reichle, R. Wargan, K., Coy, L., Cullather, R., Draper, C., Akella, S., Buchard, V., Conaty, A., da Silver, A. M., Gu, W., Kim, G.-K., Koster, R., Lucchesi, R., Merkova, D., Nielsen, J. E., Partyka, G., Pawson, S., Putman, W., Rienecker, M., Schubert, S. D., Sienkiewicz, M., and Zhao, B.: The Modern-Era Retrospective Analysis for Research and Applications, Version 2 (MERRA-2), J. Climate, 30, 5419–5454, 2017.
Goulden, M. L., Miller, S. D., da Rocha, H. R., Menton, M. C., de Freitas, H. C., e Silva Figueira, A. M., and de Sousa, C. A. D.: Diel and seasonal patterns of tropical forest CO2 exchange, Ecol. Appl., 14, S42–S54, 2004.
Green, J. K., Seneviratne, S. I., Berg, A. M., Findell, K. L., Hagemann, S., Lawrence, D. M., and Gentine, P.: Large influence of soil moisture on long-term terrestrial carbon uptake, Nature, 565, 476–479, 2019.
Gruber, A., Crow, W. T., and Dorigo, W. A.: Assimilation of spatially sparse in situ soil moisture networks into a continuous model domain, Water Resour. Res., 54, 1353–1367, 2018.
Gruber, A., Scanlon, T., van der Schalie, R., Wagner, W., and Dorigo, W.: Evolution of the ESA CCI Soil Moisture climate data records and their underlying merging methodology, Earth Syst. Sci. Data, 11, 717–739, https://doi.org/10.5194/essd-11-717-2019, 2019.
Halkidi, M., Vazirgiannis, M., and Batistakis, I.:, Quality scheme assessment in the clustering process, in: Principles of data mining and knowledge discovery, edited by: Zighed, D. A., Komorowski, J., and Żytkow, J., PKDD 2000, L:ecture notes in computer science, vol. 1910, Springer, Berlin, Heidelberg, 2000.
Halkidi, M. and Vazirgiannis, M.: Clustering validity assessment: finding the optimal partitioning of a data set, Proceedings of the 2001 IEEE International Conference on Data Mining, 187–194, 2001.
Hameed, S. N., Jin, D., and Thilakan, V.: A model for super El Niños, Nat. Commun., 9, 1–15, 2018.
Hastenrath, S. and Heller, L.: Dynamics of climatic hazards in northeast Brazil, Q. J. Roy. Meteorol. Soc., 103, 77–92, 1977.
Hong, L.-C., LinHo, and Jin, F.-F.: A Southern Hemisphere booster of super El Niño, Geophys. Res. Lett., 41, 2142–2149, 2014.
Huang, B., L'Heureux, M., Hu, Z.-Z., and Zhang, H.-M.: Ranking the strongest ENSO events while incorporating SST uncertainty, Geophys. Res. Lett., 43, 9165–9172, 2016.
Huang, P. and Chen, D.: Enlarged asymmetry of tropical Pacific rainfall anomalies induced by El Niño and La Niña under global warming, J. Climate, 30, 1327–1343, 2017.
Hubert, L. J. and Levin, J. R.: A general statistical framework for assessing categorical clustering in free recall, Psychol. Bull., 83, 1072–1080, 1976.
Iizumi, T., Luo, J.-J., Challinor, A. J., Sakurai, G., Yokozawa, M., Sakuma, H., Brown, M. E., and Yamagata, T.: Impacts of El Niño Southern Oscillation on the global yields of major crops, Nat. Commun., 5, 1–7, 2014.
Jardine, K., Gimenez, B., Negron-Juarez, R., Holm, J., Araujo, A., Higuchi, N., and Chambers, J.: Raw/translated data and metadata from sensor measurements at Manaus, Brazil, 15 February 2015–14 July 2016, NGEE Tropics Data Collection, 2019.
Jiménez-Muñoz, J. C., Mattar, C., Barichivich, J., Santamaria-Artigas, A., Takahashi, K., Malhi, Y., Sobrino, J. A., and van der Schrier, G.: Record-breaking warming and extreme drought in the Amazon rainforest during the course of El Niño 2015–16, Sci. Rep.-UK, 6, 1–7, 2016.
Jones, P. D., Osborn, T. J., and Briffa, K. R.: The evolution of climate over the last millennium, Science, 292, 662–667, 2001.
Kang, C. S., Kanniah, K. D., Kerr, Y. H., and Cracknell, A. P.: Analysis of in-situ soil moisture data and validation of SMOS soil moisture products at selected agricultural sites over a tropical region, Int. J. Remote Sens., 37, 3636–3654, 2016.
Kao, H.-Y. and Yu, J.-Y.: Contrasting Eastern-Pacific and Central-Pacific Types of ENSO, J. Climate, 22, 615–632, 2009.
Köhli, M., Schrön, M. , Zreda, M., Schmidt, U., Dietrich, P., and Zacharias, S., Footprint characteristics revised for field-scale soil moisture monitoring with cosmic-ray neutrons, Water Resour. Res., 51, 5772–5790, 2015.
Koster, R. and Suarez, M.: Energy and water balance calculations in the Mosaic LSM NASA Tech Memo, 104606, p. 76, 1996.
Koster, R. D., Dirmeyer, P. A., Guo, Z., Bonan, G., Chan, E., Cox, P., Gordon, C. T., Kanae, S., Kowalczyk, E., Lawrence, D., Liu, P., Lu, C.-H., Malyshev, S., McAvaney, B., Mitchell, K., Mocko, D., Oki, T., Oleson, K., Pitman, A., Sud, Y. C., Taylor, C. M., Verseghy, D., Vasic, R., Xue, Y., and Yamada, T.: Regions of strong coupling between soil moisture and precipitation, Science, 305, 1138–1140, 2004.
Kottek, M., Grieser, J., Beck, C., Rudolf, B., and Rubel, F.: World Map of the Köppen-Geiger climate classification updated, Meteorol. Z., 15, 259–263, 2006.
Krzanowski, W. J. and Lai, Y. T.: A Criterion for determining the number of groups in a data set using sum-of-squares clustering, Biometrics, 44, 23–34, 1988.
Larson, K. M., Small, E. E., Gutmann, E. D., Bilich, A. L., Braun, J. J., and Zavorotny, V. U.: Use of GPS receivers as a soil moisture network for water cycle studies, Geophys. Res. Lett., 35, 1–5, 2008.
Levine, P. A., Randerson, J. T., Chen, Y., Pritchard, M. S., Xu, M., and Hoffman, F. M.: Soil moisture variability intensifies and prolongs eastern Amazon temperature and carbon cycle response to El Niño-Southern Oscillation, J. Climate, 32, 1273–1292, 2019.
Liang, X., Lettenmaier, D. P., Wood, E. F., and Burges, S. J.: A simple hydrologically based model of land surface water and energy fluxes for general circulation models, J. Geophys. Res., 99, 14415–14428, 1994.
Liu, Y. Y., Dorigo, W. A., Parinussa, R. M., de Jeu, R. A. M., Wagner, W., McCabe, M. F., Evans, J. P., and van Dijk, A. I. J. M.: Trend-preserving blending of passive and active microwave soil moisture retrievals, Remote Sens. Environ., 123, 280–297, 2012.
Marengo, J.: Interannual variability of surface climate in the Amazon basin, Int. J. Climatol., 12, 853–863, 1992.
Marengo, J. A., Douglas, M. W., and Silva Dias, P. L.: The South American low-level jet east of the Andes during the 1999 LBA-TRMM and LBA-WET AMC campaign, J. Geophys. Res., 107, 1–11, 2002.
Marengo, J. A., Soares, W. R., Saulo, C., and Nicolini, M.: Climatology of the low-level jet east of the Andes as derived from the NCEP-NCAR Reanalyses: characteristics and temporal variability, J. Climate, 17, 2261–2280, 2004.
Martens, B., Miralles, D. G., Lievens, H., van der Schalie, R., de Jeu, R. A. M., Fernández-Prieto, D., Beck, H. E., Dorigo, W. A., and Verhoest, N. E. C.: GLEAM v3: satellite-based land evaporation and root-zone soil moisture, Geosci. Model Dev., 10, 1903–1925, https://doi.org/10.5194/gmd-10-1903-2017, 2017.
McCabe, M. F., Rodell, M., Alsdorf, D. E., Miralles, D. G., Uijlenhoet, R., Wagner, W., Lucieer, A., Houborg, R., Verhoest, N. E. C., Franz, T. E., Shi, J., Gao, H., and Wood, E. F.: The future of Earth observation in hydrology, Hydrol. Earth Syst. Sci., 21, 3879–3914, https://doi.org/10.5194/hess-21-3879-2017, 2017.
McClain, J. O. and Rao, V. R.: CLUSTISZ: A program to test for the quality of clustering of a set of objects, J. Mark. Res., 12, 456–460, 1975.
Meijide, A., Badu, C. S., Moyano, F., Tiralla, N., Gunawan, D., and Knohl, A.: Impact of forest conversion to oil palm and rubber plantations on microclimate and the role of the 2015 ENSO event, Agr. Forest Meteorol., 252, 208–219, 2018.
Milligan, G.: A Monte Carlo study of thirty internal criterion measures for cluster analysis, Psychometrika, 46, 187–199, 1981.
Milligan, G. W.: An examination of the effect of six types of error perturbation on fifteen clustering algorithms, Psychometrika, 45, 325–342, 1980.
Miralles, D. G., Holmes, T. R. H., De Jeu, R. A. M., Gash, J. H., Meesters, A. G. C. A., and Dolman, A. J.: Global land-surface evaporation estimated from satellite-based observations, Hydrol. Earth Syst. Sci., 15, 453–469, https://doi.org/10.5194/hess-15-453-2011, 2011.
Miralles, D. G., van den Berg, M. J., Gash, J. H., Parinussa, R. M., de Jeu, R. A. M., Beck, H. E., Holmes, T. R. H., Jiménez, C., Verhoes, N. E. C., Dorigo, W. A., Teuling, A. J., and Dolman, A. J.: El Niño-La Niña cycle and recent trends in continental evaporation, Nat. Clim. Change, 4, 122–126, 2014.
National Aeronautics and Space Administration (NASA): Global Land Data Assimilation System (GLDAS), available at: https://disc.gsfc.nasa.gov/datasets?page=1&keywords=GLDAS, last access: 1 May 2020a.
National Aeronautics and Space Administration (NASA): Modern-Era Retrospective analysis for Research and Applications, Version 2 (MERRA2), available at: https://disc.gsfc.nasa.gov/datasets?keywords=% 22MERRA-2% 22&page=1&source=Models% 2FAnalyses MERRA-2, last access: 1 May 2020b.
Next Generation Ecosystem Experiments (NGEE): Tropics Data Archive, Data reference numbers NGT0131-NGT0147 and NGT148, available at: https://ngt-data.lbl.gov/, last access: 1 May 2020.
Ochoa-Sánchez, A., Crespo, P., and Célleri, R.: Quantification of rainfall interception in the high Andean Tussock grasslands, Ecohydrology, 11, 1–11, https://doi.org/10.1002/eco.1946, 2018.
ORNL DAAC: Spatial Data Access Tool (SDAT): ORNL DAAC, Oak Ridge, Tennessee, USA, available at: https://webmap.ornl.gov/ogc (last access: 1 February 2018), 2017a.
ORNL DAAC: Fluxnet: Archived Website Including Site and Investigator Information. ORNL DAAC, Oak Ridge, Tennessee, USA, available at: https://daac.ornl.gov/FLUXNET/guides/Fluxnet_website_archive_copy.html (last access: 1 February 2018), 2017b.
Piao, S., Sitch, S., Ciais, P., Friedlingstein, P., Peylin, P. Wang, X., Ahlström, A., Anav, A., Canadell, J. G., Cong, N., Huntingford, C., Jung, M., Levis, S., Levy, P. E., Li, J., Lin, X., Lomas, M. R., Lu, M., Luo, Y., Ma, Y., Myneni, R. B., Poulter, B., Sun, Z., Wang, T. Viovy, N., Zaehle, S., and Zeng, N.: Evaluation of terrestrial carbon cycle models for their response to climate variability and to CO2 trends, Glob. Change Biol., 19, 2117–2132, 2013.
Prigent, C., Aires, F., Rossow W. B., and Robock, A.: Sensitivity of satellite microwave and infrared observations to soil moisture at a global scale: relationship of satellite observations to in situ soil moisture measurements, Clim. Dynam., 110, 1–15, 2005.
Raddatz, T. J., Reick, C. H., Knorr, W., Kattge, J., Roeckner, E., Schnur, R., Schnitzler, K. -G., Wetzel, P., and Junglaus, J.: Will the tropical land biosphere dominate the climate-cabron cycle feedback during the twenty-first century?, Clim. Dynam., 29, 565–574, 2007.
Ratkowsky, D. A. and Lance, G. A.: A criterion for determining the number of groups in a classification, Aust. Comput. J., 10, 115–117, 1978.
Reichle, R. H., De Lannoy, G. J. M., Liu, Q., Ardizzone, J. V., Colliander, A., Conaty, A., Crow, W., Jackson, T. J., Jones, L. A., Kimball, J. S., Koster, R. D., Mahanama, S. P., Smith, E. B. Berg, A., Bircher, S., Bosch, D., Caldwell, T. G., Cosh, M., González-Zamora, Á, Collins, C. D. H., Jensen, K. H., Livingston, S., Lopez-Baeza, E., Martínez-Fernández, J., McNairn, H., Moghaddam, M., Pacheco, A., Pellarin, T., Prueger, J., Rowlandson, T., Seyfried, M., Starks, P., Su, Zhongbo, Thibeault, M., van der Velde, R., Walker, J., Wu, X., and Zeng, Y.: Assessment of the SMAP Level-4 surface and root-zone soil moisture product using in situ measurements, J. Hydrometeorol., 18, 2621–2645, 2017.
Rodell, M., Houser, P. R., Jambor, U., Gottschalck, J., Mitchell, K., Meng, C.-J., Arsenault, K., Cosgrove, B., Radakovich, J., Bosilovich, M., Entin, J. K., Walker, J. P., Lohmann, D., and Toll, D.: The global land data assimilation system, B. Am. Meteorol. Soc., 85, 381–394, 2004.
Ropelewski, C. F. and Halpert, M. S.: Precipitation patterns associated with the high index phase of the Southern Oscillation, J. Climate, 2, 268–284, 1989.
Rousseeuw, P. J.: Silhouettes: a graphical aid to the interpretation and validation of cluster analysis, J. Comput. Appl. Math., 20, 53–65, 1987.
Rubio, V. E. and Detto, M.: Spatiotemporal variability of soil respiration in a seasonal tropical forest, Ecol. Evol., 7, 7104–7116, 2017.
Sarle, W. S.: The cubic clustering criterion, In SAS technical report A-108, Cary, NC, SAS Institute, 1983.
Satyamurty, P., da Costa, C. P. W., and Manzi, A. O.: Moisture source for the Amazon Basin: a study of contrasting years, Theor. Appl. Clim., 111, 195–209, 2013.
Schaefer, G. L., Cosh, M. H., and Jackson, T. J.: The USDA Natural Resources Conservation Service Soil Climate Analysis Network (SCAN), J. Atmos. Ocean. Tech., 24, 2073–2077, 2007.
Schubert, S. D., Stewart, R. E., Want, H., Barlow, M., Berbery, E. H., Cai, W., Hoerling, M. P., Kanikicharla, K. K., Koster, R. D., Lyon, B., Mariotti, A., Mechoso, C. R., Müller, O. V., Rodriguez-Fonseca, B., Seager, R., Seneviratne, S. I., Zhang, L., and Zhou, T.: Global meteorological drought: a synthesis of current understanding with a focus on SST drivers of precipitation deficits, J. Climate, 29, 3989–4019, 2016.
Seneviratne, S. I., Corti, T., Davin, E. L., Hirschi, M., Jaeger, E. B., Lehner, I., Orlowsky, B., and Teuling, A. J.: Investigating soil moisture-climate interactions in a changing climate: A review, Earth Sci. Rev., 99, 125–161, 2010.
Silva Dias, M. A. F., Rutledge, S., Kabat, P., Silva Dias, P. L., Nobre, C., Fisch, G., Dolman, A. J., Zipser, E., Garstang, M., Manzi, A. O., Fuentes, J. D., Rocha, H. R., Marengo, J., Plana-Fattori, A., Sá, L. D. A., Alvalá, R. C. S., Andreae, M. O., Artaxo, P., Gielow, R., and Gatti, L.: Clouds and rain processes in a biosphere-atmosphere interaction context in the Amazon Region, J. Geophys. Res., 107, 8072, https://doi.org/10.1029/2001JD000335, 2002.
Tebaldi, C. and Knutti, R.: The use of multi-model ensemble in probabilistic climate projections, Philos. T. R. Soc., 365, 2053–2075, 2007.
Tomasella, J., Hodnett, M. G., Cuartas, L. A., Nobre, A. D., Waterloo, M. J., and Oliveira, S. M.: The water balance of an Amazonian micro-catchment: the effect of interannual variability of rainfall on hydrological behavior, Hydrol. Process., 22, 2133–2147, 2008.
Trenberth, K. E.: The definition of El Niño, B. Am. Meteorol. Soc., 78, 2771–2778, 1997.
van Schaik, E., Killars, L., Smith, N. E., Koren, G., van Beek, L. P. H., Peters, W., and van der Laan-Luijkx, I. T.: Changes in surface hydrology, soil moisture, and gross primary production in the Amazon during the 2015/2016 El Niño, Philos. T. R. Soc. B, 373, 1–9, 2018.
Wanders, N., Bachas, A., He, X. G., Huang, H., Koppa, A., Mekonnen, Z. T., Pagán, B. R., Peng, L. Q., Vergopolan, N., Wang, K. J., Xiao, M., Zhan, S., Lettenmaier, D. P., and Wood, E. F.: Forecasting the hydroclimatic signature of the 2015/16 El Niño event on the western United states, J. Hydrometeorol., 18, 177–186, 2017.
Wang, W., Ciais, P., Nemani, R. R. Canadell, J. G., Piao, S., Sitch, S., White, M. A., Hashimoto, H., Milesi, C., and Myneni, R. B.: Variations in atmospheric CO2 growth rates coupled with tropical temperature, P. Natl. Acad. Sci. USA, 110, 13061–13066, 2013.
Wu, J., Albert, L. P., Lopes, A. P., Restrepo-Coupe, N., Hayek, M., Wiedemann, K. T., Guan, K., Stark, S. C., Christoffersen, B., Prohaska, N., Tavares, J. V., Marostica, S., Kobayashi, H., Ferreira, M. L., Campos, K. S., da Silver, Rodrigo, Brando, P. M., Dye, D. G., Huxman, T. E., Huete, A. R., Nelson, B. W., and Saleska, S. R.: Leaf development and demography explain photosynthetic seasonality in Amazon evergreen forests, Science, 351, 972–976, 2016.
Xu, K., Tam, C.-Y., Zhu, C., Liu, B., and Wang, W.: CMIP5 projections of two types of El Niño and their related tropical precipitation in the twenty-first century, J. Climate, 30, 849–864, 2017.
Yang, L., Sun, G. Zhi, L., and Zhao, J.: Negative soil moisture-precipitation feedback in dry and wet regions, Sci. Rep.-UK, 8, 1–9, 2018.
Yu, J.-Y. and Zou, Y.: The enhance drying effect of Central-Pacific El Niño on US winter, Environ. Res. Lett., 8, 1–7, 2013.
Zhuo, L., Dai, Q., Islam, T., and Han, D.: Error distribution modelling of satellite soil moisture measurements for hydrological applications, Hydrol. Proc. , 30, 2223–2236, 2016.