the Creative Commons Attribution 4.0 License.
the Creative Commons Attribution 4.0 License.
 | 09 Apr 2020
Near-0 °C surface temperature and precipitation type patterns across Canada
Ronald E. Stewart
Julie M. Theriault
Bohdan Kochtubajda
Barrie R. Bonsal
Zhuo Liu
The 0 ∘C temperature threshold is critical for many meteorological and hydrological processes driven by melting and freezing in the atmosphere, surface, and sub-surface and by the associated precipitation varying between rain, freezing rain, wet snow, and snow. This threshold is especially important in cold regions such as Canada, because it is linked with freeze–thaw, snowmelt, and permafrost. This study develops a Canada-wide perspective on near-0 ∘C conditions using hourly surface temperature and precipitation type observations from 92 climate stations for the period from 1981 to 2011. In addition, nine stations from various climatic regions are selected for further analysis. Near-0 ∘C conditions are defined as periods when the surface temperature is between −2 and 2 ∘C. Near-0 ∘C conditions occur often across all regions of the country, although the annual number of days and hours and the duration of these events varies dramatically. Various types of precipitation (e.g., rain, freezing rain, wet snow, and ice pellets) sometimes occur with these temperatures. Near-0 ∘C conditions and the reported precipitation type occurrences tend to be higher in Atlantic Canada, although high values also occur in other regions. Trends of most temperature-based and precipitation-based indicators show little or no change despite a systematic warming in annual surface temperatures over Canada. Over the annual cycle, near-0 ∘C temperatures and precipitation often exhibit a pattern: short durations occur around summer, driven by the diurnal cycle, and a tendency toward longer durations around winter, associated with storms. There is also a tendency for near-0 ∘C surface temperatures to occur more often than expected relative to other temperature windows at some stations due, at least in part, to diabatic cooling and heating that take place with melting and freezing, respectively, in the atmosphere and at the surface.
- Article
(2979 KB) - Full-text XML
- BibTeX
- EndNote


In cold regions such as Canada, both environmental processes and socio-economic activities are significantly impacted by temperatures near 0 ∘C. At larger spatial and temporal scales, the seasonal arrival and retreat of 0 ∘C temperatures influence snow melt/accumulation, hydrologic processes (spring freshet, freshwater ice duration, flooding), permafrost thaw and related slumping, transportation (e.g., ice roads), growing season length, and animal hibernation (e.g., Bonsal and Prowse, 2003). At smaller scales, periodic transitional episodes from below to above 0 ∘C (or vice versa) can have adverse effects including mid-winter ice jams and related flooding (e.g., Beltaos et al., 2006; Lindenschmidt et al., 2016), freeze–thaw damage to infrastructure (e.g., Kraatz et al., 2019), unseasonal frosts (e.g., McKenney et al., 2014), and recreation impacts (skiing, avalanches; e.g., Moen and Fredman, 2007; Laute and Beylich, 2018). Furthermore, if these periods are associated with precipitation (e.g., freezing rain/ice-storms), severe and sometimes life-threatening impacts are possible, including damaged electrical transmission infrastructure, air traffic disruptions, and hazardous road conditions. If near-0 ∘C occurrences change, this will have subsequent impacts on all of these issues.
Many regions of Canada have experienced major impacts from near-0 ∘C events. For example, a prolonged period of freezing rain, drizzle, and ice pellets severely affected a region stretching from southeastern Ontario to southwestern Quebec, as well as the northeastern United States in early January 1998 (Henson et al., 2007, 2011). Some areas experienced in excess of 100 mm of freezing precipitation. Transportation was shut down and damage to the electrical infrastructure, trees, and farms was catastrophic. There were an estimated 47 fatalities in Canada and the United States and USD 4 billion in total losses (Lecomte et al., 1998; Kerry et al., 1999; Milton and Bourque, 1999; Klaassen et al., 2003). More recently, ice storms over northeastern New Brunswick in January 2017 (McFadden and Thériault, 2018) and the Fraser Valley of British Columbia in December 2017 (Mendoza and Schmunk, 2017) severely impacted electrical power grids, snapping poles, downing lines, and leaving thousands of people without electricity for days.
Near-0 ∘C conditions occur over many areas of the world. Over land areas, even high terrain experiences such conditions. Some of the most critical questions associated with our changing climate are associated with temperature change and the hydrological cycle. This certainly applies to the future occurrence of near-0 ∘C conditions and the associated precipitation.
Naturally, many studies continue to be carried out that document global, regional, and local surface temperatures ranging from climate change synthesis reports (Intergovernmental Panel on Climate Change, 2013) to studies of temperature at individual weather stations. While many of these works include 0 ∘C, few have focused on this temperature, although studies such as Wexler et al. (1954), Fujibe (2001), and Takeuchi et al. (2002) all showed that melting and/or freezing can affect the occurrence and/or duration of these conditions.
In contrast, several studies have examined the varying precipitation types near 0 ∘C. Examples of studies examining the occurrence of rain and snow in relation to temperature and, in some cases, relative humidity include U.S. Army Corps of Engineers (1956), Auer Jr. (1974), Matsuo and Sasyo (1981a, b), Matsuo et al. (1981), and Kienzle (2008). In general, these studies found a steady increase in the probability of rain as temperatures increase from near 0 ∘C to higher values, and they also pointed out that lower atmospheric moisture generally leads to higher temperatures being needed for rain to occur. Dai (2008) built on this work to examine global distributions of rain and snow, although freezing rain was only included within the snow category in this study. Sims and Liu (2015) developed an algorithm for use with remotely sensed observations to discriminate between different types of surface precipitation; they emphasized the importance of atmospheric moisture. Jennings et al. (2018) examined the threshold temperature at which rain and snowfall occur with equal frequency, mapped this parameter over the Northern Hemisphere, and illustrated its strong dependence on atmospheric humidity. Overall, many of these studies illustrated that the variation in atmospheric moisture directly affects the temperature threshold needed for rain to occur with lower values acting to increase the required temperatures. In addition, atmospheric humidity can also influence the characteristics of the melting particles and, consequently, the threshold. For example, under saturated conditions aloft with rising air, cloud droplets can be produced that can then be subsequently captured by falling precipitation particles. The ensuing rimed, more dense particles require greater fall distances and/or higher temperatures to melt (Stewart et al., 2019).
Previous Canadian studies have been carried out that were related to aspects of the 0 ∘C temperature threshold and the associated precipitation. At large scales, Bonsal and Prowse (2003) assessed 20th century trends and variability in spring and autumn 0 ∘C dates across the country and found significant trends toward earlier springs (particularly in western areas) but little change during autumn. Regionally, Stewart and Yiu (1993) examined near-0 ∘C conditions including their horizontal scales and associated precipitation over southern Ontario. In terms of associated precipitation, MacKay and Thompson (1969) published the first climatology of freezing precipitation for Canada, and this was later updated by Stuart and Isaac (1999) and Wang (2006). Many case study analyses of heavy precipitation and/or freezing rain events have been carried out to investigate storm structure and the associated precipitation production mechanisms (e.g., Henson et al., 2007, 2011). Two recent articles, one focused on western and northern Canada (Kochtubajda et al., 2017) and one focused on the eastern regions (Bresson et al., 2017), have collectively documented some of the hazardous freezing conditions occurring within the country.
A number of studies have examined the climatological characteristics of freezing precipitation across North America, Europe, and Asia (see, e.g., Carrière et al., 2000; Cortinas, 2000; Changnon, 2003; Houston and Changnon, 2007; Groisman et al., 2016; Kämäräinen et al., 2017). These investigations used a variety of observational and model datasets, found wide variations in freezing precipitation occurrence, and, in some cases, related these findings to contributing factors such as mountain barriers and coastlines. A recent study also identified the impacts of extreme weather on critical infrastructure in Europe (Groenemeijer et al., 2017). One of the results of interviews with infrastructure and emergency managers was that the impacts of freezing precipitation, snowfall, snow loading, and snow storms were of most concern.
Although studies have assessed various aspects of 0 ∘C conditions, there has been no Canada-wide assessment describing characteristics and trends in their historical occurrence. A preliminary assessment of near-0 ∘C surface temperatures across Canada (Fig. 1) shows that they occur at stations where the average annual surface temperatures range between below, near, and substantially above 0 ∘C. Given the aforementioned importance of this threshold, additional information is necessary to better understand the spatial and temporal characteristics of these conditions across Canada. This includes the associated precipitation that often results in the greatest impacts.
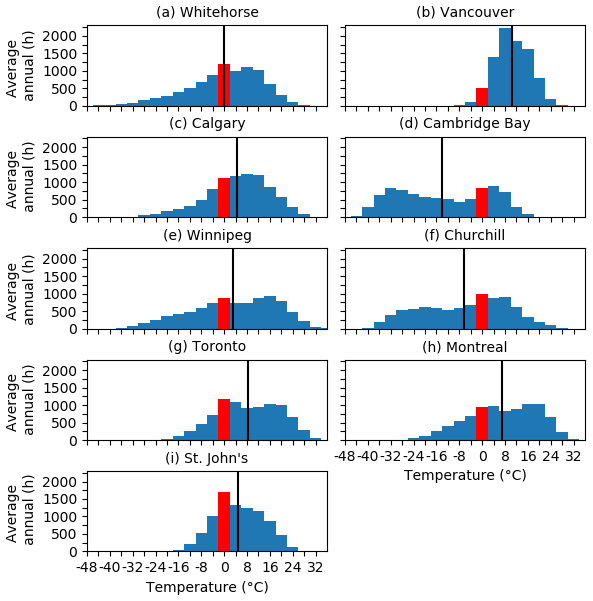
Figure 1The average annual hours (h) of surface temperature distribution (4 ∘C bins) from 1981 to 2011 for nine stations across Canada, as shown in Fig. 2. The vertical black line indicates the average annual surface temperature using information from ECCC (2019a). The red bar identifies near-0 ∘C surface temperatures defined as ∘C. Stations are arranged from west to east. Details on the temperature data are given in Sect. 2.
Thus, the objective of this study is to quantify and improve the understanding of the temperature and precipitation type patterns of near-0 ∘C conditions across Canada. The data and methods are described first (Sect. 2) followed by an assessment of climatology and trends in the key identified variables (Sect. 3). Next, selected stations are examined in more depth (Sect. 4) followed by a discussion of several critical near-0 ∘C features (Sect. 5). Finally the concluding remarks are given in Sect. 6.
2.1 Data
A combination of automated systems and human observations comprise the surface weather networks of the Environment and Climate Change Canada (ECCC). These measurements are subject to subsequent manual and automated quality control procedures and are available from the Historical Climate Data repository of ECCC's National Climate Archive at various temporal scales ranging from hourly to annual (http://www.climate.weatheroffice.ec.gc.ca, last access: 2 April 2020, ECCC, 2019a). As this study focuses on the identification of conditions near 0 ∘C at the surface along with the associated precipitation, hourly surface temperature and the manual precipitation type observations across Canada were retrieved from the archive.
Selecting appropriate stations for further analysis was determined by data availability and the observation program. The initial period considered was 1953–2016, with the criterion of a minimum 25-year data record. Although 227 stations satisfied this criterion for both hourly surface temperature and precipitation type information, many did not operate 24 h a day and others changed their observing practices over the period of interest (e.g., from 24 h d−1 to fewer or vice versa). Thus, it was decided that only stations operating 24 h a day would be used, and these had to have at least 90 % hourly surface dry bulb temperature data availability (equivalent to an average requirement of 21 h d−1). For precipitation type observations, the only condition was the existence of an hourly observation program during the study period.
Consequently, to maximize the number of stations but still maintain a sufficiently long period for climatological studies, the 31-year period from 1981 to 2011 was chosen. This latter date was influenced by the dramatic drop in the number of stations archiving information after 2012 (Mekis et al., 2018). This resulted in 92 stations being used for analyses (Fig. 2), which provide reasonable coverage over the country. For these stations, the following 12 manual weather (precipitation) type observations were considered: rain, rain showers, drizzle, freezing rain, freezing drizzle, snow, snow grains, ice crystals, ice pellets, ice pellet showers, snow showers, and snow pellets. Reporting was carried out according to World Meteorological Organization standards, which are described in the Manual of Surface Weather Observation Standards (MANOBS https://www.canada.ca/en/environment-climate-change/services/weather-manuals-documentation/manobs-surface-observations.html, last access: 2 April 2020, ECCC, 2019b). Precipitation intensity was characterized using four distinct values based on visibility or the rate of rainfall ranging from absent to “heavy”, but, for the purposes of this study, only the presence or absence of precipitation types was considered. Definitions are described in American Meteorological Society (2018), ECCC (2019b), and WMO (2017).
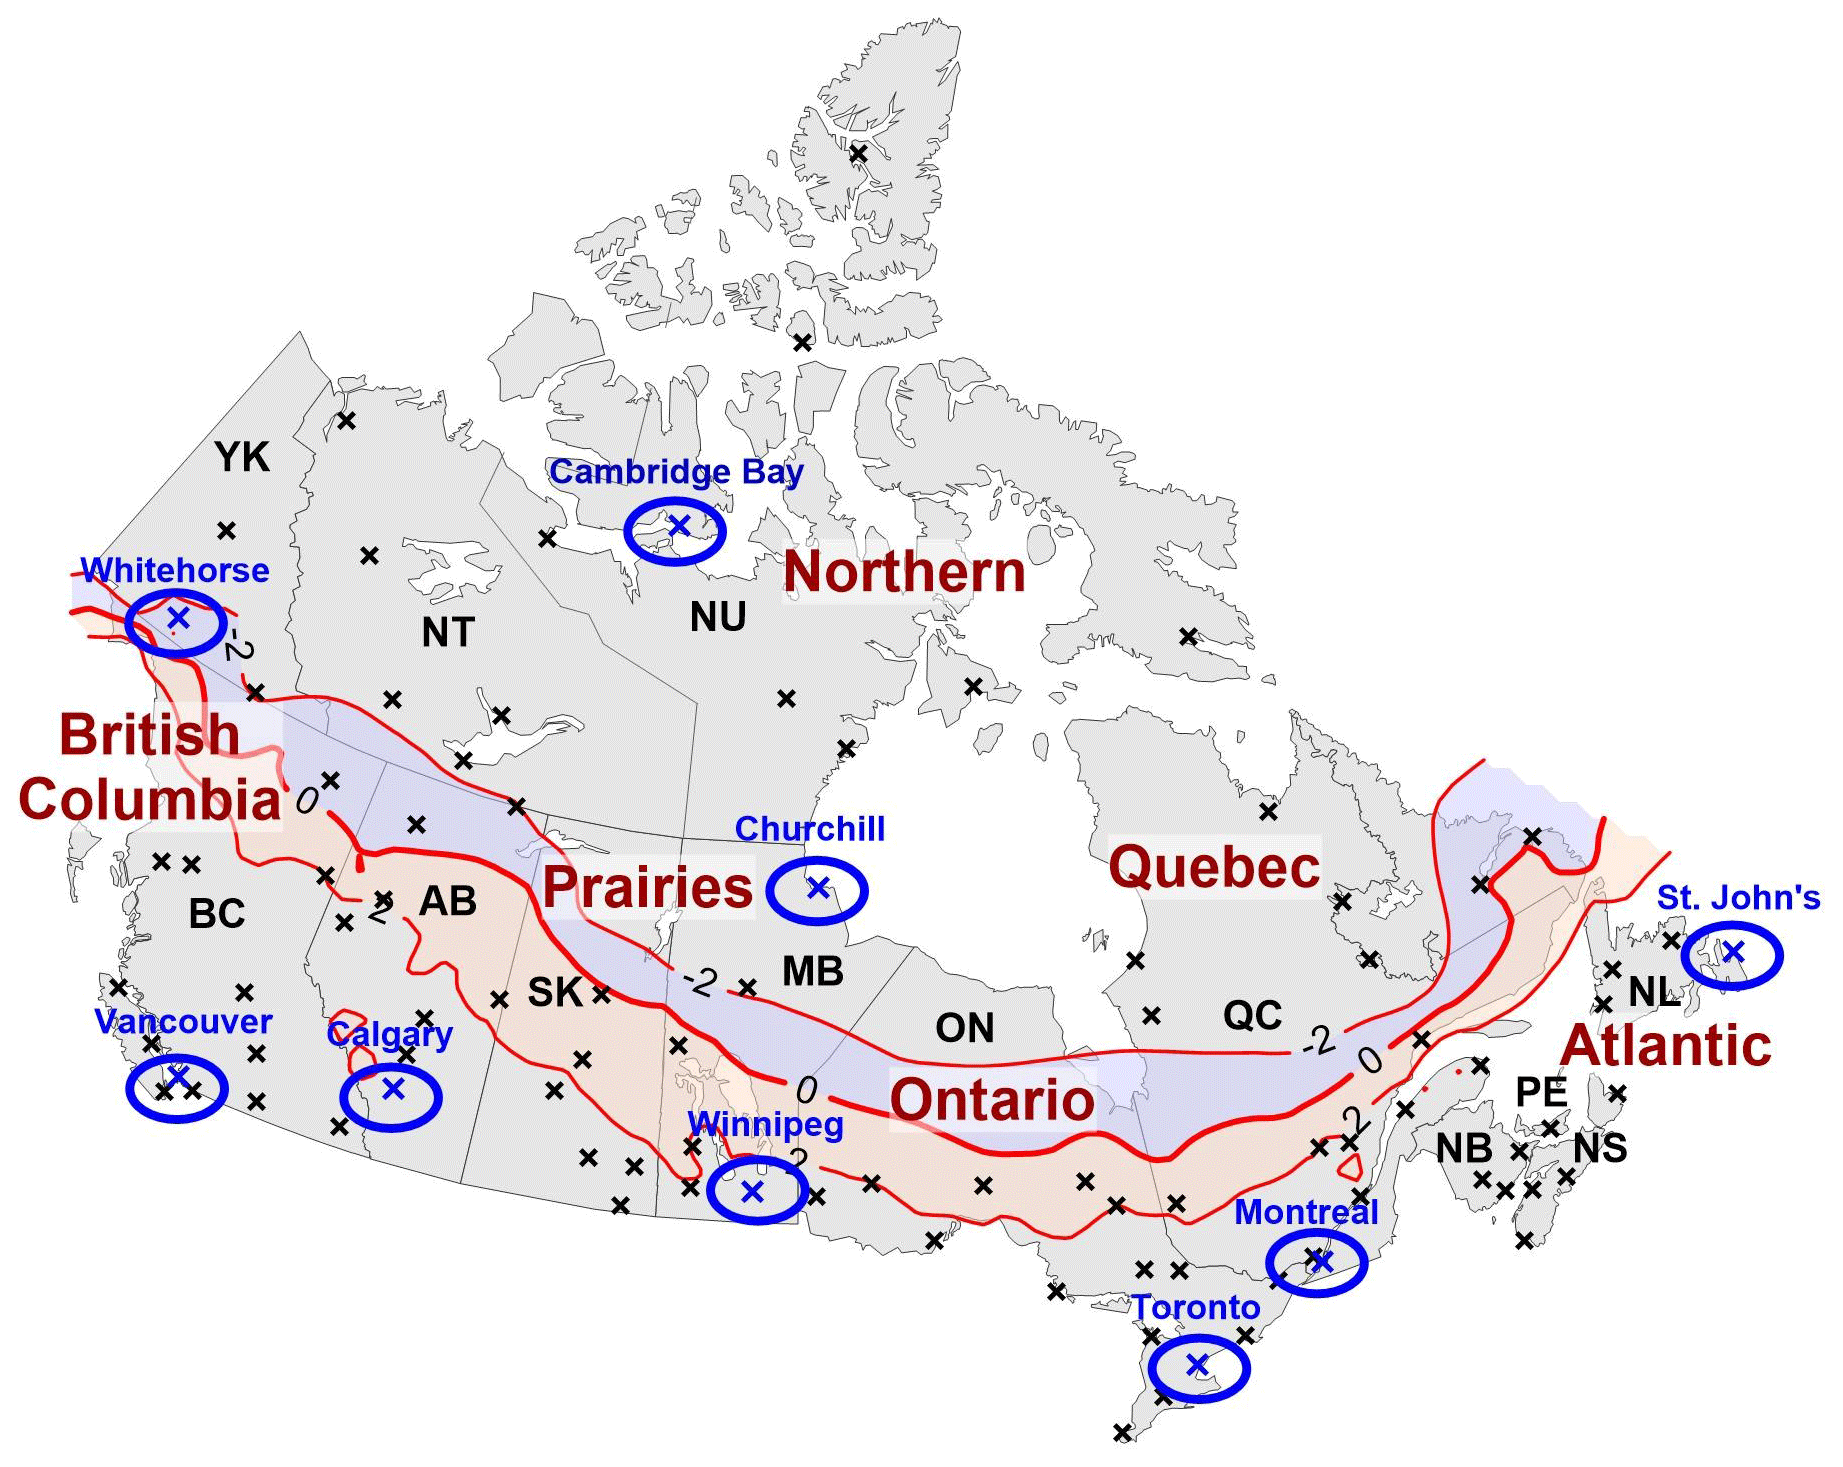
Figure 2The 92 stations used in the analysis (see text for details). Blue crosses show the nine selected stations across Canada. The British Columbia region includes all stations in British Columbia (BC); the Prairies region includes all stations in Alberta (AB), Saskatchewan (SK), and Manitoba (MB); the Ontario region includes all stations in Ontario (ON); the Quebec region includes all stations in Quebec (QC); the Atlantic region includes all stations in New Brunswick (NB), Prince Edward Island (PE), Nova Scotia (NS), Newfoundland, and Labrador (NL-L); and the Northern region includes all stations in the Yukon (YK), the Northwest Territories (NT), and Nunavut (NU). The average annual 0, −2, and 2 ∘C surface temperature lines, computed from the 1981–2010 climate normals of 1619 locations (ECCC, 2019c), are also shown.
Canada is a vast country with many different climatic regions (Gullett and Skinner, 1992) and ecozones (Zhang et al., 2011). For easier evaluation of the results, similar to Vincent et al. (2018), the country was divided into six broad regions based on the 13 provincial/territorial boundaries (Fig. 2). In addition to the Canada-wide analysis, nine stations were chosen for further analysis (Fig. 2). These stations, which have high quality consistent observation practices, represent contrasting climatic conditions across the country.
2.2 Methods
This analysis identified key near-0 ∘C characteristics and threshold events during the study period. There is no precise, physically based criterion that can be used to characterize conditions near 0 ∘C, although we wanted to focus on conditions in which embedded change in precipitation types is common. We note that WMO Solid Precipitation Intercomparison Experiment (SPICE) broke precipitation down into three categories based on surface temperature (T): snow < −2 ∘C, mixed precipitation −2 ∘C ∘C, and rain > 2 ∘C (Nitu et al., 2018); this approach was similar to that used by Yang et al. (1995, 1998). In addition, Matsuo et al. (1981) found that almost all of the precipitation near rain–snow transitions in Japan is rain if the surface temperature is 2 ∘C and relative humidity is 90 %, and Kochtubajda et al. (2017) found that 75 % of freezing rain across the Canadian Prairies and northern Canada fell at surface temperatures of ∘C. To provide a reasonable symmetric temperature window straddling 0 ∘C with embedded large fractions of overall occurrences of varying precipitation types, we define near-0 ∘C conditions as ∘C throughout the paper.
A total of 21 indicators were considered (Table 1). The first four indicators are associated with the near-0 ∘C temperature condition (measured as hourly surface dry bulb temperature) without any consideration of precipitation. They are the number of days per year, the number of hours per year, the number of events per year, and the annual maximum duration of the events within the study period. An event is defined as the number of consecutive hourly observations within the ∘C range. Note that in order to be considered a single event, there could be no more than 3 continuous hours of missing data. To assess precipitation during near-0 ∘C conditions, a further 13 precipitation type indicators were computed. In addition, the combination of temperature and precipitation type provides an additional four indicators; these include the annual average hours with any of the 12 aforementioned precipitation type conditions, the annual average hours with only freezing rain, the percentage of time in which any precipitation (from the 12 types) occurred, and the percentage of time that freezing rain alone occurred. Freezing rain is highlighted, rather than other frozen precipitation, as its occurrence often results in major impacts.
Table 1Table of indicators in the ∘C range. “T” refers to hourly surface dry bulb temperature, (d) represents days and (h) represents hours. Definitions were obtained from American Meteorological Society (2018), ECCC (2019b), and World Meteorological Organization (2017).

To characterize these variables, the 1981–2011 average was determined for each station and mapped across the country. Assessment of the trend can be challenging for time series with low occurrences and repetitive (tied) values (Frei and Schär, 2001 and Keim and Cruise, 1998), such as the annual number of days with certain precipitation types. A χ2 test was applied to the data to determine whether the data followed a normal or Poisson distribution. Depending on the results, two different approaches were used to estimate the trends. For the data with a normal distribution (most of the surface-temperature-related indicators), the estimated magnitude of the trend was based on the slope estimator of Sen (1968), and the statistical significance of the trend was based on the nonparametric Kendall's τ-test (Kendal, 1955). This same approach was recently used to assess trends in Canada's climate (Vincent et al., 2015) and in surface temperature and precipitation indices (Vincent et al., 2018). This test is less sensitive to the non-normality of the data distribution and less affected by missing values and outliers than the frequently used least squares method. As serial correlation is often present in climatological time series, the method also involves an iterative procedure that takes the first lag autocorrelation into account (Zhang et al., 2000). For the data following a parametric Poisson distribution (mainly the precipitation type indicators), a logistic model was applied to transform the time series (McCullagh and Nelder, 1989). In this case, only the direction (positive and negative trends) and the significance of the fitted curve were used in the analysis. The statistical significance of the trends was assessed at the 5 % level. Given the aforementioned aspect of missing data, and similar to earlier works (Mekis et al., 2015; Vincent et al., 2018), the trends were calculated if at least 90 % of the values (29 out of the 31 years) were available, otherwise the trends were set to missing.
In addition to the temperature and precipitation type occurrence information, hourly sky cover was also extracted over the nine selected stations. Sky conditions are reported in units of octas according to World Meteorological Organization standards, which are described in the Manual of Surface Weather Observation Standards (ECCC, 2019b). If multiple cloud layers are observed, then the octas of the layers are summed. This information was only examined for the longest durations of near-0 ∘C conditions at these stations.
Given the significance of the 0 ∘C reference line in this study, the −2, 0, and +2 ∘C average annual surface temperature contour lines were computed from the 1981–2010 climate normal period (http://climate.weather.gc.ca/climate_normals/index_e.html, last access: 2 April 2020, ECCC, 2019c) to be used later in the analysis. Kriging with a linear variogram model and a grid spacing of 50 km was applied to create the interpolated surface temperature map from the 1619 stations for Canada.
3.1 The 31-year climatology for 1981–2011
Figure 3a shows the number of days per year when surface temperatures were between −2 and +2 ∘C. In relation to the average annual 0 ∘C surface temperature line, it is apparent that high values generally occur at stations that are near or above 0 ∘C. There are distinct regional patterns with the largest values (120 to 200 d) concentrated in three main areas. The highest occurrences are found in interior British Columbia and southern Alberta extending into southern Saskatchewan with the maximum values observed within or on the leeward side of the western Cordillera. The second region with high values is found in Atlantic Canada where temperatures often fluctuate around 0 ∘C during the cold season due to the maritime influence. Southern Ontario also has a relatively high number of occurrences, which is likely due to its more southerly location and the resultant influxes of warmer southern air masses during the cold season. Mid-range values (80 to 120 d) occur in the continental interior, stretching from the Yukon through central Canada to Quebec and Labrador. This area is colder than the previously mentioned regions with fewer incursions of warm air during the cold season. The lowest values (40 to 80 d) are found in the North due to even fewer warm air incursions. Low values also occur in southwestern British Columbia where temperatures seldom dip to values below 0 ∘C. The preceding indicates that near-0 ∘C conditions can occur on over 50 % of the days, on average, in regions with the highest values in Fig. 3a. Even in the most northerly locations, such conditions occur approximately once per week on average.
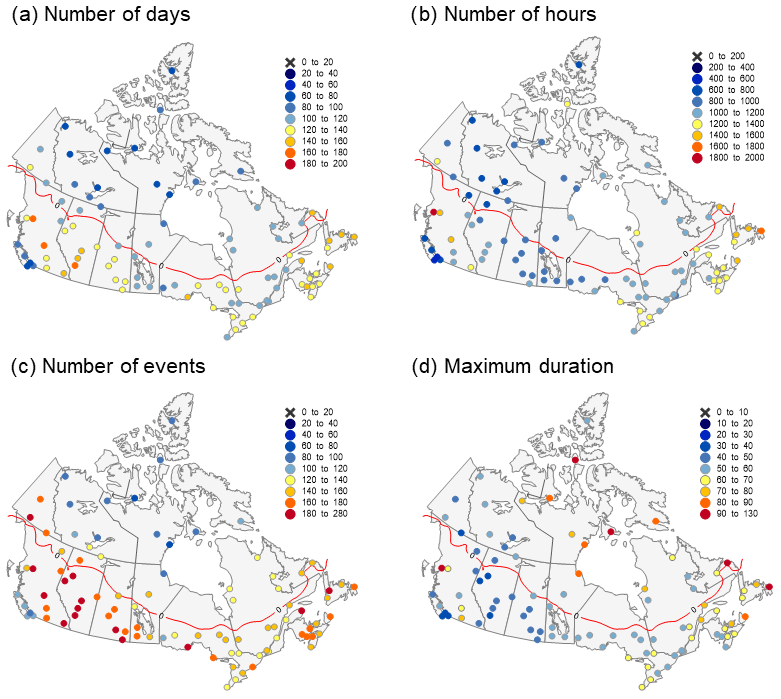
Figure 3Average near-0 ∘C ( ∘C) conditions over the 1981–2011 period for (a) the number of days per year, (b) the number of hours per year, (c) the number of events per year, and the (d) annual maximum (max) duration of events. The red line indicates the annual average 0 ∘C surface temperature computed from the 1981 to 2010 climate normals (ECCC, 2019c).
Figure 3b shows the average number of hours per year with surface temperatures between −2 and +2 ∘C. Unlike the number of days in Fig. 3a, the number of hours shows less dependence on the location of the average annual 0 ∘C surface temperature line. Overall, the spatial distribution is similar to that of Fig. 3a, but the differences are apparent. The same three general regions of high values still occur, but the western region is more localized and does not extend east of the Canadian Rockies. This may indicate that such conditions are short-lived east of the Canadian Rockies; thus, they show up in the number of days but not as an extended number of hours. High values are even more pronounced in Fig. 3b than in Fig. 3a at one northern coastal British Columbia station (Terrace) where the maximum values of 1800–2000 h represent approximately 80 d yr−1. This northern British Columbia station near the ocean may share many characteristics with those in the Atlantic region. In contrast to Fig. 3a, there are now three distinct areas of low values (< 800 h) in the average number of hours near 0 ∘C (Fig. 3b). These areas are the far North, southwestern British Columbia, and northern British Columbia and the western Northern Territories. This latter region experiences warm summer conditions during which the temperatures seldom reach this low as well as cold winter conditions when temperatures seldom reach this high.
Figure 3c shows the average number of events per year. Similar to Fig. 3a, almost all high values occur at stations with average annual surface temperatures near or above 0 ∘C. Spatial patterns are also similar to those in Fig. 3a with maximum values (180–280) in the west extending into southern Saskatchewan. High values are observed within the previously mentioned area of the Atlantic region, but they also occur on the north shore of Lake Superior. The number of events in Atlantic Canada is comparable to the eastern Prairies, although there are far more hours in the Atlantic region. The number of events at some stations in southern Ontario (120–140) is also comparable to the number in the southern Northwest Territories, although, again, there are far more hours in southern Ontario.
The annual maximum duration of events, characterizing the occasional persistence of such events, is shown in Fig. 3d. The maximum duration of events tends to show little dependence on the average annual 0 ∘C surface temperature line across the entire country. The spatial pattern differs from those in Fig. 3a–c with the longest durations in the Atlantic region and some interior stations in British Columbia, including the northern coastal region. Other large values occur near coastlines in the North. These values range up to 130 h or ∼5 d. The lowest maximum durations (10–20 h) occur in the lee of the Rocky Mountains as well as in southern British Columbia.
Figure 4a–d provide the climatologies of precipitation types associated with near-0 ∘C conditions. First, Fig. 4a shows the average annual number of hours with any of the 12 reported precipitation types listed in Table 1. There is no strong dependence in the occurrence of any weather type in relation to the position of the average annual 0 ∘C surface temperature line. The maximum values (up to 800 h) are primarily concentrated in the eastern half of the country, although, as with the number of hours in Fig. 3b, northern coastal British Columbia is again associated with high values. Such precipitation types are rare in most of western Canada (except northern coastal British Columbia), and the lowest value (40–80 h) occurs on Vancouver Island. There is more than an order of magnitude difference between the lowest and highest values across the country. There is even huge variation between the two farthest north stations (120–160 and 360–800 h, respectively).
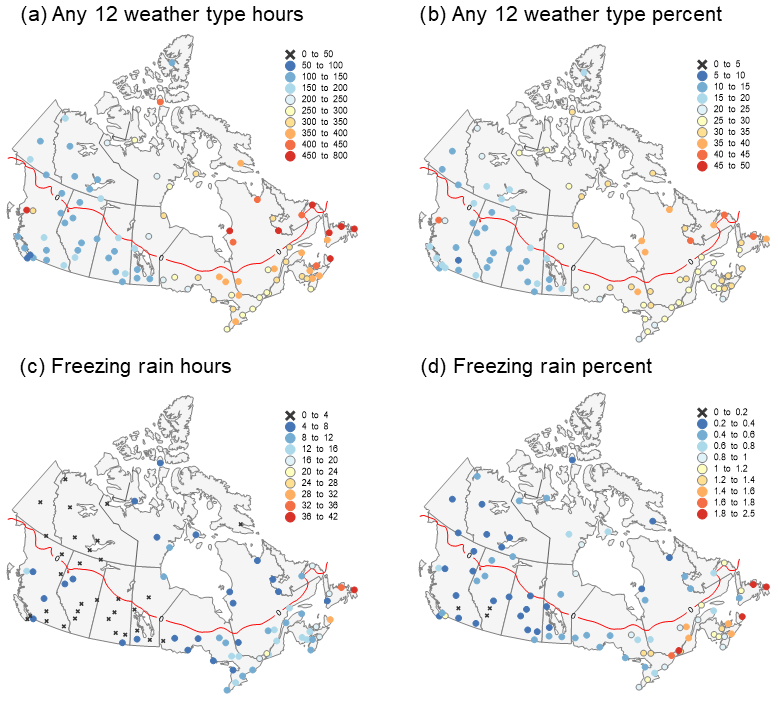
Figure 4Precipitation type occurrences during near-0 ∘C ( ∘C) conditions over the 1981–2011 period: (a) average annual number of hours with reported precipitation types (any of the 12), (b) percentage of near-0 ∘C conditions associated with reported precipitation types (any of the 12), (c) average annual number of hours with freezing rain, and (d) percentage of near-0 ∘C conditions associated with freezing rain. The red line indicates the annual average 0 ∘C surface temperature computed from the 1981 to 2010 climate normals (ECCC, 2019c).
Figure 4b shows the percentage of near-0 ∘C conditions with the associated precipitation types, where the number of hours reported for any of the 12 precipitation type events are divided by all of the hours with near-0 ∘C conditions. As in Fig. 4a, there is little dependence on the average annual surface temperature. The spatial pattern is quite similar to that in Fig. 4a but with a few exceptions. The highest values are again in eastern Canada and northern coastal British Columbia. The map reveals that over 40 % of near-0 ∘C conditions are associated with precipitation types in these regions, whereas this value is only of the order of 10 %–20 % in western Canada.
Figure 4c shows the average annual number of hours of freezing rain with surface temperatures near 0 ∘C. In contrast to Fig. 4a–b, the highest values of freezing rain primarily occur at stations with an average annual surface temperature above 0 ∘C. The maximum values (by far) are in the Atlantic region (36–42 h), and there is a regional maximum near Montreal (20–24 h). Low values (0–4 h) occur in other regions of the country, especially in the North and much of the west. In fact, freezing rain is rarely reported on the western side of the Prairies and Northern areas.
Figure 4d shows the percentage of near-0 ∘C hours with freezing rain. Consistent with the freezing rain hours in Fig. 4c, the highest percentages of near-0 ∘C hours with freezing rain also tend to occur at stations with average annual surface temperature above 0 ∘C. The spatial pattern is also similar to that in Fig. 4c. This includes that fact that the highest values (1.8 %–2.5 %) are found in the Atlantic region with a secondary maximum near Montreal. However, one isolated, high value (1.0 %–1.2 %) does occur near Vancouver.
3.2 Trends
Figure 5a shows trends in the number of days with temperatures near 0 ∘C during the 1981–2011 period that are significant at the 5 % level. There is no apparent relationship between these trends and the average annual 0 ∘C surface temperature line. The majority of stations are characterized by a nonsignificant decrease with few having a nonsignificant increase (mainly in central Alberta and parts of British Columbia). Only two stations exhibited significant change: Toronto and the most northerly station Eureka, which experienced a decrease of 27 and 19 d over the 31-year period, respectively.
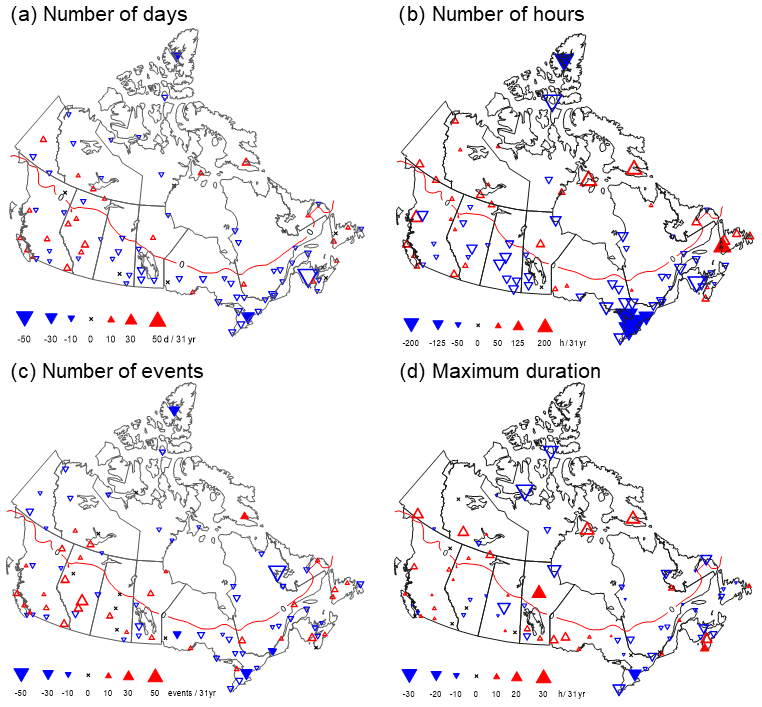
Figure 5Trends in near-0 ∘C ( ∘C) conditions over the 1981–2011 period: (a) annual average number of days, (b) annual average hours, (c) annual number of events, and (d) annual maximum duration. A solid triangle indicates statistical significance at the 5 % level. The red line indicates the annual average 0 ∘C surface temperature computed from the 1981 to 2010 climate normals (ECCC, 2019c).
Figure 5b shows trends in the annual number of hours with near-0 ∘C conditions. As in Fig. 5a, there is no simple relationship with the average annual 0 ∘C surface temperature line, although more decreasing trends are evident in areas above 0 ∘C. Most stations also experienced a decrease over the 1981–2011 period. This is most pronounced over southern Ontario but also over other large areas of the country. Newfoundland, several stations in the North, and southern British Columbia experienced increases. Significant decreases were observed in many southern Ontario stations and, again, at Eureka. Only one station (western Newfoundland) showed a significant increase. The maximum changes of over 300 h over the 31-year period (the equivalent of over 12 d) were found in three locations in Ontario, namely Toronto, Wiarton (which is north of Toronto), and London in the extreme southwestern part of the province.
Figure 5c shows trends in the annual number of events with near-0 ∘C conditions. No apparent pattern in relation to the 0 ∘C surface temperature line was found. The pattern is similar to those in Fig. 5a and b, although both increase and decreases are often observed in the same general areas. One exception is southern Ontario, which again shows consistent decreases. Only Toronto, Eureka, Sioux Lookout in northwestern Ontario, and Montreal show statistically significant change, with the number of events decreasing by 36, 31, 20, and 16, respectively, over the 31-year period.
Figure 5d shows the trends of the maximum duration. As in Fig. 5a–c, there is no simple relationship with the average annual surface temperature. There is a mix of decreasing and increasing patterns, and many stations show little change. Southern Ontario is completely characterized by decreases, whereas other regions have a mixed pattern. Stations that experience a significant change are scattered across the country and exhibit both increases and decreases. Only four locations show significant change: decreases in Toronto and Eureka of 25 and 18 h per event, respectively, and increases in Yarmouth (in Nova Scotia) and Thompson (in Manitoba) of 34 and 19 h per event, respectively.
The preceding analyses have illustrated Canada-wide conditions, but it is also critical to examine individual stations in more detail. Therefore, nine stations representing contrasting climatic conditions were chosen (Fig. 1). The annual average frequencies for the 4 surface-temperature- related indicators and the 13 precipitation-type-related indicators are available in Tables 2 and 3 at each of the case study locations. The greatest annual number of days and number of hours with near-0 ∘C conditions occurred at St. John's with 155 d and 1744 h, respectively. The maximum annual number of independent events occurred at Calgary (280 events), whereas the maximum durations are observed at the coastal stations of St. John's, Cambridge Bay, and Churchill (91, 89, and 84 h, respectively). This is consistent with the regional patterns shown in Figs. 3 and 4.
Table 2Average annual frequencies of the number of the days, hours, events, and maximum duration when −2 ∘C ∘C along with the 31-year trend values (in parentheses) based on hourly surface temperature over the 1981–2011 period (minimum 90 % of data). The numbers in bold indicate significant changes at the 5 % level.

Table 3The average number of hours with the 12 different precipitation type occurrences, and the indication of the direction of changes over the 1981–2011 period (in parentheses): the absence of parentheses denotes no significant change; “>” indicates a statistically significant increasing change; “<” indicates a statistically significant decreasing change; “rare” indicates that the given precipitation type rarely occurs and that the change is not computed; and “n/a” indicates that there were not enough data to compute the change. The statistical significance of the trends was assessed at the 5 % level.

An important characteristic of near-0 ∘C conditions – the duration of events – is studied further. As shown in Fig. 6, this distribution shows wide variation at each of the selected stations as well as between stations. For example, almost half of the events at Calgary were less than 2 h, whereas at Cambridge Bay this value was less than 7 h; 90 % of the events at Calgary were less than 8 h, whereas at Cambridge Bay this value was 30 h. In parallel, Calgary experienced the largest number of events, whereas Cambridge Bay experienced the fewest.
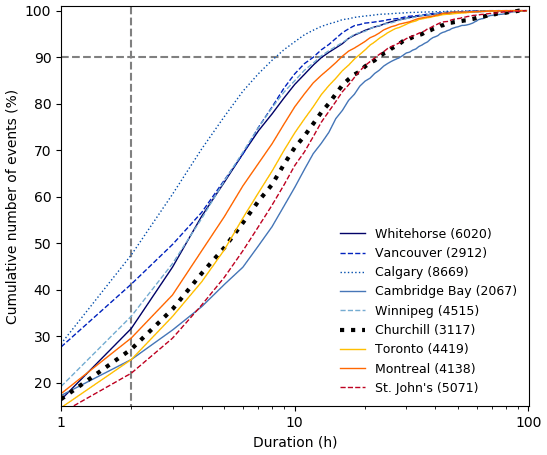
Figure 6The cumulative distribution of events (%) as a function of the duration (in hours) of near-0 ∘C ( ∘C) events at the nine stations across Canada over the 1981–2011 period (arranged from west to east). The total number of events is shown in parentheses and the duration is plotted using a logarithmic scale.
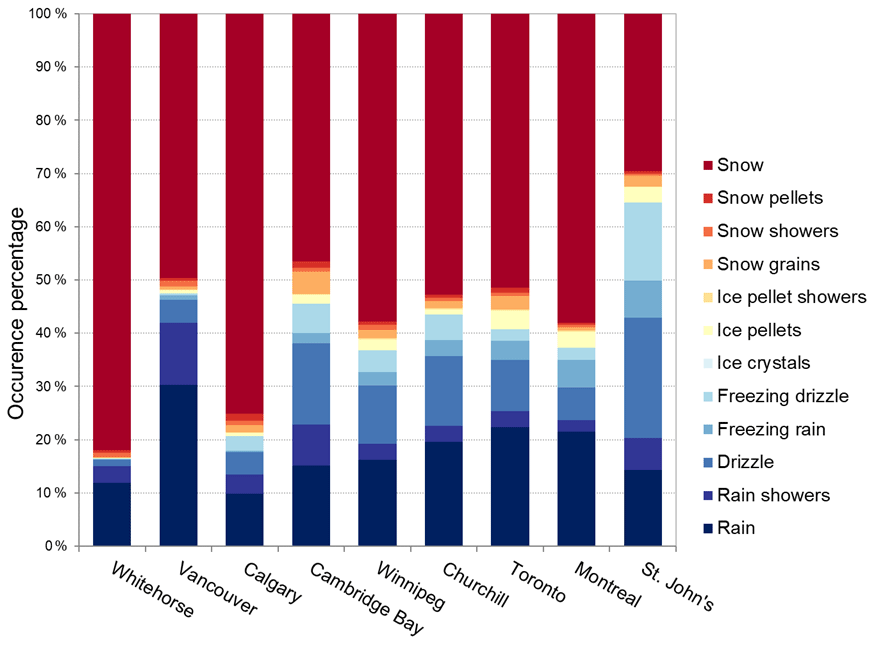
Figure 7The distribution of the occurrence of the different precipitation types under near-0 ∘C conditions at each of the nine stations over the 1981–2011 period. Stations are arranged from west to east.
While Table 3 contains the average number of hours with the occurrence of the 12 precipitation types, Fig. 7 shows the distribution of the occurrence based on the same input at the nine stations over the 1981–2011 period. Snow dominates at all stations, except at St. John's, and it is most prevalent over Whitehorse and Calgary. Freezing rain is minimal at most of the western stations but steadily increases eastward. There is also a large variation in precipitation type occurrences between the two northern stations with, for example, drizzle and freezing drizzle being minimal at Whitehorse but not at Cambridge Bay.
As discussed in Sect. 3.2, many stations exhibited some change but few were significant (Fig. 8, Table 2). This characteristic is also prevalent for the nine case studies with only two experiencing significant change. In particular, Toronto showed significant decreases in all four temperature-related indicators, whereas Montreal displayed a decrease in the number of events per year. These regional patterns are also somewhat reflected in the dependence on the average annual surface temperature: high values generally occur at stations with near- or above-0 ∘C conditions, although long durations often occur at stations with below-0 ∘C conditions.
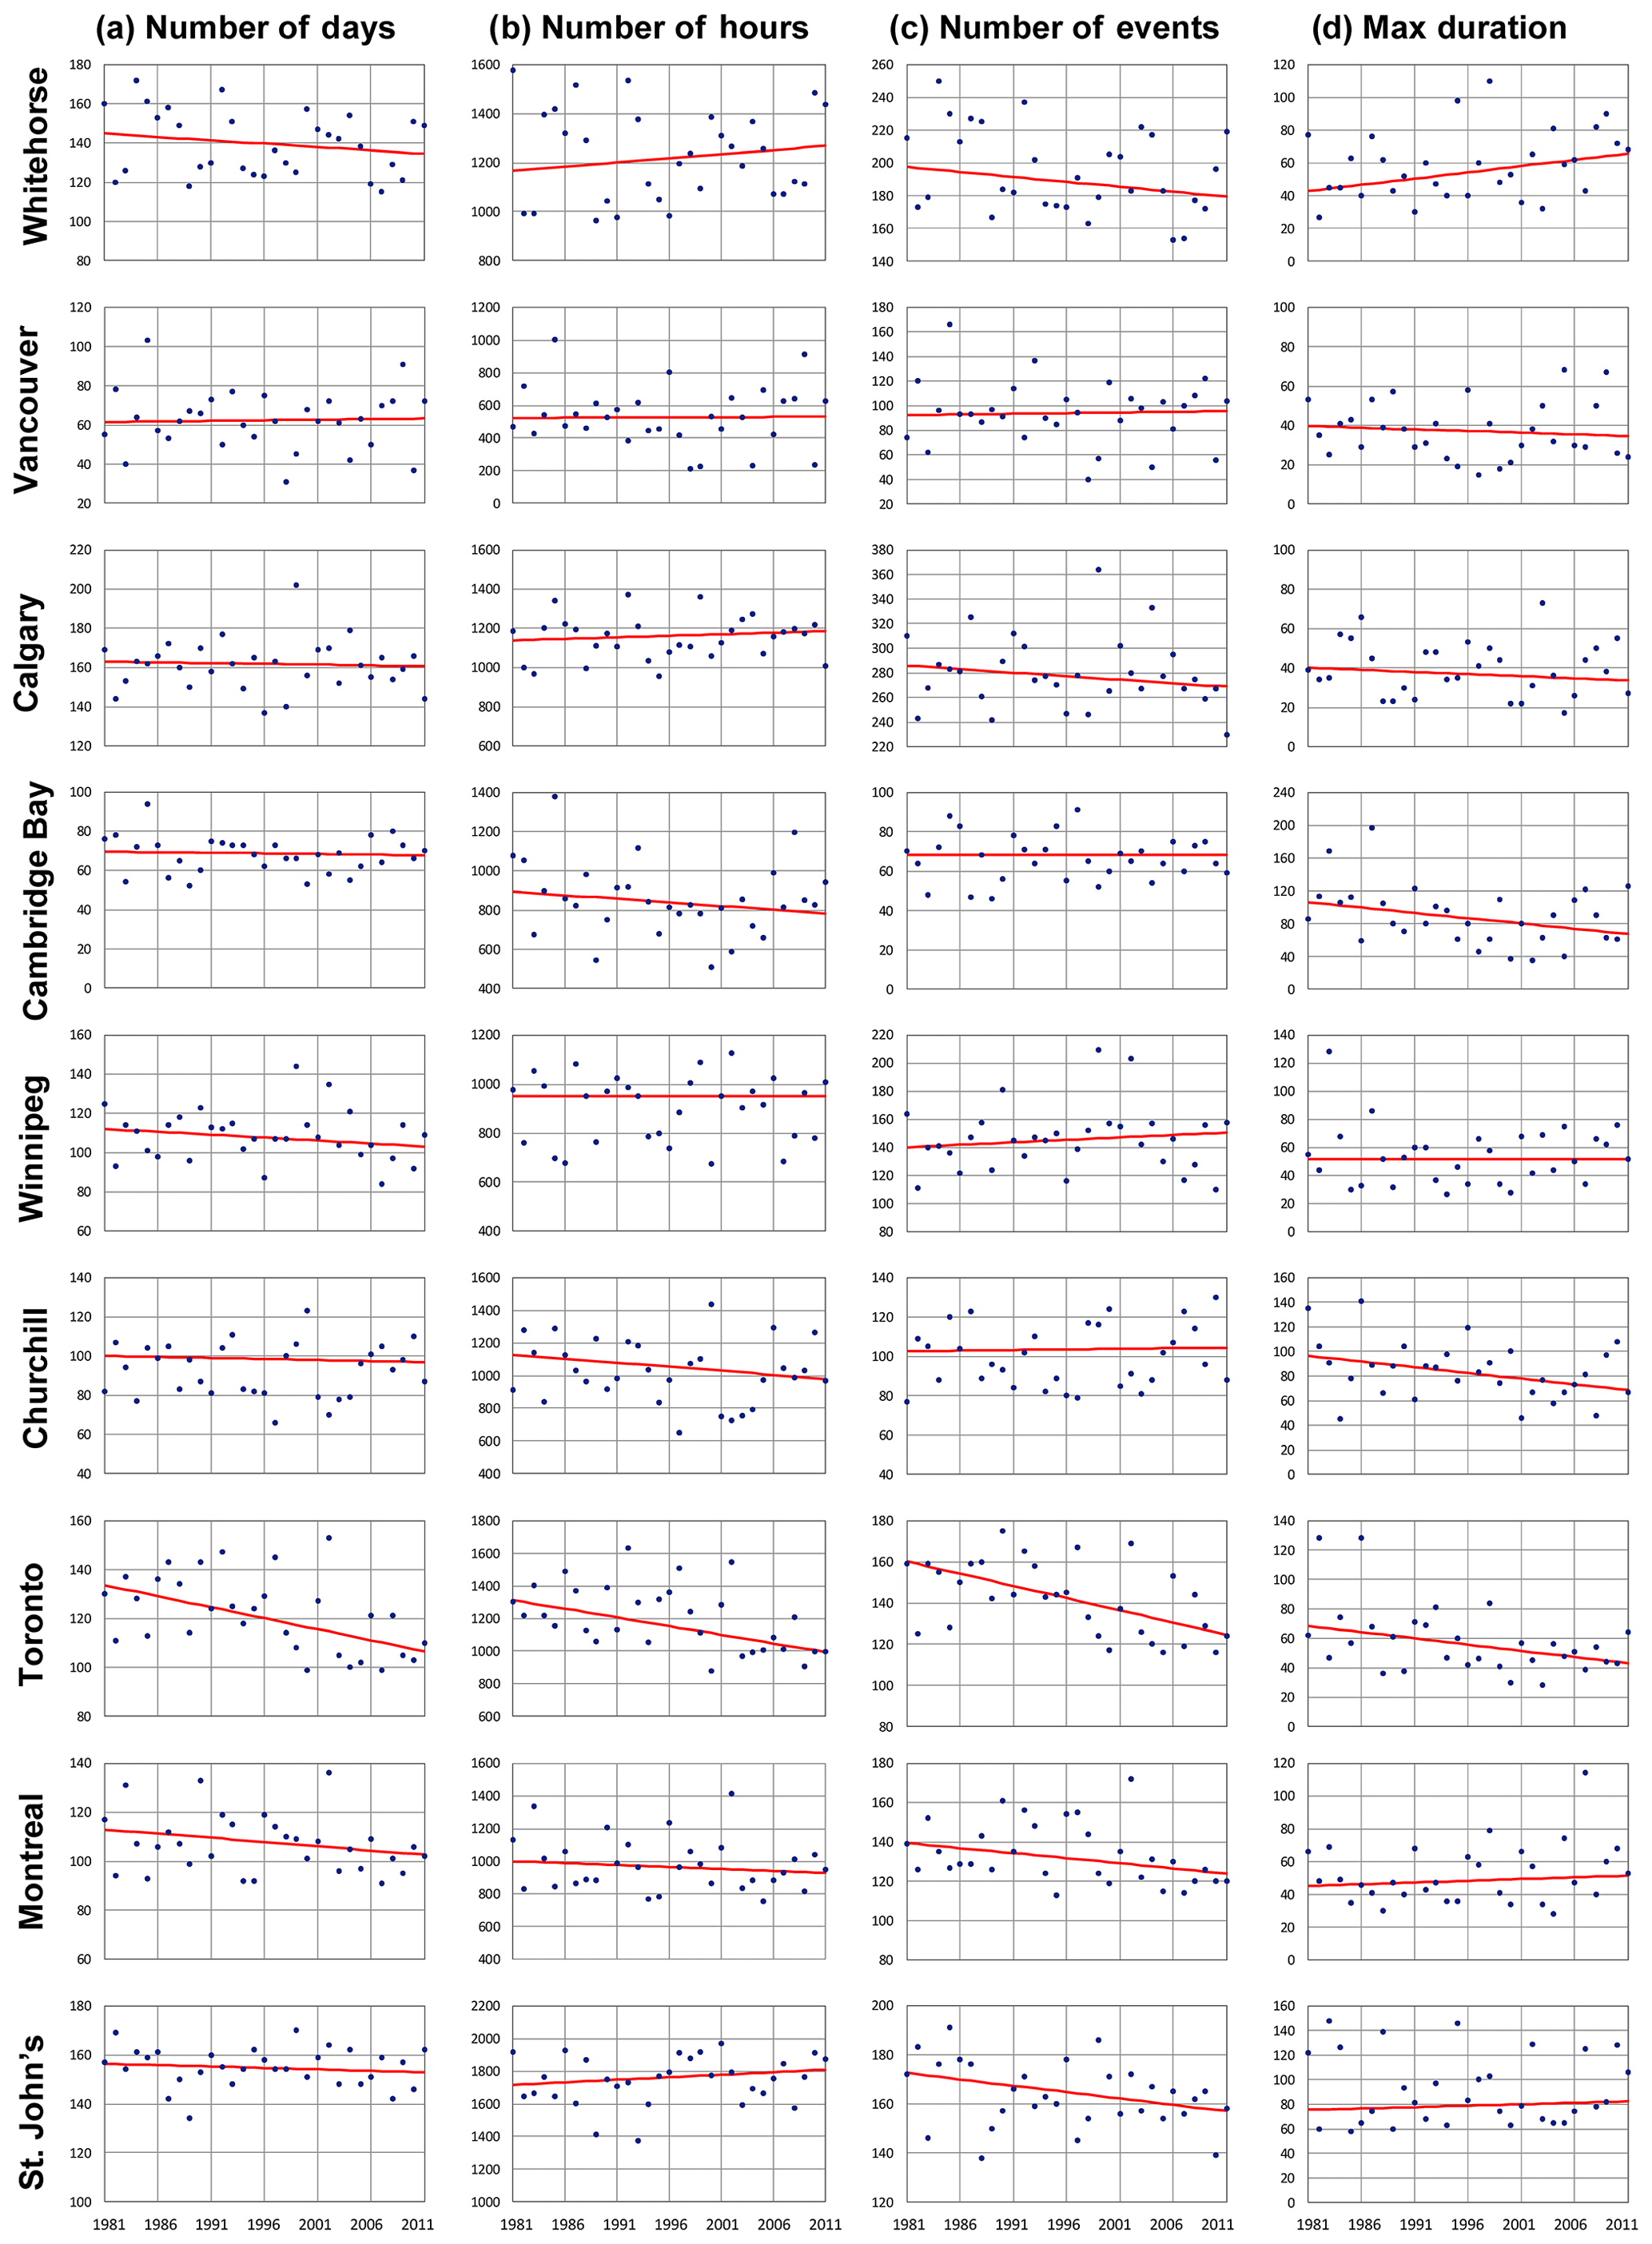
Figure 8The 1981–2011 values of the average (a) annual number of days, (b) annual number of hours, (c) annual number of events, and (d) annual maximum duration (in hours) during near-0 ∘C ( ∘C) conditions for the nine selected locations in Canada. Linear trend lines are superimposed in red.
The trend summary for the 12 weather types is shown in Table 3. Only Churchill exhibited a statistically significant trend (decrease) in the occurrence of any of the 12 precipitation types (bottom row). This arises from five significant decreasing precipitation types, namely rain showers, drizzle, freezing drizzle, ice pellets, and snow showers. St. John's experienced five significant changes (in rain showers, freezing drizzle, snow, snow grains, and snow showers), but, due to the shift from snow grains and snow showers to snow, the overall changes for all types were not significant.
Patterns on sub-annual timescales are also examined. The average monthly occurrences of near-0 ∘C conditions were calculated, and these values were compared with the average monthly surface temperatures. As shown in Fig. 9a, there is a strong dependence of average near-0 ∘C occurrences on the average monthly surface temperature over the 1981–2011 period; this pattern is largely independent of station. The largest occurrences naturally take place when the average temperatures are close to 0 ∘C. By ±10 ∘C, values have fallen to approximately 25 %–35 % of those at the peaks, with higher values generally associated with lower temperatures. Although rare, near-0 ∘C conditions sometimes occurred with average monthly surface temperatures that were more than 20 ∘C from the 0 ∘C line (Fig. 9b). The five coldest differences occurred at Churchill and Cambridge Bay, and the five warmest difference took place at Toronto, Winnipeg, and Montreal.
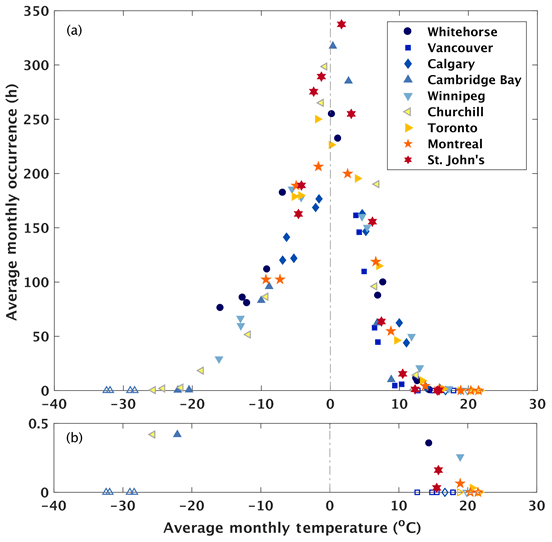
Figure 9(a) The average monthly occurrence (in hours) of near-0 ∘C conditions as a function of the average monthly surface temperature for the nine selected stations over the 1981–2011 period. Filled symbols indicate occurrence, and open or unfilled symbols indicate no occurrence. Panel (b) provides an expanded view to better illustrate low values of average monthly occurrence.
Further insight can be gained by examining shorter timescales. For example, Fig. 10 shows annual cycles of near-0 ∘C conditions and the associated precipitation type occurrences at four stations (Vancouver, Cambridge Bay, Toronto, and St. John's) that were chosen to illustrate a range of variation. Near-0 ∘C conditions do not occur during summer at all southern stations (Fig. 10a, c, d) but they can occur in any other month. In contrast, these conditions only occur in summer at Cambridge Bay (Fig. 10b). The most frequent occurrence can be seen at St. John's (Fig. 10d). Furthermore, the occurrence of any precipitation type tends to take place towards the “winter” side at southern stations, although there are exceptions. Such occurrences on the winter side are probably linked to storms passing over the stations and the associated precipitation, whereas occurrences on the “summer” side normally just reflect the diurnal cycle.
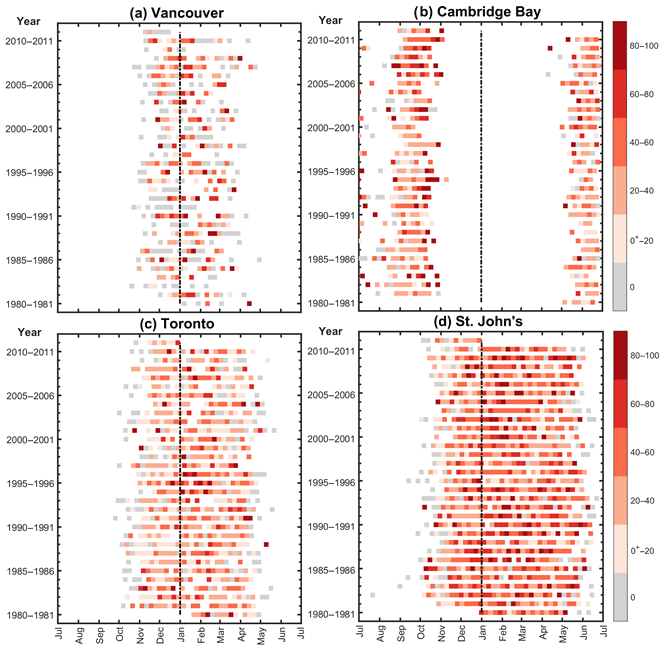
Figure 10The occurrence of near-0 ∘C conditions and any (of the 12) associated precipitation types at (a) Vancouver, (b) Cambridge Bay, (c) Toronto, and (d) St. John's over the 1981–2011 period. Shading refers to the weekly fraction (%) of near-0 ∘C hours with (or without) precipitation; the “ 0+” symbol refers to at least 1 h of precipitation; and the grey “0” denotes no precipitation, even if the near-0 ∘C criterion was met. Blank areas indicate no occurrence of near-0 ∘C conditions. The vertical, dashed line indicates 1 January.
Important features of near-0 ∘C conditions are the first and last occurrences of these conditions over the annual cycle (Fig. 10). For stations with “warm season” surface temperatures continually well above 0 ∘C, onset is defined as the first occurrence of near-0 ∘C conditions in the autumn, and cessation is defined as the last occurrence of these conditions in the spring. For stations such as Cambridge Bay with surface temperatures near-0 ∘C in every “warm season” month and below this value in every “cold season” month, onset is defined as the first occurrence of these conditions in the spring, and cessation is defined as the last occurrence of these conditions in the autumn. For stations such as Churchill, near-0 ∘C conditions can occur every month so neither onset nor cessation can be defined.
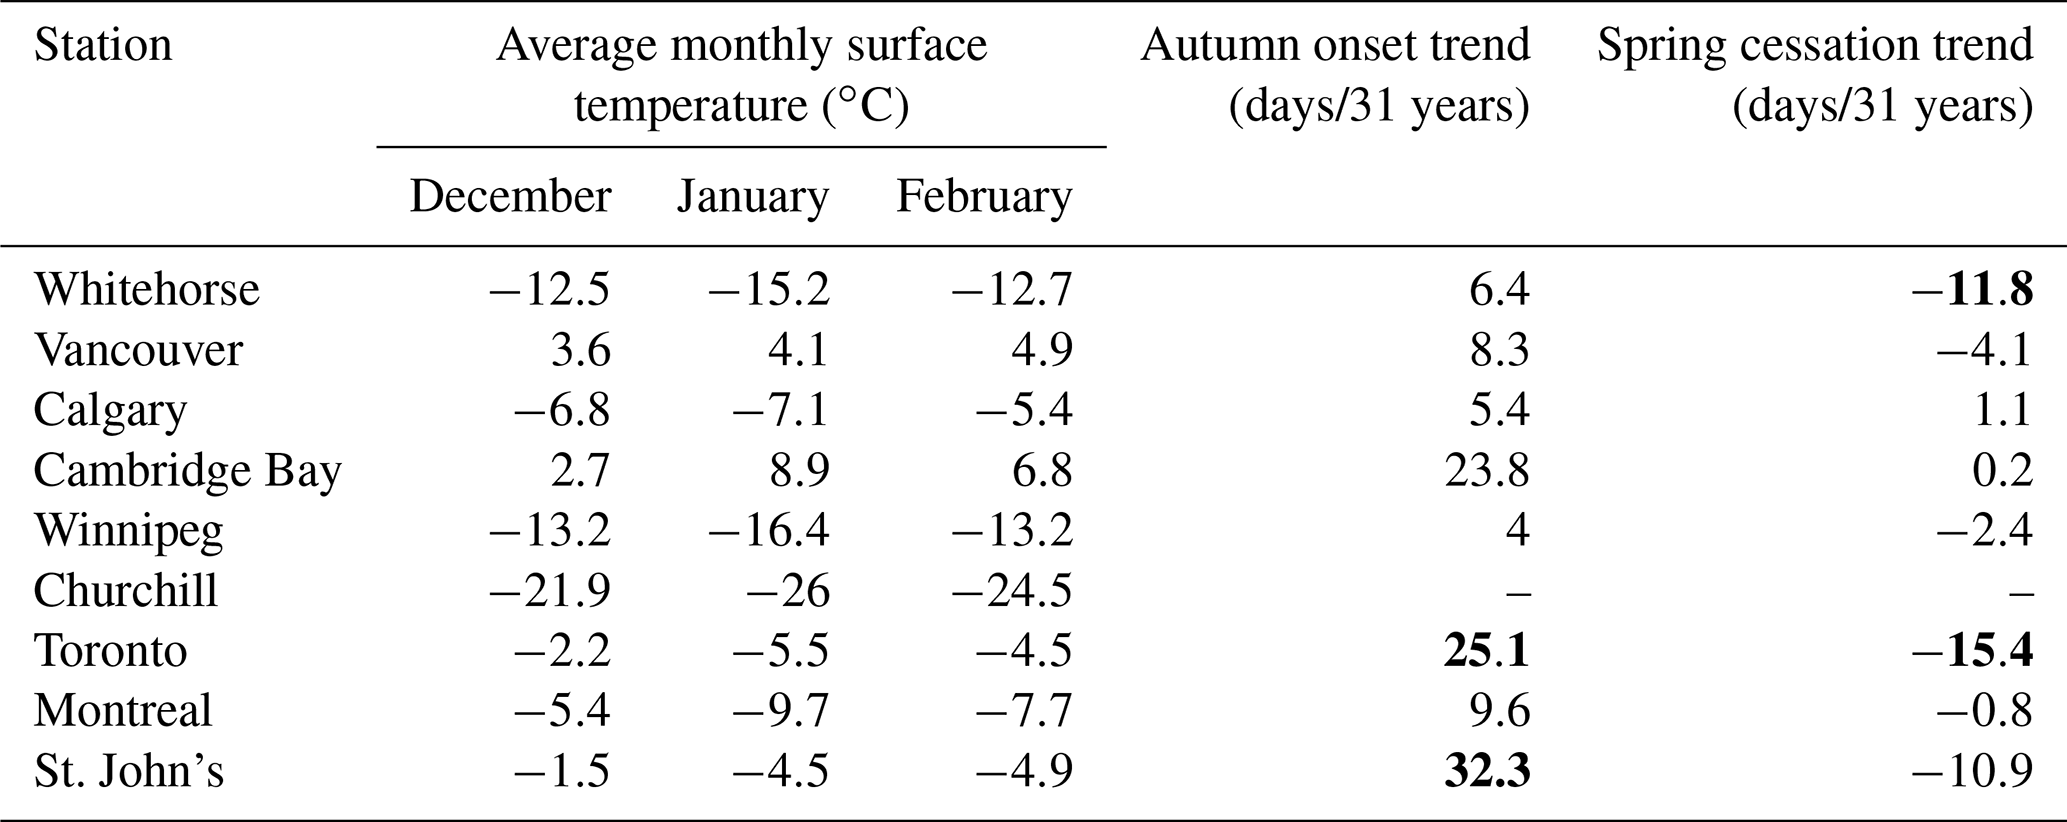
It would be expected that, with overall warming (Bush and Lemmen, 2019), the onset of near-0 ∘C conditions would occur later in autumn and earlier in spring. As shown in Table 3 and Fig. 10c, both of these trends are significant at only one location – Toronto. Whitehorse shows significant earlier spring cessation (Table 4), and St. John's shows significant later autumn onset (Fig. 10d, Table 4). Neither spring onset nor autumn cessation illustrated a statistically significant trend at Cambridge Bay (Table 4, Fig. 10b). No analysis was conducted for Churchill because near-0 ∘C conditions occurred every month (Table 4).
Table 4Average monthly surface temperatures (∘C) and trends (days/31 years) of the onset of near-0 ∘C conditions in autumn and cessation in spring for the 1981–2011 period. For Cambridge Bay, average monthly values refer to June, July, and August, and trends refer to the cessation of near-0 ∘C conditions in autumn and the onset in spring. No calculations were carried out at Churchill. Average monthly surface temperatures were obtained from ECCC for the 1981–2010 period (ECCC, 2019c). The numbers in bold indicate trends that are significant at the 5 % level.
It is also recognized that surface temperatures can enter and leave near-0 ∘C conditions in different manners. These are referred to as pathways, and there are only four possibilities (Fig. 11): events that vary (1) from above to below near-0 ∘C conditions, (2) from below to above near-0 ∘C conditions, (3) from above back to above near-0 ∘C conditions, and (4) from below back to below near-0 ∘C conditions. As shown in Fig. 11, pathway 3 is the most common at all of the selected stations, Calgary experiences this pathway more than anywhere else (94 events yr−1), and this pathway also dominates at Vancouver. The least common pathways, except in Vancouver and Calgary, are pathways 1 and 2 (which have very similar values at all of the other stations), with the overall lowest value being observed at Cambridge Bay (less than 4 events yr−1).
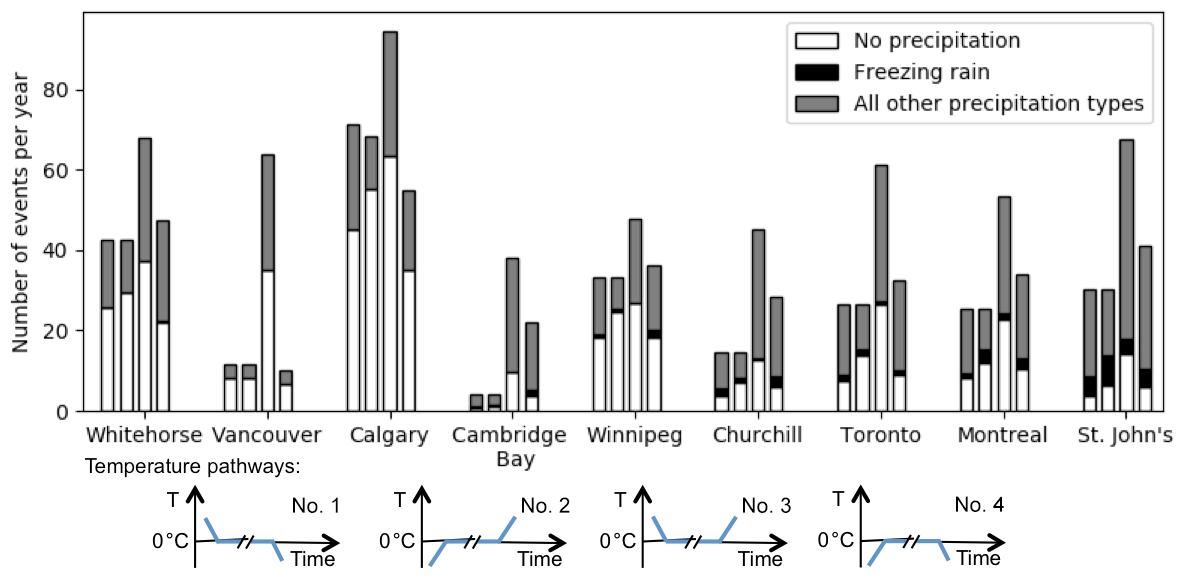
Figure 11Average annual number of near-0 ∘C events at the nine selected stations organized by surface temperature pathways. The four pathways are shown schematically below the figure. They are represented by bars at each station from pathway 1 to 4 (from left to right). No shading refers to the occurrence of near-0 ∘C conditions, dark shading refers to the occurrence of freezing rain near 0 ∘C, and light grey shading refers to the occurrence of all other types of precipitation near 0 ∘C.
Pathways with the highest and lowest fractions of any type of precipitation vary. The highest fractional occurrence of any precipitation is associated with pathway 1 at St. John's (88 %), and this pathway is also associated with the highest fraction at Calgary and Cambridge Bay; pathway 3 is associated with the highest fraction at Vancouver; and pathway 4 is associated with the highest fraction at the remaining five stations. The lowest fractional occurrence is associated with pathway 2 at Calgary (19 %), and this pathway is also associated with the lowest fraction at all stations. St. John's experiences the maximum occurrence of freezing rain for all pathways. The pathway most often associated with freezing rain events varies between stations. For example, it is pathway 1 at Churchill; pathway 2 at Toronto, Montreal, and St. John's; and pathway 4 at Winnipeg.
5.1 Canada-wide patterns and governing factors
The Canada-wide plots exhibit a number of patterns in the temperature indicators. First, there are three general regions in terms of high occurrences of near-0 ∘C conditions (Fig. 3a, b, c). These are in central British Columbia and sometimes stretch into Saskatchewan, southern Ontario, and the Atlantic region. The size of the regions varies with indicator. Regions with generally low occurrences are in the north, where such temperatures are not often reached, and in the lower southwestern part of British Columbia, where temperatures seldom reach 0 ∘C. In terms of duration (Fig. 3d), the highest values tend to be in the Atlantic region, the eastern Northern region, and the northern coastal British Columbia. The lowest values are in southwestern British Columbia and stations just east of the Rocky Mountains in Alberta. These regional patterns are also somewhat reflected in the dependence on the average annual 0 ∘C surface temperature line, with higher values generally occurring at stations near or above 0 ∘C. However, long durations also often occur at stations with below-0 ∘C conditions.
There are numerous factors contributing to these patterns. One is the proximity to coastlines. Many of the oceans surrounding Canada are close to 0 ∘C, especially in the cold season (Phillips, 1990; Larouche and Galbraith, 2016), and this acts to maintain station temperatures near this value. For some stations in the North and Atlantic regions, the development and melting of sea ice must also act to maintain temperatures near 0 ∘C; inland stations in close proximity to large lakes likely experience a similar effect from the development and melting of lake ice. For example, Larouche and Galbraith (2016) showed that water temperatures in parts of the Great Lakes are close to 0 ∘C during the cold season. Most stations are similarly affected by the melting and freezing of snow on the surface (Takeuchi et al., 2002). Many stations are also impacted by frozen soil: its freezing and melting would again act to maintain temperatures near 0 ∘C (Boone et al., 2000).
Mountains can also be a contributor to near-0 ∘C conditions. Circulations such as chinooks (American Meteorological Society, 2012) and valley/mountain flows are continually shifting temperatures, and these temperatures can pass through 0 ∘C in the cold season (Longley, 1967). Chinooks are common at Calgary. Longley (1967) found an average of 27 d of chinooks per season (December–February) over the 1931–1965 period, whereas Nkemdirim (1996) found 50 d per season (November–February) over the 1951–1990 period. The associated temperature changes are typically rapid and are sometimes associated with several passes through near-0 ∘C conditions in a day (Brinkman and Ashwell, 1968). Temperature changes during chinooks can be dramatic. Nkemdirim (1996) pointed out that temperature increases of more than 25 ∘C in less than 24 h are typical, and Gough (2008) indicated that the largest observed temperature change at Calgary was associated with a 4 h event in 1883 during which the temperature increased by 30 ∘C (from −17 to +13 ∘C). During chinook episodes, large temperature swings can also occur. For example, Brinkman and Ashwell (1968) showed that there were 4 near-0 ∘C events at Calgary on 16 February 1965 (two 1 h periods, one 2 h period, and one 5 h period) and no associated precipitation at all.
These chinook effects undoubtedly contribute to the findings at Calgary. As shown in Sects. 3 and 4, the location experiences many days and events with near-0 ∘C conditions, although it experiences relatively few hours with near-0 ∘C conditions (as the events are short) as well as relatively few hours of associated precipitation.
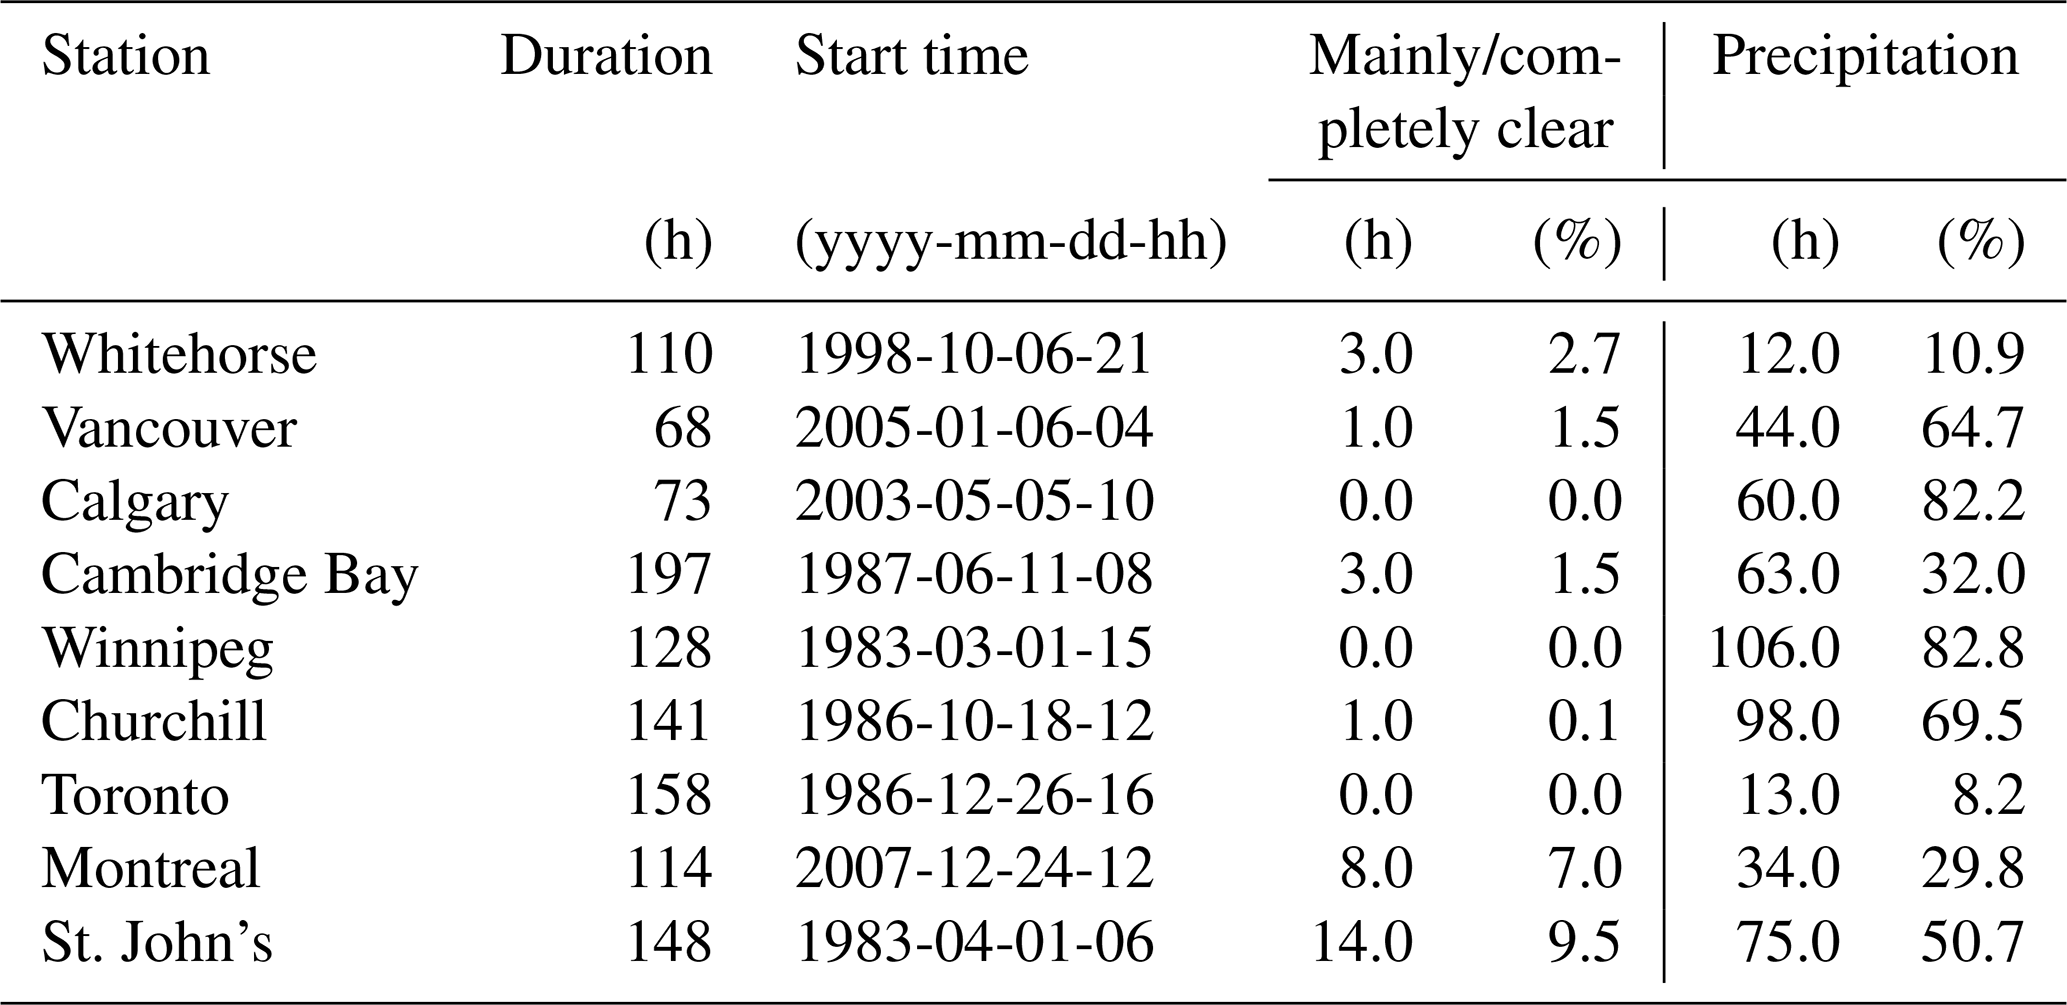
Long durations of near-0 ∘C conditions based on surface temperature were further examined by identifying the longest periods at the selected stations (Table 5). The longest period was found at Cambridge Bay (197 h) and the shortest was found in Vancouver (68 h), although it was still almost 3 d. These events occurred in every season, with the longest being in June (Cambridge Bay). An analysis of the hourly sky conditions during these events was carried out by identifying the associated frequency of clear or mainly clear sky conditions (≤2 octas of clouds). All of the events were dominated by cloudy conditions that were sometimes accompanied by persistent precipitation (Table 5). Such sky conditions would contribute to reducing the temperature swings associated with daytime heating and nighttime cooling (see, e.g., Ahrens et al., 2015). Many of the mainly or completely clear reports were linked to temperatures initially passing into or finally passing out of these long duration near-0 ∘C conditions.
Table 5The longest duration events at the nine selected stations. Columns indicate the maximum duration; the start time; the total hours and the fraction of the duration with mainly or completely clear sky conditions; and the total hours with any of the 12 reported precipitation types and the fraction of the duration. Times are local standard.
There are also patterns with the occurrence of the associated precipitation types. Canada is almost split in two between west (low values) and east (high values), as shown in Fig. 4. This is likely a reflection of moisture access, with the eastern regions receiving warm, humid tropical and subtropical air – that raises temperatures through 0 ∘C – much more often than western regions (Hare, 1997). One exception in the west is northern coastal British Columbia (Terrace near the coast and nearby Smithers further inland). Some Northern stations, particularly in the eastern portion, experience more occurrences than many of the stations in British Columbia and the Prairies do. The regional patterns related to the occurrence of any precipitation type are not directly reflected in the dependence on the average annual 0 ∘C surface temperature line. This is not the case for freezing rain, where high values generally occur at stations with above-0 ∘C conditions.
The fractional occurrence of precipitation types (Fig. 7) can generally be explained as follows. In some of the western regions (such as Calgary and Whitehorse), the atmosphere is normally dry; this means that the melting of snow aloft is reduced because the wet bulb temperature is lowered. Over the 2 ∘C temperature window studied here, more of the snow will not have melted (Matsuo et al., 1981). In contrast, the Atlantic region is subject to large storms coming from the south as discussed by, for example, Stewart et al. (1987) and Stewart et al. (1995a). These vigorous storms are almost always associated with surface temperatures passing from below to above 0 ∘C with near-saturated conditions (Stewart and Patenaude, 1988); they are also associated with strong warm air advection aloft that often leads to inversions and freezing rain (Stewart et al., 1987).
An examination of the four pathways through which surface temperatures enter and leave near-0 ∘C conditions revealed additional patterns (Fig. 11). Regardless of whether the average annual surface temperature is above, near, or below 0 ∘C, the pathway associated with temperatures that were initially above-0 ∘C, dropped, and then once again rose above this threshold (pathway 3) is connected to the highest number of events at all nine selected stations. In contrast, this most common pathway is associated with a variable fraction of precipitation occurrence from low values, perhaps simply reflecting the diurnal cycle, to high values, possibly reflecting the passage of weather systems. Freezing rain is most likely present in events with temperatures passing from below to above 0 ∘C (pathway 2) at several locations; this pathway follows the temperature evolution during the passage of a warm front, which commonly leads to freezing rain (see, e.g., Stewart et al., 1995b).
5.2 Enhanced occurrence of near-0 ∘C conditions
As shown in Fig. 1, near-0 ∘C conditions are prominent at several of the selected stations. At four locations, this is the most common temperature band despite wide variations in their whole span of temperatures, average annual temperature, and geographic location. These stations are Whitehorse, Churchill, Toronto, and St. John's. In addition, there is a secondary peak near 0 ∘C at Winnipeg. Cambridge Bay and Montreal did not display dramatic change near 0 ∘C, although there was a jump in the occurrence from colder temperatures. At Vancouver and Calgary, no obvious enhancement was apparent.
The enhanced occurrence of near-0 ∘C conditions is similar to the pattern found in Japan by Fujibe (2001). This study attributed the enhancement to the melting of falling snow, which cooled surface temperatures towards 0 ∘C, as previously noted by works such as Wexler et al. (1954). However, other factors are also critical as discussed in Sect. 5.1. For example, the only mention by Fujibe (2001) of the role played by snow cover was as a factor leading to stable atmospheric conditions, which would reduce mixing that acts to eliminate isothermal layers near 0 ∘C, but there was no mention of the cooling effect on the atmosphere of the melting snowpack and refreezing of meltwater (Takeuchi et al., 2002). In addition, the freezing of freezing rain drops at the surface acts to raise temperatures towards 0 ∘C (Stewart, 1985); rain reaching the surface that subsequently freezes with lowering temperatures would have the same effect.
5.3 Factors affecting change
A question that arises is whether the observed warming over most of Canada during the last few decades (Vincent et al., 2015, 2018) has impacted the occurrence of near-0 ∘C conditions. Results from this study indicate a general lack of statistically significant change in the frequency and maximum duration of near-0 ∘C conditions (Sect. 3.2). This is consistent with the Canada-wide assessment of annual freeze–thaw days (defined as the number of days with daily minimum temperatures ≤0 ∘C and daily maximum temperatures ≥0 ∘C) for the period from 1948 to 2016 that found a slight decrease in these events when averaged over the entire country (Vincent et al., 2018). However, regional differences were apparent, including minor increases in the Prairies and Ontario.
The lack of significant change also holds for the four temperature indicators in this study, including the onset and cessation of near-0 ∘C conditions. The major exception is Toronto with significant declines in all four temperature indicators, delayed onset of near-0 ∘C conditions in the autumn, and earlier spring cessation of these conditions (Tables 2, 4). Montreal only showed significant declines in the number of near-0 ∘C events (Table 2); Whitehorse showed significantly earlier spring cessation, and St. John's showed later autumn onset (Table 4). Several stations illustrated significant change (increase and/or decrease) in the occurrence of at least one precipitation type, but only Churchill experienced a significant decrease in the occurrence of any precipitation type (Table 3).
It is not surprising that significant trends are not always evident. This may simply reflect a relatively short observational period (31 years). Moreover, and as discussed in Sect. 5.1 and 5.2, many factors contribute to the occurrence of near-0 ∘C conditions and these can counter each other. At many stations, temperatures in mid-winter are far below 0 ∘C (Table 4), even with the recent warming. For such stations, overall warming simply leads to a shift in the timing of near-0 ∘C occurrences towards winter, so the overall number of occurrences does not necessarily change. In contrast, some stations, such as in southern Ontario (e.g., Toronto), are normally not far below 0 ∘C in mid-winter (Table 4). With the observed overall warming, these stations experience a shift in the timing of near-0 ∘C occurrence towards winter but more instances of mid-winter temperatures above 2 ∘C will probably also occur, so they would likely experience an overall decrease in near-0 ∘C occurrences. In addition, the melting and freezing factors contributing to near-0 ∘C conditions would continue to be active despite warming (Sect. 5.1). One exception may again be southern Ontario, as the ground is not covered by as much snow (Vincent et al., 2015; Bush and Lemmen, 2019).
These findings represent a basis for examining how near-0 ∘C conditions may change in the future. Some studies of future freezing rain conditions have been carried out over North America (e.g., Lambert and Hansen, 2011; Jeong et al., 2019) and southern Quebec (Matte et al., 2019) but none have focused specifically on near-0 ∘C conditions.
One can anticipate more indications of significant trends in near-0 ∘C conditions. Although this is not generally apparent at present, there should eventually be, for example, widespread delays in occurrence in autumn and earlier cessation in spring at southern locations. However, the total number of occurrences may be countered by warmer mid-winters, although at locations such as in Toronto (Table 4), mid-winter temperatures may be substantially more often sustained above 2 ∘C (and thus no longer as often near 0 ∘C). This latter factor may not occur for a long time at locations such as Winnipeg, where temperatures are normally far below 0 ∘C in mid-winter (Table 4). Such changes would be expected to affect the occurrence of the near-0 ∘C conditions shown in Fig. 1. For example, these conditions should become less prominent in Toronto but not necessarily at stations such as Winnipeg.
Temperatures near 0 ∘C represent an important issue throughout Canada. A comprehensive characterization of near-0 ∘C conditions and the occurrence of the associated precipitation types has been carried out. To accomplish this, the study had to carefully address which stations had good quality hourly data for a sufficient period; 92 locations were finally used for the 1981–2011 period. The period's last year (2011) was determined by the shrinking manual observation program required for the precipitation type observations. The analysis was completed for four temperature-related indicators, 12 precipitation type indicators, and four combined temperature and precipitation type indicators. Using the ∘C criterion, important insight was gained from the 31-year climatological and trend assessments for all locations and from in depth analysis of the nine case study locations. Key findings include the following:
-
Canada is characterized by highly variable near-0 ∘C occurrences, events, durations, and associated precipitation types that have been quantified for the first time.
-
There are systematic preferred regions with respect to the occurrence of near-0 ∘C conditions and the associated precipitation types that can be explained by large- to regional-scale conditions. Stations near oceans, for example, tend to have the largest values due to the moderating effects of near-0 ∘C oceanic temperatures.
-
A distinctive pattern related to the occurrence of several precipitation-related indicators is an east–west divide roughly down the centre of the country.
-
As expected, the monthly near-0 ∘C occurrences peak when the average monthly temperatures are near 0 ∘C and there is a sharp fall off as averages move away from this value, although there are rare occurrences at much colder or warmer temperatures.
-
The occurrence of near-0 ∘C values is influenced by numerous factors including daily, radiatively driven temperature variation and the annual temperature cycle. In addition, precipitation, snow cover, and sea/lake ice can be important: all of these can melt and freeze, and the impact of this change always tips temperatures towards 0 ∘C. In addition, sea surface temperatures around Canada tend to be near 0 ∘C during the cold season, especially near some of Canada's coastlines (Larouche and Galbraith, 2016). This is especially evident in Atlantic Canada and the Arctic; parts of the Great Lakes have comparable values in some seasons as well. When such conditions occur, sea surface temperatures are generally slightly above 0 ∘C, although in some small areas they are below this value. Sea surface temperature values near 0 ∘C would act to bring the temperature of the overlying air towards similar values.
-
The longest duration events at the nine selected stations were associated with persistent cloud conditions that act to reduce diurnally driven temperature swings.
-
The aforementioned processes lead to near-0 ∘C temperatures often being the most common occurring temperatures during the year. This observation is evident over wide geographic and climatic areas.
-
Four pathways into and out of near-0 ∘C conditions occur. At the nine selected stations across Canada, the pathway in which surface temperatures never become lower than −2 ∘C is associated with the highest number of events, and the one in which surface temperatures pass from below to above 0 ∘C is associated with the lowest fraction of events with any precipitation (except at Vancouver).
-
Even though surface temperatures have generally increased over the 1981–2011 period (Bush and Lemmen, 2019), the occurrences of near-0 ∘C conditions have not trended in a similar fashion. This arises at least in part from the fact that increased temperatures in the warm season lead to fewer near-0 ∘C conditions, but this is largely balanced by more occurrences in the cold season. In addition, the processes acting to maintain near-0 ∘C conditions have generally continued to occur, even as overall temperatures have increased. One exception is Toronto, which has consistent cold season temperatures not too far below 0 ∘C.
-
There has been no significant change in the frequency of occurrence of any of the 12 precipitation types or of freezing rain at most stations. However, a period of 31 years is relatively short to detect statistically significant changes. Using different selection criteria and a different time period, Wang (2006) found that some areas of Canada experienced an increasing trend of freezing rain events over the 1953–2004 period.
Although our ∘C window for defining near-0 ∘C conditions is justified, as discussed in Sect. 2.2, it is recognized that other surface temperature windows could have been used. The overall findings would undoubtedly have been similar, although quantitative values would have changed. For example, although not shown, near-0 ∘C conditions largely exhibit the same occurrence patterns at the selected stations (Fig. 1) regardless of whether a ∘C window or a ∘C window is used. Moreover, a narrower (wider) surface temperature window would lead to smaller (larger) fractions of precipitation type occurrences that are simply rain and snow. Nonetheless, future research should thoroughly investigate the implications of applying different definitions to the study of near-0 ∘C conditions. With respect to trend computation, this study followed the statistical approach used in several recent Canadian studies (Vincent et al., 2015, 2018), but the use of “significance/non-significance” terms for trend analysis can be restrictive. Additional research is needed to examine the strengths and probabilities of each relationship, as discussed by, for example, Wasserstein et al. (2019).
The findings of this study may be applicable to many other regions. On examining a global map of the location of the average annual 0 ∘C isotherm (Ahrens et al., 2016), one can appreciate that it slices through large expanses of land; areas at least occasionally passing through 0 ∘C will be massive. A recent WMO international project that focused on solid precipitation measurement (Nitu et al., 2018) and utilized observational sites across North America, Europe, and Asia was concerned, in part, with the −2 ∘C ∘C so called “mixed” precipitation range examined here. Dai (2008) and Jennings et al. (2018) have also illustrated rain/snow issues over many regions of the world. Given the importance of near-0 ∘C conditions and the large areas of the world subject to them, analyses carried out in this study should be conducted elsewhere.
In summary, this study can be considered an important step in improving the understanding of near-0 ∘C conditions and the associated precipitation types across Canada and possibly many other regions.
The dataset used in this article is available from Environment Climate Change Canada.
EM was the lead author, obtained and analyzed most of the data, and wrote several sections of the article. RES wrote several sections of the paper and carried out some of the analyses. JMT and ZL carried out analyses and contributed to the paper. BK and BRB contributed to the paper. All authors contributed scientifically by providing comments and suggestions.
The authors declare that they have no conflict of interest.
This article is part of the special issue “Understanding and predicting Earth system and hydrological change in cold regions”. It is not associated with a conference.
The authors would like to thank David Hudak from Environment and Climate Change Canada and the four reviewers for their useful comments and suggestions that helped to improve the paper.
This research was supported by the Changing Cold Regions Network, which was supported by the Natural Sciences and Engineering Research Council (NSERC) of Canada through its Climate Change and Atmospheric Research (CCAR) initiative (grant no. 433923-2012); the Global Water Futures study, which is supported by the Canada First Research Excellence Fund; and the NSERC Discovery grants to Ronald E. Stewart and Julie M. Theriault.
This paper was edited by Markus Hrachowitz and reviewed by Paul Whitfield and three anonymous referees.
Ahrens, C. D., Jackson, P. L., and Jackson, C. E. J.: Meteorology Today: An introduction to weather, climate, and the environment, Second Canadian edition, Nelson Education, ISBN-13: 978-0176530792, 2015.
American Meteorological Society: Chinook, Glossary of Meteorology, available at: http://glossary.ametsoc.org/wiki/Chinook (last access date: 2 April 2020), 2012.
American Meteorological Society: Glossary of Meteorology, available at: http://glossary.ametsoc.org/wiki/Main_Page (last access: 3 October 2019), 2018.
Auer Jr., A. H.: The rain versus snow threshold temperatures, Weatherwise, 27, 67–67, 1974.
Beltaos, S., Prowse, T., Bonsal, B., Mackay, R., Romolo, L., Pietroniro, A., and Toth, B.: Climatic effects on ice-jam flooding of the Peace-Athabasca Delta, Hydrol. Process., 20, 4031–4050, https://doi.org/10.1002/hyp.6418, 2006.
Bonsal, B. R. and Prowse, T. D.: Trends and variability in spring and autumn 0 ∘C-isotherm dates over Canada, Climatic Change, 57, 341–358, https://doi.org/10.1023/a:1022810531237, 2003.
Boone, A., Masson, V., Meyers, T., and Noilhan, J.: The influence of the inclusion of soil freezing on simulations by a soil–vegetation–atmosphere transfer scheme, J. Appl. Meteorol., 39, 1544–1569, https://doi.org/10.1175/1520-0450(2000)039<1544:TIOTIO>2.0.CO;2, 2000.
Bresson, É., Laprise, R., Paquin, D., Thériault, J., and Elía, R. D.: Evaluating the ability of CRCM5 to simulate mixed precipitation, Atmos.-Ocean, 55, 79–93, https://doi.org/10.1080/07055900.2017.1310084, 2017.
Brinkmann, W. and Ashwell, I.: The structure and movement of the chinook in Alberta, Atmosphere, 6, 1–10, https://doi.org/10.1080/00046973.1968.9676548, 1968.
Bush, E. and Lemmen, D. S. (Eds.): Canada's changing climate report, Government of Canada, Ottawa, Ontario, 444 pp., 2019.
Carrière, J.-M., Lainard, C., Bot, C. L., and Robart, F.: A climatological study of surface freezing precipitation in Europe, Meteorol. Appl., 7, 229–238, https://doi.org/10.1017/s1350482700001560, 2000.
Changnon, S. A.: Characteristics of ice storms in the United States, J. Appl. Meteorol., 42, 630–639, https://doi.org/10.1175/1520-0450(2003)042<0630:coisit>2.0.co;2, 2003.
Cortinas, J.: A climatology of freezing rain in the Great Lakes region of North America, Mon. Weather Rev., 128, 3574–3588, https://doi.org/10.1175/1520-0493(2001)129<3574:acofri>2.0.co;2, 2000.
Dai, A.: Temperature and pressure dependence of the rain-snow phase transition over land and ocean, Geophys. Res. Lett., 35, L12802, https://doi.org/10.1029/2008GL033295, 2008.
ECCC (Environment and Climate Change Canada): Historical Climate Data portal, available at: http://www.climate.weatheroffice.ec.gc.ca, last access: 3 October 2019a.
ECCC (Environment and Climate Change Canada): MANOBS (Manual of Surface Weather Observation Standards), 8th Edition, available at: https://www.canada.ca/en/environment-climate-change/services/weather-manuals-documentation/manobs-surface-observations.html, last access: 3 October 2019b.
ECCC (Environment and Climate Change Canada): Canadian Climate Normals, available at: http://climate.weather.gc.ca/climate_normals/index_e.html, last access: 24 October 2019c.
Frei, C. and Schär, C.: Detection probability of trends in rare events: Theory and application to heavy precipitation in the Alpine region, J. Climate, 14, 1568–1584, 2001.
Fujibe, F.: On the near-0 ∘C. frequency maximum in surface air temperature under precipitation: A statistical evidence for the melting effect, J. Meteorol. Soc. Jpn., 79, 731–739, 2001.
Groenemeijer, P., Becker, N., Djidara, M., Gavin, K., Hellenberg, T., Holzer, A. M., Juga, I., Jokinen, P., Jylhä, K., Lehtonen, I., Mäkelä, H., Napoles, O., Nissen, K., Paprotny, D., Prak, P., Púčik, T., Tijssen L., and Vajda, A.: Past Cases of Extreme Weather Impact on Critical Infrastructure in Europe. Office of Critical Infrastructure Protection and Emergency Preparedness, FP7-SEC-2013-1, 129 pp., 2017.
Groisman, P. Y., Bulygina, O. N., Yin, X., Vose, R. S., Gulev, S. K., Hanssen-Bauer, I., and Førland, E.: Recent changes in the frequency of freezing precipitation in North America and Northern Eurasia, Environ. Res. Lett., 11, 045007, https://doi.org/10.1088/1748-9326/11/4/045007, 2016.
Gullett, D. W. and Skinner, W. R.: The state of Canada's climate: temperature change in Canada 1895-1991, SOE Report no. 92-2. Catalogue No. En 1-11/92-2E.A, State of the Environment Report, ISSN 0843-6193, Toronto, ON, Environment Canada, 1992.
Hare, K.: Canada's climate: An overall perspective, in: “The Surface Climates of Canada”, McGill-Queen's University Press, 3–20, 1997.
Henson, W., Stewart, R., and Kochtubajda, B.: On the precipitation and related features of the 1998 Ice Storm in the Montréal area, Atmos. Res., 83, 36–54, https://doi.org/10.1016/j.atmosres.2006.03.006, 2007.
Henson, W., Stewart, R., Kochtubajda, B., and Thériault, J.: The 1998 Ice Storm: Local flow fields and linkages to precipitation, Atmos. Res., 101, 852–862, https://doi.org/10.1016/j.atmosres.2011.05.014, 2011.
Houston, T. G. and Changnon, S. A.: Freezing rain events: a major weather hazard in the conterminous US, Nat. Hazards, 40, 485–494, https://doi.org/10.1007/s11069-006-9006-0, 2007.
Intergovernmental Panel on Climate Change: Climate Change 2013: The Physical Science Basis, Contribution of Working Group I to the Fifth Assessment Report of the Intergovernmental Panel on Climate Change, edited by: Stocker, T. F., Qin, D., Plattner, G.-K., Tignor, M., Allen, S. K., Boschung, J., Nauels, A., Xia, Y., Bex, V., and Midgley, P. M., Cambridge University Press, Cambridge, United Kingdom and New York, NY, USA, 1535 pp., https://doi.org/10.1017/CBO9781107415324, 2013.
Jennings, K. S., Winchell, T. S., Livneh, B., and Molotch, N. P.: Spatial variation of the rain–snow temperature threshold across the Northern Hemisphere, Nat. Commun., 9, 1148, https://doi.org/10.1038/s41467-018-03629-7, 2018.
Jeong, D. I., Cannon, A. J., and Zhang, X.: Projected changes to extreme freezing precipitation and design ice loads over North America based on a large ensemble of Canadian regional climate model simulations, Nat. Hazards Earth Syst. Sci., 19, 857–872, https://doi.org/10.5194/nhess-19-857-2019, 2019.
Kämäräinen, M., Hyvärinen, O., Jylhä, K., Vajda, A., Neiglick, S., Nuottokari, J., and Gregow, H.: A method to estimate freezing rain climatology from ERA-Interim reanalysis over Europe, Nat. Hazards Earth Syst. Sci., 17, 243–259, https://doi.org/10.5194/nhess-17-243-2017, 2017.
Keim, B. D. and Cruise, J. F.: A technique to measure trends in the frequency of discrete random events, J. Climate, 11, 848–855, 1998.
Kendall, M. B.: Rank Correlation Methods, Hafner Publishing Company, New York, 1955.
Kerry, M., Kelk, G., Etkin, D., Burton, I., and Kalhok, S.: Glazed over: Canada copes with the Ice Storm of 1998, Environment, 41, 6–11, 1999.
Kienzle, S. W.: A new temperature based method to separate rain and snow, Hydrol. Process., 22, 5067–5085, https://doi.org/10.1002/hyp.7131, 2008.
Klaassen, J., Cheng, C. S., Auld, H., Li, Q., Ros, E., Geast, M., Li, G., and Lee, R.: Estimation of Severe Ice Storm Risks for South-Central Canada. Report prepared for Office of Critical Infrastructure Protection and Emergency Preparedness, Meteorological Service of Canada, Environment Canada, Toronto, Canada, 2003.
Kochtubajda, B., Mooney, C., and Stewart, R.: Characteristics, atmospheric drivers and occurrence patterns of freezing precipitation and ice pellets over the Prairie Provinces and Arctic Territories of Canada: 1964–2005, Atmos. Res., 191, 115–127, https://doi.org/10.1016/j.atmosres.2017.03.005, 2017.
Kraatz, S., Jacobs, J. M., and Miller, H. J.: Spatial and temporal freeze-thaw variations in Alaskan roads, Cold Reg. Sci. Technol., 157, 149–162, https://doi.org/10.1016/j.coldregions.2018.10.006, 2019.
Lambert, S. J. and Hansen, B. K.: Simulated changes in the freezing rain Climatology of North America under global warming using a coupled climate model, Atmos.-Ocean, 49, 289–295, https://doi.org/10.1080/07055900.2011.607492, 2011.
Larouche, P. and Galbraith, P. S.: Canadian coastal seas and Great Lakes Sea Surface Temperature climatology and recent trends, Can. J. Remote Sens., 42, 243–258, https://doi.org/10.1080/07038992.2016.1166041, 2016.
Laute, K. and Beylich, A. A.: Potential effects of climate change on future snow avalanche activity in western Norway deduced from meteorological data, Geogr. Ann. A, 100, 163–184, https://doi.org/10.1080/04353676.2018.1425622, 2018.
Lecomte, E. L., Pang, A. W., and Russell, J. W.: Ice Storm '98. Institute for Catastrophic Loss Reduction, Toronto, Ontario, Research Paper Series 1, 37 pp., 1998.
Lindenschmidt, K.-E., Das, A., Rokaya, P., and Chu, T.: Ice-jam flood risk assessment and mapping, Hydrol. Process., 30, 3754–3769, https://doi.org/10.1002/hyp.10853, 2016.
Longley, R. W.: The frequency of winter chinooks in Alberta, Atmosphere, 5, 4–16, https://doi.org/10.1080/00046973.1967.9676538, 1967.
MacKay, G. A. and Thompson, H. A.: Estimating the hazard of ice accretion in Canada from climatological data, J. Appl. Meteorol., 8, 927–935, https://doi.org/10.1175/1520-0450(1969)008<0927:ethoia>2.0.co;2, 1969.
Matsuo, T. and Sasyo, Y.: Empirical formula for the melting rate of snowflakes, J. Meteorol. Soc. Jpn. Ser. II, 59, 1–9, https://doi.org/10.2151/jmsj1965.59.1_1, 1981a.
Matsuo, T. and Sasyo, Y.: Melting of snowflakes below freezing level in the atmosphere, J. Meteorol. Soc. Jpn. Ser. II, 59, 10–25, https://doi.org/10.2151/jmsj1965.59.1_10, 1981b.
Matsuo, T., Sasyo, Y., and Sato, Y.: Relationship between types of precipitation on the ground and surface meteorological elements, J. Meteorol. Soc. Jpn. Ser. II, 59, 462–476, https://doi.org/10.2151/jmsj1965.59.4_462, 1981.
Matte, D., Thériault, J. M., and Laprise, R.: Mixed precipitation occurrences over southern Québec, Canada, under warmer climate conditions using a regional climate model, Clim. Dynam., 53, 1125–1141, https://doi.org/10.1007/s00382-018-4231-2, 2019.
McCullagh, P. and Nelder, J. A.: Generalized linear models, 2nd ed., Monogr. on Statistics and Appl. Probability, No. 37, Chapman and Hall, London, UK, 1989.
McFadden, V. and Thériault, J. M.: Simulations of the ice storm in the Maritime Provinces on 24–26 January 2017, Canadian Meteorological and Oceanographic Society Congress, Halifax, Nova Scotia, 2018.
McKenney, D. W., Pedlar, J. H., Lawrence, K., Papadopol, P., Campbell, K., and Hutchinson, M. F.: Change and evolution in the plant hardiness zones of Canada, BioScience, 64, 341–350, https://doi.org/10.1093/biosci/biu016, 2014.
Mekis, É., Vincent, L. A., Shephard, M. W., and Zhang, X.: Observed trends in severe weather conditions based on humidex, wind chill, and heavy rainfall events in Canada for 1953–2012, Atmos.-Ocean, 53, 383–397, https://doi.org/10.1080/07055900.2015.1086970, 2015.
Mekis, E., Donaldson, N., Reid, J., Zucconi, A., Hoover, J., Li, Q., Nitu, R., and Melo, S.: An overview of surface-based precipitation observations at Environment and Climate Change Canada, Atmos.-Ocean, 56, 71–95, https://doi.org/10.1080/07055900.2018.1433627, 2018.
Mendoza, G.-P. and Schmunk, R.: Fraser Valley ice storm creates slippery roads, leaves thousands without power | CBC News, CBCnews, available at: https://www.cbc.ca/news/canada/british-columbia/fraser-valley-winter-storm-december-2017-1.4467154 (last access: 2 April 2020), 2017.
Milton, J. and Bourque, A.: A climatological account of the January 1998 Ice Storm in Québec, Atmospheric Sciences and Environmental Issues Division, Environment Canada, Québec Region, 87 pp., 1999.
Moen, J. and Fredman, P.: Effects of climate change on alpine skiing in Sweden, J. Sustain. Tour., 15, 418–437, https://doi.org/10.2167/jost624.0, 2007.
Nitu, R., Roulet, Y. A., Wolff, M., Earle, M., Reverdin, A., Smith, C., Kochendorfer, J., Morin, S., Rasmussen, R., Wong, K., Alastrué, J., Arnold, L., Baker, B., Buisán, S., Collado, J. L., Colli, M., Collins, B., Gaydos, A., Hannula, H. R., Hoover, J., Joe, P., Kontu, A., Laine, T., Lanza, L., Lanzinger, E., Lee, G. W., Lejeune, Y., Leppänen, L., Mekis, E., Panel, J. M., Poikonen, A., Ryu, S., Sabatini, F., Theriault, J., Yang, D., Genthon, C., van den Heuvel, F., Hirasawa, N., Konishi, H., Nishimura, K., and Senese, A.: WMO Solid Precipitation Intercomparison Experiment (SPICE) (2012–2015), World Meteorological Organization Instruments and Observing Methods Report No. 131, Geneva, 2018.
Nkemdirim, L. C.: Canada's chinook belt, Int. J. Climatol., 16, 441–462, https://doi.org/10.1002/(sici)1097-0088(199604)16:4< 441::aid-joc21>3.0.co;2-t, 1996.
Phillips, D.: The Climates of Canada, Supply and Services Canada, Ottawa, 176 pp., 1990.
Sen, P. K.: Estimates of the regression coefficient Based on Kendall's tau, J. Am. Stat. Assoc., 63, 1379–1389, https://doi.org/10.1080/01621459.1968.10480934, 1968.
Sims, E. M. and Liu, G.: A parameterization of the probability of snow–rain transition, J. Hydrometeorol., 16, 1466–1477, https://doi.org/10.1175/jhm-d-14-0211.1, 2015.
Stewart, R. and Patenaude, L.: Rain-snow boundaries and freezing precipitation in Canadian East Coast winter storms, Atmos.-Ocean, 26, 377–398, https://doi.org/10.1080/07055900.1988.9649309, 1988.
Stewart, R. E.: Precipitation types in winter storms, Pure Appl. Geophys., 123, 597–609, 1985.
Stewart, R. E. and Yiu, D. T.: Distributions of precipitation and associated parameters across precipitation type transitions over southern Ontario, Atmos. Res., 29, 153–178, https://doi.org/10.1016/0169-8095(93)90002-6, 1993.
Stewart, R. E., Isaac, G. A., and Shaw, R. W.: Canadian Atlantic Storms Program: The meteorological field project, B. Am. Meteorol. Soc., 68, 338–345, https://doi.org/10.1175/1520-0477(1987)068<0338:casptm>2.0.co;2, 1987.
Stewart, R. E., Bachand, D., Dunkley, R., Giles, A., Lawson, B., Legal, L., Miller, S., Murphy, B., Parker, M., Paruk, B., and Yau, M.: Winter storms over Canada, Atmos.-Ocean, 33, 223–247, https://doi.org/10.1080/07055900.1995.9649533, 1995a.
Stewart, R. E., Yui, D. T., Chung, K. K., Hudak, D. R., Lozowski, E. P., Oleskiw, M., Sheppard, B. E., and Szeto, K. K.: Weather conditions associated with the passage of precipitation type transition regions over Eastern Newfoundland, Atmos.-Ocean, 33, 25–53, 1995b.
Stewart, R. E., Szeto, K. K., Bonsal, B. R., Hanesiak, J. M., Kochtubajda, B., Li, Y., Thériault, J. M., DeBeer, C. M., Tam, B. Y., Li, Z., Liu, Z., Bruneau, J. A., Duplessis, P., Marinier, S., and Matte, D.: Summary and synthesis of Changing Cold Regions Network (CCRN) research in the interior of western Canada – Part 1: Projected climate and meteorology, Hydrol. Earth Syst. Sci., 23, 3437–3455, https://doi.org/10.5194/hess-23-3437-2019, 2019.
Stuart, R. and Isaac, G.: Freezing precipitation in Canada, Atmos.-Ocean, 37, 87–102, https://doi.org/10.1080/07055900.1999.9649622, 1999.
Takeuchi, Y., Kodama, Y., and Ishikawa, N.: The thermal effect of melting snow/ice surface on lower atmospheric temperature, Arct. Antarct. Alp. Res., 34, 20–25, https://doi.org/10.2307/1552504, 2002.
U.S. Army Corps of Engineers: Snow hydrology: Summary report of the snow investigations, North Pacific Division, Portland, Ore, 437 pp., 1956.
Vincent, L. A., Zhang, X., Brown, R. D., Feng, Y., Mekis, E., Milewska, E. J., Wan, H., and Wang, X. L.: Observed trends in Canada's climate and influence of low-frequency variability modes, J. Climate, 28, 4545–4560, https://doi.org/10.1175/jcli-d-14-00697.1, 2015.
Vincent, L. A., Zhang, X., Mekis, E., Wan, H., and Bush, E. J.: Changes in Canada's climate: Trends in indices based on daily temperature and precipitation data, Atmos.-Ocean, 56, 332–349, https://doi.org/10.1080/07055900.2018.1514579, 2018.
Wang, X. L.: Climatology and trends in some adverse and fair weather conditions in Canada, 1953–2004, J. Geophys. Res., 111, D09105, https://doi.org/10.1029/2005JD006155, 2006.
Wasserstein, R. L., Schirm, A. L., and Lazar, N. A.: Moving to a world beyond “p < 0.05”, Am. Stat., 73, 1–19, 2019.
Wexler, R., Reed, R. J., and Honig, J.: Atmospheric cooling by melting snow, B. Am. Meteorol. Soc., 35, 48–51, https://doi.org/10.1175/1520-0477-35.2.48, 1954.
WMO (World Meteorological Organization): International Cloud Atlas Manual on the Observation of Clouds and Other Meteors, (WMO-No. 407), available at: https://cloudatlas.wmo.int/home.html (last access: 1 April 2020), 2017.
Yang, D., Goodison, B. E., Metcalfe, J. R., Golubev, V. S., Elomaa, E., Gunther, T., Bates, R., Pangburn, T., Hanson, C., Emerson, D., Copaciu, V., and Milkovic, J.: Accuracy of Tretyakov precipitation gauge: Result of WMO intercomparison, Hydrol. Process., 9, 877–895, https://doi.org/10.1002/hyp.3360090805, 1995.
Yang, D., Goodison, B. E., Metcalfe, J. R., Golubev, V. S., Bates, R., Pangburn, T., and Hanson, C. L.: Accuracy of NWS 8” standard nonrecording precipitation gauge: Results and application of WMO Intercomparison, J. Atmos. Ocean. Tech., 15, 54–68, https://doi.org/10.1175/1520-0426(1998)015<0054:AONSNP>2.0.CO;2, 1998.
Zhang, X., Vincent, L. A., Hogg, W., and Niitsoo, A.: Temperature and precipitation trends in Canada during the 20th century, Atmos.-Ocean, 38, 395–429, https://doi.org/10.1080/07055900.2000.9649654, 2000.
Zhang, X., Brown, R., Vincent, L., Skinner, W., Feng, Y., and Mekis, É.: Canadian climate trends, 1950–2007, Canadian biodiversity: Ecosystem status and trends 2010, (Technical Thematic Report No. 5), Canadian Councils of Resource Ministers, Ottawa, Ontario, iv +21 pp., available at: http://www.biodivcanada.ca/default.asp?lang=En&n=137E1147-0 (last access: 2 April 2020), 2011.