the Creative Commons Attribution 4.0 License.
the Creative Commons Attribution 4.0 License.
 | 06 Apr 2020
The role of flood wave superposition in the severity of large floods
Bruno Merz
Luzie Wietzke
Sophie Ullrich
Alberto Viglione
Sergiy Vorogushyn
The severity of floods is shaped not only by event- and catchment-specific characteristics but also depends on the river network configuration. At the confluence of relevant tributaries with the main river, flood event characteristics may change depending on the magnitude and temporal match of flood waves. This superposition of flood waves may potentially increase the flood severity downstream in the main river. However, this aspect has not been analysed for a large set of river confluences to date.
To fill this gap, the role of flood wave superposition in the flood severity at downstream gauges is investigated in four large river basins in Germany and Austria (the Elbe, the Danube, the Rhine and the Weser). A novel methodological approach to analyse flood wave superposition is presented and applied to mean daily discharge data from 37 triple points. A triple point consists of three gauges: one in the tributary as well as one upstream and downstream of the confluence with the main river respectively. At the triple points, differences and similarities in flood wave characteristics between the main river and the tributary are analysed in terms of the temporal match and the magnitudes of flood peaks.
At many of the confluences analysed, the tributary peaks consistently arrive earlier than the main river peaks, although high variability in the time lag is generally detected. No large differences in temporal matching are detected for floods of different magnitudes. In the majority of cases, the largest floods at the downstream gauge do not occur due to perfect temporal match between the tributary and the main river. In terms of spatial variability, the impact of flood wave superposition is site-specific. Characteristic patterns of flood wave superposition are detected for flood peaks in the Danube River, where peak discharges largely increase due to inflow from alpine tributaries. Overall, we conclude that the superposition of flood waves is not the driving factor behind flood peak severity at the major confluences in Germany; however, a few confluences show the potential for strong flood magnifications if a temporal shift in flood waves was to occur.
- Article
(8627 KB) - Full-text XML
-
Supplement
(64 KB) - BibTeX
- EndNote


Floods result from an interplay of several factors along a cascade of processes beginning with precipitation and runoff generation in a catchment down to river routing. Event-specific characteristics such as the intensity and spatial patterns of precipitation exert an impact on river discharge. The impact of a precipitation event on the timing and magnitude of a flood is further modulated by the prevailing soil moisture conditions in the catchment that control the timing and amount of runoff generation (Merz and Blöschl, 2003; Nied et al., 2013). Moreover, flood patterns are characteristic for each catchment due to the specific physiogeographic conditions, i.e. the elevation and slope or geological formation, that result in site-specific runoff generation processes. In particular, floods are impacted by the river network configuration and the related geomorphological catchment characteristics. Several studies have indicated the impact of drainage density (or hillslope lengths), which is related to the network configuration, on the runoff coefficients (e.g. Plaut-Berger and Entekhabi, 2001). Travel times of water to the catchment outlet or confluence are also influenced by the distributions of hillslope-channel lengths (Di Lazzaro et al., 2015). Hence, the river network configuration can lead to a higher/lower probability of flood wave superposition (Seo and Schmidt, 2013), and the impact from different tributaries to the main river can be highly variable. Each tributary has specific catchment characteristics and typical flood characteristics. Thus, the shape of the flood wave can significantly change at each relevant confluence (Blöschl et al., 2013; Skublics et al., 2016).
According to the definition in this study, flood wave superposition is based on both (i) a temporal match of flood peaks and (ii) a high peak magnitude in both the main river and the tributary. A superposition of flood waves at confluences may increase the flood magnitude and lead to an acceleration of the flood wave (Blöschl et al., 2013; Skublics et al., 2014). Conversely, low or medium discharge conditions in a tributary may prevent further aggravation of the flood event (Thomas and Nisbet, 2007; Pattison et al., 2014). In a study of the 2013 flood in the Danube Basin, Blöschl et al. (2013) noted the synchronous occurrence of flood waves at the confluence of the Salzach and the Inn rivers in Austria. They emphasised that the Inn River flood wave typically occurs earlier than the flood wave of the Danube at the confluence of the Inn and the Danube rivers at the German–Austrian border. An earlier or later flood occurrence in the tributary relative to the main river leads to a weaker flood wave superposition due to a temporal peak mismatch (Skublics et al., 2014). In a simulation study, Skublics et al. (2014) analysed how a temporal shift of a flood event of two tributaries to the Danube of 20 h affects the flood peak in the main river. In one case, they showed that temporal peak matching would increase the flood peak in the main river downstream of the confluence by up to twice the observed value.
Although flood wave superposition could potentially impact flood magnitudes, only a few studies have addressed this topic to date (Vorogushyn and Merz, 2013; Geertsema et al., 2018). Lane (2017) suggested the possibility of decoupling the tributary and main channel waves, i.e. enforcing a temporal shift through enhanced storage and attenuation, as a measure for flood risk reduction. At the lowland confluence in the Meuse catchment, Geertsema et al. (2018) concluded that the time lag between peaks is of minor importance due to the long duration of flood waves compared with the typical variability of the time lags. They stated that the typical time lags are less relevant for the impact of flood wave superposition for long flood durations. In contrast, the time lag may be of high importance in smaller and fast reacting catchments with shorter flood durations. Hence, it is important to understand whether patterns of flood wave superposition are typical for a confluence or whether they are event-specific and change between small and large floods.
To quantify flood wave superposition, we select triple points. These are three gauging stations that are located close to the confluence: one on the tributary and two on the main river, upstream and downstream of the confluence. At these triple points, two flood event characteristics are considered simultaneously. First, the timing of the flood wave peak describes whether the tributary flood peak reaches the confluence at the same time as the main flood wave or if there is a temporal shift. Second, the flood magnitudes at all three gauges are used for the assessment of similarities or differences in flood intensity. Therefore, a perfect overlay of flood waves means that a high tributary wave peak matches (in time) a high main channel peak at the confluence.
The aim of this study is to investigate the role of flood wave superposition in flood severity downstream of relevant confluences in the main rivers in Germany, including Austrian tributaries. It provides a first analysis of the flood wave superposition problem for a large set of river confluences. We develop and test a method to jointly analyse temporal matching and (dis)similarities in flood peak magnitudes between the tributary and main river (at upstream and downstream sites). We address the following research questions:
-
Is the temporal match of flood waves a key factor in the occurrence of large floods?
-
To what extent does the peak discharge in the tributary contribute to the severity of the main river flood via wave superposition?
-
Is the impact of flood wave superposition higher for large floods than for small floods?
2.1 Study area
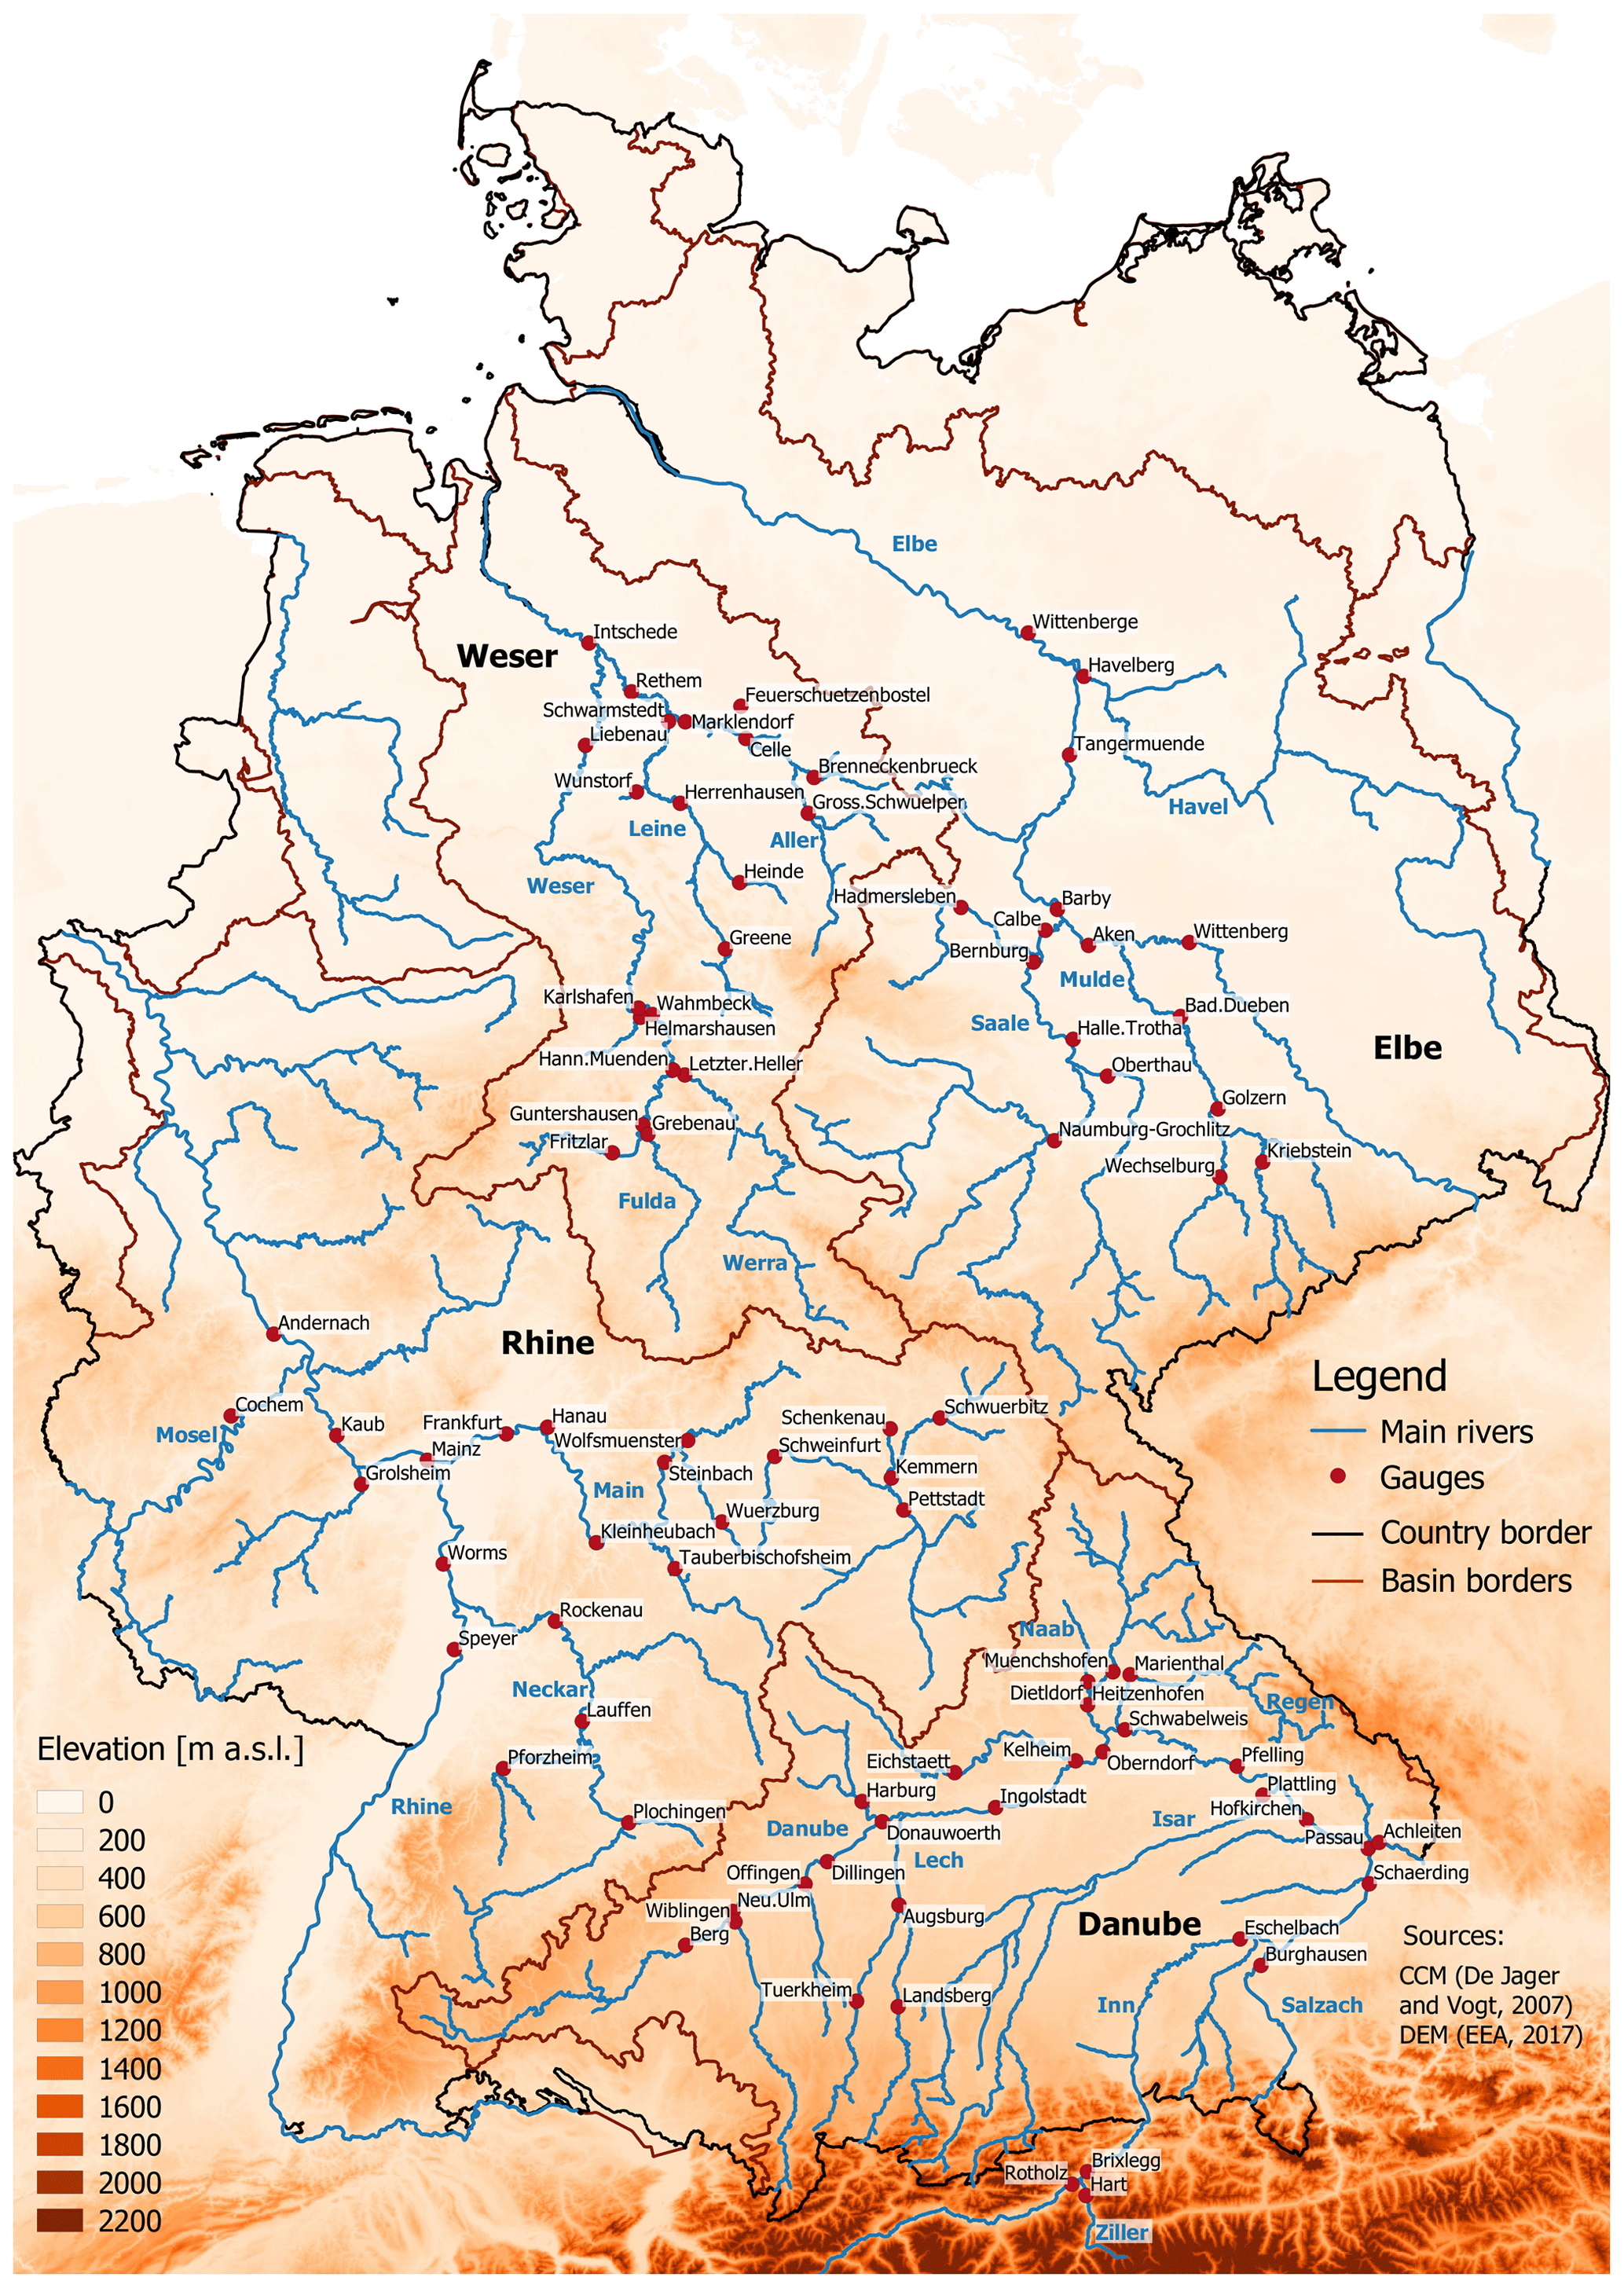
Figure 1Map of Germany showing the catchment elevation, major basins, rivers and gauges.
In this study, triple points from four large river basins in Germany and Austria (the Elbe, the Rhine, the Danube and the Weser) are analysed; the selected gauges, the main rivers (De Jager and Vogt, 2007) and a digital elevation model (EEA, 2017) that is presented in a resampled version as described in Samaniego et al. (2018) are shown in Fig. 1. The Elbe River originates in the Czech Republic and flows through eastern Germany into the North Sea. The middle Elbe is mainly influenced by two tributaries from the Ore Mountains (the Mulde and the Saale, which are both left-bank tributaries). The lower Elbe flows through the North German Plains with its major tributary the Havel (right-bank tributary). The Rhine River originates in Switzerland and flows northwards to the North Sea. In Switzerland, the Rhine Basin is characterised by alpine topography and the nival flow regime. Our analysis is mainly focused on the Upper Rhine and Middle Rhine. The largest tributaries are the Neckar at the Upper Rhine and the Main (both from the east; right-bank tributaries) and the Mosel (from the west; left-bank tributary) that are both at the Middle Rhine. The Danube River drains the catchments in southern Germany and is fed by quick-reacting steep tributaries from the German and Austrian Alps. There are several large tributaries feeding into to the Danube within Germany such as the Naab and the Regen from the north (left-bank tributaries) and the Iller, Lech, Isar and Inn from the south (right-bank tributaries). The northern and southern tributaries have different climatological and hydrological regimes and exhibit different flow dynamics relative to the main stream. The Weser is the only large river basin that is completely located in Germany and originates in the Central German Uplands at the confluence of the Werra and Fulda. It flows through the North German Plains into the North Sea.
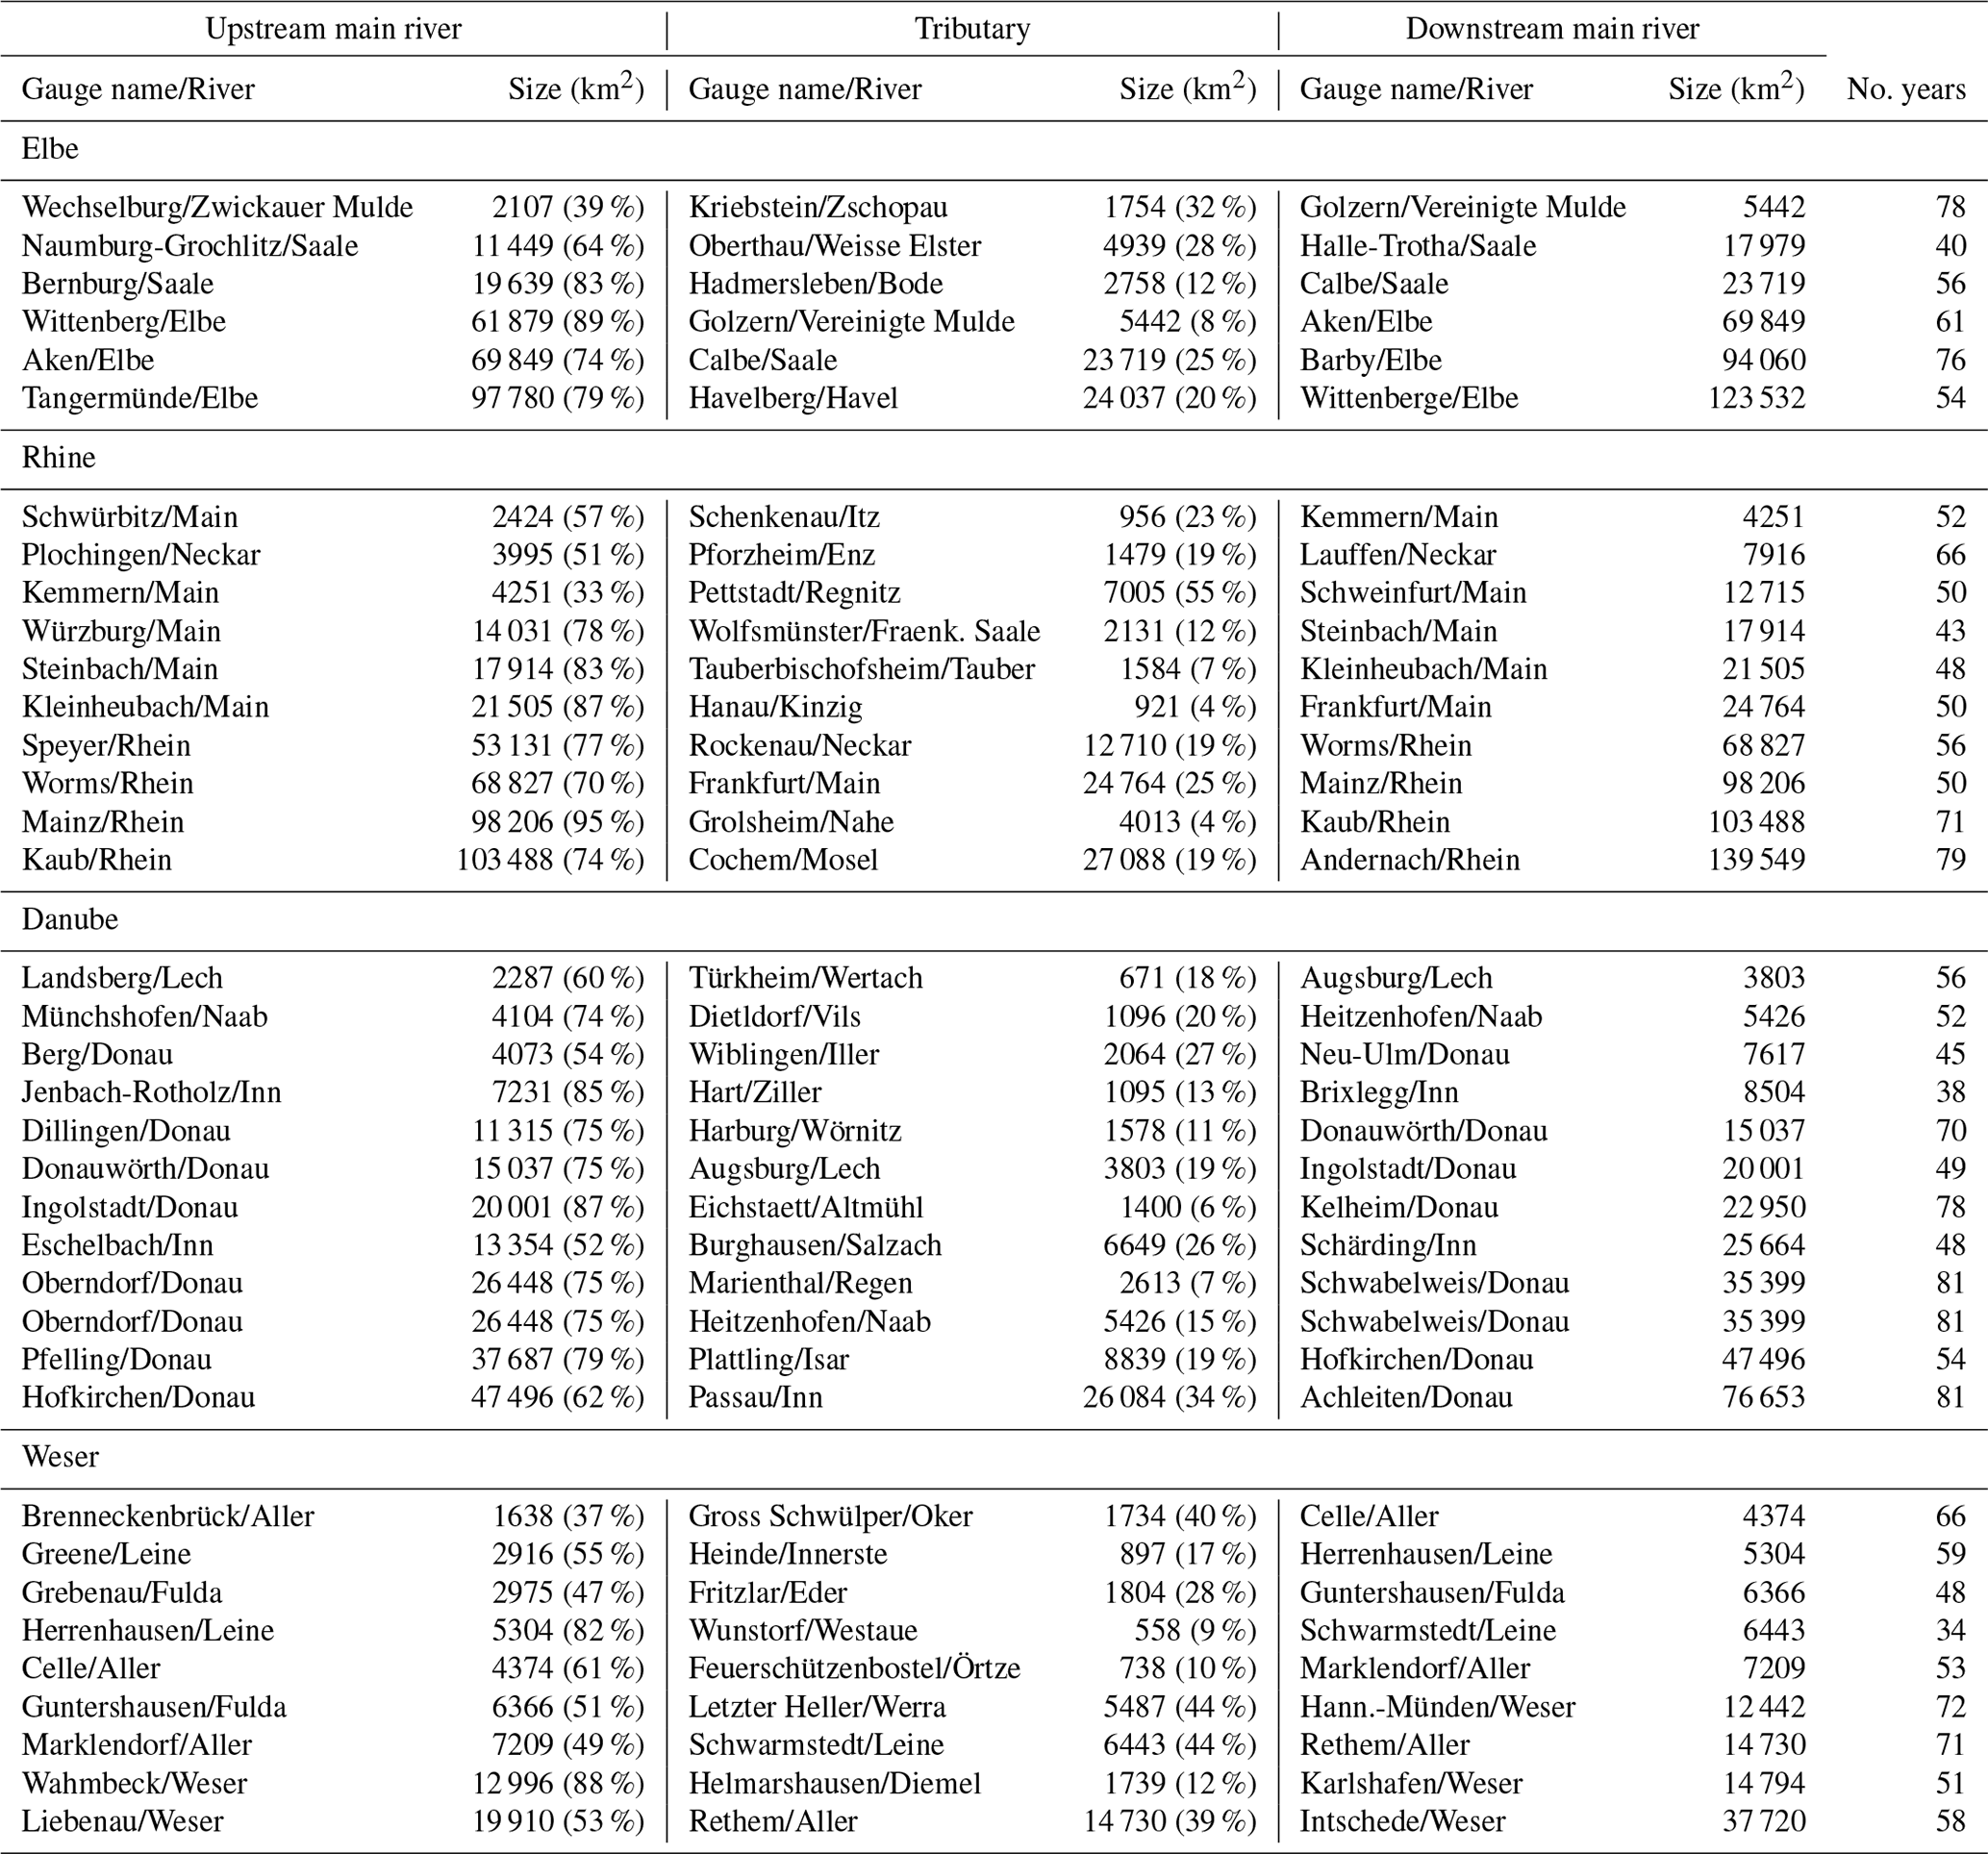
Table 1Triple points of the four major river basins ordered by the catchment size of the downstream gauge. The percentages in parentheses denote the share of the tributary and of the main river upstream gauge in relation to the catchment size of the downstream gauge. The last column shows the number of years for each of the triple points.
Floods in Germany are controlled by two major gradients (Beurton and Thieken, 2009; Merz et al., 2018): (1) the elevation increases from the lowlands in the north via the Central German Uplands up to the Alps in the south; and (2) the climate regime changes from maritime in the western and coastal areas to more continental in the eastern parts of Germany. As a consequence, the Weser and the Middle Rhine are characterised by winter floods evoked by long precipitation events. Winter floods are also dominant in the Elbe Basin and on the left side of the Danube, but seasonal variability is higher in these regions. In the south of Germany, i.e. in catchments on the right side of the Danube, floods mostly occur in summer due to high precipitation and/or the snowmelt from the Alps.
2.2 Discharge data set
The data set consists of 37 triple points (Fig. 1), for which mean daily discharge data with a time series length of more than 30 years are available. We do not consider small catchments (area <500 km2) for which hourly discharge data would be required due to very short catchment response times. Table 1 shows all of the triple points clustered by the major basins. They are manually assembled based on two criteria.
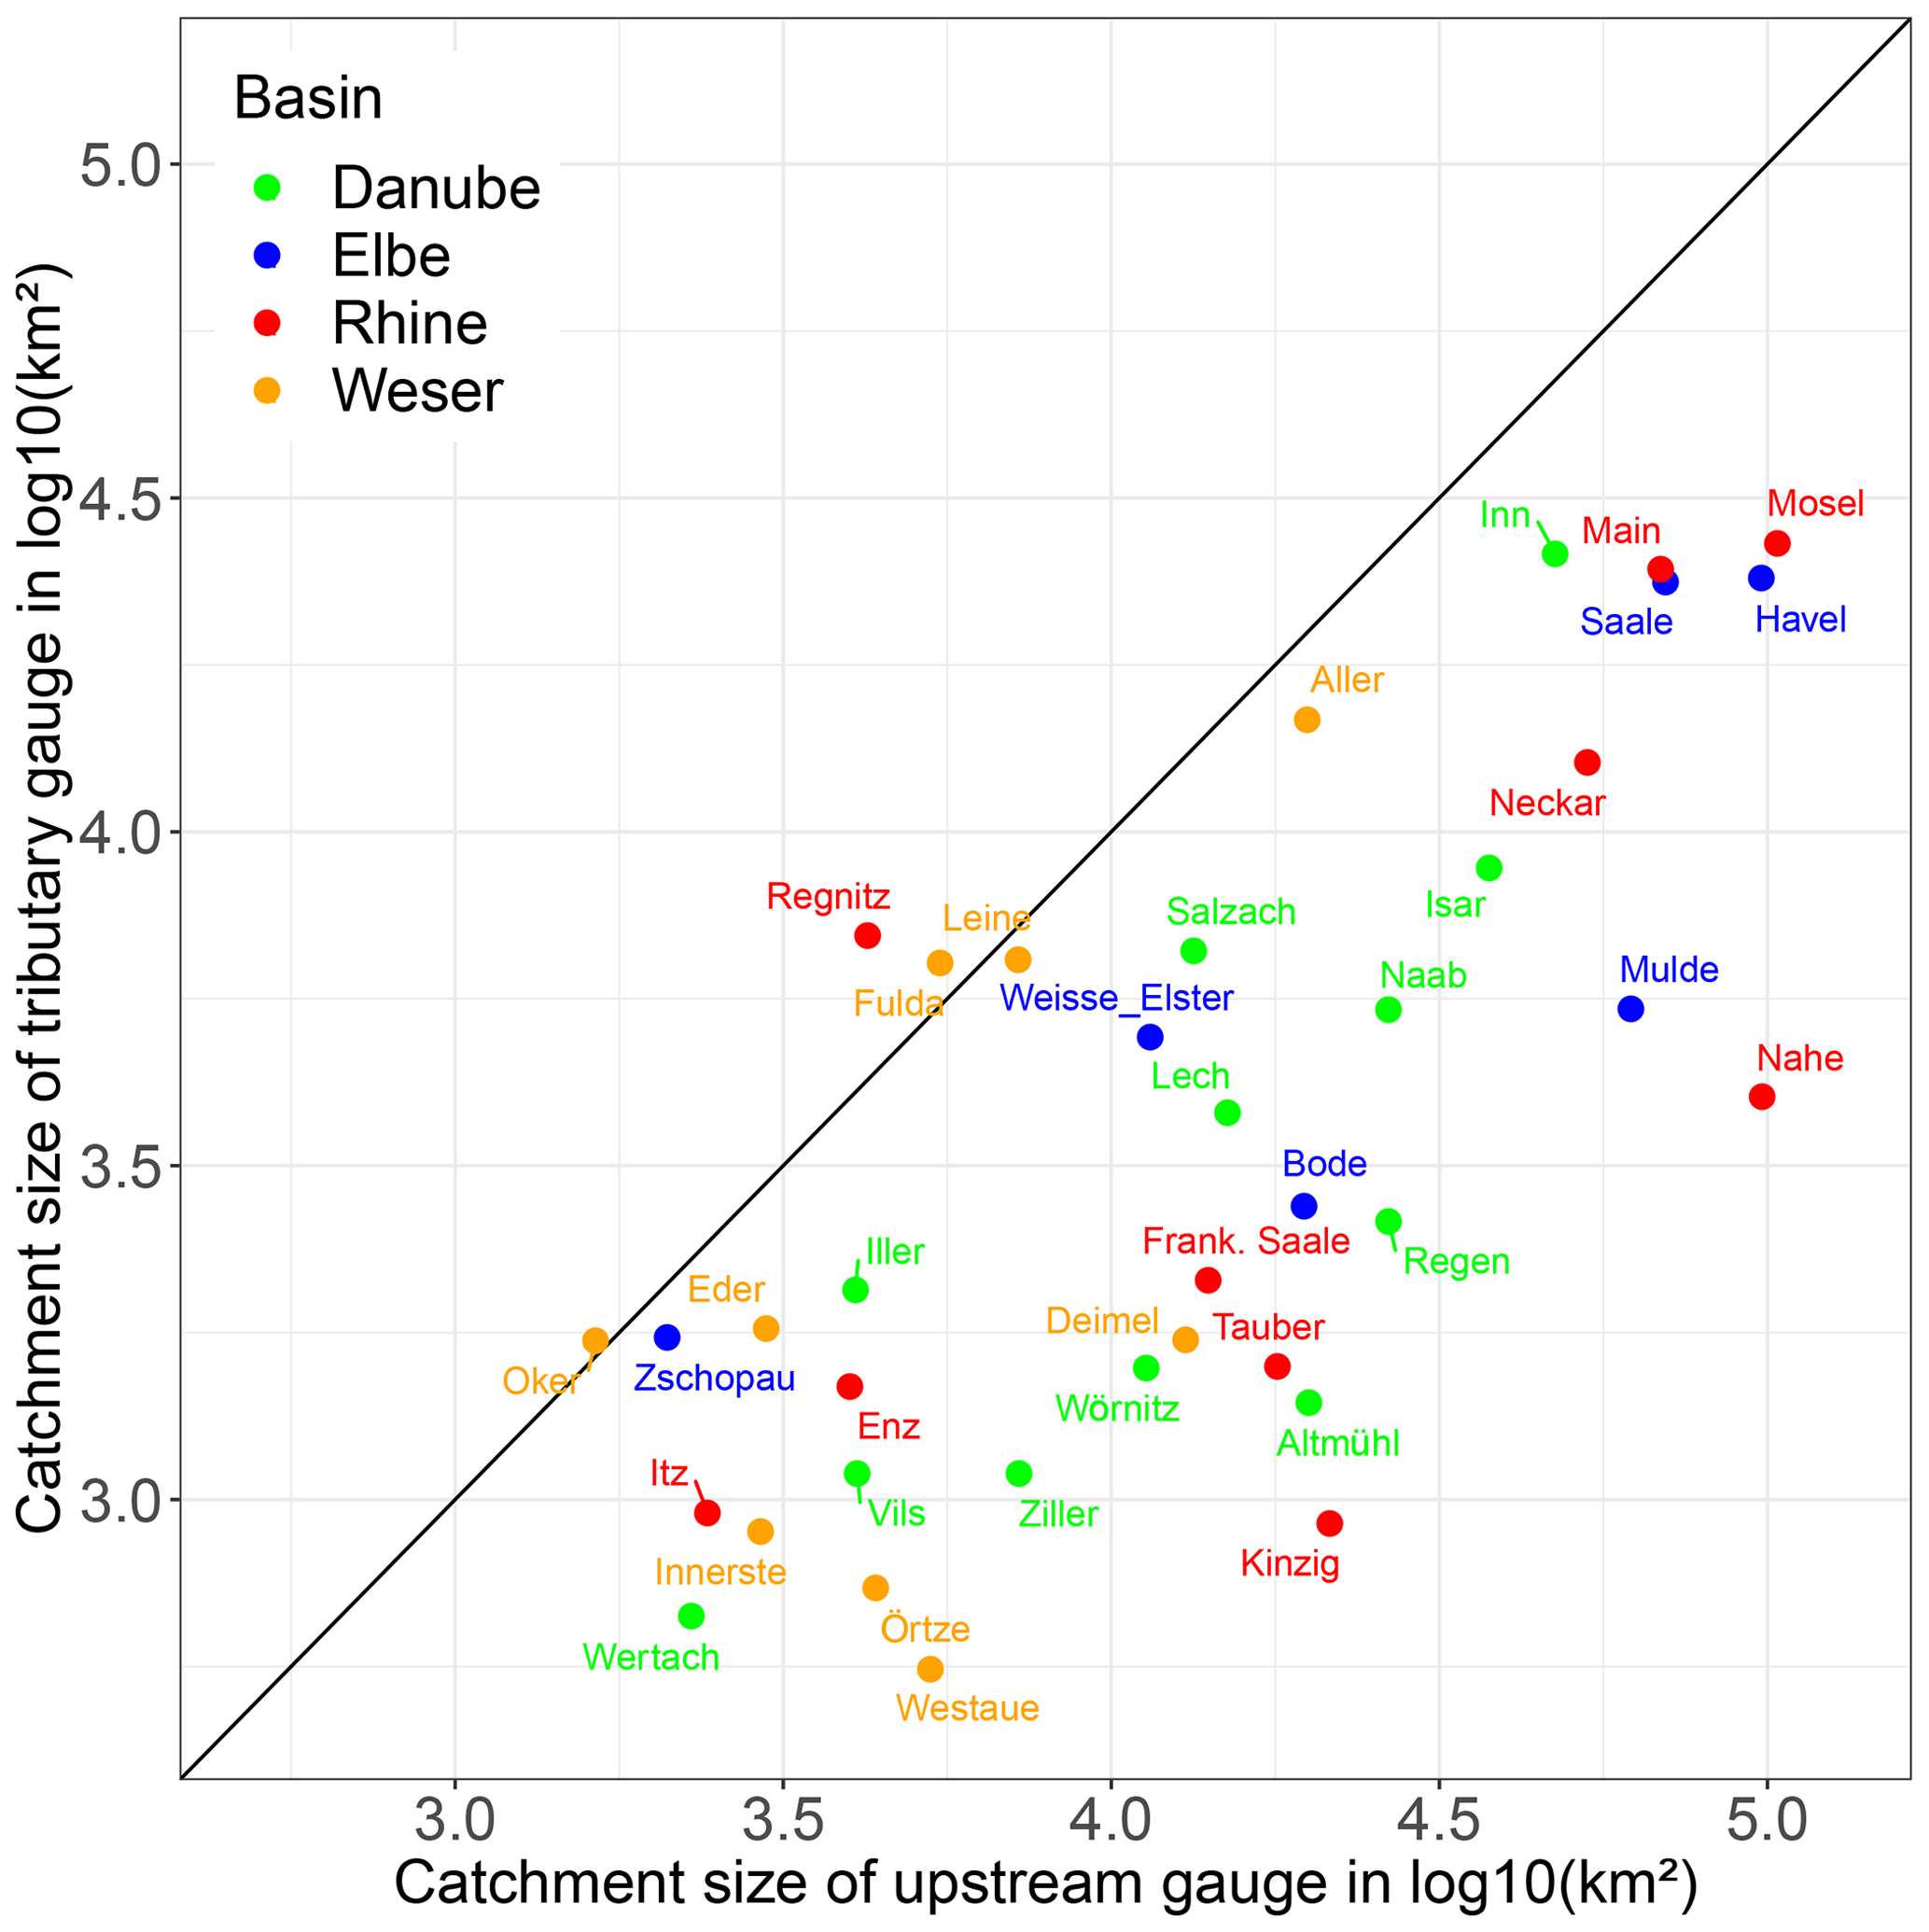
Figure 2For each triple point, the catchment size of the upstream and tributary gauge is shown on a log scale. The tributary name is coloured according to the major river basins.
Firstly, the size of the tributary catchment is larger than 2 % of the downstream catchment. The 2 % threshold was empirically estimated by investigating which tributary catchment size influences the main river peak discharge. Tributaries that are too small have no relevant impact, as the contributing flood volume is too small compared with the flood volume in the main river.
Secondly, the sum of the catchment size of the tributary (Ctrib) and upstream gauge (Cup) is at least 70 % of the downstream gauge (Cdown). Thus, there is a short distance between the three gauges of a triple point to minimise the effect of travel time lags. This criterion is needed to avoid overly large lateral inflows to the river between the two upstream gauges and the downstream gauge. In such cases, this inflow may dominate the downstream behaviour, strongly reducing the value of the information from the two upstream branches for the analysis. Due to the daily resolution of the discharge data, a tributary peak occurring around midnight may be recorded in the previous/next day compared with the main stream peak. In this case, some peaks can be recorded on 2 different days if they occur around midnight. Thus, time lags of ±1 d may also be seen as strong superposition. At this point, we neglect the flood wave travel time from the gauges to the confluence, or we assume it to be within the same day for the tributary and the upstream gauge.
We have carried out an analysis on discharge data alone without using information on overbank flow, as a detailed consideration of flood inundation and backwater effects was not possible for this large set of stations and events.
is the ratio of the upstream gauge catchment size to the downstream gauge catchment size.
is the ratio of the tributary catchment size to the downstream gauge catchment size.
The catchment size of the downstream gauges ranges from 3803 to 139 549 km2. The ratio of the tributary catchment size to the downstream catchment sizes (CRtrib) varies between 4 % and 55 %. For the upstream gauges, this ratio (CRup) ranges from 33 % to 95 %. Thus, the relevance of the tributary and upstream gauges varies considerably between the triple points.
Figure 2 shows the catchment size of the upstream and tributary gauges to demonstrate the variability in the contribution of both gauges. Points along the diagonal line show a similar catchment size ratio. Among the major tributaries to the Elbe, the Mulde has much smaller catchment size compared with the Saale and the Havel. The catchment ratio of the three Rhine tributaries (the Neckar, Main and Mosel) is relatively similar. Along the Danube, the catchment ratios mostly increase downstream. The Weser confluences (the Aller, Leine and Werra) are characterised by the highest similarities in catchment sizes between the upstream and tributary gauges. Within a triple point, the upstream gauge is always the gauge on the same river, whereas the tributary gauge is on a different river branch even when the catchment size and/or mean discharge is larger in the tributary. This explains why the tributary catchment is larger than the catchment associated with the upstream gauge in a few cases.
We present four types of flood wave superposition in relation to matches and mismatches in time and in flood magnitude using stylised figures (Fig. 3).
- I.
A perfect overlay (matching in time and with respect to peak magnitude): peaks Qp occur at all three gauges at the same time with the same relative intensity, i.e. the same specific discharge.
- II.
Temporal mismatch: there is a time lag Δtp between the flood peaks of main river and tributary gauges, while the specific discharge is the same.
- III.
Peak magnitude mismatch: there is a strong difference in specific discharge. For example, high specific discharge in the upstream gauge is compensated for by a low specific discharge in the tributary which prevents an increase in downstream flood severity.
- IV.
Temporal and peak magnitude mismatch: both the peak magnitude and peak timing vary between the three gauges. Although there are no clear boundaries between these conceptual types of wave superposition, this typology is helpful to classify and describe the superposition.
Specific terminology is used to distinguish between the impact of timing and magnitude. Flood synchronicity is defined as a temporal match of flood peaks (types I and III). Flood amplification means that the downstream flood magnitude increases due to the peak overlay of upstream and tributary waves (types I, II and IV). The compensation effect refers to the fact that a high flood magnitude in the upstream gauge is compensated for by a low flood magnitude in the tributary or vice versa. Both cases are characterised by a mismatch in peak magnitudes (type III).
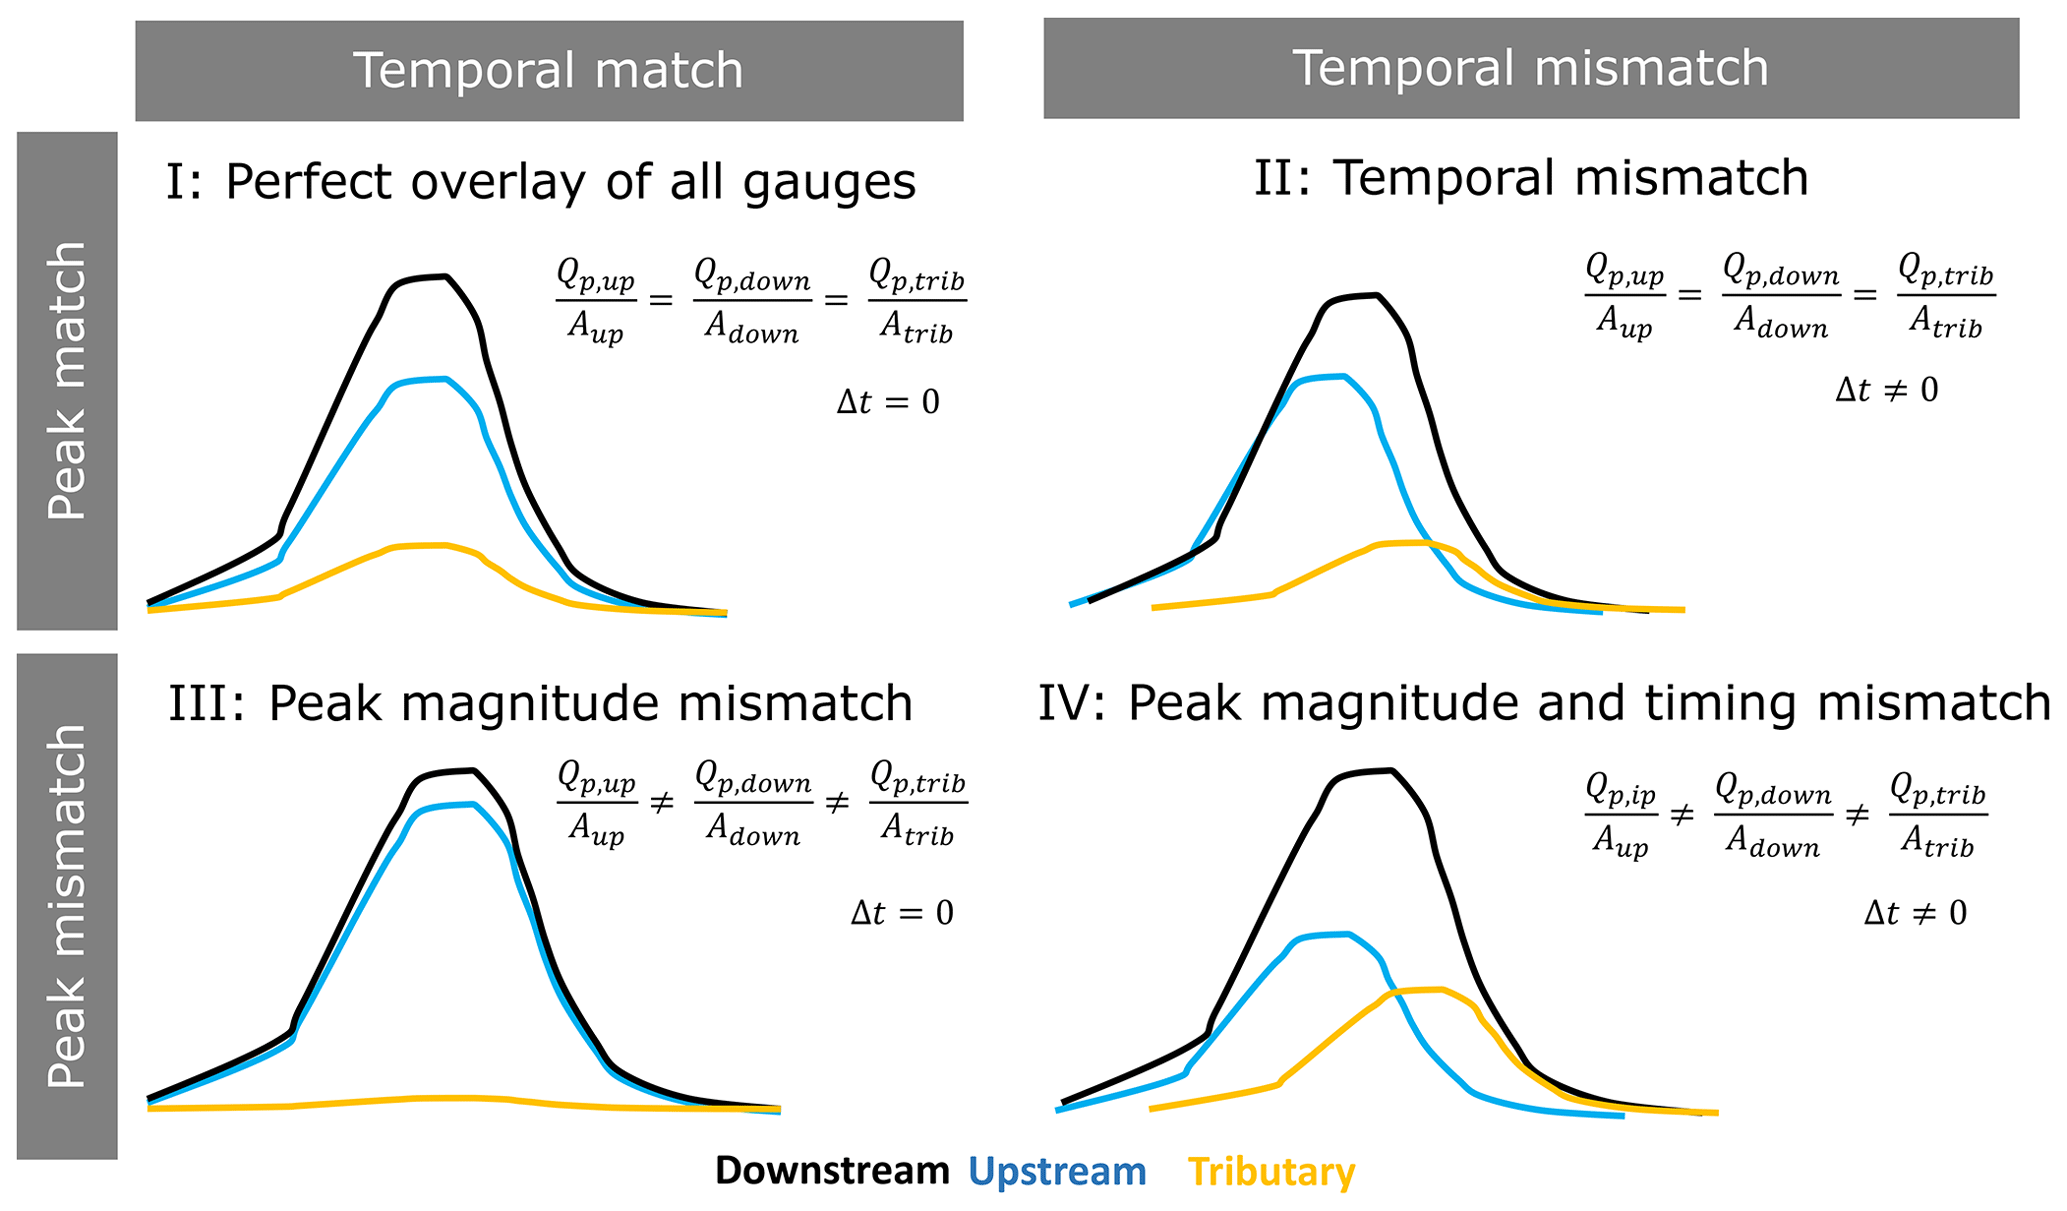
Figure 3Comparison of the four types of flood wave superposition shown for four combinations of matches and mismatches in peak magnitude and peak timing.
Our objective regarding analysing a large set of flood events is to detect whether one of these cases dominates at a particular triple point and how it impacts flood severity at the downstream location. Moreover, we are interested in determining whether spatially coherent patterns of flood wave superposition types occur in Germany. In particular, we investigate if and where case I (perfect overlay of all three waves) occurs and how it impacts flood severity.
3.1 Derivation of flood peaks
For the selected 37 triple points, we consider the annual maximum flood series (AMS) at the downstream gauge and the corresponding tributary flood waves in the analysis. To derive flood event hydrographs, the methodology from Klein (2009) is modified. First, the AMS peak at the downstream gauge is selected. Each event is characterised by a peak value, a start and an end point. The event start point is located between the annual maximum peak and the previous independent peak. An independent peak is identified if it fulfils the criteria following Bacchi et al. (1992) and LAWA (2018): (1) the lowest discharge between two peaks is smaller than 70 % of the smaller peak; (2) the smaller peak is greater than 20 % of the annual maximum peak; (3) the minimum flow between two peaks drops below 20 % of the annual maximum flow; and (4) the time lag between two peaks is at least 7 d. These criteria were empirically derived by Bacchi et al. (1992) and LAWA (2018) to prevent the identification of oscillatory peaks as independent flood events.
To estimate the start and end point, the gradient in discharge between 2 consecutive days is first calculated. The start point of the flood event is then identified by tracing back the gradient prior to the peak flow. If the gradient is lower than a predefined threshold for 7 consecutive days, the starting date is set to the latest date in this time window. We have empirically identified the 90th percentile of all gradients for the selected gauge as the threshold using a trial-and-error procedure and visual inspection. If no starting point is detected within 40 d prior to the peak flow, the lowest discharge value in this time window is selected. The event end point is analogously determined by looking forward from the peak. The corresponding flood peaks of the upstream and tributary gauge are defined as the largest discharge values within the event period of the downstream gauge (from the start to end point).
A flood peak is characterised by two indicators: the time of peak occurrence tp and the peak discharge Qp, which are calculated for all selected events at the three gauges of each triple point. To assess flood wave superposition, the time lags Δtp, Δtp, up and Δtp, trib between the peak flows at the triple points are calculated using the following: tp, down, which is the time of the peak of the downstream gauge; tp, up, which is the time of the peak of the upstream gauge; tp, trib, which is the time of the peak of the tributary gauge; Qp, down, which is the peak discharge of the downstream gauge; Qp, up, which is the peak discharge of the upstream gauge; Qp, trib, which is the peak discharge of the tributary gauge.
Therefore,
which gives the time differences in the peak between the upstream and tributary gauge;
which gives the time differences in the peak between the downstream and upstream gauge; and
which gives the time differences in the peak between the downstream and tributary gauge.
3.2 Design of the analyses
The impact of flood wave superposition on flood severity in terms of the peak magnitude and temporal match is analysed using three steps, as shown in Fig. 4 and described in detail below. For each step, four examples are given. These examples do not represent the complete spectrum; thus, Fig. 4 does not correspond to Fig. 3.
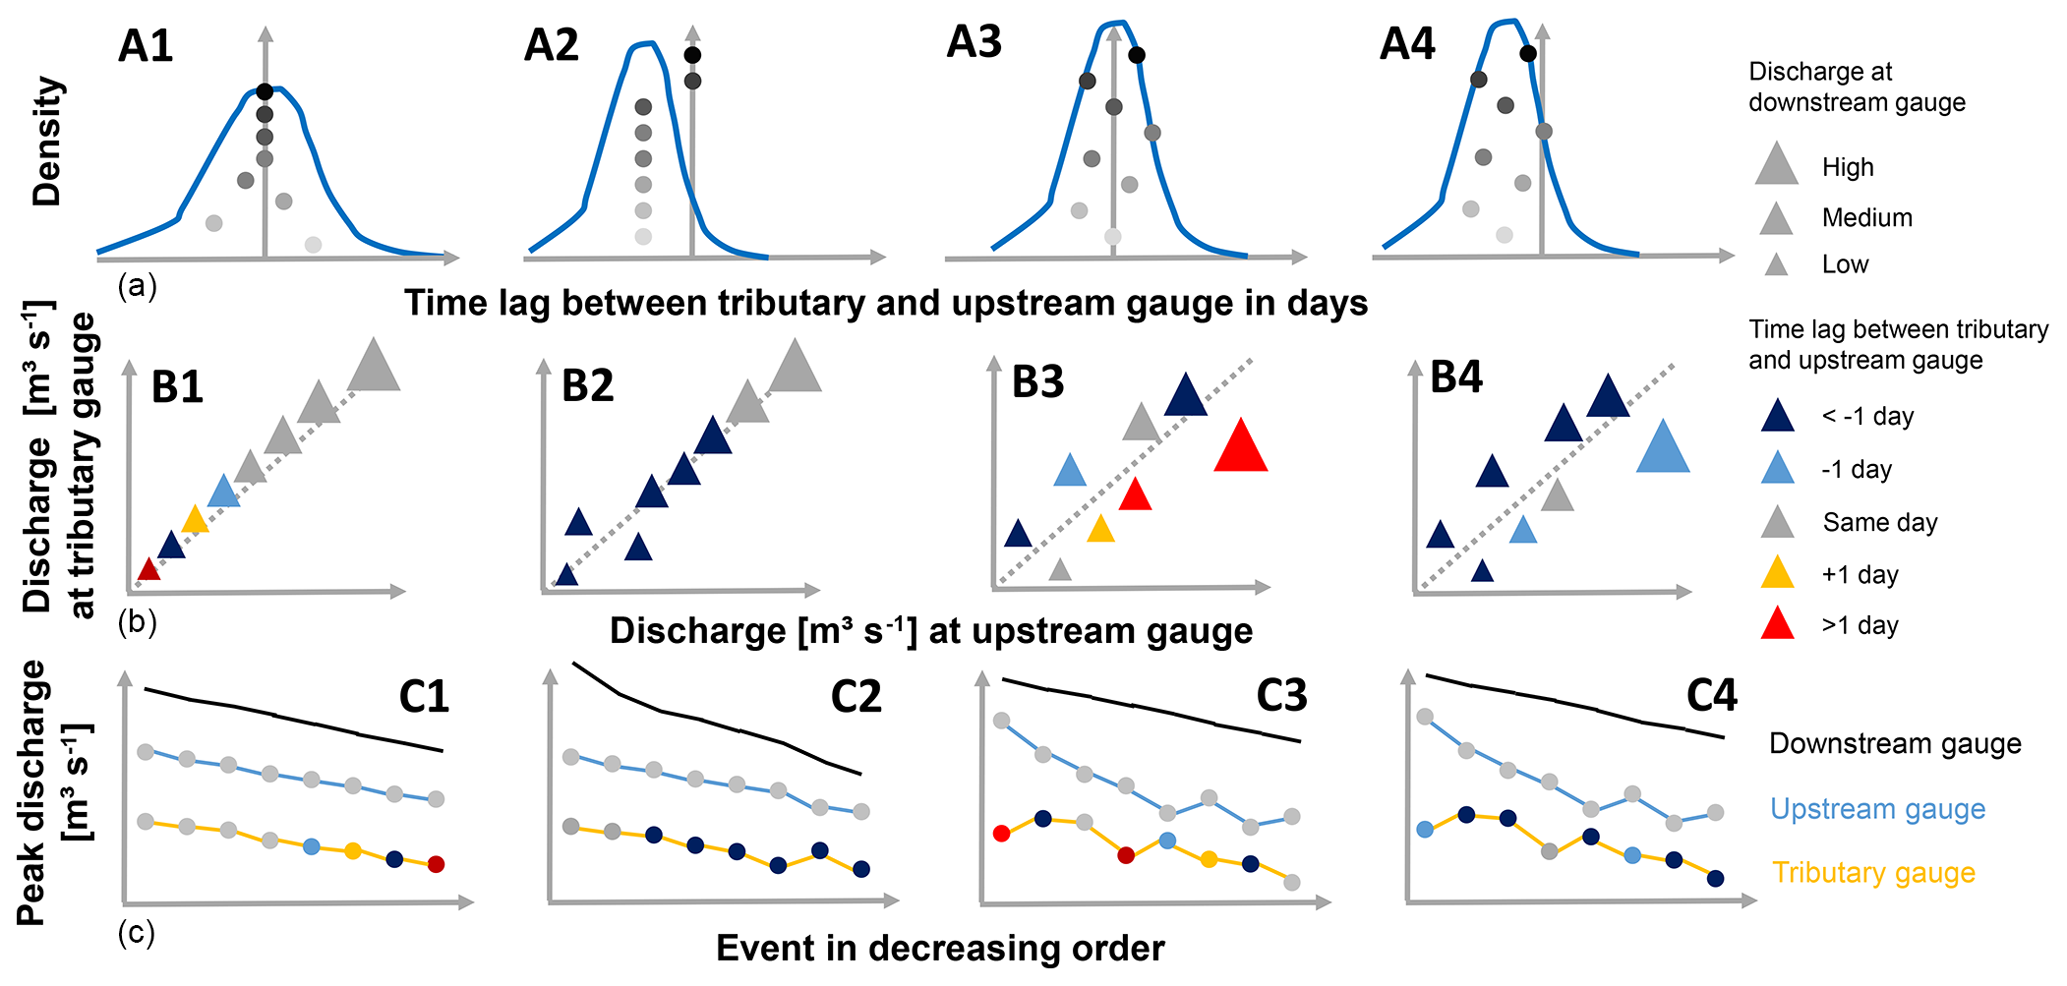
Figure 4Flowchart of the analysis steps. In each column, the same flood event situation is presented. (a) Time lags in days between the tributary and upstream peaks as density plots of time lags for all events and for the largest flood peaks (shown using shaded dots in descending order). The distance between the shaded dots is identical and represents the ranks and not the differences in peak magnitude. (b) Representation of flood event discharges at triple points, with the colours corresponding to time lag. The grey symbols in (b) and (c) correspond to zero lag; the blue symbols represent an earlier tributary peak occurrence, and the red symbols represent a later peak occurrence. The symbol size indicates the flood magnitude at the downstream gauge. The diagonal line indicates the same specific discharge for the upstream and tributary peaks. A triangle above (below) the diagonal line indicates a higher (lower) specific discharge at the tributary compared with the upstream gauge. (c) The representation of peak flows at the downstream, upstream and tributary gauges, with the respective coloured points corresponding to the time lag of the peaks of the upstream and tributary gauges with respect to the downstream gauge. The flood peaks are ordered by the peak magnitude at the downstream gauge in descending order.
3.2.1 Degree of temporal flood wave superposition
The first step investigated whether temporal flood wave superposition is a key factor in the occurrence of large floods (Fig. 4a). The degree of temporal flood wave superposition is represented by the time lags between flood peaks at the tributary and upstream gauges Δtp. The time lags of all of the events at a triple point are presented as an empirical density curve. A peaky density curve shows low variability of temporal matching, i.e. a relatively constant time lag. A perfect temporal flood wave superposition is indicated by Δtp=0. Additionally, we analysed whether small time lags are (inversely) related to the magnitude for the largest events. In this way, the hypothesis that temporal peak matching leads to larger flood peaks is tested: the time lags of the eight largest flood peaks are shown as shaded circles (Fig. 4a) to check whether the largest floods are amplified due to flood wave superposition (flood synchronicity).
Four cases of temporal flood wave superposition are schematically shown in Fig. 4a:
-
Case A1: the time lags between the tributary and upstream gauge Δtp are widely spread around zero. In contrast, the four largest floods have perfect temporal match which could potentially explain the occurrence of these large floods.
-
Case A2: the peak discharge occurs earlier in the tributary. Most of the largest floods also occur earlier with a constant time lag. However, the two largest floods occur when flood waves are synchronous, which suggests that temporal superposition is a relevant driver for large floods.
-
Case A3: as in case A1, time lags are variable around zero, but there seems to be no systematic difference in temporal matching between small and large floods.
-
Case A4: as in case A2, most of the flood peaks occur earlier in the tributary. Similar to case A3, the superposition of flood waves does not result in the occurrence of large floods.
The first two cases show a high relevance of temporal flood wave superposition for the occurrence of large floods at the downstream gauge. Here, the largest floods coincide with zero time lag, which suggests that temporal superposition contributes to high severity. Thus, flood synchronicity, i.e. temporal matching of floods at the upstream and tributary gauges, is detected for cases A1 and A2. The last two cases are examples with a low impact of flood wave superposition.
3.2.2 Contribution of the tributary and main river to downstream flood severity
In the next step, the peak magnitude and temporal matching are jointly investigated for all events of a triple point. An analysis of flood synchronicity alone is not sufficient to evaluate flood wave superposition; thus, an understanding of the impact of flood amplification and an analysis of whether high discharge values at both the tributary and upstream gauges cause an increase in flood severity at the downstream gauge are also required. Otherwise, a low discharge magnitude either in the tributary or upstream gauge may lead to a compensation effect and a low downstream flood severity.
The relationship between the peak magnitude at the tributary and upstream gauges is analysed taking their time lag and the downstream peak magnitude into consideration (Fig. 4b). In this analysis, both axes are scaled to the same specific discharge. The diagonal line indicates the same specific discharge at the tributary and upstream gauges. A flood peak below the 1:1 line indicates a higher specific discharge in the main river compared with the tributary and vice versa. The size of the triangles is scaled by the flood magnitude at the downstream gauge, and the colour code corresponds to the time lag between the tributary and upstream gauge. Four cases are distinguished in Fig. 4b:
-
Case B1: the specific discharge is similar at the tributary and upstream gauge. Thus, with increasing discharge in the main river the tributary and the downstream discharges also increase. The flood peak occurs at the tributary and upstream gauges on the same day for the four largest events (grey), whereas the tributary peak occurs earlier (blue) or later (red) for smaller flood events (here ranks 5–8). This suggests that synchronous peaks at the upstream and tributary gauges contribute to large downstream floods.
-
Case B2: the specific discharge is similar at the tributary and upstream gauges for most of the flood events, but the tributary peak typically occurs a few days earlier. Only the two largest flood peaks occur on the same day. High peaks in the tributary and main river lead to large floods in the downstream part of the river, and flood wave superposition clearly contributes to the amplification of the largest flood peaks.
-
Case B3: the specific discharge is sometimes higher and sometimes lower in the tributary. The peak sometimes occurs earlier and sometimes later, although rarely on the same day as for the upstream gauge. The flood peak severity at the downstream gauge is instead driven by the upstream and tributary flows, and the superposition plays a minor role for peak amplification.
-
Case B4: as in case B3, the specific discharges are variable. However, for the majority of the events, the peak occurs earlier in the tributary (dark blue triangles). The largest floods downstream are instead driven by specific flows in the tributary and upstream branches, and flood wave superposition is of minor importance for flood amplification.
3.2.3 Contribution of the tributary and main river to the largest downstream floods
In the last step, we analysed whether the impact of the tributary and upstream gauges on the downstream gauge changes for different flood magnitudes. In this way, we test whether the relevance of flood synchronicity and flood amplification increases for large downstream floods. In contrast to the previous analyses, the flood timing of the tributary and upstream gauges is related to the downstream gauge. The time lags between the upstream and downstream gauges (Δtp, up) and between tributary and downstream gauges (Δtp, trib), respectively, are coloured accordingly. This shows whether the flood peak magnitudes at the tributary and upstream gauges change relative to each other for the largest downstream flood peaks.
Four cases are distinguished (Fig. 4c):
-
Case C1: high discharges at both the tributary and upstream gauge lead to high floods in the main river downstream of the confluence. For the largest floods, the flood peaks occur at all three gauges on the same day; thus, flood wave superposition enhances the flood peaks at the downstream gauge. A temporal mismatch is observed for lower-ranked flood events.
-
Case C2: also here, high discharges in the tributary and upstream gauges evoke large floods downstream. Due to flood wave synchronicity for the two largest events, the flood peaks at the downstream gauge are disproportionally amplified. This indicates a significant role of flood wave superposition in driving flood severity.
-
Case C3: the relevance of peak flows in the two upstream branches changes between different events. A relatively small flood at the upstream gauge (compared with other events) can be compensated for by a large flood in the tributary and vice versa. The synchronicity of flood peak occurrence is not systematic and is not a major driver of large floods downstream.
-
Case C4: the relevance of peak flows also changes between different events. However, the tributary peaks systematically occur earlier, and flood wave superposition is not a significant driver of flood severity downstream.
Cases C3 and C4 show a flood compensation effect for some events. A high flood magnitude in the upstream gauge can be compensated for by a low flood magnitude in the tributary and vice versa.
All results are presented in separate subplots for the four major basins (the Elbe, the Danube, the Rhine and the Weser) and are analysed consecutively.
4.1 Degree of temporal flood wave superposition
In the Elbe River basin, the tributaries generally have the lowest degree of temporal superposition among the four basins (Fig. 5). The flood peaks in the Mulde occur about 4 d earlier for most of the events, including large floods. The time lags of the Saale peaks are more variable with some waves arriving few days earlier or later than the main Elbe flood. Few large floods show strong temporal superposition, but this is not an unequivocal pattern: large floods also occur for preceding and subsequent waves. The vast majority of the Havel peaks runs behind the Elbe flood wave and appears not to control the peak magnitude downstream. A perfect match of flood waves is detected for the small catchment of Zschopau, where flood wave superposition enhances the majority of flood events (case A1). Thus, all confluences in the Elbe Basin except Zschopau belong to case A4.
In the Danube Basin, high flood synchronicity is identified in most of the tributaries (cases A1 and A2). There is a high share of perfect matches for several triple points (e.g. Wertach, Ziller and Naab). In the Wertach, the largest flood peaks occur on the same day, showing a perfect wave superposition. For the largest flood events at the confluences of the Salzach, Regen, Naab and Isar, a perfect match or a time lag of 1 d is observed. This suggests the strong role of temporal wave superposition in flood generation in the lower German Danube. This applies in particular for Salzach, where a perfect temporal match or a time lag of 1 d is observed for the largest events, whereas small events exhibit high variability in time lags (case A1). Hence, at this triple point, a difference in temporal matching is detected between small and large floods, and wave superposition appears to enhance large floods.
In the Rhine River basin, high flood synchronicity is identified for the small tributaries (Itz, Enz and Regnitz). They exhibit relatively small time lag variability due to short catchment reaction times. At the Neckar–Rhine confluence the largest flood is characterised by strong peak synchronicity, whereas the majority of the events arrives slightly earlier (case A2). This could indicate the enhanced role of wave superposition. For this confluence, a higher probability of temporal matching due to river training and flood wave acceleration has been detected (e.g. Vorogushyn and Merz, 2013 and references therein). The Main tributary shows the highest variability of time lags around zero in the Rhine Basin (case A3). The largest floods downstream of the confluence occur with the Main wave preceding or following the Rhine flood by few days, respectively. This indicates that large floods are not generated by temporal superposition. The vast majority of Mosel floods occurs a few days prior to the Rhine floods. Several floods occur at the ideal superposition of both waves, although these are not the largest recorded discharges.
In the Weser River basin, high flood synchronicity is found at the smaller tributaries (Oker and Innerste). In contrast, there is high time lag variability at the confluence of the Eder and Aller. At the Aller confluence, the largest recorded flood is notably generated under perfect wave matching conditions (case A2). Temporal matching is high at the Fulda confluence (case A1) with several high floods characterised by a time lag of 0–1 d.
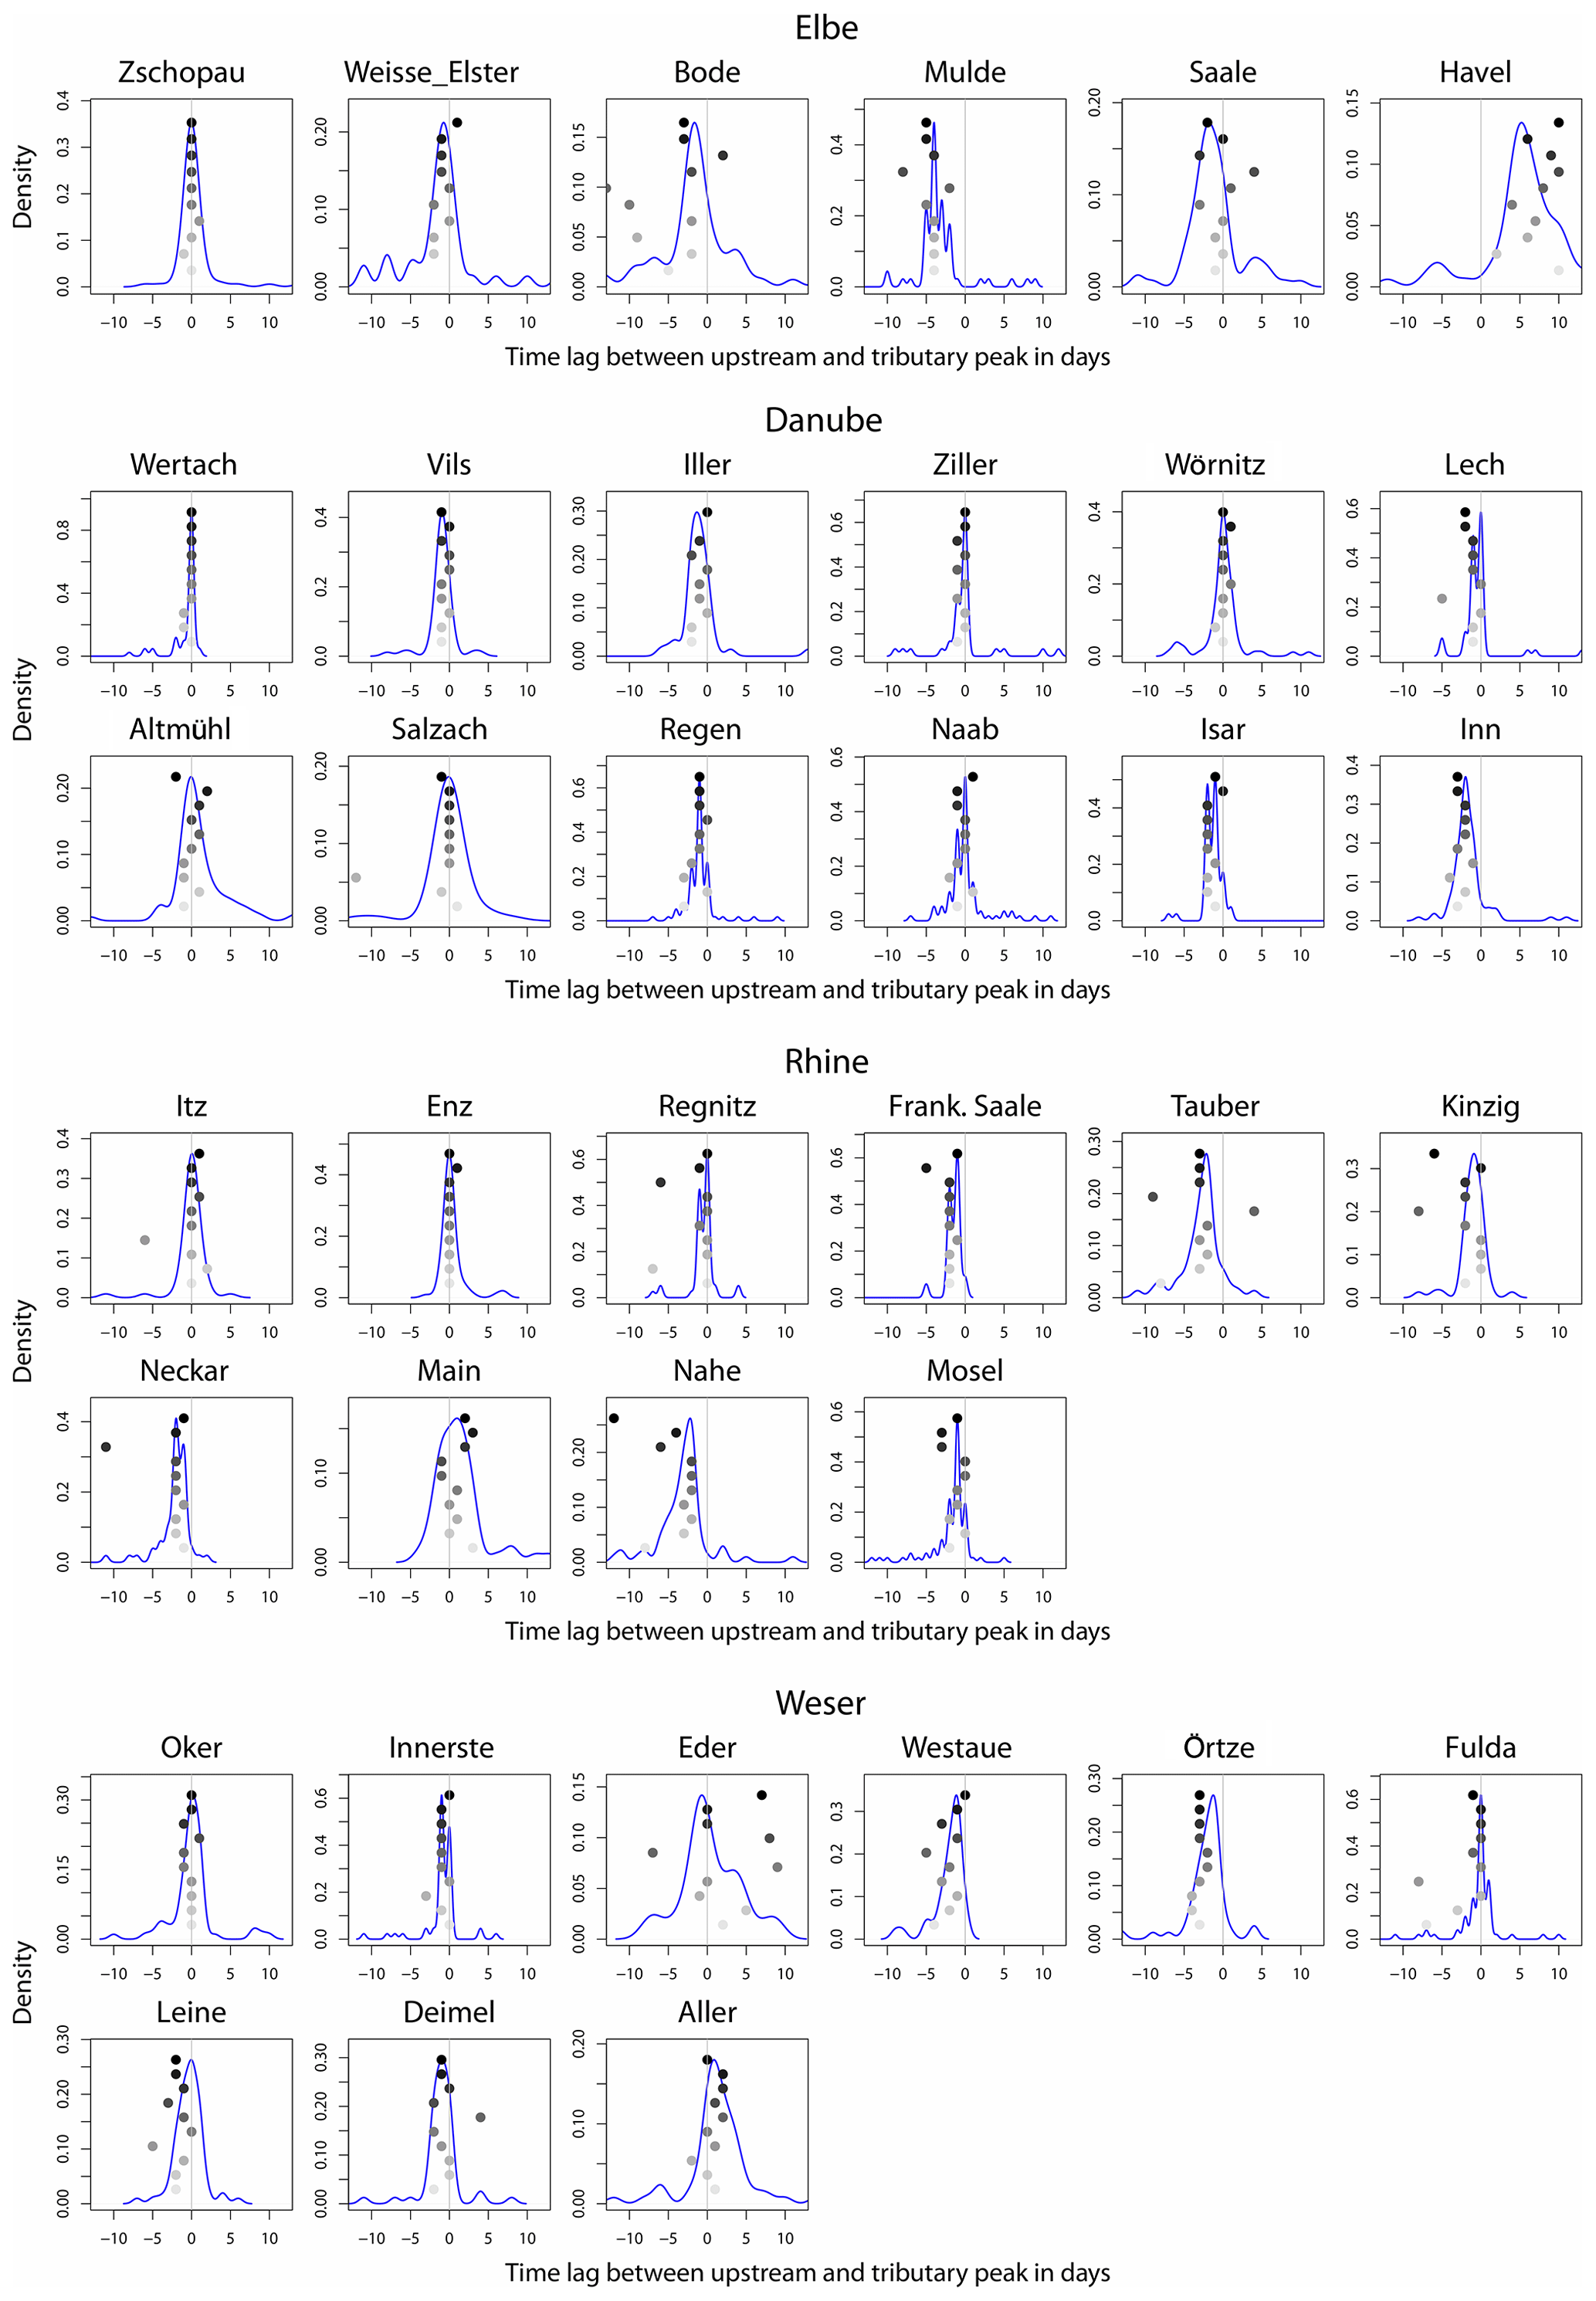
Figure 5Density of the time lag in days between the tributary and upstream peak. A positive time lag means that the tributary peak occurs later. The 10 largest events are shown as circles with decreasing grey colour intensity. The catchments are ordered by increasing catchment size in each subplot.
Many triple points show flood synchronicity with a sharp peak around −1 to +1 d. For the majority of the triple points, either most of the large floods are regularly enhanced by wave superposition (case A1) or the superposition is not related to large floods (cases A3 and A4). For A3 and A4, flood synchronicity is not decisive for the generation of large floods. A strong difference in temporal matching between all of the selected floods (AMS) and the 10 largest floods could only be observed for a few triple points. The largest floods appear to emerge during perfect matching of the main river and tributary waves (e.g. Salzach, Neckar). At the Salzach, this also seems to be the case, and we characterised it as A1. For the other cases, the causal relationship between superposition and the emergence of the largest floods needs to be further investigated. In the next steps, we analysed whether these large floods are indeed generated by the strong superposition of high floods in the tributary and upstream branches. In this case, the wave superposition would have the potential to produce large-magnitude floods.
4.2 Contribution of the tributary and main river to downstream flood severity
Small tributaries in the Elbe Basin (Zschopau and Bode) have a similar specific discharge to the respective upstream gauge in the main river (Fig. 6; Fig. 4, cases B1 and B3). The Mulde River has a much higher specific discharge than the Elbe, but its waves reach the confluence more than 3 d prior to the main river flood peak (case B4). The Saale and Havel tributaries have much smaller specific discharges and, similar to the Mulde, there is a time lag of several days. In the Danube Basin, higher specific discharges are found in the major tributaries (e.g. the Iller, Inn, Lech, Regen and Salzach) than in the main river. There is a temporal mismatch between the Inn and the upstream gauge, with earlier occurrence of the Inn peak. The Isar peak generally arrives earlier than the main river peak (Fig. 6). In the Rhine Basin, high specific discharge is identified in several tributaries (the Mosel, Neckar, Nahe, Kinzig and Tauber) with an earlier flood peak. A different pattern is found for the Main River with changing contributions from the Main and the upstream Rhine gauge as well as a later peak occurrence in the tributary (case B3). For most of the largest events, the specific discharges of either the tributary or the main river are exceptionally high. This suggests that flood magnitudes in the upstream branches are the major drivers of large floods downstream rather than the wave superposition alone. In the Weser Basin, similar specific discharges are detected for flood events in the Aller and Fulda catchments. Overall, the tributary peaks are often later in the Weser Basin.
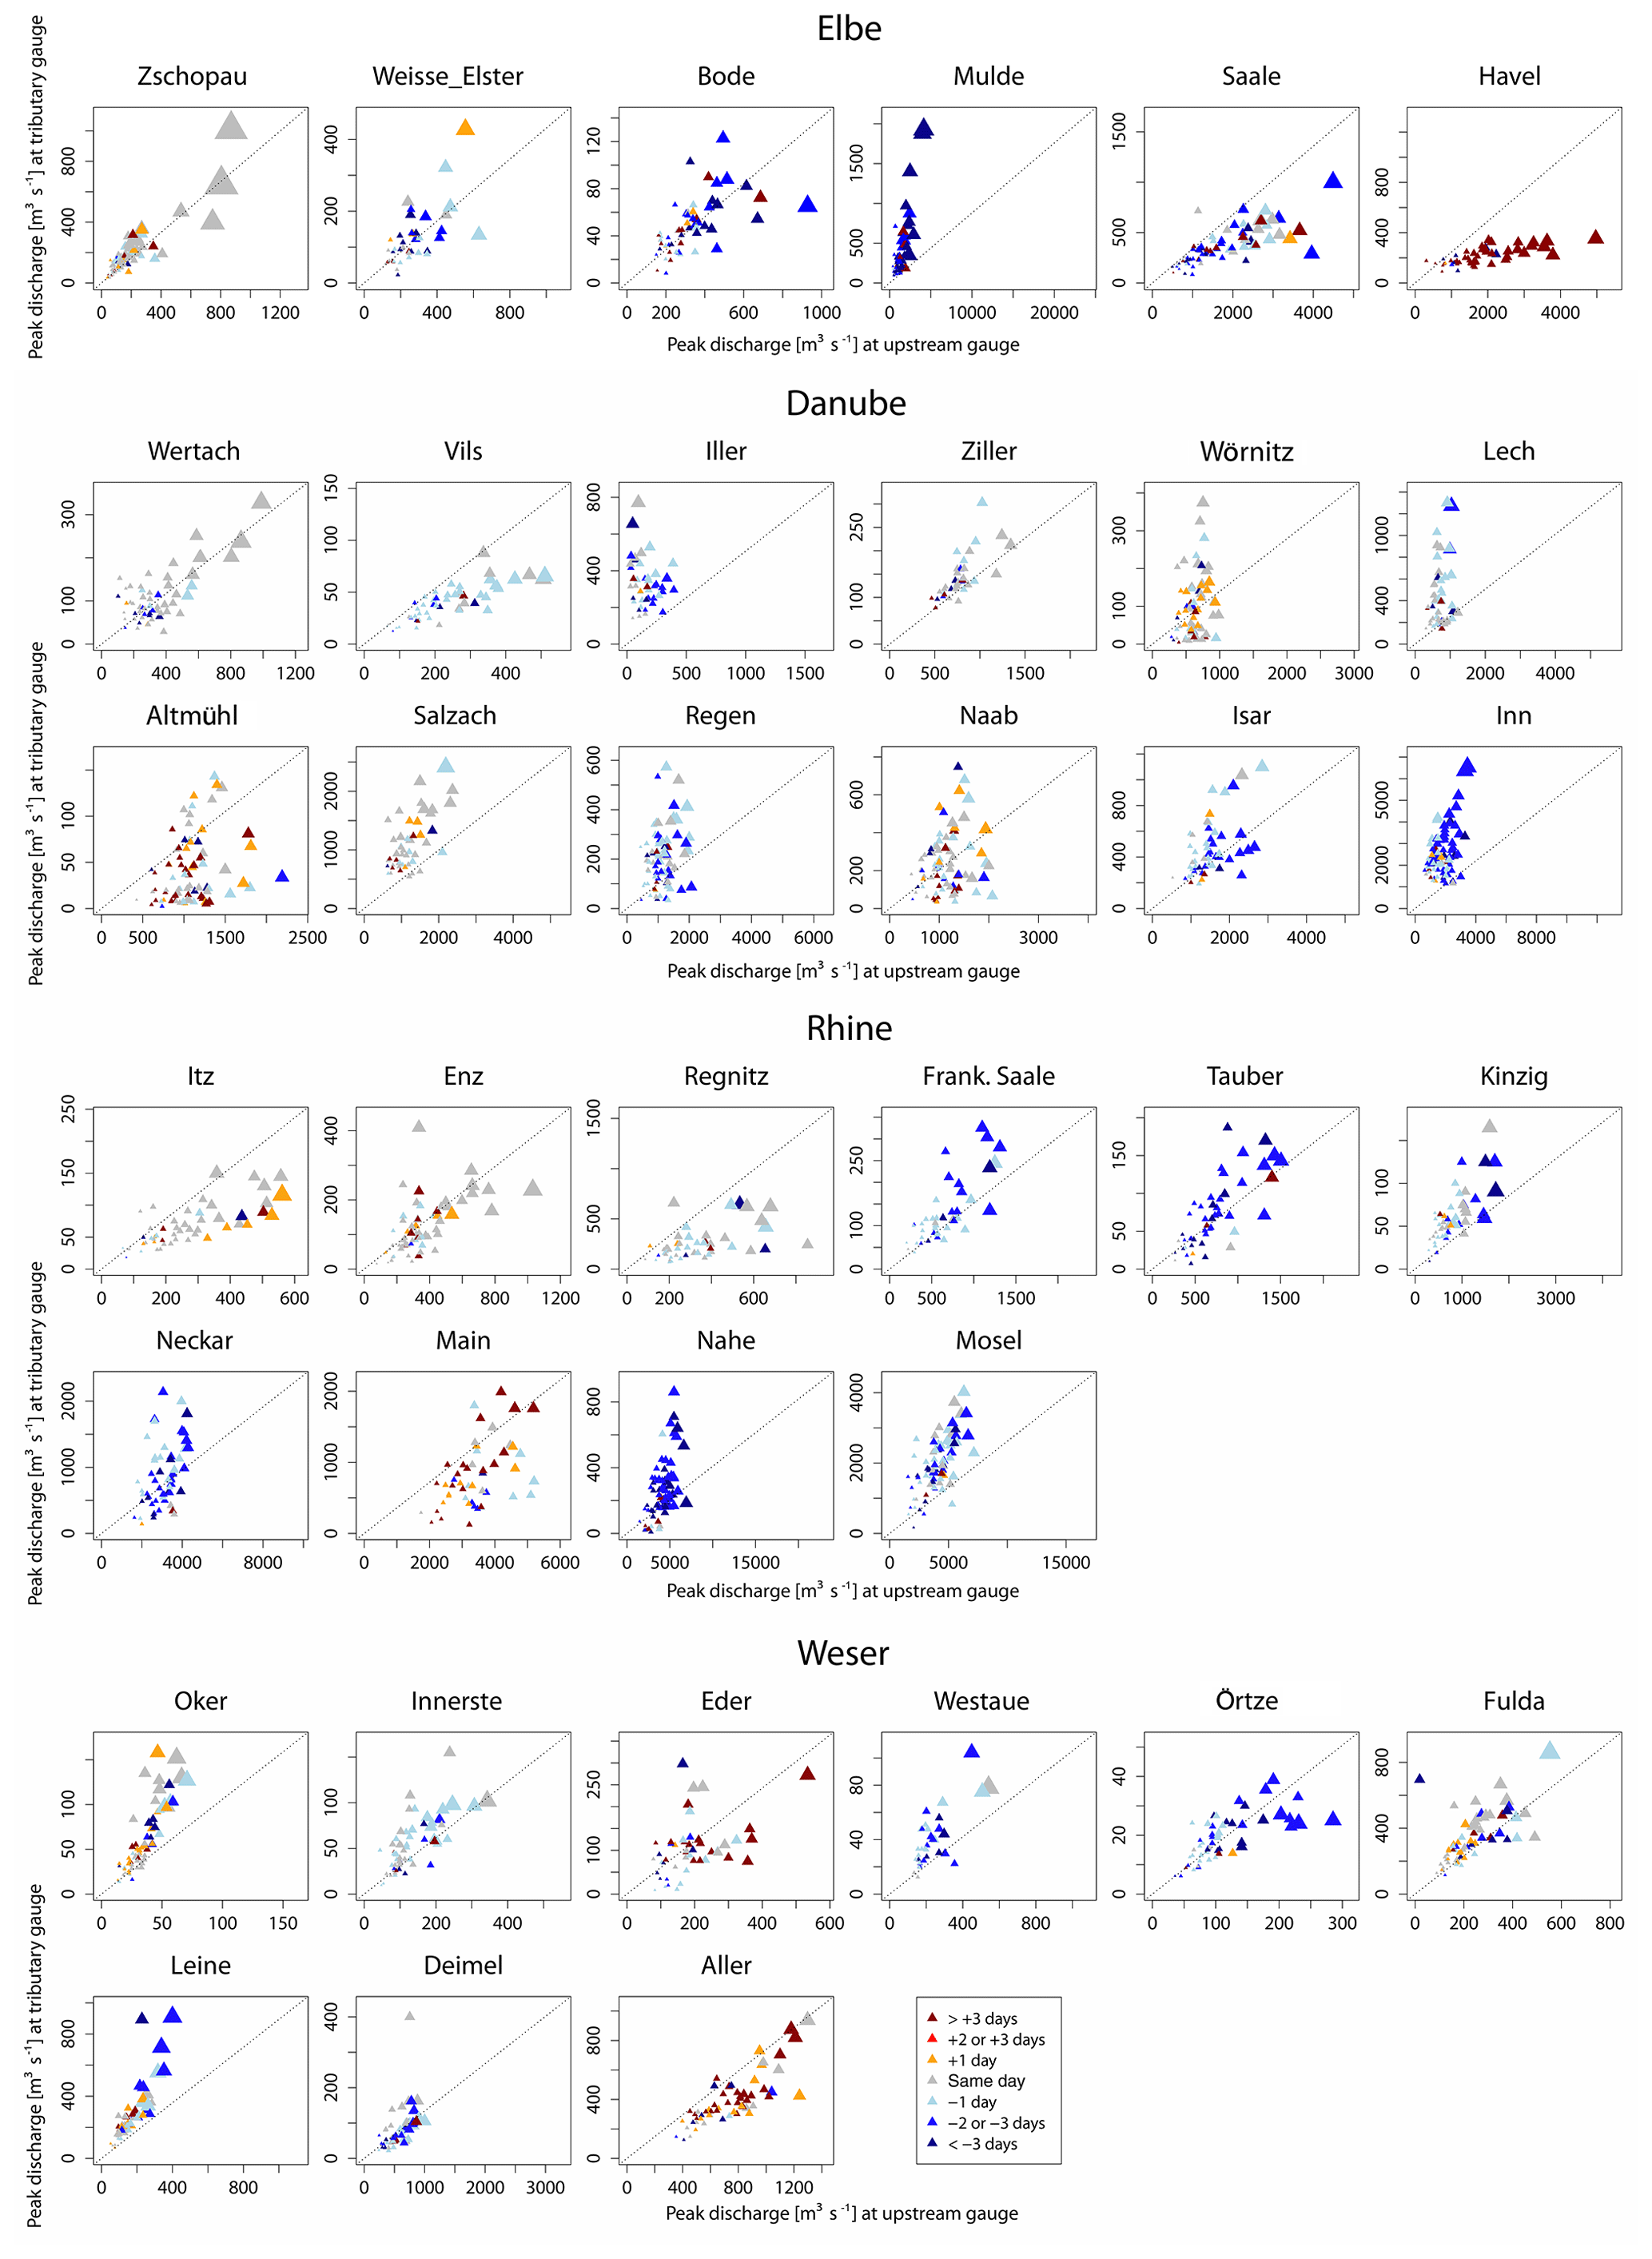
Figure 6The relationship of peak discharge between the upstream and tributary gauges for all selected events. The size of the triangles shows the downstream peak magnitude, normalised by the mean peak discharge: the larger the triangle, the larger the flood magnitude compared with the mean annual flood. The diagonal line delineates the same specific discharge at tributary and upstream gauges. Triangles above (below) the line represent a higher (lower) specific discharge at the tributary gauge compared with the upstream gauge. The colours express the time lag between the tributary and upstream peak: blue shows that the upstream peak occurs later, and red shows that the tributary peak occurs later.
In many cases, the analysis shows that the specific discharge is larger in tributaries than in the main stream, but the tributary peaks often occur earlier. The largest downstream floods (largest triangles in Fig. 6) are often characterised by the highest specific discharges, either in both branches or in one of them. Many subplots show a quasi-linear relationship, often deviating from the diagonal line that would indicate similar specific discharge (Fig. 6). Other triple points are characterised by event-specific behaviour with varying contributions from the tributary and upstream gauges. There is no clear indication that perfect temporal matching (grey triangles in Fig. 6) leads to the largest floods when the specific discharges are moderate. Hence, wave superposition does not seem to play a major role in generating large floods in Germany.
4.3 Contribution of the tributary and main river to the largest downstream floods
The contribution of the tributaries in the Elbe Basin is variable among tributaries and across the largest flood events (Fig. 7). While the Zwickauer Mulde has a similar contribution to the main stream of the Freiberger Mulde (case C1), the contribution of e.g. the Havel to the Elbe floods is minor. The strong delay between upstream and downstream peaks in the main river around the Saale confluence for the two largest floods (2002 and 2013) clearly points to floodplain inundation and wave attenuation, which indeed occurred after several dike failures.
In the Danube Basin, the largest floods are caused by much larger peaks in the Inn tributary compared with the upstream Danube. However, at the Inn–Danube confluence, the Danube wave has typically a 2 d lag. At the confluence of the Salzach and Inn rivers, similar peak values are observed. Thus, large flood peaks at the Inn confluence with the Danube are driven by both the Inn and the Salzach. Notably, the Wörnitz, Naab, Regen and Isar tributaries as well as the Inn (to a lesser degree) appear to behave somewhat asynchronously with respect to the Danube floods (a “see-saw” pattern). Large floods in the main river are typically matched by lower floods in the tributaries and vice versa (the flood compensation effect). At the confluence of the Lech and the Danube, high variability in the flood peak values is detected. The largest downstream flood peaks only occur if both rivers show large peaks. Low flood peaks in the Lech also lead to lower values at the Danube downstream gauge. The same situation is observed for the Regen and Naab tributaries. The ranking of the flood peaks is largely different between the upstream and downstream gauges due to the changing contribution from the Regen and Naab.
In the Rhine Basin, large floods occur with relevant contributions from the three major tributaries (the Mosel, Main and Neckar); however, the relative contributions vary between the events (cases C3 and C4). These tributaries and the main river flows exhibit a “see-saw” pattern (Fig. 7), where relatively low magnitudes in the main river are compensated for by relatively large flows in the tributaries and vice versa. For example, the flood severity in the Rhine is partly reduced due to a relatively low flood peak in the Mosel. Otherwise, a large flood peak in the Mosel could increase the downstream flood peak in the Rhine. The effect of wave superposition is not dominant in these cases either. This pattern suggests that the extent of flood-generating storms or their specific tracks have not been able to affect the upstream Rhine catchment and the tributary catchments to an equal degree in the past. The largest flood downstream of the Neckar confluence is caused by moderate main stream and tributary flows, but here the temporal matching of the Neckar wave is strong, which suggests the enhanced role of wave superposition at this confluence as mentioned above.
In the Weser Basin, the contributions from upstream and the tributary are similar at the Fulda and Aller confluences. The largest flood peaks at the confluence of the Leine and the Aller are evoked by large flood peaks from both upstream branches. In the majority of the cases, the Leine peak is 1 d later and the upstream Aller peak. For the seventh largest flood at the Leine–Aller confluence, the tributary peak is clearly larger than the downstream peak, which indicates strong attenuation effects due to inundation in the tributary. A flood compensation effect is found at the confluence of the Werra and the Fulda. Here, large discharges in the Fulda alone are not sufficient to generate a large flood downstream.
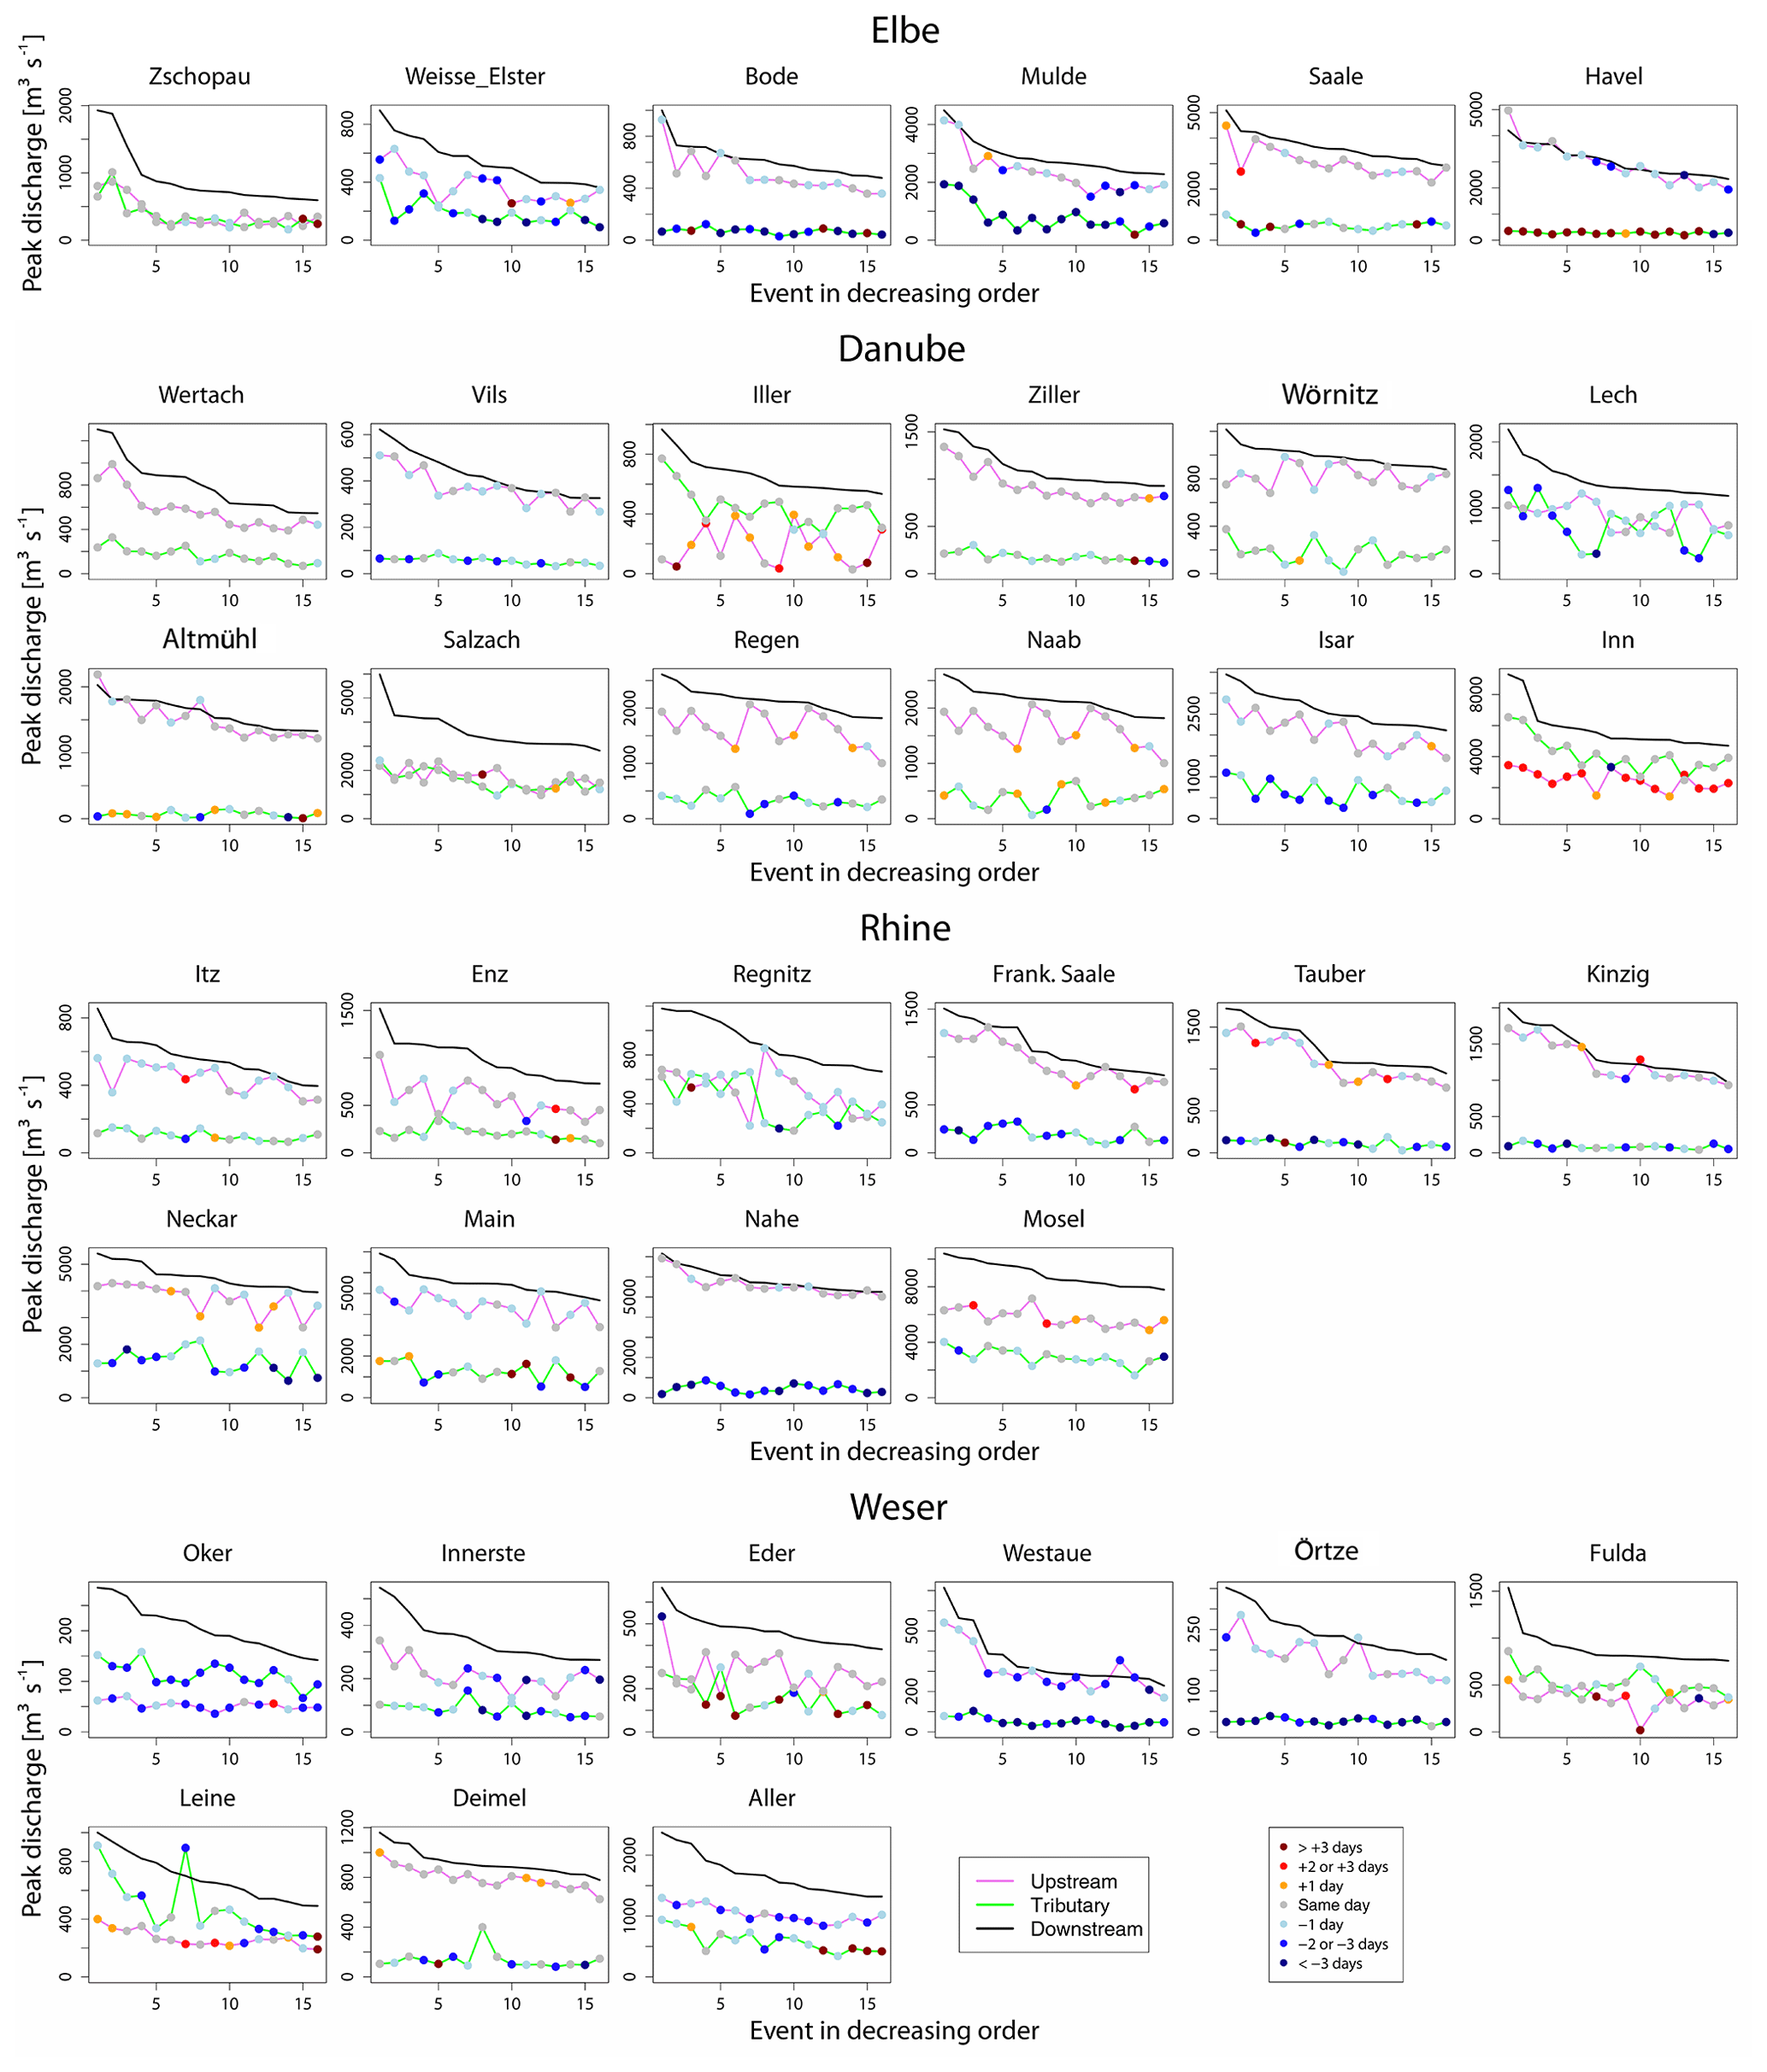
Figure 7Event peaks at the upstream, tributary and downstream gauges, shown in decreasing order according to the downstream peak discharge. The points show the timing of the upstream and tributary peak in relation to the downstream peak.
For some triple points, the flood peaks in the main river can be strongly enhanced by inflow from the tributaries. Flood wave superposition alone is not identified as a driver of the largest floods; however, in a few cases at some confluences, flood wave superposition appears to compensate for lower discharges in the upstream branches and, thus, contributes to the generation of floods.
In contrast to former studies using a few confluences, our study focused on a large set of gauging stations to explain general patterns and not on the specific characteristics of individual events.
Regarding discharge data, measurement uncertainty may be a limiting factor for various hydrological analyses. However, we do not expect this to have a significant impact on our results, as we analyse flood waves and events jointly in relation to each other. We expect that the uncertainty is similar for different events at the same gauge and for gauges at one triple point.
The relevance of flood wave superposition for flood severity also depends on the physiogeographic catchment characteristics and the catchment size. Geertsema et al. (2018) concluded that flood wave superposition is less important in large lowland rivers due to the long duration of flood waves. In our study, flood wave superposition may play a role at several confluences. We consider catchments ranging across 2 orders of magnitude from lowland areas via the Central German Uplands to alpine regions with the whole range of reaction times. Hence, there is high variability in the time lags at the confluences and flood durations of the incoming flood waves.
In several cases, our study has derived a time lag of some days between the tributary and upstream peak. A perfect temporal match of flood peaks could potentially lead to a large increase in peak discharge. For example, in the Mulde, the two largest events (2002 and 2013) have the highest specific discharges in both streams (the Elbe and the Mulde), but the Mulde peak occurs 4–6 d earlier. A meteorological situation in combination with a catchment response, which would reduce the time lag at the Mulde confluence, would be rather dangerous. Hence, the potential for a delayed Mulde response (in comparison to the Elbe) needs to be investigated in the future. A possible scenario would be long lasting extreme rainfall (e.g. a Vb cyclone; Petrow et al., 2007) in combination with dry catchment conditions in the Mulde catchment. This could result in a delayed Mulde response and a surprisingly large flood downstream.
The sensitivity of precipitation timing and soil wetness conditions was analysed by Blöschl et al. (2013) in a comparison of the flood waves of the Inn and Danube rivers. The flood peak in the Inn occurs earlier than in the Danube; however, there is some temporal variability in these time lags among different floods. Blöschl et al. (2013) explained the lower time lag for the 2013 floods by the earlier onset of the precipitation event in the Danube Basin compared with the Inn catchment and by strongly saturated soils that lead to a faster runoff response.
In order to investigate the impact of a delay in the tributary peak, Skublics et al. (2014) shifted the discharge time series of a tributary to achieve temporal matching of the flood peaks of tributary and main river in their simulation study in the Danube Basin. They showed that flood wave superposition could highly increase the flood peak. However, this study did not analyse whether this temporal shift was realistic. In future, we see the need to analyse storm tracks and precipitation patterns, which may potentially reveal if specific storm movements could induce temporal wave matching and large floods.
In this study, flood wave superposition between the tributary and main river is analysed at 37 confluences in four large basins in Germany. Each confluence is characterised by a triple point of three gauges (one in the tributary and two on the main river: upstream and downstream) which are jointly analysed regarding temporal matching and similarities in specific peak discharge during flood events. An approach is presented to disentangle the impact from tributaries on the downstream peak flow in terms of the temporal occurrence and peak magnitude.
The major outcomes of this study are as follows:
-
Flood wave superposition is not the major driver of flood peak occurrence downstream of most of the confluences analysed in this study. Flood wave superposition can be regarded as an amplification mechanism for downstream flood peaks. These are largely driven by discharges from upstream branches.
-
In general, the temporal superposition is sometimes constant with respect to the time lag, and there is sometimes strong variability in time lags among the floods at a specific triple point. In several cases, the tributary peaks precede the main river peak by about 2–5 d for most flood events. Several highly relevant tributaries in terms of their contribution show a prevailing peak delay (the Mulde, Mosel and Inn), but they also show the potential for strong flood amplification if a delayed response were to occur. Future work will analyse the probability of specific storm and catchment states that are capable of reducing the time lag with a simultaneously high peak magnitude.
-
The impact of flood wave superposition is event-specific in terms of peak discharges in the tributary and main river. At most of the confluences, no systematic differences are observed between the small and large floods. Either all floods are enhanced systematically by wave superposition or the mechanism does not lead to extremes.
-
At several confluences, “see-saw” patterns of main stream and tributary flows are detected, i.e. lower flows in the main stream are compensated for by larger flows in the tributary and vice versa. These confluences show the potential to generate large floods if both upstream subcatchments react in resonance. Future work will investigate the circumstances under which such resonance is possible (different event and soil moisture patterns and different storm tracks).
Overall, we conclude that the superposition of flood waves is not the driving factor of flood severity in Germany. The developed methodology can be transferred to other basins and confluences and is not region-specific.
The discharge data are not able to be provided due to restrictions. Please find the MATLAB code for deriving the flood peaks for the triple points in the Supplement of this article.
The supplement related to this article is available online at: https://doi.org/10.5194/hess-24-1633-2020-supplement.
All authors contributed to the design of the study, the discussion of the results and writing the article. SU undertook the GIS analyses and prepared the discharge data. SV and BG implemented the flood wave separation algorithm. BG carried out the analyses and prepared the figures.
The authors declare that they have no conflict of interest.
Financial support of the FOR 2416 “Space-Time Dynamics of Extreme Floods (SPATE)” research group from the German Research Foundation (“Deutsche Forschungsgemeinschaft”, DFG) is gratefully acknowledged. Funding from the Austrian Science Fund (grant no. I 3174-N29) is also acknowledged. The authors thank the following authorities for discharge data: the Federal Institute of Hydrology (BfG); the Bavarian State Office for the Environment (LfU); the Baden-Württemberg Office of Environment, Measurements and Environmental Protection (LUBW); the Saxony State Office for the Environment, Agriculture and Geology (SMUL); the Saxony-Anhalt Office for Flood Protection and Water Management (LHW); the Hessian Agency for Nature Conservation, Environment and Geology (HLNUG); the Rhineland Palatinate Office for the Environment, Water Management and the Factory Inspectorate (LUWG); and the Lower Saxony Office for Water Management, Coastal Defence and Nature Conservation (NLWKN).
This research has been supported by the German Research Foundation (DFG; grant no. FOR 2416) and the Austrian Science Fund (grant no. I 3174-N29).
The article processing charges for this open-access
publication were covered by a Research
Centre of the Helmholtz Association.
This paper was edited by Markus Hrachowitz and reviewed by two anonymous referees.
Bacchi, B., Brath, A., and Kottegoda, N.: Analysis of the Relationships Between Flood Peaks and Flood Volumes Based on Crossing Properties of River Flow Processes, Water Resour. Res., 28, 2773–2782, 1992. a, b
Beurton, S. and Thieken, A.: Seasonality of floods in Germany, Hydrolog. Sci. J., 54, 62–76, 2009. a
Blöschl, G., Nester, T., Komma, J., Parajka, J., and Perdigão, R. A. P.: The June 2013 flood in the Upper Danube Basin, and comparisons with the 2002, 1954 and 1899 floods, Hydrol. Earth Syst. Sci., 17, 5197–5212, https://doi.org/10.5194/hess-17-5197-2013, 2013. a, b, c, d, e
De Jager, A. and Vogt, J.: Rivers and Catchments of Europe – Catchment Characterisation Model (CCM), European Commission, Joint Research Centre (JRC), available at: http://data.europa.eu/89h/fe1878e8-7541-4c66-8453-afdae7469221 (last access: 2009), 2007. a
Di Lazzaro, M., Zarlenga, A., and Volpi, E.: Hydrological effects of within-catchment heterogeneity of drainage density, Adv. Water Resour., 76, 157–167, 2015. a
EEA: Copernicus Land Monitoring Service – EU DEM, European Environment Agency, available at: https://www.eea.europa.eu/data-and-maps/data/copernicus-land-monitoring-service-eu-dem (last access: May 2015), 2017. a
Geertsema, T. J., Teuling, A. J., Uijlenhoet, R., Torfs, P. J. J. F., and Hoitink, A. J. F.: Anatomy of simultaneous flood peaks at a lowland confluence, Hydrol. Earth Syst. Sci., 22, 5599–5613, https://doi.org/10.5194/hess-22-5599-2018, 2018. a, b, c
Klein, B.: Ermittlung von Ganglinien für die risikoorientierte Hochwasserbemessung von Talsperren, Doktorarbeit an der Ruhr-Universität Bochum, Fakultät fuer Bau- und Umweltingenieurwissenschaften, Lehrstuhl für Hydrologie, Wasserwirtschaft und Umwelttechnik, 2009. a
Lane, S.: Natural flood management, WIREs Water, 4, e1211, https://doi.org/10.1002/wat2.1211, 2017. a
LAWA: Leitfaden zur Hydrometrie des Bundes und der Länder – Pegelhandbuch, 5. Aufl., Bund/Länderarbeitsgemeinschaft Wasser (LAWA) and Ministerium für Umwelt, Klima und Energiewirtschaft Baden-Württemberg, 2018. a, b
Merz, R. and Blöschl, G.: A process typology of regional floods, Water Resour. Res., 39, 1340, https://doi.org/10.1029/2002WR001952, 2003, 2003. a
Merz, B., Dung, N., Apel, H., Gerlitz, L., Schröter, K., Steirou, E., and Vorogushyn, S.: Spatial coherence of flood-rich and flood-poor periods across Germany, J. Hydrol., 559, 813–826, 2018. a
Nied, M., Hundecha, Y., and Merz, B.: Flood-initiating catchment conditions: a spatio-temporal analysis of large-scale soil moisture patterns in the Elbe River basin, Hydrol. Earth Syst. Sci., 17, 1401–1414, https://doi.org/10.5194/hess-17-1401-2013, 2013. a
Pattison, I., Lane, S., Hardy, R., and Reaney, S.: The role of tributary relative timing and sequencing in control large floods, Water Resour. Res., 50, 5444–5458, https://doi.org/10.1002/2013WR014067, 2014. a
Petrow, Th., Merz, B., Lindenschmidt, K.-E., and Thieken, A. H.: Aspects of seasonality and flood generating circulation patterns in a mountainous catchment in south-eastern Germany, Hydrol. Earth Syst. Sci., 11, 1455–1468, https://doi.org/10.5194/hess-11-1455-2007, 2007. a
Plaut-Berger, K. and Entekhabi, D.: Basin hydrologic response relations to distributed physiographic descriptors and climate, J. Hydrol., 247, 169–182, 2001. a
Samaniego, L., Thober, S., Kumar, R., Wanders, N., Rakovec, O., Pan, M., Zink, M., Sheffield, J., Wood, E., and Marx, A.: Anthropogenic warming exacerbates European soil moisture droughts, Nat. Clim. Change, 8, 421–426, https://doi.org/10.1038/s41558-018-0138-5, 2018. a
Seo, Y. and Schmidt, A. R.: Network configuration and hydrograph sensitivity to storm kinematics, Water Resour. Res., 49, 1812–1827, https://doi.org/10.1002/wrcr.20115, 2013. a
Skublics, D., Seibert, S. P., and Ehret, U.: Abbildung der Hochwasserretention durch hydrologische und hydrodynamische Modelle unter unterschiedlichen Randbedingungen – Sensitivitätsanalyse am Donauabschnitt zwischen Neu-Ulm und Donauwürth, Hydrol. Wasserbewirts., 58, 178–189, https://doi.org/10.5675/HyWa_2014,3_2, 2014. a, b, c, d
Skublics, D., Bloeschl, G., and Rutschmann, P.: Effect of river training on flood retention of the Bavarian Danube, J. Hydrol. Hydromech., 64, 349–356, https://doi.org/10.1515/johh-2016-0035, 2016. a
Thomas, H. and Nisbet, T.: An assessment of the impact of floodplain woodland on flood flows, Water Environ. J., 21, 114–126, 2007. a
Vorogushyn, S. and Merz, B.: Flood trends along the Rhine: the role of river training, Hydrol. Earth Syst. Sci., 17, 3871–3884, https://doi.org/10.5194/hess-17-3871-2013, 2013. a, b