the Creative Commons Attribution 4.0 License.
the Creative Commons Attribution 4.0 License.
 | 01 Apr 2020
Can we trust remote sensing evapotranspiration products over Africa?
Imeshi Weerasinghe
Wim Bastiaanssen
Marloes Mul
Li Jia
Ann van Griensven
Evapotranspiration (ET) is one of the most important components in the water cycle. However, there are relatively few direct measurements of ET available (e.g. using flux towers). Nevertheless, various disciplines, ranging from hydrology to agricultural and climate sciences, require information on the spatial and temporal distribution of ET at regional and global scales. Due to the limited data availability, attention has turned toward satellite-based products to fill observational gaps. Various data products, including remote sensing (RS) products, have been developed and provide a large range of ET estimations. Across Africa, only a limited number of flux towers are available; hence, they are insufficient for the systematic evaluation of the available ET products. Thus, in this study, we conduct a methodological evaluation of nine existing RS-derived ET products as well as other available ET products in order to evaluate their reliability at the basin scale. A general water balance (WB) approach is used, where ET is equal to precipitation minus discharge for long-term averages. Firstly, ET products are compared with WB-inferred ET (ETWB) for basins that do not show long-term trends. The ET products and the calculated ETWB are then evaluated against the Budyko equation, which is used as a reference condition. The spatial characteristics of the ET products are finally assessed via the analysis of selected land cover elements across Africa: forests, irrigated areas and water bodies. Additionally, a cluster analysis is conducted to identify similarities between individual ET products. The results show that CMRSET, SSEBop and WaPOR rank highest in terms of the estimation of the long-term average mean ET across basins, with low biases and good spatial variability across Africa. GLEAM consistently ranks lowest in most evaluation criteria, although it has the longest available time period. Each product shows specific advantages and disadvantages. Depending on the study in question, at least one product should be suitable for a particular requirement. The reader should bear in mind that many products suffer from a large bias. Based on the evaluation criteria in this study, the three highest ranked products, CMRSET, SSEBop and WaPOR, would suit many users' needs due to the low biases and good spatial variability across Africa.
- Article
(7422 KB) - Full-text XML
- BibTeX
- EndNote


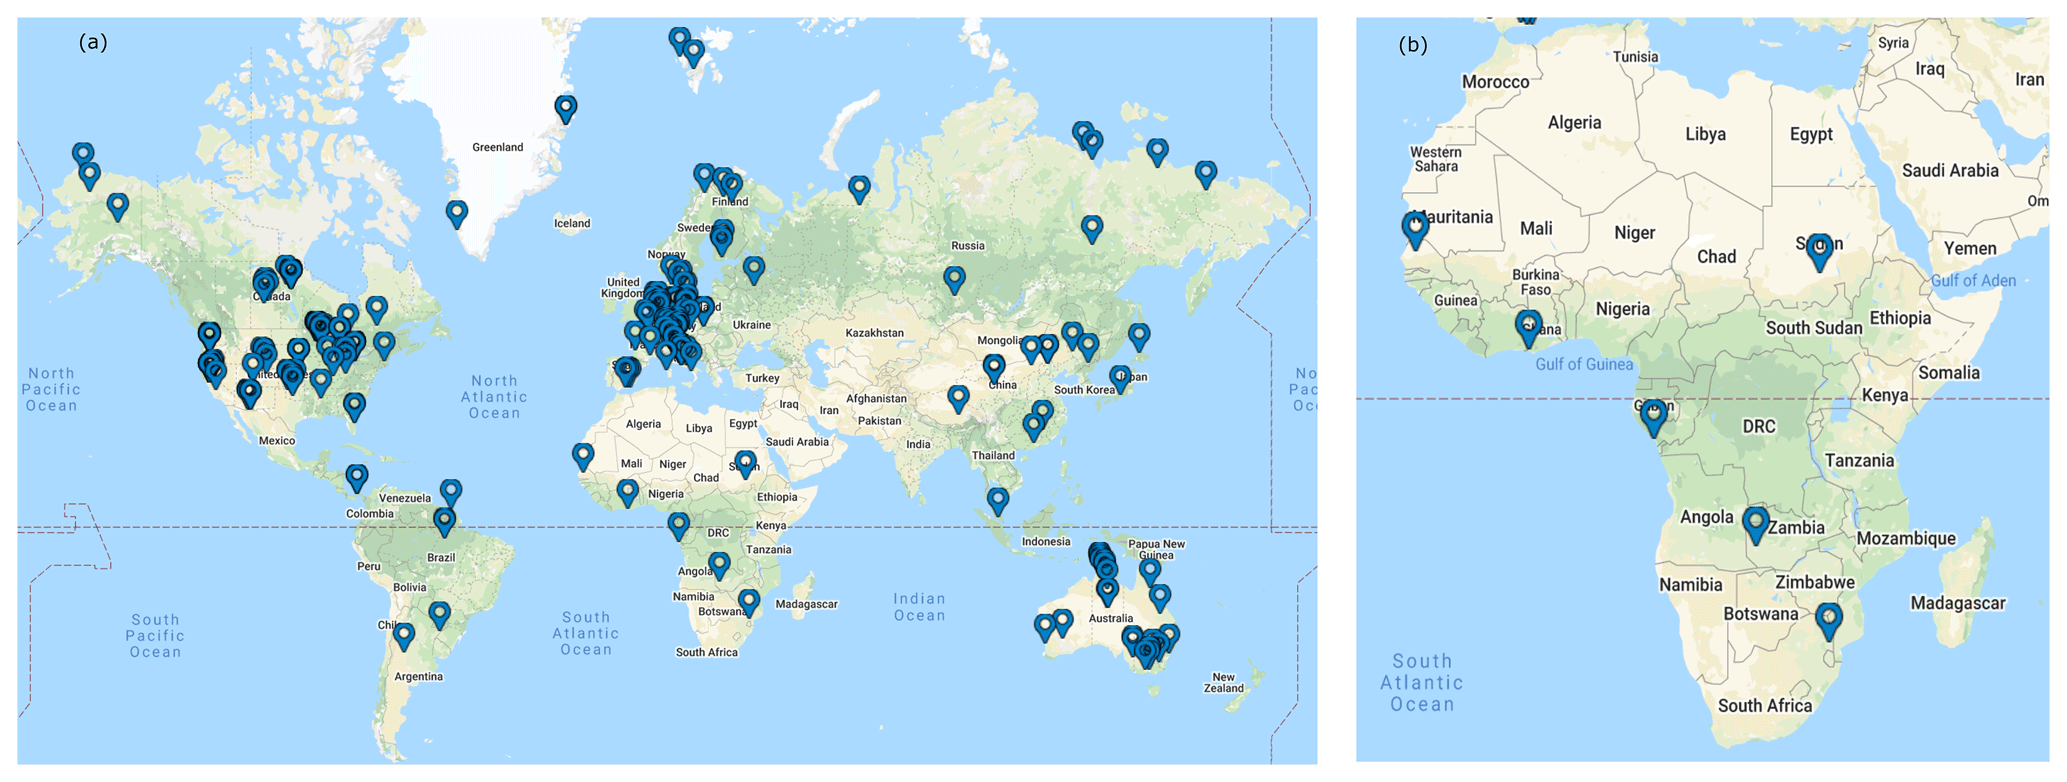
Evapotranspiration (ET) or the water vapour flux is an important component in the water cycle and is widely studied due to its implications in disciplines ranging from hydrology to agricultural and climate sciences (Trambauer et al., 2014). Growing attention has been given to estimating ET fluxes at regional and global scales for a wide variety of reasons, including the following: understanding the partitioning of energy and water at the Earths surface and their feedbacks; comprehending how the different external drivers of ET vary regionally; and understanding the impacts of potential changes on the hydrological cycle under a changing climate (Teuling et al., 2009; Vinukollu et al., 2011a; Mu et al., 2011). However, the estimation of ET at large scales has always been a difficult task due to the fact that direct measurement of ET is only possible at point locations, for example using flux towers (Trambauer et al., 2014). Obtaining ET observations from flux towers is challenging due to the high costs of implementation and maintenance, and studies often rely on openly accessible data, especially for regions in Asia, South America and Africa. Worldwide flux tower data can be openly accessed through FLUXNET1, although there is limited coverage in many regions (Fig. 1a). For example, for the entire African continent, there are only six FLUXNET sites (Fig. 1b) with available ET data. Due to the limited data availability of in situ measurements, a method of evaluating ET estimations using data other than point observations is required.
Recent advances in satellite-based ET products have provided promising data to fill these observational gaps (Alkema et al., 2011; Miralles et al., 2016; Guerschman et al., 2009; Zheng et al., 2016; Mu et al., 2007, 2011; Jung et al., 2011; Senay et al., 2013). ET cannot be directly measured by satellite-based measurements, but it can be derived from physical variables that can be observed from space, such as latent heat flux and surface heat flux, using the surface energy balance. In addition, due to passing frequencies and cloud interference, interpolations in time are required. Keeping this in mind, remote-sensing-derived ET cannot be interpreted as direct satellite observations and should instead be construed as model outputs based on satellite forcing data (Miralles et al., 2016). Therefore, large-scale estimations of ET are most commonly products of remote-sensing-based models, hydrological models and land surface models (Trambauer et al., 2014). More recently, ET products have also been developed using machine learning (ML) approaches such as model-tree ensemble (MTE) or artificial neural networks (ANNs) combined with observed flux tower data or model outputs used as training sets (Tramontana et al., 2016; Jiménez et al., 2011; Jung et al., 2017; Alemohammad et al., 2017).
Satellite observations often give useful information on the spatial variability; however, many of the products tend to suffer from a large bias. Within the range of approaches used to estimate ET, large differences are observed among the products, and evaluation is consequently required. Keeping the limited availability of in situ measurements for evaluation in mind, an alternate approach is to consider the water balance closure at the river basin scale. Only a few studies exist that compare the different satellite-based and gridded ET products at the global and continental scales using this approach among others. In their study, Miralles et al. (2016) evaluated four commonly used and tested algorithms, the Surface Energy Balance System (SEBS; Su, 2002), the Moderate Resolution Imaging Spectroradiometer (MODIS) MOD16 algorithm (Mu et al., 2007, 2011), the Global Land Evaporation Amsterdam Model (GLEAM; Miralles et al., 2011) and the Priestly–Taylor Jet Propulsion Laboratory model (PT-JPL; Fisher et al., 2008), to derive ET using a range of methods including water balance closure across a broad range of catchments worldwide. They found that GLEAM and PT-JPL appear more realistic when compared with 837 globally distributed catchments, although they also found that all products showed large dissimilarities under water stress and drought conditions (Miralles et al., 2016). Another global evaluation of the estimation of ET by three process-based models, SEBS, the Penman–Monteith algorithm (PM-Mu; Mu et al., 2007; Penman, 1948; Montieth, 1965) and a Priestly–Taylor-based approach (PT-Fi; Priestley and Taylor, 1972; Fisher et al., 2008), was conducted by Vinukollu et al. (2011a) using the water balance approach at 26 major basins worldwide along with other methods. A root-mean-square difference (RMSD) of 118 to 194 mm yr−1 and a bias of −132 to 53 mm yr−1 were found between the estimated annual ET and the water balance approximations. The LandFlux initiative, supported by the Global Energy and Water Exchanges (GEWEX) project (http://www.gewex.org/, last access: 1 July 2019) is a framework aiming to evaluate and compare several global ET data sets (Mueller et al., 2011; Jiménez et al., 2011). With these aims in mind, global merged benchmarking ET products were derived (Mueller et al., 2013a) using 40 data sets over a 7-year period (1989–1995) and 14 data sets over a 17-year period (1989–2005) to be utilized for evaluation. At the continental scale, a study by Trambauer et al. (2014) compared ET estimates derived using a continental hydrological model, PCR-GLOBWB (Van Beek and Bierkens, 2009), with other independently computed ET products, the European Centre for Medium-Range Weather Forecasts (ECMWF) reanalysis – ERA-Interim (Dee et al., 2011), ERA-Land (Balsamo et al., 2015), MOD16, GLEAM and three other versions of the PCR-GLOBWB model, using visual inspection and statistical methods. By subdividing the continent into climatic regions, they found that the annual anomalies of ET for each of the products with respect to the multiproduct mean was highest in ERA-Interim. GLEAM was lower than the multiproduct mean in most cases, whereas PCR-GLOBWB was close to the multiproduct mean in nearly all cases.
To our knowledge, there are no existing studies that use the water balance approach for evaluating existing ET products that focus solely and entirely on the African continent. The water budget of a catchment implies that precipitation (P) minus river discharge (Q) equals evapotranspiration (ETWB) when considering a long time period so that the change in water storage (soil moisture, lakes and deltas) can be neglected (Miralles et al., 2011, 2016; Vinukollu et al., 2011b). Using this general water balance to infer ETWB, it is possible to gain an understanding of the magnitude of ET within a given basin and, hence, estimate biases in the ET estimation by the different products at the catchment scale. Unfortunately, the period of observation for measured discharge for certain basins is limited or does not overlap with existing ET products; thus, different time periods need to be used.
Therefore, this study focuses on evaluating nine existing, mostly open access, ET products (ETRS) using a water balance approach over Africa. The products analysed are the Commonwealth Scientific and Industrial Research Organisation's MODIS Reflectance Scaling Evapotranspiration (CMRSET; Guerschman et al., 2009), ETMonitor (Zheng et al., 2016), GLEAM, LandFlux-EVAL, MOD16, FLUXNET Model-Tree Ensemble (MTE; Jung et al., 2011), the operational Simplified Surface Energy Balance model (SSEBop; Senay et al., 2013), the portal from the Food and Agriculture Organization (FAO) to monitor “Water Productivity through Open access of Remotely sensed derived data” (WaPOR; FAO, 2018) and the Water, Energy and Carbon Cycle with Artificial Neural Networks (WECANN; Alemohammad et al., 2017). The evaluation of the products will be conducted using (1) a comparison of their performance against calculated ETWB, (2) a robustness check of their performance against the Budyko curve (Budyko, 1974) that provides a reference condition for the water balance assuming it correctly partitions P into Q and (3) a spatial variability assessment using specific land cover elements (forests, water bodies and irrigated areas).
2.1 Data
2.1.1 Evapotranspiration products
The derived ET products evaluated in this study include CMRSET, ETMonitor, GLEAM, LandFlux-EVAL, MOD16, MTE, SSEBop, WaPOR and WECANN. Overall there are large differences between the products that result in certain advantages and disadvantages among the products. All products have a global spatial coverage (advantage) except for WaPOR (disadvantage). All products are openly accessible (advantage) except for ETMonitor (disadvantage). GLEAM and ETMonitor have a daily resolution, CMRSET has an 8 d resolution and WaPOR has decadal temporal resolution, which is an advantage over other products that have monthly or yearly resolutions. Most products are still ongoing (advantage) except for ETMonitor, LandFlux-EVAL and MTE (disadvantage). GLEAM, MTE and LandFlux-EVAL have data available prior to 1990 (advantage), whereas all other product only have data available after 1999 (disadvantage). CMRSET and WaPOR have the highest resolutions (; possible advantage), LandFlux-EVAL and WECANN have the lowest resolutions (; possible disadvantage), and all of the other products range in between these values. Table 1 summarizes the different features mentioned and specifies whether these are possible advantages or disadvantages. These different ET products give a good sample of the data sets that are available to choose from.
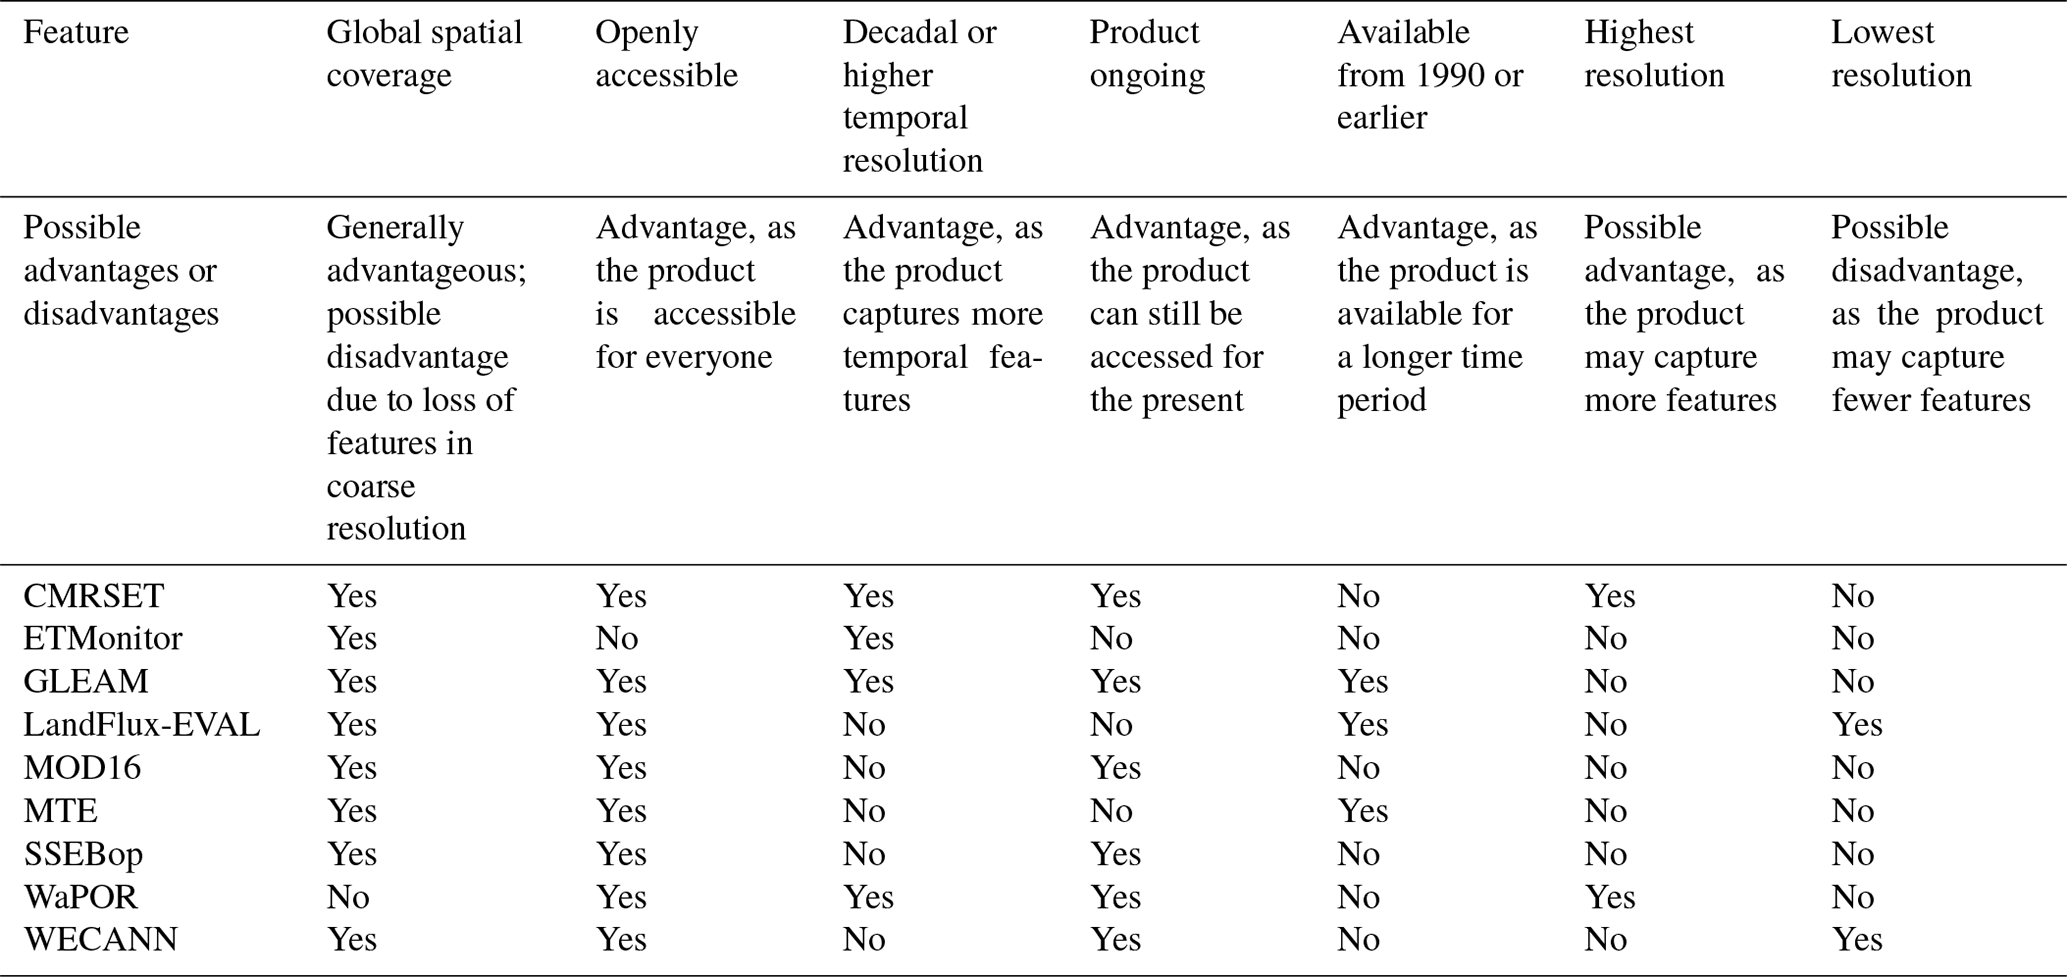
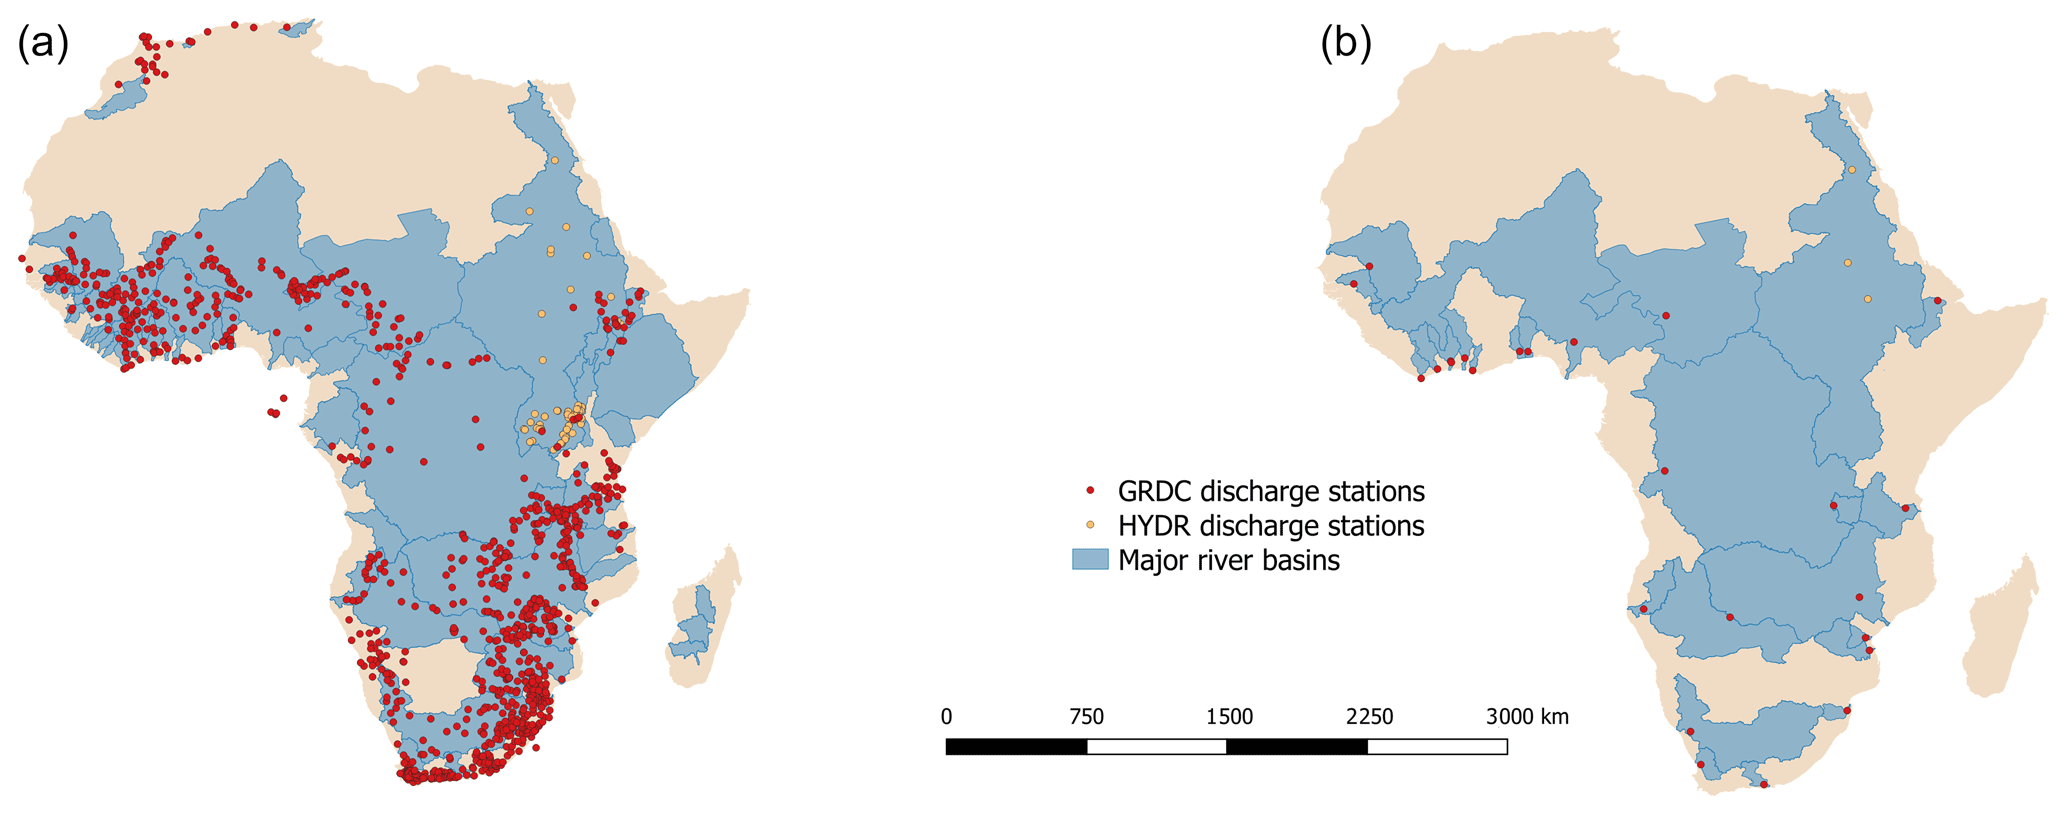
Figure 2(a) All major basins in Africa and all available discharge stations; (b) major basins in Africa with available discharge data at the outlet.
All products have been projected and gridded on a geographic grid and averaged at a yearly temporal resolution for the purposes of this study. Table 2 summarizes the characteristics of the products that were used. For details on and access to each of the products, please refer to the references and websites listed in Table 2.
Guerschman et al. (2009)Zheng et al. (2016)Martens et al. (2017)Miralles et al. (2011)Mueller et al. (2013b)Mu et al. (2011, 2007)Jung et al. (2011)Senay et al. (2013)FAO (2018)Alemohammad et al. (2017)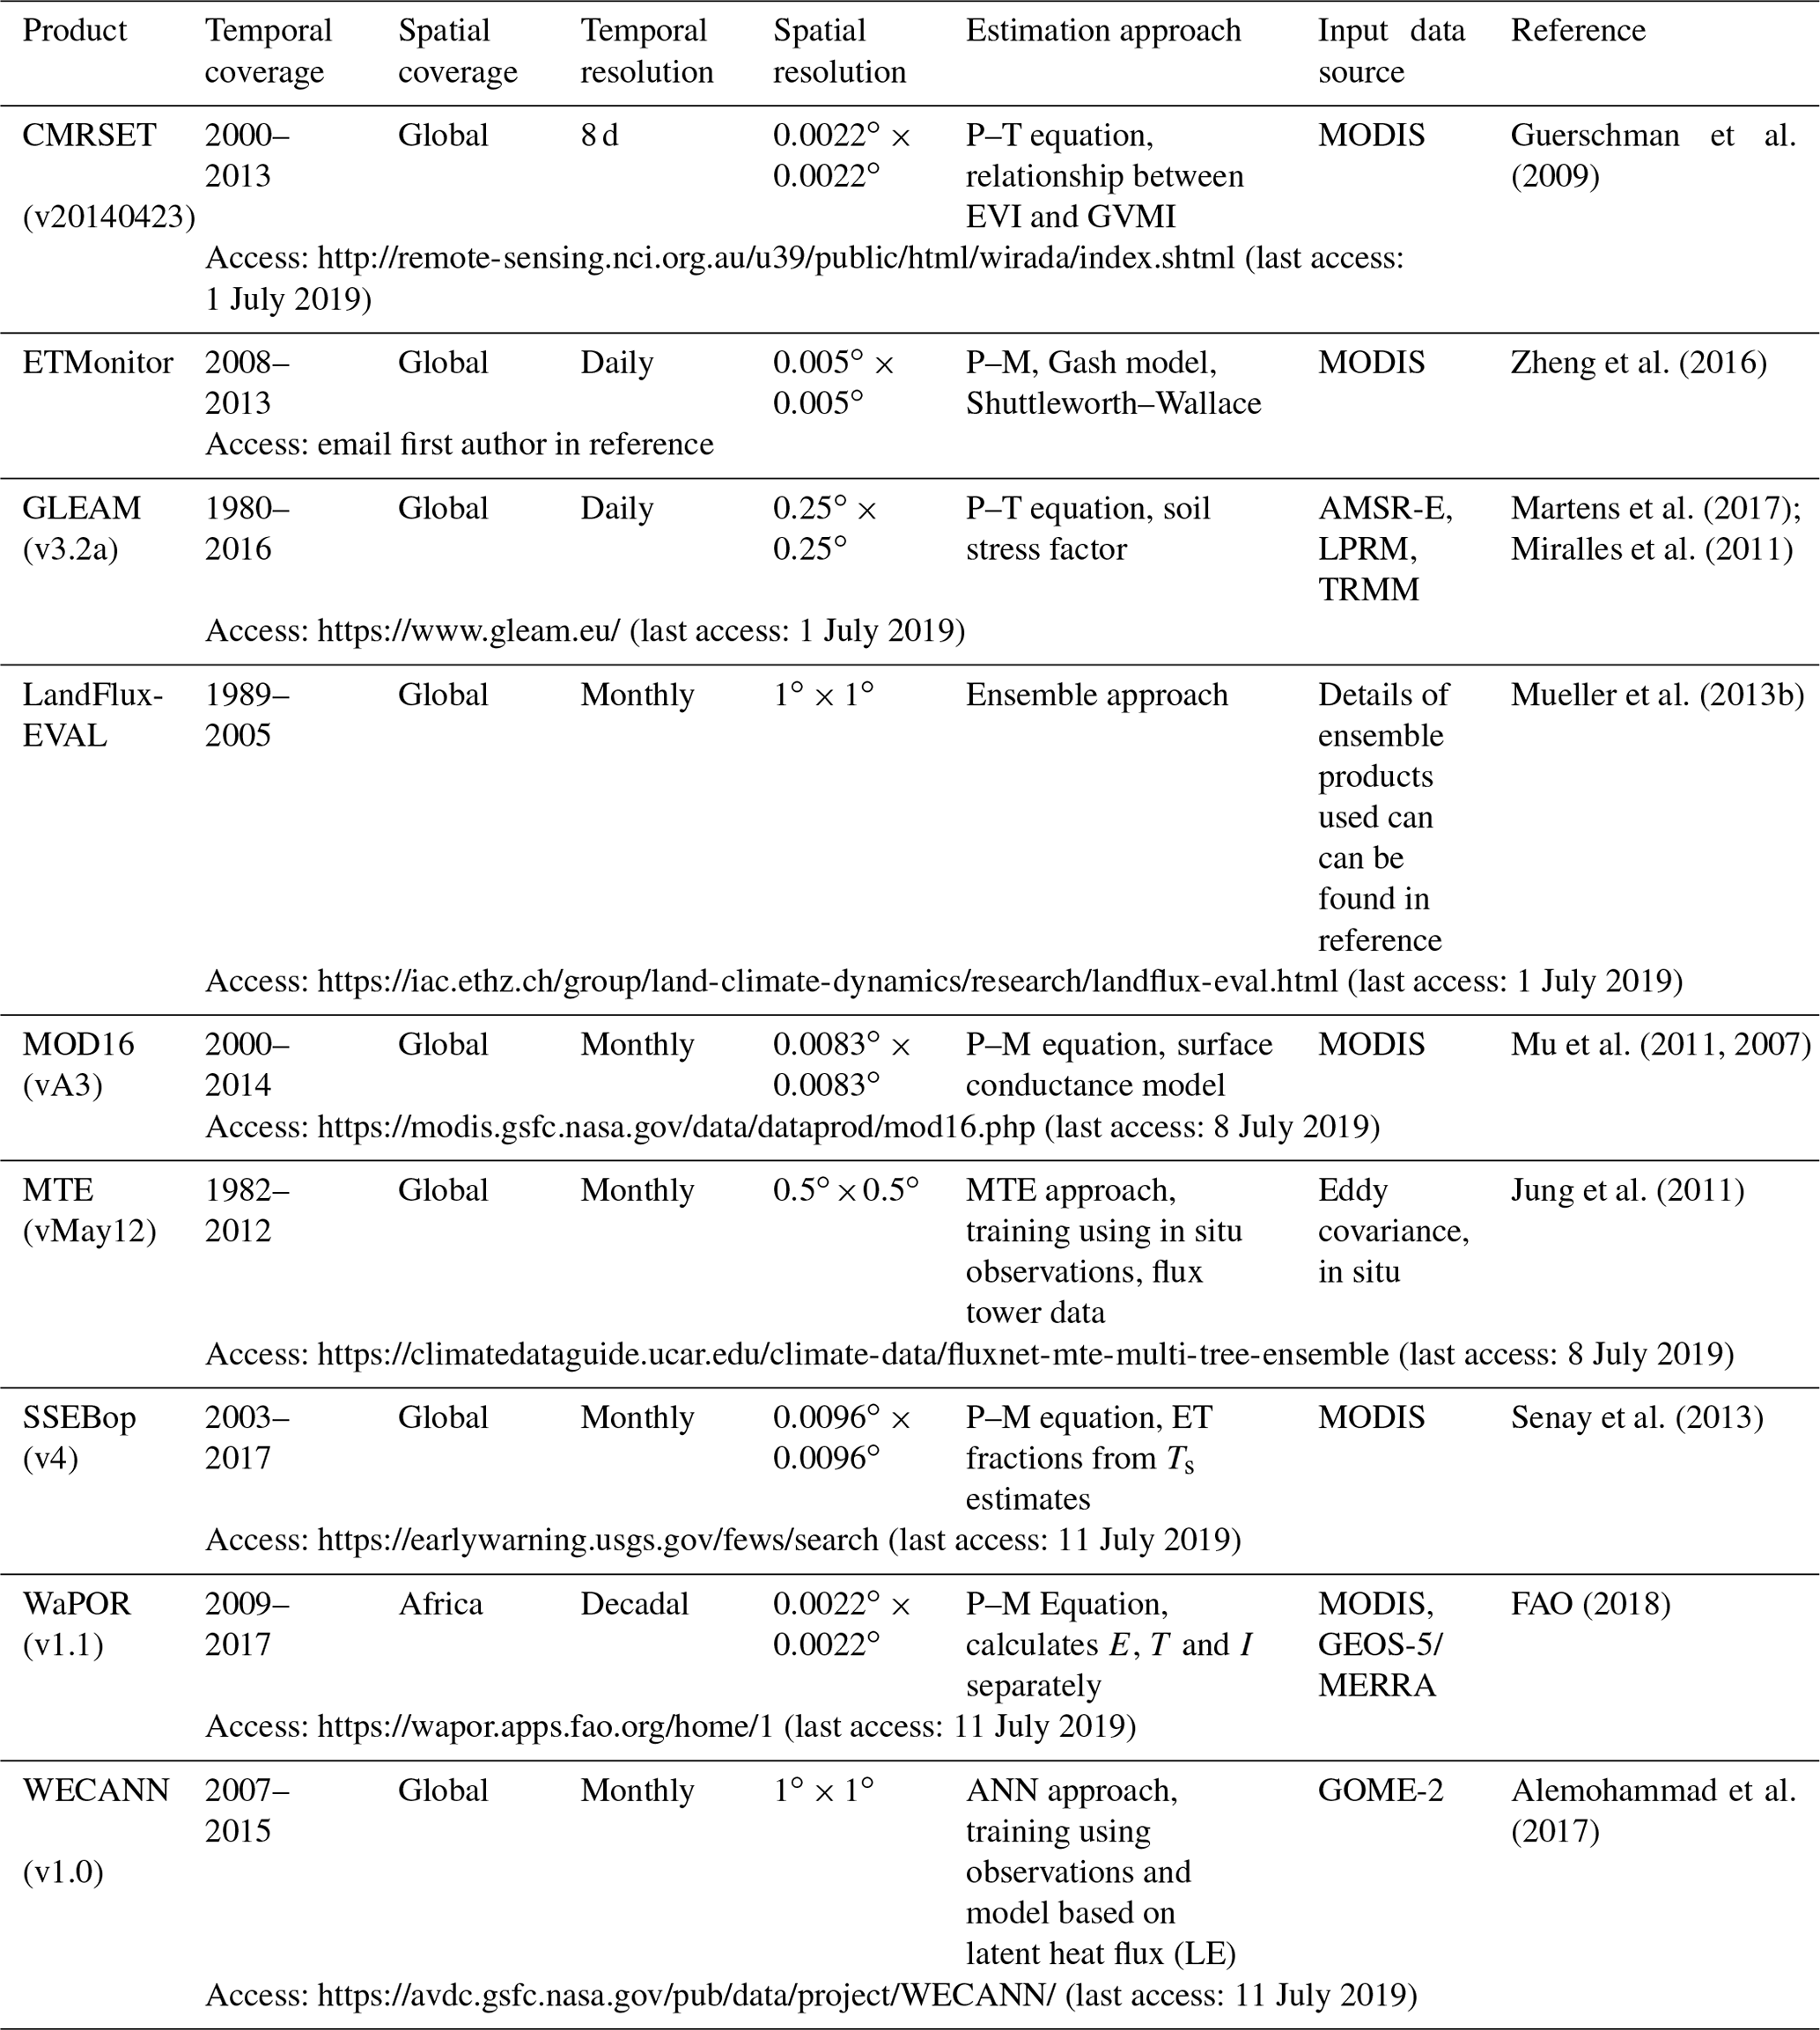
2.1.2 Precipitation products
The precipitation products used in this study are EartH2Observe (E2OBS), WATCH forcing data methodology applied to ERA-Interim reanalysis (WFDEI), ERA-Interim data Merged and Bias-corrected (EWEMBI), the Climate Hazards group Infrared Precipitation with Stations (CHIRPS) and the Multi-Source Weighted Ensemble Precipitation (MSWEP). Precipitation products were averaged at a yearly temporal resolution for the purposes of this study. Table 3 summarizes the characteristics of the products that were used. For details on and access to each of the products, please refer to the references and websites listed in Table 3. An ensemble of the three P products was used for all calculations requiring P.
(Weedon et al., 2014)(Calton et al., 2016)Lange (2019)(Huffman et al., 2007)(NCAR, 2017)Funk et al. (2015)(JAXA, 2009)Bai and Liu (2018)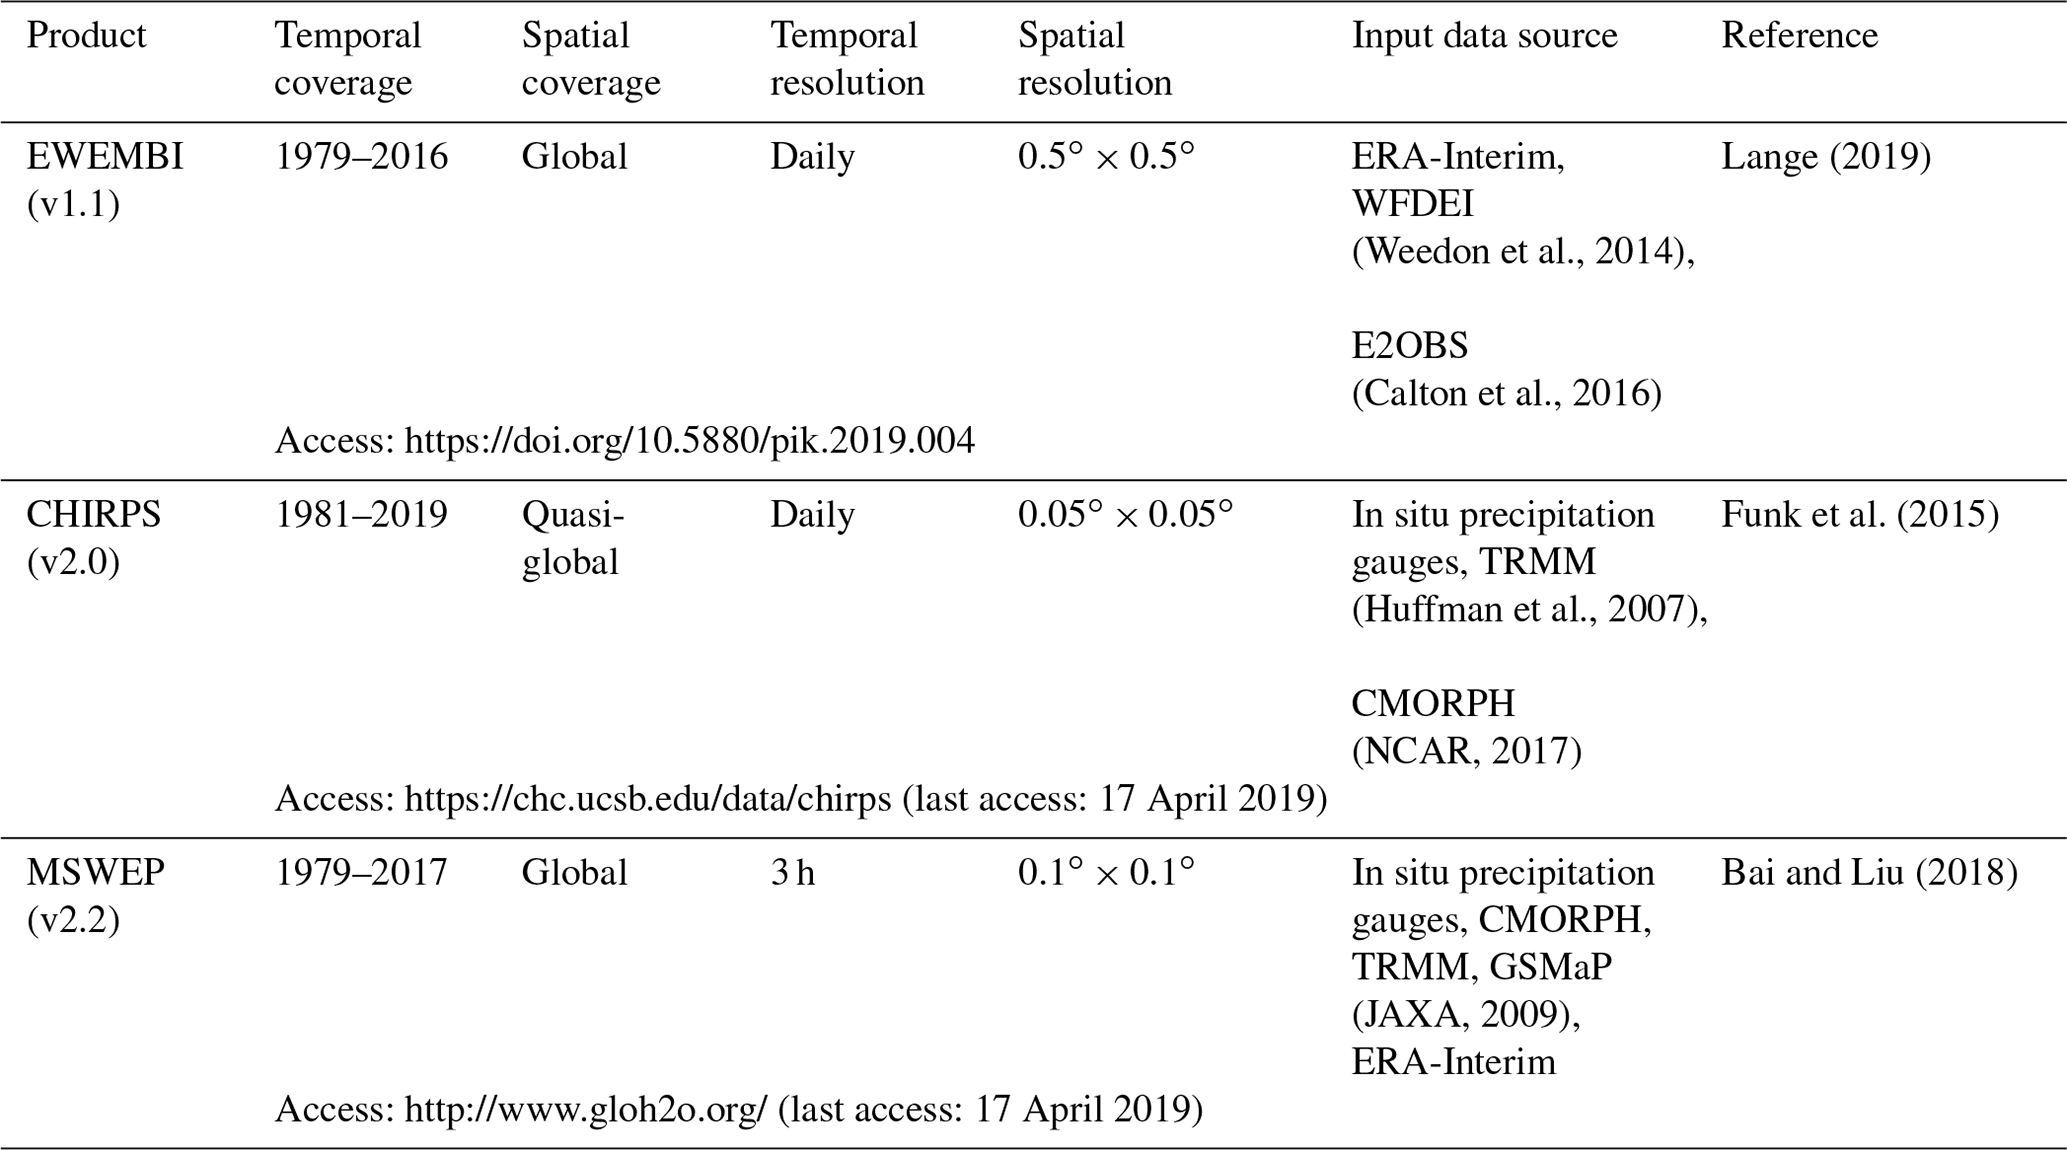
2.1.3 Discharge data
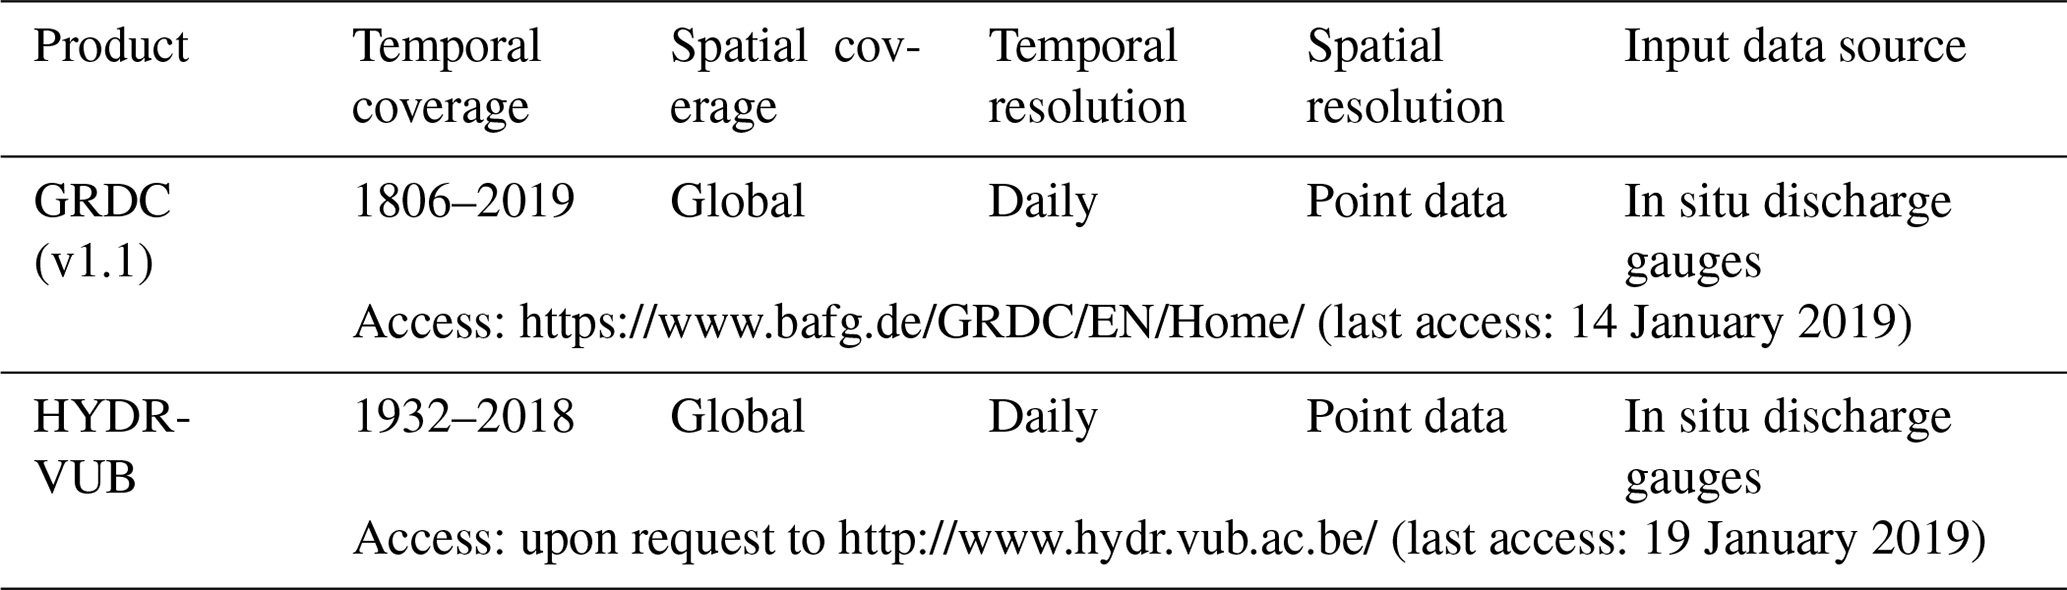
Discharge data were obtained from the Global Runoff Data Centre (GRDC) and the Vrije Universiteit Brussels (VUB) Department of Hydrology and Hydraulic Engineering (HYDR). Table 4 summarizes the characteristics of the data that were used. For details on and access to each of the products, please refer to the references and websites listed in Table 4.
2.1.4 Reference potential evapotranspiration data
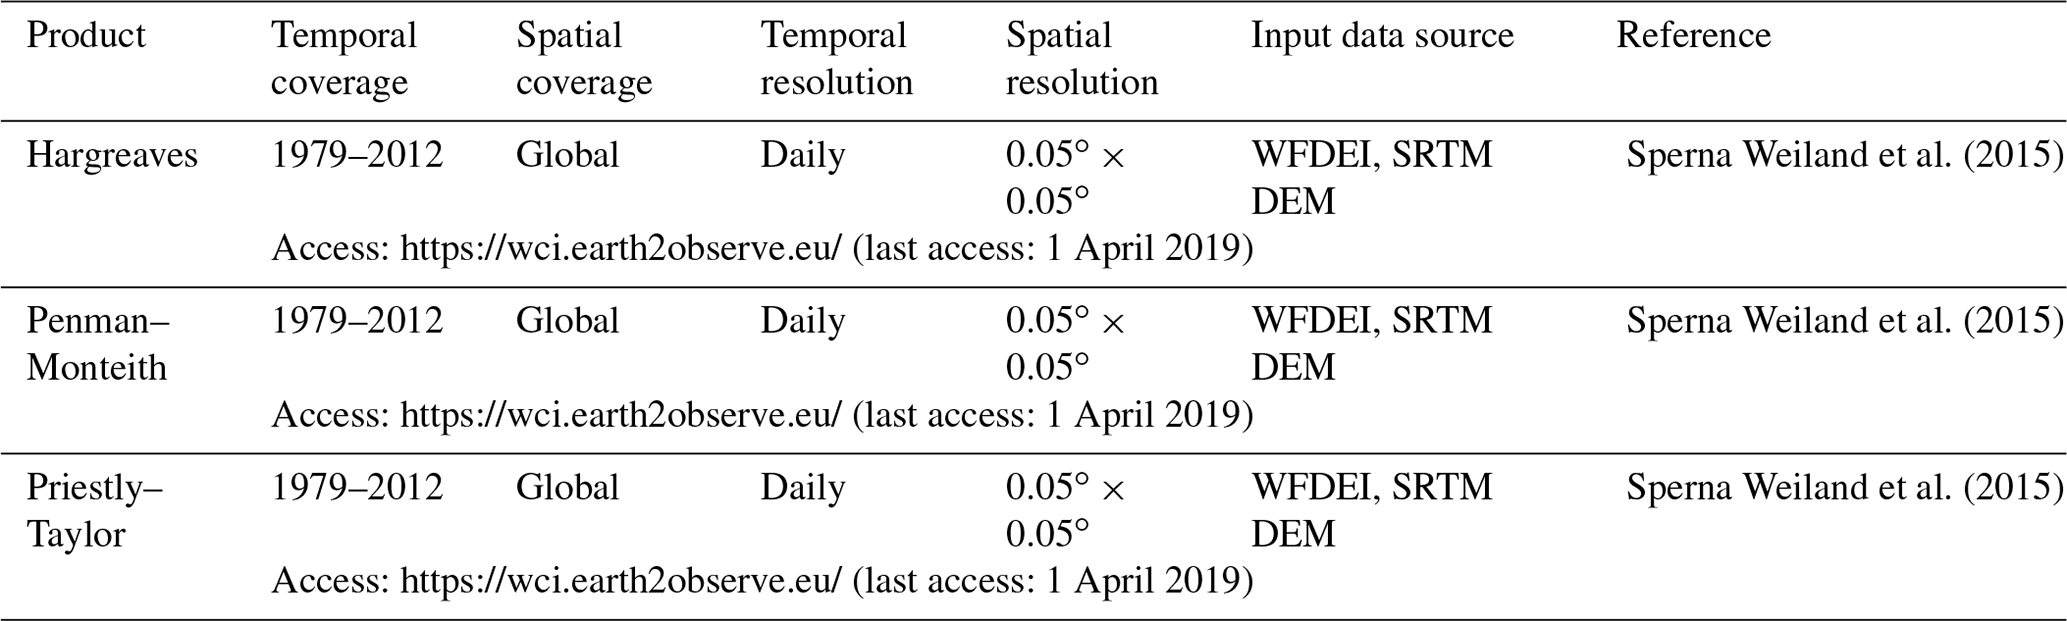
Three global reference potential evapotranspiration (PET) data products developed by Deltares (Sperna Weiland et al., 2015) are used based on the Hargreaves (Har; Hargreaves and Samani, 1985), Penman–Monteith (P–M; Montieth, 1965; Penman, 1948) and Priestly–Taylor (P–T; Priestley and Taylor, 1972) approaches. Table 5 summarizes the characteristics of the products that were used. For details on and access to each of the products, please refer to the references and websites listed in Table 5. An ensemble of the three PET products was used for all calculations requiring PET.
Sperna Weiland et al. (2015)Sperna Weiland et al. (2015)Sperna Weiland et al. (2015)Table 5Characteristics of potential evapotranspiration products.
2.2 Methods
The methodology used to evaluate ET product estimations is presented in the following:
-
comparison between catchment water balance evapotranspiration (ETWB) and ET products;
-
evaluation of ETWB and ET product estimations using the Budyko curve (ETBudyko) as a reference;
-
assessment of spatial variability using land cover elements; and
-
assessment of similarity using a cluster analysis.
2.2.1 Catchment water balance evapotranspiration (ETWB)
Due to the limited availability of direct observations of ET across Africa, we infer ET estimates at the river basin level using the water balance approach and assuming a negligible change in storage (discussed further in Sect. 5) for long time periods:
ETWB was calculated for 27 major river basins across Africa based on discharge data (GRDC and HYDR VUB) quality and availability at the outlets of 54 major basins (Fig. 2). Catchment or basin areas were taken from the “Major River Basins of the World” (MRBW) shapefile (World Bank, 2017). Discharge was converted from cubic metres per second to millimetres per year using the above-mentioned catchment areas for all years of data availability for each basin. As direct observations of precipitation from gauges were not used, precipitation was taken as the average of the three data products, EWEMBI, CHIRPS and MSWEP. The basin-averaged precipitation was calculated for the years from 1979 to 2016 according to the MRBW shapefile boundaries recording the basin mean. The performance of the precipitation products in estimating P for each of the basins was compared. Long-term ETWB was calculated using the long-term average discharge and precipitation data for each catchment. The MRBW shapefile area did not differ greatly with the drainage area reported by the GRDC except in two cases. Here we found that the ETWB calculated using the two areas only differed by 2.5 % and 3.3 % respectively; thus, we retained these basins in the analyses.
One problem that arises when using the water balance approach is that the period of observation for measured discharge is limited or does not overlap with existing ET products in certain cases. For this reason, long-term averages of ETWB were used in which no major trends were present in order to justify the evaluation using different time periods (discussed further in Sect. 5). The Mann–Kendall (MK; Mann, 1945; Kendall, 1948) test was used to identify whether a monotonic upward or downward trend was present in the calculated ETWB estimates. The MK test is nonparametric (distribution free), is best used as an exploratory analysis to identify where changes are significant or of a large magnitude (Matzke et al., 2014) and should only be used where seasonal trends are not present. Considering annual averages are used in this study, the MK test was deemed appropriate.
In order to conduct our comparisons using the calculated ETWB, all ET products that were evaluated were projected to EPSG:4326 WGS 84 on a grid. This resolution represented the highest spatial resolution of the products that were analysed. Products were resampled to the highest resolution in order to obtain the best approximation of basin areas when overlaid with basin boundary shapefiles. Only negligible differences were found between the calculation of ETWB using products with the original resolution compared with ETWB calculated using resampled products. The nearest-neighbour interpolation method was used for any resampling required from course to high resolution to limit the loss of any information. The estimations were then combined to give a single map of the long-term average ETRS for each product across Africa. The time periods averaged for each product can be found in Table 2. The basin-averaged ETRS was calculated according to the MRBW shapefile boundaries and the basin mean was recorded. The root-mean-square error (RMSE), the basin area-weighted RMSE (RMSEaw), the correlation coefficient (r), the bias and basin area-weighted bias (biasaw) between ETWB and ETRS for all basins were calculated. Basin area weighting was considered when calculating the bias and RMSE due to a large difference in the basin areas. Therefore, basins with larger areas had more weight in the basin area-weighted statistics than basins with smaller areas. Correlations were calculated based on long-term averages across all basins.
The ranking of the ET products are based on their performance with respect to the RMSE, RMSEaw, r, bias and biasaw.
2.2.2 Evaluation using the Budyko curve
The Budyko equation partitions precipitation into streamflow and ETBudyko by describing the relationship between mean annual ET and the long-term average water and energy balance at catchment scales (Sposito, 2017), as seen in Fig. 3. Budyko (1974) developed this approach for the physics of catchment ET by postulating on the phase transformation of green water to vapour and, thus, that ET reflects not only the partitioning of water but also the radiant energy at the vadose zone–atmosphere interface (Sposito, 2017; Gerrits et al., 2009), following Eq. (2).
The Budyko curve provides a reference condition for the water balance, assuming that it correctly describes the partitioning of P into Q, which can be used to see how well the ET products and calculated ETWB perform in estimating ET. For each of the basins under study, we calculated ET/P and PET/P and plotted these against the Budyko curve. Average PET estimates from the three products using the Hargreaves, P–M and P–T approaches were used by taking the basin mean PET according to the MRBW shapefile boundaries. The performance of the reference potential evapotranspiration products with respect to estimating PET for each of the basins was compared. P was taken as the average of the EWEMBI, CHIRPS and MSWEP precipitation products. The bias was found between the calculated ETWB and ETRS using the calculated ETBudyko.

The ranking of the ETRS from each product is based on the performance of their average bias across all basins with that of the calculated ETBudyko.
2.2.3 Spatial variability assessment
Three types of land cover elements were evaluated in this study, irrigated areas, water bodies and forested areas. A map of areas equipped for irrigation that are actually irrigated (AEIai, from FAO and the Rheinische Friedrich-Wilhelms-Universität Bonn; Siebert et al., 2013), a map of water bodies obtained from the Global Reservoir and Dam (WBGRanD) database (Lehner et al., 2011) and a map of 2013 Intact Forest Landscapes (IFL) were used to evaluate how well the ET products identified spatial characteristics. Two steps were used. Firstly the ET products were evaluated visually. Using different scales and the land cover elements identified (Fig. 4), the ET products were then evaluated on how well each type of land cover element was detected. Secondly, a quantitative assessment was conducted for forested areas and water bodies. However, a quantitative assessment of irrigated areas was not conducted due to the fact that a suitable reference condition for such large pixels and long-term temporal scales could not be found. For water bodies, ET should be more or less equal to the PET. Therefore, the long-term annual average ETRS and PET across water bodies was calculated by recording the mean according to the boundary provided by the WBGRanD map. The mean ETRS for water bodies for each ET product was then compared with the PET mean for water bodies by calculating the bias.
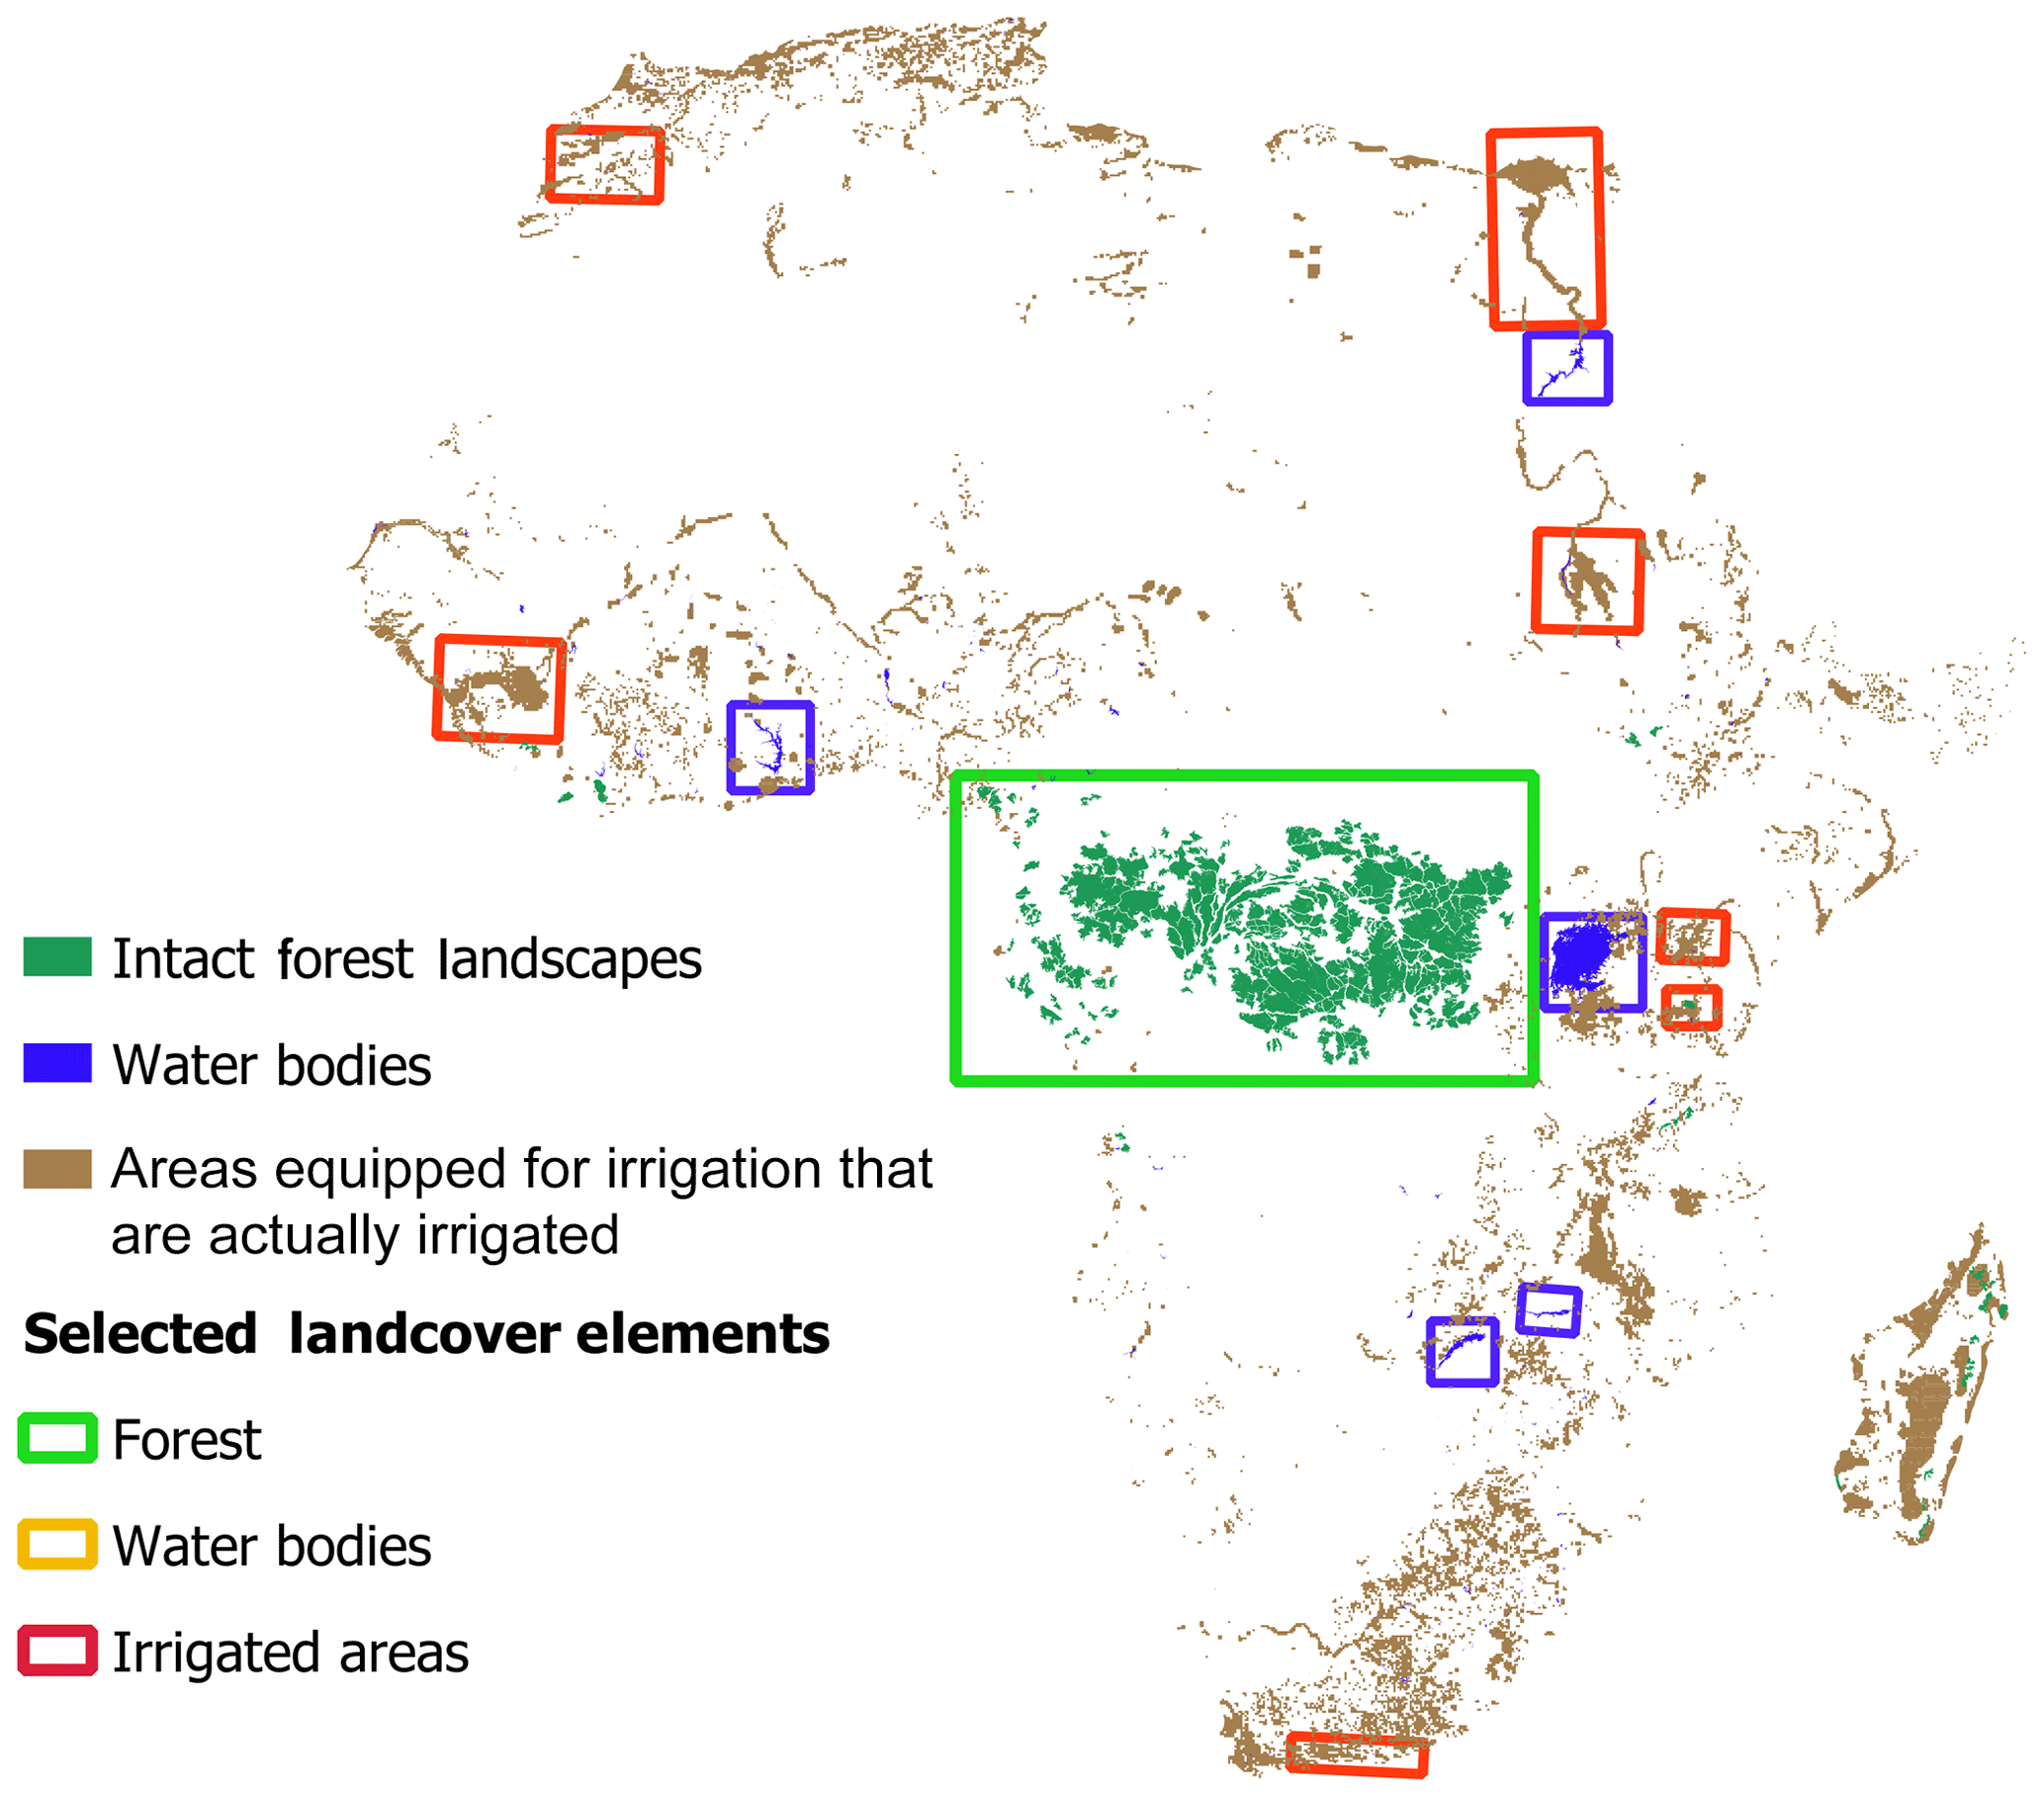
Figure 4IFL, WB GRanD and AEIai land cover element maps and areas selected for visual inspection.
For forested areas, the average ET was taken from the literature, where estimations for the Congo forest, the forested area being evaluated, were between 1200 and 1500 mm yr−1 (Otto et al., 2013; Reynolds et al., 1988). Therefore, a reference value of 1350 mm yr−1 was chosen for ET across the evaluated forested area. Mean values of ET for the forested area were found using the IFL shapefile and were recorded for each ET product. The bias between the reference ET as reported in literature and the calculated mean ET for forested areas for each product was found and recorded.
Ranking was conducted in two stages: firstly, on the performance of the ET products with respect to characterizing the three land cover element types through visual inspection; and secondly, based on the bias of each of the ET products in relation to the reference used for water bodies and forested area.
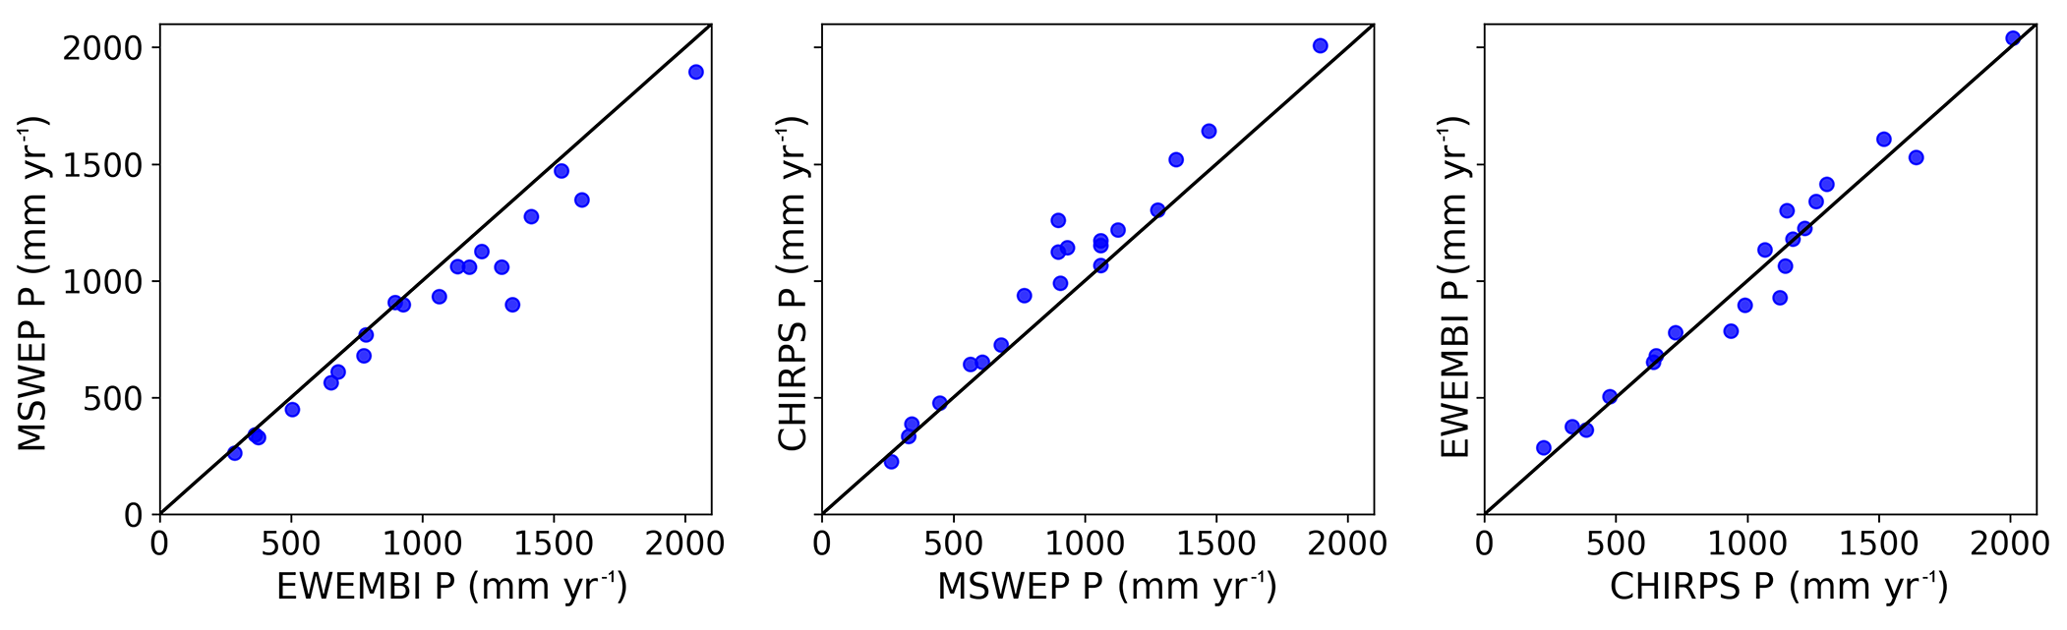
Figure 5Comparison of the EWEMBI, MSWEP and CHIRPS precipitation products with respect to their prediction of mean P across the basins.
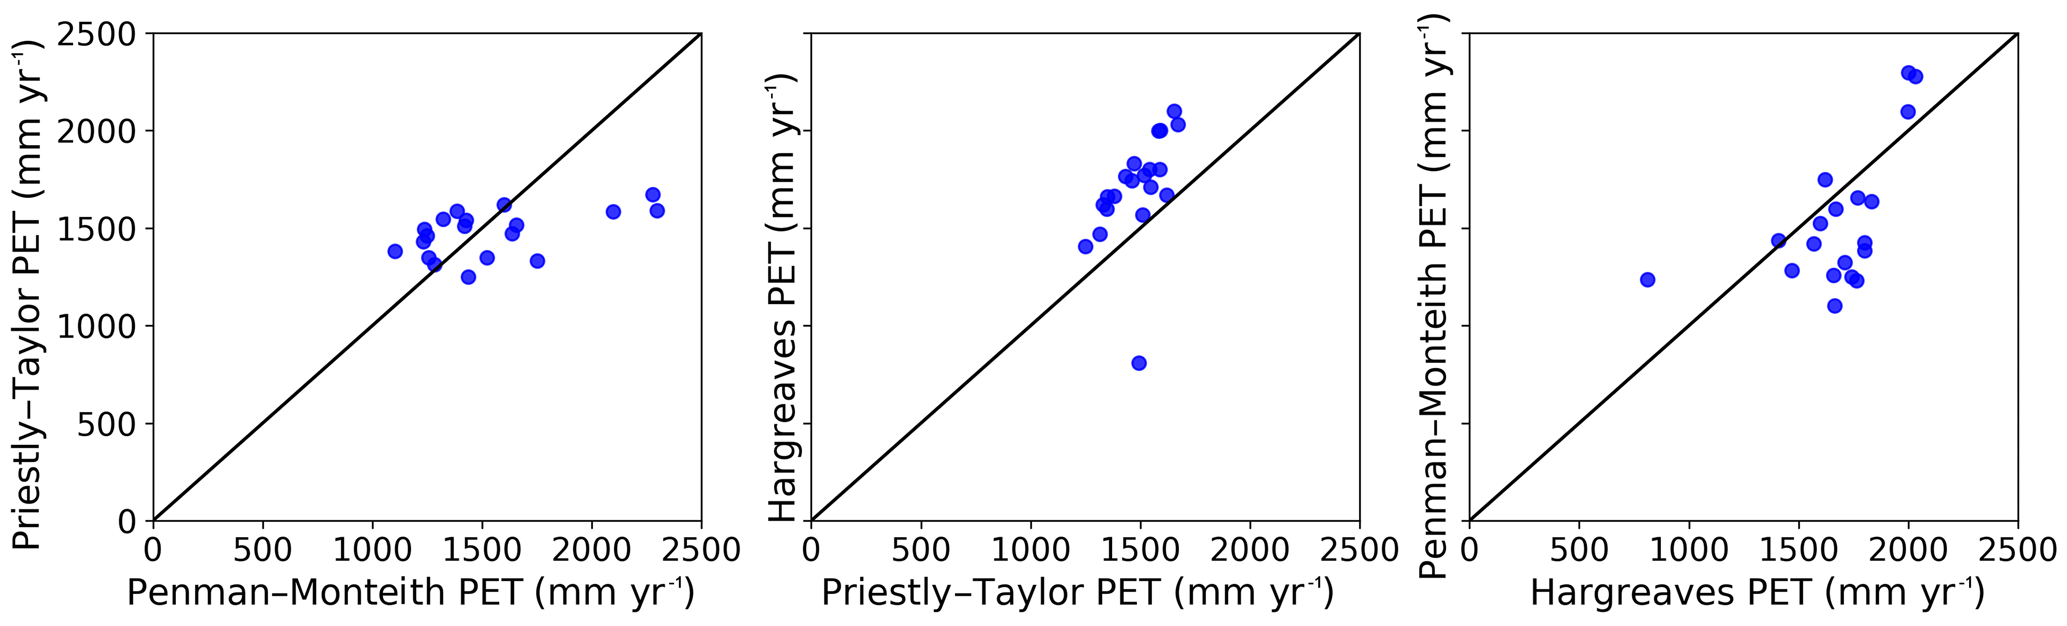
Figure 6Comparison of the P–M, P–T and Hargreaves potential evapotranspiration products with respect to their prediction of mean PET across the basins.
2.2.4 Assessment of similarity
Lastly, a cluster analysis was performed, using the method followed by Wartenburger et al. (2018), on the ET products to find the overall level of similarity between the individual products in terms of spatial variability and magnitude. The aggregated long-term average maps for all products were used, whereby the pairwise Euclidean distance between each data set for each pixel was calculated and evaluated. Each of the maps used were resampled to for computation efficiency.
3.1 Catchment water balance
3.1.1 Comparison of precipitation and potential evapotranspiration products
Precipitation and PET were taken as the average of three products. Here we compare the results of the different P and PET products for the basins analysed. We see that the three precipitation products show little differences in their estimations of long-term average P across the basins. No large outliers can be seen (Fig. 5). The comparison of the three PET products showed larger differences in their estimations of long-term average PET across the basins (Fig. 6). One significant outlier can be seen for Bandama Basin, where the Hargreaves PET product has a much lower PET estimation than the Priestly–Taylor product. However, as no reference PET was available for Bandama or any of the other basins, we kept all basins within the analyses and still used the average of all three products.
3.1.2 Basins used in the analyses
Figure 7a shows the long-term average ETWB estimates for the 27 basins with available discharge and precipitation data. The spread of the ET across the basins seems to be consistent with the African climate, where basins in the semi-arid to arid northern and southern parts of Africa show lower ET than the more centrally located basins that are known to be more tropical.
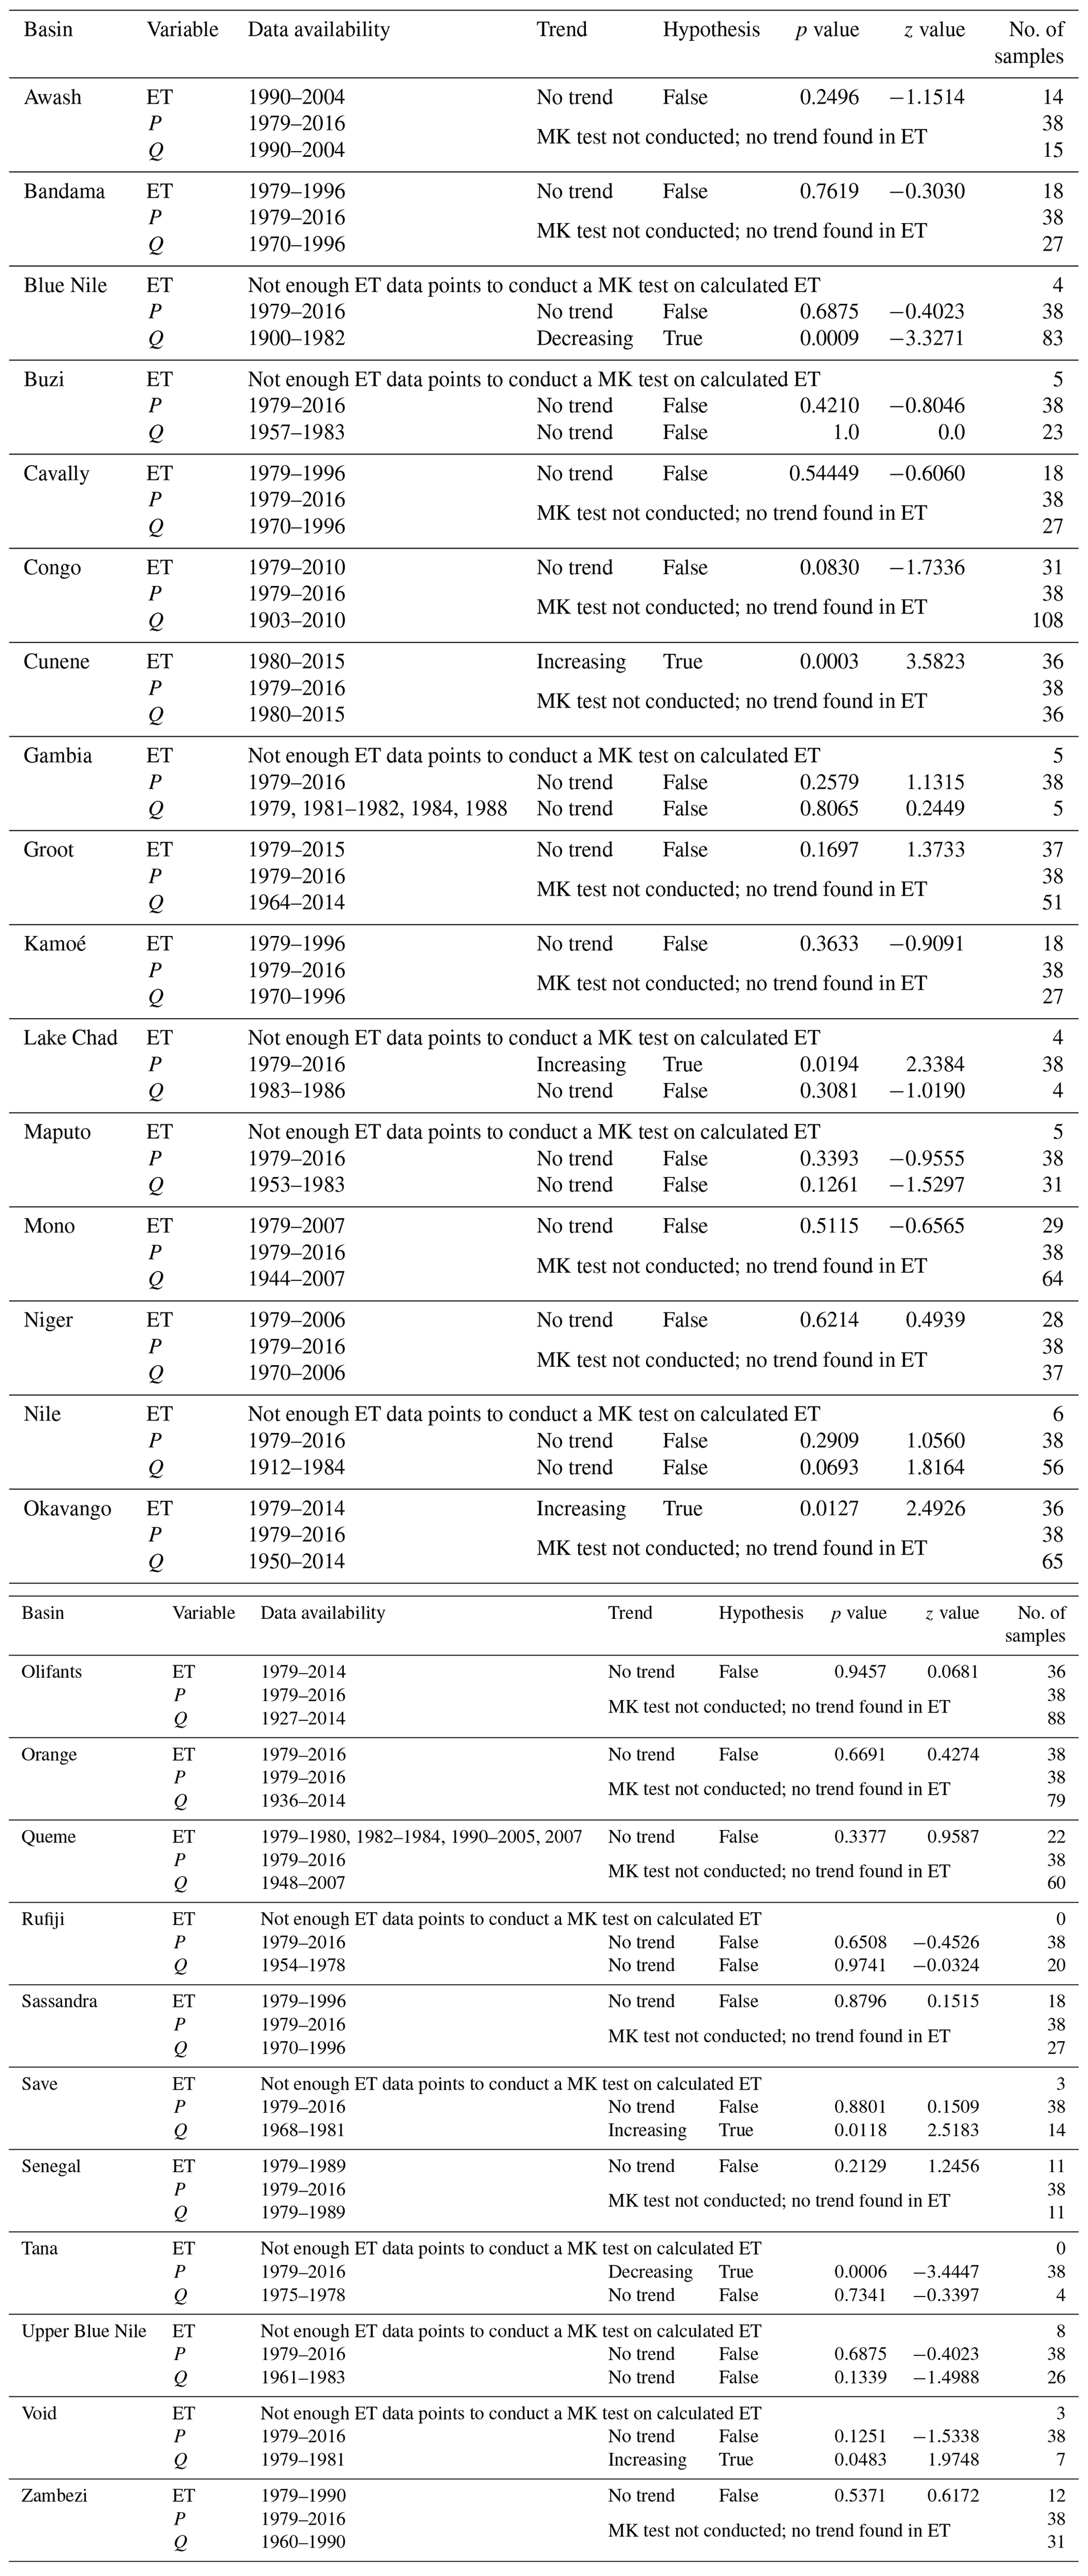
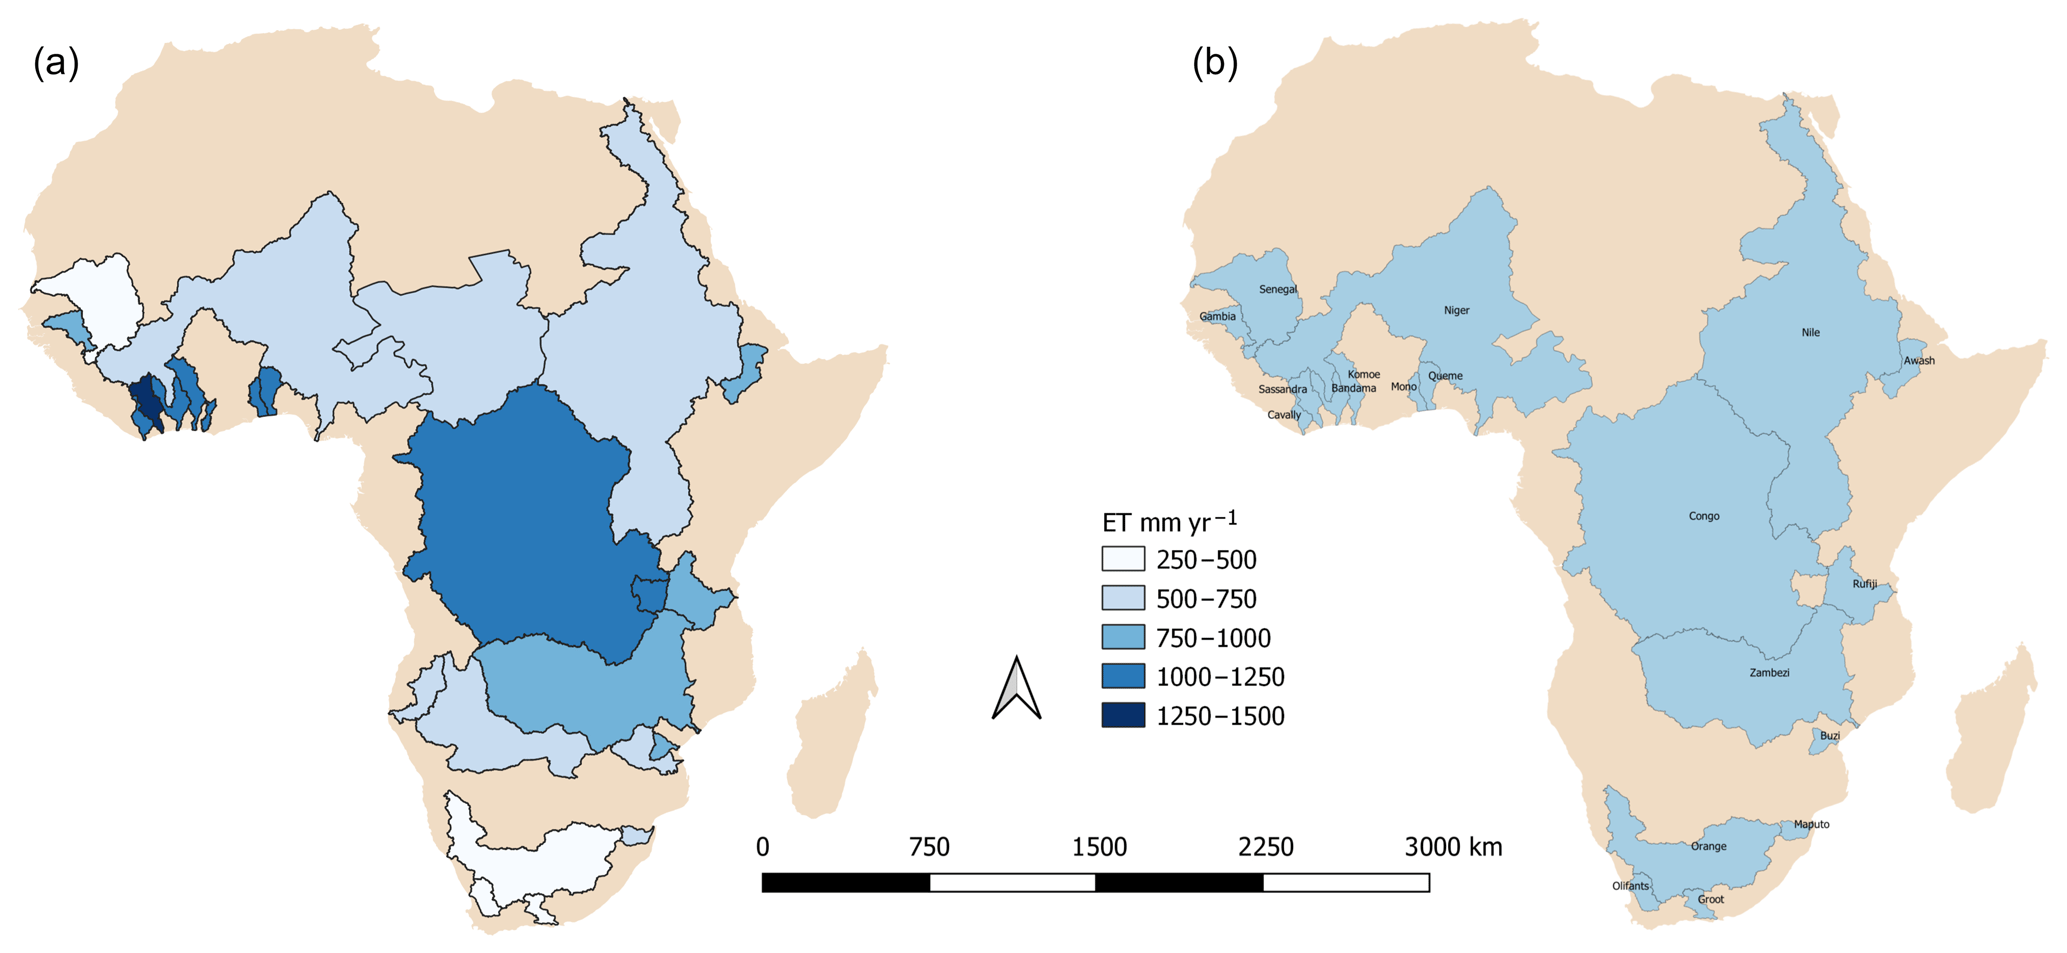
Figure 7(a) ETWB estimation for 28 major basins in Africa using P−Q. (b) The final basins analysed after analyses to discount basins with trends in ETWB, P and/or Q.
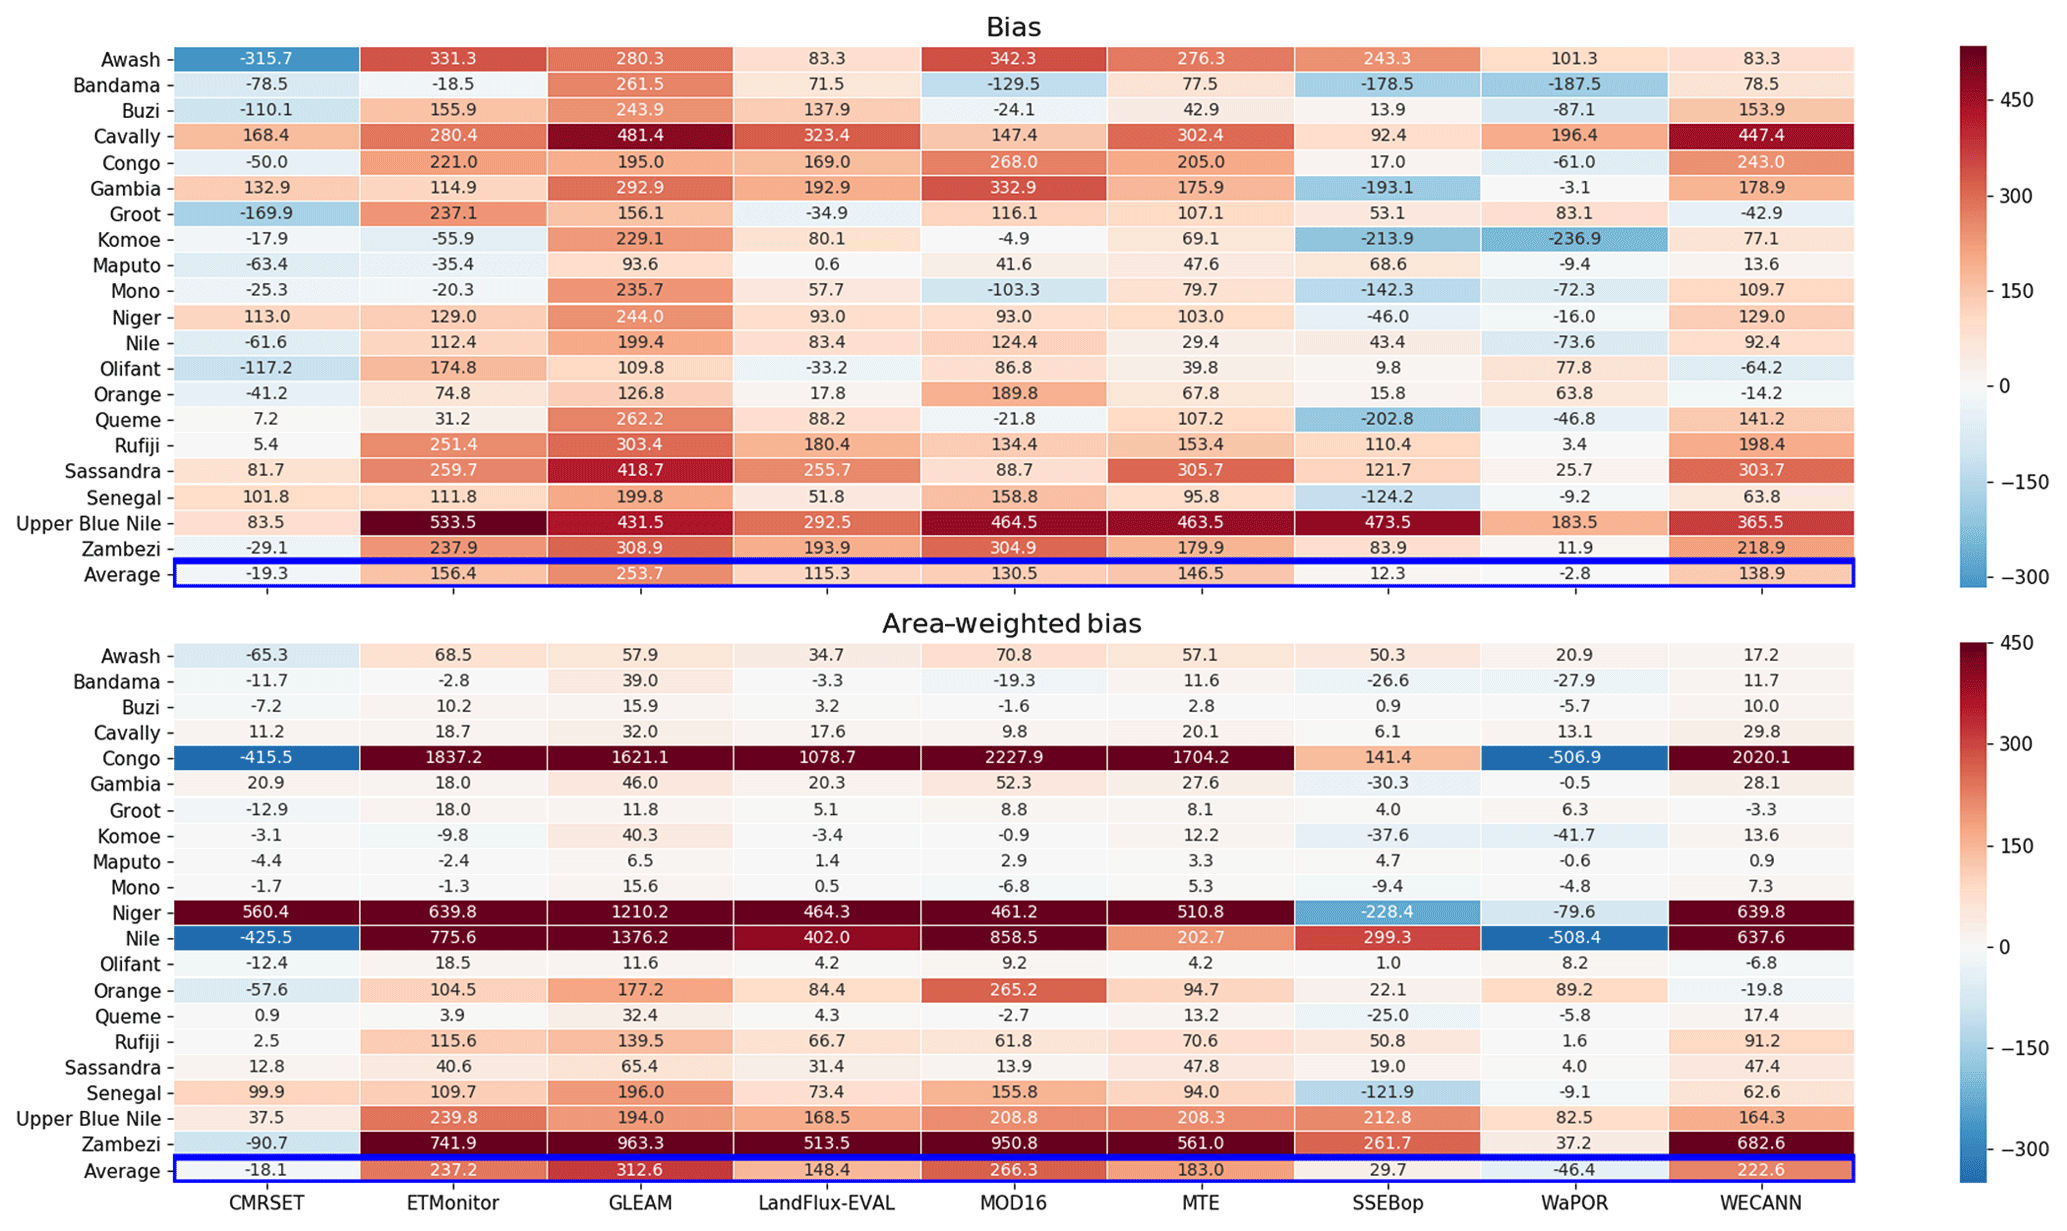
Figure 8Bias and basin area-weighted bias between the long-term annual average calculated ETWB and ETRS for all basins and the average of the 20 basins.
The MK test was then conducted on the 27 basins with calculated ETWB to test for trends. In order for the MK test to be accurate, a minimum of 10 data points are required, which were not available for all basins. For these basins, the MK test was conducted on the collected P and Q data used to calculate ET. For the results of the MK test, please see Table 6. After conducting the MK test on the 27 basins for major trends in the calculated ETWB and/or the precipitation and discharge data, 20 basins remained that did not show a monotonic trend (Fig. 7). The spread of the remaining 20 basins still gives good spatial coverage for analysis across the African continent.
3.1.3 Catchment water balance comparison
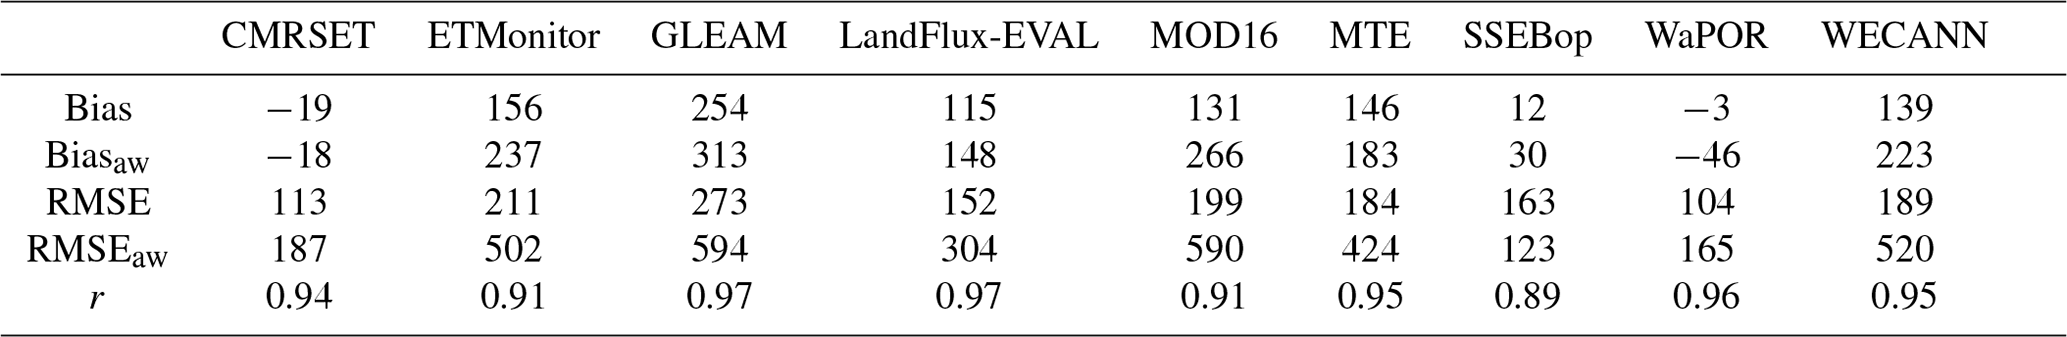
Table 7 shows the calculated statistics for the comparison of the long-term average ETWB with ETRS across the average of all basins. Three products, CMRSET, SSEBop and WaPOR, clearly stand out in terms of showing low biases that range from 3 to 46 mm yr−1. The remainder of the products have relatively large biases that range from 115 to 313 mm yr−1. CMRSET and WaPOR are the only two products that overestimate ET with respect to the calculated ETWB, while all other products underestimate ET when looking at the average bias across all basins. All products show a high RMSE, with CMRSET, SSEBop and WaPOR showing the lowest RMSE and RMSEaw. The RMSEaw for most products exceeds 300 mm yr−1. There is a significant positive correlation for all products that ranges from 0.89 to 0.97, with GLEAM and LandFlux-EVAL showing the strongest relationships with ETWB across the different basins.
Delving deeper into the biases (Fig. 8), we can identify certain basins where most products have large biases, namely Awash, Groot, Niger, Olifants and the Upper Blue Nile. The only pattern that may be seen here with the location of the basins is that they are found in the semi-arid northern and southern regions of Africa. The majority of the products underestimate the basin-averaged ET across most basins; however, CMRSET and WaPOR mostly overestimate ET, and the ET is equally over and underestimated by SSEBop across the different basins.
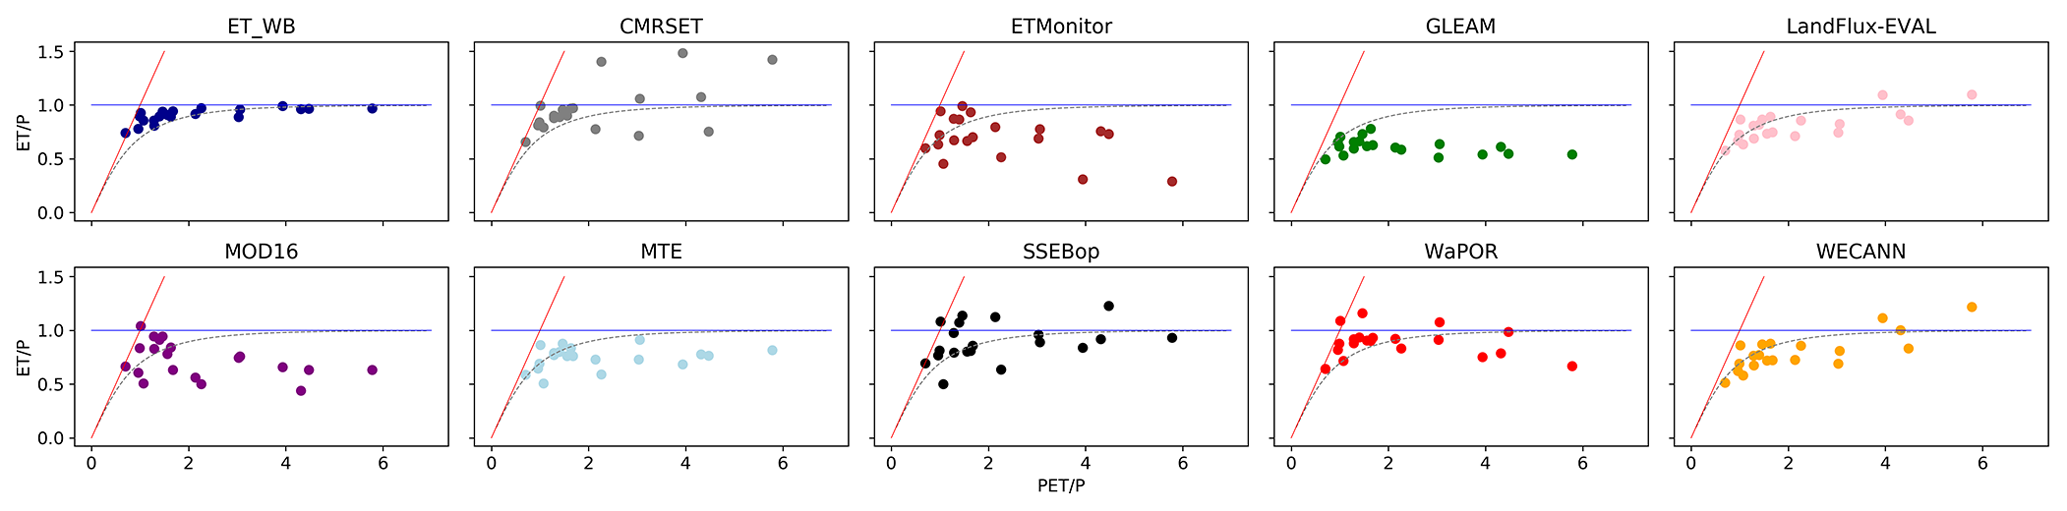
Figure 9Evaluation of the calculated ETWB and ETRS from products using the Budyko curve calculated using the average P and PET from three products.
Table 7Calculated statistics, including the bias, biasaw, RMSE, RMSEaw and r, for the comparison of the long-term annual average ETWB with ETRS.

3.2 Evaluation using the Budyko curve
Figure 9 shows the ability of each ET product to capture ET according to the Budyko curve. The ETWB follows the Budyko curve well: the calculated ETWB falls very close to the Budyko curve for each of the basins. The calculated ET for most of the ET products and also for the majority of basins falls under the curve, showing a tendency for products to underestimate basin ET, as has been previously observed. Conversely, the clear tendency of the CMRSET product to overestimate basin ET can be seen. What is interesting to note here is that some ET products exceed either the water limit and/or the energy limit in their calculation of ET in certain basins. This implies that water is being lost, for example through the groundwater system when the energy limit is exceeded, or that there is an additional input of water beyond precipitation if the water limit is exceeded. SSEBop, WECANN and CMRSET exceed the water limit in more basins relative to other products; however, their ET estimations are not necessarily further from the ET estimations using the Budyko approach, as given by Eq. (2). This is confirmed in Table 8 where CMRSET, SSEBop and WaPOR have the lowest biases when compared with ETBudyko after ETWB.
3.3 Spatial variability assessment
Figure 10 shows the ET across Africa for all ET products with the specific land cover elements (forest, irrigated areas and water bodies) highlighted. Two different scales are used in order to be able to visually compare the products according to spatial variability rather than the magnitude of ET. For products where large biases were found, a scale of 0–1200 mm yr−1 was used, whereas for the remaining products, a scale of 0–1800 mm yr−1 was used. Visually, all products capture the forested area. Irrigated areas are also captured well by most products; however, GLEAM and LandFlux-EVAL do not capture the majority of the selected irrigated areas. CMRSET, ETMonitor, SSEBop and WaPOR capture most of the selected irrigated areas, whereas the remaining products capture a few. GLEAM, LandFlux-EVAL, MOD16, MTE and WECANN only estimate land ET and, thus, do not report ET across water bodies. The remaining products capture the water bodies well, with CMRSET and ETMonitor showing larger differences in their estimations of ET across water bodies than the surrounding areas; the differences in estimations with the surrounding areas are also larger than those of SSEBop and WaPOR. A ranking based on the visual inspection of how well each ET product captures the selected land cover element can be found in Table 9.
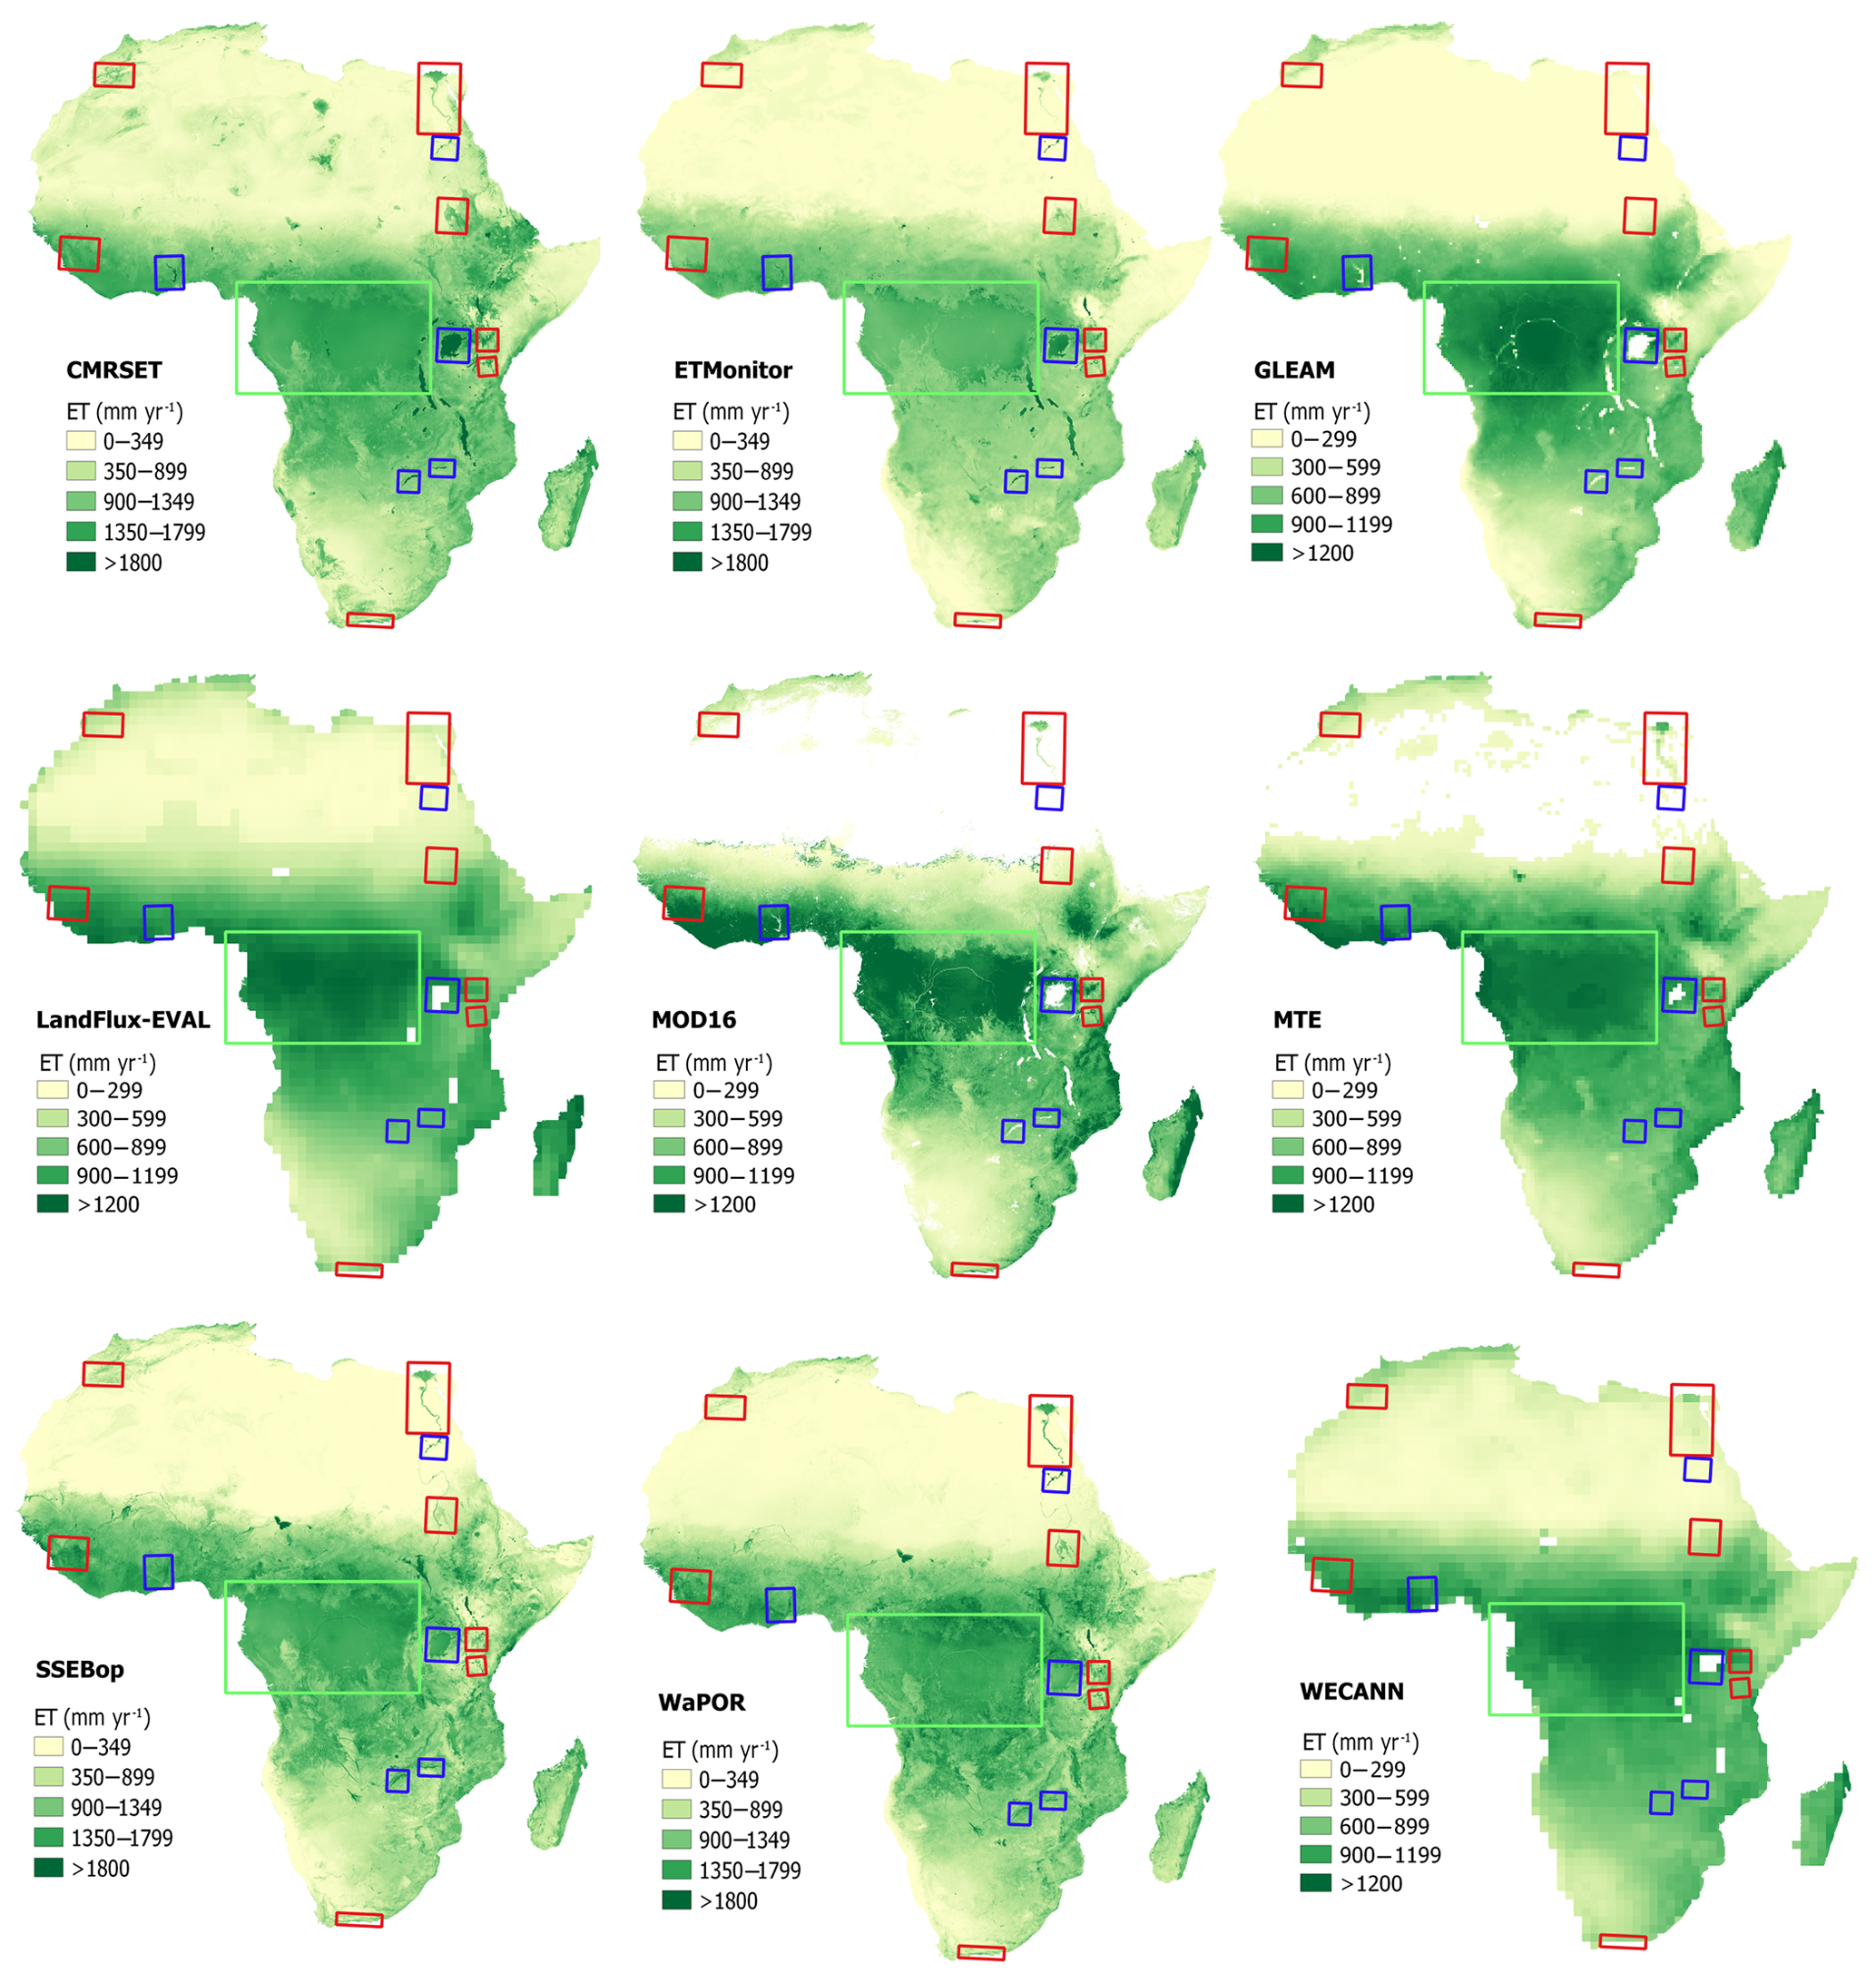
Figure 10Spatial assessment of each ET product based on selected land cover elements, forest, irrigated areas and water bodies across Africa. Red boxes indicate irrigated areas, blue boxes indicate water bodies and green boxes indicate forested areas.
Table 9Ranking of the ET products based on the different evaluation steps in the proposed methodology.
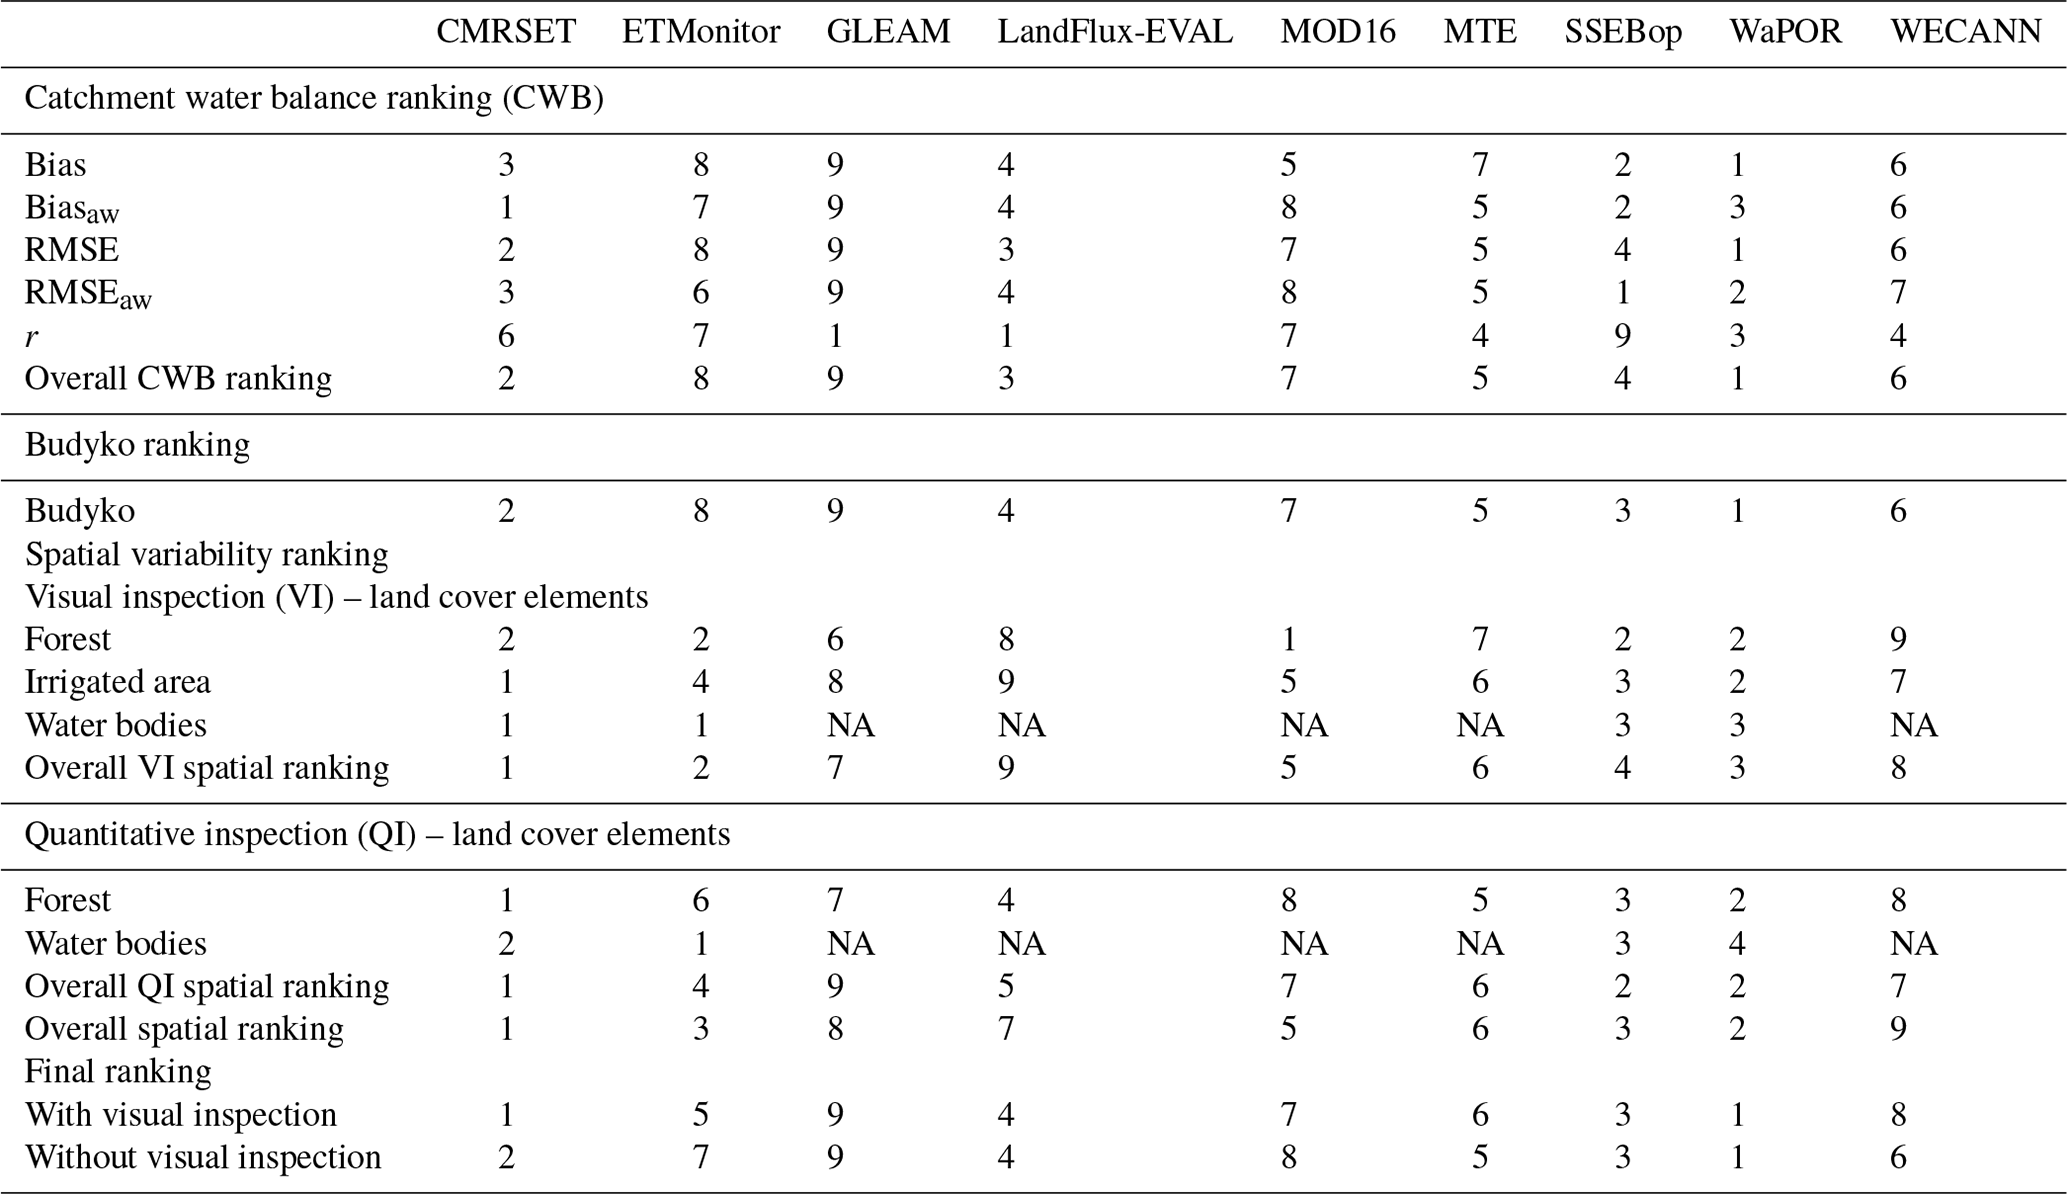
NA means for not available.
Figures 11 and 12 show the bias between the mean ET across the forests and water bodies estimated by the ET products and the reference ET used for each element. All ET products capture ET across the selected forested area, although some perform better than others at describing the magnitude. CMRSET, SSEBop and WaPOR have very low biases with respect to the reference found in the literature, whereas MOD16 and WECANN have the largest biases. All products underestimate ET across the forested area with respect to the reference used. The four products that estimate ET across water bodies show relatively low biases with the reference PET. CMRSET overestimates ET, whereas ETMonitor, SSEBop and WaPOR underestimate ET on average across water bodies. The lowest bias for water bodies is found in ETMonitor.
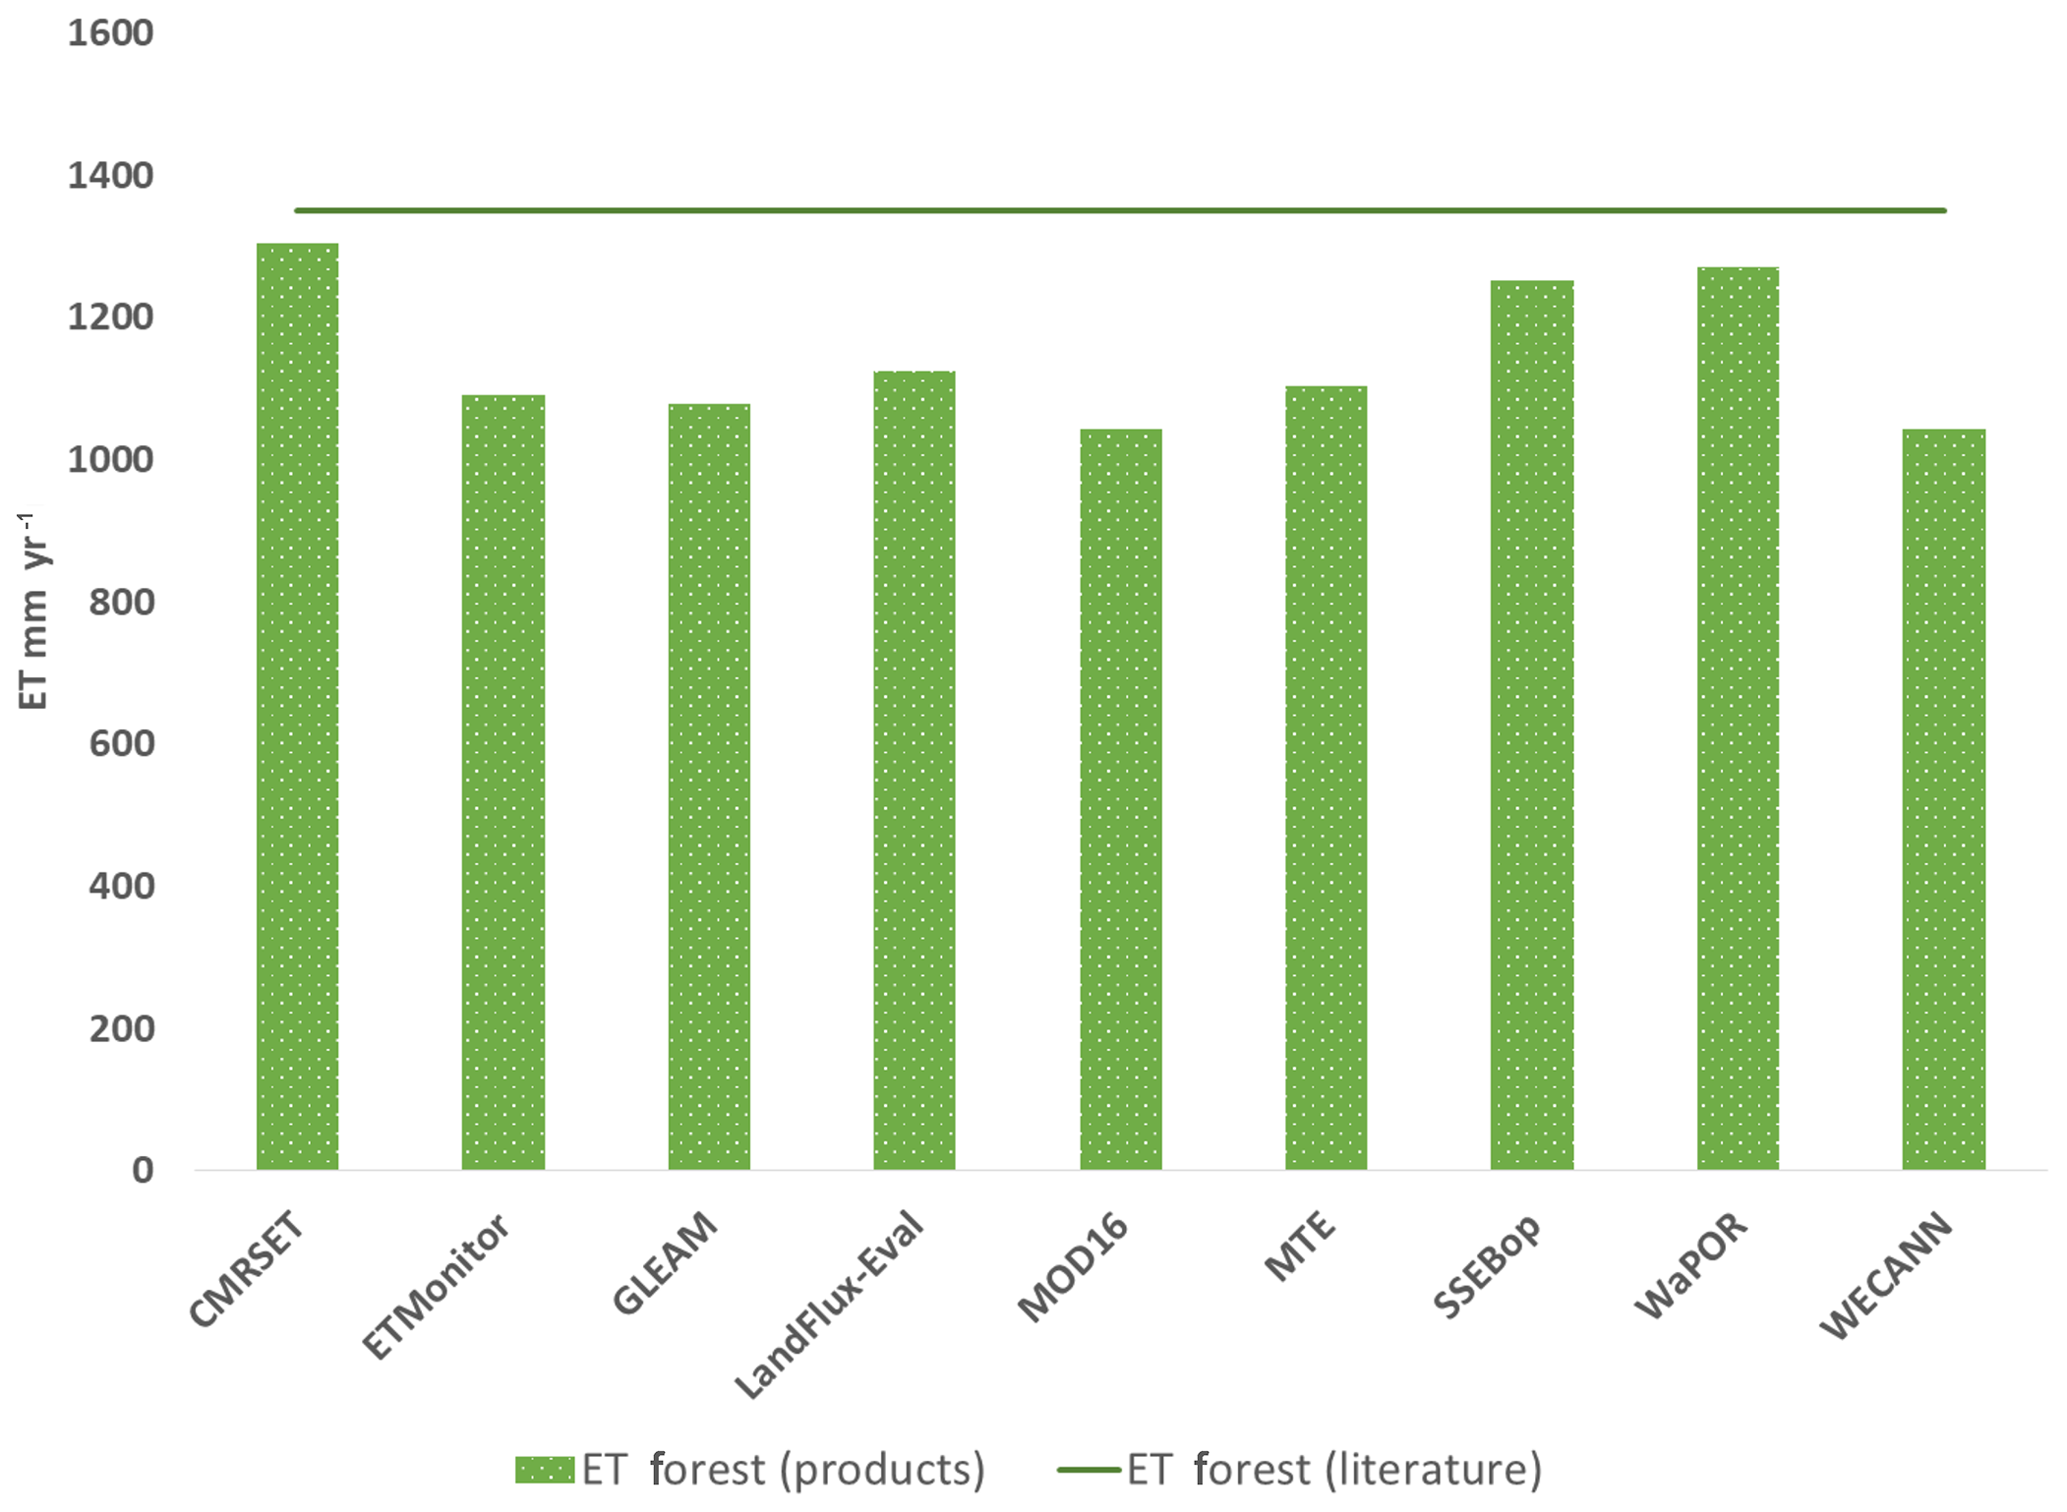
Figure 11Comparison of mean ET across the selected forested area for each product versus the mean ET found from the literature.
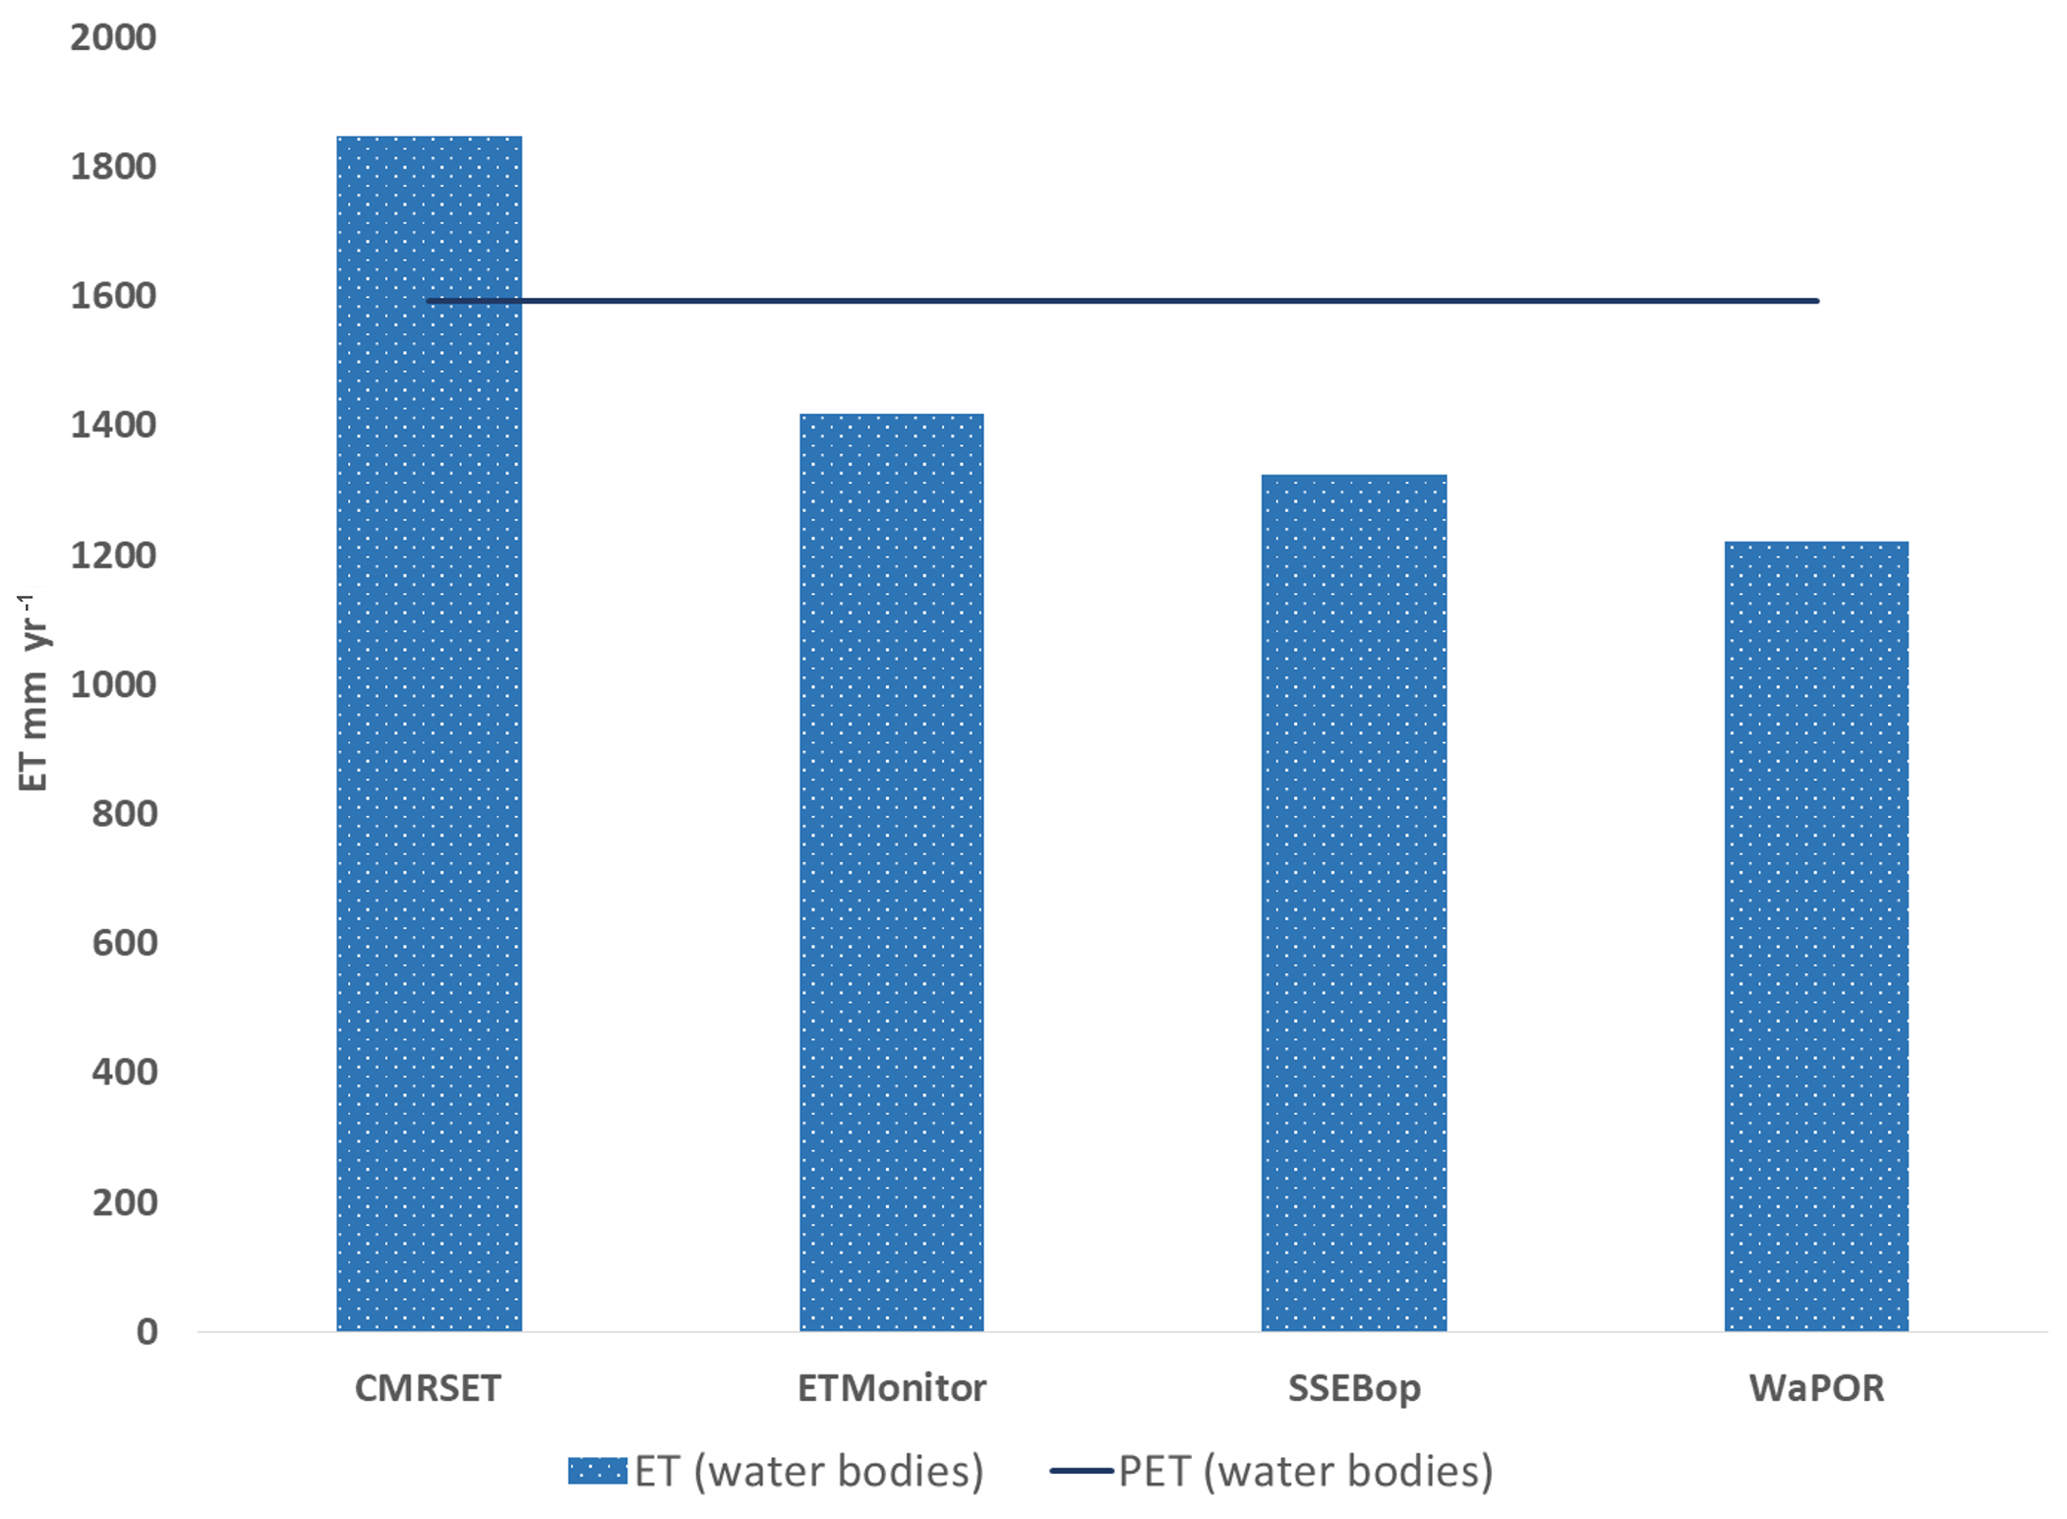
Figure 12Comparison of the mean ET across water bodies estimated by each ET product and PET using the average of three PET products.
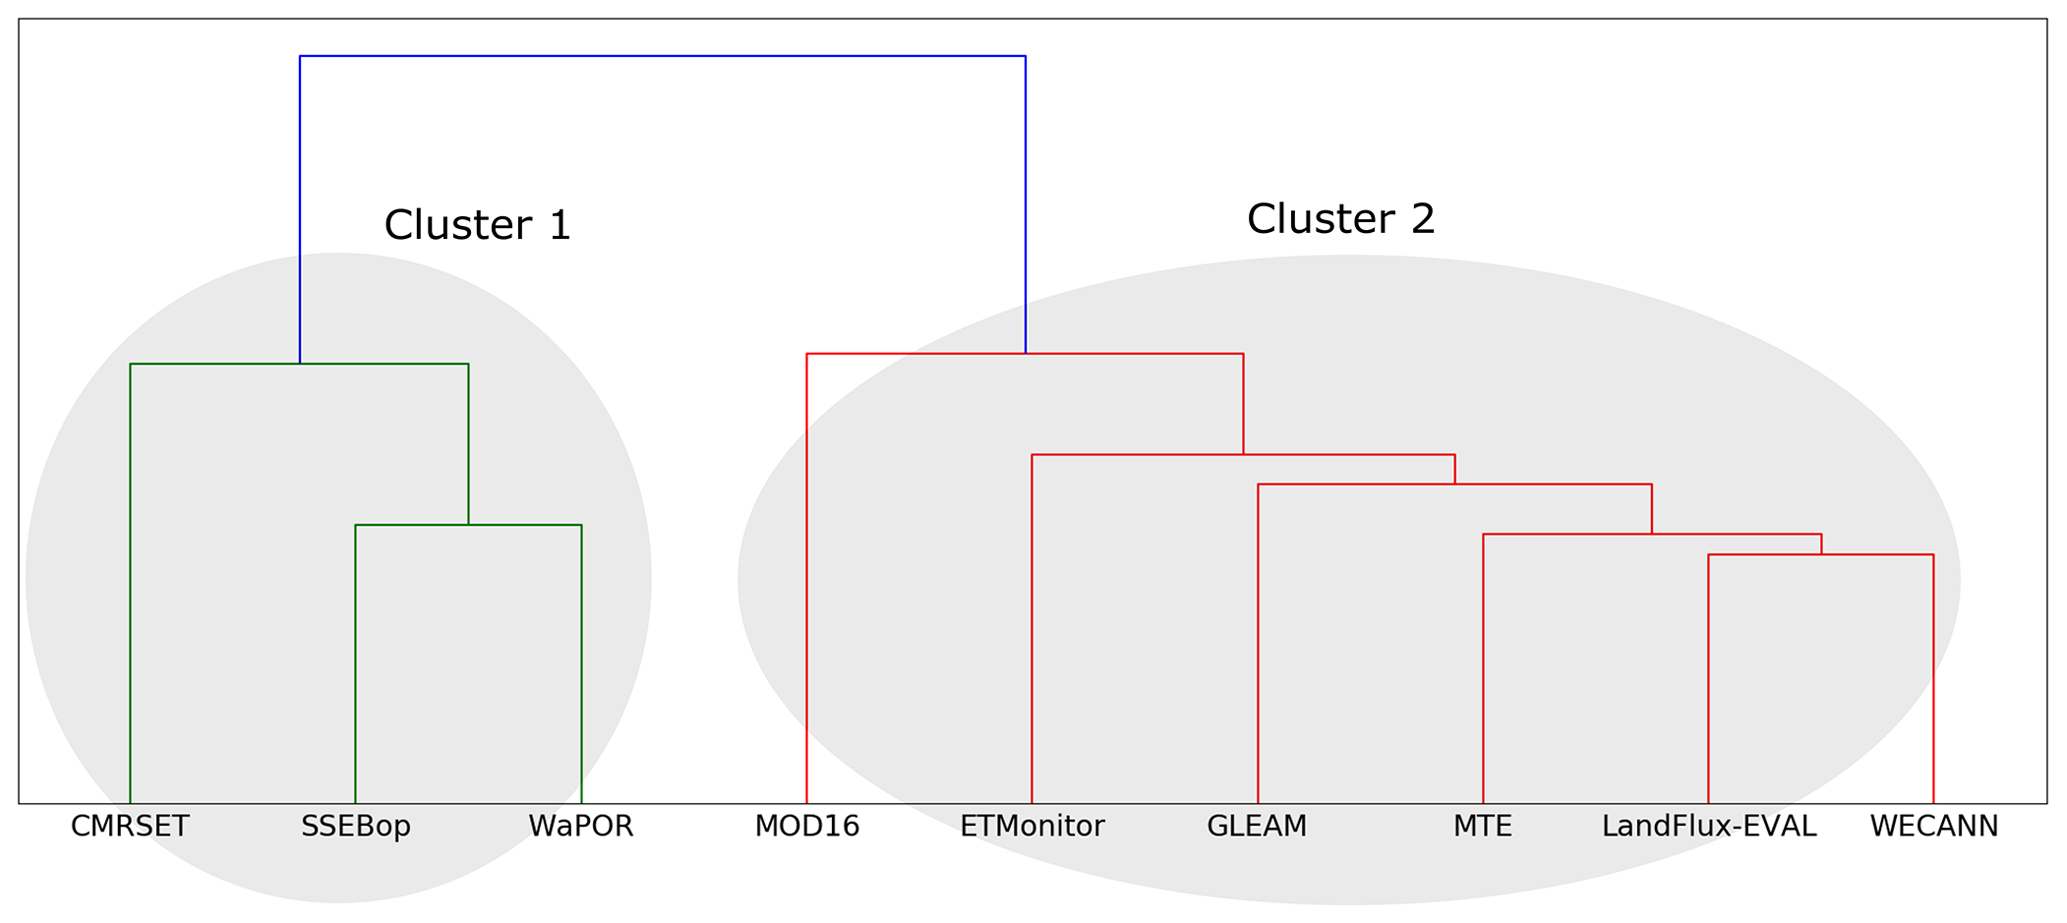
Figure 13Cluster analysis based on the pairwise Euclidean distance between each pixel for each ET product to assess overall similarity between data sets.
3.4 Product similarity assessment
Two groupings or clusters are observed when looking at the similarity between individual products (Fig. 13). We see one cluster formed from three products, CMRSET, SSEBop and WaPOR, with SSEBop and WaPOR being slightly more similar than with CMRSET; a second cluster formed with the remaining products. Within the second cluster, LandFlux-EVAL and WECANN show the highest level of similarity which also coincides with having the same spatial resolution.
3.5 Ranking of products
Table 9 shows the ranking of the ET products based on the different assessment criteria. First, we look at the ranking with respect to the statistics of the catchment water balance. In terms of the bias and biasaw, CMRSET, SSEBop and WaPOR are consistently ranked the highest, whereas GLEAM is ranked the lowest. When looking at the RMSE and RMSEaw, the same three products along with LandFlux-EVAL are ranked as the top four, whereas GLEAM is again ranked lowest. With respect to correlation, GLEAM and LandFlux-EVAL rank highest, whereas SSEBop is ranked the lowest. Overall, regarding the comparison of the ETWB and ET calculated by the products, CMRSET, LandFlux-EVAL, SSEBop and WaPOR rank the highest, whereas GLEAM and MOD16 rank the lowest. Second, we look at the comparison with the reference condition of the Budyko curve. Here, the same ranking pattern can be seen, with CMRSET, LandFlux-EVAL, SSEBop and WaPOR ranking the highest and GLEAM and MOD16 ranking the lowest. Third, we look at the spatial variability rankings. For spatial variability based on visual inspection, CMRSET, ETMonitor, SSEBop and WaPOR rank the highest, and LandFlux-EVAL and WECANN rank the lowest. For spatial variability based on quantitative inspection, we see that the same four products, CMRSET, ETMonitor, SSEBop and WaPOR, rank the highest, and GLEAM and WECANN rank the lowest. Overall, with respect to spatial variability, CMRSET, ETMonitor, SSEBop and WaPOR rank the highest, whereas GLEAM and WECANN rank the lowest. The final ranking was conducted with and without visual inspection. The top four products, CMRSET, LandFlux-EVAL, SSEBop and WaPOR, do not vary in the two ranking schemes. GLEAM is also ranked lowest in both ranking schemes. Interesting, however, ETMonitor ranks higher when visual inspection is included, whereas WECANN ranks higher when visual inspection is excluded.
Table 10Differences in mean ETWB estimations for varying RS product periods.
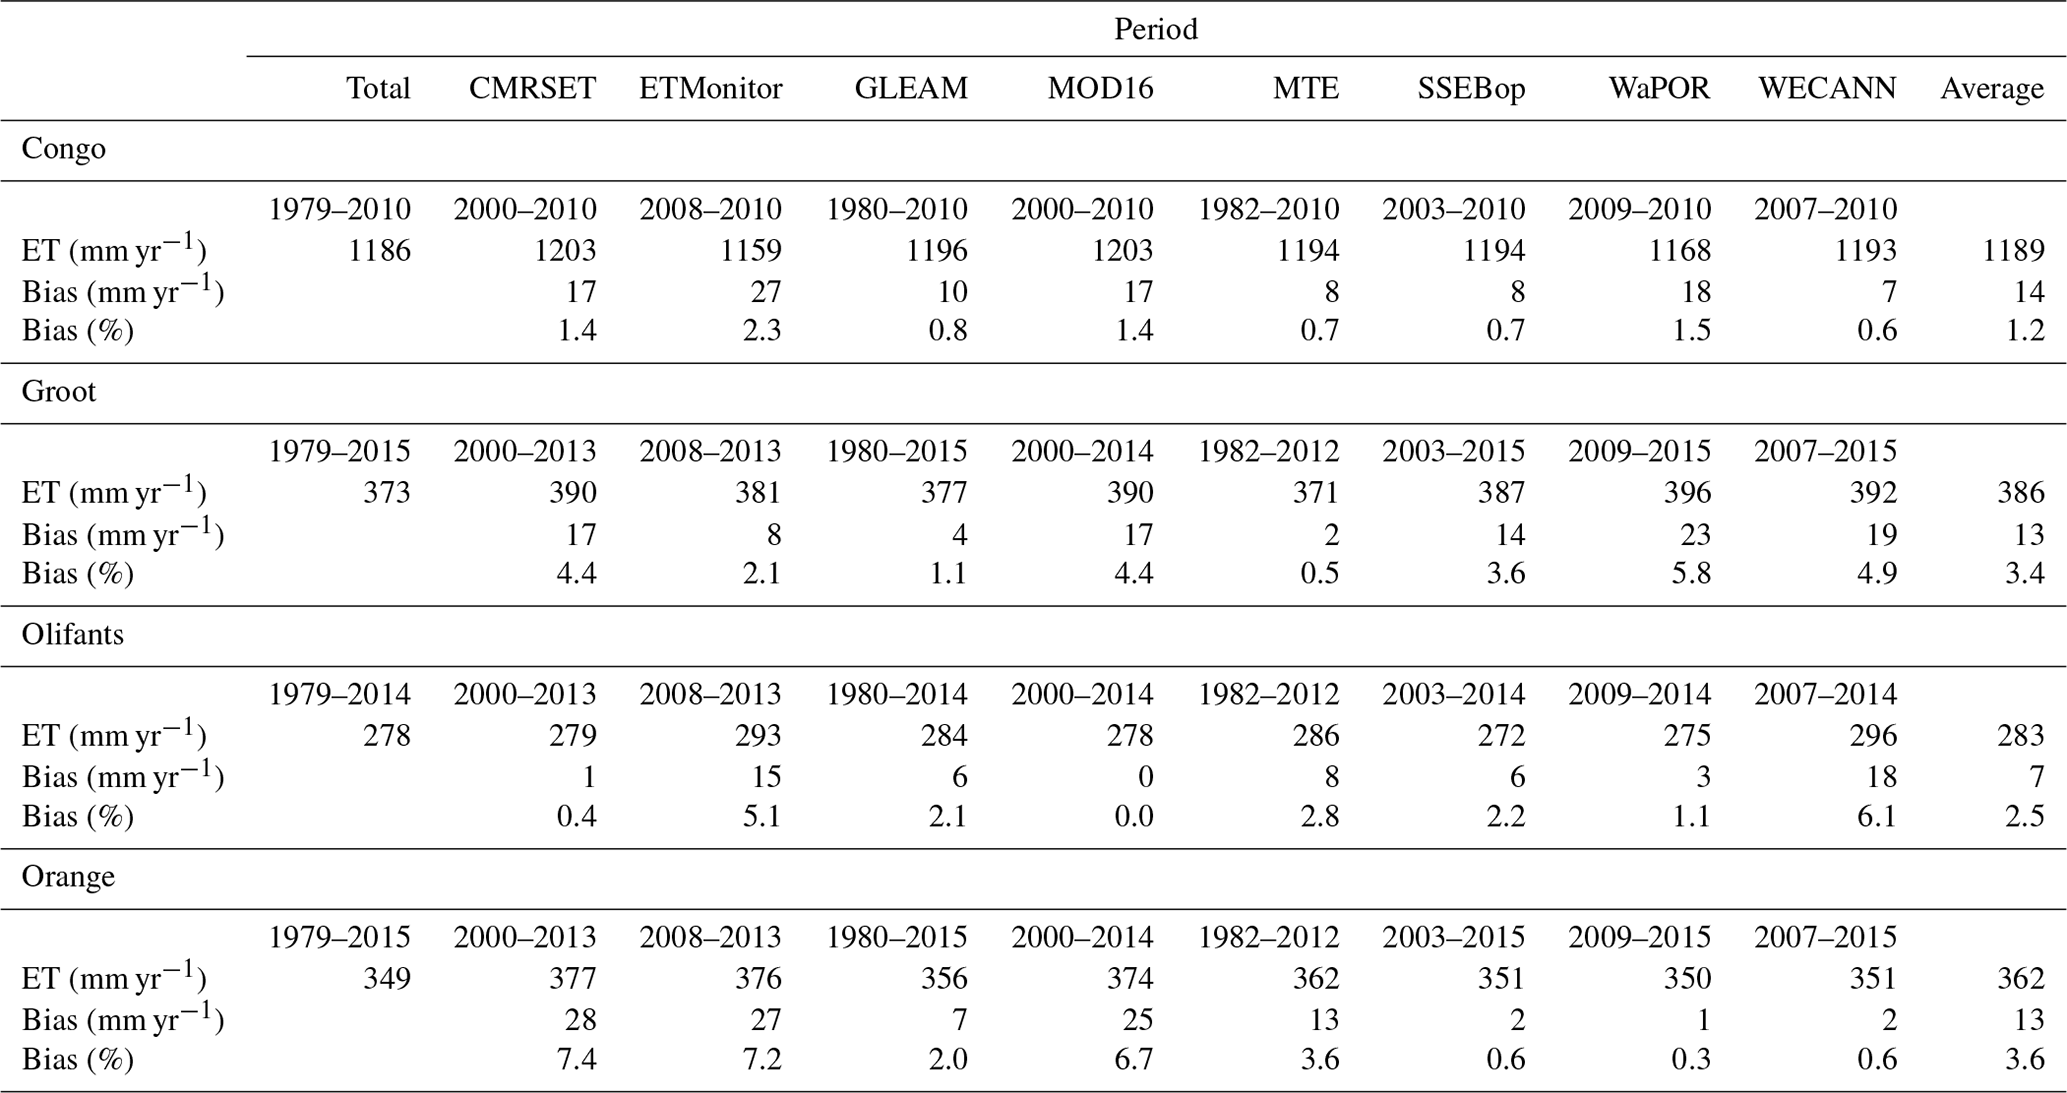
We make two assumptions in this paper regarding the methodology applied for evaluating the selected ET products. The first assumption is that if no trends are present in the long-term average ETWB across a basin, the long-term average ETWB across basins can be compared using different time periods. This is true if long-term trends in global ET are not visibly present. However, Jung et al. (2010) claim that there have been declining trends in global ET estimates in the recent past in association with the last major El Niño event in 1998, with the largest regional contributions to the declining trend in Australia and southern Africa. The exact opposite effect is reported by Zhang et al. (2016), who describe significant increases in global land ET trends, especially in Australia and southern Africa. Other studies also focus on investigating trends in long-term ET and do not come to a consensus as to the cause or direction of the trend (Miralles et al., 2014; Douville et al., 2013; Jung et al., 2010; Zhang et al., 2016). With this in mind, it is difficult to assume that there is long-term global trend in one direction or another. For the first assumption to hold, we must also address the possibility that regardless of whether trends are present or not, the mean ET from one period may be different from that of another period due to precipitation variability. In this case we analysed four basins where the calculated ETWB estimations had a period sufficient enough to cover the time period of the range of the ET products evaluated. For the four basins, the ETWB was calculated for each of the different time periods of the ET products. We then found the bias from the calculated long-term average ETWB. In Table 10, we see that the percentage differences relative to the total basin long-term average ET range from 0 % to a maximum of 7.4 % for the four basins for all ET products. Thus, considering the lack of a consensus regarding the direction of the long-term global trend in ET and the very low differences in precipitation variability, in this study our assumption holds that if no significant trend can be found in annual long-term ET estimates, different time periods can be used due to the lack of overlapping data.
The second assumption is that the water balance can be simplified to Eq. (1), where the change in storage is negligible for long-term average estimates. Many studies make this assumption for long-term averages and basin-scale averages (Du et al., 2016; Taniguchi et al., 2003; Wang and Alimohammadi, 2012; Carter, 2001; Budyko, 1974). However a recent study by Rodell et al. (2018) quantified trends in terrestrial water storage using Gravity Recovery and Climate Experiment (GRACE) data for the period from 2002 to 2016. The largest annual trend found in this study is 20 mm yr−1 and, for the African continent, can be found across sections of the Congo, Zambezi, Okavango, Cunene, Save and Rufiji basins. Of these basins, the Okavango, Cunene and Save are not used in this study and are therefore not affected. Assuming a contribution of the largest trend in storage for the other basins, this represents a maximum of 2.3 % of the long-term annual average mean basin ET. Thus, we assumed negligible change in storage for our calculations.
The comparison between the RS products was carried out at the highest spatial resolution of the products utilized which was . As we are resampling from a coarse resolution to a higher resolution, the nearest-neighbour method (which was employed to complete the resampling) is sufficient, as the magnitude and spatial characteristics will not be altered or lost (Porwal and Katiyar, 2014; Gurjar and Padmanabhan, 2005). It must also be kept in mind that the initial spatial resolution and the temporal period under comparison are not the same for each product, and this may effect the ranking that we are considering. However, taking the fact that there are different resolution products available into account, this is an important feature in considering the ranking of products in terms of accuracy in order to make an educated decision on which product to use. Moreover, many of the products do not estimate ET across water bodies, and this may explain the large biases in certain products when comparing ET estimations with the ETWB estimations. Another aspect to bear in mind is that WaPOR, ETMonitor and WECANN have less than 10 years of total coverage with which to calculate their long-term average.
Evaluation of the spatial characteristics is completed using two steps: the comparison of land cover elements with reference estimates and visual interpretation. There are two issues involved in this spatial comparison. Firstly, the evaluation takes place based on products that have different original resolutions. Thus, the view that higher resolution products may outperform coarser resolution products, which is generally the case. However, we can also see that coarser resolution products, namely LandFlux-EVAL and, in certain cases, MTE and WECANN, outperform the higher resolution GLEAM product. Thus, higher resolution products do not always outperform lower resolution products. The spatial resolution of the ET estimates used may also be a critical element in determining which product is of use for a specific requirement. Secondly, the visual interpretation can be viewed as quite arbitrary and subjective according to the evaluator's eye. However, by using land cover elements that are large and easy to visualize, such as forested areas, irrigated areas and water bodies, the relative subjectivity can be reduced.
We used the assumption that ET equals PET where there is ample water (McMahon et al., 2013) and, thus, applied this assumption to the evaluation of our ET products for water bodies. The assumption holds quite well for the products that estimate ET over water. There are several reasons why it is difficult to find a quantitative reference for irrigated areas at such large magnitudes. Firstly, it is difficult to assume that there is no mixing and that only irrigated areas are found in pixels with a minimum size of 250 m × 250 m. Secondly, an irrigated area of a particular size is often growing more than one crop in reality, which is difficult to measure or map. A reference that could be utilized in subsequent studies would be water productivity – biomass/water consumed (ET) – for comparison.
The overall ranking for each product was based on the average ranking of the different comparative elements. An overall ranking was performed including the visual inspection of the land cover elements; however, a ranking was also performed without visual inspection, due to the subjectivity of the analyst carrying out the inspection. This does not affect the ranking of the top four or the lowest ranked products, but it changes the order of the products ranked in the middle. WaPOR, CMRSET, SSEBop and LandFlux-EVAL are consistently ranked 1, 2, 3 and 4 respectively. CMRSET and WaPOR rank first when including a visual inspection, although only WaPOR ranks first without visual inspection. The lowest ranked product is GLEAM in both cases. WECANN ranks higher without visual inspection, going from position 8 to 6, and ETMonitor ranks lower without visual inspection, going from position 5 to 7.
Looking at the overall level of similarity between the products in Fig. 5, we can see that for the cluster including CMRSET, SSEBop and WaPOR, all products use MODIS as an input. SSEBop and WaPOR both use the P–M method for the calculation of ET, whereas CMRSET uses the P–T method. ETMonitor and MOD16 also use MODIS as an input, with MOD16 using the P–M method for ET calculation and ETMonitor using both the Shuttleworth–Wallace and the P–M methods, although both products are found in the second cluster. The remaining products within the second cluster use different inputs and different ET estimation methods. Thus, no patterns can be inferred through cluster analysis by looking at the input or ET calculation method. What is clear is that the first cluster contains the products that have the highest spatial resolutions and that rank highest overall in terms of ET estimation based on the evaluation criteria.
In terms of consistency of the results with previous studies conducted on some of the products under evaluation, we see similar tendencies. According to Miralles et al. (2016), GLEAM, MOD16 and other products show divergences under water stress and drought conditions. Considering that large parts of Africa are potentially under water stress due to the semi-arid and arid climate (IPCC, 2019; World Bank, 2018), this could explain the low ranking of GLEAM and MOD16 in this study. The RMSE and bias values found in our study for Africa are comparable with those found by Vinukollu et al. (2011b) at the global scale; however, Vinukollu et al. (2011b) utilized different products to those compared in this study. The range is higher in this study for Africa than the range found at the global scale. In their study, Trambauer et al. (2014) found that GLEAM underestimates ET in terms of the multiproduct mean. This is again consistent with our findings: biases in GLEAM showed large underestimations across the basins in Africa with respected to the calculated ETWB. We used the LandFlux-EVAL benchmark product as an ensemble product without calculating the multiproduct mean of the products being used in this study, as it was developed using a large range of ET products. LandFlux-EVAL, which has the coarsest spatial resolution, ranked fourth in the final ranking and was only outranked by the products with the three highest spatial resolutions in this study, CMRSET, SSEBop and WaPOR. Therefore, LandFlux-EVAL generally performs well regardless of its coarse resolution and is interesting as it is an ensemble product. Therefore, the continuation or commencement of a similar initiative to develop a benchmark product using a range of ET data sets including the high-resolution products ranked within this study may improve the ensemble product for future use.
It is also important to note that the overall ranking is interesting for global- or large-scale regional modellers; however, for catchment studies, a detailed look into their basin(s) of interest and local elements should also be considered. For example, if we look at the basin-level bias and the area-weighted bias (Fig. 8) for three of the large basins in Africa (the Congo, the Nile and the Niger basins), the following products have the lowest biases in the specified order: for the Congo Basin, SSEBop, CMRSET and WaPOR; for the Nile Basin, MTE, SSEBop and CMRSET; and for the Niger Basin, WaPOR, SSEBop and MOD16. This shows that a detailed look into the local characteristics of a particular basin is required before selecting a product for use. Due to the limited overlap between discharge data and ET estimations by the products, temporal evaluations were not possible. It would also be interesting and valuable to see which products capture temporal trends that may also effect the choice of a product.
This study focuses on the question of whether or not we can trust remote sensing and other ET products over Africa. By trying to overcome the problem of the lack of data for validation and evaluation purposes, the methodology used can identify which products perform well in terms of biases and spatial characteristics. Using observations of discharge and observation-based precipitation products to infer long-term average mean ET estimates at the basin scale and overcoming the lack of overlapping data for comparison by using different time periods for the calculation of our long-term averages, different ET products were evaluated. According to the comparison of the ETWB with the ETBudyko, we see that ETWB follows the Budyko curve and has an overall low bias across the basins. This indicates that the calculated ETWB is a sound reference condition to use for analyses. Based on the different elements analysed, CMRSET, WaPOR and SSEBop capture the magnitude of ET, showing small biases in the long-term average mean ET across basins. The same products also capture the spatial distribution of the ET patterns well along with ETMonitor. Apart from the visual inspection, the ensemble product LandFlux-EVAL consistently ranks fourth or higher, acting as a bridge between the products with the highest spatial resolutions and others. The high correlation statistics indicate good spatial distribution in all products, especially GLEAM and LandFlux-EVAL that rank the highest. However, nearly all products show relatively large biases in ET estimations, except CMRSET, SSEBop and WaPOR. It is difficult to come to a concrete judgement as to the reasons behind the differences among the ET products. A big difference between the top three ranked products and the others is the high spatial resolution as well as the estimation of ET as a whole rather than only land ET in most other cases. However, no pattern can be found between the product ranking and the forcing or the ET calculation methods. There are also certain advantages and disadvantages to the products outside of the evaluation criteria which are important to name. Although GLEAM is ranked lowest overall, the product has the longest temporal coverage: coverage begins in 1980 and is ongoing. LandFlux-EVAL and MTE also have early starting years, although they are only available until 2005 and 2012 respectively. ETMonitor is also no longer being extended and is not openly accessible or available for use. WaPOR is only available for Africa and cannot be globally compared to other products. Therefore, if we answer our question of whether remote sensing estimates of ET across Africa can be trusted, the answer is not black and white. Yes, in general we can trust the products under evaluation in this study. CMRSET, WaPOR and SSEBop show low biases in estimations and a good spatial distribution of ET patterns. Each of these products have relatively high resolutions, and both CMRSET and SSEBop are global products. Depending on the study under question, with respect to whether an early and long time period is needed, whether a higher or lower resolution is required, whether the work is focused on a global or regional scale or whether the study is only interested in land evapotranspiration, one product may be more suitable than another. However, a large consideration to be kept in mind for Africa is that the three highest ranked products, CMRSET, SSEBop and WaPOR, have low biases and perform well with respect to spatial variability; thus, they would suit most needs within a given study. However, for catchment-scale studies within Africa, a detailed look into the characteristics of the basin should be considered along with the overall ranking.
The openly accessible data used in this analysis are available from the first author upon request (imeshi.nadishka.weerasinghe@vub.be).
IW and AVG conceived and designed the alternate methodology for the evaluation of large-scale RS ET products. IW performed the required data analysis using scripts written by IW. IW and AVG prepared the structure of the paper. IW wrote the initial draft of the paper. AVG and WB supervised the research and contributed to improving the paper prior to submission. MM also contributed to improving the paper prior to submission. LJ made the ETMonitor data available that are not openly accessible.
The authors declare that they have no conflict of interest.
Most spatial data layers can be accessed through the public domain; however, we would still like to thank the teams that provide the CMRSET, GLEAM, MOD16, MTE, SSEBop, WaPOR, WECANN, CHIRPS, MSWEP, EWEMBI and PET data sets. We thank the team at the Global Runoff Data Centre (GRDC) in Koblenz, Germany, for providing the discharge data. We thank Wim Thiery, Steven Eisenreich, Inne Vanderkelen and Graham Jewitt for their advice on improvements to the scientific content and paper.
This research has been supported by the ERA4CS CIREG and TORUS projects, grant no. 561797-EPP-1-2015-1-FR-EPPKA2-CBHE-JP (2015-3515).
This paper was edited by Shraddhanand Shukla and reviewed by two anonymous referees.
Alemohammad, S. H., Fang, B., Konings, A. G., Aires, F., Green, J. K., Kolassa, J., Miralles, D., Prigent, C., and Gentine, P.: Water, Energy, and Carbon with Artificial Neural Networks (WECANN): a statistically based estimate of global surface turbulent fluxes and gross primary productivity using solar-induced fluorescence, Biogeosciences, 14, 4101–4124, https://doi.org/10.5194/bg-14-4101-2017, 2017. a, b, c
Alkema, L., Raftery, A. E., Gerland, P., Clark, S. J., and Pelletier, F.: Estimating the Total Fertility Rate from Multiple Imperfect Data Sources and Assessing its Uncertainty, Center for Statistics and the Social Sciences, University of Washington, Washington, 50, 1–19, 2011. a
Bai, P. and Liu, X.: Intercomparison and evaluation of three global high-resolution evapotranspiration products across China, J. Hydrol., 566, 743–755, https://doi.org/10.1016/j.jhydrol.2018.09.065, 2018. a
Baldocchi, D., Falge, E., Gu, L., Olson, R., Hollinger, D., Running, S., Anthoni, P., Bernhofer, C., Davis, K., Evans, R., Fuentes, J., Goldstein, A., Katul, G., Law, B., Lee, X., Malhi, Y., Meyers, T., Munger, W., Oechel, W., Paw, K. T., Pilegaard, K., Schmid, H. P., Valentini, R., Verma, S., Vesala, T., Wilson, K., and Wofsy, S.: FLUXNET: A New Tool to Study the Temporal and Spatial Variability of Ecosystem–Scale Carbon Dioxide, Water Vapor, and Energy Flux Densities, B. Am. Meteorol. Soc., 82, 2415–2434, 2001. a
Balsamo, G., Albergel, C., Beljaars, A., Boussetta, S., Brun, E., Cloke, H., Dee, D., Dutra, E., Muñoz-Sabater, J., Pappenberger, F., De Rosnay, P., Stockdale, T., and Vitart, F.: ERA-Interim/Land: a global land surface reanalysis data set, Hydrol. Earth Syst. Sci, 19, 389–407, https://doi.org/10.5194/hess-19-389-2015, 2015. a
Budyko, M. I.: Climate and life, English Edn.,Academic Press, New York, 1974. a, b, c
Calton, B., Schellekens, J., and Martinez-De La Torre, A.: Water Resource Reanalysis v1: Data Access and Model Verification Results, Zenodo, https://doi.org/10.5281/zenodo.57760, 2016. a
Carter, J. M.: Hydrologic Budgets Methods for Estimating Basin Yield and Recharge, Tech. rep., 2001. a
Dee, D. P., Uppala, S. M., Simmons, A. J., Berrisford, P., Poli, P., Kobayashi, S., Andrae, U., Balmased, G. B., Bauer, P., Bechtold, P., Beljaars, A. C. M., van de Berg, L., Bidlot, J., Bormann, N., Delsol, C., Dragani, R., Fuentes, M., Geer, A. J., Haimb, L., Vitart, F., and Thépautaan, J. N.: The ERA-Interim reanalysis: configuration and performance ofthe data assimilation system, Royal Meteorol. Soc., 137, 553–597, 2011. a
Douville, H., Ribes, A., Decharme, B., Alkama, R., and Sheffield, J.: Anthropogenic influence on multidecadal changes in reconstructed global evapotranspiration, Nat. Clim. Change, 3, 59–62, https://doi.org/10.1038/nclimate1632, 2013. a
Du, C., Sun, F., Yu, J., Liu, X., and Chen, Y.: New interpretation of the role of water balance in an extended Budyko hypothesis in arid regions, Hydrol. Earth Syst. Sci., 20, 393–409, https://doi.org/10.5194/hess-20-393-2016, 2016. a
FAO: WaPOR Database Methodology: Level 1 Data using remote sensing in support of solutions to reduce agricultural water productivity gaps, Tech. rep., FAO, Rome, available at: http://www.fao.org/3/I7315EN/i7315en.pdf (last access: 11 July 2019), 2018. a, b
Fisher, J. B., Tu, K. P., and Baldocchi, D. D.: Global estimates of the land–atmosphere water flux based on monthly AVHRR and ISLSCP-II data, validated at 16 FLUXNET sites, Remote Sens. Environ., 112, 901–919, https://doi.org/10.1016/j.rse.2007.06.025, 2008. a, b
Funk, C., Peterson, P., Landsfeld, M., Pedreros, D., Verdin, J., Shukla, S., Husak, G., Rowland, J., Harrison, L., Hoell, A., and Michaelsen, J.: The climate hazards infrared precipitation with stations – A new environmental record for monitoring extremes, Scient. Data, 2, 1–21, https://doi.org/10.1038/sdata.2015.66, 2015. a
Gerrits, A. M., Savenije, H. H., Veling, E. J., and Pfister, L.: Analytical derivation of the Budyko curve based on rainfall characteristics and a simple evaporation model, Water Resour. Res., 45, 1–15, https://doi.org/10.1029/2008WR007308, 2009. a
Google: Distribution of flux towers across Africa, available at: https://fluxnet.fluxdata.org/sites/site-list-and-pages/?view=map (last access: 1 October 2019), 2020. a
Guerschman, J. P., Van Dijk, A. I., Mattersdorf, G., Beringer, J., Hutley, L. B., Leuning, R., Pipunic, R. C., and Sherman, B. S.: Scaling of potential evapotranspiration with MODIS data reproduces flux observations and catchment water balance observations across Australia, J. Hydrol., 369, 107–119, https://doi.org/10.1016/j.jhydrol.2009.02.013, 2009. a, b, c
Gurjar, S. B. and Padmanabhan, N.: Study of various resampling techniques for high-resolution remote sensing imagery, J. Indian Soc. Remote Sens., 33, 113–120, https://doi.org/10.1007/BF02989999, 2005. a
Hargreaves, G. and Samani, Z.: Reference crop evapotranspiration from temperature, Appl. Eng. Agricult., 1, 96–99, 1985. a
Huffman, G. J., Adler, R. F., Bolvin, D. T., Gu, G., Nelkin, E. J., Bowman, K. P., Hong, Y., Stocker, E. F., and Wolff, D. B.: The TRMM Multisatellite Precipitation Analysis (TMPA): Quasi-Global, Multiyear, Combined-Sensor Precipitation Estimates at Fine Scales, J. Hydrometeorol., 8, 38–55, https://doi.org/10.1175/JHM560.1, 2007. a
IPCC: IPCC Special Report on Climate Change, Desertification, Land Degradation, Sustainable Land Management, Food Security, Tech. rep., Intergovernmental Panel on Climate Change, available at: https://www.ipcc.ch/site/assets/uploads/2019/08/Fullreport-1.pdf, last access: 1 July 2019. a
JAXA: The Global Satellite Mapping of Precipitation (GSMaP) project, available at: https://sharaku.eorc.jaxa.jp/GSMaP_crest/ (last access: 1 July 2019), 2009. a
Jiménez, C., Prigent, C., Mueller, B., Seneviratne, S. I., McCabe, M. F., Wood, E. F., Rossow, W. B., Balsamo, G., Betts, A. K., Dirmeyer, P. A., Fisher, J. B., Jung, M., Kanamitsu, M., Reichle, R. H., Reichstein, M., Rodell, M., Sheffield, J., Tu, K., and Wang, K.: Global intercomparison of 12 land surface heat flux estimates, J. Geophys. Res.-Atmos., 116, 1–27, https://doi.org/10.1029/2010JD014545, 2011. a, b
Jung, H. C., Getirana, A., Policelli, F., McNally, A., Arsenault, K. R., Kumar, S., Tadesse, T., and Peters-Lidard, C. D.: Upper Blue Nile basin water budget from a multi-model perspective, J. Hydrol., 555, 535–546, https://doi.org/10.1016/j.jhydrol.2017.10.040, 2017. a
Jung, M., Reichstein, M., Ciais, P., Seneviratne, S. I., Sheffield, J., Goulden, M. L., Bonan, G., Cescatti, A., Chen, J., De Jeu, R., Dolman, A. J., Eugster, W., Gerten, D., Gianelle, D., Gobron, N., Heinke, J., Kimball, J., Law, B. E., Montagnani, L., Mu, Q., Mueller, B., Oleson, K., Papale, D., Richardson, A. D., Roupsard, O., Running, S., Tomelleri, E., Viovy, N., Weber, U., Williams, C., Wood, E., Zaehle, S., and Zhang, K.: Recent decline in the global land evapotranspiration trend due to limited moisture supply, Nature, 467, 951–954, https://doi.org/10.1038/nature09396, 2010. a, b
Jung, M., Reichstein, M., Margolis, H. A., Cescatti, A., Richardson, A. D., Arain, M. A., Arneth, A., Bernhofer, C., Bonal, D., Chen, J., Gianelle, D., Gobron, N., Kiely, G., Kutsch, W., Lasslop, G., Law, B. E., Lindroth, A., Merbold, L., Montagnani, L., Moors, E. J., Papale, D., Sottocornola, M., Vaccari, F., and Williams, C.: Global patterns of land-atmosphere fluxes of carbon dioxide, latent heat, and sensible heat derived from eddy covariance, satellite, and meteorological observations, J. Geophys. Res.-Biogeo., 116, 1–16, https://doi.org/10.1029/2010JG001566, 2011. a, b, c
Kendall, M.: Rank correlation methods, Griffin, Oxford, England, 1948. a
Lange, S.: EartH2Observe, WFDEI and ERA-Interim data Merged and Bias-corrected for ISIMIP (EWEMBI), V. 1.1, GFZ Data Services, https://doi.org/10.5880/pik.2019.004, 2019. a
Lehner, B., Reidy Liermann, C., Revenga, C., Vörösmarty, C., Fekete, B., Crouzet, P., Döll, P., Endejan, M., Frenken, K., Magome, J., Nilsson, C., Robertson, J. C., Rodel, R., Sindorf, N., and Wisser, D.: Global Reservoir and Dam Database, Version 1 (GRanDv1): Dams, Revision 01, NASA Socioeconomic Data and Applications Center (SEDAC), Palisades, NY, https://doi.org/10.7927/H4N877QK, 2011. a
Mann, H.: Non-parametric tests against trend, Econometrica, 13, 163–171, 1945. a
Martens, B., Miralles, D. G., Lievens, H., Van Der Schalie, R., De Jeu, R. A. M., Fernández-Prieto, D., Beck, H. E., Dorigo, W. A., and Verhoest, N. E. C.: GLEAM v3: satellite-based land evaporation and root-zone soil moisture, Geosci. Model Dev., 10, 1903–1925, https://doi.org/10.5194/gmd-10-1903-2017, 2017. a
Matzke, B. D., Wilson, J. E., Newburn, L., Dowson, S. T., Hathaway, J. E., Sego, L. H., Bramer, L. M., and Pulsipher, B. A.: Mann–Kendall Test For Monotonic Trend, Tech. rep., Pacific Northwest National Laboratory, Richland, Washington, 2014. a
McMahon, T. A., Peel, M. C., Lowe, L., Srikanthan, R., and McVicar, T. R.: Estimating actual , potential , reference crop and pan evaporation using standard meteorological data: a pragmatic synthesis, Hydrol. Earth Syst. Sci., 17, 1331–1363, https://doi.org/10.5194/hess-17-1331-2013, 2013. a
Miralles, D. G., Holmes, T. R. H., De Jeu, R. A. M., Gash, J. H., Meesters, A. G. C. A., and Dolman, A. J.: Hydrology and Earth System Sciences Global land-surface evaporation estimated from satellite-based observations, Hydrol. Earth Syst. Sci., 15, 453–469, https://doi.org/10.5194/hess-15-453-2011, 2011. a, b, c
Miralles, D. G., Van Den Berg, M. J., Gash, J. H., Parinussa, R. M., De Jeu, R. A. M., Beck, H. E., Holmes, T. R. H., Jiménez, C., Verhoest, N. E. C., Dorigo, W. A., Teuling, A. J., and Dolman, J. A.: El Niño–La Niña cycle and recent trends in continental evaporation, Nat. Clim. Change, 4, 122–126, https://doi.org/10.1038/nclimate2068, 2014. a
Miralles, D. G., Jiménez, C., Jung, M., Michel, D., Ershadi, A., Mccabe, M. F., Hirschi, M., Martens, B., Dolman, A. J., Fisher, J. B., Mu, Q., Seneviratne, S. I., Wood, E. F., and Fernández-Prieto, D.: The WACMOS-ET project – Part 2: Evaluation of global terrestrial evaporation data sets, Hydrol. Earth Syst. Sci., 20, 823–842, https://doi.org/10.5194/hess-20-823-2016, 2016. a, b, c, d, e, f
Montieth, L. J.: State and movement of water in living organisms, in: 19th Symposium of Evaporation and the Environment, Cambridge University Press, Swansea, London, 1965. a, b
Mu, Q., Heinsch, F. A., Zhao, M., and Running, S. W.: Development of a global evapotranspiration algorithm based on MODIS and global meteorology data, Remote Sens. Environ., 111, 519–536, https://doi.org/10.1016/j.rse.2006.07.007, 2007. a, b, c, d
Mu, Q., Heinsch, F. A., Zhao, M., and Running, S. W.: Improvements to a MODIS global terrestrial evapotranspiration algorith, Remote Sens. Environ., 115, 1781–1800, https://doi.org/10.1016/j.rse.2007.04.015, 2011. a, b, c, d
Mueller, B., Seneviratne, S. I., Jimenez, C., Corti, T., Hirschi, M., Balsamo, G., Ciais, P., Dirmeyer, P., Fisher, J. B., Guo, Z., Jung, M., Maignan, F., McCabe, M. F., Reichle, R., Reichstein, M., Rodell, M., Sheffield, J., Teuling, A. J., Wang, K., Wood, E. F., and Zhang, Y.: Evaluation of global observations-based evapotranspiration datasets and IPCC AR4 simulations, Geophys. Res. Lett., 38, 1–7, https://doi.org/10.1029/2010GL046230, 2011. a
Mueller, B., Hirschi, M., Jimenez, C., Ciais, P., Dirmeyer, P. A., Dolman, A. J., Fisher, J. B., Jung, M., Ludwig, F., Maignan, F., Miralles, D. G., Mccabe, M. F., Reichstein, M., Sheffield, J., Wang, K., Wood, E. F., Zhang, Y., and Seneviratne, S. I.: Benchmark products for land evapotranspiration: LandFlux-EVAL multi-data set synthesis, Hydrol. Earth Syst. Sci., 17, 3707–3720, https://doi.org/10.5194/hess-17-3707-2013, 2013a. a
Mueller, B., Hirschi, M., Jimenez, C., Ciais, P., Dirmeyer, P. A., Dolman, A. J., Fisher, J. B., Jung, M., Ludwig, F., Maignan, F., Miralles, D. G., Mccabe, M. F., Reichstein, M., Sheffield, J., Wang, K., Wood, E. F., Zhang, Y., and Seneviratne, S. I.: Benchmark products for land evapotranspiration: LandFlux-EVAL multi-data set synthesis, Hydrol. Earth Syst. Sci., 17, 3707–3720, https://doi.org/10.5194/hess-17-3707-2013, 2013b. a
NCAR: CMORPH (CPC Morphing Technique): High Resolution Precipiation, (60∘ S–60∘ N), available at: https://climatedataguide.ucar.edu/climate-data/cmorph-cpc-morphing-technique-high-resolution (last access: 1 July 2019), 2017. a
Otto, F. E. L., Jones, R. G., Halladay, K., and Allen, M. R.: Attribution of changes in precipitation patterns in African rainforests, Philos. T. Roy. Soc. B, 368, 1625, https://doi.org/10.1098/rstb.2012.0299, 2013. a
Penman, H. L.: Natural Evaporation from Open Water, Bare Soil and Grass, Tech. Rep. 1032, London, 1948. a, b
Porwal, S. and Katiyar, S. K.: Performance evaluation of various resampling techniques on IRS imagery, in: 2014 7th International Conference on Contemporary Computing, IC3 2014, 7–9 August 2014, Noida, India, 489–494, https://doi.org/10.1109/IC3.2014.6897222, 2014. a
Priestley, B. and Taylor, R.: On the assessment of surface heat flux and exporation using large-scale parameters, Mon. Weather Rev., 100, 81–92, 1972. a, b
Reynolds, E. R. C., Thompson, F. B., and United Nations University: Forests, climate, and hydrology: regional impacts, United Nations University, available at: http://archive.unu.edu/unupress/unupbooks/80635e/80635E00.htm#Contents (last access: 11 January 2019), 1988. a
Rodell, M., Famiglietti, J. S., Wiese, D. N., Reager, J. T., Beaudoing, H. K., Landerer, F. W., and Lo, M.-H.: Emerging trends in global freshwater availability, Nature, 557, 651–659, https://doi.org/10.1038/s41586-018-0123-1, 2018. a
Senay, G. B., Bohms, S., Singh, R. K., Gowda, P. H., Velpuri, N. M., Alemu, H., and Verdin, J. P.: Operational Evapotranspiration Mapping Using Remote Sensing and Weather Datasets: A New Parameterization for the SSEB Approach, J. Am. Water Resour. Assoc., 49, 577–591, https://doi.org/10.1111/jawr.12057, 2013. a, b, c
Siebert, S., Henrich, V., Frenken, K., and Burke, J.: Global map of irrigation areas version 5, Rheinische Friedrich-Wilhelms-University, Bonn, Germany/Food and Agriculture Organization of the United Nations, Rome, Italy, 2, 1299–1327, 2013. a
Sperna Weiland, F., Lopez, P., van Dijk, A., and Schellekens, J.: Global high-resolution reference potential evaporation, in: 21st International Congress on Modelling and Simulation, 29 November–4 December 2015, Broadbeach, Queensland, Australia, 2548–2554, 2015. a, b, c, d
Sposito, G.: Understanding the budyko equation, Water, 9, 1–14, https://doi.org/10.3390/w9040236, 2017. a, b
Su, Z.: The Surface Energy Balance System (SEBS) for estimation of turbulent heat fluxes, Tech. Rep. 1, availabel at: https://www.hydrol-earth-syst-sci.net/6/85/2002/hess-6-85-2002.pdf (last access: 11 January 2019), 2002. a
Taniguchi, M., Burnett, W., Cable, J., and Turnerd, J.: Assessment methodologies for submarine groundwater discharge, Land Mar. Hydrogeol., 1, 1–23, 2003. a
Teuling, A. J., Hirschi, M., Ohmura, A., Wild, M., Reichstein, M., Ciais, P., Buchmann, N., Ammann, C., Montagnani, L., Richardson, A. D., Wohlfahrt, G., and Seneviratne, S. I.: A regional perspective on trends in continental evaporation, Geophys. Res. Lett., 36, 1–5, https://doi.org/10.1029/2008GL036584, 2009. a
Trambauer, P., Dutra, E., Maskey, S., Werner, M., Pappenberger, F., Van Beek, L. P. H., and Uhlenbrook, S.: Comparison of different evaporation estimates over the African continent, Hydrol. Earth Syst. Sci., 18, 193–212, https://doi.org/10.5194/hess-18-193-2014, 2014. a, b, c, d, e
Tramontana, G., Jung, M., Schwalm, C. R., Ichii, K., Camps-Valls, G., Ráduly, B., Reichstein, M., Arain, M. A., Cescatti, A., Kiely, G., Merbold, L., Serrano-Ortiz, P., Sickert, S., Wolf, S., and Papale, D.: Predicting carbon dioxide and energy fluxes across global FLUXNET sites with regression algorithms, Biogeosciences, 13, 4291–4313, https://doi.org/10.5194/bg-13-4291-2016, 2016. a
Van Beek, L. R. and Bierkens, M. F. P.: The Global Hydrological Model PCR-GLOBWB: Conceptualization, Parameterization and Verification Report, Tech. rep., Utrecht University, Faculty of Earth Sciences, Department of Geography, Utrecht, the Netherlands, available at: http://vanbeek.geo.uu.nl/suppinfo/vanbeekbierkens2009.pdf (last access: 1 July 2019), 2009. a
Vinukollu, R. K., Meynadier, R., Sheffield, J., and Wood, E. F.: Multi-model, multi-sensor estimates of global evapotranspiration: climatology, uncertainties and trends, Hydrol. Process., 25, 3993–4010, https://doi.org/10.1002/hyp.8393, 2011a. a, b
Vinukollu, R. K., Wood, E. F., Ferguson, C. R., and Fisher, J. B.: Global estimates of evapotranspiration for climate studies using multi-sensor remote sensing data: Evaluation of three process-based approaches, Remote Sens. Environ., 115, 801–823, 2011b. a, b, c
Wang, D. and Alimohammadi, N.: Responses of annual runoff, evaporation, and storage change to climate variability at the watershed scale, Water Resour. Res., 48, W05546, https://doi.org/10.1029/2011WR011444, 2012. a
Wartenburger, R., Seneviratne, S. I., Hirschi, M., Chang, J., Ciais, P., Deryng, D., Elliott, J., Folberth, C., Gosling, S. N., Gudmundsson, L., Henrot, A.-J., Hickler, T., Ito, A., Khabarov, N., Kim, H., Leng, G., Liu, J., Liu, X., Masaki, Y., Morfopoulos, C., Muller, C., Schmied, H., Nishina, K., Orth, R., Pokhrel, Y., Pugh, T., Satoh, Y., Schaphoff, S., Schmid, E., Sheffield, J., Stacke, T., Steinkamp, J., Tang, Q., Thiery, W., Wada, Y., Wang, X., Weedon, G., Yang, H., and Zhou, T.: Evapotranspiration simulations in ISIMIP2a – Evaluation of spatio-temporal characteristics with a comprehensive ensemble of independent datasets, Environ. Res. Lett., 13, 075001, https://doi.org/10.1088/1748-9326/aac4bb, 2018. a
Weedon, G. P., Balsamo, G., Bellouin, N., Gomes, S., Best, M. J., and Viterbo, P.: The WFDEI meteorological forcing data set: WATCH ForcingData methodology applied to ERA-Interim reanalysis data, Water Resour. Res., 50, 7505–7514, https://doi.org/10.1002/2014WR015638, 2014. a
World Bank: Major River Basins Of The World, available at: https://datacatalog.worldbank.org/dataset/major-river-basins-world (last access: 1 July 2019), 2017. a
World Bank: Beyond Scarcity Water Security in the Middle East and North Africa, MENA Development Report, Washington, D.C., https://doi.org/10.1192/bjp.111.479.1009-a, 2018. a
Zhang, Y., Peña-Arancibia, J. L., Mcvicar, T. R., Chiew, F. H. S., Vaze, J., Liu, C., Lu, X., Zheng, H., Wang, Y., Liu, Y. Y., Miralles, D. G., and Pan, M.: Multi-decadal trends in global terrestrial evapotranspiration and its components OPEN, Scient. Rep., 6, 19124, https://doi.org/10.1038/srep19124, 2016. a, b
Zheng, C., Jia, L., Hu, G., Lu, J., Wang, K., and Li, Z.: Global evapotranspiration derived by ETMonitor model based on earth observations, in: International Geoscience and Remote Sensing Symposium (IGARSS), 10–15 July 2016, Beijing, China, 222–225, https://doi.org/10.1109/IGARSS.2016.7729049, 2016. a, b, c
FLUXNET is a global network of micrometeorological flux measurement sites that measure the exchange of CO2, water vapour and energy between the biosphere and the atmosphere (Baldocchi et al., 2001).