the Creative Commons Attribution 4.0 License.
the Creative Commons Attribution 4.0 License.
 | 01 Apr 2020
The role of liquid water percolation representation in estimating snow water equivalent in a Mediterranean mountain region (Mount Lebanon)
Simon Gascoin
In many Mediterranean mountain regions, the seasonal snowpack is an essential yet poorly known water resource. Here, we examine, for the first time, the spatial distribution and evolution of the snow water equivalent (SWE) during three snow seasons (2013–2016) in the coastal mountains of Lebanon. We run SnowModel (Liston and Elder, 2006a), a spatially distributed, process-based snow model, at 100 m resolution forced by new automatic weather station (AWS) data in three snow-dominated basins of Mount Lebanon. We evaluate a recent upgrade of the liquid water percolation scheme in SnowModel, which was introduced to improve the simulation of the SWE and runoff in warm maritime regions. The model is evaluated against continuous snow depth and snow albedo observations at the AWS, manual SWE measurements, and MODIS snow cover area between 1200 and 3000 m a.s.l. The results show that the new percolation scheme yields better performance, especially in terms of SWE but also in snow depth and snow cover area. Over the simulation period between 2013 and 2016, the maximum snow mass was reached between December and March. Peak mean SWE (above 1200 m a.s.l.) changed significantly from year to year in the three study catchments, with values ranging between 73 and 286 mm w.e. (RMSE between 160 and 260 mm w.e.). We suggest that the major sources of uncertainty in simulating the SWE, in this warm Mediterranean climate, can be attributed to forcing error but also to our limited understanding of the separation between rain and snow at lower-elevations, the transient snowmelt events during the accumulation season, and the high variability of snow depth patterns at the subpixel scale due to the wind-driven blown-snow redistribution into karstic features and sinkholes. Yet, the use of a process-based snow model with minimal requirements for parameter estimation provides a basis to simulate snow mass SWE in nonmonitored catchments and characterize the contribution of snowmelt to the karstic groundwater recharge in Lebanon. While this research focused on three basins in the Mount Lebanon, it serves as a case study to highlight the importance of wet snow processes to estimate SWE in Mediterranean mountain regions.
- Article
(1925 KB) - Full-text XML
-
Supplement
(111 KB) - BibTeX
- EndNote


Winter snowpack has a large influence over the hydrological processes in Mediterranean mountains and the spring meltwater from the seasonal snowpack often represents a key water resource for downstream areas (Fayad et al., 2017a). In such regions, a large fraction of the annual precipitation falls during the winter season, which extends over a period of 5 months (Fayad et al., 2017a). With a limited precipitation season and warm and dry summers, the Mediterranean mountainous areas are among the most vulnerable to a warming climate (e.g, Nohara et al., 2006; Loarie et al., 2009; Kumar et al., 2016).
Our understanding of the snowpack hydrological contribution in many Mediterranean mountains remains incomplete. Snow monitoring in regions such as the central Chilean Andes, Moroccan Atlas Mountains, and the Eastern Mediterranean Sea is relatively new (Fayad et al., 2017a). The increased interest, over the past decade, in understanding snow accumulation and melt in the less monitored Mediterranean mountains is mainly driven by the need to meet the increased demand for water resources. Mediterranean mountain regions, which share many characteristics of the snow in maritime regions (Fayad et al., 2017a), are characterized by their deep multilayer winter snowpack, which can exceed the 3 m in depth, coarser grain size due to wetting, almost isothermal winter snowpack, and the high sensitivity of the precipitation phase to air temperature (Sturm et al., 1995; Sproles, et al., 2013; Pflug et al., 2019). Capturing the meltwater runoff dynamics in the Mediterranean can be challenging, especially when transient snowmelt events are common during the winter season.
To reduce the uncertainty in simulating the snow water equivalent (SWE) in warm maritime regions, Pflug et al. (2019) implemented a discrete representation of snow liquid water percolation into the snowpack using gravity drainage to replace the standard snow density threshold routine in the distributed snowpack model SnowModel (Liston and Elder, 2006a). The new scheme by Pflug et al. (2019) showed improvement in simulating SWE compared to the default model (Liston and Elder, 2006a), which tended to strongly overestimate the SWE at a Snow Telemetry station (SNOTEL) in the Washington Olympic Mountains, USA. The default liquid water percolation scheme did not allow the release of meltwater runoff during the accumulation season, causing a large over-accumulation of SWE. This process is typical of a warm Mediterranean snowpack, such as the Mount Lebanon snowpack.
In this study, we make use of a newly available snow dataset (Fayad et al., 2017b) to evaluate this new percolation scheme in SnowModel to compute the SWE distribution and its evolution, for the first time, in three basins in the warm Mediterranean mountains of Lebanon. We evaluate the model outputs using both in situ (continuous snow depth records at AWSs and snow course measurements) and remote sensing data (MODIS snow cover area). We show that the improved percolation scheme led to better performance, and we used this model version to estimate the daily evolution of the SWE distribution over three water years (2013–2014, 2014–2015, and 2015–2016, hereafter W1314, W1415, and W1516, respectively).
Lebanon has relatively abundant water resources (857 m3 per capita in 2014 according to World Bank data). Nevertheless, water shortages are frequent during the summer. The water scarcity became particularly acute in Lebanon between 1998 and 2012, when the worst drought of the past nine centuries hit the Eastern Mediterranean (Cook et al., 2016). The difficulty to meet water demand in Lebanon is also exacerbated by the poor management of the water resources (Lebanese Ministry of Energy and Water, 2012), the increase in urbanization, and population growth over the past decades (Lebanese Ministry of Environment, 2011).
In Lebanon, the water demand for agriculture is concentrated in the irrigated Bekaa Valley between the Mount Lebanon and the Anti-Lebanon mountain ranges. On the other hand, the water demand in the coastal strip of Lebanon, between the Mediterranean Sea and Mount Lebanon, is mostly associated with domestic and industrial uses. This narrow coastal plain is heavily urbanized and includes the Beirut metropolitan area, where approximately one-third of the Lebanese population lives. In this area, the urban water supply relies on the discharge of springs and water wells from the highly karstified Jurassic limestone aquifers (Margane et al., 2013). The recharge area of this karstic system is located in Mount Lebanon, a mountain range that extends over a distance of 150 km parallel to the Mediterranean coast with a main plateau averaging 2500 m a.s.l. elevation and peak at 3088 m a.s.l.
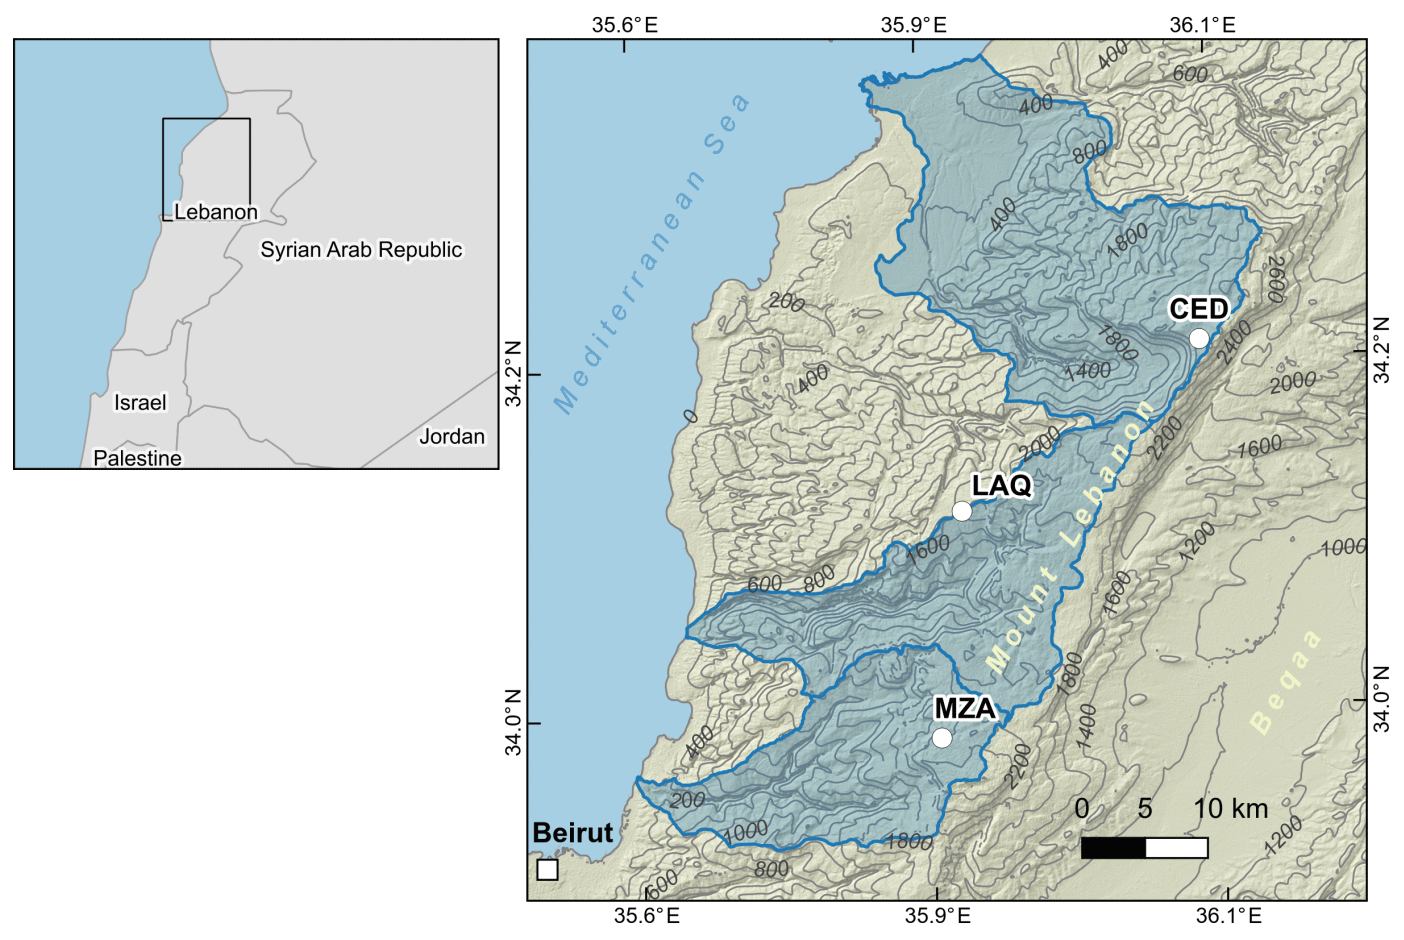
Figure 1Study area. The three studied basins are marked in blue (from north to south: Abou Ali, Ibrahim, and El Kelb). Elevation contours are given in meters above the WGS-84 ellipsoid.
Most of the precipitation occurs between January and March due to the influence of the Mediterranean climate, and therefore areas above 1200 m a.s.l. receive between 50 % and 67 % of their total annual precipitation as snow (Shaban et al., 2004; Aouad-Rizk et al., 2005; Mhawej et al., 2014; Telesca et al., 2014). Winter precipitation events are due to the orographic lifting of the cold northerly currents from the Anatolian plateau (Fish, 1944). Snowmelt is a major contributor to the groundwater recharge (Margane et al., 2013; UNDP, 2014). In this upper Cretaceous formation, usually above 1600 m a.s.l., snowmelt contributes to roughly 75 % of the groundwater recharge (Fig. 1) (Margane et al., 2013; Königer and Margane, 2014).
Table 1Main characteristics of the river basins in this study (defined using the surface topography). Annual flow based on unpublished data from the Litani river authority gauging stations (1992–2016).
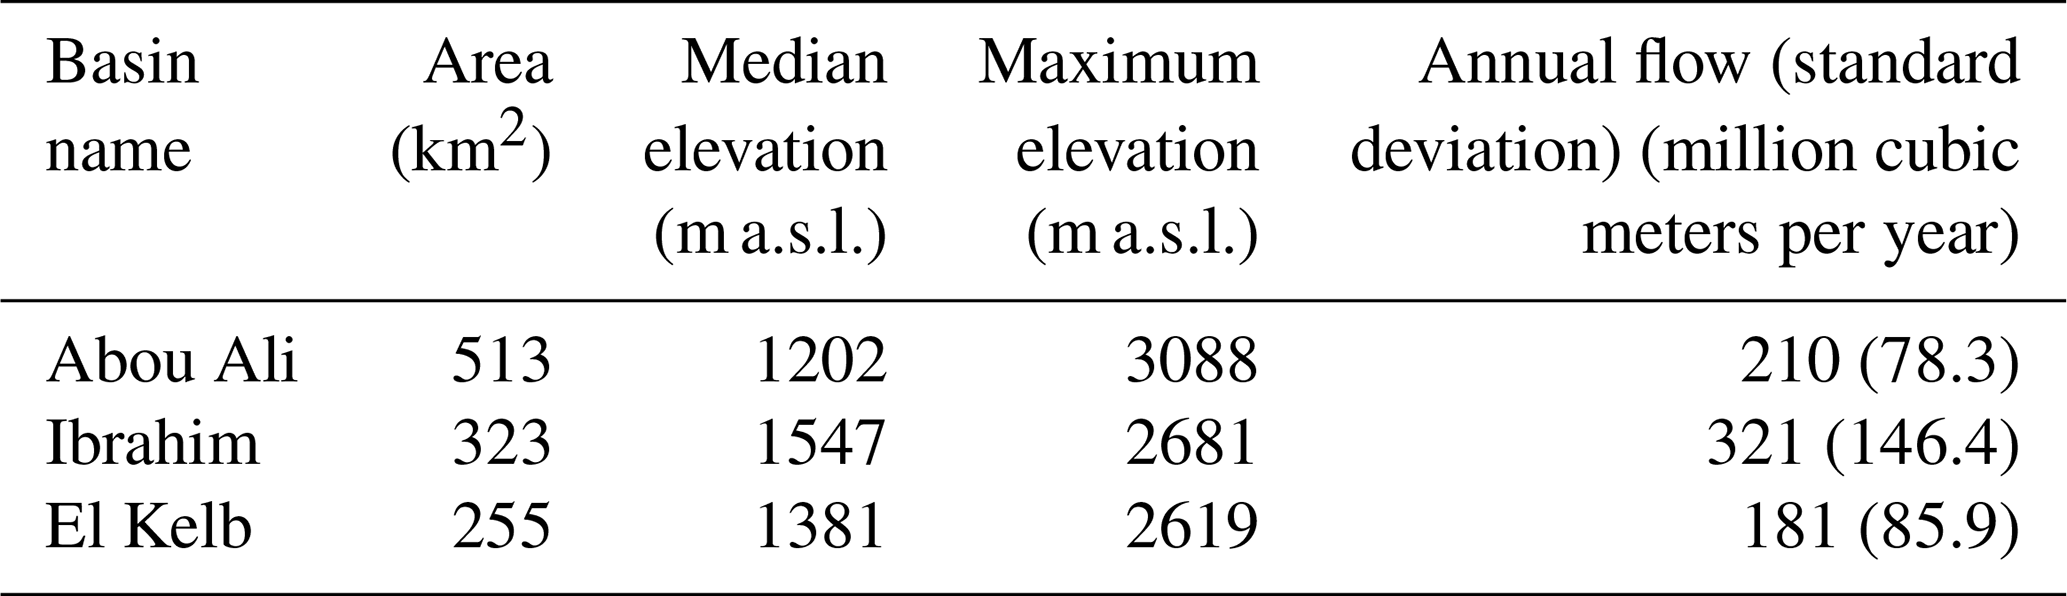
This study focuses on the upper catchment areas of the Abou Ali, Ibrahim, and El Kelb river basins (Fig. 1; Table 1). These basins provide key water resources to two major governorates – the northern districts of the Mount Lebanon Governorate and the districts of the North Governorate – as well as the densely populated coastal cities of Lebanon, including Beirut the capital. The Abou Ali River provides water to the districts of Bcharre, Zgharta, Minieh, and Tripoli, the second-largest city in the country. The Ibrahim River emerges from the Afqa grotto and supplies water for the districts of Kesrouan and Jbeil, a touristic area on the coast including the Byblos archeological site. The El Kelb River basin supplies water for the El Metn and Keserouan districts. The Jeita spring in the lower area of the El Kelb river basin provides 75 % of the domestic water supply for the Beirut district and its northern suburbs (about 1.5 million inhabitants) (Doummar et al., 2014). The contribution of the snowfed upper Cretaceous plateau to the discharge at the Jeita spring (60 m a.s.l.) was estimated at 39 % (Margane et al., 2013).
All three basins have similar topographic, physiographic, and geological characteristics. They stretch from the Mediterranean Sea to the Mount Lebanon range with a mean west-facing slope. The recharge area on Mount Lebanon above 1200 m a.s.l. can be classified as mid- to high-altitude ranges with rugged topography and high plateaus (Viviroli et al., 2007). The maximum elevation exceeds 2500 m a.s.l. in the three basins. The Abou Ali river basin includes Qurnat El Sawda (3088 m a.s.l.), the highest point in Lebanon and the Levant. The land cover is mainly bare rocks and soils and short scrublands.
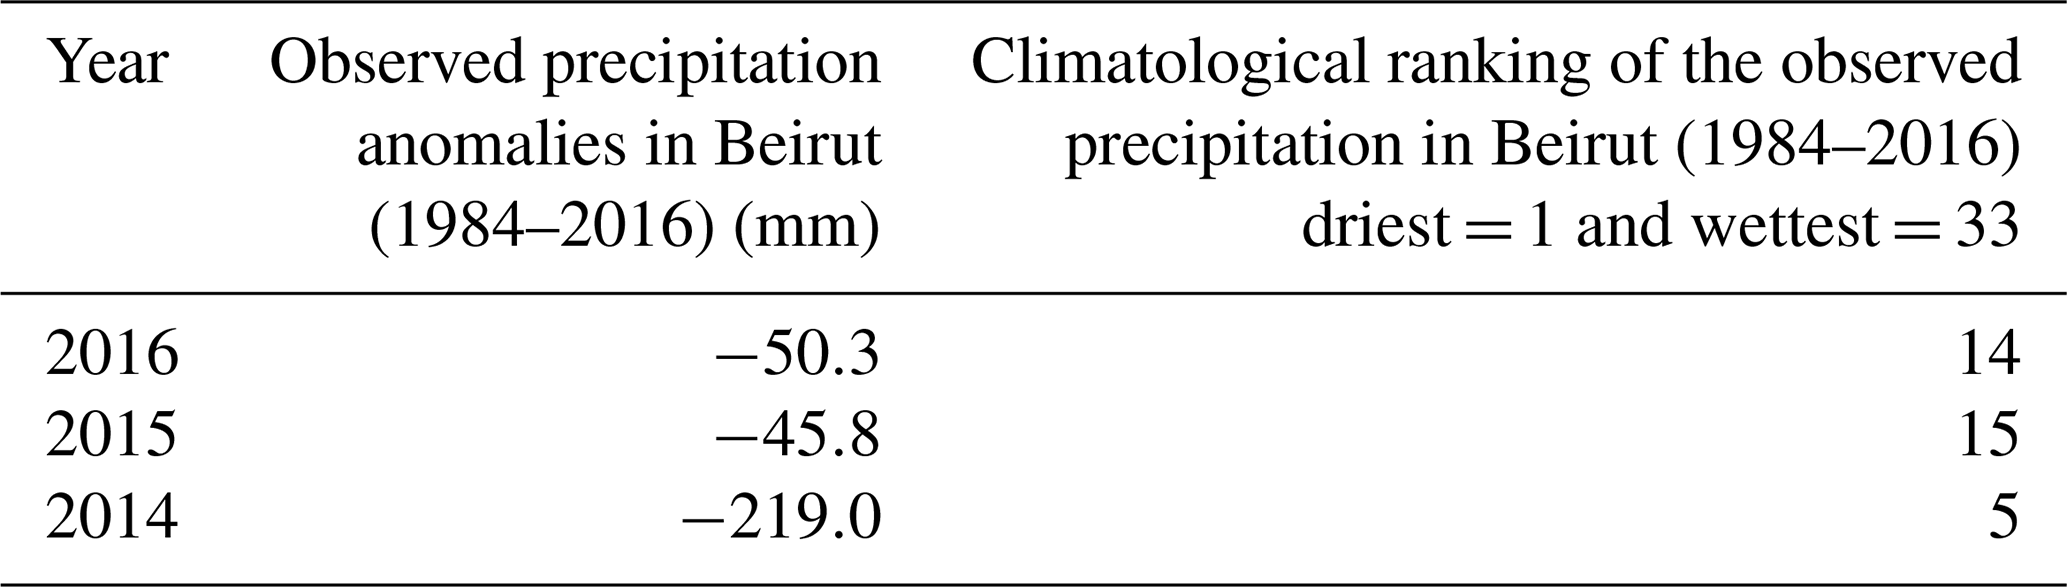
The surface drainage network is poorly developed in the upper areas of the basins as most rainfall and snowmelt runoff infiltrates in the highly karstified limestone aquifers and aquitards beneath the surface of Mount Lebanon (Margane et al., 2013). Basin outlines used in this study (Fig. 1; Table 1) were derived from surface topography and may differ from the actual catchment boundaries, which are mostly controlled by the karst aquifer geometry and connectivity (Margane et al., 2013). The topographic catchments are shown here to give an indication of the basin size and location because the hydrogeological catchments are poorly known. Meteorological data at the Beirut weather station (20 m a.s.l.) operated by the national civil aviation service for the time period between 1984 and 2016 suggest that W1314 was a very dry year (fifth driest year on record between 1984 and 2016). W1415 and W1516 were less dry but had below-average precipitation (Table 2).
Table 2Precipitation anomalies in Beirut (1984–2016). Observed precipitation anomalies in Beirut (20 m a.s.l) are based on AWS meteorological data provided by the national civil aviation service.
3.1 Model
We used SnowModel (Liston and Elder, 2006a), to simulate the spatial distribution of snow depth, SWE, and snowmelt over the study area. SnowModel is a physically based snow evolution model which combines four submodels: (1) MicroMet (Liston and Elder, 2006b) spatially interpolates the meteorological forcing over the simulation domain from AWS observations and the digital elevation model (DEM) using the Barnes scheme; (2) EnBal simulates the snowpack energy balance (Liston, 1995; Liston et al., 1999); (3) SnowPack simulates the snow depth evolution and runoff (Liston and Elder, 2006b); and (4) SnowTran-3D simulates blowing-snow sublimation and wind-driven redistribution processes (Liston et al., 2007). Two additional submodels are available but were not used in this study: SnowAssim (Liston and Hiemstra, 2008), which allows the assimilation of SWE data and HydroFlow (Liston and Mernild, 2012), a runoff routing model. Pflug et al. (2019) implemented a gravity-driven scheme to compute the liquid water percolation through the snowpack instead of the default density threshold scheme in the SnowPack submodel. In the next sections we used the default model and this new version, which will be referred to as Pflug et al. (2019).
3.2 Model setup
The model was run at a half-hourly time step over a simulation domain that encompasses the three study basins (Fig. 1). The model grid resolution was set to 100 m, which is deemed sufficient to represent the main effects of the terrain on the energy and mass balance (Baba et al., 2019). The input DEM was generated by cubic resampling of the ASTER GDEM V2 in the WGS-84 UTM 36N reference system. The land-cover grid was obtained from the land-cover and land-use map of Lebanon produced at a spatial resolution of 25 m (National Council for Scientific Research, 2015). Land classes were aggregated into nine classes after Liston and Elder (2006a) and resampled to 100 m spatial resolution using a majority filter: bare soils and rocks (59 %), shrubland (12 %), sea (8 %), crops (7 %), grassland (4 %), clear-cut conifer (4 %), urban (3 %), coniferous, deciduous and mixed forests (<3 %), and water (<1 %). The different land classes are needed to account for the snow holding capacities and canopy radiation effects (Liston and Elder, 2006a); however, bare soil is the dominant class in the snow-dominated region of the study area.
SnowModel was forced using the half-hourly meteorological data collected at the AWSs (LAQ, MZA, CED) for three snow seasons (1 November to 30 June) between 2013 and 2016. The data were taken from Fayad et al. (2017c) and only reformatted to match SnowModel input format. We used the following input meteorological variables: precipitation (LAQ, MZA), air temperature (LAQ, MZA, CED), air relative humidity (LAQ, MZA, CED), and wind speed and direction (LAQ, MZA, CED). No observations were available for the LAQ AWS during snow season 2013–2014 (Fayad et al., 2017b). We did not use the shortwave radiation measurements because of the large data gaps. The model was used with all default parameters with two exceptions. First, the snow–rain threshold was set to 0 ∘C instead of 2 ∘C based on the analysis of the local meteorological record and other studies in similar climatic context (Harpold et al., 2017). We did not use a more complex precipitation-phase partitioning method such as those described in Harder and Pomeroy (2014) and Harpold et al. (2017) because the parameterization of such methods would require introducing more parameters that we will not be able to determine for this study area. Second, we did not activate the default correction of the precipitation rate with elevation. It means that we ran the model with the minimal hypothesis that the precipitation spatial distribution is only controlled by the distances with the AWS according to the Barnes interpolation scheme (Liston and Elder, 2006b). This approximation is justified by the good horizontal (Fig. 1) and vertical distribution (Fig. 2) of the AWS in the simulation domain and the fact that we could not identify a robust elevation effect from the AWS precipitation records.
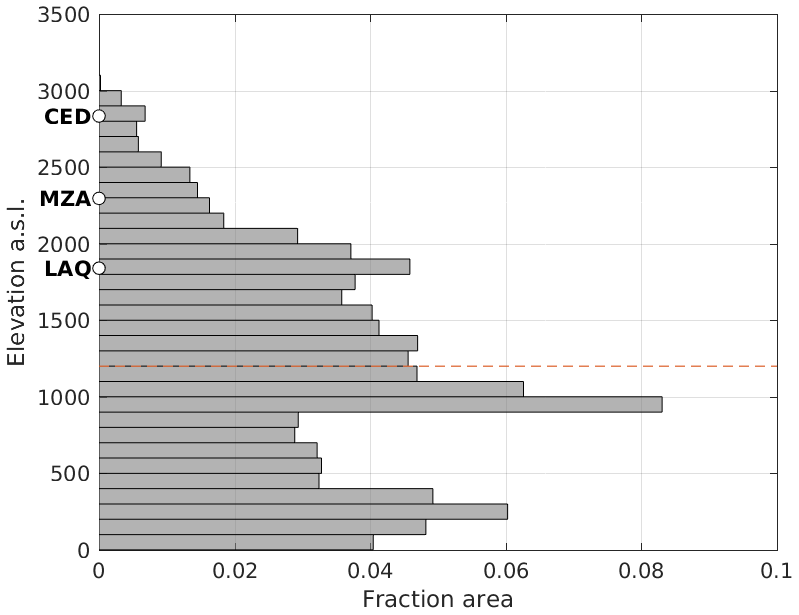
Figure 2Elevation histogram of the simulation domain (in meters above mean sea level) including the position of the AWS. The dashed line indicates the reference elevation, which is generally considered as the lower winter snowline elevation in Mount Lebanon, i.e., the elevation below which the snow cover is virtually absent (1200 m).
The liquid-water percolation scheme by Pflug et al. (2019) introduces an additional parameter, a freezing curve parameter after Jordan (1991), which we left to the default value of 50 kg m−3 following Pflug et al. (2019). The gravity-drainage scheme requires the simulation to be run with the multi-layer snowpack option that is not activated in the default run.
3.3 Model validation
The validation dataset includes (1) half-hourly snow height (HS), snow albedo and incoming shortwave radiation collected at the AWS from W1314 to W1516; (2) bi-weekly manual SWE and snow density measurements collected near the AWS during the snow seasons of W1415 and W1516; and (3) daily snow cover area (SCA) observations from MODIS (time period from W1314 to W1516). All these data are fully described in Fayad et al. (2017b) and are available as open data in a public repository (Fayad et al., 2017c).
Nearly continuous snow depth is available for water years W1415 and W1516 at LAQ and for water years W1314, W1415 and W1516 at MZA and CED. Half-hourly snow depth records were averaged to the daily time step. We computed the daily albedo of the surface below AWS from half-hourly upward- and downward-looking pyranometer measurements following Stroeve et al. (2013), i.e., by computing the ratio of the daily incoming and reflected shortwave radiation totals. Summer albedo values ranged between 0.2 and 0.4 depending on the site and the year; hence, we removed albedo values lower than 0.5 to keep only snow albedo measurements. The calculated daily snow albedo values and the incoming shortwave radiation were averaged to monthly values. The MODIS dataset is a daily cloud-free time series of snow cover maps providing the snow presence and absence at 500 m resolution (binary SCA). The model outputs at 100 m resolution were converted to binary SCA using a threshold of 10 mm w.e. of SWE.
We used the snow course locations to approximate the pixels that are representative for each snow course. The simulated SWE values were evaluated by comparing the observed SWE (revisit time ∼11 d on average for all snow courses according to Fayad et al., 2017b) with the simulated SWE value corresponding to the same dates when the in situ observations were taken. Five snow courses located near the three stations are used to showcase the evolution of SWE across different elevation bands (snow courses near the three AWS have elevations at 2823 and 2834 m a.s.l. for CED, 2297 and 2301 m a.s.l. for MZA, and 1843 m a.s.l. for LAQ).
To further investigate the effect of the liquid water percolation scheme on the internal properties of the snowpack, we used the wet snow detection from Sentinel-1 C-band Synthetic Aperture Radar data. We use these data as a proxy of melting conditions that we compared to the simulated release of liquid water from the snowpack. The wet snow detection was done using Sentinel-1 observations over the period October 2014 to June 2016. We extracted Sentinel-1 backscatter in VV polarization mode from the Sentinel-1 Ground Range Detected (GRD) collection in Google Earth Engine (Gorelick et al., 2017). We spatially averaged the backscatter at each station using a buffer with a radius of 100 m. Then, we defined a reference “dry” surface backscatter for each station using the 10th percentile of the backscatter time series (CED: −8.4 dB, LAQ: −10.7 dB, MZA: −6.10 dB). A negative departure of 4 dB to this reference was used to determine the occurrences of wet snow (Nagler et al., 2016).
The main reason for using daily HS, SCA, and Sentinel-1 wet snow observations in the validation of the SWE is the scarcity of the spatially and temporally distributed SWE observations. However, HS is known to be a good proxy of SWE in many regions (Sturm et al., 2010). Furthermore, Fayad et al. (2017b) demonstrated that the estimation of SWE from HS could be achieved with acceptable accuracy using 2 years of observations in Mount Lebanon. Both the SWE and HS measurements are collected at point locations (Fayad et al., 2017c) and may not be representative at the catchment scale due to the high spatial variability of the snowpack in Mediterranean mountains (e.g., López-Moreno et al., 2011, 2013). The use of SCA is justified in the absence of distributed SWE or HS measurements to validate the model (e.g. Gascoin et al., 2015; Baba et al., 2018a).
3.4 SWE estimation
We used the model outputs to estimate the evolution of the SWE over the three basins (Fig. 1). The basin surface boundaries were used to estimate the SWE contribution for each basin by computing the mean daily SWE for all pixels within each basin. To account for the hydrological contribution of SWE from the snow-dominated regions, the daily distributed SWE was spatially integrated for elevations above 1200 m a.s.l. From the temporal evolution of these basin-scale SWE time series we derived the following key indicators: date and value of the peak SWE (maximum SWE during a water year), snow melt-out date (the first day of the calendar year on which SWE gets below 1 mm w.e.), and distributed SWE for the peak SWE data (this map is important from a hydrological perspective as it shows the amount of snow available for melt at the end of the snowfall season for each hydrological year).
4.1 Model evaluation
Figure 3 compares the observed and modeled SWE evolution using both SnowModel configurations. The Pflug et al. (2019) model provides a better simulation of SWE during the melt season in CED and MZA. At LAQ, both models are biased to draw a robust conclusion on the effect of the percolation scheme. Both models are negatively biased in W1415 and either positively biased (default model) or negatively biased (Pflug et al., 2019) in W1516.

Figure 3Time series of observed and modeled daily SWE at each AWS. SWE data were obtained from manual sampling during snow course measurements.
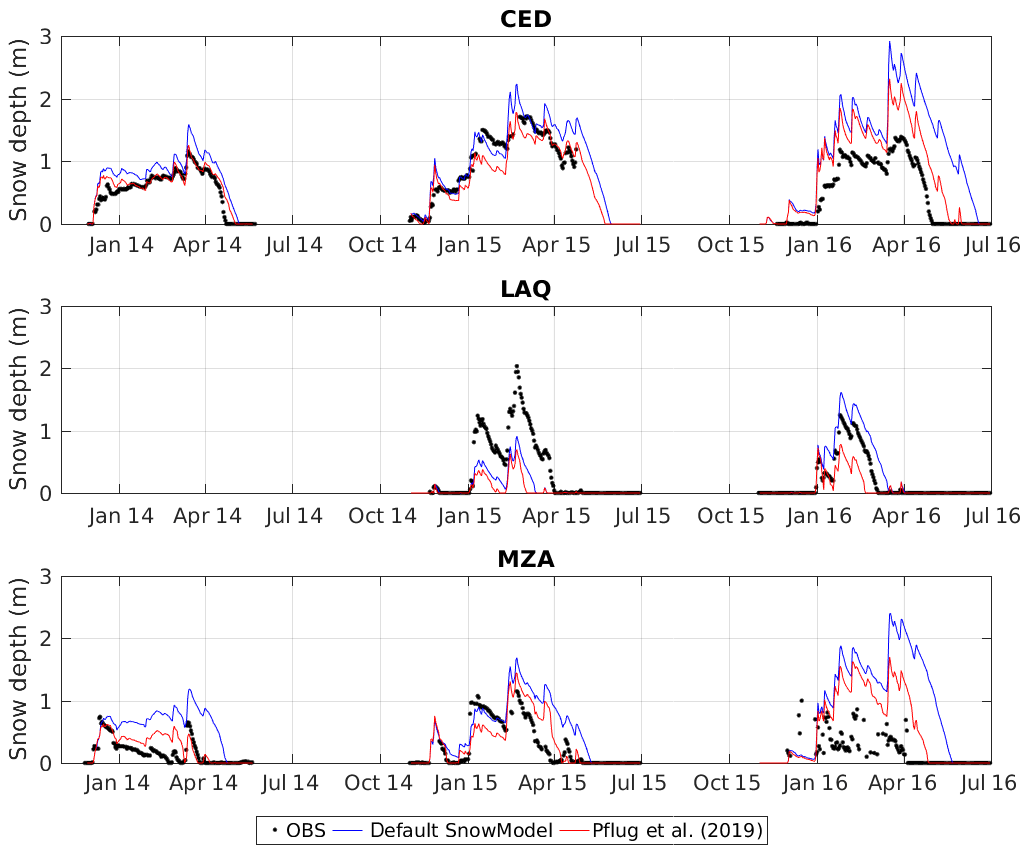
Figure 4 compares the modeled snow depth time series with the continuous snow depth measurements at each AWS. Although the differences between both models are less marked, similar observations as above can be made. This comparison also shows that the model reproduces the snow depth evolution during W1314 and W1415 well at CED and MZA, and the Pflug et al. (2019) model seems to be more consistent at these stations. The model overestimates snow depth at MZA during W1516 but the snow depth measurements are very noisy during this period, suggesting that the data may be affected by a sensor issue, especially given the SWE observations presented above. Otherwise, the same positive bias as noted above (Fig. 3) can be observed at LAQ for W1415.
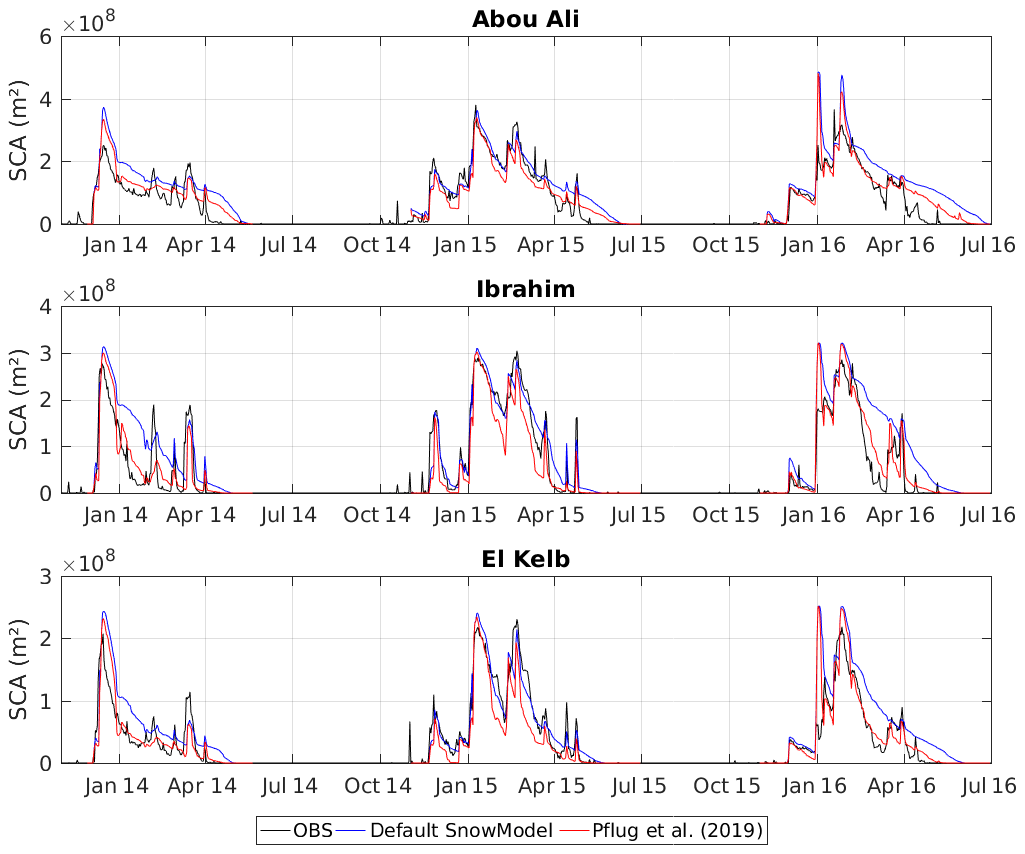
The comparison of the modeled and observed snow cover shows that both models perform well in reproducing the snow cover evolution at the catchment scale, although the default model tends to overestimate the snow cover area during the ablation periods (Fig. 5). This is particularly evident in spring 2016, but also during the atypical melt event in January 2014.
We also evaluate the model using the snow cover duration from MODIS over the entire study area (Fig. 6). The results show that the spatial patterns of snow cover duration are generally better reproduced with the Pflug et al. (2019) scheme. The largest bias is found in the northernmost region, which corresponds to the region with the highest elevation (2700 to 3000 m a.s.l.). However, the average bias for this model configuration over the entire domain remains low (2 d).
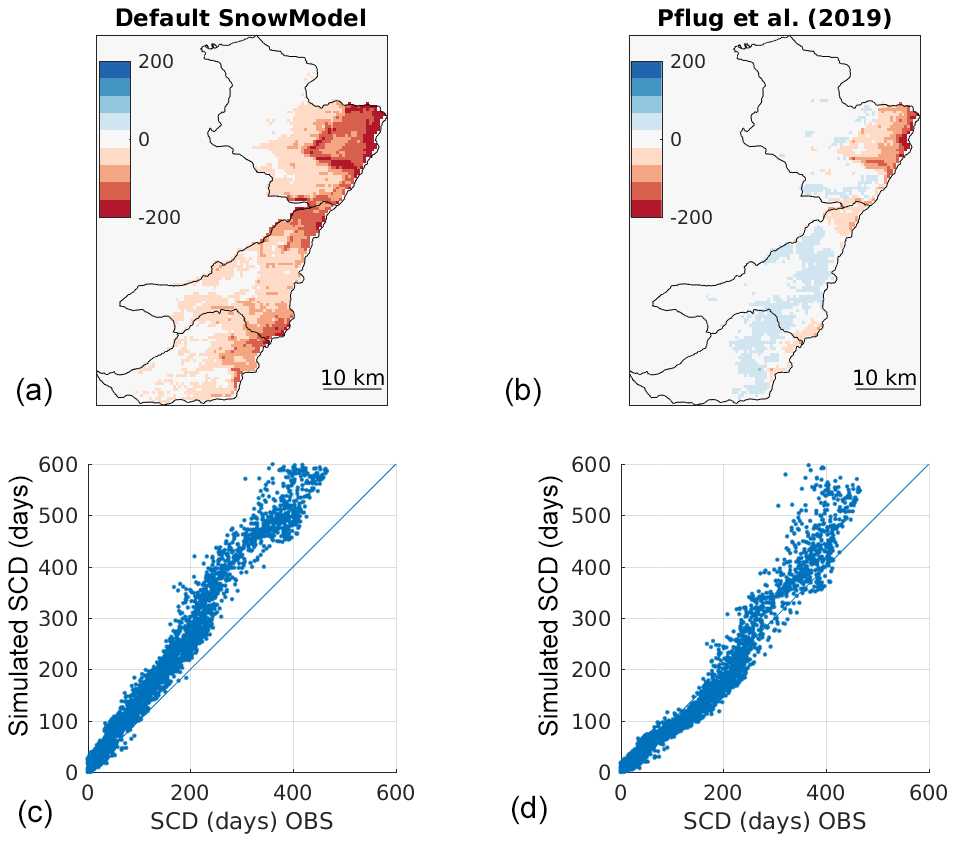
Figure 6(a, b) Difference in days between the MODIS and simulated snow cover duration (SCD), computed over the entire period of the simulation (three snow seasons, from 1 November to 30 June, between 2013 and 2016) using the default SnowModel and the Pflug et al. (2019) model configurations. (c, d) The scatterplots show the pixel-by-pixel comparison of the simulated and MODIS SCD.
Interestingly, Fig. 7 shows that the Pflug et al. (2019) scheme had a greater impact on the snow cover duration in the mid-elevation zones near 2000 m a.s.l. This is consistent with the expected behavior of this scheme since these areas are prone to continuous melting during the winter, and the Pflug et al. (2019) scheme is expected to have a greater impact in areas where the snowpack is wet and isothermal.
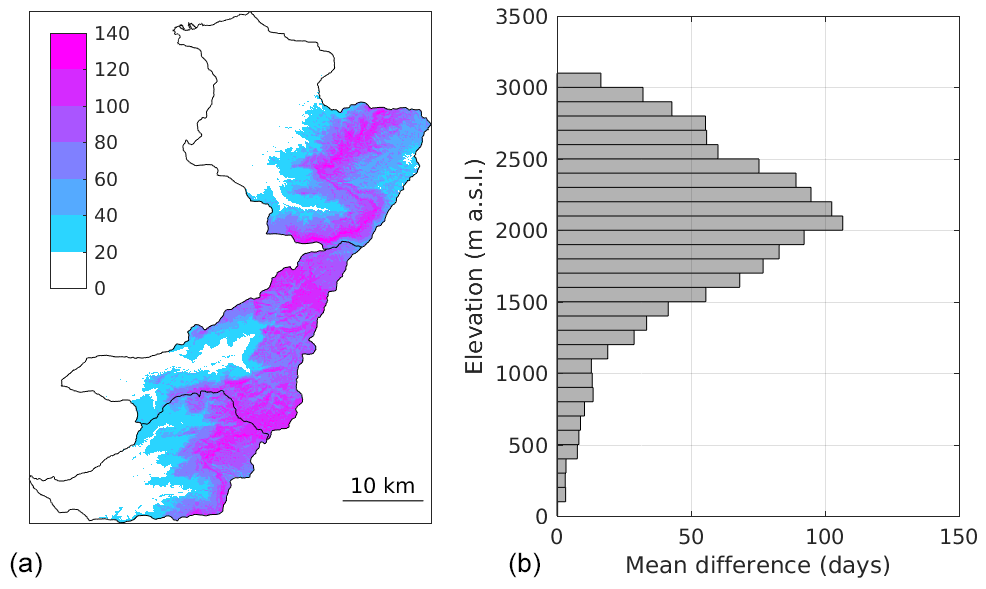
Figure 7(a) Map of the difference in days between the snow cover duration (SCD) simulated by the default model and the Pflug et al. (2019) model. (b) Mean difference by elevation band. The SCD was computed over the simulation period (three snow seasons from 1 November 2013 to 1 July 2016).
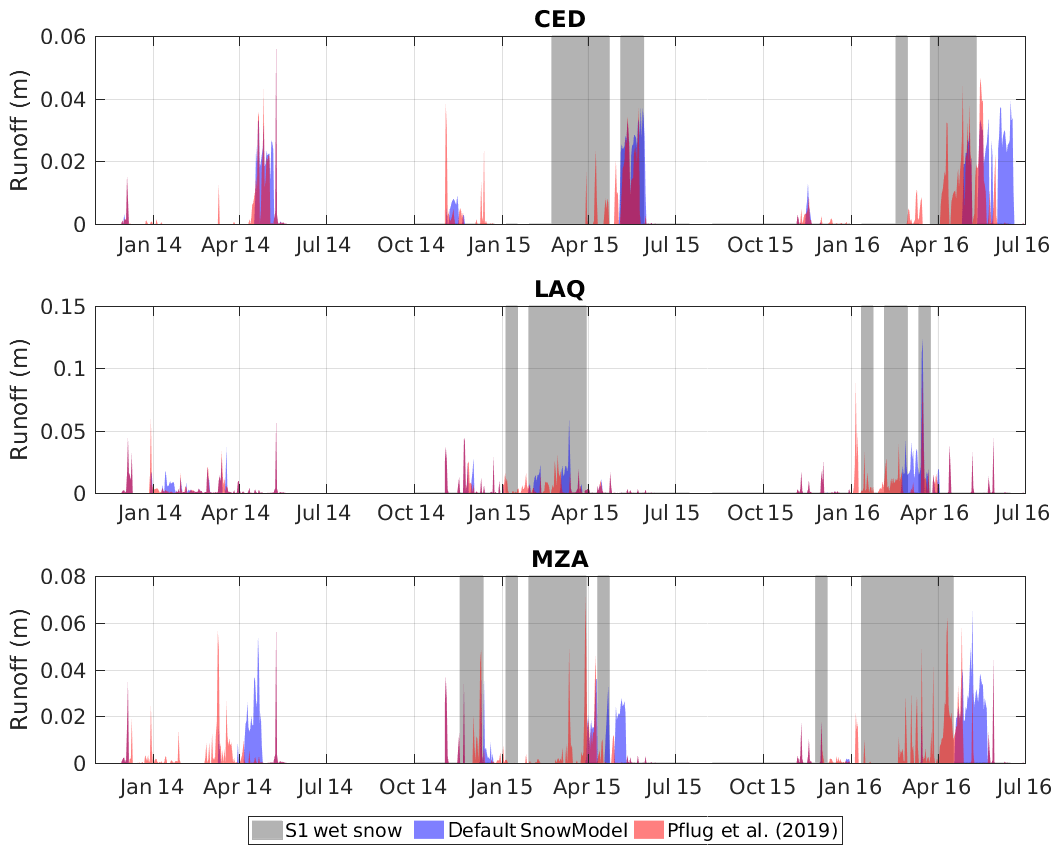
Figure 8Time series of wet snow occurrences as detected from Sentinel-1 observations and modeled daily snowmelt runoff at each AWS.
Figure 8 shows the time series of wet snow detection from Sentinel-1 over the period October 2014 to June 2016 and the simulated melt runoff for both model configurations. It can be observed that at CED and MZA, snowmelt runoff using the default model occurs over a short period of time at the end of the snowmelt season, while the runoff simulated using the Pflug et al. (2019) model occurs earlier in the season and is more temporally distributed. This temporal distribution is consistent with Sentinel-1 data that indicate the presence of liquid water in the snowpack over the same periods. Again, this is consistent with the expected behavior of the new liquid percolation scheme, which allows a more gradual release of liquid water throughout the melt season when the snowpack contains meltwater.
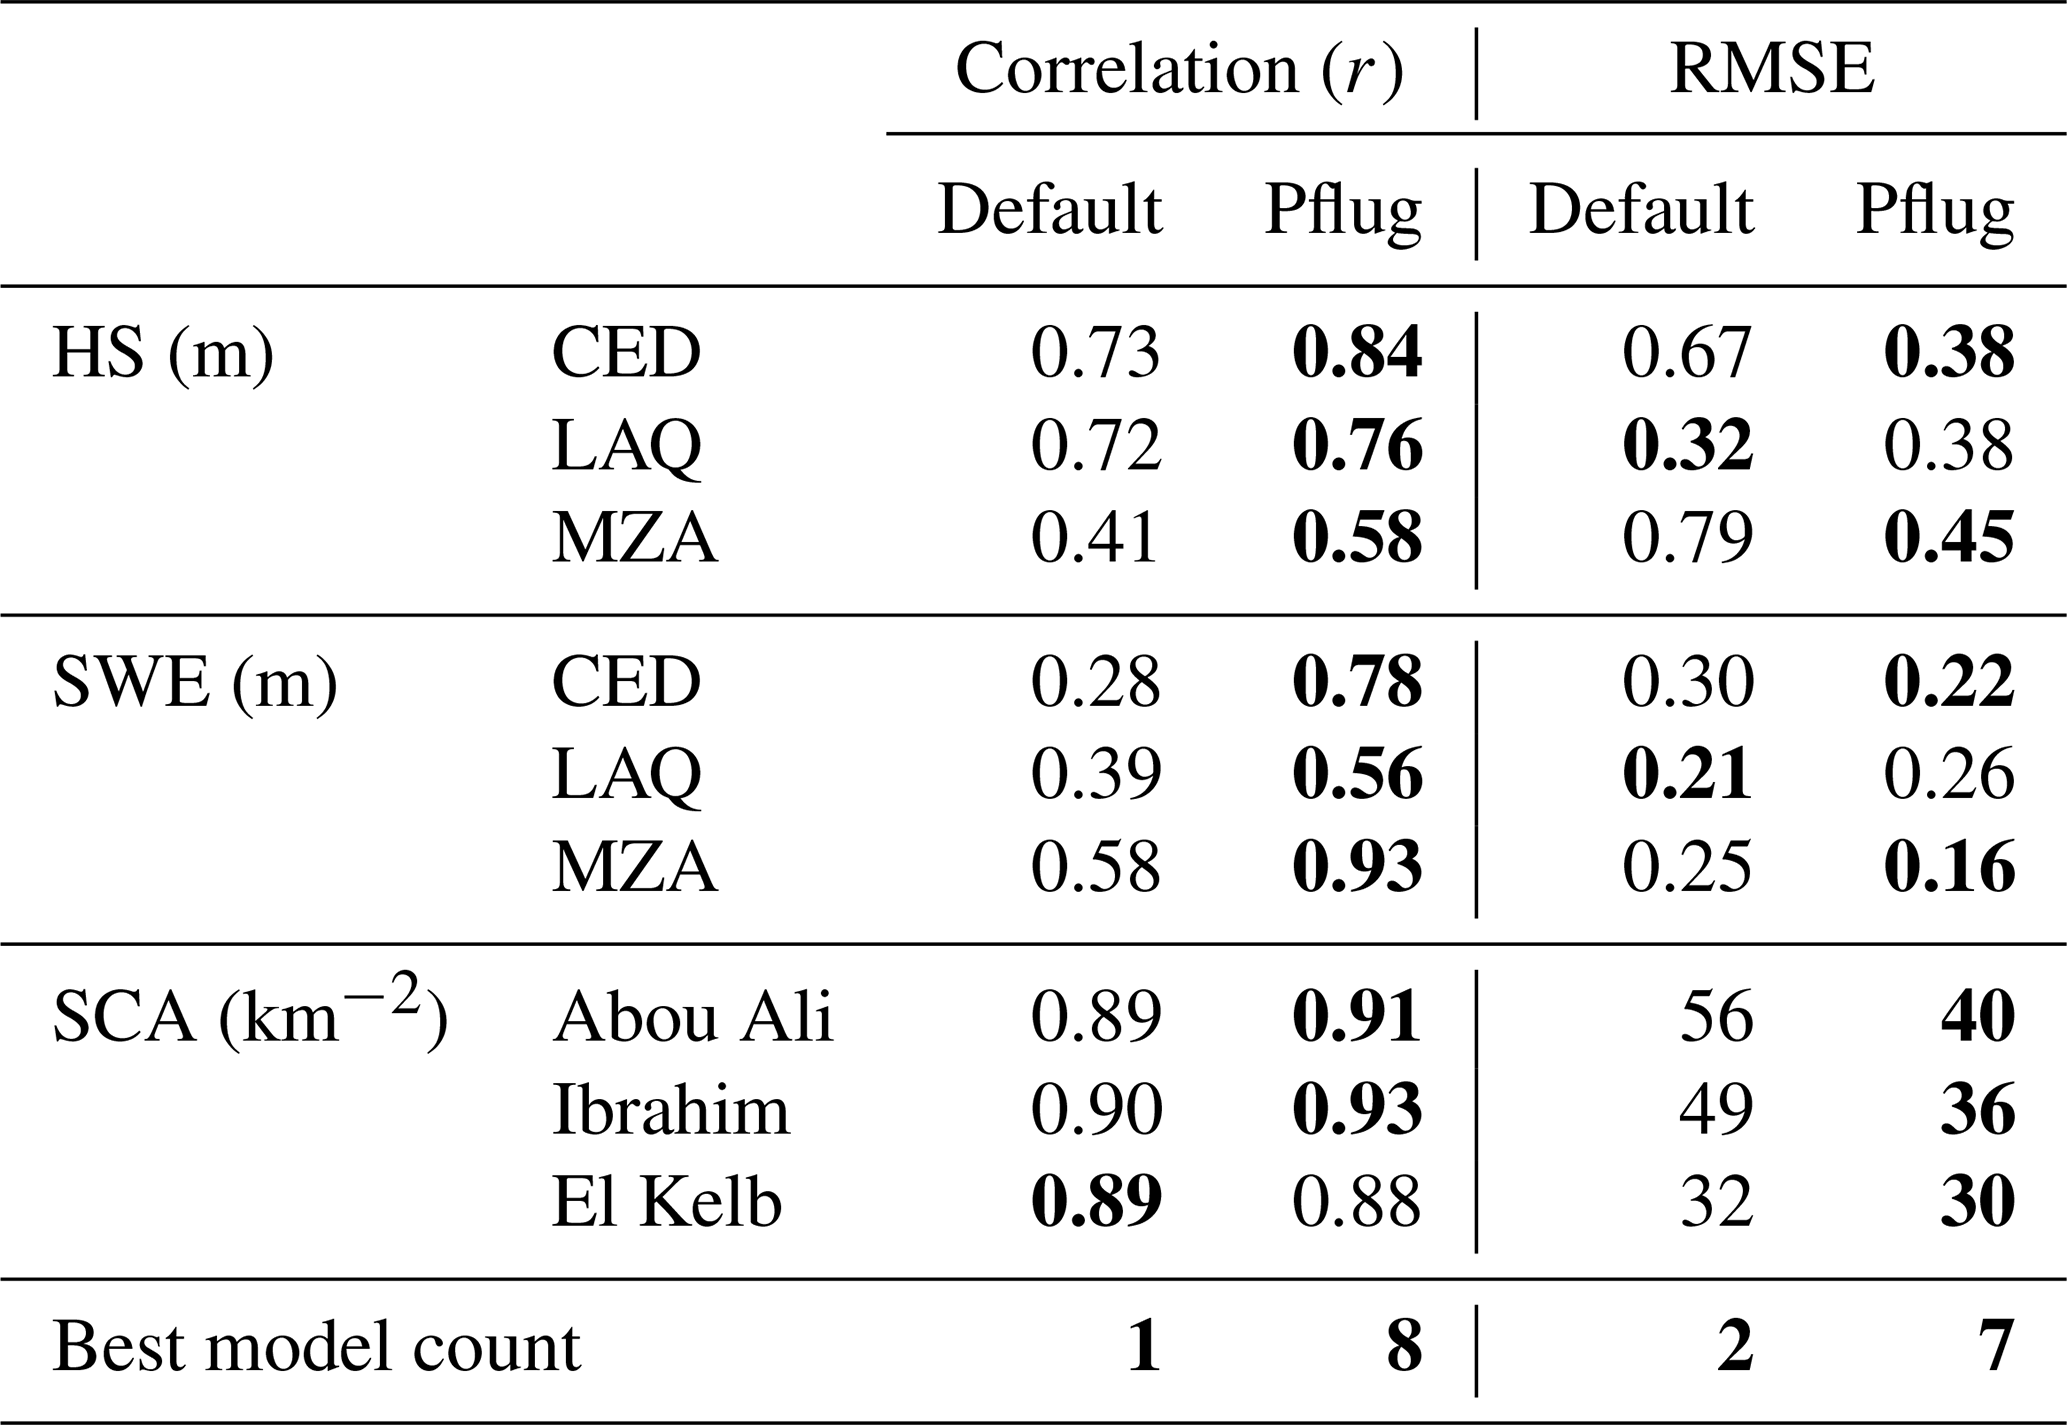
Overall, all above results suggest that the Pflug et al. (2019) model provides a better representation of the snow cover in terms of snow depth, SWE, and SCA. Table 3 shows that the correlation and RMSE are generally improved in comparison with the default model. The notable exceptions are small increases in the RMSE of snow depth and SWE at LAQ, which are hardly conclusive given the large accumulation biases at this AWS (Figs. 3 and 4). At CED and MZA, the performances of the model are significantly improved with the Pflug et al. (2019) version in terms of both correlation and RMSE with observed SWE.
Table 3Performance of both model runs, default SnowModel and Pflug et al. (2019). HS is daily snow height from continuous acoustic gauges, SWE is snow water equivalent from snow course measurements, and SCA is daily snow cover area from MODIS. The values in bold indicate the best performance.
We note that we have also evaluated the modeled shortwave radiation and snow albedo (see Fig. S1 in the Supplement). The results show that the monthly incoming shortwave radiation is well simulated, with correlation coefficients ranging between 0.94 and 0.99 and RMSE ranging between 13 W m−2 (LAQ) and 32 W m−2 (MZA). The snow albedo variability is less accurately captured but the RMSE remains acceptable with 0.086, 0.074, and 0.096 at CED, LAQ, and MZA respectively (Fig. S1).
4.2 Estimation of SWE
Given the better performance of the Pflug et al. (2019) model in this study area, we use this model to characterize the SWE distribution and evolution over the study area. The evolution of the spatially averaged modeled SWE over the study basins above 1200 m a.s.l. is shown in Fig. 9, and the main indicators are provided in Table 4. Figure 9 shows that there is a lot of variability in the SWE evolution during the study period; hence the peak SWE is not clearly defined. However, it was consistently reached on the same date in each catchment for a given water year. During W1314 it occurred early in the snow season on 22 December 2013, and then on 21 February 2015 and 27 January 2016. However, the maximum SWE was nearly reached on 28 March in the Abou Ali catchment, which comprises the highest elevation areas of the study area. The same Abou Ali catchment had the longest snow season, with a melt-out date ranging between 6 May and 8 June, while the melt-out occurred about a month earlier in El Kelb and Ibrahim catchments.

Figure 9Temporal evolution of the simulated SWE above 1200 m a.s.l., based on the Pflug et al. (2019) model outputs.
Table 4Key indicators from the spatially averaged SWE above 1200 m a.s.l. (also see Fig. 11): date and value of the peak SWE and melt-out date. Here the Pflug et al. (2019) results are reported.
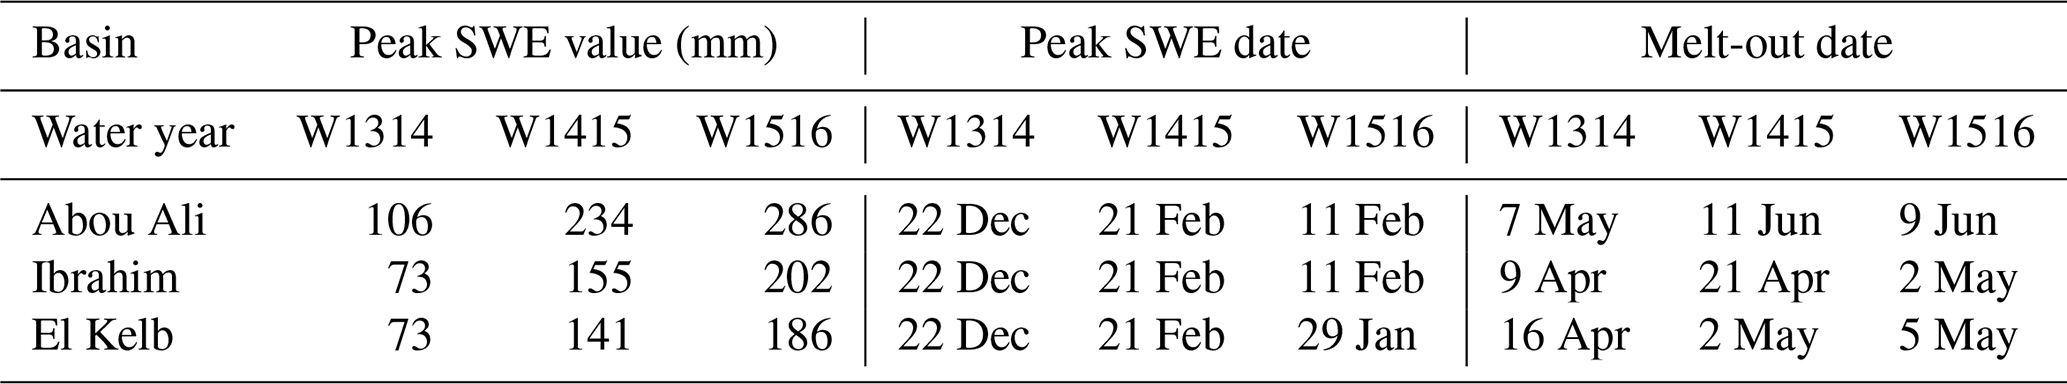

Figure 10Temporal evolution of the spatially integrated mean monthly SWE in cubic meters (total snow mass in each catchment), based on the Pflug et al. (2019) model outputs.
In terms of SWE values, 2015–2016 was the snow season with the largest peak SWE, followed by 2014–2015 and 2013–2014 in the three catchments (Table 4). This is also illustrated in Fig. 10, which presents the temporal evolution of the total mass of snow (expressed in cubic meters of water equivalent) for each catchment. The Abou Ali has the largest snow mass throughout the snow season due to its larger area and higher elevation. The temporal evolution of the three catchments was similar in W1415 and W1516; however, this figure also reveals that the behavior of Abou Ali was different during W1314, with a much larger snow mass in Abou Ali in spring than in El Kelb and Ibrahim catchments. The months with the largest mean snow mass in El Kelb and Ibrahim catchments were December in W1314 and February in W1415 and W1516, while in Abou Ali it was February in W1314, March in W1415, and February in W1516.
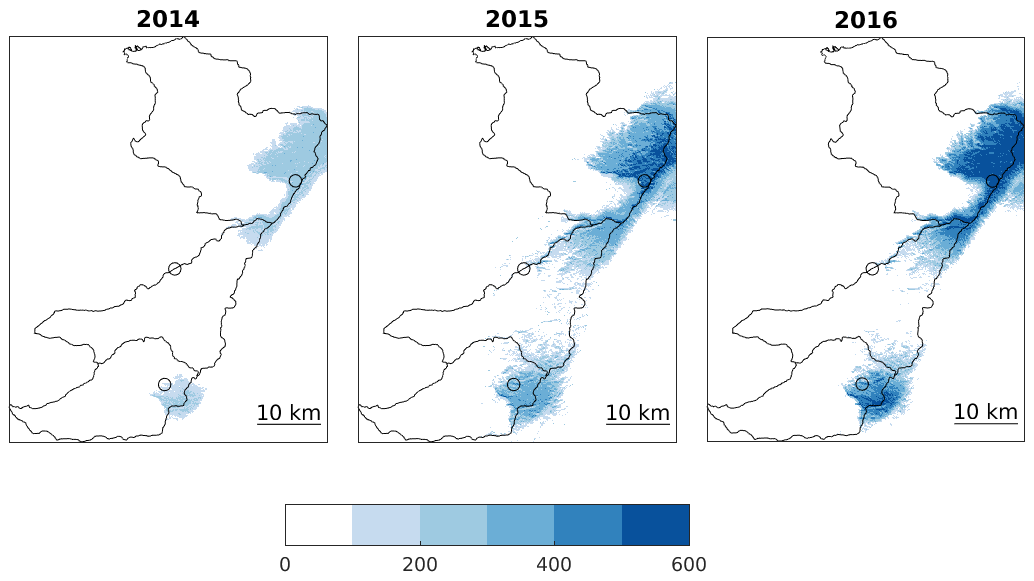
Figure 11Spatial distribution of the simulated SWE (in mm) on 1 March. Here the Pflug et al. (2019) model outputs are shown.
Based on Fig. 10, we selected 1 March as a common date to represent the spatial distribution of SWE across the study domain for the three study years (Fig. 11). These maps further illustrate how the SWE in Mount Lebanon can be strongly impacted by the interannual variability. On 1 March 2016, SWE exceeded 500 mm w.e. over a large portion of the Mount Lebanon range, while it was below 200 mm w.e. on 1 March 2014.
Previous studies showed that SnowModel could overestimate SWE of warm maritime snowpack due to its liquid water percolation parameterization (Sproles et al., 2013; Pflug et al., 2019). We also find that the default SnowModel version overestimates SWE at MZA and CED stations. The available observations show that new percolation scheme by Pflug et al. (2019) allows a clear improvement in modeled SWE but also in the snow depth and snow cover area at the catchment scale.
The improvement with the Pflug et al. (2019) model is similar to what has been reported by the same authors in the Olympic Mountains. The gravity drainage scheme allows a better representation of the liquid water percolation during the melt season, whereas the default density threshold method retains too much liquid water when applied to warm maritime snowpacks. Only at LAQ does the Pflug et al. (2019) version not improve the SWE simulation. However, the snowpack is shallower and the SWE error is already large during the accumulation period at this AWS; hence it is difficult to consider this AWS as a good reference for evaluating a liquid water percolation scheme. This error in SWE at LAQ is probably due to errors in the precipitation input data. This issue is being investigated, but so far we do not have a clear answer. In addition, the model tends to overestimate snow depth whereas there is no clear positive or negative bias in SWE. This suggests that the modeled density might be too low. High densification rates are typical of Mediterranean mountains (Fayad et al., 2017a), and this process might be insufficiently represented in SnowModel. Despite these limitations, however, the overall model evaluation with in situ and remote sensing data suggest that SnowModel modified by Pflug et al. (2019) generates a reasonable estimation of the SWE in Mount Lebanon. It is not possible to make a direct comparison of the results of this study with previous snow studies since the periods of computation do not match, but we note that the orders of magnitude of the peak SWE are compatible (Sect. 1).
The agreement between the measured point scale and modeled SWE in the three basins indicated good agreement, with a correlation coefficient ranging between 0.56 and 0.93 and an RMSE ranging between 16 and 26 cm w.e. (Table 3). The range of the reported RMSE values in Table 3 are not uncommon in mediterranean-like climates (Guan et al., 2013; Musselman et al., 2017). These results indicate that SnowModel modified by Pflug et al. (2019) was able to explain a large part (56 %–93 %) of the variability in the SWE with an accuracy between 16 and 26 cm w.e.
Given the fact that the three AWSs are well distributed in the domain (Fig. 1), the reported RMSE values for snow height (HS), SWE, and SCA (Table 3) can be used as a possible estimate of the uncertainty of SWE in every grid cell. This uncertainty would be a conservative estimate since the random part of the error in the distributed SWE is reduced by the spatial averaging. In addition, the MODIS data showed no evidence of a large systematic SWE error over the domain except in the highest elevation region of the Abou Ali catchment, where the model tends to overestimate the snow cover duration (Fig. 6).
The model results tend to suggest that the spatial variability of SWE is rather low over Mount Lebanon, but this is due to the large-scale morphology of Mount Lebanon, with a strong topographic gradient from the coast to 2000 m a.s.l. followed by a high-elevation plateau. This plateau is situated above the zero-degree isotherm in winter and therefore the snowfall regime is rather homogeneous over this area. However, Mount Lebanon is also characterized by a peculiar heterogeneous topography, visible at smaller scales (below 100 m), with many karstic surface features like sinkholes, which create highly variable snow depth patterns due to wind-driven snow redistribution processes (Fig. 12; Chakra et al., 2019). This variability is not resolved with this current model setup with a grid size of 100 m. This can be explained by the fact that SnowModel does not account for subgrid variability and assumes spatial uniformity over the entire grid cell (Liston and Elder, 2006a). Not accounting for snow subgrid variability is considered a fundamental limitation in the application of snow models and has implications for solving for snow ablation (DeBeer and Pomeroy, 2017). Furthermore, the presence of heterogeneous fractional snow cover (Fig. 12) has major implications for the surface energy fluxes (DeBeer and Pomeroy, 2009). If fact, the heterogeneity in snow cover fraction is known to have implications for the small-scale advection of sensible heat and other local variations in the surface energy balance terms (DeBeer and Pomeroy, 2017). This interaction between the fractional snow cover and the overlaying boundary layer is usually simplified and not captured by most models (DeBeer and Pomeroy, 2009; Mott et al., 2018).
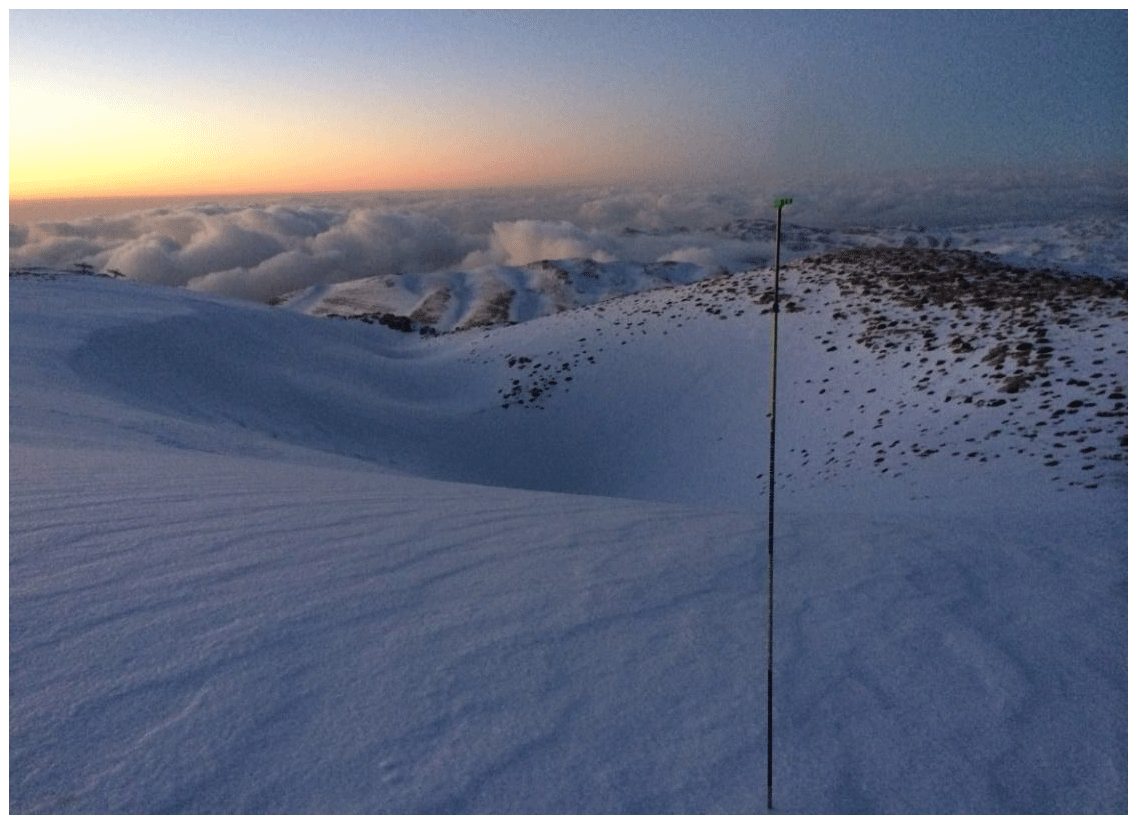
Figure 12Snow redistribution following a major snowfall event at 2310 m a.s.l., 200 m away from the MZA AWS (located to the left of the image). Image taken on 15 January 2016. Snow depth at the station was 7.5 cm. Snow depth measured with snow probes in the vicinity ranged between 0 and 258 cm (n=46) with an average of 117 cm (median =99 cm) and a standard deviation of 67 cm.
Figures 5 and 9 show multiple transient melt periods during the entire snow season. These events can be clearly observed in the three basins during the months of January and February (Fig. 9), which is considered as the accumulation season. Precipitation events during the same months did restore most of the snowpack (Fig. 9). These events, which are more common in warmer climates, such as the Mediterranean climate of Mount Lebanon, make it more difficult to distinctly separate between the accumulation and ablation seasons (DeBeer and Pomeroy, 2017). These transient snowmelt and accumulation events pose major challenges in terms of simulating snow accumulation, its redistribution, and ablation due to the complex nature of these processes, which remain not fully understood (Liston, 1995; Essery et al., 2006).
Model results indicate that the largest snow reserves are found in the Abou Ali catchment (Fig. 10). This is due to its larger area but also to a larger portion of the basin being located at higher elevation bands. As a result, the SWE evolution in the Abou Ali catchment differs from that in the El Kelb and Ibrahim catchment. The snow season is longer and the peak SWE occurs about a month later. Although the study period only spans three snow seasons, a large interannual variability can already be observed.
Both model simulations showed higher biases in computing SWE at lower elevation, whereas the default SnowModel tended to overestimate and the Pflug et al. (2019) model tended to underestimate the SWE in LAQ (Fig. 3). This can be attributed to the separation of rain from snow at lower elevations, and the fact that these regions are more sensitive to rain-on-snow events. Finally, the Pflug et al. (2019) snowpack liquid water percolation algorithm may be overestimating melt at lower elevations. The extent to which these processes are influencing the model performance is still unknown to us.
The snow cover is a critical yet poorly understood water resource in many Mediterranean regions (Fayad et al., 2017a). A good knowledge of the snow water equivalent (SWE) and snowmelt in Mount Lebanon is key for the evaluation and management of the water resources in Lebanon. This study presents the first simulation of the daily SWE in Mount Lebanon over three contrasted snow seasons (2013–2016) in three catchments that are critical in terms of water resources for Lebanon. This was made possible by the availability of new meteorological AWS observations at high elevation (1840–2834 m a.s.l.). The model was evaluated using a number of in situ and remote sensing observations. Recent developments with SnowModel including a gravity drainage formulation instead of the default snow density threshold to control liquid fluxes (Pflug et al., 2019) were beneficial in this study area where the snowpack is subject to multiple snowmelt episodes during the snow season. The results indicated that this improved model was generally able to reproduce the observed snowpack properties with a reasonable performance despite the uncertainties in the model forcing. Although the default version of SnowModel can theoretically be applied in any climatic region since it relies mostly on physical equations to solve the energy and mass balance of the snowpack, it also includes parameterizations to replace processes that are too complex to be physically represented in the model. These parameterizations were primarily derived from studies in Arctic or subarctic regions (e.g., Bruland et al., 2004; Mernild et al., 2008) and should be carefully examined if the model is applied to Mediterranean mountain regions with mild, humid winters.
Over the simulation period 2013–2016, the maximum snow mass was reached between December and March and its magnitude changed significantly from year to year in the three study catchments. The results are subject to large uncertainties given that the model was only partially evaluated despite all the efforts made to collect in situ measurements. In particular there is a mismatch between the spatial scale of field data and the current model extent and resolution which prevents a robust estimation of the model error. To further evaluate the model ability to resolve small-scale variability, higher-resolution remote sensing products like Sentinel-2 SCA (Lebanon has been recently included in Theia Snow collection; Gascoin et al., 2019) or stereo-satellite snow depth (Marti et al., 2016) should be useful. Another important limitation of this work is the short record of the forcing data from the AWSs that does not allow robust conclusions to be drawn on the interannual variability of the SWE in Mount Lebanon and allows even fewer conclusions on the extremes. In particular, exceptional snowfall occurred in Lebanon during winter 2018–2019 and the snow cover was still significant in July near MZA and CED stations. Future work may focus on the application of downscaled climate reanalysis data to extend the study period (Mernild et al., 2017; Baba et al., 2018b). Longer simulations would also enable the use of the simulated snowmelt as input to a karst hydrogeological model in order to improve our knowledge on the snowpack dynamics' influence on the spring discharges and regional water resources.
We found in the Mount Lebanon snowpack some typical features of the Mediterranean snow, i.e., the high temporal variability and the high densification rates (Fayad et al., 2017a). Results from this study indicate that SnowModel modified by Pflug et al. (2019) can provide realistic estimates of SWE, which are essential for understanding the hydrological contribution of the snowpack from Mount Lebanon. Yet, there are many aspects of the model that could be further improved:
-
The comparison with MODIS data suggests that the enhanced model performed better at mid-elevations but there remains a positive bias in the snow cover duration at high elevation (Fig. 6). In this study, the model was forced with observations collected from three AWS, but precipitation data were not available at the highest AWS (CED). Since then a precipitation gauge was installed at CED and high-elevation precipitation data are available. Therefore, we suggest that the simulations could be improved by using observed precipitation from all stations to have a better representation of the high-elevation precipitation volumes.
-
Given that temperatures remain close to 0 ∘C during winter precipitation events over large areas of Mount Lebanon, a better parameterization of the precipitation phase partitioning is expected to enhance the simulations and help to capture the rain-on-snow events better. In general, this is probably a key issue for Mediterranean mountain regions with mild winters.
-
Blowing snow and its redistribution are important in this study domain. This is justified by the high variability of snow depth at shorter distances as concluded from the field observations conducted by the authors during two winter seasons. The existence of a large number of sinkholes in the region act as a trap for blowing snow. Figure 11 shows an example where snow depth varies from zero to more than 2.5 m over distances as short as a few hundred meters due to snow transport by wind. Previous work showed that the blowing-snow and snow redistribution module in SnowModel improves the accuracy of the simulations (see Gascoin et al., 2013). Hence, we chose not to focus on this aspect in this study and assume that it contributes to a realistic representation of the snowpack. Capturing snow redistribution of snow in the future would probably require focusing on a smaller model domain with an accurate fine-scale elevation DEM that is currently not available in this region. A proper representation of the snow redistribution could also help in better explaining the role of advective heat fluxes and improve the model performance in capturing SWE.
-
Snow sublimation can be a significant component of the snow mass balance, as in other Mediterranean mountains (e.g., Schulz and de Jong, 2004). In SnowModel there are two sources of sublimation: static surface sublimation and blowing-snow sublimation. Figure 13 shows the distribution of the mean annual sublimation rate, which reaches 70 mm w.e. in the upper area of the study domain and accounts for a fraction of about 5 % to 15 % of the annual peak SWE. Our justifications for the relatively low sublimation rates over the study domain can be associated with the (1) high relative humidity due to the proximity to the Mediterranean Sea, which reduces both sources of sublimation, and (2) the high snow densification rates that inhibit blowing-snow sublimation (Liston and Elder, 2006a). We are unable to qualify the simulated sublimation; however, point (2) is compatible with our field observations that the snow surface at mid-elevation is subject to multiple melt and refreeze events. Such a snowpack surface limits the capacity for snow removal by wind and hence reduces snow sublimation. To conclude, the model suggests that the sublimation is probably not the main source of uncertainty in this area (precipitation remains the main uncertainty), but we suggest this aspect should be the focus of further investigation using in situ measurements by eddy covariance towers or lysimeters.
-
The surface radiative forcing effects due to the deposition of mineral dust, such as those from the African Sahara and the Arabian Desert, are not included in SnowModel, but recent studies in regions with similar climate suggest that it can have a significant impact on snowmelt runoff (e.g., Painter et al., 2018). In fact, most of the energy used for snowmelt is shortwave radiation. With the occurrence of numerous dust storm events in this region, a proper parameterization of surface albedo (through assimilation of remote sensing products) could for example help to capture the onset of snowmelt better, especially at mid-elevations. Collecting information on the radiative and thermal fluxes and measuring the properties of the different snowpack layers could help to represent these processes better in models.
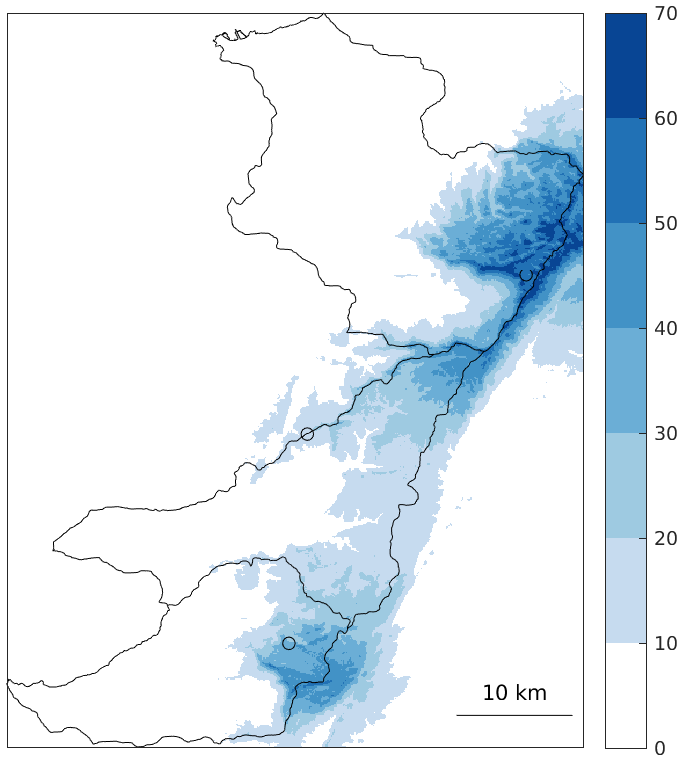
Figure 13Mean annual snow sublimation in millimeters (Pflug et al., 2019 model).
Finally, a specific feature of Mount Lebanon is that most of the snow accumulates on a high-elevation plateau. This morphology implies that the seasonal snow cover could be highly impacted by a rise in the mean zero-degree isotherm altitude in winter, which determines the partition of precipitation into rain or snow. Given the importance of snowmelt for groundwater recharge and water supply in Lebanon, it is urgent to evaluate the vulnerability of the snowfall regime to climate change in Mount Lebanon.
The SnowModel code is archived at https://github.com/jupflug/SnowModel (last access: 12 July 2019) (Pflug, 2019). Model forcing and validation data are available at https://doi.org/10.5281/zenodo.583733 (Fayad et al., 2017c).
The supplement related to this article is available online at: https://doi.org/10.5194/hess-24-1527-2020-supplement.
Both AF and SG worked on the conceptualization of the research goals and the design of the methodology as well as analyzing the model outputs. AF and SG contributed equally to the writing and editing of the paper.
The authors declare that they have no conflict of interest.
This article is part of the special issue “Changes in the Mediterranean hydrology: observation and modeling”. It is not associated with a conference.
This publication was made possible through support provided by the French National Research Institute for Sustainable Development (IRD) and the Centre national d'études spatiales (CNES) via its Tosca program. This paper was improved thanks to the constructive comments of Ali Nadir Arslan and one anonymous reviewer. The authors also gratefully acknowledge editor Ryan Teuling for handling this paper and providing helpful comments to improve the presentation of our work.
This research has been supported by the ERANET-MED CHAAMS Project (grant no. 03-62).
This paper was edited by Ryan Teuling and reviewed by A.N. Arslan and one anonymous referee.
Aouad-Rizk, A., Job, J.-O., Khalil, S., Touma, T., Bitar, C., Boqcuillon, C., and Najem, W.: Snow in Lebanon: a preliminary study of snow cover over Mount Lebanon and a simple snowmelt model/Etude préliminaire du couvert neigeux et modèle de fonte des neige pour le Mont Liban, Hydrolog. Sci. J., 50, 555–569, https://doi.org/10.1623/hysj.50.3.555.65023, 2005.
Baba, M. W., Gascoin, S., Kinnard, C., Marchane, A., and Hanich, L.: Assimilation of Sentinel-2 Data into a Snowpack Model in the High Atlas of Morocco, Remote Sens., 10, 1982, https://doi.org/10.3390/rs10121982, 2018a.
Baba, M. W., Gascoin, S., Jarlan, L., Simonneaux, V., and Hanich, L.: Variations of the snow water equivalent in the Ourika catchment (Morocco) over 2000–2018 using downscaled MERRA-2 data, Water, 10, 1120, https://doi.org/10.3390/w10091120, 2018b.
Baba, M. W., Gascoin, S., Kinnard, C., Marchane, A., and Hanich, L.: Effect of digital elevation model resolution on the simulation of the snow cover evolution in the High Atlas, Water Resour. Res., 55, 5360–5378, https://doi.org/10.1029/2018WR023789, 2019.
Bruland, O., Liston, G. E., Vonk, J., Sand, K., and Killingtveit, Å.: Modelling the snow distribution at two high arctic sites at Svalbard, Norway, and at an alpine site in central Norway, Hydrol. Res., 35, 191–208, 2004.
Chakra, C. A., Gascoin, S., Somma, J., Fanise, P., and Drapeau, L.: Monitoring the Snowpack Volume in a Sinkhole on Mount Lebanon using Time Lapse Photogrammetry, Sensors, 19, 3890, https://doi.org/10.3390/s19183890, 2019.
Cook, B. I., Anchukaitis, K. J., Touchan, R., Meko, D. M., and Cook, E. R.: Spatiotemporal drought variability in the Mediterranean over the last 900 years, J. Geophys. Res.-Atmos., 121, 2060–2074, https://doi.org/10.1002/2015JD023929, 2016.
DeBeer, C. M. and Pomeroy, J. W.: Modelling snow melt and snowcover depletion in a small alpine cirque, Canadian Rocky Mountains, Hydrol. Process., 23, 2584–2599, 2009.
DeBeer, C. M. and Pomeroy, J. W: Influence of snowpack and melt energy heterogeneity on snow cover depletion and snowmelt runoff simulation in a cold mountain environment, J. Hydrol., 553, 199–213, 2017.
Doummar, J., Geyer, T., Baierl, M., Nödler, K., Licha, T., and Sauter, M.: Carbamazepine breakthrough as indicator for specific vulnerability of karst springs: Application on the Jeita spring, Lebanon, Appl. Geochem., 47, 150–156, https://doi.org/10.1016/j.apgeochem.2014.06.004, 2014.
Essery, R., Granger, R., and Pomeroy, J.: Boundary-layer growth and advection of heat over snow and soil patches: modelling and parameterization, Hydrol. Process., 20, 953–967, 2006.
Fayad, A., Gascoin, S., Faour, G., López-Moreno, J. I., Drapeau, L., Le Page, M., and Escadafal, R.: Snow hydrology in Mediterranean mountain regions: A review, J. Hydrol., 551, 374–396, 2017a.
Fayad, A., Gascoin, S., Faour, G., Fanise, P., Drapeau, L., Somma, J., Fadel, A., Al Bitar, A., and Escadafal, R.: Snow observations in Mount Lebanon (2011–2016), Earth Syst. Sci. Data, 9, 573–587, https://doi.org/10.5194/essd-9-573-2017, 2017b.
Fayad, A., Gascoin, S., Faour, G., Fanise, P., and Drapeau, L.: Snow dataset for Mount-Lebanon (2011–2016), https://doi.org/10.5281/zenodo.583733, 2017c.
Fish, W. B.: The Lebanon, Geogr. Rev., 34, 235–258, 1944.
Gascoin, S., Lhermitte, S., Kinnard, C., Bortels, K., and Liston, G. E.: Wind effects on snow cover in Pascua-Lama, Dry Andes of Chile, Adv. Water Resour., 55, 25–39, 2013.
Gascoin, S., Hagolle, O., Huc, M., Jarlan, L., Dejoux, J.-F., Szczypta, C., Marti, R., and Sánchez, R.: A snow cover climatology for the Pyrenees from MODIS snow products, Hydrol. Earth Syst. Sci., 19, 2337–2351, https://doi.org/10.5194/hess-19-2337-2015, 2015.
Gascoin, S., Grizonnet, M., Bouchet, M., Salgues, G., and Hagolle, O.: Theia Snow collection: high-resolution operational snow cover maps from Sentinel-2 and Landsat-8 data, Earth Syst. Sci. Data, 11, 493–514, https://doi.org/10.5194/essd-11-493-2019, 2019.
Gorelick, N., Hancher, M., Dixon, M., Ilyushchenko, S., Thau, D., and Moore, R.: Google Earth Engine: Planetary-scale geospatial analysis for everyone, Remote Sens. Environ., 202, 18–27, 2017.
Guan, B., Molotch, N., Waliser, D., Jepsen, S., Painter, T., and Dozier, J.: Snow water equivalent in the Sierra Nevada: Blending snow sensor observations with snowmelt model simulations, Water Resour. Res. 49, 5029–5046, 2013.
Harder, P. and Pomeroy, J. W.: Hydrological model uncertainty due to precipitation-phase partitioning methods, Hydrol. Process., 28, 4311–4327, 2014.
Harpold, A. A., Kaplan, M. L., Klos, P. Z., Link, T., McNamara, J. P., Rajagopal, S., Schumer, R., and Steele, C. M.: Rain or snow: hydrologic processes, observations, prediction, and research needs, Hydrol. Earth Syst. Sci., 21, 1–22, https://doi.org/10.5194/hess-21-1-2017, 2017.
Jordan, R.: A one dimensional temperature model for a snow cover: Technical documentation for SNTHERM.89, Cold Regions Research and Engineering Lab, Hanover, NH, USA, 1991.
Königer, P. and Margane, A.: Stable Isotope Investigations in the Jeita Spring catchment, Technical Cooperation Project Protection of Jeita Spring, BGR Technical Report No. 12., 56 pp., Hannover, Germany, 2014.
Kumar, S., Zwiers, F., Dirmeyer, P., Lawrence, D., Shrestha, R., and Werner, A.: Terrestrial contribution to the heterogeneity in hydrological changes under global warming, Water Resour. Res, 52, 3127–3142, 2016.
Lebanese Ministry of Energy and Water: Lebanese National Water Sector Strategy (as approved by the Lebanese Government resolution No 2. Date: 9 March 2012), available at: http://www.databank.com.lb/docs/National Water Sector Strategy 2010-2020.pdf (last access: 12 July 2019), 2012.
Lebanese Ministry of Environment (MOE/UNDP/ECODIT): State and Trends of the Lebanese Environment, available at: http://www.undp.org.lb/communication/publications/downloads/SOER_en.pdf (last access: 12 July 2019), 2011.
Liston, G. E.: Local advection of momentum, heat, and moisture during the melt of patchy snow covers, J. Appl. Meteorol., 34, 1705–1715, 1995.
Liston, G. E. and Elder, K.: A distributed snow-evolution modeling system (SnowModel), J. Hydrometeorol., 7, 1259–1276, 2006a.
Liston, G. E. and Elder, K.: A meteorological distribution system for high-resolution terrestrial modeling (MicroMet), J. Hydrometeorol., 7, 217–234, 2006b.
Liston, G. E. and Hiemstra, C. A.: A simple data assimilation system for complex snow distributions (SnowAssim), J. Hydrometeorol., 9, 989–1004, 2008.
Liston, G. E. and Mernild, S. H.: Greenland freshwater runoff. Part I: A runoff routing model for glaciated and nonglaciated landscapes (HydroFlow), J. Climate, 25, 5997–6014, 2012.
Liston, G. E., Pielke, R. A., and Greene, E. M.: Improving first order snow related deficiencies in a regional climate model, J. Geophys. Res.-Atmos., 104, 19559–19567, 1999.
Liston, G. E., Haehnel, R. B., Sturm, M., Hiemstra, C. A., Berezovskaya, S., and Tabler, R. D.: Simulating complex snow distributions in windy environments using SnowTran-3D, J. Glaciol., 53, 241–256, 2007.
Loarie, S., Duffy, P., Hamilton, H., Asner, G., Field, C., and Ackerly, D.: The velocity of climate change, Nature, 462, 1052–1055, 2009.
López-Moreno, J. I., Fassnacht, S. R., Beguería, S., and Latron, J. B. P.: Variability of snow depth at the plot scale: implications for mean depth estimation and sampling strategies, The Cryosphere, 5, 617–629, https://doi.org/10.5194/tc-5-617-2011, 2011.
López-Moreno, J. I., Fassnacht, S. R., Heath, J. T., Musselman, K. N., Revuelto, J., Latron, J., Morán-Tejeda, E., and Jonas, T.: Small scale spatial variability of snow density and depth over complex alpine terrain: Implications for estimating snow water equivalent, Adv. Water Resour., 55, 40–52, 2013.
Margane, A., Schuler, P., Königer, P., Abi Rizk, J., Stoeckl, L., and Raad, R.: Hydrogeology of the Groundwater Contribution Zone of Jeita Spring, Technical Cooperation Project Protection of Jeita Spring, BGR Technical Report No. 5, 317 pp., Raifoun, Lebanon, 2013.
Marti, R., Gascoin, S., Berthier, E., de Pinel, M., Houet, T., and Laffly, D.: Mapping snow depth in open alpine terrain from stereo satellite imagery, The Cryosphere, 10, 1361–1380, https://doi.org/10.5194/tc-10-1361-2016, 2016.
Mernild, S. H., Hasholt, B., and Liston, G. E.: Climatic control on river discharge simulations, Zackenberg River drainage basin, northeast Greenland, Hydrol. Process., 22, 1932–1948, 2008.
Mernild, S. H., Liston, G. E., Hiemstra, C. A., Malmros, J. K., Yde, J. C., and McPhee, J.: The Andes Cordillera. Part I: snow distribution, properties, and trends (1979–2014), Int. J. Climatol., 37, 1680–1698, 2017.
Mhawej, M., Faour, G., Fayad, A., and Shaban, A.: Towards an enhanced method to map snow cover areas and derive snow-water equivalent in Lebanon, J. Hydrol., 513, 274–282, https://doi.org/10.1016/j.jhydrol.2014.03.058, 2014.
Mott, R., Vionnet, V., and Grünewald, T.: The seasonal snow cover dynamics: review on wind-driven coupling processes, Front. Earth Sci., 6, 197, https://doi.org/10.3389/feart.2018.00197, 2018.
Musselman, K. N., Molotch, N. P., and Margulis, S. A.: Snowmelt response to simulated warming across a large elevation gradient, southern Sierra Nevada, California, The Cryosphere, 11, 2847–2866, https://doi.org/10.5194/tc-11-2847-2017, 2017.
Nagler, T., Rott, H., Ripper, E., Bippus, G., and Hetzenecker, M.: Advancements for snowmelt monitoring by means of sentinel-1 SAR, Remote Sensing, 8, 348, https://doi.org/10.3390/rs8040348, 2016.
National Council for Scientific Research (NCRS): Land-use land cover map of Lebanon, Beirut, Lebanon, available at: http://www.cnrs.edu.lb/ (last access: 12 July 2019), 2015.
Nohara, D., Kitoh, A., Hosaka, M., and Oki, T.: Impact of climate change on river discharge projected by multimodel ensemble, J. Hydrometeorol., 7, 1076–1089, 2006.
Painter, T. H., Skiles, S. M., Deems, J. S., Brandt, W. T., and Dozier, J.: Variation in rising limb of Colorado River snowmelt runoff hydrograph controlled by dust radiative forcing in snow, Geophys. Res. Lett., 45, 797–808, https://doi.org/10.1002/2017GL075826, 2018.
Pflug, J. M.: SnowModel code, available at: https://github.com/jupflug/SnowModel, last access: 12 July 2019.
Pflug, J. M., Liston, G. E., Nijssen, B., and Lundquist, J. D.: Testing model representations of snowpack liquid water percolation across multiple climates, Water Resour. Res., 55, 4820–4838, 2019.
Schulz, O. and de Jong, C.: Snowmelt and sublimation: field experiments and modelling in the High Atlas Mountains of Morocco, Hydrol. Earth Syst. Sci., 8, 1076–1089, https://doi.org/10.5194/hess-8-1076-2004, 2004.
Shaban, A., Faour, G., Khawlie, M., and Abdallah, C.: Remote sensing application to estimate the volume of water in the form of snow on Mount Lebanon/Application de la télédétection à l'estimation du volume d'eau sous forme de neige sur le Mont Liban, Hydrolog. Sci. J., 49, 643–653, https://doi.org/10.1623/hysj.49.4.643.54432, 2004.
Sproles, E. A., Nolin, A. W., Rittger, K., and Painter, T. H.: Climate change impacts on maritime mountain snowpack in the Oregon Cascades, Hydrol. Earth Syst. Sci., 17, 2581–2597, https://doi.org/10.5194/hess-17-2581-2013, 2013.
Stroeve, J., Box, J.E., Wang, Z., Schaaf, C., and Barrett, A.: Re-evaluation of MODIS MCD43 Greenland albedo accuracy and trends, Remote Sens. Environ., 138, 199–214, 2013.
Sturm, M., Holmgren, J., and Liston, G. E.: A seasonal snow cover classification system for local to global applications, J. Climate, 8, 1261–1283, 1995.
Sturm, M., Taras, B., Liston, G., Derksen, C., Jonas, T., and Lea, J.: Estimating snow water equivalent using snow depth data and climate classes, J. Hydrometeorol., 11, 1380–1394, 2010.
Telesca, L., Shaban, A., Gascoin, S., Darwich, T., Drapeau, L., Hage, M., and Faour, G.: Characterization of the time dynamics of monthly satellite snow cover data on Mountain Chains in Lebanon, J. Hydrol., 519, 3214–3222, https://doi.org/10.1016/j.jhydrol.2014.10.037, 2014.
UN Development Programme (UNDP): Assessment of Groundwater Resources of Lebanon, Beirut, available at: http://www.lb.undp.org/content/lebanon/en/home/library/environment_energy/assessment-of-groundwater-resources-of-lebanon.html (last access: 7 August 2017), 2014.
Viviroli, D., Dürr, H. H., Messerli, B., Meybeck, M., and Weingartner, R.: Mountains of the world, water towers for humanity: Typology, mapping, and global significance, Water Resour. Res., 43, W07447, https://doi.org/10.1029/2006WR005653, 2007.