the Creative Commons Attribution 4.0 License.
the Creative Commons Attribution 4.0 License.
Technical note: An improved discharge sensitivity metric for young water fractions
Francesc Gallart
Jana von Freyberg
María Valiente
James W. Kirchner
Pilar Llorens
Jérôme Latron
Recent virtual and experimental investigations have shown that the young water fraction Fyw (i.e. the proportion of catchment outflow younger than circa 2–3 months) increases with discharge in most catchments. The discharge sensitivity of Fyw has been defined as the rate of increase in Fyw with increasing discharge (Q) and has been estimated by the linear regression slope between Fyw and Q, hereafter called DS(Q). The combined use of both metrics, Fyw and DS(Q), provides a promising method for catchment inter-comparison studies that seek to understand streamflow generation processes. Here we explore the discharge sensitivity of Fyw in the intensively sampled small Mediterranean research catchment Can Vila. Intensive sampling of high flows at Can Vila allows young water fractions to be estimated for the far upper tail of the flow frequency distribution. These young water fractions converge toward 1 at the highest flows, illustrating a conceptual limitation in the linear regression method for estimating DS(Q) as a metric of discharge sensitivity: Fyw cannot grow with discharge indefinitely, since the fraction of young water in discharge can never be larger than 1. Here we propose to quantify discharge sensitivity by the parameter of an exponential-type equation that expresses how Fyw varies with discharge. The exponential parameter (Sd) approximates DS(Q) at moderate discharges where Fyw is well below 1; however, the exponential equation and its discharge sensitivity metric better capture the non-linear relationship between Fyw and Q and are robust with respect to changes in the range of sampled discharges, allowing comparisons between catchments with strongly contrasting flow regimes.
- Article
(2675 KB) - Full-text XML
- BibTeX
- EndNote
The seasonal cycles of stable isotopes in precipitation are damped and phase-shifted as they are transmitted through catchments and thus can be used to infer properties of catchment travel-time distributions (e.g. DeWalle et al., 1997; McGuire and McDonnell, 2006). The young water fraction (Fyw), or the proportion of catchment outflow younger than circa 2–3 months, can be estimated as the ratio between the seasonal cycle amplitudes of stable water isotopes in precipitation and stream water. This ratio consistently predicts Fyw across a wide range of transit time distributions, whereas the same range of distributions yields widely varying mean transit times (Kirchner, 2016a).
The young water fraction usually increases with stream discharge (Kirchner, 2016b). To account for this flow dependency in their study of 22 Swiss catchments, von Freyberg et al. (2018) distinguished between time-weighted (Fyw) and flow-weighted () young water fractions and introduced the “discharge sensitivity of the young water fraction” (which we term DS(Q)) as a metric of the progressive increase of Fyw with increasing catchment discharge (Q). Thus, by combining the mean and its sensitivity to discharge, catchment young water response can be classified in two dimensions: catchments with low or high and with low or high DS(Q) (Fig. 10 in von Freyberg et al., 2018). Because these two variables did not correlate with each other and correlated with different catchment characteristics, von Freyberg et al. (2018) suggested that and DS(Q) are two independent metrics that can be informative in catchment inter-comparison studies.
These authors used the linear slope between Fyw (–) and discharge rate Q (mm d−1) for calculating DS(Q) (d mm−1). The use of discharge rate instead of volume rate (m3 d−1) is sensible because of its independence from catchment area. Von Freyberg et al. (2018) justified the choice of using Q as forcing variable instead of log(Q), which is more sensitive to low flows, by the main focus of the study being storm runoff generation.
Von Freyberg et al. (2018) determined DS(Q) through a non-linear fitting algorithm. They assumed that the seasonal cycle amplitude (AS) of the stable water isotope signal in stream water varies with Q, but the corresponding cycle amplitude in precipitation (AP) does not, such that Fyw varies with Q as
and the isotopic signal of stream water cS(t) (‰) follows a sinusoid function
where φS is the phase of the seasonal cycle (rad), t is the time (fractional years), f is the frequency (yr−1, equal to 1 for a full annual cycle) and kS (‰) is a constant describing the vertical offset of the isotope signal.
Then if AS is approximated as a linear function of Q,
Eq. (2) can be rewritten as
and the slope (mS) and the intercept (nS) of Eq. (3) can be obtained from time series of cS and Q by fitting the four parameters mS, nS, φS, and kS in Eq. (4) using non-linear fitting methods.
Combining Eqs. (1) and (3) yields
Thus DS(Q), the linear slope of the dependence of Fyw on Q, can be approximated as mS∕AP, which has units of Q−1.
We applied the approach outlined above to the small Mediterranean Can Vila catchment (Vallcebre Research Catchments, Llorens et al., 2018). The objectives were to better understand the Can Vila catchment's hydrology and to test the Fyw and discharge sensitivity concepts in an environment that was different, in terms of climate, catchment characteristics and sampling strategy, from the Swiss catchments studied by von Freyberg et al. (2018). This technical note focuses only on the aspects of this research that are relevant to the estimation of Fyw and its discharge sensitivity, as other aspects of the Can Vila catchment study will be presented in a separate publication (Gallart et al., 2020).
The Can Vila catchment (Table 1) is a 0.56 km2, semi-humid Mediterranean mid-elevation (1115–1458 m a.s.l.) catchment with a rainfall-dominated flow regime. Stream discharge varies greatly, from zero flows during some summer periods to several-day-long floods associated with saturation generation mechanisms during wet periods (Latron and Gallart, 2008; Latron et al., 2009). In addition to long-term hydrometric monitoring since the early 1990s, precipitation and stream water stable isotopes were sampled from May 2011 to September 2013 and from May 2015 to May 2016. During the isotope sampling period, 5 min discharges ranged from zero to 2.621 m3 s−1 (equivalent to 4.68 m3 s−1 km−2 or 404 mm d−1), with a highly skewed flow duration curve (i.e. 30 % of total stream discharge flowed through the gauging station during 1 % of the time). A “smart sampling strategy” was used to obtain flow-representative water samples, consisting of the combination of two automatic water samplers, one triggered by time and the other by flow. The sampling frequency was higher during the rising limb of the hydrograph than during the falling limb, in order to compensate for the rising limb's shorter duration. The resulting sampling intervals varied between 30 min and 26 d with a maximum sampled discharge equivalent to 226 mm d−1. We investigated the young water fraction and its discharge sensitivity for the Can Vila catchment using this 40-month-long isotope time series containing 464 precipitation and 858 streamflow samples. Given the drier climate, the smaller catchment area and the much finer timescale for sampling, this data set extends the range of catchments investigated by von Freyberg et al. (2018).
Table 1Main characteristics and metrics of the catchments shown in Figs. 2 and 3. P is precipitation, Q is the stream discharge, is the flow-weighted young water fraction, F0 is the virtual young water fraction for zero flow, and Sd is the proposed discharge sensitivity metric of the young water fraction. F0 and Sd are defined in Eq. (6).

For the Can Vila catchment, the flow-weighted young water fraction () was much larger than the time-weighted young water fraction (). Both values fell within the range of those reported by von Freyberg et al. (2018), but the ratio between them was larger than at the Swiss catchments, suggesting that young water fractions are more sensitive to discharge at Can Vila than at most of the Swiss sites.
To further explore the discharge sensitivity DS(Q) at Can Vila, we estimated young water fractions for different quantiles of the flow regime (similar to Fig. 7 in von Freyberg et al., 2018), extending the range to portray the highest flows (up to the top 0.25 %; Fig. 1). Our flow-dependent sampling strategy intensively sampled these high flows, which conventional sampling at regular time intervals would miss. Figure 1 shows that Fyw increases with increasing discharge, from nearly 0 at the lowest discharge to nearly 1 for Q≥24 mm d−1. This behaviour partly corresponds to a high-DS(Q) type 2 catchment in Fig. 10 in von Freyberg et al. (2018). However, the non-linear behaviour of Fyw with increasing flow shown in Fig. 1 is inconsistent with a linear model of discharge sensitivity. Very small Fyw values (<0.1) during baseflow are consistent with the long (7.7 years) mean transit time of base flows obtained in this catchment (Gallart et al., 2016), whereas the high sensitivity of Fyw to discharge reflects the varying pre-event water contributions (30 %–90 %) observed for different flow events (Llorens et al., 2018).
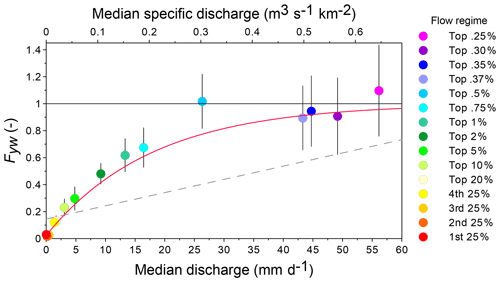
Figure 1Variation in time-weighted young water fraction at the Can Vila catchment with increasing quantiles of the flow duration curve. The dashed grey line represents Eq. (5) and the red curve represents Eq. (6), using parameters obtained by fitting Eqs. (4) and (8), respectively, to all the stream water δ18O isotope values. Discharge values are instantaneous measurements expressed in daily units. Maximum sampled discharge was 226 mm d−1. Vertical bars represent standard errors.
Equations (4) and (5) (numbered 9 and 10 in von Freyberg et al., 2018) yield a discharge sensitivity DS(Q) value of 0.0128±0.0017 d mm−1 for the Can Vila catchment (dashed grey line in Fig. 1), which is among the smallest discharge sensitivities obtained for the 22 Swiss catchments, in contrast with the visibly high discharge sensitivity of Can Vila over the range of its flow regime. Figure 1 shows that the linear design of DS(Q) is clearly inadequate to capture the asymptotic convergence of the young water fraction toward Fyw≈1 at the far upper tail of the flow distribution. Highly dynamic catchments such as Can Vila, and flow sampling strategies like those employed here, demonstrate that a non-linear discharge sensitivity function is needed.
An alternative, non-linear model can be derived by noting that the sum of old and young water fractions is always 1, and by assuming that the old water fraction decreases with increasing discharge and asymptotically approaches 0 (and thus the young water fraction asymptotically approaches 1) as Q approaches infinity. We propose the following equation, where the old water fraction decreases exponentially with increasing Q, and the young water fraction grows accordingly:
where F0(–) is the virtual Fyw for Q=0 and Sd (unit of Q−1) is the new discharge sensitivity metric. The red curve in Fig. 1 shows the application of this equation to the Can Vila data.
On combining Eqs. (1) with (6) and re-arranging the formula so that only AS(Q) remains on the left side of the equation, we obtain
Finally, by inserting Eq. (7) into Eq. (2), the F0 and Sd parameters can be obtained by fitting a sinusoid function to the seasonal variation of the isotopic signal of stream water cS(t):
We obtained the F0 and Sd parameters with a non-linear analytic Gauss–Newton algorithm in which we used streamflow rates as weights.
Taking the derivative of Eq. (6) with respect to Q directly yields the result that the local discharge sensitivity at low discharges will be directly related to (and in many cases nearly equal to) Sd:
When F0 is small, Sd will be a good approximation to the slope of the relationship between Fyw and Q at discharges that are low enough to keep Fyw still far from 1.
We used the Can Vila data set to test the robustness of the Sd metric, in comparison with the original DS(Q) metric defined by von Freyberg et al. (2018) and with several alternative metrics designed to reduce or avoid some of the DS(Q) metric's limitations. We investigated how these metrics changed when we excluded the discharge and water samples for the highest flows from the Can Vila data set (Fig. 2). This allowed us to test how these discharge sensitivity metrics were affected by the availability (or, conversely, the lack) of tracer data encompassing extreme flows.
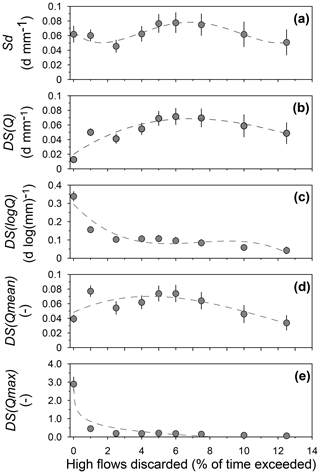
Figure 2Behaviour of the different discharge sensitivity metrics in the Can Vila catchment when measurements corresponding to the highest flows are sequentially discarded. Percentage of time exceeded refers to the flow duration curve. Vertical bars represent standard errors, and dashed lines are ancillary polynomial fits.
For this purpose, we compare the new Sd metric, the original DS(Q) metric and several dimensionless options that used log(Q), Q∕Qmax, and Q∕Qmean instead of Q in the calculations (Qmax and Qmean correspond to the maximum and mean values of the discharge rates Q(t) associated with stream water sampling). We call the resulting discharge sensitivity metrics DS(logQ), DS(Qmax) and DS(Qmean), respectively. Note that DS(Qmax) and DS(Qmean) may be obtained by multiplying any previously calculated DS(Q) value by Qmax or Qmean.
The new exponential Sd metric values (Fig. 2a) show some scatter but are robust to changes in the underlying data, exhibiting no systematic trend as the high-flow observations were progressively discarded. In contrast, DS(Q) is highly sensitive to changes in the analysed range of discharges (Fig. 2b), rapidly increasing (by a factor of 5) on exclusion of the highest flows from the calculations and reaching its maximum value on exclusion of the upper 5 % of flows (Q>4.82 mm d−1), corresponding to everything above the green dot (Top 5 %) in Fig. 1. Note that, as suggested by Eq. (9), DS(Q) takes values similar to Sd when the highest flows are excluded. DS(logQ) declines promptly on omission of the highest flows (Fig. 2c) but remains stable afterwards. DS(Qmean) behaves similarly to DS(Q); i.e. it is smallest when the complete data set is used and is largest on exclusion of the highest 5 % of flows from the analysis (Fig. 2d). Finally, Fig. 2e shows that DS(Qmax) becomes largest with the complete data set and sharply decreases to much smaller values on exclusion of the highest 1 % of flows from the calculations, but it undergoes just a little progressive decrease when more data of the flow distribution are excluded.
In summary, Sd is clearly more robust than the other discharge sensitivity metrics to changes in the sampled range of flows. It also has the distinct advantage that Eqs. (6)–(8), unlike Eqs. (3)–(4), can never yield Fyw values larger than 1. One can see from Eqs. (6)–(8) that Sd functions as both a shape parameter, controlling how non-linear Fyw is as it approaches 1, and a scale parameter, controlling the slope of the relationship between Fyw and Q at low or moderate discharges.
Figure 3 compares the quantile plot of Fig. 1 for the Can Vila catchment and the quantile plots of Fig. 7 in von Freyberg et al. (2018) for the Swiss catchments of Langeten, Biber and Ilfis, which exhibit very different young water fractions and/or discharge sensitivities (Table 1). The F0 and Sd metrics were calculated from Eq. (8) and good fits were obtained between the individual Fyw values and the median discharges as shown by the red curves. For comparison, grey curves correspond to the linear approach using Eq. (5).
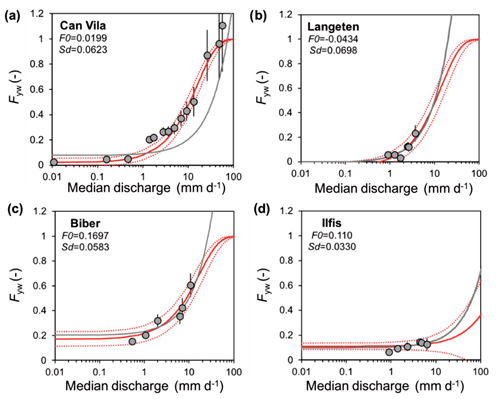
Figure 3Sensitivity of the young water fraction on discharge for the (a) Can Vila, (b) Langeten, (c) Biber and (d) Ilfis catchments. The red curves represent exponential fits (Eq. 6), with parameters Sd and F0 obtained through volume-weighted non-linear fitting of Eq. (8) to the stream water isotope data; red dashed lines indicate ±1 standard error. The grey curves represent the linear fit (Eq. 5).
We find that young water fractions in the Can Vila catchment have a discharge sensitivity (Sd) similar to that of the Langeten and the Biber catchments. By contrast, the young water fractions of the Ilfis catchment have almost no discharge sensitivity. Although Can Vila has a low F0 value, which is in line with its baseflow being several years old, its large discharge sensitivity expresses well the highly dynamic streamflow regime in this Mediterranean mountain environment.
Although the linear expression of discharge sensitivity (DS(Q), Eq. 5) provides a reasonable fit for the low-to-medium flow regimes of the Swiss sites, it fails to capture the highly non-linear dependence of Fyw on Q at Can Vila, evidenced by the high flows sampled there (Fig. 3a). In addition, Fig. 3 shows a major drawback of the linear approach, namely that it predicts Fyw values larger than 1 for high-flow conditions.
The four catchments compared here differ considerably in catchment area and median discharge (Table 1), which often challenges a robust inter-comparison analysis. However, Fig. 3 shows that Eq. (6) efficiently estimates the sensitivities (Sd) of Fyw on Q across these catchments.
The comparison of the Sd and DS(Q) metrics for Can Vila and the 22 Swiss catchments studied by von Freyberg et al. (2018) demonstrates that the DS(Q) linear approach approximates small discharge sensitivities reasonably well (Fig. 4). However, for relatively high discharge sensitivities, the linear model tends to predict smaller and more variable DS(Q) values. This behaviour may be attributed to the fact that, as shown in Fig. 2b, when Sd is high, the value of DS(Q) decreases if there are high-flow samples that reduce the linear slope between Fyw and Q (as occurs in Fig. 1).
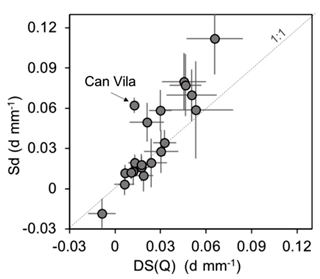
Figure 4Comparison of discharge sensitivities DS(Q) and Sd for 20 Swiss catchments and Can Vila (excluding Aach and Mentue for which unrealistic values for DS(Q) or Sd were obtained). Error bars indicate ±1 standard error.
In order to compare the frequencies of occurrence of Q and Fyw in the diverse catchments, the same points shown in Fig. 3 are plotted on a single log-probabilistic graph in Fig. 5. It presents the information as flow duration curves, using the corresponding quantile frequencies, the log-normal distributions fitted to the flow quantiles and the Fyw(Q) lines obtained by applying Eq. (6) to the discharges. Figure 5 shows differences in behaviour between Can Vila and the three Swiss catchments due to the combination of flow distribution and discharge sensitivity of Fyw that are only vaguely visible in Fig. 3. This graph also allows anticipation of the Fyw values that might be obtained if more samples would be collected during high flows (low exceedance frequencies) in the study catchments.
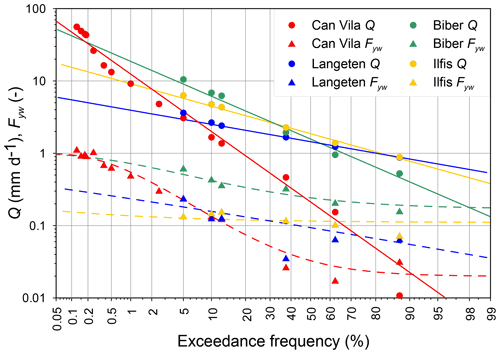
Figure 5Discharges and young water fractions from Fig. 3 plotted against the respective quantile frequencies, along with the log-normal distributions fitted to discharges (solid lines) and distributions of young water fractions (dashed curves) obtained by applying Eq. (6).
The question arises of where (in what kinds of catchments and in what types of climates) Fyw becomes high enough at high flows that it approaches unity, and thus an exponential model is needed to describe Fyw at high flows. This is a question that depends not only on catchment behaviour but also on the sampling design and the range of investigated discharges. For example, the results shown in Fig. 3 for the Biber catchment demonstrate that, if the linear sensitivity were applied, a value of Fyw=1 would be reached for a discharge of 26.8 mm d−1. This discharge is exceeded 0.38 % of the time, i.e.1.4 d yr−1, at the Biber catchment (see the solid green line in Fig. 5). Furthermore, the linear character of DS(Q) makes it sensitive to the sampled discharges (Fig. 2b), so it may be more vulnerable to insufficient sampling designs and likely to show inconsistent behaviour in sensitive catchments (Fig. 4).
The discharge sensitivity of the young water fraction is a promising metric for investigating streamflow generation processes and for catchment inter-comparison studies. However, the original discharge sensitivity approach, based on fitting a linear slope between the young water fraction (Fyw) and discharge (Q), turns out to be inadequate when applied to the intensively sampled Can Vila catchment; it does not accurately predict Fyw during high flows, which consist almost entirely of young water. Can Vila's young water fractions converge toward 1 at the highest flows, revealing a conceptual limitation in the linear approach, which can predict impossible values of Fyw>1. Because Fyw is confined between 0 and 1, whereas Q may vary by several orders of magnitude, linear estimates of discharge sensitivity will vary, depending on the highest Q values at which Fyw estimates are available; this potentially hampers robust comparisons of discharge sensitivities between catchments with very different flow regimes and sampling designs.
We propose an alternative, exponential-type approach for estimating discharge sensitivity (Eq. 6), to overcome the limitations of the linear approach. The parameters of this exponential equation are F0, i.e. virtual Fyw for zero discharge, and Sd, which represents the shape of the curve for the increase of Fyw with increasing Q. The exponential Sd metric outperforms the linear discharge sensitivity metric in terms of physical soundness and lower sensitivity to changes in available tracer and discharge information.
As the proposed Sd metric has dimensions inverse to discharge Q, its value depends on the units of Q used in Eqs. (6) and (8). Nevertheless, the Sd metric exhibited consistent behaviour across wide ranges of discharges sampled in the same catchment and between catchments of diverse sizes and flow regimes.
We hypothesize that, if estimated from tracer samples that adequately capture the runoff dynamics, the three metrics of Fyw, F0 and Sd will help in comparing runoff generation behaviour in catchments with widely varying characteristics. The Fyw metric, though being sensitive to catchment wetness, provides an overall measure of the young water contribution; the F0 metric characterizes base flows and the Sd metric quantifies how much Fyw changes as catchment wetness increases.
The Swiss isotope data are available online via https://zenodo.org/record/3659679#.Xl6LHi2ZMWp (Staudinger et al., 2020). The Can Vila isotope data are available from Jérôme Latron upon request.
JL and PL designed the isotope sampling strategy at Can Vila and provided measurements. FG and MV analysed the Can Vila data set. FG, JWK and JvF developed the new approach. FG prepared the paper with contributions from JvF, JWK, JL and PL.
The authors declare that they have no conflict of interest.
This research was supported by the projects TransHyMed (CGL2016-75957-R AEI/FEDER, UE) and Drought-CH (National Research Programme NRP 61 by the Swiss National Science Foundation). We are grateful to Carles Cayuela, Gisela Bertràn, Maria Roig-Planasdemunt and Elisenda Sánchez for their support during field work at the Can Vila catchment and to Michael Eaude for his English style improvements.
This research has been supported by the Ministerio de Ciencia, Innovación y Universidades (Spain) (grant no. CGL2016‐75957‐R AEI/FEDER, UE) and the Swiss National Science Foundation (Switzerland) (National Research Programme NRP 61).
This paper was edited by Thom Bogaard and reviewed by two anonymous referees.
DeWalle, D. R., Edwards, P. J., Swistock, B. R., Aravena, R., and Drimmie, R. J.: Seasonal isotope hydrology of three Appalachian forest catchments, Hydrol. Process., 11, 1895–1906, https://doi.org/10.1002/(SICI)1099-1085(199712)11:15%3C1895::AID-HYP538%3E3.0.CO;2-%23, 1997.
Gallart, F., Roig-Planasdemunt, M., Stewart, M. K., Llorens, P., Morgenstern, U., Stichler, W., Pfister, L., and Latron, J.: A GLUE-based uncertainty assessment framework for tritium-inferred transit time estimations under baseflow conditions, Hydrol. Process., 30, 4741–4760, https://doi.org/10.1002/hyp.10991, 2016.
Gallart, F., Valiente, M., Llorens, P., Cayuela, C., Sprenger, M., and Latron, J.: Investigating young water fractions in different hydrological compartments of a small Mediterranean mountain catchment: Sampling frequency and precipitation forcing matter, Hydrol. Process., in review, https://doi.org/10.22541/au.157979613.39458719, 2020.
Kirchner, J. W.: Aggregation in environmental systems – Part 1: Seasonal tracer cycles quantify young water fractions, but not mean transit times, in spatially heterogeneous catchments, Hydrol. Earth Syst. Sci., 20, 279–297, https://doi.org/10.5194/hess-20-279-2016, 2016a.
Kirchner, J. W.: Aggregation in environmental systems – Part 2: Catchment mean transit times and young water fractions under hydrologic nonstationarity, Hydrol. Earth Syst. Sci., 20, 299–328, https://doi.org/10.5194/hess-20-299-2016, 2016b.
Latron, J. and Gallart, F.: Runoff generation processes in a small Mediterranean research catchment (Vallcebre, Eastern Pyrenees), J. Hydrol., 358, 206–220, https://doi.org/10.1016/j.jhydrol.2008.06.014, 2008.
Latron, J., Llorens, P., and Gallart, F.: The hydrology of Mediterranean mountain areas, Geography Compass, 3, 2045–2064, https://doi.org/10.1111/j.1749-8198.2009.00287.x, 2009.
Llorens, P., Gallart, F., Cayuela, C., Planasdemunt, M. R., Casellas, E., Molina, A. J., Moreno-de las Heras, M., Bertran, G., Sánchez-Costa, E., and Latron, J.: What have we learnt about Mediterranean catchment hydrology? 30 years observing hydrological processes in the Vallcebre research catchments, Cuadernos de Investigación Geográfica/Geographical Research Letters, 44, 475–502, https://doi.org/10.18172/cig.3432, 2018.
McGuire, K. J. and McDonnell, J. J.: A review and evaluation of catchment transit time modeling, J. Hydrol., 330, 543–563, https://doi.org/10.1016/j.jhydrol.2006.04.020, 2006
Staudinger, M., Seeger, S., Herbstritt, B., Stoelzle, M., Seibert, J., Stahl, K., and Weiler, M.: The CH-IRP data set: fortnightly data of δ2H and δ18O in streamflow and precipitation in Switzerland (Version Version 1), Data set, Zenodo, https://doi.org/10.5281/zenodo.3659679, 2020.
von Freyberg, J., Allen, S. T., Seeger, S., Weiler, M., and Kirchner, J. W.: Sensitivity of young water fractions to hydro-climatic forcing and landscape properties across 22 Swiss catchments, Hydrol. Earth Syst. Sci., 22, 3841–3861, https://doi.org/10.5194/hess-22-3841-2018, 2018.
- Abstract
- Recalling the definition of the discharge sensitivity of the young water fraction
- Investigating discharge sensitivity of the young water fraction in a small Mediterranean catchment
- Defining alternative metrics for discharge sensitivity of the young water fraction
- Sensitivity of the discharge sensitivity metrics to changes in data availability at the Can Vila catchment
- Comparing discharge sensitivities at Can Vila and the Swiss catchments
- Conclusions
- Data availability
- Author contributions
- Competing interests
- Acknowledgements
- Financial support
- Review statement
- References


