the Creative Commons Attribution 4.0 License.
the Creative Commons Attribution 4.0 License.
 | 30 Jan 2019
Assessment of food trade impacts on water, food, and land security in the MENA region
Sang-Hyun Lee
Rabi H. Mohtar
Seung-Hwan Yoo
The Middle East and North Africa (MENA) region has the largest water deficit in the world. It also has the least food self-sufficiency. Increasing food imports and decreasing domestic food production can contribute to water savings and hence to increased water security. However, increased domestic food production is a better way to achieve food security, even if irrigation demands an increase in accordance with projected climate changes. Accordingly, the trade-off between food security and the savings of water and land through food trade is considered to be a significant factor for resource management, especially in the MENA region. Therefore, the aim of this study is to analyze the impact of food trade on food security and water–land savings in the MENA region. We concluded that the MENA region saved significant amounts of national water and land based on the import of four major crops, namely, barley, maize, rice, and wheat, within the period from 2000 to 2012, even if the food self-sufficiency is still at a low level. For example, Egypt imported 8.3 million t yr−1 of wheat that led to 7.5 billion m3 of irrigation water and 1.3 million ha of land savings. In addition, we estimated the virtual water trade (VWT) that refers to the trade of water embedded in food products and analyzed the structure of VWT in the MENA region using degree and eigenvector centralities. The study revealed that the MENA region focused more on increasing the volume of virtual water imported during the period 2006–2012, yet little attention was paid to the expansion of connections with country exporters based on the VWT network analysis.
- Article
(7651 KB) - Full-text XML
- BibTeX
- EndNote


Food security and water scarcity are urgent socioeconomic and environmental issues in the Middle East and North Africa (MENA) region (Saladini et al., 2018), which are highly interlinked, and a water–energy–food (WEF) nexus has been suggested as a proper and integrated approach for resource management (Bazilian et al., 2011; Rasul, 2014; Mohtar and Daher, 2014; Lee et al., 2018). For example, food security in the MENA region has become complicated due to increased risks owing to the geopolitical challenges and inability to satisfy needs with domestic production because of the lack of adequate arable land and water resources (Rastoin and Cheriet, 2010). In addition, food imbalance in the MENA region is forecast to reach 60 % in 2050 and food security in the MENA region could be extremely compromised (Rastoin and Cheriet, 2010). Climate change could lead to more frequent occurrence of extreme climatic events in Mediterranean region, accompanying a 50 % decrease in agricultural production by the end of the century (Porter et al., 2014). In particular, water saving through food trade can be suggested as a solution for mitigating groundwater depletion in the MENA region (Lezzaik et al., 2018).
In this study, we focused on the role of food trade in the MENA region in terms of resource management. Accordingly, we applied the concept of virtual water trade (VWT), which refers to the trade of water embedded in food products (Allan, 1993; Aldaya et al., 2010; Antonelli et al., 2015), in order to assess the food trade impact on water savings in the MENA region. International trade in food commodities has been shown to save water; thus food trade is an important element of both food and water security in water-scarce regions (Hoekstra, 2003; Chapagain et al., 2006; Hanjra and Qureshi, 2010; Fader et al., 2011; Konar et al., 2012). In addition, food trade could contribute to global water savings if food is exported by countries with a higher water productivity than the countries of import (Konar et al., 2012). The concept and quantitative estimates of virtual water can help to realistically assess water scarcity for each country, projecting future water demand for food supply and thus increasing public awareness on water and identifying water-wasting processes in production (Oki and Kanae, 2004). For water-scarce countries, achieving water security by importing water-intensive products could be a more attractive option compared to producing all water-demanding products domestically (Hoekstra and Hung, 2005). The global volume of international crop-related virtual water flows averaged 695 billion m3 yr−1 over the period 1995–1999, which means that 13 % of the water used for crop production in the world was not used for domestic consumption but rather for export in virtual forms (Hoekstra and Hung, 2005). Falkenmark and Lannerstad (2010) estimated that it would be necessary to double the VWT by 2050 to compensate for agricultural water deficits because of climatic change, population increase, and the pattern of food supply per capita. For example, an average of 20 % of the per capita food energy supply was assumed to originate from animal foods to ensure sufficient protein content, and additional water was required to produce animal foods compared to other food types (Falkenmark and Lannerstad, 2010).
The VWT could contribute to the relief of water stress through the use of global water in a more efficient manner in the event of an increase in the global food trade (Molden, 2007). Additionally, the VWT and the respective savings garnered through the trade of agricultural goods have been quantified in a number of studies. Oki and Kanae (2004) investigated that approximately 1140 km3 yr−1 of virtual water could be used for altering the import of food products to domestic products, e.g., cereals, soybeans, and meat; however, 680 km3 yr−1 of water was used to produce these food types in exporting areas. Yang et al. (2006) revealed that the VWT could generate global water savings because virtual water has been transferred primarily from countries of increased-crop-water productivity to countries of low-crop-water productivity. In their study, 336.8 km3 yr−1 of water was saved globally by the international trade of major food crops from 1997 to 2001, while 20.4 % of the total global net virtual water import was imported by countries that have water availability below 1700 m3 per capita, such as the Arab countries. Fader et al. (2011) calculated the VWT based on the trade of crop products and compared it with the water requirements for producing crop products in each country for domestic consumption without international trade. Generally, exporters use less water for production of crop products than importers. Thus, the trade of crop products saves 263 km3 yr−1 of water globally, thereby representing 3.5 % of the annual precipitation on cropland (Fader et al., 2011). In particular, water-scarce countries, such as China and Mexico, as well as land-scarce countries, such as the Netherlands and Japan, saved large amounts of water by importing goods that require water in the range from 25 to 73 km3 yr−1, because they would otherwise need relatively large amounts of water to produce the goods they import. According to the study by Biewald et al. (2014), blue water, which refers to the irrigation water supplied from artificial facilities, such as reservoirs, groundwater pumping, or desalination stations, was saved in importing countries by importing products in accordance with international trade. It is expected that this can elicit enormous benefits in water-scarce regions. For example, 17 billion m3 of blue water per year was saved by the global food trade, and the value of blue water saving was estimated to be USD 2.4 billion.
Previous studies showed that the effective import of virtual water may reduce water use for domestic food production in importing countries and help alleviate water stress in the MENA region, where the largest water deficit in the world exists (Gleick, 2000; World Bank, 2009). The critical condition of water scarcity in the MENA region will reach severe levels by 2025 (Tolba and Saab, 2009). In addition, if population increases rapidly and urbanization continues fast, availability of water could be reduced in the Arab countries by approximately 50 % by the year 2025 (Abahussain et al., 2002). Water shortages will certainly speed up the rate of desertification in the Arab countries (Abahussain et al., 2002). Agricultural water withdrawals account for over 85 % of the total water withdrawn by the various countries of the MENA region (FAO, 2014). Irrigation systems in the MENA region are based on pumping groundwater resources, such as aquifers, and water security is being threatened by the declining aquifer levels and the extraction of nonrenewable groundwater (Antonelli et al., 2015). In addition, Immerzeel et al. (2011) expected that the unfulfilled water demand in the entire MENA region would increase from the current level of 16 % to 51 % in 2040–2050 owing to climate changes. The zone of severely reduced rainfall extends throughout the Mediterranean region and the northern Sahara (Hennessy et al., 2007). Milly et al. (2005) estimated that climate change will cause a decrease in water runoff by 20 % to 30 % in most of the MENA region by 2050, mainly owing to the rising temperatures and lower precipitation. In addition, the regions that include Syria, Lebanon, Israel, and Jordan will get drier, with significant rainfall decreases in the wet season.
However, the high dependency on food import can be a risk of food security, even if it can elicit domestic water, energy, and land savings in water-scarce regions. Therefore, we should consider a trade-off between food security and resource savings using a holistic approach, such as a trade–WFL (water–food–land) nexus. Furthermore, the VWT can be suggested as relevant to the water policy of a nation (Schyns and Hoekstra, 2014), thus establishing a new point of view from which both food security and sustainable water management are considered (Novo et al., 2009).
This study addresses three questions that relate to the role and impact of the VWT in the MENA region, which are raised to draw attention to the complexity of the issue and the need for a broader view in assessment. Specifically, (1) what are the effects of the VWT on water savings and land tenure in the MENA region? (2) Has the structure of the virtual water import in the MENA region been vulnerable or robust? (3) Who are the influential importers and exporters in the VWT network in the MENA region?
The aim of this study is to evaluate the effects on water savings and land tenure from importing crops in 15 countries in the MENA region such as Algeria, Egypt, Iraq, Jordan, Kuwait, Lebanon, Libya, Morocco, Oman, Qatar, Saudi Arabia, Syria, Tunisia, the UAE, and Yemen. In addition, we quantified the amount of VWT from 2000 to 2012, and we analyzed the structure of the VWT, such as the connectivity and influence in the MENA region using degree and eigenvector centralities.
2.1 VWT based on international trade
The VWT represents the water embedded in international trade, and it indicates the water used in the exporting country to produce crops for export. Therefore, the VWT is calculated based on the water footprint of exporters, which indicates the total amount of water used for producing crop, and the export of virtual water in the exporting country has the same meaning as the import of virtual water has in the importing country. For example, Saudi Arabia imported wheat from various exporters, and the virtual water import (or export) was calculated by multiplying the quantity of traded wheat with the respective water footprint of exporters. Accordingly, the main factors for quantifying a VWT are the trade data and water footprint, and the VWT is calculated by multiplying the trade by its associated water footprint in the exporting country, as follows:
where the variable VWT denotes the virtual water trade from the exporting country, ne, to the importing country, ni, in year t, as a result of trade in crop c; CT represents the crop trade from the exporting country, ne, to the importing country, ni, in year t as a result of trade in crop c; and WFP represents the water footprint of crop c in the exporting country, ne.
The international trade data of the four major crops, namely, barley, maize, rice, and wheat from 2000 to 2012, were obtained from FAOSTAT (http://www.fao.org/faostat/, last access: 15 July 2018), as shown in Table 1. The crop with the largest amount of import was wheat, with 27.6 million t yr−1 imported by the MENA region from 2000 to 2012, followed by maize (14.4 million t yr−1), barley (9.0 million t yr−1), and rice (3.7 million t yr−1).
Water footprint is a localized index for countries, accounting for the climate, productivity, and irrigation. In this study, we considered water footprints of all countries in the world; however, a lot of effort would be required to estimate the water footprints of all countries and this was outside the scope of the current study. Therefore, we applied water footprint data of 147 countries, including those in the MENA region, from the study executed by Mekonnen and Hoekstra (2010). The water footprint for a crop is divided into green and blue water footprints based on the water resources (Hoekstra and Chapagain, 2008). The green water footprint indicates that water supplied by precipitation is retained in the soil of the root zone (Falkenmark, 1995), and blue water footprint is the water stored at the surface or in the ground. Therefore, the green water footprint is related to rain-fed agriculture and the blue water footprint is related to irrigation water provided by aquifers or surface bodies of water. Water saving could be also divided into green and blue water savings through water footprints.
2.2 Water and land savings due to international food trade in an importing country
Food import is also related to domestic water and land savings. In particular water saving has a different meaning from virtual water import. For example, Saudi Arabia imported wheat from various exporters and virtual water import indicates the sum of the products obtained from multiplying the quantity of imported wheat by the respective water footprint of each exporter. However, water saving indicates the amount of water needed to produce the same quantity of imported products domestically. Therefore, water saving due to wheat import in Saudi Arabia is estimated by multiplying the quantity of imported wheat with the water footprint of wheat in Saudi Arabia.
In this study, we applied green and blue water footprints of crops in each country in the MENA region, as shown in Table 1. However, the availability of water footprint data in the MENA region was limited in some cases. For example, the water footprint of wheat was available in all countries except for Bahrain. Land savings have the same implication as water savings; thus we calculated land savings using the land footprint of each country in the MENA region, as shown in Table 2. The land footprint indicates the land requirement for producing 1 t of crops, and it was calculated based on the harvest area and crop production data collected from FAOSTAT (Table 1).
Table 1Cultivation area, production, and the quantity of crops imported in the MENA region from 2000 to 2012.

a Average value from 2000 to 2012 provided from FAOSTAT (http://www.fao.org/faostat/, last access: 10 January 2019); b average value from 2000 to 2012 provided from World Bank (https://data.worldbank.org/, last access: 10 January 2019).
The water and land savings could be assess the impacts of the failure of trade on domestic water and land requirements in the importing country. Although this assumption about water and land savings considers an extreme trade situation, these results could be used to understand the importance of the international crop trade in the MENA region. In other words, the water and land savings indicated the amount of water and land requirements for crops imported to substitute domestic production, and the water and land savings were calculated as follows:
in which variable WFP [ni, c] (m3 t−1) is the water footprint of crop c in the importing country ni, CWR is the crop water requirement (m3), and P is the production (t). Equivalently, LFP [ni, c] (ha t−1) is the land footprint of crop c in the importing country ni, and “Area” is the cultivated area (ha). The symbol WS (m3) or LS (ha) indicates the amount of water or land savings in the importing country ni. CI is the import of crop c in the importing country ni.
2.3 Degree and eigenvector centralities for analyzing the structure of VWT
2.3.1 Nonscaled and scaled in-degree centralities of VWT
Understanding the VWT structure is important for quantifying the amount of import and export because the VWT structure can represent whether it would be sustainable or vulnerable. For example, if a country imports considerable amounts of virtual water through the food trade from just a few exporters, the structure of VWT in this country might be easily influenced by exporters. However, if a country is connected with many exporters in VWT, it can have a resilient structure for global changes. A few studies have been conducted on the analysis of the structure of the VWT using a network-based approach (Konar et al., 2012; Dalin et al., 2012; Lee et al., 2016). For example, Konar et al. (2012) analyzed the characteristics of the network change in virtual water trade and found that a number of export trade partners followed an exponential distribution in 2000. Dalin et al. (2012) found that constant organizational features were observed in the network of VWT even though the number of trade connections and the volume of VWT has been growing. In addition, Lee et al. (2016) analyzed the vulnerability of the importing countries through the characteristics of the network in VWT.
Table 2Water and land footprints of four major crops in the MENA region.

a Water footprint data were referenced by Mekonnen and Hoekstra (2010); b land footprint was calculated by crop production and cultivated area provided from World Bank open data (https://data.worldbank.org/, last access: 15 July 2018).
In this study, we analyzed the links of the VWT network for identifying the VWT structure using degree centrality, that is, the number of degree incidents on a given node (Freeman, 1979). In addition, the degree centrality is divided into in- and out-degree centralities, depending on the direction. “In-degree” is based on the number of lines (or volume) directed to the node and “out-degree” is based on the number of lines (or volume) that the node directs to. A node indicates the country in the global trade network, and incidents mean the trade between countries which can be amounts of products or number of connections; for example, if one country exports product to five countries, that country has five incidents. In this study, we focused on the in-degree centrality because the MENA region includes representative importing countries. An importer accompanying an increased in-degree centrality has expanded connectivity with a large number of exporters, meaning that this importer could cope with an accidental disconnection from a certain exporter. In addition, the volume of products exported or imported can be applied to incidents as the weight of links. In this study, the in-degree centrality, based on the VWT network, is expressed according to the nonscaled in-degree centrality (NSInDC), that is, based on the number of links, and the scaled in-degree centrality (SInDC), that is, based on the volume of links.
where NSInDCi is the nonscaled in-degree centrality of country i, and Linkij is the number of links between the ith and jth countries. The symbol SInDCi is the scaled in-degree centrality of country i, and Flowij is the volume of virtual water traded between the ith and jth countries. Moreover, N is the total number of countries that trade with a given MENA country.
Through NSInDC and SInDC, we analyzed the vulnerable expansion (or reduction) and robust expansion (or reduction) in the VWT network in the MENA region. For example, the vulnerable expansion in the network indicates that the amount of flow to a node increases but the number of connections to other nodes decreases. This is represented by high levels of SInDC and low levels of NSInDC. The importer country that is associated with vulnerable expansion has an increased quantity of products from only a few exporters.
2.3.2 Eigenvector centralities of VWT
In general, connections to nodes which are themselves influential could make a node more influential than connections to less influential nodes (Newman, 2016), and eigenvector centrality can be used for measuring the influential connections (Ruhnau, 2000). For example, the concept of eigenvector centrality has been used by the web search engine Google in order to rank web pages (Berry and Browne, 2005; Bryan and Leise, 2006; Newman, 2016).
Table 3The annual water and land savings based on imported crops in the MENA region from 2000 to 2012.

* Water and land savings by rice import were not calculated because of the lack of data of water and land footprints in the MENA region.
In the VWT network, the eigenvector centrality could be used for identifying influential countries that could affect the entire network. In other words, the entire VWT can be affected by a few influential countries, and it is important to identify these countries for understanding and estimating the change in the entire structure of the VWT. An eigenvector centrality can measure the influence of each country in the entire VWT, and it is related not only to its own connection pattern but also to the connections of other countries to it. Therefore, a country is more influential if it is considered in relation to the countries that are influential themselves (Ruhnau, 2000). The eigenvector centrality assigns relative centrality to all of the countries in the VWT, based on the principle that connections to high-level centrality countries contribute more to the centrality of the countries compared to equal connections to low-level centrality countries (Ruhnau, 2000; Lee et al., 2016). Bonacich (1972) defined the centrality (xi) of a node i as the positive multiple of the sum of adjacent centralities in links (or volume) between nodes (Aij). Therefore, if we denote the centrality of vertex i by xi , then we can allow for this effect by making xi proportional to the average of the centralities of i's network neighbors (Newman, 2016),
where λ is a constant. Defining the vector of centralities x=(x1, x2, …), we can rewrite this equation in matrix form as
This type of equation is solved using eigenvalues and eigenvectors, where A is an adjacency matrix of Aij, and λ is a scalar, known as the eigenvalue associated with the eigenvector c defined as a column vector. Eigenvector centrality is determined by calculating the principal eigenvector that has the largest eigenvalue among all eigenvectors. A nonnegative eigenvector with the maximal eigenvalue exists. We refer to a nonnegative eigenvector (x≥0) of the maximal eigenvalue as the principal eigenvector, and we call the entry xi the eigenvector centrality of node (country) i (Ruhnau, 2000).
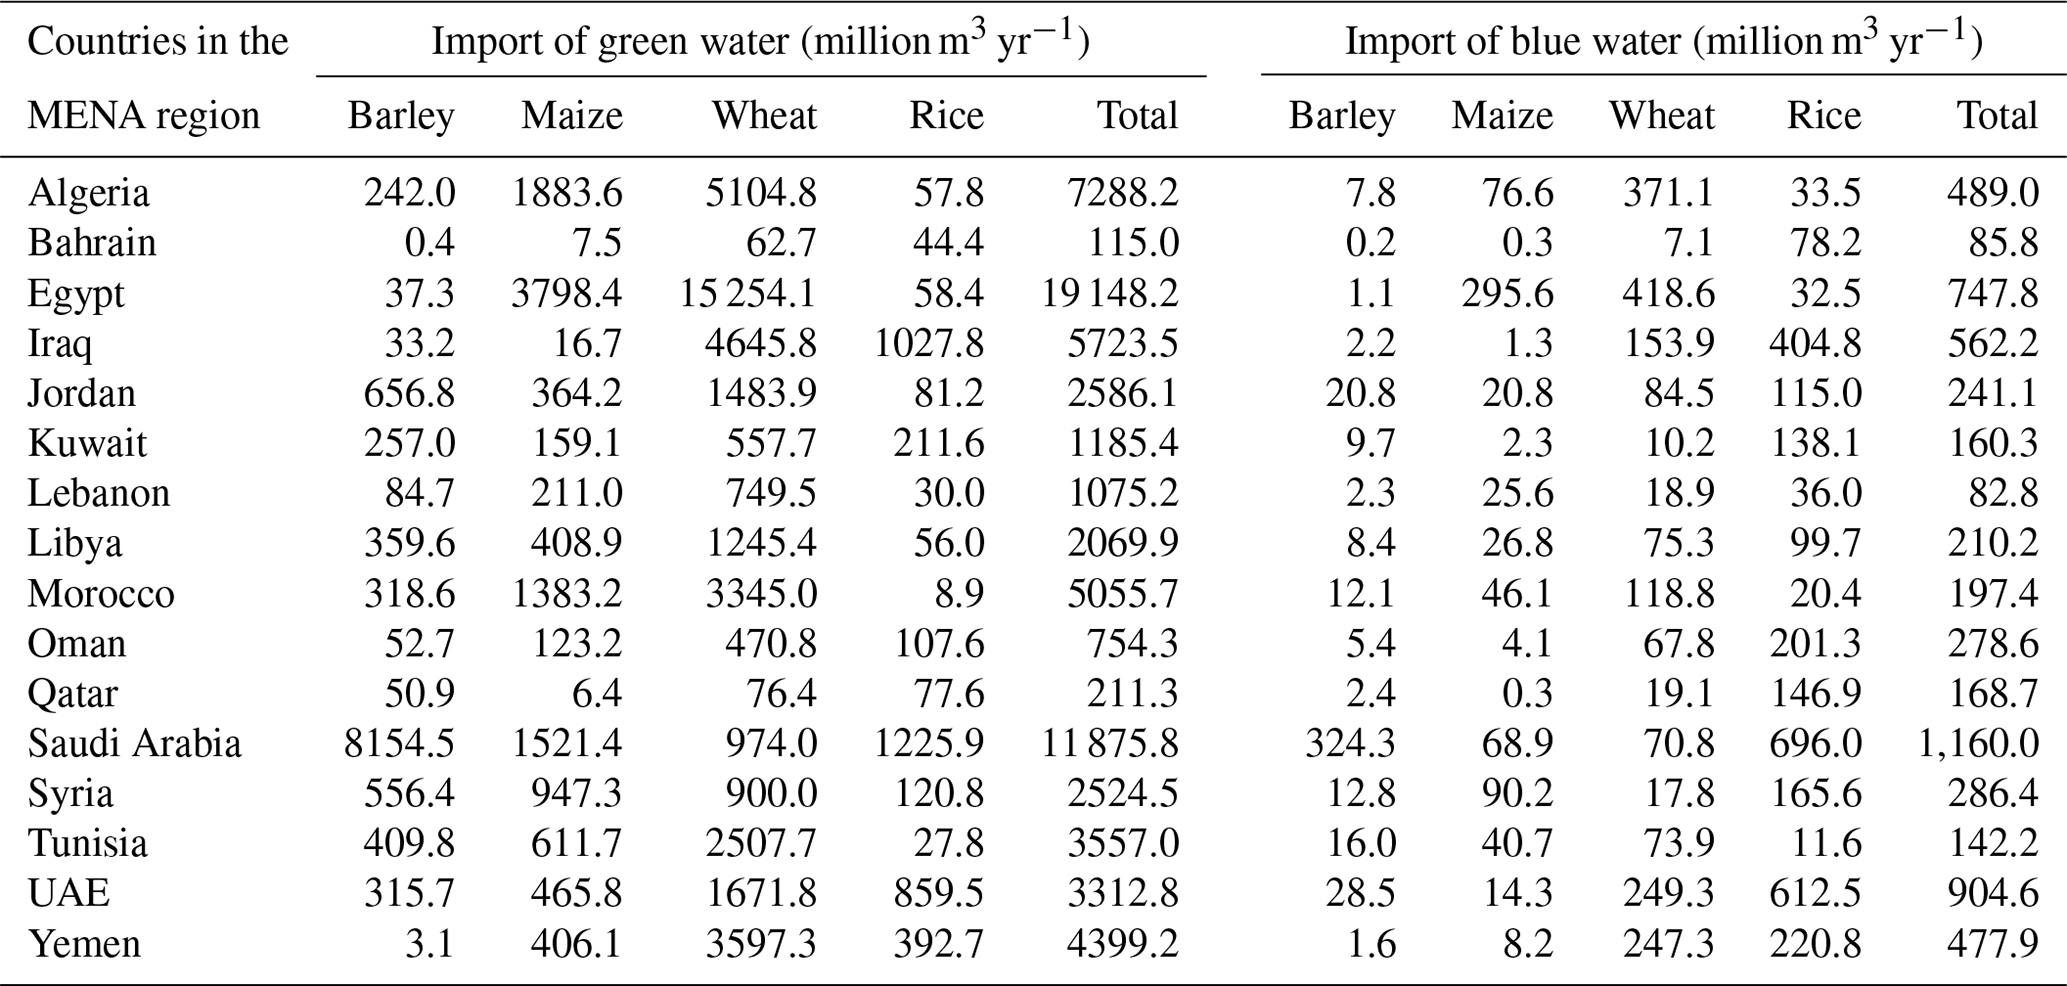
Table 4The amounts of green and blue water imported in the MENA region from 2000 to 2012.
3.1 Trade-offs between national water–land savings and food security through food trade in the MENA region
This study considered trade-offs between food security and food trade in terms of national resource management. For example, increasing domestic food production instead of importing food products could be one policy for food security, but additional water and land for domestic products would need to be considered at the same time. In other words, food imports could contribute to domestic water and land management; therefore, we estimated the national water and land savings by importing crops as shown in Table 3. In Saudi Arabia, blue water savings by barley, maize, and wheat imports were estimated to be 5.0, 2.0 and 0.8 billion m3 yr−1, respectively. In comparison to the internal water resource of Saudi Arabia, which is 2.4 billion m3 yr−1 as shown Table 1, the water saving through the import of barley, maize, and wheat could be considered to be significant in Saudi Arabia. In the case of Egypt, most of the water saving occurred based on the imports of wheat and maize. Approximately 7.5 billion m3 yr−1 of blue water was saved by importing wheat. Specifically, the internal water resources in Egypt are only 1.8 billion m3 yr−1 (Table 1); therefore, water scarcity could be an issue for food security policy in Egypt. Lebanon was strongly influenced by the impact of crop import on land savings. Approximately 0.24 million ha could be saved by crop imports, comprising 36 % of the agricultural area in Lebanon, which indicates that the crop trade in Lebanon has significant benefits in terms of land resources compared to water resources.
Food imports could be regarded as a negative factor in food security, and it is obvious that food security would accompany water and lands for domestic food products. These results showed that food imports could result in positive impacts on numerous water and land savings in the MENA region. However, there are limitations to these results. First, water saving estimated in this study was based on the hypothetical situation that meat there was no international trade situation, and sometimes the water saving estimate was larger than the internal water resources in some countries, such as Saudi Arabia and Egypt. Additionally, some crops are required for the specific type of climate but this study assumed that MENA region was suitable for cultivating maize, wheat, barley, and rice.
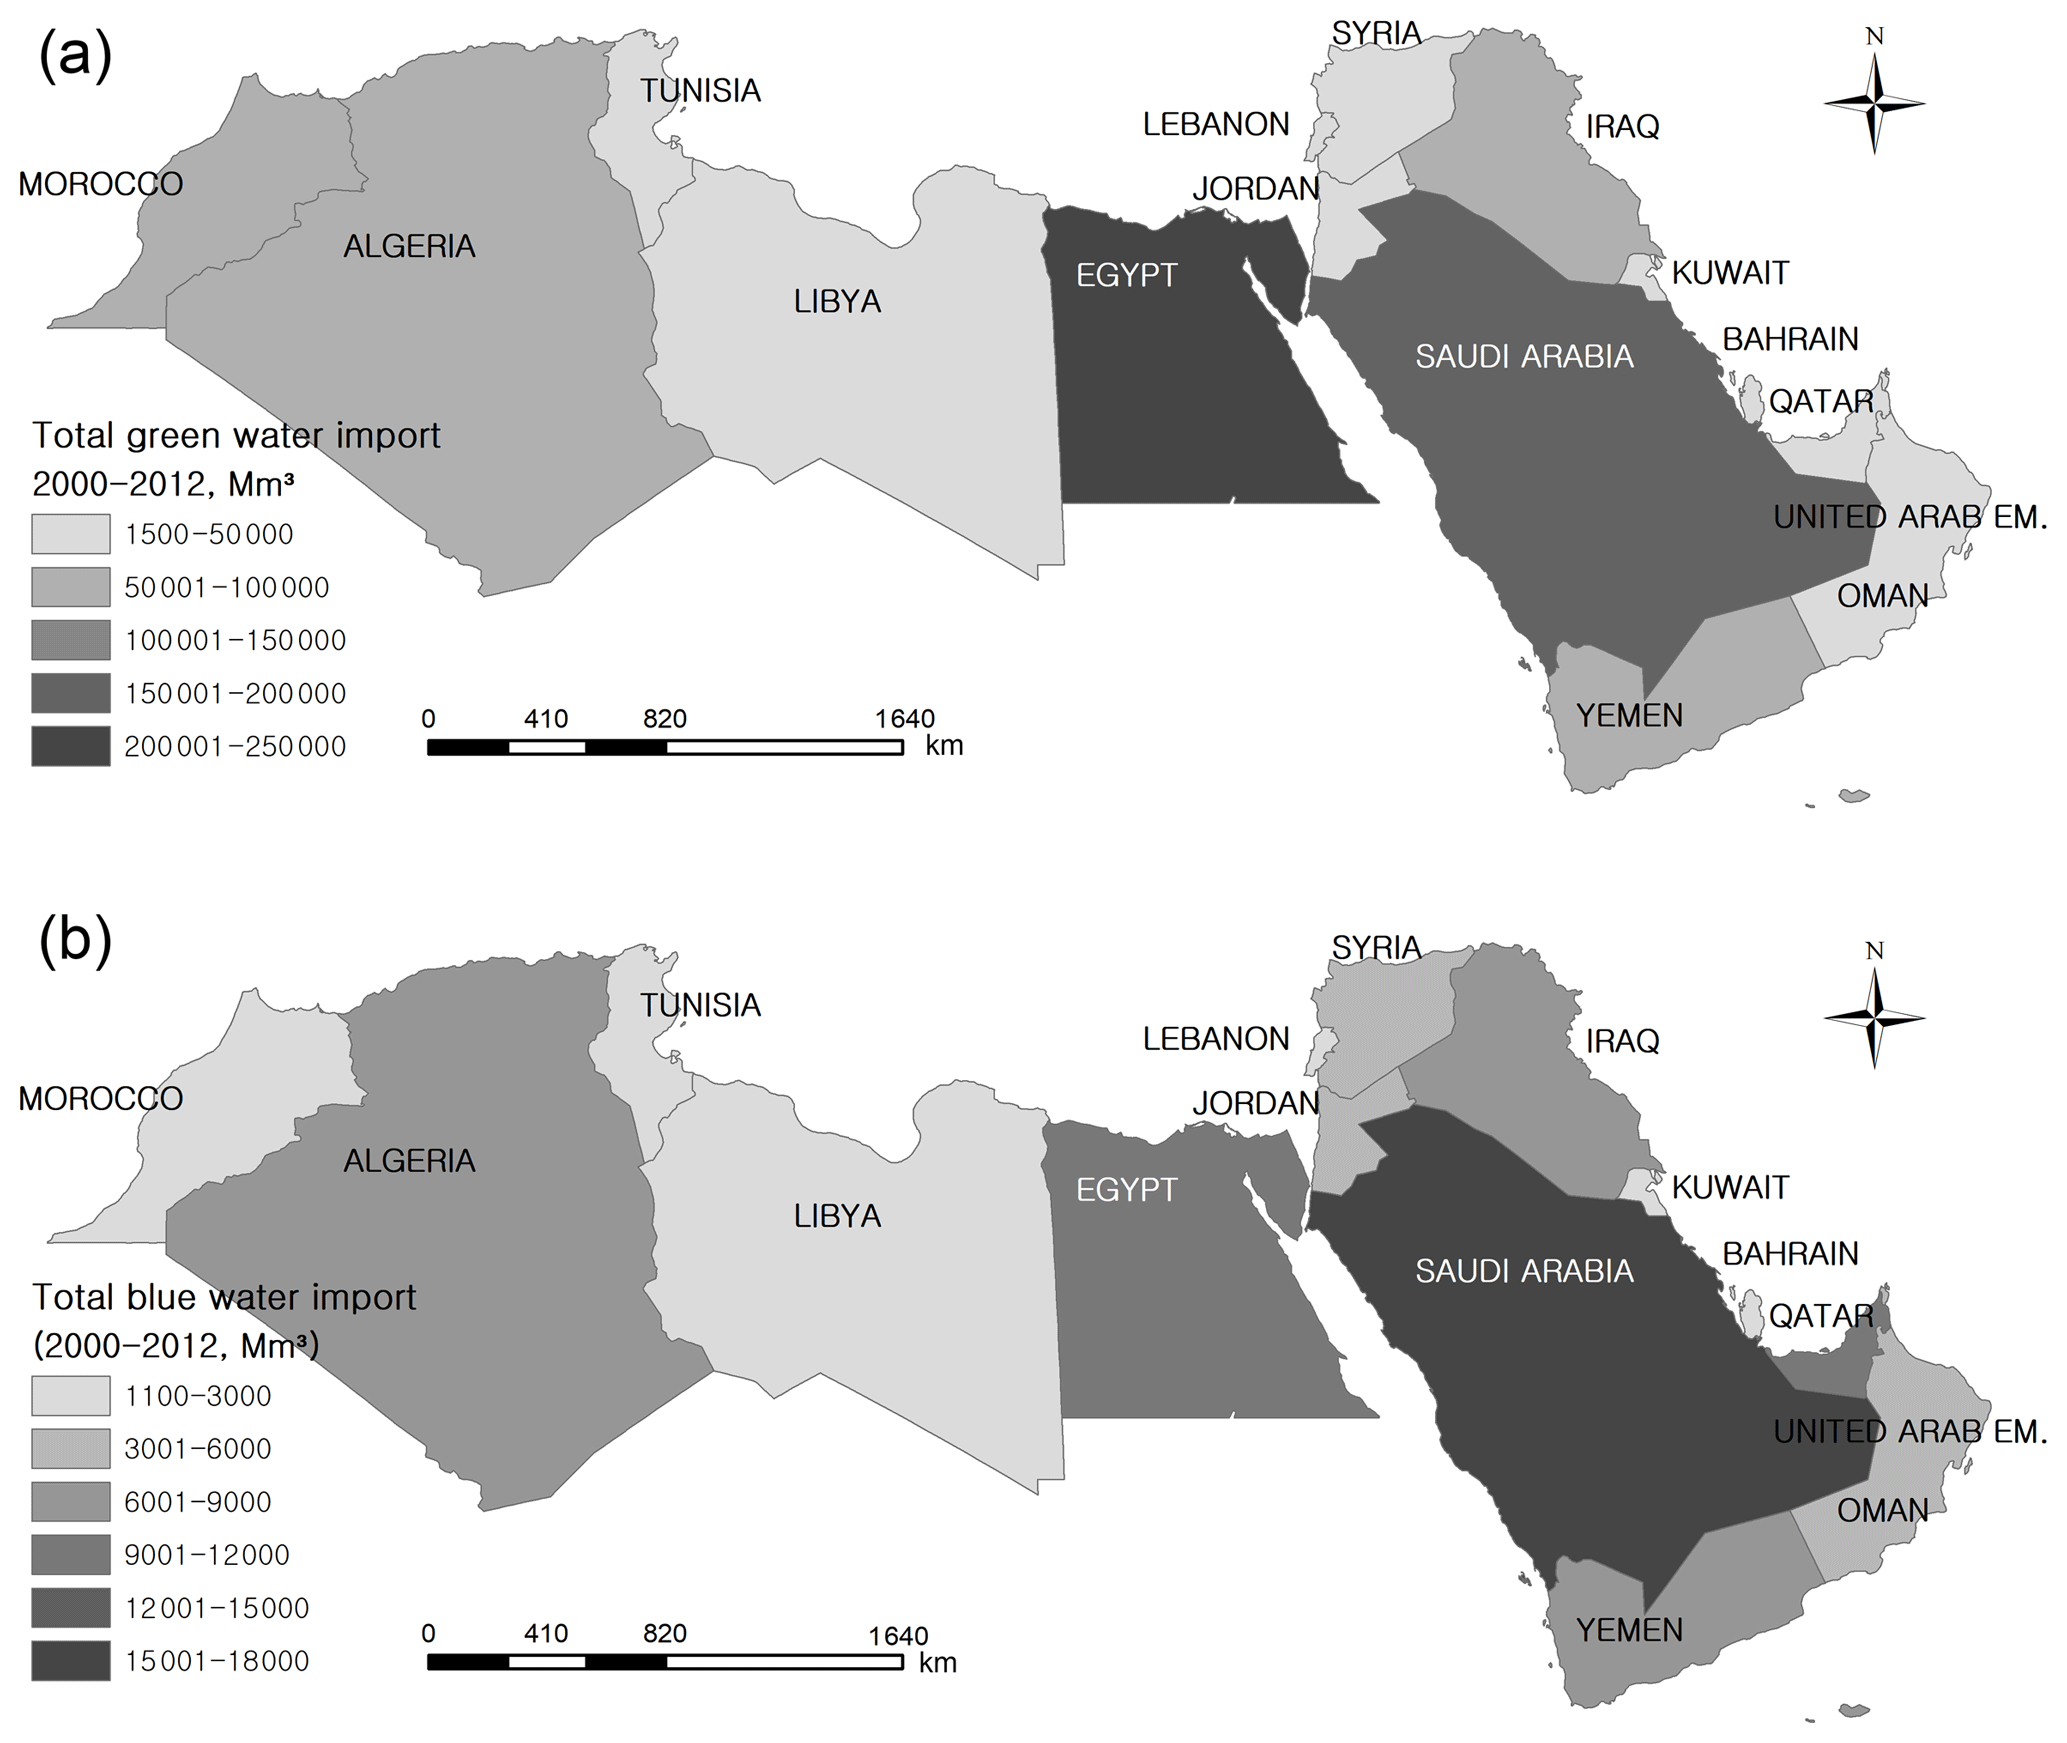
Figure 1The total amount of virtual water imported by each country in the MENA region from 2000 to 2012, separated into green (a) and blue (b) water.
3.2 The VWT in the MENA region from 2000 to 2012
3.2.1 Virtual water import in the MENA region
The total amount of green and blue water imported by each MENA country from 2000 to 2012, respectively, reached 921.2 and 80.5 billion m3 in the MENA region, as shown in Table 4 and Fig. 1. The largest volume of green water was imported annually by Egypt (19.1 billion m3 yr−1), followed by Saudi Arabia (11.9 billion m3 yr−1). In addition, the largest amount of blue water was imported annually by Saudi Arabia (1.2 billion m3 yr−1), followed by the UAE (0.9 billion m3 yr−1). Over 70 % of the green water imported annually into the MENA region based on the trade of barley (approximately 8.5 billion m3 yr−1) was occupied by Saudi Arabia. The amount of virtual water imported based on the trade of maize was 13.0 billion m3 yr−1, with Egypt being the primary importer of 31 % of the total imported amount into the MENA region.
Generally, rice is cultivated in paddy fields, and the blue water footprint of rice in these fields is larger than other cereal crops in various countries. For example, the global average of the blue water footprint of rice is 584 m3 t−1 but that for wheat is 343 m3 t−1 (Chapagain and Hoekstra, 2011; Mekonnen and Hoekstra, 2010). Therefore, the importers of rice also import a lot of water. Approximately 3.0 billion m3 yr−1 of blue water was imported in the rice trade from 2000 to 2012, and Saudi Arabia, the UAE, and Iraq were the primary importers. The largest volume of virtual water imported by the MENA region was due to the trade of wheat. The annual amount of virtual water imported based on the trade of wheat in the MENA region from 2000 to 2012 was approximately 42.6 billion m3 yr−1, and over 35 % of the virtual water imported through the wheat trade was imported by Egypt (15.7 billion m3 yr−1). However, the amount of blue water was only 2.0 billion m3 yr−1 because the green water footprint is much larger than the blue water footprint in main exporters such the Russian Federation, Australia, and Canada, which might indicate that wheat has been cultivated in rain-fed areas with less irrigation.
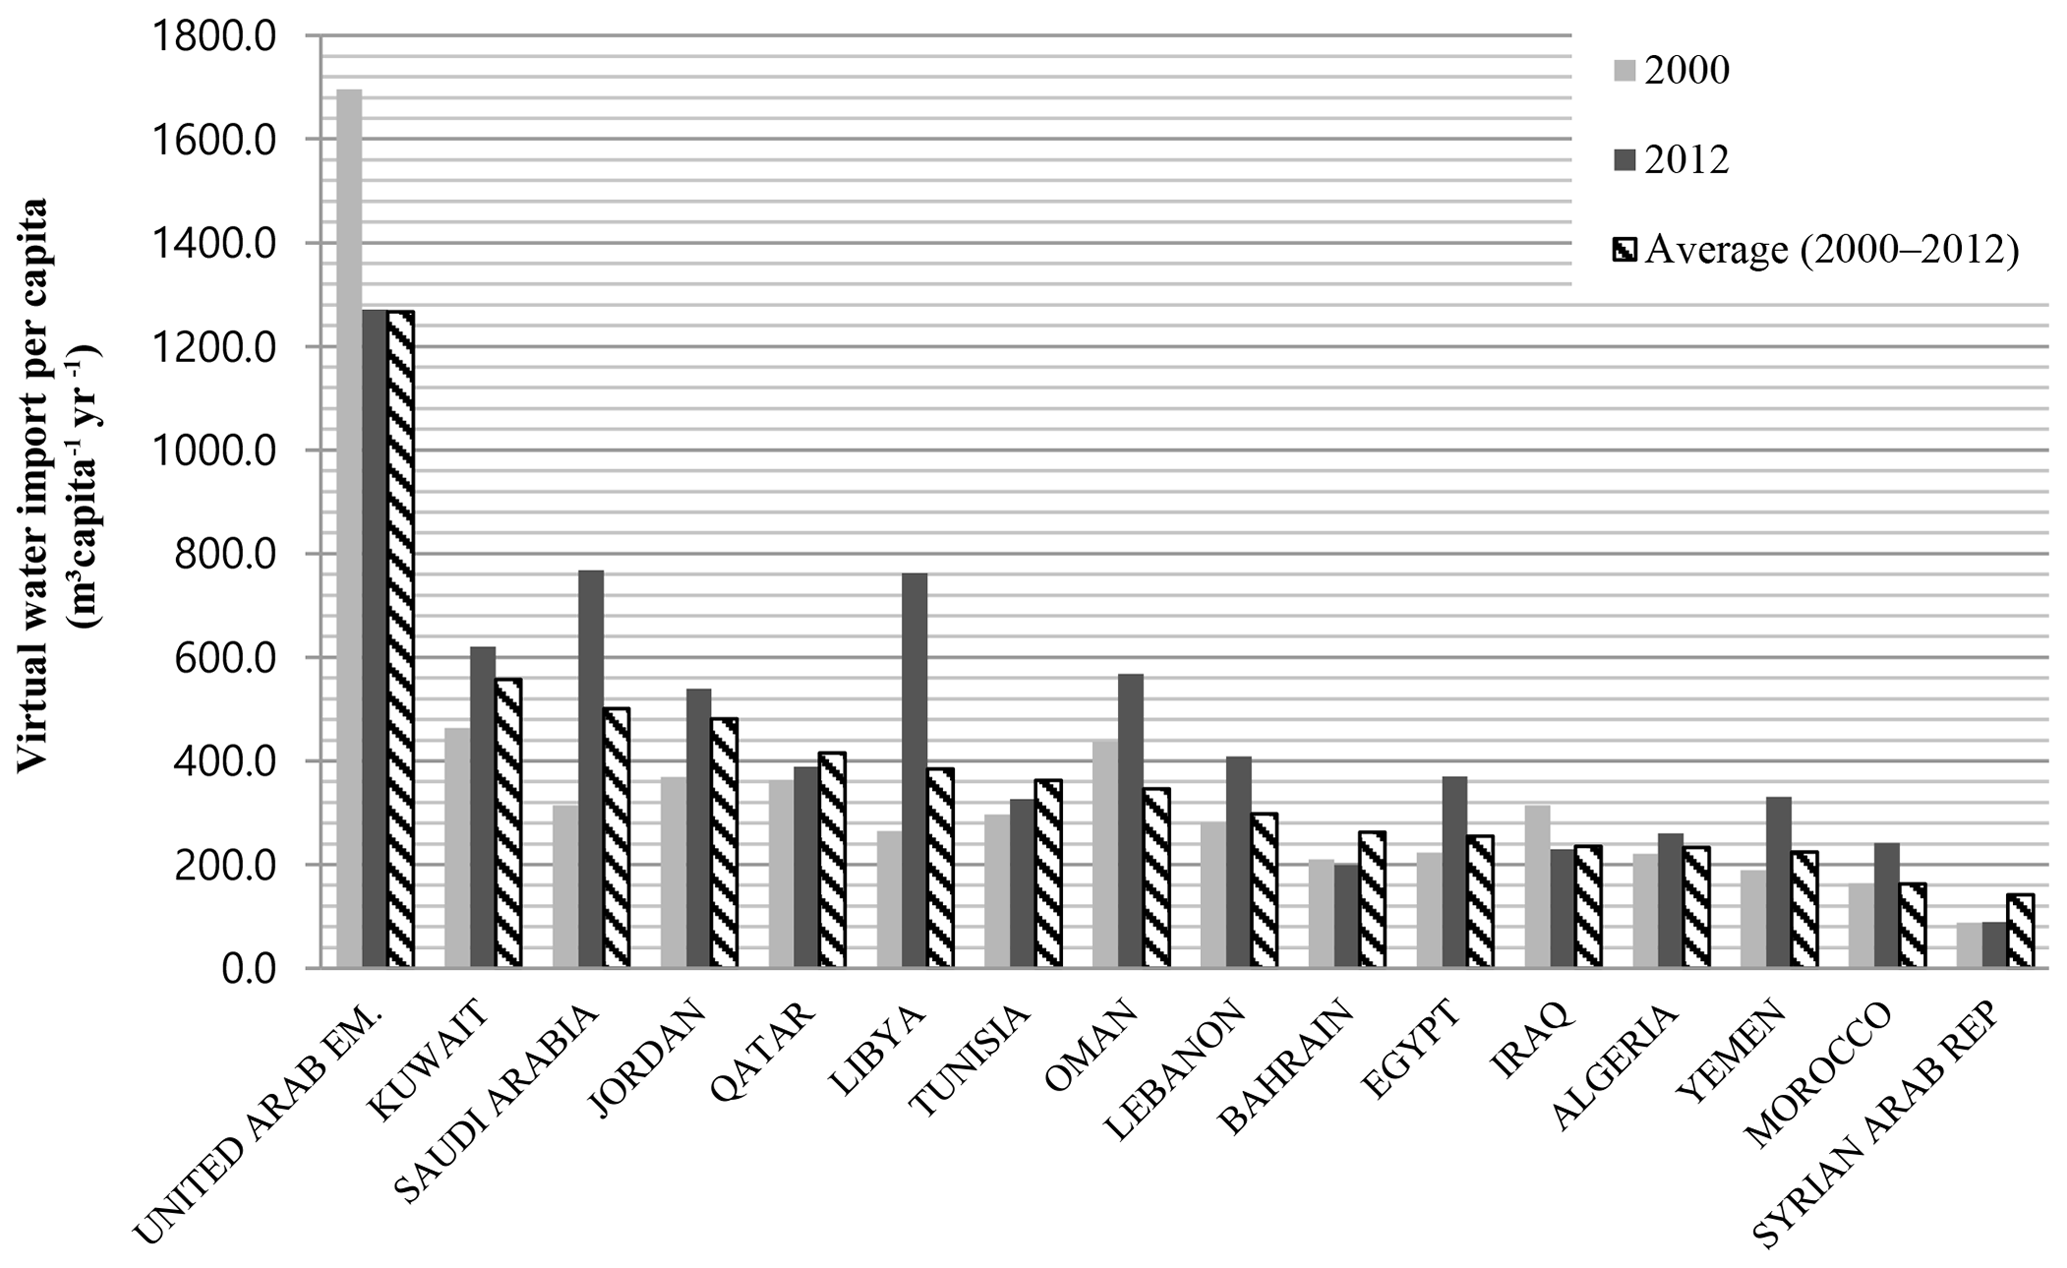
We also estimated the amount of virtual water imported per capita (VWIcap), as shown in Fig. 2, which shows the differing viewpoints regarding food and water securities. If we consider only the total amount of imported virtual water, the UAE may not be considered to be a significant importer because the population and area of the UAE is much smaller than those of the other countries in the MENA region, such as Saudi Arabia. However, the virtual water import per capita in the UAE is larger than that of Saudi Arabia, thus indicating that the dependency on virtual water imported from exporters in the UAE is much more significant than in Saudi Arabia. For example, the VWIcap was 1266.6 m3 cap−1 yr−1 in the UAE, which was the largest value in the MENA region. The UAE is strongly dependent on the import of virtual water, even though the UAE imports only 4.2 billion m3 yr−1 of virtual water. The VWIcap increased significantly in Saudi Arabia and Libya from 2000 to 2012. For example, Saudi Arabia imported approximately 314 m3 cap−1 yr−1 of virtual water in 2000 and it increased to 768 m3 cap−1 yr−1 in 2012. Saudi Arabia was the second largest importer in the MENA region, and its VWIcap was also the fifth highest in the MENA region.
3.2.2 Virtual water export to the MENA region
We also focused on the volume of virtual water exported to the MENA region by each exporter from 2000 to 2012, as shown in Fig. 3. Based on the trade of barley, Ukraine exported 41.1 billion m3 of green water to the MENA region that amounted to 27 % of the total green water imported in the MENA region. In terms of blue water traded through barley, five exporters (Germany, Australia, the Russian Federation, Ukraine, and India) provided 78 % of the total blue water imported in the MENA region based on barley. Based on the trade of maize, Argentina contributed 40 % of the total amount of green water imported by the MENA region based on maize, but the blue water imported by the MENA region was primarily from the USA. Based on the trade of rice, the major virtual water exporters to the MENA region were India, Thailand, and Pakistan. In particular, 30.4 billion m3 of blue water was imported from these countries from 2000 to 2012, which comprised 78 % of the blue water imported by the MENA region based on rice. Wheat was the most representative crop imported by the MENA region. The Russian Federation and the USA provided 25 % (140.6 billion m3) and 21 % (111.2 billion m3) of the total amount of green water imported in the MENA region based on the trade of wheat in 2000 to 2012, respectively, and the remaining 55 % was divided among several exporters, including Australia, Canada, France, and Ukraine.
3.3 The temporal change in VWT structure in the MENA region
From 2000 to 2012, both the volume and connectivity of VWT was changed. For example, the virtual water imported in the MENA region slightly increased and the VWT was distributed with more exporters in 2006, as shown in Fig. 4. However, the volume of virtual water imported in the MENA region increased more than 50 % from 2006 to 2012 but the distribution of VWT seemed to be consistent. In the case of Lebanon, VWT was strongly dependent on the USA, Argentina, and Australia. However, Lebanon expended the VWT in 2006 and the Russian Federation, Turkey, and Kazakhstan contributed to virtual water imports in Lebanon, as shown in Fig. 4. Accordingly, the structure of VWT in Lebanon approached a distributed network. However, the VWT in 2012 showed that it was dominated by Ukraine and the Russian Federation, though Lebanon imported more virtual water in 2012 than 2006.
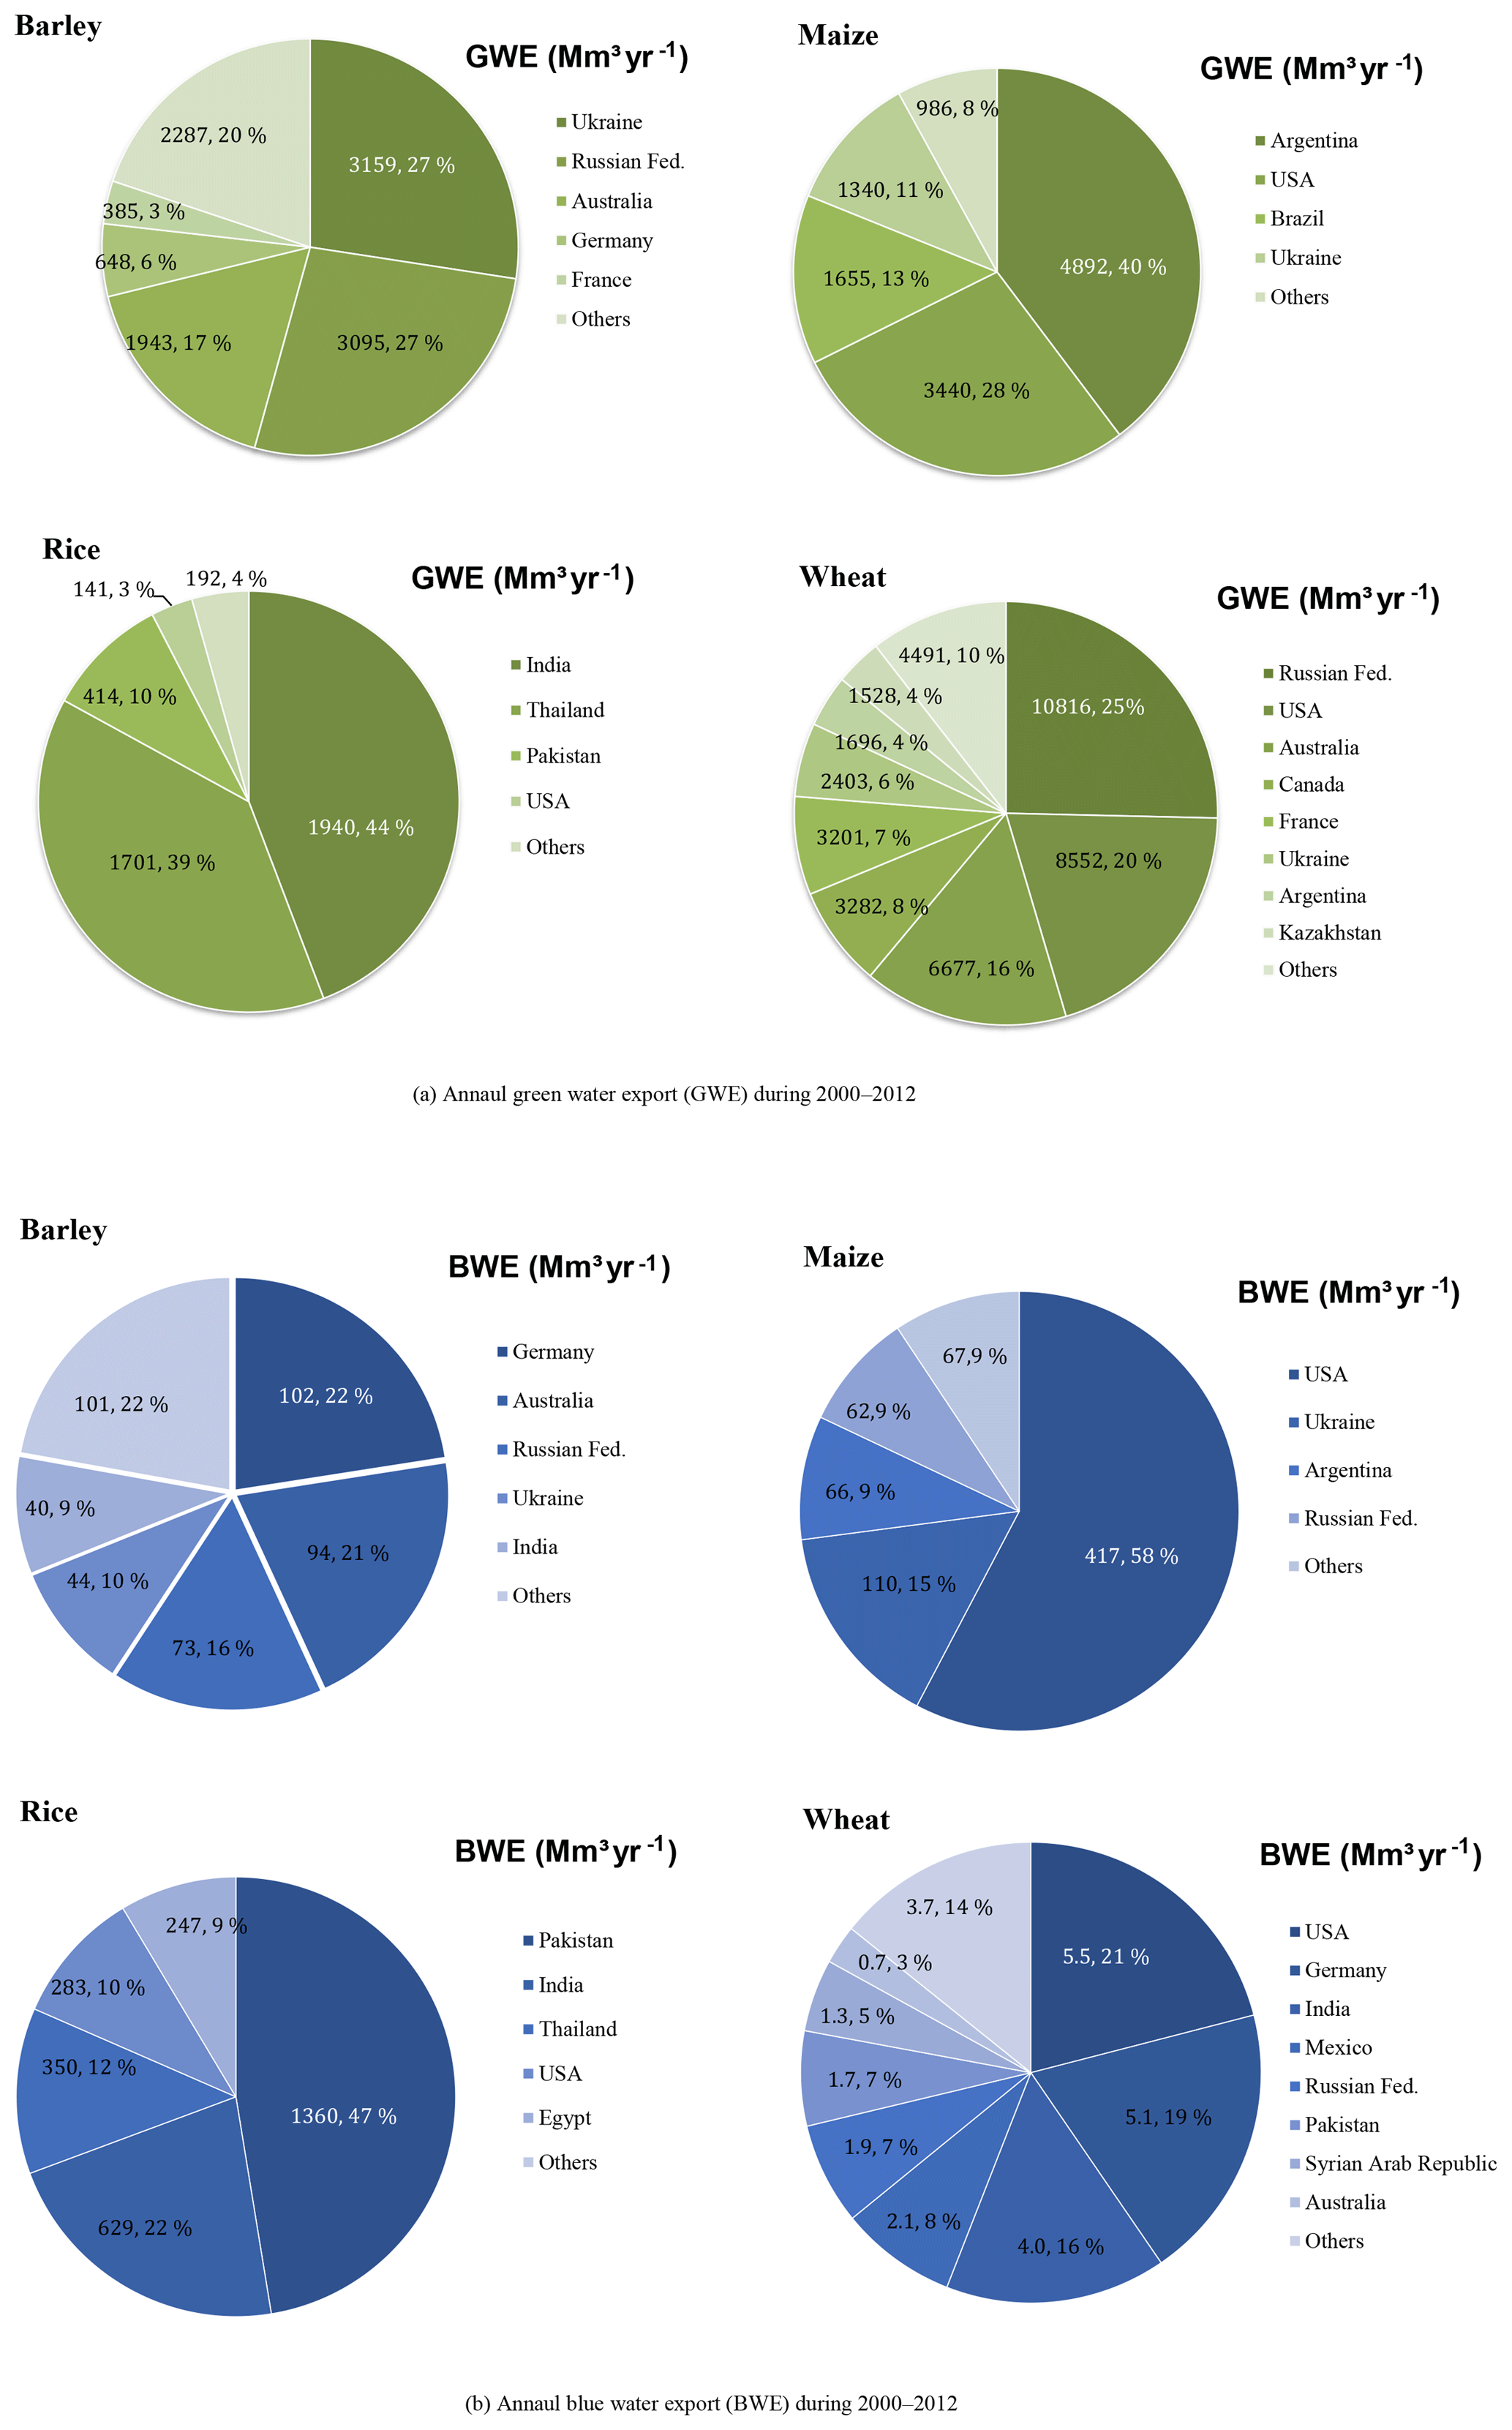
Figure 3Quantities of green water export (GWE) and blue water export (BWE) from the primary exporters to the MENA region from 2000 to 2012.
These changes are more related to the structure of VWT and the MENA region should consider not only the amount of virtual water but also the structure of VWT for sustainable food security, subject to the condition of a strong dependency on crop import. Therefore, we analyzed the degree centralities of NSInDC and SInDC from 2000 to 2012 in the MENA region and identified the countries who had the vulnerable expansion or reduction in the VWT network. Figure 5 shows the NSInDC and SInDC patterns in the VWT network in accordance with each country in the MENA region. If a specific country has both large NSInDC and small SInDC, this country has connections with various exporters but imports a small amount of virtual water. Specifically, Egypt and Yemen showed that NSInDC was lower but SInDC was higher than other countries, thus indicating the intensive connectivity with a few exporters. In contrast, Saudi Arabia had larger SInDC than other countries expect for Egypt, while the NSInDC was also the highest of the MENA region. Accordingly, Saudi Arabia had a more distributed structure regarding VWT. The UAE and Iraq had similar SInDC in 2012 but NSInDC was quite different – 0.46 for the UAE and 0.27 for Iraq. Furthermore, SInDC in Morocco (96.45) was larger than in the UAE (83.41) but NSInDC in Morocco (0.26) was smaller than in the UAE (0.46). In comparison to the UAE, Morocco had intensive connections with fewer exporters compared to the UAE.
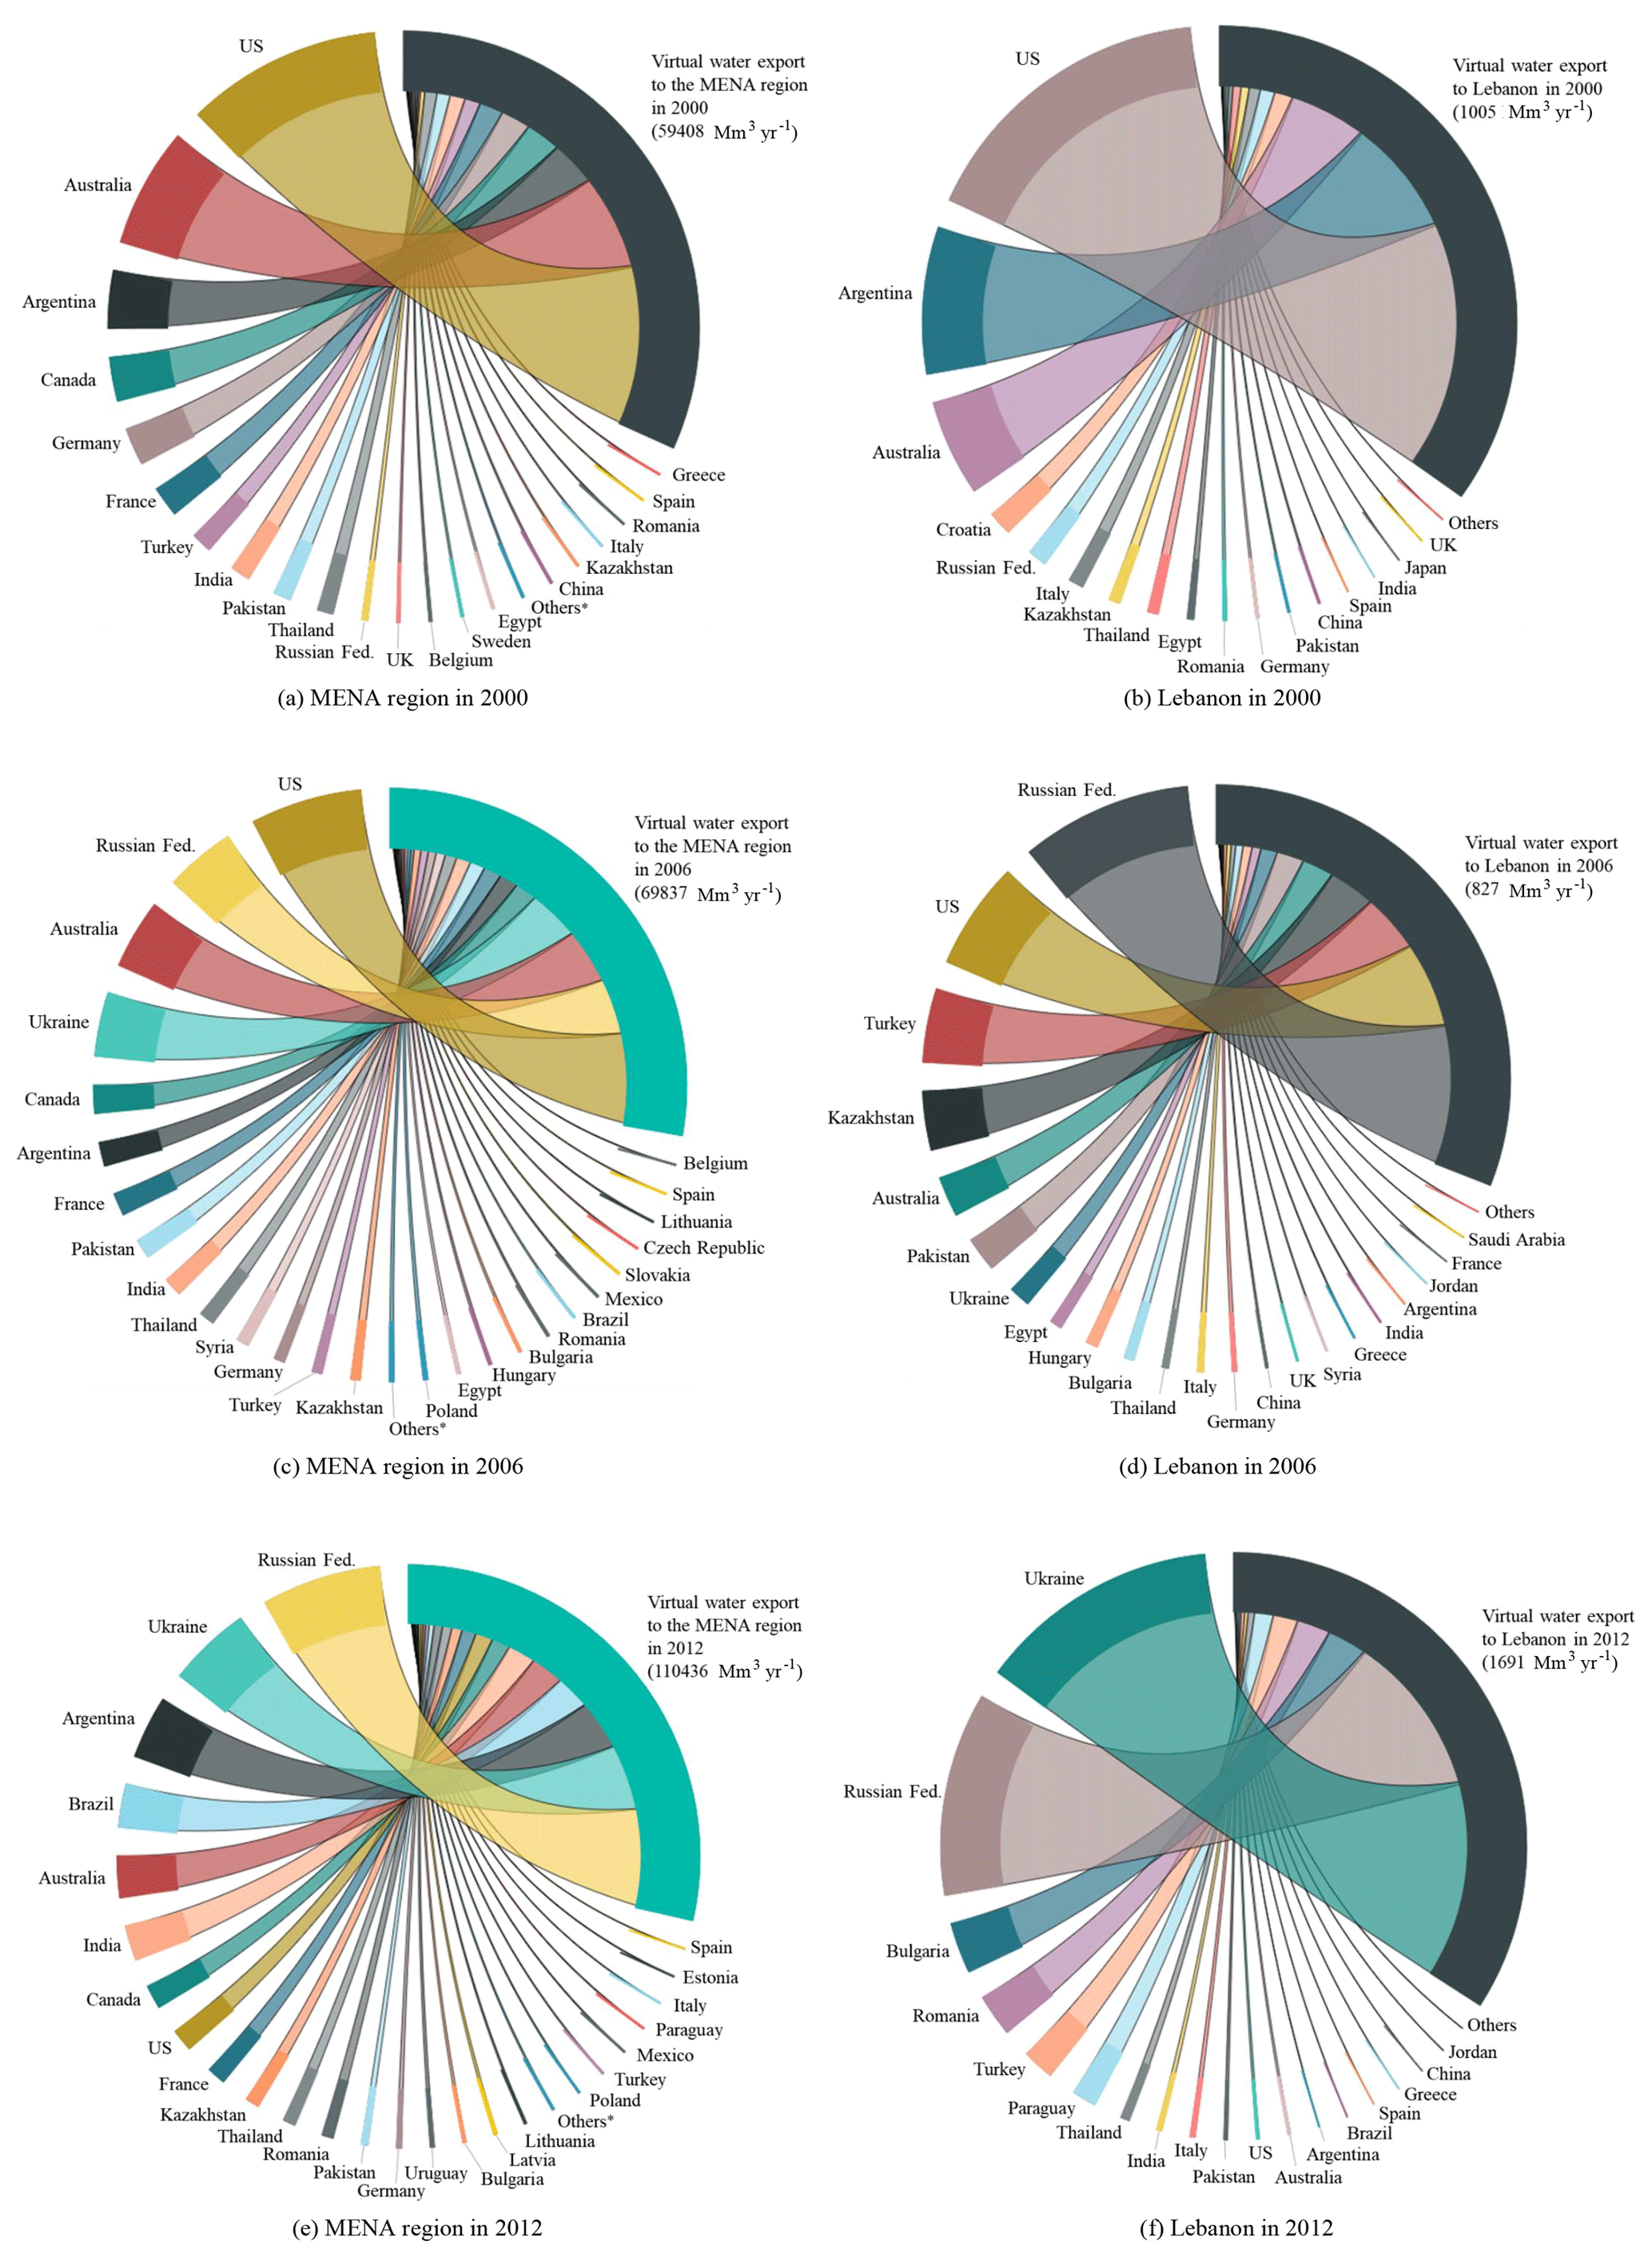
Figure 4Virtual water imports at the MENA region and Lebanon in 2000, 2006, and 2012. Others indicate the countries which export less than 100 Mm3 yr−1 to the MENA region or Lebanon.
Based on the temporal changes in NSInDC and the SInDC during two periods (2000–2006 and 2006–2012), the MENA region countries were divided into four types (I–IV), as shown in Fig. 6. The x axis indicates the NSInDC and the y axis indicates the SInDC. Type I countries are located at higher levels both in the x and y axis and show a robust expansion in the virtual water import. Additionally, the countries in this type increased the connectivity and volume of virtual water imported, simultaneously. Type II countries increased the volume of virtual water imported without expansion of connectivity. Type III countries showed reductions in the virtual water import with reduction of connectivity, and type IV countries have established connections with more exporters but have decreased virtual water imports.
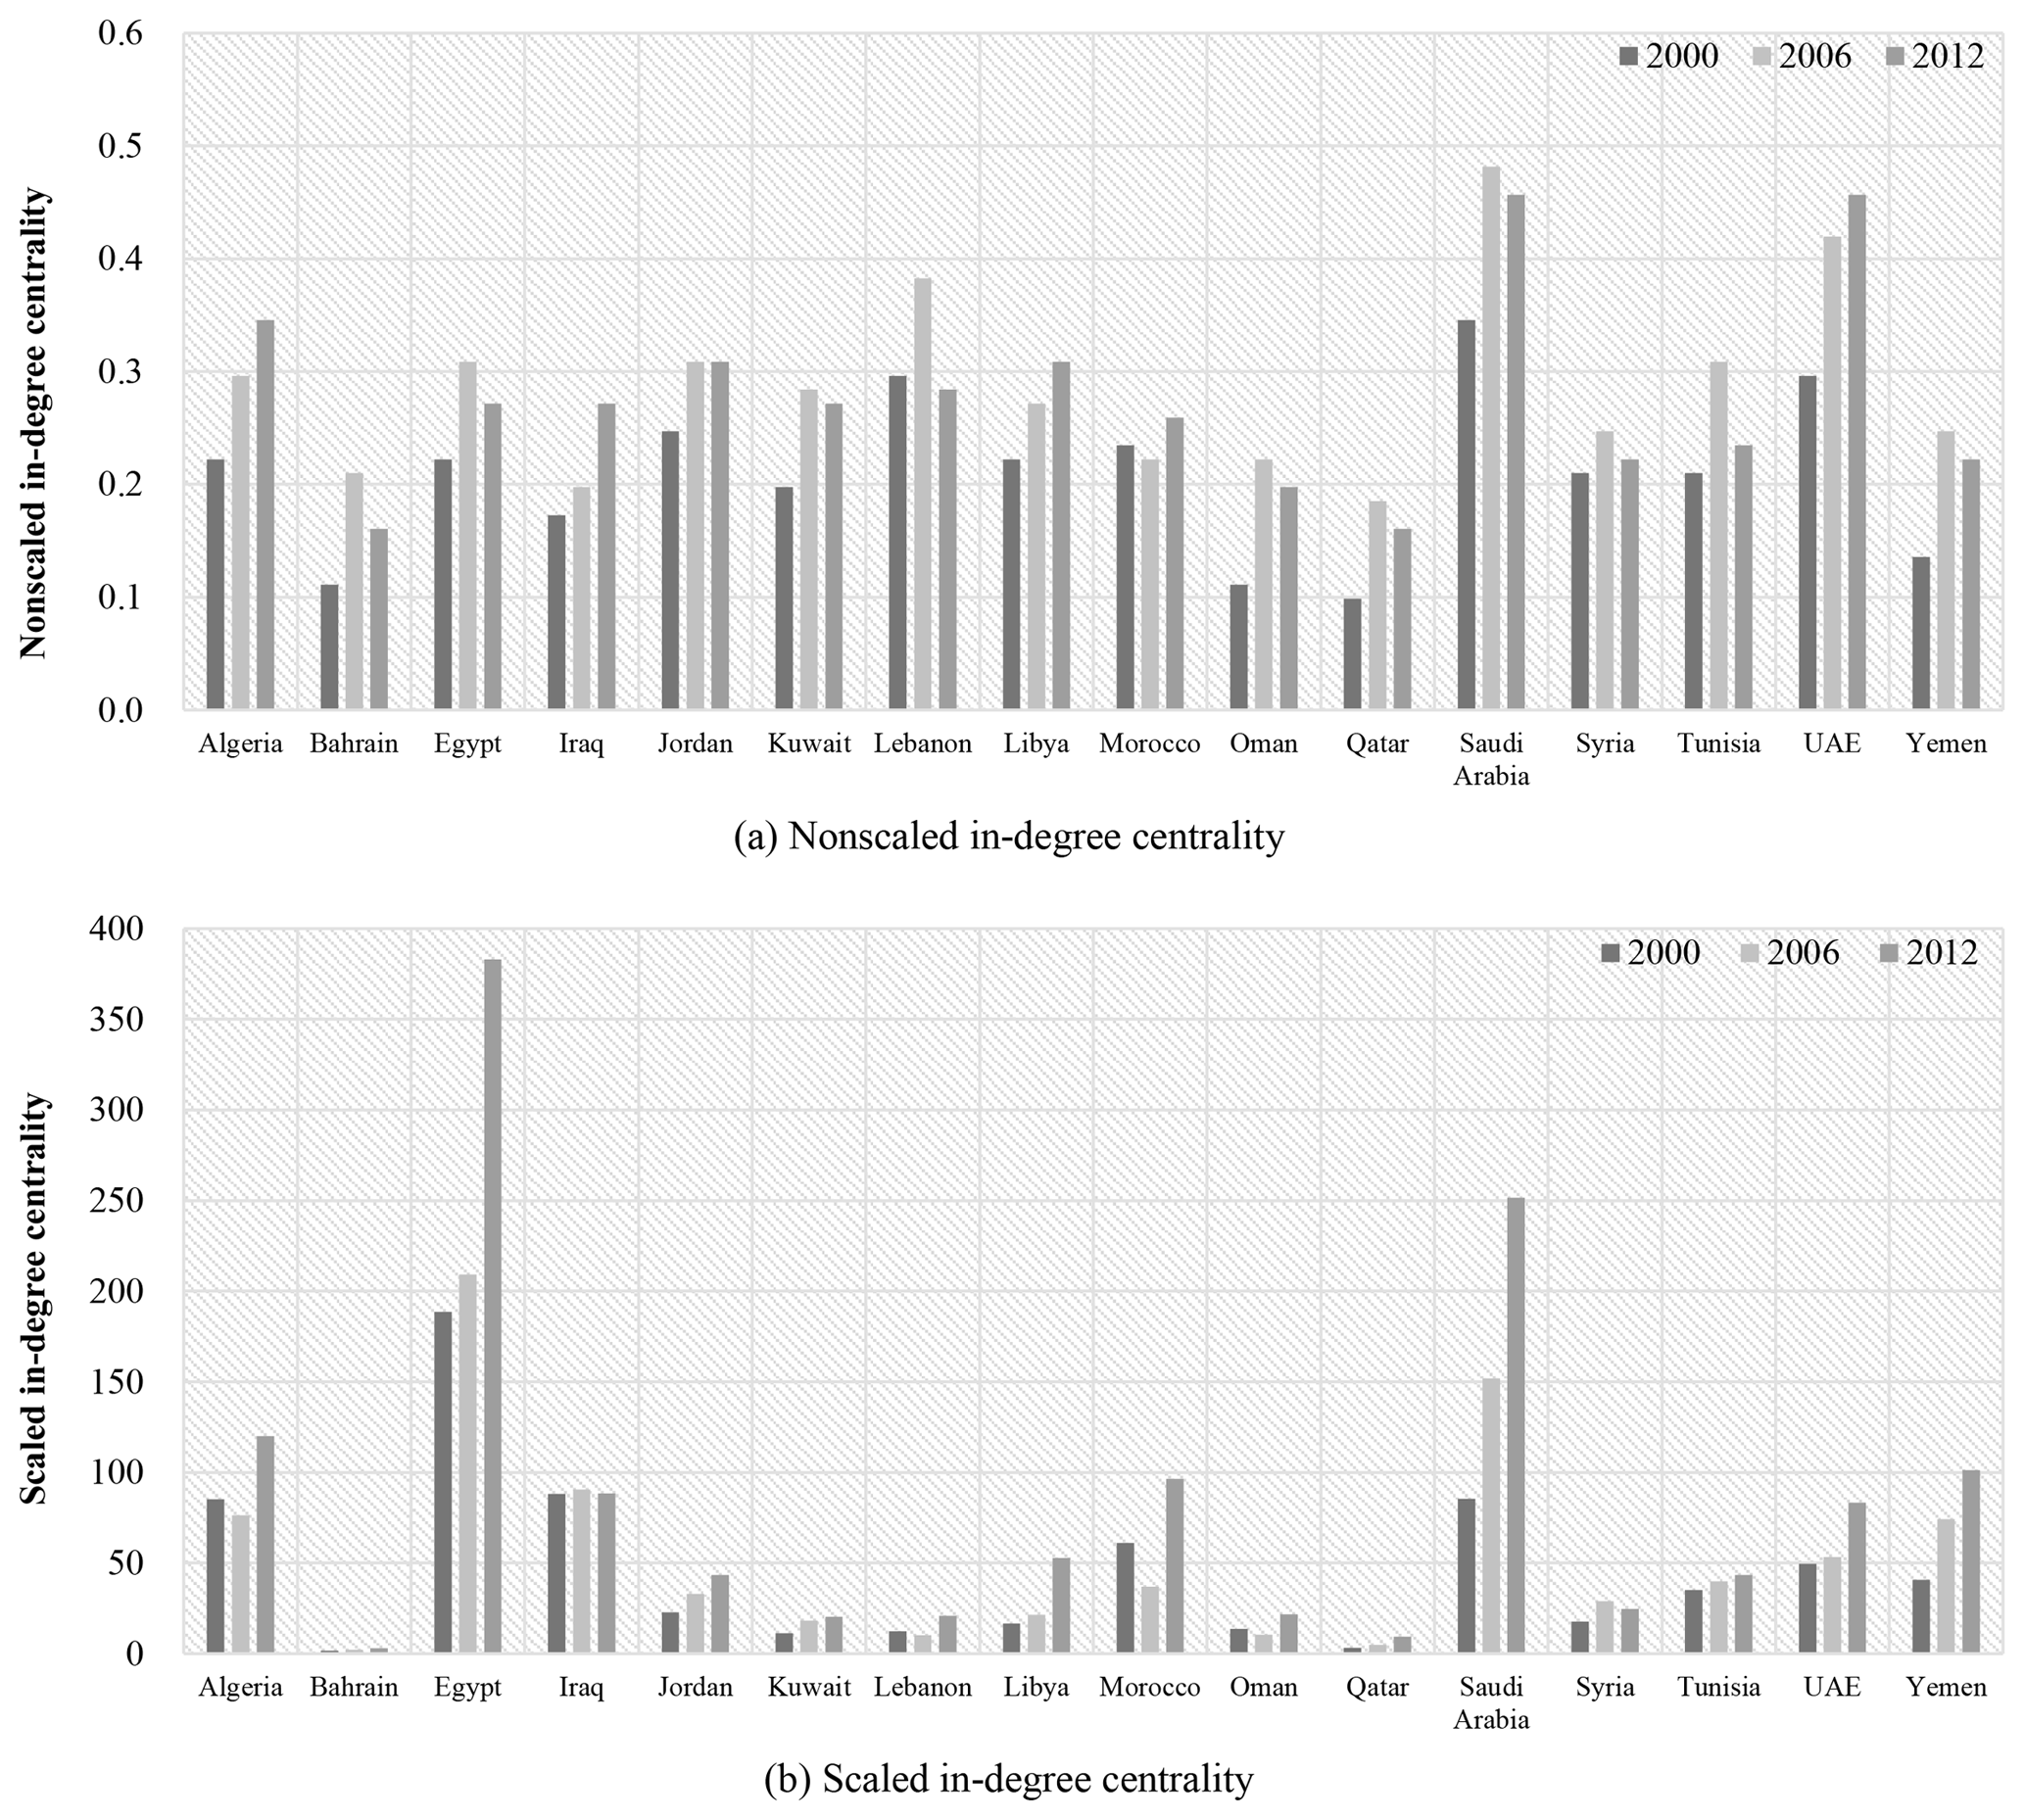
Figure 5Nonscaled and scaled in-degree centralities of each country in the MENA region in 2000, 2006, and 2012.
In the early 2000s, most countries in the MENA region expanded their trade structure by increasing both the connectivity to the exporters and the volume of the imported virtual water. In Bahrain, Omen, Qatar, Yemen, Saudi Arabia, Lebanon, and the UAE, the NSInDC of the VWT network increased significantly from 2000 to 2006, which means that the trade connectivity expanded. The expanded structure of the VWT indicates that the MENA countries were connected to various exporters and that this structure can be a resilient structure for global changes. In particular, the import of food crops is an essential factor in food security in the MENA region, even if food self-sufficiency is increased by increasing domestic production. However, Egypt had the largest SInDC but NSInDC was ranked sixth among the MENA region countries. In 2006, Egypt and Saudi Arabia both expanded the connectivity in the VWT network, as shown by the increasing NSInDC. However, the type of VWT structure in many MENA countries such as Yemen, Qatar, Bahrain, and Lebanon has moved to Type II, which means that the countries increased the volume of the imported virtual water, but the number of exporters that linked to the MENA countries decreased from 2006 to 2012. In particular, in 2012, most countries kept their connectivity or reduced it, except for Algeria, Iraq, Libya, and the UAE. These results indicate that the dependence of the MENA region on virtual water import increased rapidly recently with the large increase in the imported volume of virtual water. However, the connectivity of the VWT in the MENA region has not increased as much as the volume of virtual water imported increased.
The degree centrality in this study could be useful for identifying the connectivity and volume of trade of each country, but it is limited to show the influence of each country on entire trade network; thus we estimated eigenvector centrality, as shown on Fig. 7. In 2000, Egypt and Saudi Arabia were identified as the most influential importers in the MENA region, and the USA and Australia were the most influential exporters. Accordingly, the entire VWT in the MENA region could be affected by these importers and exporters. This means that the change in the trade policy or food management in these countries could change the structure of VWT in the MENA region. In 2006 and 2012, the influential countries in the MENA region were still Egypt and Saudi Arabia, but the influential exporters moved to the Russian Federation, Ukraine, and Brazil.
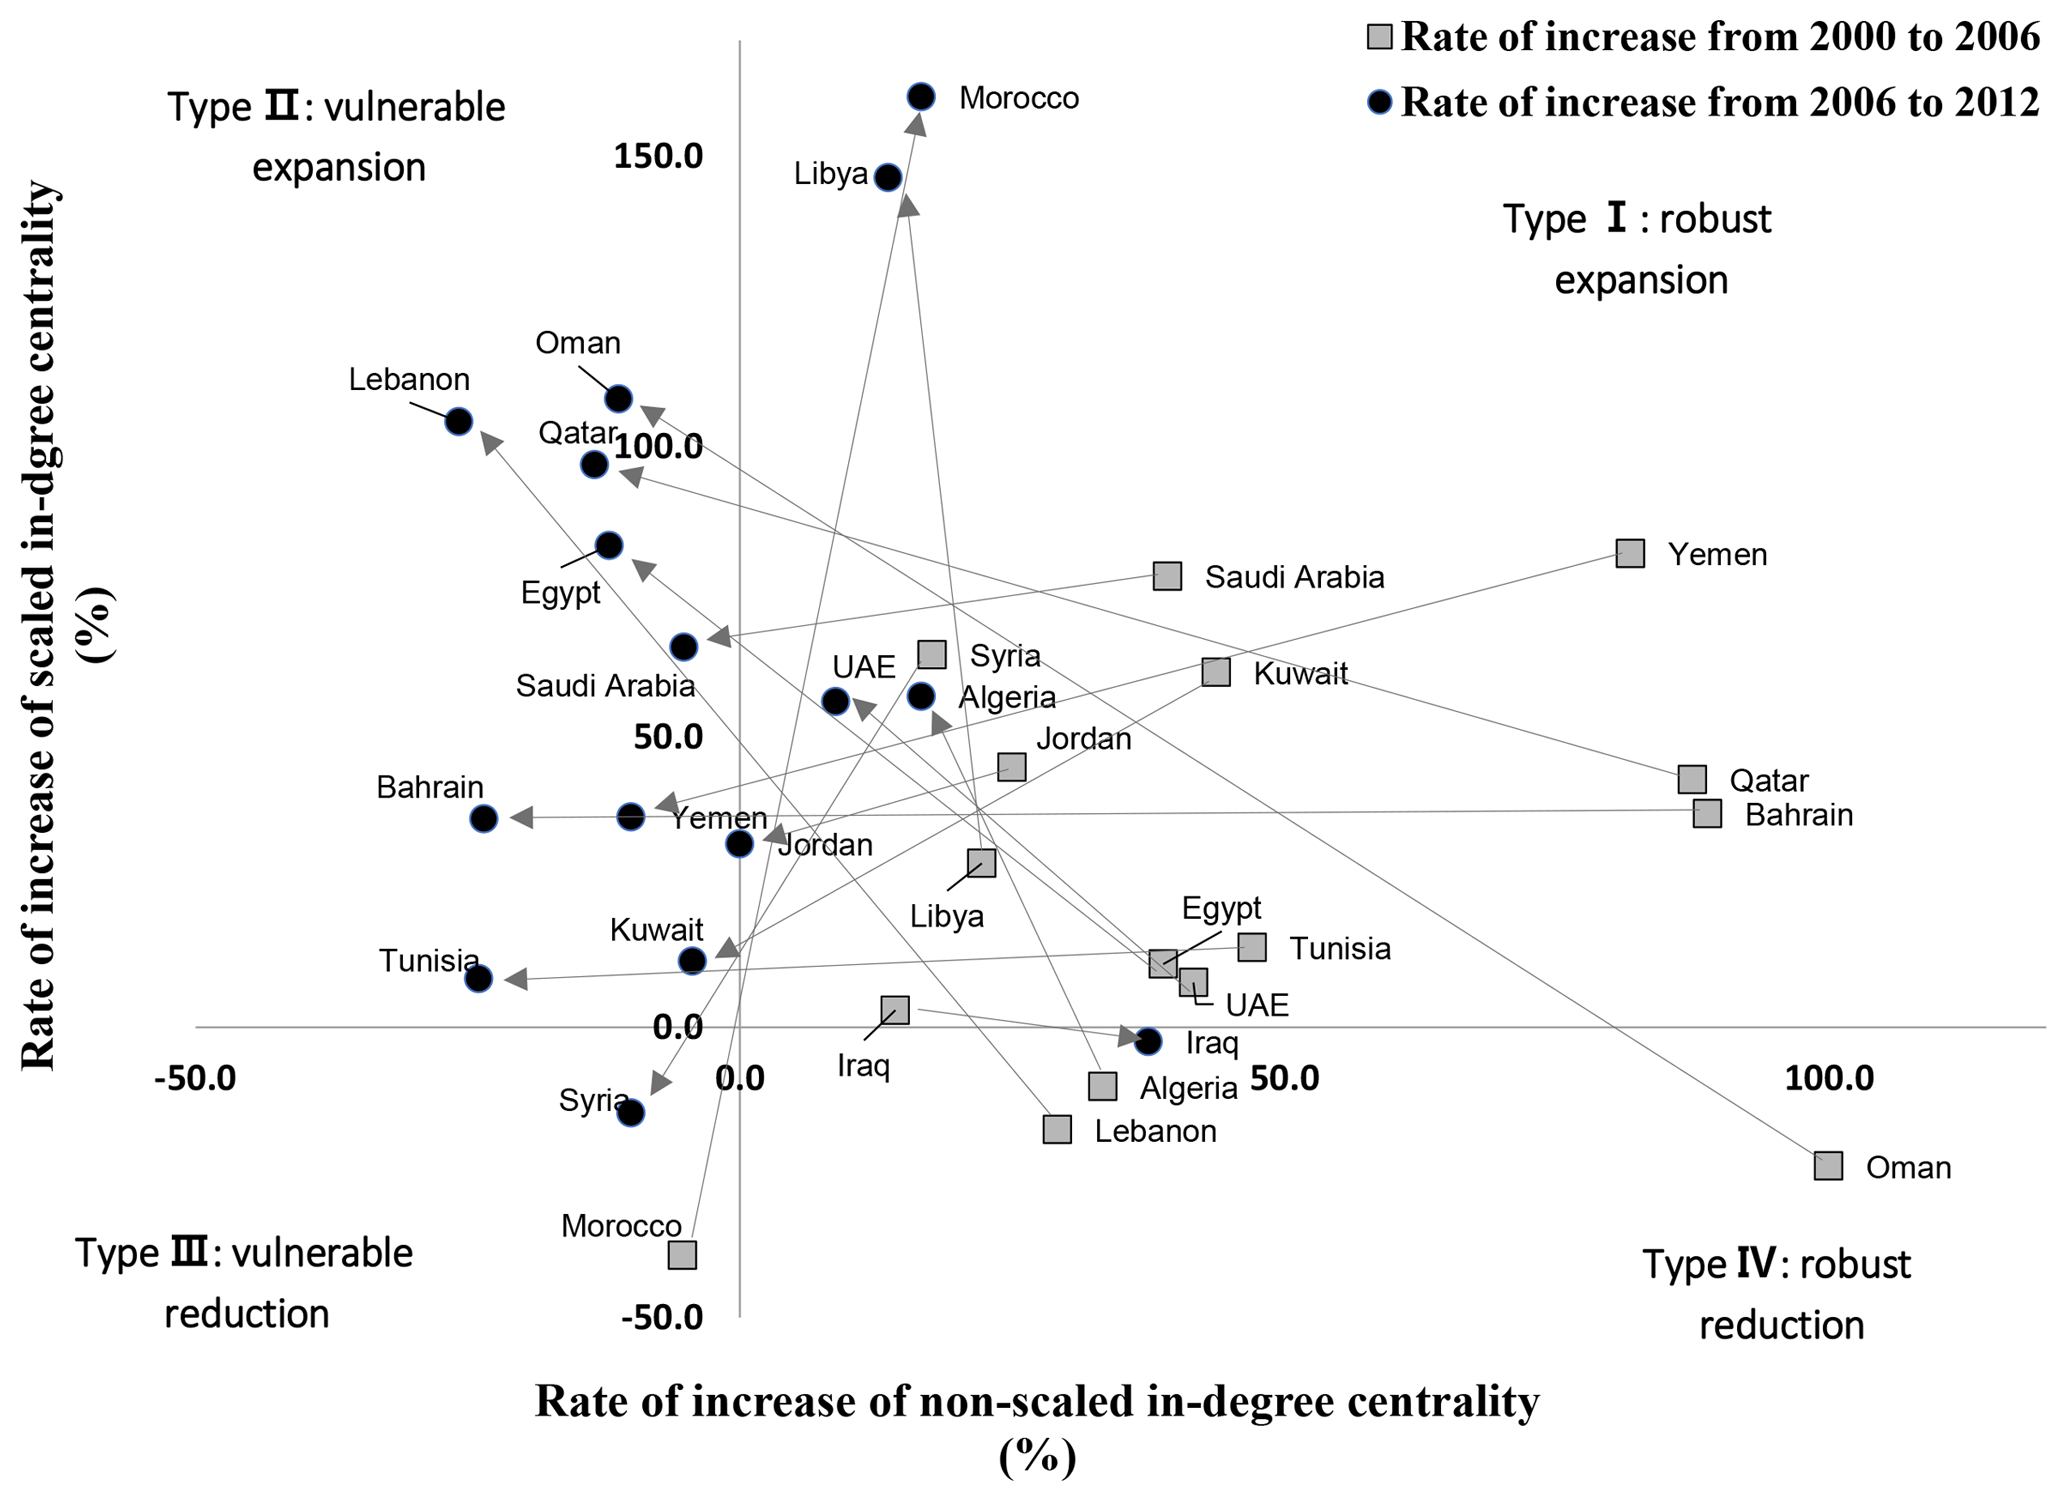
Figure 6Country types in the MENA region according to the changes in nonscaled and scaled in-degree centralities.
3.4 Importance and limitations of water footprint and VWT in the MENA region from a policy perspective
Generally, the VWT is more related to resource management in exporting countries rather than importing countries because the embedded water in food trade indicates water resources that are consumed for producing food products in the exporting country. However, VWT is also considered to be an important issue in importing countries in terms of water and food security. For example, the reduction of VWT might be related to water consumption by replacing imported food products by domestic food products.
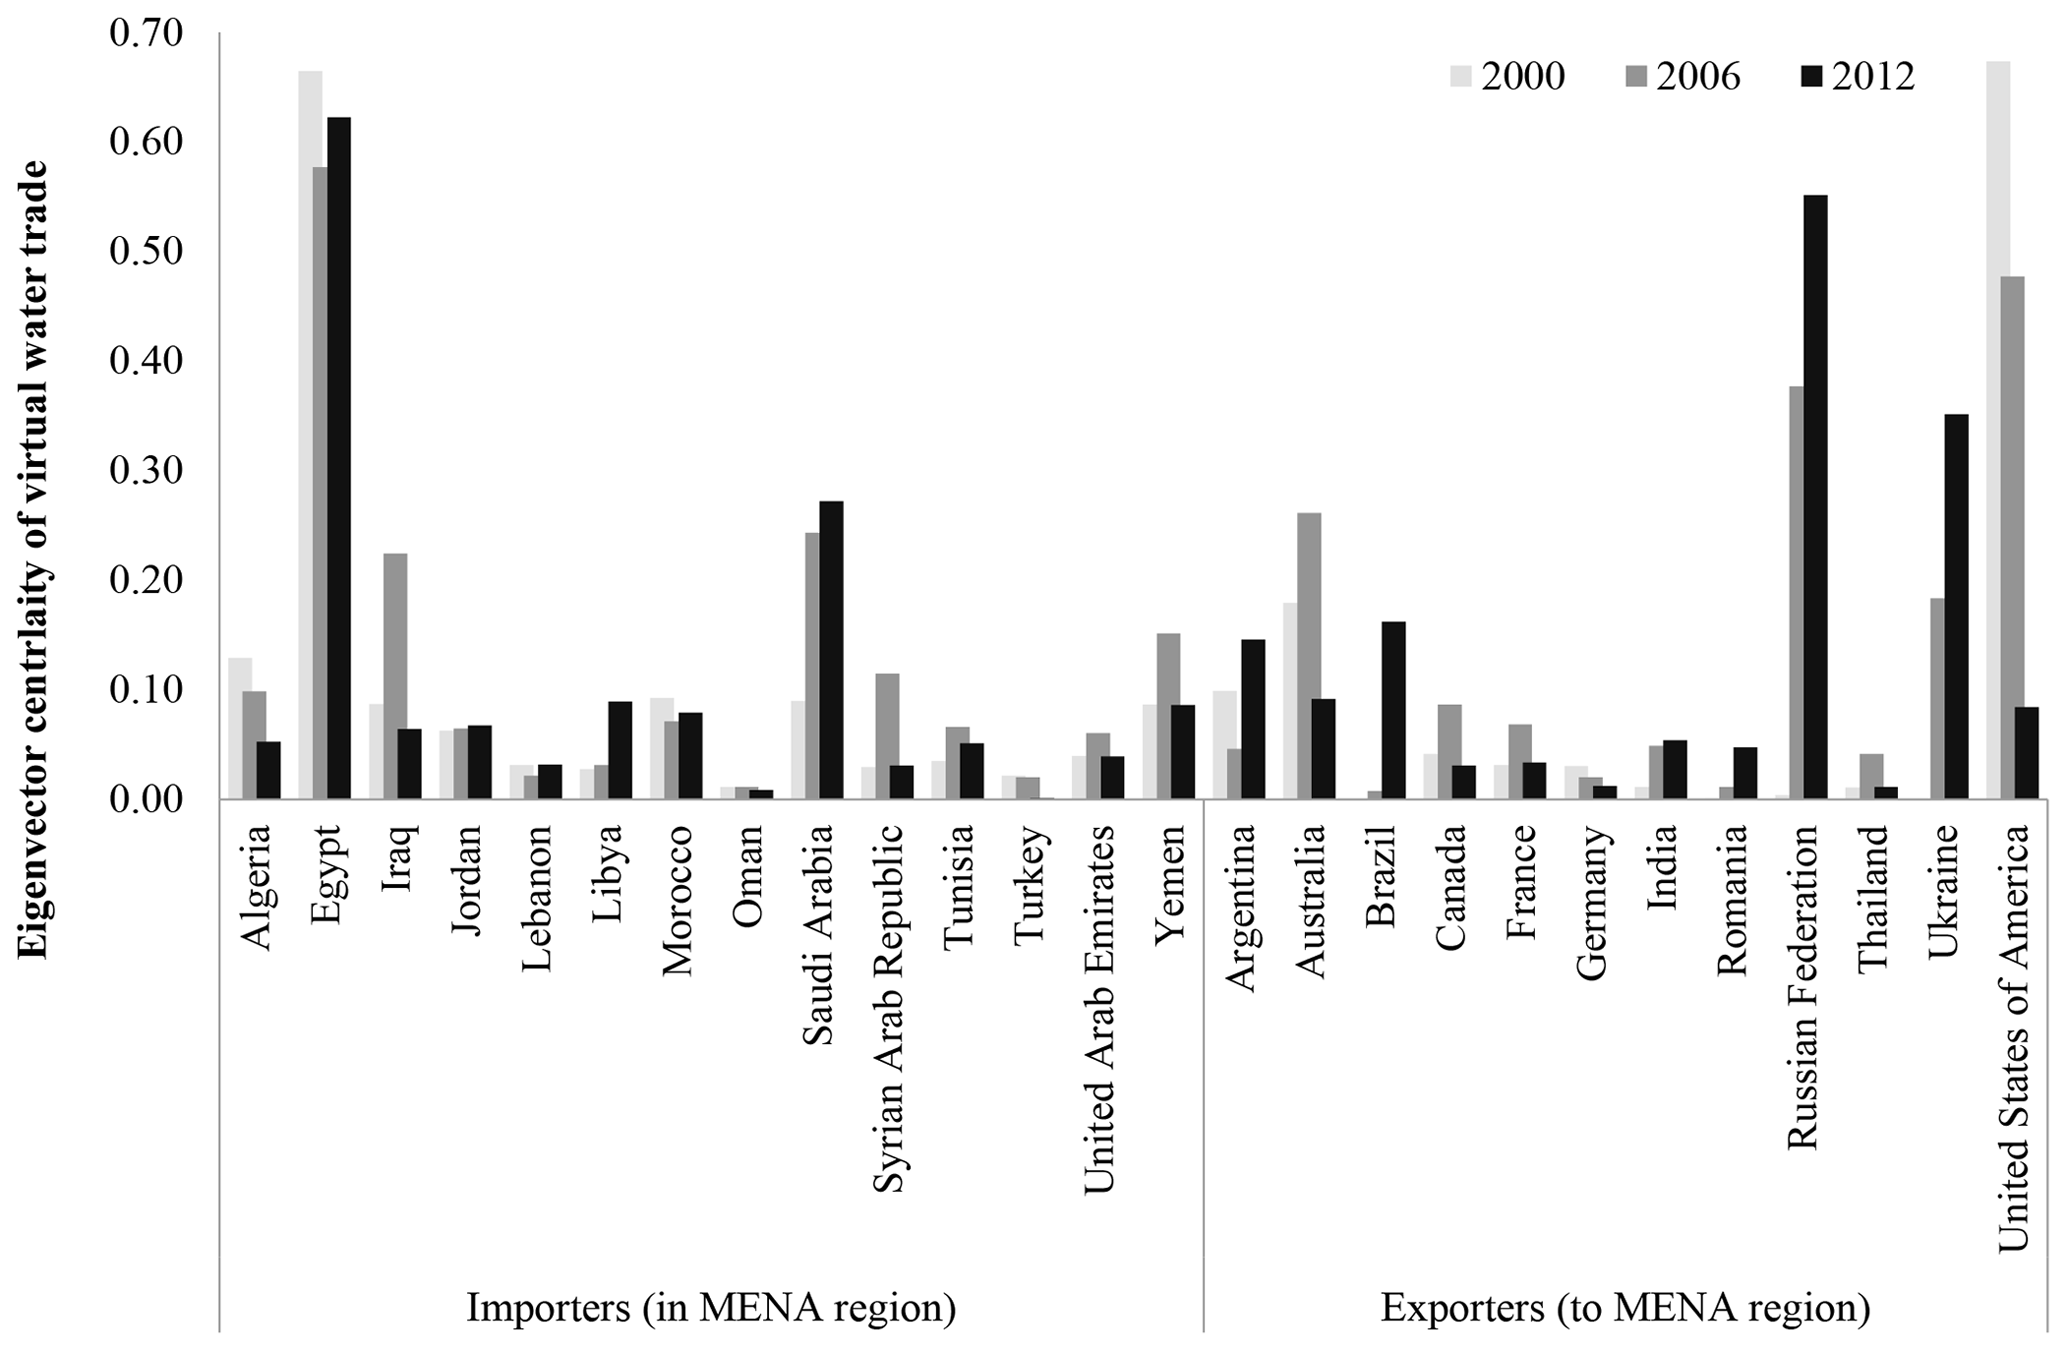
Figure 7Eigenvector centralities of the virtual water trade network in the MENA region in 2000, 2006, and 2012.
However, the application of the concept of VWT is under critical discussion (Wichelns, 2010). First, water footprints formulate new concepts of water management, but we need to realize that water footprint can be changed due to various factors such water requirement, productivity, production system, development of technologies, fertilizer usage, and irrigation scheduling and operations of the water facilities. Second, VWT could contribute to the connection of water management to food security. However, food trade is affected by the scarcity or affluence of other important resources, such as capital, labor, and land (Biewald et al., 2014). In particular, economic values, such as the price of food products, are the main driver in global food trade, but there is no global value established for virtual water. Therefore, it is difficult to apply virtual water to trade policy in terms of the economic efficiency. Therefore, policy makers or resource managers in the MENA region should not only consider the effects of VWT but also the difficulty in adapting virtual water to policies for resource management. Third, there are spatial and temporal issues of VWT in the study. The VWT could be affected by geopolitical issues such as topography and distances between importers and exporters. For example, the changes in exporting countries in the MENA region could be related to energy use for transporting products; thus trade policy should consider the economic benefit or cost of transportation. Therefore, the VWT should be discussed with geopolitical issues such as benefit and cost of transportation. In addition, VWT and water–land savings by food trade in this study were calculated based on a historical database; thus it was difficult to apply the results to future policy.
Despite these limitations, we believe that virtual water has a role in the achievement of sustainable water, land, and food security, even if there are limitations and difficulties in applying the virtual water concept. As mentioned above, the VWT can be a major resource in the MENA region. Accordingly, vulnerable VWT, for example, low connectivity, can be a risk element for future food security risk management. In particular, the MENA region is strongly dependent on food products from exporting countries, which implies a strong dependency on water resource from exporting countries. Therefore, water shortages or low-food production in exporting countries might cause increasing food prices in the MENA region, but also increasing domestic water use for increasing domestic food production. The primary resources of water, energy, and food are naturally interlinked. The degree of their interlinkages in the MENA region is exceptionally high, thus creating a higher degree of risks and vulnerability. Therefore, understanding these interlinkages and quantifying them in an attempt to better understand this complex system of systems is crucial. This requires the synergistic effort of multiple disciplines, including contributions from various technologies, science, policies, health, communication, and economics, at local-process- and system-level scales. In this study, we believe that the VWT in the MENA region can be the key factor for bridging water and food, and it is important to quantify the influence of trade on water and food management. In addition, this study revealed vulnerable (or robust) expansion (or reduction) and influential traders in the VWT network in the MENA region, based on in-degree and eigenvector centrality indices. If a country in the MENA region has low connectivity but an increased import of virtual water, this country should re-evaluate their vulnerable trade structure and change their trade policy or water–food management.
The import of water in virtual form based on VWT could develop into a major water portfolio that dominates water management in the water-scarce countries of the MENA region. In water-deficit areas, such as the MENA region, the VWT can offer new perspectives for understanding and solving water stress and scarcity. In summary, this study showed that the significant water in comparison to internal water resources could be saved by food trade in the MENA region, and policy makers can benefit by considering both the quantitative impacts of VWT and the structural changes in VWT, such as vulnerable expansion (or reduction) in the MENA region. For example, when a country in the MENA region sets a plan for increasing food security, this country first should identify the amount of water and land savings that can be achieved by food import and consider the trade-off between food security and food import. In addition, the stable trade could be a component for stable food supply in the MENA region; thus this study contributes to the understanding of the dependency on each trade partner for countries in the MENA region and can help with setting the food trade policy in terms of extension (or reduction) of trade partners and increase (or decrease) in volume of trade.
However, this study only focused on food trade and water–land savings; thus the energy part was not considered. The MENA region represents an extreme case globally in terms of water and energy resources; for example, 66 % of the world's known crude oil reserves, but only 1.4 % of the world's fresh water supplies is attributed to the region (Khater, 2001). The increase or decrease in water withdrawal for irrigation is related to the energy used for water extraction such as pumping surface or groundwater. For example, 5 % or more of the total electricity consumption can be attributed to water pumping in Saudi Arabia (Siddiqi and Anadon, 2011). Energy use for food production and water supply could be the main factor in integrated resource management in the MENA region, and the lack of the energy part was a limitation in this study.
In spite of this limitation, the intensity and connectivity of VWT, which were analyzed in this study, can be the major components needed for integrating resource management in the MENA region. Accordingly, VWT is regarded as the important factor in determining food security and water–land management, and it can be a useful interlinking parameter among resources in the WEF nexus approach, which identifies key issues in food, water, and energy securities through the lens of sustainability, seeking to predict and protect against future risks and resource insecurities (Biggs et al., 2015). The core of the nexus concept is that the production, consumption, and distribution of water, energy, and food are inextricably interlinked; thus this study would provide important information to policy makers for evaluating scenarios about integrated resource management toward sustainability in the MENA region.
The international trade data, cultivation area, and production of study crops (barley, wheat, maize, and rice) are available via FAOSTAT (http://www.fao.org/faostat/, last access: 10 January 2019), and water footprint data are available via the Water Footprint Network (https://waterfootprint.org, last access: 10 January 2019). The results data for this study are freely available by contacting the corresponding author.
S-HL and RHM conceived and designed the research; S-HL and S-HY analyzed the data; S-HL contributed analysis tools; and S-HL and RHM wrote the paper.
The authors declare that they have no conflict of interest.
This research was supported by the Basic Science Research Program through the
National Research Foundation of Korea (NRF) funded by the Ministry of
Education (NRF-2018R1A6A3A03010868).
Edited by: Nadia Ursino
Reviewed by: Marc Walther and Trent W. Biggs
Abahussain, A. A., Abdu, A. S., Al-Zubari, W. K., El-Deen, N. A., and Abdul-Raheem, M.: Desertification in the Arab Region: analysis of current status and trends, J. Arid Environ., 51, 521–545, 2002.
Aldaya, M. M., Allan, J. A., and Hoekstra, A. Y.: Strategic importance of green water in international crop trade, Ecol. Econo., 69, 887–894, 2010.
Allan, J.: Fortunately there are substitutes for water otherwise our hydro-political futures would be impossible, in: Priorities for water resources allocation and management, ODA, London, 13–26, 1993.
Antonelli, M., Laio, F., and Tamea, S.: Food security and VWT in the Middle East and North Africa, Int. J. Water Resour. Dev., 31, 326–342, 2015.
Bazilian, M., Rogner, H., Howells, M., Hermann, S., Arent, D., Gielen, D., Steduto, P., Mueller, A., Komor, P., Tol, R. S. J., and, Yumkella, K. K.: Considering the energy, water and food nexus: Towards an integrated modelling approach, Energ. Policy, 39, 7896–7906, 2011.
Berry, M. W. and Browne, M.: Understanding search engines: mathematical modeling and text retrieval, SIAM, 17, 84–88, 2005.
Biewald, A., Rolinski, S., Camoen, H. L., Schmitz, C., and Dietrich, J. P.: Valuing the impact of trade on local blue water, Ecol. Econ., 101, 43–53, 2014.
Biggs, E. M., Bruce, E., Boruff, B., Duncan, J. M., Horsley, J., Pauli, N., McNeill, K., Neef, A., Van Ogtrop, F., Curnow, J., Haworth, B., Duce, S., and Imanari, Y.: Sustainable development and the water–energy–food nexus: A perspective on livelihoods, Environ. Sci. Policy, 54, 389–397, 2015.
Bonacich, P.: Factoring and weighting approaches to status scores and clique identification, J. Math. Sociol., 2, 113–120, 1972.
Bryan, K. and Leise, T.: The $25,000,000,000 eigenvector: The linear algebra behind Google, SIAM Rev., 48, 569–581, 2006.
Chapagain, A. K. and Hoekstra, A. Y.: The blue, green and grey water footprint of rice from production and consumption perspectives, Ecol. Econ., 70, 749–758, 2011.
Chapagain, A. K., Hoekstra, A. Y., and Savenije, H. H. G.: Water saving through international trade of agricultural products, Hydrol. Earth Syst. Sci., 10, 455–468, https://doi.org/10.5194/hess-10-455-2006, 2006.
Dalin, C., Konar, M., Hanasaki, N., Rinaldo, A., and Rodriguez-Iturbe, I.: Evolution of the global VWT network, P. Natl. Acad. Sci. USA, 109, 5989–5994, 2012.
Fader, M., Gerten, D., Thammer, M., Heinke, J., Lotze-Campen, H., Lucht, W., and Cramer, W.: Internal and external green-blue agricultural water footprints of nations, and related water and land savings through trade, Hydrol. Earth Syst. Sci., 15, 1641–1660, https://doi.org/10.5194/hess-15-1641-2011, 2011.
Falkenmark, M.: Land-water linkages: a synopsis. Land and Water integration and river basin management, FAO Land Water Bull., 1, 15–16, 1995.
Falkenmark, M. and Lannerstad, M.: Food security in water-short countries – Coping with carrying capacity overshoot, Re-thinking Water and Food Security: Fourth Botin Foundation Water Workshop, CRC Press/Taylor & Francis, Boca Raton, USA, 3–22, 2010.
FAO – Food and Agriculture Organization of the United Nations: on-line database, available at: http://www.fao.org/nr/water/aquastat/main/index.stm (last access: 10 January 2019), 2014.
Freeman, L. C.: Centrality in social network: conceptual clarification, Soc. Networks, 1, 215–239, 1979.
Gleick, P. H.: The world's water 2000–2001, The biennial report on freshwater resources, Island Press, Washington, D.C., USA, 19–38, 2000.
Hanjra, M. and Qureshi, M.: Global water crisis and future food security in an era of climate change, Food Policy, 35, 365–377, 2010.
Hennessy, K. B., Fitzharris, B., Bates, B. C., Harvey, N., Howden, M., Hughes, L., Salinger, J., and Warrick, R.: Australia and New Zealand: climate change 2007: impacts, adaptation and vulnerability: contribution of Working Group II to the Fourth Assessment Report of the Intergovernmental Panel on Climate Change, Cambridge University Press, Cambridge, UK, 2007.
Hoekstra, A. Y.: VWT: Proceedings of the international expert meeting on VWT, Value of Water Research Series No. 12, UNESCO-IHE, Delft, the Netherlands, 2003.
Hoekstra, A. Y. and Chapagain, A. K.: Globalisation of Water: Sharing the Planet's Freshwater Resources, Wiley-Blackwell Publishing, New Jersey, USA, 2008.
Hoekstra, A. Y. and Hung, P. Q.: Globalisation of water resources: international virtual water flows in relation to crop trade, Global Environ. Change, 15, 45–56, 2005.
Immerzeel, W., Droogers, P., Terink, W., Hoogeveen, J., Hellegers, P., Bierkens, M., and van Beek, R.: Middle-East and Northern Africa water outlook, World Bank Study, Future Water Report, Future Water, Wageningen, the Netherlands, 1–136, 2011.
Khater, A. R.: Intensive groundwater use in the Middle East and North Africa, Intensive use of groundwater: challenges and opportunities, CRC Press, Boca Raton, USA, 355–386, 2001.
Konar, M., Dalin, C., Hanasaki, N., Rinaldo, A., and Rodriguez-Iturbe, I.: Temporal dynamics of blue and green VWT networks, Water Resour. Res., 48, W07509, https://doi.org/10.1029/2012WR011959, 2012.
Lee, S.-H., Mohtar, R. H., Choi, J.-Y., and Yoo, S.-H.: Analysis of the characteristics of the global virtual water trade network using degree and eigenvector centrality, with a focus on food and feed crops, Hydrol. Earth Syst. Sci., 20, 4223–4235, https://doi.org/10.5194/hess-20-4223-2016, 2016.
Lee, S. H., Taniguchi, M., Mohtar, R., Choi, J. Y., and Yoo, S. H.: An Analysis of the Water-Energy-Food-Land Requirements and CO2 Emissions for Food Security of Rice in Japan, Sustainability, 10, 3354, https://doi.org/10.3390/su10093354, 2018.
Lezzaik, K., Milewski, A., and Mullen, J.: The groundwater risk index: Development and application in the Middle East and North Africa region, Sci. Total Environ., 628, 1149–1164, 2018.
Mekonnen, M. M. and Hoekstra, A. Y.: The green, blue and grey water footprint of crops and derived crop products, Value of Water Research Series No. 47, UNESCO-IHE, Delft, the Netherlands, 2010.
Milly, P. C., Dunne, K. A., and Vecchia, A. V.: Global pattern of trends in streamflow and water availability in a changing climate, Nature, 438, 347–350, 2005.
Mohtar, R. H. and Daher, B.: A platform for trade-off analysis and resource allocation: the water-energy-food nexus tool and its application to Qatar's food security [part of the `Valuing Vital Resources in the Gulf' series], Chatham House, London, UK, 2014.
Molden, D.: Water for food, water for life, Earthscan, London, and International Water Management Institute, Colombo, 2007.
Newman, M. E.: Mathematics of networks, The new Palgrave dictionary of economics, Palgrave Macmillan, London, UK, 1–8, 2016.
Novo, P., Garrido, A., and Varela-Ortega, C.: Are virtual water “flows” in Spanish grain trade consistent with relative water scarcity?, Ecol. Econ., 68, 1454–1464, 2009.
Oki, T. and Kanae, S.: VWT and water resource, Water Sci. Technol., 49, 203–209, 2004.
Porter, J. R., Xie, L., Challinor, A. J., Cochrane, K., Howden, S. M., Iqbal, M. M., Lobell, D. B., and Travasso, M. I.: Food Security and Food Production Systems, in: Contribution of Working Group II to the Fifth Assessment Report of the IPCC, Cambridge University Press, Cambridge, UK, 485–533, 2014.
Rastoin, J. L. and Cheriet, F.: Food security in the Mediterranean: a major geostrategic issue, Les Notes d'Ipemed, Etudes & Analyses, Ipemed, Paris, 2010.
Rasul, G.: Food, water, and energy security in South Asia: a nexus perspective from the Hindu Kush Himalayan region, Environ. Sci. Policy, 39, 35–48, 2014.
Ruhnau, B.: Eigenvector-centrality: a node-centrality?, Soc. Networks, 22, 357–365, 2000.
Saladini, F., Betti, G., Ferragina, E., Bouraoui, F., Cupertino, S., Canitano, G., Gigliotti, M., Autino, A., Pulselli, F. M., Riccaboni, A., Bidoglio, G., and Bastianoni, S.: Linking the water-energy-food nexus and sustainable development indicators for the Mediterranean region, Ecol. Indicat., 91, 689–697, 2018.
Schyns, J. F. and Hoekstra, A. Y.: The Added Value of Water Footprint Assessment for National Water Policy: A Case Study for Morocco, Plos ONE, 9, e99705, https://doi.org/10.1371/journal.pone.0099705, 2014.
Siddiqi, A. and Anadon, L. D.: The water–energy nexus in Middle East and North Africa, Energ. Policy, 39, 4529–4540, 2011.
Tolba, M. K. and Saab, N. W.: Arab environment: Climate change, Arab Forum for Environment and Development, Beirut, 2009.
Wichelns, D.: Virtual water: A helpful perspective, but not a sufficient policy criterion, Water Resour. Manage., 24, 2203–2219, 2010.
World Bank: Water in the MENA region: Management Perspectives and Innovations, edited by: Jagannathan, N. V., Mohamed, A. S., and Kremer, A., World Bank, Washington, D.C., 2009.
Yang, H., Wang, L., Abbaspour, K. C., and Zehnder, A. J. B.: Virtual water trade: an assessment of water use efficiency in the international food trade, Hydrol. Earth Syst. Sci., 10, 443–454, https://doi.org/10.5194/hess-10-443-2006, 2006.