the Creative Commons Attribution 4.0 License.
the Creative Commons Attribution 4.0 License.
 | 20 Dec 2019
Evaluation of MODIS and VIIRS cloud-gap-filled snow-cover products for production of an Earth science data record
Dorothy K. Hall
George A. Riggs
Nicolo E. DiGirolamo
Miguel O. Román
MODerate resolution Imaging Spectroradiometer (MODIS) cryosphere products have been available since 2000 – following the 1999 launch of the Terra MODIS and the 2002 launch of the Aqua MODIS – and include global snow-cover extent (SCE) (swath, daily, and 8 d composites) at 500 m and ∼5 km spatial resolutions. These products are used extensively in hydrological modeling and climate studies. Reprocessing of the complete snow-cover data record, from Collection 5 (C5) to Collection 6 (C6) and Collection 6.1 (C6.1), has provided improvements in the MODIS product suite. Suomi National Polar-orbiting Partnership (S-NPP) Visible Infrared Imaging Radiometer Suite (VIIRS) Collection 1 (C1) snow-cover products at a 375 m spatial resolution have been available since 2011 and are currently being reprocessed for Collection 2 (C2). Both the MODIS C6.1 and the VIIRS C2 products will be available for download from the National Snow and Ice Data Center beginning in early 2020 with the complete time series available in 2020. To address the need for a cloud-reduced or cloud-free daily SCE product for both MODIS and VIIRS, a daily cloud-gap-filled (CGF) snow-cover algorithm was developed for MODIS C6.1 and VIIRS C2 processing. MOD10A1F (Terra) and MYD10A1F (Aqua) are daily, 500 m resolution CGF SCE map products from MODIS. VNP10A1F is the daily, 375 m resolution CGF SCE map product from VIIRS. These CGF products include quality-assurance data such as cloud-persistence statistics showing the age of the observation in each pixel. The objective of this paper is to introduce the new MODIS and VIIRS standard CGF daily SCE products and to provide a preliminary evaluation of uncertainties in the gap-filling methodology so that the products can be used as the basis for a moderate-resolution Earth science data record (ESDR) of SCE. Time series of the MODIS and VIIRS CGF products have been developed and evaluated at selected study sites in the US and southern Canada. Observed differences, although small, are largely attributed to cloud masking and differences in the time of day of image acquisition. A nearly 3-month time-series comparison of Terra MODIS and S-NPP VIIRS CGF snow-cover maps for a large study area covering all or parts of 11 states in the western US and part of southwestern Canada reveals excellent correspondence between the Terra MODIS and S-NPP VIIRS products, with a mean difference of 11 070 km2, which is ∼0.45 % of the study area. According to our preliminary validation of the Terra and Aqua MODIS CGF SCE products in the western US study area, we found higher accuracy of the Terra product compared with the Aqua product. The MODIS CGF SCE data record beginning in 2000 has been extended into the VIIRS era, which should last at least through the early 2030s.
- Article
(5936 KB) - Full-text XML
- BibTeX
- EndNote


Regular snow-cover mapping of the Northern Hemisphere from space began in 1966 when the National Oceanic and Atmospheric Administration (NOAA) started producing weekly snow maps to improve weather forecasting (Matson and Wiesnet, 1981). A 53-year climate-data record (CDR) of Northern Hemisphere snow-cover extent (SCE), based on NOAA's snow maps, is available at the Rutgers University Global Snow Lab (Robinson et al., 1993; Estilow et al., 2015) at a resolution of 190 km2. Using the Rutgers CDR, researchers have shown that SCE has been declining and melt has been occurring earlier in the Northern Hemisphere (e.g., Déry and Brown, 2007). This shortening of the snow season has many implications; for example, in the western US (Mote et al., 2005; Stewart, 2009; Hall et al., 2015), earlier snowmelt contributes to a longer fire season (Westerling et al., 2006; O'Leary et al., 2018) and other environmental and societal problems. However, the coarse resolution of the Rutgers CDR is not suitable for regional and basin-scale studies.
Meltwater from mountain snowpacks provides hydropower and water resources. Accurate snow measurement is needed as input to hydrological models that predict the quantity and timing of snowmelt during spring runoff. SCE can be input to models to estimate snow-water equivalent (SWE) which is the quantity of most interest to hydrologists and water management agencies. Accurate predictions save money and water because reservoir management improves with knowledge of SWE.
Moderate-resolution SCE maps are produced daily from multiple satellite sensors such as the MODerate resolution Imaging Spectroradiometer (MODIS) on both the Terra (1999 launch) and Aqua (2002 launch) satellites and from the Visible Infrared Imaging Radiometer Suite (VIIRS) on the Suomi National Polar Partnership (S-NPP) and the Joint Polar Satellite System-1 (JPSS-1) satellites, launched in 2011 and 2017, respectively. Snow maps from MODIS, in particular, are used extensively by modelers and hydrologists to study regional- and basin-scale SCE and to develop snow-cover depletion curves for hydrological applications. Algorithms utilizing data from the VIIRS and MODIS sensors provide global snow-cover maps with spatial resolutions ranging from 375 to 500 m under clear skies. Instruments on the Landsat series of satellites, for which the record began in 1972, and other higher-resolution sensors, such as from the more-recent Sentinel series, provide even higher spatial resolution data from which snow maps can be developed, although these data are at a lower temporal resolution.
Cloud cover is the most important factor affecting the ability to accurately map SCE using visible–near infrared (VNIR) and shortwave infrared (SWIR) sensors. Clouds frequently create gaps in snow-cover maps that are generated using data from VNIR and SWIR sensors. Cloud-gap filling can be used to mitigate the cloud issue using VNIR and SWIR sensors. Additionally, methods to combine passive-microwave snow-cover maps with VNIR maps to eliminate clouds have been developed (e.g., see Foster et al., 2011) but there are substantial limitations to the resulting products even though the passive-microwave sensors can provide images through cloud cover. Terra and Aqua MODIS and S-NPP VIIRS cloud-gap-filled (CGF) SCE map products have been developed to address the issues caused by gaps in data from cloud cover when using VNIR and SWIR sensors. These new standard products have not previously been available globally.
The objective of this paper is to introduce the new MODIS and VIIRS standard CGF daily SCE products and to provide preliminary evaluation of uncertainties in the gap-filling methodology so the products can be used as the basis for a moderate-resolution Earth science data record (ESDR) of SCE. A thorough analysis of the uncertainties of these products globally will be possible only after the entire time series of both MODIS and VIIRS have been processed and archived which is likely to occur sometime in 2020.
2.1 Terra and Aqua MODIS
The MODIS instruments have been providing daily snow maps at a variety of temporal and spatial resolutions since 24 February 2000, following the 18 December 1999 launch of the Terra spacecraft, using a subset of the 36 channels. A second MODIS was launched on 4 May 2002 on the Aqua spacecraft, and the data record began on 4 July 2002. The MODIS sensors allowed for the development of a large suite of land, atmosphere, and ocean products (https://modis.gsfc.nasa.gov, last access: 16 December 2019), including maps of global snow cover. The prefix “MOD” refers to a Terra MODIS algorithm or product and “MYD” refers to an Aqua MODIS algorithm or product. When the discussion in this paper refers to both the Terra and Aqua products we will use the “M*D” nomenclature. Information on the full MODIS standard cryosphere product suite is available elsewhere (https://modis-snow-ice.gsfc.nasa.gov/, last access: 16 December 2019).
Since the launches of the Terra and Aqua spacecraft, the entire suite of MODIS Land data products (https://modis-land.gsfc.nasa.gov/, last access: 16 December 2019) has been reprocessed several times. In recent years, reprocessing from Collection 5 (C5) to Collection 6 (C6) and Collection 6.1 (C6.1) has been accomplished to provide improvements in the MODIS snow-cover standard data products to the user community (Riggs et al., 2017a, 2018).
A great deal of validation has been conducted on the MODIS snow-cover products through the C5 era (e.g., Klein and Barnett, 2003; Parajka and Blöschl, 2006; Hall and Riggs, 2007; Frei and Lee, 2010; Arsenault et al., 2014; Parajka et al., 2012; Chelamallu et al., 2013; Dietz et al., 2013), including validation with higher-resolution snow maps derived from satellite imagery, such as Landsat Thematic Mapper, Enhanced Thematic Mapper Plus, and Operational Land Imager (TM/ETM+ and OLI) (see , e.g., Huang et al., 2011; Crawford, 2015; Coll and Li, 2018). Although use of higher-resolution data is valuable for comparison and validation purposes, use of meteorological station data (e.g., Brubaker et al., 2005) is the only true validation of snow-cover products when adequate station data are available. Comparing the extent of snow cover derived from MODIS with snow cover from other satellite products, although extremely useful, is not true validation because all derived snow-cover products have uncertainties.
A new feature of the MODIS C6 and C6.1 product suites provides the snow decision on each map as a normalized-difference snow index (NDSI) value instead of fractional-snow cover (FSC) (Riggs et al., 2017a, 2018). This has the important advantage of allowing a user to more accurately determine FSC in their particular study area by applying a specially tuned algorithm to derive FSC from the NDSI. The C5 FSC algorithms (Salomonson and Appel, 2004, 2006) remain useful and can easily be applied to the MODIS C6 and C6.1 and VIIRS C2 NDSI data to derive an estimate of FSC globally.
2.2 S-NPP VIIRS
There are 22 channels on the S-NPP VIIRS instrument. Although the key VIIRS snow-mapping channels, I1 (0.600–0.680 µm) and I3 (1.580–1.640 µm), are also available on MODIS (with slight differences in the wavelength range), some of the bands that are used in cloud mapping which are available on the MODIS sensors, are not available on the VIIRS. As a result there are differences in the MODIS and VIIRS cloud masks that affect the SCE standard products. Additionally, the Terra MODIS and the S-NPP VIIRS data are acquired at different times of the day, allowing for movement of clouds and for some snow-cover changes. Furthermore, the spatial resolution of the MODIS SCE products is 500 m, whereas the resolution of the VIIRS SCE products is 375 m.
S-NPP VIIRS C2 SCE products (https://doi.org/10.5067/VIIRS/VNP10.001) are designed to correspond to the MODIS C6.1 SCE products (Riggs et al., 2017a, b). There have been many revisions made to the MODIS C6 and C6.1 algorithms that improved the snow-cover detection accuracy and quality assurance (QA) in the data products. Although there are important differences between the MODIS and VIIRS instruments, some of which are described in the previous paragraph, the snow-detection algorithms have been designed to be as similar as possible so that the ∼20 year MODIS ESDR of global SCE can be extended into the future with the S-NPP and Joint Polar Satellite System (JPSS)-1 VIIRS snow products and with products from future JPSS platforms.
2.3 Methods to reduce or eliminate cloud cover in MODIS-derived snow-cover maps
The objective of the NASA standard MODIS and VIIRS CGF snow-cover algorithms is to generate snow maps daily in the normal operational processing stream of MODIS and VIIRS snow products. As part of the early MODIS snow-product suite, 8 d maximum snow-cover maps (M*D10A2) were designed to provide greatly reduced cloud cover. However these maps are available only once every 8 d, the maps frequently retain some cloud cover, and it is difficult to determine on which days during the 8 d period snow was or was not observed; furthermore, only maximum observed snow cover is provided for any given 8 d period. In spite of the limitations, the 8 d maximum snow maps have been useful in many studies (e.g., O'Leary et al., 2018; Hammond et al., 2018). The cloud-gap-filling cloud-clearing method that uses current day and/or previous day(s) of MODIS daily snow-cover products to fill gaps created by cloud cover is far superior to the 8 d maximum method of cloud clearing.
Many effective methods have been developed to reduce or eliminate cloud cover in the MODIS standard snow-cover products as well as other satellite-derived snow-cover products. These methods include temporal and spatial filtering, and use of data from two or more satellites. Fusion of ground and satellite measurements is another method to mitigate the influence of clouds. In the following paragraphs we provide a brief overview of selected works that address the cloud-clearing issue using MODIS SCE products.
Forward, backward, and multi-temporal forward/backward interpolation gap-filling methods to reduce cloud cover have been used successfully by many researchers with the MODIS standard snow products and other satellite data (see, e.g., Parajka and Blöschl, 2008; Gafurov et al., 2016; Malnes et al., 2016). A spatial-filtering method that uses the relative position of a cloud-obscured pixel to the regional snow-line elevation (SNOWL) was developed by Parajka et al. (2010) using Terra MODIS data to create “cloud-free” snow maps that produced robust snow-cover maps even in situations of extensive cloud cover.
A common method to reduce cloud cover on a daily snow map is to combine or fuse results from the daily Terra (MOD10A1) and Aqua (MYD10A1) snow maps (see, e.g., Gao et al., 2010a, b, 2011; Li et al., 2017; Paudel and Anderson, 2011; Paull et al., 2015; Dong and Menzel, 2016; Yu et al., 2016; Xu et al., 2017). These methods take advantage of the fact that the Terra and Aqua satellite overpasses occur at different times of the day and, as clouds move, oftentimes more snow cover or non-snow-covered land cover can be imaged and mapped using data from both satellites, compared with using the Terra or Aqua MODIS data alone. Although this method of cloud clearing is useful, it is of limited utility for large areas because changes in cloud cover are typically small between Terra's 10:30 LT (local time) Equator crossing and Aqua's 01:30 LT Equator crossing.
Additionally, reductions in cloud cover that are achieved by combining Terra and Aqua daily snow-cover data are highly variable and dependent on many factors such as location, time of year, daily weather and cloud conditions, an so on, and have been reported to vary. A factor that impacts the quality of both the Aqua MODIS snow-cover and the cloud-cover products, used to mask clouds, is that many of the detectors in the critical 1.6 µm band used in both algorithms is non-functional on the Aqua MODIS. As an example, for the western US study area shown in Fig. 1, for 14 and 19 March 2012, using a snow-cover map that combined Terra and Aqua snow-cover products, the MOD10A1 snow product showed 71.7 % clouds whereas the combined Terra and Aqua products showed 67.0 % for 14 March 2012. Combining the MOD and MYD snow maps can definitely reduce cloud cover, but there are issues with the Aqua snow maps (see below) and reliance on the continued availability of two nearly-identical sensors is unrealistic for development of an ESDR because satellites do not last indefinitely.

Figure 1Study area covering all or parts of 11 states in the western US and part of southern Canada. This study area is 2 487 610 km2 in area. The base map was obtained from Interactive Data Language (IDL) software that uses Natural Earth raster + vector map data, which are in the public domain.
Fusion of ground- and satellite-based snow observations is an effective approach to map snow-cover beneath clouds. This method of cloud clearing is used successfully by NOAA to develop the Interactive Multisensor Snow and Ice Mapping System (IMS) SCE products (see Helfrich et al., 2007, 2012).
Hybrid methods to reduce cloud cover are also effective. For example, Gafurov and Bárdossy (2009) developed a cloud-clearing method consisting of six sequential steps; the method begins by using Terra and Aqua snow-cover maps, ground observations, spatial analysis, and finally snow climatology to clear clouds and generate a cloud-free daily snow-cover map with high accuracy. Other researchers have developed CGF techniques that combine Terra and Aqua, time interpolation, spatial interpolation, and probability estimation (e.g., López-Burgos et al., 2013) to create “cloud-free” SCE maps. Deng et al. (2015) combined MOD, MYD, and SNOWL SCE and AMSR2 SWE data and temporal filtering to create daily “cloud-free” snow-cover maps of China. Crowdsourcing by cross-country skiers combined with MODIS snow-cover products has also been used to create daily CGF products (Kadlec and Ames, 2017). Many other methods to reduce cloud cover have also been successful (see, e.g., Tong et al., 2009a, b; Tang et al., 2013, 2017; Dariane et al., 2017; Xu et al., 2017; Coll and Li, 2018).
The CGF method of Hall et al. (2010) and Riggs et al. (2018) is the method that was selected for the NASA MODIS standard SCE products because of its ease-of-use, effectiveness, and because it relies on data from only one sensor at a time to produce results.
2.4 Differences between Terra and Aqua MODIS snow-cover maps
Since the MODIS C6 reprocessing, the quantitative image restoration (QIR) algorithm (Gladkova et al., 2012) has been used in the Aqua MODIS snow algorithm to restore lost data from non-functional band 6 detectors so that the same snow-cover mapping algorithm can be used in both Terra and Aqua. Band 6 (with a center wavelength of ∼1.6 µm), which is a key band for snow-cover mapping, experienced degradation issues even before the launch of the Aqua satellite in 2002 and many of its detectors are non-functioning. Therefore, for C5 and earlier collections, Aqua MODIS band 7 (∼2.1 µm) was used instead of band 6 in the snow-mapping algorithm (Riggs et al., 2006). An additional complication is that the cloud-masking algorithm for Terra uses MODIS band 6 but the cloud-masking algorithm for Aqua was adapted to use band 7 instead of band 6 because of the non-functioning detectors in Aqua band 6. This resulted in the Terra and Aqua algorithms often providing different snow-mapping results. In C6 and C6.1, in which the QIR is employed to map snow in both the Terra and Aqua SCE algorithms, there are still more cloud/snow discrimination errors in the Aqua cloud-mask algorithm compared with the Terra algorithm because the QIR is not used in the Aqua cloud mask. This results in more snow commission errors in MYD10L2 (Aqua) snow maps compared with MOD10L2 (Terra) snow maps.
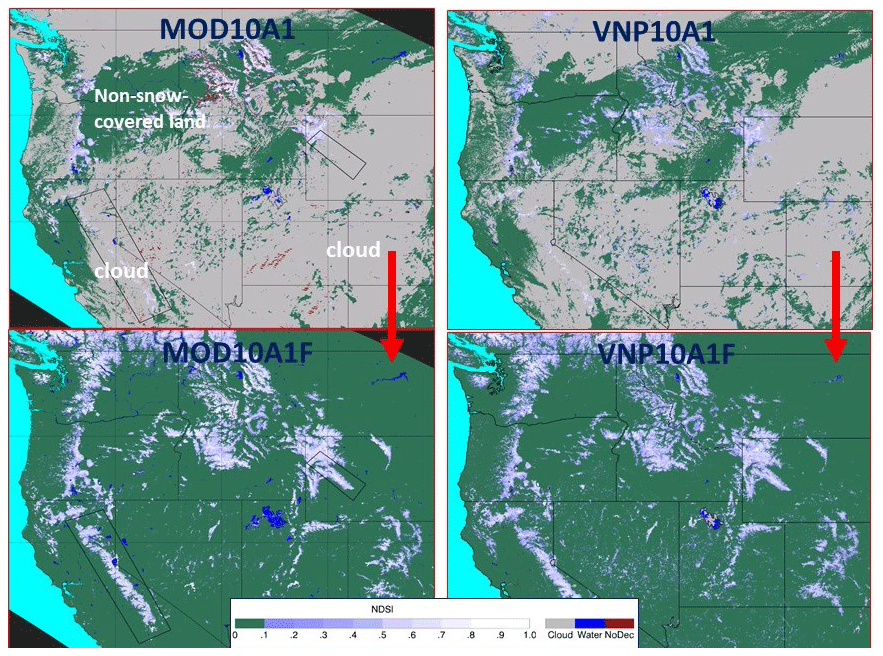
Figure 2Examples of MODIS and VIIRS standard and cloud-gap-filled (CGF) snow maps on 14 April 2012 for a study area in the western US/southwestern Canada (see Fig. 1). Top left panel: MODIS MOD10A1 C6.1 snow map showing extensive cloud cover on 14 April 2012. Top right panel: VIIRS VNP10A1 C1 snow map also showing extensive cloud cover on 14 April 2012. Bottom left panel: MOD10A1F C6.1 CGF map corresponding to the MOD10A1 snow map in the top left panel, also for 14 April 2012. Bottom right panel: VNP10A1F CGF map corresponding to the VNP10A1 snow map in the top right panel, also for 14 April 2012. In all of the snow maps, non-snow-covered land is shown in green. Regions of interest containing the Sierra Nevada Mountains in California and Nevada (109 575 km2), and the Wind River Range in Wyoming (22 171 km2), are outlined using dark blue on the MODIS snow maps. The following MODIS tiles were used to develop the MODIS composites: h08v04, h09v04, h10v04, h08v05, h09v05, and h10v05. Each VIIRS swath that included coverage of this study area was composited to create a daily map; the daily maps were then used to create the VNP10A1F snow map for 14 April 2012. The base map was obtained from Interactive Data Language (IDL) software that uses Natural Earth raster + vector map data, which are in the public domain.
For the present work, we focus on a large (2 487 610 km2) study area covering all or parts of 11 states in the western US and part of southern Canada (Fig. 1). Examples of the daily Terra MODIS standard and CGF and the daily S-NPP VIIRS standard and CGF map products for this study area may be seen in Fig. 2. There are some differences in cloud cover between the Terra MODIS (top left panel) and S-NPP VIIRS (top right panel) standard snow maps. The MOD10A1 snow map is 65.8 % (1 637 066 km2) cloud-covered vs. 60.6 % (1 506 924 km2) for the VNP10A1 snow map. The difference in cloud cover is largely due to differences in the cloud masking of MODIS and VIIRS SCE maps, as described earlier. However, difference in the locations of clouds is also a contributing factor because the Terra MODIS and S-NPP VIIRS images were acquired at different times on the same day, and clouds move. There may also be changes in the location of snow cover within a day (e.g., due to melting of shallow snow). Even given these small differences in the standard products that include clouds, the CGF snow maps shown in the bottom row of Fig. 2 are very similar, with 15.2 % (378 634 km2) snow cover on the MOD10A1F snow map and 16.6 % (413 794 km2) snow cover on the VNP10A1F snow map. The VIIRS map shows fewer clouds and more snow than does the Terra MODIS map in this example.
The accuracy of a snow observation is dependent on many factors. In this work, we focus on the uncertainties of the gap-filling method; we do not address the inherent accuracy of the snow maps because that has been documented elsewhere by many previous studies, at least for the MODIS SCE products. Uncertainties in the CGF maps that relate to the gap-filling methodology depend in part on the age of the observation, i.e., the number of days since last cloud-free observation. To address this, information on cloud persistence for each pixel is included with each product. Cloud masking of the swath product “M*D10_L2” for MODIS and “VNP10” for VIIRS represents an additional uncertainty in the both products and contributes to differences between the snow-mapping results. The MODIS and VIIRS snow-cover swath products are gridded and mapped into the daily tiled products that are input to the M*D10A1F and VNP10A1F CGF algorithms (Riggs et al., 2017a).
Inputs to the MODIS CGF algorithms are the current day M*D10A1 and the previous day M*D10A1F products. The CGF daily snow map is created by replacing cloud observations in the current day M*D10A1 with the most recent previous cloud-free observation from the M*D10A1F (Hall et al., 2010; Riggs et al., 2018). The algorithm tracks the number of days since the last cloud-free observation by incrementing the count of consecutive days of cloud cover for a pixel. This is stored in the cloud-persistence count (CPC) data array. If the current day observation is “cloud” then the cloud count is one and is added to the CPC count from the previous day's M*D10A1F and written to the current day's M*D10A1F algorithm. If the current day observation is “not cloud”, the CPC is reset to zero in the current day's M*D10A1F CPC. If the CPC is zero, it means that the snow-cover observation is from the current day. If the CPC for the current day is greater than or equal to one, it represents the count of days since the last “non-cloud” observation. On the day that the CGF mapping algorithm is initialized for a time series, the CGF snow-cover map is identical to the MODIS daily snow-cover map (M*D10A1) and the CPC map will show zeros for non-cloud observations and ones for cloud observations (Riggs et al., 2018). As the time series progresses, a nearly-cloud-free snow map is produced on about Day 8 in the example shown in Fig. 3 when clouds cover only 8.0 % of the snow map. The same method is used to develop the VNP10A1F CGF snow-map products. For the same initialization of the time series, beginning on 4 February 2012, a nearly-cloud-free snow map is produced on Day 5 when clouds cover only 6.7 % of the map (Fig. 3).

Figure 3Percent cloud cover in a Terra MODIS (MOD10A1F) and an S-NPP VIIRS (VNP10A1F) time series of snow-cover maps for the western US study area (see location in Fig. 1). Note that the percentage of cloud cover decreases dramatically in the first few days following the 4 February 2012 initiation of the CGF time series, denoted here as “Day 1”.
A CPC data array is associated with each CGF snow map so that a user may determine the age of the snow observation of each pixel (Fig. 4). For each pixel, the uncertainty of the observation increases with time since the last clear view. To help a user assess the accuracy of an observation, the count of consecutive days of cloud cover is incremented and stored as QA in the CPC map that specifies how far back in time the observation was acquired. A user can decide how far back in time they would like to use an observation, and can easily develop a unique CGF map, utilizing the CPC information that is most appropriate for their application.
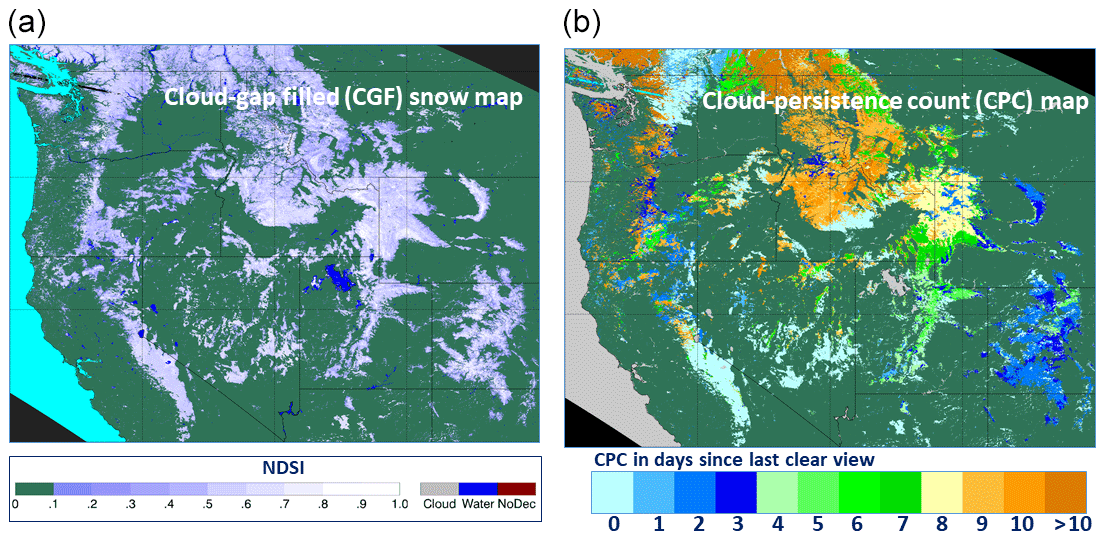
Figure 4(a) Terra MODIS cloud-gap-filled (CGF) MOD10A1F snow map for 19 March 2012. (b) Cloud-persistence count (CPC) map from the quality assurance (QA) data set for the CGF snow map in (a). For 19 March 2012, when a pixel has a CPC of zero, it means that the NDSI value for that pixel was acquired on 19 March 2012. When a pixel has a CPC of one, it means that the NDSI pixel value is 1 d old, and was therefore acquired on 18 March, and so on. The base map was obtained from Interactive Data Language (IDL) software that uses Natural Earth raster + vector map data, which are in the public domain.
For the snow-cover product suite, the time series are started with the first day of acquisition for each mission, then reset on 1 October of each year. The first days of the gap-filling time series for the Terra and Aqua MODIS CGF production are 24 February 2000 and 4 July 2002, respectively. The first day of gap filling for the S-NPP VIIRS CGF production is 21 November 2011. With those exceptions, gap-filling sequences begin on the first day of each water year.
The MODIS data-acquisition record is nearly continuous from the beginning of the missions; however, there are brief periods – minutes to hours – when either the Terra (https://modaps.modaps.eosdis.nasa.gov/services/production/outages_terra.html, last access: 16 December 2019) or Aqua (https://modaps.modaps.eosdis.nasa.gov/services/production/outages_aqua.html, last access: 16 December 2019) MODIS data were not acquired or data were “lost”. In general, these outages have a minimal effect on the snow-cover data record. There have also been some VIIRS data outages which are also tracked (https://modaps.modaps.eosdis.nasa.gov/services/production/outages_npp.html, last access: 16 December 2019).
In addition, there are a few extended data outages of 1–5 d that have occurred in the MODIS Terra record. Extended outages may occur in the future. The gap-filling algorithms for both MODIS and VIIRS are designed to continue processing over daily or multi-day gaps in the data record. A missing day of MODIS or VIIRS snow-cover input is processed as if it were completely cloud-obscured; thus, the previous day's CGF result is retained and the CPC is incremented by one. Orbit gaps and missing swath or scan line data within a tile are processed as a cloud observation with the previous good observation retained and the CPC is incremented for the current day. This provides a continuous snow-cover data record for the CGF product; see Riggs et al. (2018) for further details.
The MODIS and VIIRS CGF SCE products will be available to download in early 2020 from the National Snow and Ice Data Center (NSIDC) in Boulder, Colorado, USA. To provide some early evaluation of the products to the user community, we produced CGF Terra and Aqua MODIS time series of selected areas in the western US/southwestern Canada study area and of a study area in the northeastern US/southeastern Canada. We also look at regions of interest (ROI) within our primary western US/southwestern Canada study area shown in Fig. 1. We selected the year 2012 for the time series because both MODIS and VIIRS data were available in that year. Comprehensive global validation studies will not be possible until the data sets are released through NSIDC and the entire MODIS and VIIRS records have been processed. This will take several months following initial release of the data; the full data records should be available in late 2020.
There are many ways to evaluate the uncertainties in the CGF snow-cover maps but only one way to perform absolute validation of the maps. The CGF maps can be compared with other daily snow-cover map products (e.g., NOAA IMS 4 km snow maps; Helfrich et al., 2007, 2012; Chen et al., 2012), with snow maps developed from higher-resolution maps such as Landsat and Sentinel, and with reflectance images derived from satellite data. This allows for the evaluation of the products but does not constitute absolute validation.
In the US, the SCE products can be validated using NOAA snow depth data (https://gis.ncdc.noaa.gov/maps/ncei/summaries/daily, last access: 16 December 2019) as has been done for MOD10A1 (Collections 1–5) by many authors (e.g., Brubaker et al., 2005; Chen et al., 2012). However, the density of meteorological stations is highly variable in the US and the network of meteorological station data over the globe is even more variable, especially in higher latitudes.
4.1 Validation using NOAA snow depth data
Snow depths from NOAA (Fig. 5) can be overlain on a MODIS CGF snow map as shown in the example in Fig. 6. Based on NOAA snow-depth data indicating the presence of snow cover, on 16 April 2012 the Terra MODIS CGF map appears to map the location of snow cover very well in an ROI in Utah that includes part of the Wasatch Range. A NASA WorldView true-color (corrected reflectance) Terra MODIS image is shown alongside a Terra MODIS CGF snow map with NOAA snow depths superimposed on an ROI in south-central Utah (Fig. 6a, b, c). There are no other NOAA stations that report snow cover except those shown in Fig. 6b. The dark blue and light blue circles indicate snow depths of ≥254.0 mm, and the white circle indicates a snow depth of 0.1–25.4 mm, revealing that the MOD10A1F snow map accurately shows the location of snow cover in this ROI.
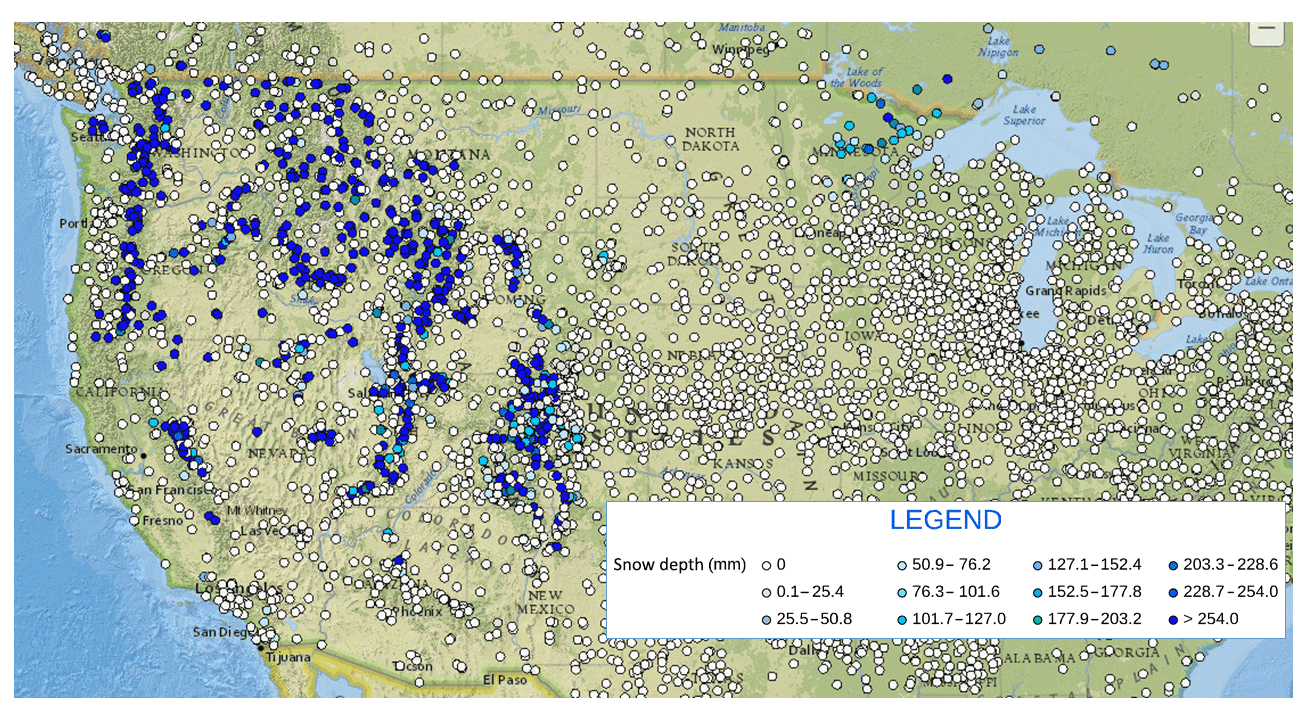
Figure 5Snow depth (mm) from 16 April 2012 for part of the continental US. Source: NOAA National Climate Data Center (https://gis.ncdc.noaa.gov/maps/ncei/summaries/daily, last access: 16 December 2019). The map was developed by the US Government and is in the public domain.
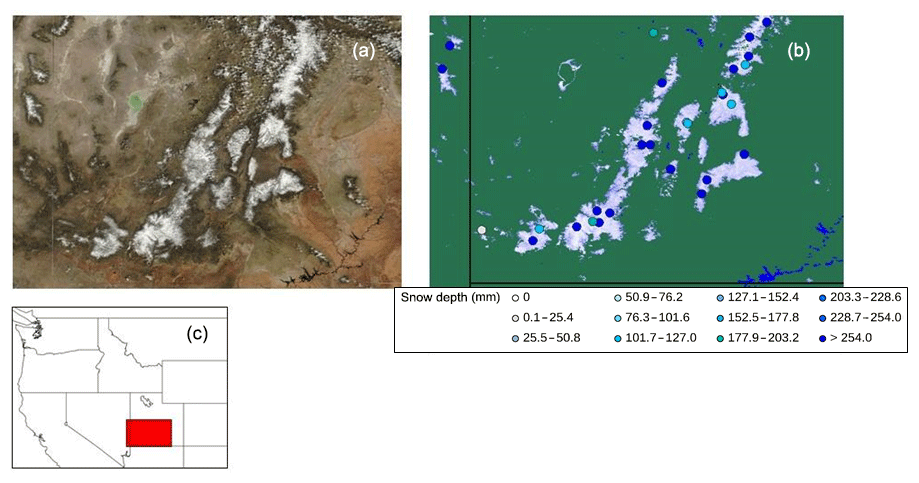
Figure 6(a) NASA WorldView true-color (corrected reflectance) Terra MODIS image of a region on interest (ROI) in central Utah, USA, including the southern part of the Wasatch Range, acquired on 16 April 2012. (b) Snow depths from NOAA are mapped onto the Terra MODIS CGF map, MOD10A1F, for 16 April 2012 for the same area shown in (a). (c) Location map that shows a red box which delineates the ROI. The base map in (b) and the location map in (c) were obtained from Interactive Data Language (IDL) software package that uses Natural Earth raster + vector map data, which are in the public domain.
4.2 Compare with higher-resolution images and derived snow maps
In the absence of meteorological station data or in addition to it, a good way to evaluate the accuracy of the MODIS CGF SCE maps is to compare them with snow maps derived from higher-resolution sensors, such as the Sentinel-2A (S-2A) Multispectral Instrument (MSI) 30 m resolution images derived from the Harmonized Landsat Sentinel-2 (HLS) data set [https://hls.gsfc.nasa.gov/, last access: 16 December 2019] (Claverie et al., 2018). Figure 7a and b show a comparison of an S-2A image and a Terra MODIS CGF snow map from 2 December 2016.

Figure 7(a) Sentinel-2A “true-color” image showing snow cover in shades of white and gray, acquired on 2 December 2016 for a region of interest (ROI) in the state of Montana, USA. Black indicates non-snow-covered ground. (b) The MOD10A1F cloud-gap-filled (CGF) snow map of the same area and on the same date as is shown in (a). In the CGF snow map in (b), snow is depicted in various shades of white and purple, corresponding to normalized-difference snow index (NDSI) values. Pixels shown in red represent “no decision” by the NDSI algorithm. (c) The red box corresponds to the location of the images in the ROI in Montana, shown in (a) and (b). The location map in (c) was obtained from Interactive Data Language (IDL) software that uses Natural Earth raster + vector map data, which are in the public domain.
Snow cover on 2 December 2016 may be seen on the Sentinel-2A (S-2A) image in shades of white and gray from this RGB composite image – bands 4, 3, and 2 (red – 664.6 nm, green – 559.8 nm, and blue – 492.4 nm, respectively) – in Fig. 7a. Although the location of snow cover in the S-2A image is visually very close to the snow cover depicted in shades of purple to white in the CGF snow map in Fig. 7b, there is not perfect correspondence. The point of this comparison is to demonstrate the utility of high-resolution imagery to evaluate the CGF maps, not to perform a detailed and quantitative comparison that would involve our selecting an algorithm to map snow cover in the S-2A image, with its inherent uncertainties. This is an example of evaluation and comparison of snow maps, and not validation of the CGF map product.
4.3 Effect of cloud cover on the accuracy of the CGF snow-cover maps
The accuracy of the CGF snow decision in each pixel is influenced by cloud persistence, or the number of days of continuous cloud cover. The algorithm updates the snow map when there are breaks in cloud cover, as determined by the MODIS or VIIRS cloud mask. To demonstrate differences in cloud coverage and, thus, to illustrate sources of CGF uncertainty between two climatologically different areas, we show the mean number of days of cloud cover for an area in the western US/northern Mexico and in the northeastern US/southeastern Canada for the month of February 2012 (Fig. 8a, b, c). Greater accuracy in snow-cover decisions in the CGF snow-cover product is achieved when there are more views of the surface as illustrated for the month of February 2012 in the western US/northern Mexico ROI (Fig. 8a); there are fewer days of clouds and more views of the surface compared with the northeastern US/southeastern Canada (Fig. 8b).

Figure 8(a–c) Maps showing the number of days of cloud cover for February 2012 derived from the MOD35 cloud mask used in the MOD10A1F snow-cover products: (a) in the western US, extending into northern Mexico, and (b) in the northeastern US/southeastern Canada. (c) Location map showing outlines (in red) of the study areas shown in (a) and (b). The location map in (c) was obtained from Interactive Data Language (IDL) software that uses Natural Earth raster + vector map data, which are in the public domain.
4.4 Comparison of a time series of MODIS and VIIRS cloud-gap-filled SCE maps
A 3-month (1 February–30 April 2012) time series of Terra MODIS and S-NPP VIIRS SCE map products (Fig. 9) was developed, processed, and evaluated for the study area shown in Fig. 1. The difference in SCE between the MODIS and VIIRS snow maps for each day of the time series is shown in the graph. Overall, the snow maps agree very well, although the Terra MODIS snow maps show less snow than the VIIRS snow maps, with a mean daily difference of 11 070 km2, which is only ∼0.45 % of the study area. Reasons for disagreement between MODIS and VIIRS on a given day are that the Terra MODIS images are acquired at a different time of the day (10:30 ECT – equatorial crossing time) than the S-NPP VIIRS images (01:30 ECT); cloud-cover differences on the original snow maps (before gap filling) also explain some of the difference in extent of snow mapped. This is largely because of differences in cloud masking between the MODIS and VIIRS SCE products as described earlier, and as illustrated in the example shown in Fig. 2.
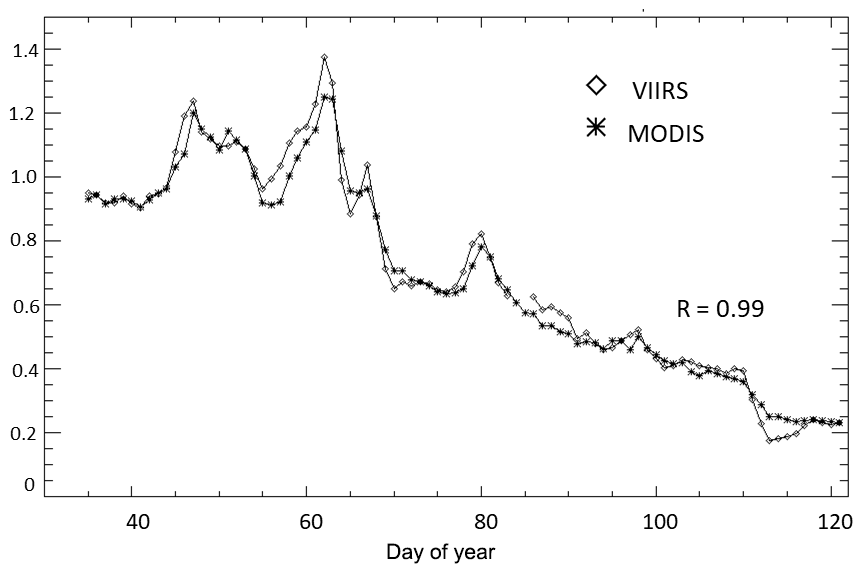
Figure 9Time series showing differences in snow-cover extent (SCE) derived from Terra MODIS and S-NPP VIIRS cloud-gap-filled (CGF) snow maps for a nearly 3-month period extending from 4 February to 30 April 2012 for the western US/southwestern Canada study area. Although the time series began on 1 February, snow-cover extent from 1 to 3 February is not shown because, in this example, the gap-filling algorithm was started on 1 February and had not filled most of the gaps from clouds until 4 February.
4.5 Comparison of Terra and Aqua MODIS snow maps for inclusion in an Earth science data record (ESDR)
We analyzed Terra and Aqua CGF snow maps and time-series plots to determine which maps are better suited to being part of a moderate-resolution SCE ESDR. First, we compared snow maps from both Terra and Aqua from 1 February through 30 April 2012 for ROIs including the Wind River Range, Wyoming, and the Sierra Nevada Mountains in California and Nevada (see dark blue rectangles in Fig. 2, left panels, for locations). In the first few days of each time series, the CGF algorithm is actively removing clouds from the daily maps, until both the Terra and Aqua daily maps are completely cloud-free by approximately Day 20 of the Wind River Range ROI time series and Day 10 of the Sierra Nevada ROI time series. Pixels for which the algorithm provided “no decision” were excluded from the analysis. The plots in Fig. 10a and b show agreement of the Terra and Aqua CGF maps of percent snow cover as an R value of 1.0, and mean bias of 1.69 for the Wind River Range ROI time series and an R value of 0.96 and mean bias of 1.13 for the Sierra Nevada ROI time series.

Figure 10(a, b) Time-series plots of percent snow cover in a 22 171 km2 scene (see location of the ROI that includes the Wind River Range, Wyoming, in Fig. 2) and in a 109 575 km2 scene (see ROI that includes the Sierra Nevada Mountains, in Fig. 2) using M*D10A1F snow-cover maps for a time series extending from 1 February through 30 April (DOY 32–121) 2012. (c, d) Difference in percent cloud cover by day for Terra MODIS minus Aqua MODIS for the ROI including the Wind River Range and the ROI including the Sierra Nevada Mountains, corresponding to (a, b), showing that the Aqua MODIS shows more cloud cover during the study period than the Terra MODIS does.
There are differences in cloud masking that prevent the Terra and Aqua time series from being identical. This is especially notable from ∼ Day 35–70 of the Wind River Range time series (see Fig. 10a). This corresponds to a period with significant cloud cover that is being mapped differently by the Terra and Aqua cloud masks (see Fig. 10c and d). Difference in percent cloud cover by day for Terra minus Aqua CGF for the ROI including the Wind River Range and the ROI including the Sierra Nevada Mountains are shown in Fig. 10a and d. The Aqua snow maps generally have more clouds than the Terra snow maps do.
Although the percent snow cover on the Terra and Aqua snow maps is highly correlated in the time series shown in Fig. 10, there is also quite a bit of disagreement for example from about DOY 55–70 for the Wind River Range. Our analysis of both CGF snow maps for this western US study area indicates that the Terra MODIS snow maps are superior for reasons described below. Further analysis, after the full data set has been reprocessed, is required to confirm this.
The primary reason for disagreement between the Terra MODIS and Aqua MODIS snow maps in C5 and earlier collections is that the 1.6 µm channel (band 6) on the Aqua MODIS sensor has some non-functioning detectors (MCST, 2014), as described earlier. Other reasons include low illumination and terrain shadowing. The reader is referred to the MODIS Snow Products User Guide to Collection 5 (Riggs et al., 2006) for details concerning the effect of the non-functioning detectors on the Aqua snow-cover maps in data collections prior to C6.
For C6, the MYD10A1 snow-mapping algorithm uses the QIR (Gladkova et al., 2012) to correct the Aqua MODIS band 6 radiances for the non-functioning detectors; this enables the use of the same algorithm for Aqua MODIS as used for Terra MODIS. Differences in cloud cover, and in cloud masking account for differences in snow-mapping results between the C6 Terra and Aqua MODIS snow maps shown in Fig. 10. Figure 10c and d illustrate differences in the cloud masking for Terra and Aqua for the February–April 2012 time series.
An example to illustrate this can be seen on 26 April 2012, which was a day that had a large amount of clouds in the western US study area (Fig. 11). The patterns of cloud cover in the false-color imagery (not shown) of both Terra and Aqua MODIS show that the clouds have the same shape as many of the “no-decision” regions on the Aqua CGF snow map. The clouds are probably very cold (possibly with ice) on top of lower-level clouds. The Aqua cloud mask fails to flag most of those clouds as “certain cloud”, so they are processed as “clear” in the MYD10A1 snow algorithm, and “no decision” is the result. This is because the Aqua MODIS band 6 (with its non-functioning detectors) is not used in the Aqua MODIS cloud masking algorithm. The C6 cloud masking algorithm, MYD35, developed by the University of Wisconsin, does not “restore” the non-functioning detectors of Aqua band 6, and therefore uses Aqua band 7 instead.
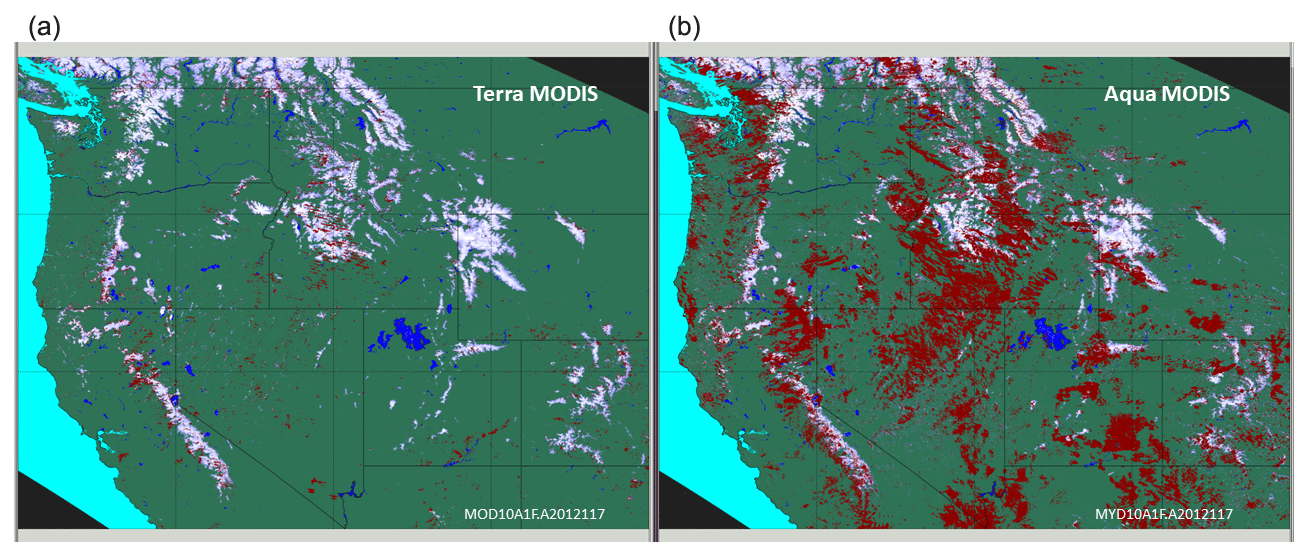
Figure 11Terra MODIS (a) and Aqua MODIS (b) cloud-gap-filled (CGF) snow-cover maps from 26 April 2012. Note that there are red pixels on both snow maps indicating “no decision” by the algorithm; however, there are many more red pixels on the Aqua MODIS snow map, primarily due to the inability of the Aqua MODIS cloud mask to identify large areas of cloud cover as “certain cloud”. The location of this western US study area is shown in Fig. 1. The base map was obtained from Interactive Data Language (IDL) software that uses Natural Earth raster + vector map data, which are in the public domain.
There are greater uncertainties inherent in snow mapping using the Aqua MODIS vs. Terra MODIS for the reasons mentioned above, which are largely related to the non-functioning detectors in the Aqua MODIS band 6. The large number of “no decision” pixels resulting from the Aqua C6 and C6.1 cloud mask would adversely affect the continuity of a moderate-resolution SCE ESDR. Based on this preliminary analysis, we recommend use of the Terra MODIS and S-NPP VIIRS CGF maps to develop the moderate-resolution SCE ESDR. Further analysis in other snow-covered areas is necessary to confirm this.
In this paper, we describe some uncertainties of the C6.1 MODIS and VIIRS cloud-gap-filled (CGF) daily snow-cover maps, M*D10A1F and the C2 VNP10A1F, respectively. The NASA MODIS and VIIRS algorithms produce daily, cloud-free snow-cover products along with appropriate QA information. These products will enable an Earth science data record (ESDR) of snow cover to be produced at moderate spatial resolution for hydrological and climatological applications. Cloud-gap-filled snow-cover products from MODIS and VIIRS have all of the uncertainties of the original products that contain clouds, as well as additional uncertainties that are related to cloud-gap filling, such as the age of the snow observation. When using the MODIS and VIIRS CGF products, a user can specify how far back in time they want to look, using the cloud-persistence count (CPC) which tells the age of the snow measurement in each pixel; the CPC is available as part of the product QA metadata for both the MODIS and VIIRS CGF snow-cover products. Uncertainty relating to cloud-gap filling is greater in areas with frequent and persistent cloud cover during the snow season such as in the northeastern US, in contrast to areas such as the Sierra Nevada Mountains where gaps in clouds occur more frequently during the snow season.
It can be difficult to validate the MODIS and VIIRS CGF (and other) snow maps. Absolute validation can only be accomplished using daily snow depth measurements when available. However, product accuracy can be evaluated by comparing the CGF products with surface reflectance maps, higher-resolution maps such as those derived from Landsat and Sentinel, and using other satellite-derived snow maps.
Comparisons of Terra and Aqua CGF snow maps in C6 reveal many more “no-decision” pixels in the Aqua snow maps, due to cloud masking, low illumination, and terrain shadowing. Because of non-functioning detectors in band 6, the Aqua cloud mask is less accurate than the Terra cloud mask according to our preliminary validation over the western US study area. Although the Aqua snow algorithms use the quantitative image restoration (QIR) technique to map snow using the Aqua MODIS, the Aqua cloud mask does not use the QIR.
Comparisons of the daily Terra MODIS and S-NPP VIIRS CGF SCE products for a 3-month time period in 2012 were undertaken for our study area in the western US (2 487 610 km2) covering all or parts of 11 states and part of southwest Canada. Although the MODIS and VIIRS SCE maps show excellent correspondence, the VIIRS maps, on average, show 11 070 km2 more snow than the MODIS maps on a given day, which is only ∼0.45 % of the study area. MODIS CGF snow-cover maps of C6.1 are useful for development of an ESDR and ultimately a CDR (combined with S-NPP VIIRS and other JPSS VIIRS-derived snow maps now and in the future).
Snow cover is one of the Global Climate Observing System (GCOS) essential climate variables. The distribution, extent, and duration of snow, along with knowledge of snowmelt timing, are critical for characterizing the Earth's climate system and its changes. To complement the 53-year NOAA/Rutgers CDR of snow cover at 190 km resolution which is valuable for climate and other studies, the MODIS/VIIRS moderate-resolution ESDR will be available at a 500 m resolution and, as such, will be useful for local and regional studies of snow cover and water resources, as well as for climate studies. The value of the ESDR will increase as the length of the record increases.
The MODIS cloud-gap-filled (CGF) data product used in this research will be publicly available from the NASA Distributed Active Archive Center (DAAC) at the National Snow and Ice Data Center (NSIDC) https://nsidc.org/daac (last access: 18 December 2019). This data product has the Earth Science Data Type (ESDT) name of MOD10A1F, https://doi.org/10.5067/MODIS/MOD10A1.006 (Riggs and Hall, 2019).
DH wrote the first drafts of the paper and completed the submission process as well as working with the co-authors on content, data analysis, and the production of the figures. GR carried out the coding of the MODIS and VIIRS cloud-gap-filled data algorithms and worked with the other authors on data analysis. ND undertook all of the image processing and worked with the other authors on data analysis. MR provided guidance regarding the requirements of the moderate-resolution Earth science data record and worked with the first author on data analysis.
The authors declare that they have no conflict of interest.
The Sentinel-2A satellite is operated by the European Space Agency (ESA); a collaborative effort between ESA and the USGS provides a data portal for Sentinel-2A data products.
This research has been supported by the NASA Earth Observing System (grant no. NNG17HP01C) and the NASA Terrestrial Hydrology (grant no. 80NSSC18K1674) programs.
This paper was edited by Günter Blöschl and reviewed by two anonymous referees.
Arsenault, K. R., Houser, P. R., and De Lannoy, G. J.: Evaluation of the MODIS snow cover fraction product, Hydrol. Process., 28, 980–998, 2014.
Brubaker, K. L., Pinker, R. T., and Deviatova, E.: Evaluation and Comparison of MODIS and IMS Snow-Cover Estimates for the Continental United States Using Station Data, J. Hydrometeorol., 6, 1002–1017, 2005.
Chelamallu, H. P., Venkataraman, G., and Murti, M. V. R.: Accuracy assessment of MODIS/Terra snow cover product for parts of Indian Himalayas, Geocarto Int., 29, 592–608, 2013.
Chen, C., Lakhankar, T., Romanov, P., Helfrich, Powell, A., and Khanbilvardi, R.: Validation of NOAA-interactive multisensor snow and ice mapping system (IMS) by comparison with ground-based measurements over continental United States, Remote Sens., 4,, 1134–1145, 2012.
Claverie, M., Ju, J., Masek, J. G., Dungan, J. L., Vermote, E. F., Roger, J.-C., Skakun, S. V., and Justice, C.: The Harmonized Landsat and Sentinel-2 surface reflectance data set, Remote Sens. Environ., 219, 145–161, 2018.
Coll, J. and Li, X.: Comprehensive accuracy assessment of MODIS daily snow cover products and gap filling methods, ISPRS J. Photogram. Remote Sens., 144, 435–452, 2018.
Crawford, C. J.: MODIS Terra Collection 6 fractional snow cover validation in mountainous terrain during spring snowmelt using Landsat TM and ETM+, Hydrol. Process., 29, 128–138, 2015.
Dariane, A. B., Khoramian, A., and Santi, E.: Investigating spatiotemporal snow cover variability via cloud-free MODIS snow cover product in Central Alborz Region, Remote Sens. Environ., 202, 152–165, 2017.
Deng, J., Huang, X., Feng, Q., Ma, X., and Liang, T.: Toward improved daily cloud-free fractional snow cover mapping with multi-source remote sensing data in China, Remote Sens., 7, 6986–7006, 2015.
Déry, S. J. and Brown, R. D.: Recent Northern Hemisphere snow cover extent trends and implications for the snow-albedo feedback, Geophys. Res. Lett., 34, L22504, https://doi.org/10.1029/2007GL031474, 2007.
Dietz, A. J., Kuenzer, C., and Conrad, C.: Snow-cover variability in central Asia between 2000 and 2011 derived from improved MODIS daily snow-cover products, Int. J. Remote Sens., 34, 3879–3902, https://doi.org/10.1080/01431161.2013.767480, 2013.
Dong, C. and Menzel, L.: Producing cloud-free MODIS snow cover products with conditional probability interpolation and meteorological data, Remote Sens. Environ., 186, 439–451, https://doi.org/10.1016/j.rse.2016.09.019, 2016.
Estilow, T. W., Young, A. H., and Robinson, D. A.: A long-term Northern Hemisphere snow cover extent data record for climate studies and monitoring, Earth Syst. Sci. Data, 7, 137–142, https://doi.org/10.5194/essd-7-137-2015, 2015.
Foster, J. L., Hall, D. K., Eylander, J. B., Riggs, G. A., Nghiem, S. V., Tedesco, M., Kim, E., et al.: A blended global snow product using visible, passive microwave and scatterometer satellite data, International Journal of Remote Sensing, 32(5), 1371-1395, 2011.
Frei, A. and Lee, S.: A comparison of optical-band based snow extent products during spring over North America, Remote Sens. Environ., 114, 1940–1948, 2010.
Gafurov, A. and Bárdossy, A.: Cloud removal methodology from MODIS snow cover product, Hydrol. Earth Syst. Sci., 13, 1361–1373, https://doi.org/10.5194/hess-13-1361-2009, 2009.
Gafurov, A., Lüdtke, S., Unger-Shayesteh, K., Vorogushyn, S., Schöne, T., Schmidt, S., Kalashnikova, O., and Merz, B.: MODSNOW-Tool: an operational tool for daily snow cover monitoring using MODIS data, Environ. Earth Sci., 75, 1078, https://doi.org/10.1007/s12665-016-5869-x, 2016.
Gao, Y., Xie, H., Yao, T., and Xue, C.: Integrated assessment on multi-temporal and multi-sensor combinations for reducing cloud obscuration of MODIS snow cover products of the Pacific Northwest USA, Remote Sens. Environ., 114, 1662–1675, 2010a.
Gao, Y., Xie, H., Lu, N., Yao, T., and, Liang, T.: Toward advanced daily cloud-free snow cover and snow water equivalent products from Terra–Aqua MODIS and Aqua AMSR-E measurements, J. Hydrol., 385, 23–35, https://doi.org/10.1016/j.jhydrol.2010.01.022, 2010b.
Gao, Y., Lu, N., and, Yao, T.: Evaluation of a cloud-gap-filled MODIS daily snow cover product over the Pacific Northwest USA, J. Hydrol., 404, 157–165, https://doi.org/10.1016/j.jhydrol.2011.04.026, 2011.
Gladkova, I., Grossberg, M., Bonev, G., Romanov, P., and Shahriar, F.: Increasing the accuracy of MODIS/Aqua snow product using quantitative image restoration technique, IEEE Geosci. Remote Sens. Lett., 9, 740–743, 2012.
Hall, D. K. and Riggs, G. A.: Accuracy Assessment of the MODIS Snow Products, Hydrol. Process., 21, 1534–1547, 2007.
Hall, D. K., Riggs, G. A., Foster, J. L., and Kumar, S. V.: Development and evaluation of a cloud-gap-filled MODIS daily snow-cover product, Remote Sens. Environ., 114, 496–503, https://doi.org/10.1016/j.rse.2009.10.007, 2010.
Hall, D. K., Crawford, C. J., DiGirolamo, N. E., Riggs, G. A., and Foster, J. L.: Detection of earlier snowmelt in the Wind River Range, Wyoming, using Landsat imagery, 1972–2013, Remote Sens. Environ., 162, 45–54, 2015.
Hammond, J. C., Saavedra, F. A., and Kampf, S. K.: Global snow zone maps and trends in snow persistence 2001–2016, Int. J. Climatol., 38, 4369–4383, https://doi.org/10.1002/joc.5674, 2018.
Helfrich, S. R., McNamara, D., Ramsay, B. H., Baldwin, T., and Kasheta, T.: Enhancements to, and forthcoming developments in the Interactive Multisensor Snow and Ice Mapping System (IMS), Hydrol. Process., 21, 1576–1586, 2007.
Helfrich, S. R., Li, M., and Kongoli, C.: Interactive Multisensor Snow and Ice Mapping System Version 3 (IMS V3) Algorithm Theoretical Basis Document Version 2.0 Draft 4.1, NOAA NESDIS Center for Satellite Applications and Research (STAR), College Park, MD, USA, 2012.
Huang, X., Liang, T., Zhang, X., and Guo, Z.: Validation of MODIS snow cover products using Landsat and ground measurements during the 2001–2005 snow seasons over northern Xinjiang, China, Int. J. Remote Sens., 32, 133–152, 2011.
Kadlec, J. and Ames, D. P.: Using crowdsources and weather station data to fill cloud gaps in MODIS snow cover datasets, Environ. Model. Softw., 95, 258–270, 2017.
Klein, A. G. and Barnett, A. C.: Validation of daily MODIS snow cover maps of the Upper Rio Grande River Basin for the 2000–2001 snow year, Remote Sens. Environ., 86, 162–176, 2003.
Li, X., Fu, W., Shen, H., Huang, C., and Zhang, L.: Monitoring snow cover variability (2000–2014) in the Hengduan Mountains based on cloud-removed MODIS products with an adaptive spatio-temporal weighted method, J. Hydrol., 551, 314–327, https://doi.org/10.1016/j.jhydrol.2017.05.049, 2017
López-Burgos, V., Gupta, H. V., and Clark, M.: Reducing cloud obscuration of MODIS snow cover area products by combining spatio-temporal techniques with a probability of snow approach, Hydrol. Earth Syst. Sci., 17, 1809–1823, https://doi.org/10.5194/hess-17-1809-2013, 2013.
Malnes, E., Karlsen, S. R., Johansen, B., Bjerke, J. W., and Tømmervik, H.: Snow season variability in a boreal-Arctic transition area monitored by MODIS data, Environ. Res. Lett., 11, 125005, https://doi.org/10.1088/1748-9326/11/12/125005, 2016.
Matson, M. and Wiesnet, D. R.: New database for climate studies, Nature, 289, 451–456, 1981.
MCST: MODIS Characterization Support Team, available at: https://mcst.gsfc.nasa.gov (last access: 16 December 2019), 2014.
Mote, P. W., Hamlet, A. F., Clark, M. P., and Lettenmaier, D. P.: Declining mountain snowpack in western North America, B. Am. Meteorol. Soc., 86, 39–49, 2005.
O'Leary, D., Hall, D., Medler, M., and Flower, A.: Quantifying the early snowmelt event of 2015 in the Cascade Mountains, USA by developing and validating MODIS-based snowmelt timing maps, Front. Earth Sci., 12, 693–710, 2018.
Parajka, J. and Blöschl, G.: Validation of MODIS snow cover images over Austria, Hydrol. Earth Syst. Sci., 10, 679–689, https://doi.org/10.5194/hess-10-679-2006, 2006.
Parajka, J. and Blöschl, G.: Spatio-temporal combination of MODIS images–potential for snow cover mapping, Water Resour. Res., 44, W03406, https://doi.org/10.1029/2007WR006204, 2008.
Parajka, J., Pepe, M., Rampini, A., Rossi, S., and Blöschl, G.: A regional snow-line method for estimating snow cover from MODIS during cloud cover, J. Hydrol., 381, 203–212, 2010.
Parajka, J., Holko, L., Kostka, Z., and Blöschl, G.: MODIS snow cover mapping accuracy in a small mountain catchment – comparison between open and forest sites, Hydrol. Earth Syst. Sci., 16, 2365–2377, https://doi.org/10.5194/hess-16-2365-2012, 2012.
Paudel, K. P. and Anderson, P.: Monitoring snow cover variability in an agropastoral area in the Trans Himalayan region of Nepal using MODIS data with improved cloud removal methodology, Remote Sens. Environ., 115, 1234–1246, 2011.
Paull, D. J., Lees, B. G., and Thompson, J. A.: An improved liberal cloud-mask for addressing snow/cloud confusion with MODIS, Photogram. Eng. Remote Sens., 81, 19–29, 2015.
Riggs, G. A. and Hall, D. K.: MODIS cloud-gap filled snow daily snow cover, 500 m resolution, https://doi.org/10.5067/MODIS/MOD10A1.006, 2019.
Riggs, G. A., Hall, D. K., and Salomonson, V. V.: MODIS Snow Products User Guide to Collection 5, available at: https://modis-snow-ice.gsfc.nasa.gov/?c=userguides (last access: 16 December 2019), 2006.
Riggs, G. A., Hall, D. K., and Román, M. O.: Overview of NASA's MODIS and Visible Infrared Imaging Radiometer Suite (VIIRS) snow-cover Earth System Data Records, Earth Syst. Sci. Data, 9, 765–777, https://doi.org/10.5194/essd-9-765-2017, 2017a.
Riggs, G. A., Hall, D. K., and Román, M. O.: NASA S-NPP VIIRS Snow Products Collection 1 (C1) User Guide, Release 1.0, available at: https://modis-snow-ice.gsfc.nasa.gov/?c=userguides (last access: 16 December 2019), 2017b.
Riggs, G. A., Hall, D. K., and Román, M. O.: MODIS snow products user guide for Collection 6.1 (C6.1), available at: https://modis-snow-ice.gsfc.nasa.gov/?c=userguides (last access: 17 March 2019), 2018.
Robinson, D. A., Dewey, K. F., and Heim, R. R.: Global snow cover monitoring: An update, B. Am. Meteorol. Soc., 74, 1689–1696, 1993.
Salomonson, V. V. and Appel, I.: Estimating fractional snow cover from MODIS using the normalized difference snow index, Remote Sens. Environ., 89, 351–360, 2004.
Salomonson, V. V. and Appel, I.: Development of the Aqua MODIS NDSI fractional snow cover algorithm and validation results, IEEE T. Geosci. Remote., 44, 1747–1756, 2006.
Stewart, I. T.: Changes in snowpack and snowmelt runoff for key mountain regions, Hydrol. Process., 23, 78–94, 2009.
Tang, Z, Wang, J., Li, H., and Yan, L.: Spatiotemporal changes of snow cover over the Tibetan plateau based on cloud-removed moderate resolution imaging spectroradiometer fractional snow cover product from 2001 to 2011, J. Appl. Remote Sens., 7, 073582, https://doi.org/10.1117/1.JRS.7.073582, 2013.
Tang, Z., Wang, X., Wang, J., Wang, X., Li, H., and Jinag, Z.: Spatiotemporal variation of snow cover in Tianshan Mountains, Central Asia, based on cloud-free MODIS fractional snow cover product, 2001–2015, Remote Sens., 9, 1045, https://doi.org/10.3390/rs9101045, 2017.
Tong, J., Déry, S. J., and Jackson, P. L.: Topographic control of snow distribution in an alpine watershed of western Canada inferred from spatially-filtered MODIS snow products, Hydrol. Earth Syst. Sci., 13, 319–326, https://doi.org/10.5194/hess-13-319-2009, 2009a.
Tong, J., Déry, S. J., and Jackson, P. L.: Interrelationships between MODIS/Terra remotely sensed snow cover and the hydrometeorology of the Quesnel River Basin, British Columbia, Canada, Hydrol. Earth Syst. Sci., 13, 1439001452, https://doi.org/10.5194/hess-13-1439-2009, 2009b.
Westerling, A. L., Hidalgo, H. G., Cayan, D. R., and Swetnam, T. W.: Warming and earlier spring increase western U.S. forest wildfire activity, Science, 313, 940–943, 2006.
Xu, W., Ma, H., Wu, D., and Yuan, W.: Assessment of the Daily Cloud-Free MODIS Snow-Cover Product for Monitoring the Snow-Cover Phenology over the Qinghai-Tibetan Plateau, Remote Sens., 9, 585, https://doi.org/10.3390/rs9060585, 2017.
Yu, J., Zhang, G., Yao, T., Xie, H., Zhang, H., Ke, C., and Yao, R.: Developing daily cloud-free snow composite products from MODIS Terra-Aqua and IMS for the Tibetan Plateau, IEEE T. Geosci. Remote, 54, 2171–2180, 2016.