the Creative Commons Attribution 4.0 License.
the Creative Commons Attribution 4.0 License.
 | 25 Oct 2019
Time variability and uncertainty in the fraction of young water in a small headwater catchment
Michael Paul Stockinger
Heye Reemt Bogena
Andreas Lücke
Christine Stumpp
Harry Vereecken
The time precipitation needs to travel through a catchment to its outlet is an important descriptor of a catchment's susceptibility to pollutant contamination, nutrient loss, and hydrological functioning. The fast component of total water flow can be estimated by the fraction of young water (Fyw), which is the percentage of streamflow younger than 3 months. Fyw is calculated by comparing the amplitudes of sine waves fitted to seasonal precipitation and streamflow tracer signals. This is usually done for the complete tracer time series available, neglecting annual differences in the amplitudes of longer time series. Considering inter-annual amplitude differences, we employed a moving time window of 1 year in weekly time steps over a 4.5-year δ18O tracer time series to calculate 189 Fyw estimates and their uncertainty. They were then tested against the following null hypotheses: (1) at least 90 % of Fyw results do not deviate more than ±0.04 (4 %) from the mean of all Fyw results, indicating long-term invariance. Larger deviations would indicate changes in the relative contribution of different flow paths; (2) for any 4-week window, Fyw does not change more than ±0.04, indicating short-term invariance. Larger deviations would indicate a high sensitivity of Fyw to a 1-week to 4-week shift in the start of a 1-year sampling campaign; (3) the Fyw results of 1-year sampling campaigns started in a given calendar month do not change more than ±0.04, indicating seasonal invariance. In our study, all three null hypotheses were rejected. Thus, the Fyw results were time-variable, showed variability in the chosen sampling time, and had no pronounced seasonality. We furthermore found evidence that the 2015 European heat wave and including two winters into a 1-year sampling campaign increased the uncertainty of Fyw. Based on an increase in Fyw uncertainty when the mean adjusted R2 was below 0.2, we recommend further investigations into the dependence of Fyw and its uncertainty to goodness-of-fit measures. Furthermore, while investigated individual meteorological factors did not sufficiently explain variations of Fyw, the runoff coefficient showed a moderate negative correlation of with Fyw. The results of this study suggest that care must be taken when comparing Fyw of catchments that were based on different calculation periods and that the influence of extreme events and snow must be considered.
- Article
(1495 KB) - Full-text XML
-
Supplement
(341 KB) - BibTeX
- EndNote


Precipitation water uses slow and fast flow paths on its way through a catchment to the outlet where it becomes stream water (Tsuboyama et al., 1994). Slow flow paths are for example the saturated and unsaturated flow through the soil matrix (Gannon et al., 2017), while fast flow paths include preferential flow (Wiekenkamp et al., 2016a) and overland flow (Miyata et al., 2009). The distribution of slow and fast flow paths varies in time and depends on a catchment's spatiotemporal characteristics (Harman, 2015; Heidbüchel et al., 2013; Stockinger et al., 2014; Tetzlaff et al., 2009a, b). Knowledge of this distribution helps in assessing the risk of streamflow contamination with pollutants or nutrient loss, since nutrients and pollutants are transported through the soil by hydrological pathways (Bourgault et al., 2017; Gottselig et al., 2014).
The water stable isotopes (δ18O and δ2H) are widely applied in the study of flow paths and transit times of precipitation through a catchment (McGuire and McDonnell, 2006). One method that utilizes the water stable isotopes for investigating fast flow paths is the fraction of young water (Fyw). Developed by Kirchner (2016a), Fyw estimates the streamflow fraction that is younger than approximately 3 months since entering the catchment as meteoric water. It does so by comparing the amplitudes of sine waves fitted to the seasonally varying isotope tracer signals of precipitation and streamflow. The seasonally varying isotope signal in precipitation is caused by different evaporation or condensation temperatures, vapor source areas, and evaporation amounts of falling rain droplets during warmer and colder seasons, leading on average to higher δ18O values in summer and lower values in winter (Dansgaard, 1964). As rainfall passes through a catchment to reach the outlet, this signal is attenuated and shifted in time, leading to a much smoother but still seasonally varying isotope signal in streamflow. The ratio of the fitted streamflow sine wave's amplitude AS divided by the fitted precipitation sine wave's amplitude AP equals the percentage of water in streamflow younger than 3 months. Kirchner (2016a, b) showed the robustness of Fyw against spatial catchment heterogeneities (aggregation bias error), where previous methods of transit time estimation by sine wave fitting produced highly uncertain results.
Catchment influences on Fyw were investigated globally by, for example, Jasechko et al. (2016). They calculated Fyw for 254 catchments and concluded that one-third of global streamflow consists of water younger than 3 months, with catchments in steeper terrains having smaller contributions of young water to their runoff. Wilusz et al. (2017) coupled a rainfall generator with rainfall–runoff and time-varying transit time models to determine the young water fraction. They found that an increase in annual rainfall amounts of 1 mm d−1 led to an increase of 0.03–0.04 in the modeled Fyw (percentage point increase of 3 %–4 %, hereafter written as 0.03–0.04, where the value 1 means that 100 % of streamflow is younger than 3 months). Similar to this, von Freyberg et al. (2018) found a positive correlation between Fyw and high-intensity precipitation events. This dependence of Fyw on precipitation characteristics could lead to long-term changes in Fyw due to global warming. Global warming was found to increase precipitation intensity and the frequency of droughts (Pendergrass and Hartmann, 2014; Trenberth, 2011). For Europe, the chance of extreme heat waves and thus dry conditions has substantially increased since 2003 (Christidis et al., 2015). Previous studies highlighted that the distribution of fast and slow flow paths is time-variable (Harman, 2015; Heidbüchel et al., 2013). Since Fyw focuses on fast flow paths, we expect it to be variable in time as well. However, so far previous studies focused on comparing Fyw between different catchments to derive relationships between catchment characteristics and Fyw, but no study has investigated the temporal variability in Fyw for a given catchment yet.
Besides catchment characteristics, the conditions and conceptualizations of the Fyw calculation also influenced results in past studies. The effect of varying sampling frequencies of tracer data was investigated by Stockinger et al. (2016). A higher sampling frequency led to higher Fyw, highlighting the sensitivity of Fyw to the temporal resolution of the available tracer data. Lutz et al. (2018) investigated 24 catchments in Germany and used 10 000 Monte Carlo simulations with random errors in the isotope data of precipitation and streamflow to derive the 95 % confidence intervals of Fyw. Their confidence intervals indicated a robustness of Fyw against random errors in input data. The study of von Freyberg et al. (2018) focused on three influences on Fyw: (a) spatially interpolating precipitation isotopes, (b) including snowpack, and (c) weighing streamflow in fitting sine waves. They found that weighing streamflow led to significant changes in Fyw, while the other factors had a negligible effect.
The mentioned studies highlight the current research interest in the new measure of Fyw. For this reason, it is necessary to investigate the sensitivity of Fyw and its uncertainty to different datasets. This is especially important for catchment comparison studies where the conceptualization of calculating Fyw might vary between catchments or datasets of different catchments may vary in quality. The question to answer is how much of the difference between individual Fyw estimates stems from actual, catchment-borne differences in flow path distributions and which part is merely based on, for example, different data quality or quantity.
The present study aims at answering one aspect of this open research question by focusing on the time variance in Fyw and its associated uncertainty. Past studies fitted one sine wave to the complete time series available, varying from less than a year to several decades (Ogrinc et al., 2008; Song et al., 2017; von Freyberg et al., 2018). To our knowledge, only the study of Stockinger et al. (2017) calculated Fyw for two different 1-year periods of a multi-year time series but did not test the temporal variability in Fyw nor influencing factors on it or its uncertainty. Thus, the sensitivity of the Fyw method towards the timing and the length of the available data remains to be tested in detail. The present study investigated the temporal variability in Fyw when different calculation periods of a multi-year isotope dataset are used. We used a 1-year time window which was shifted in 7 d steps to calculate 189 Fyw estimates over a 4.5-year time series of isotope data. The 189 Fyw results were tested against the following null hypotheses:
-
Fyw estimates do not change over time (time invariance).
-
Short-term changes in the start of a tracer sampling campaign do not influence the Fyw estimate (sampling invariance).
-
Fyw estimates are similar for calculation years that are centered around a given calendar month (seasonal invariance).
The three hypotheses were tested against whether Fyw differences exceeded a threshold value of ±0.04, which is the Fyw uncertainty when fitting a single sine wave to the 4.5-year time series (uncertainty derived by Gauss error propagation; see Results). We used hydrometeorological and isotopic data to investigate possible influences on time-variable Fyw results and their associated uncertainties and, where applicable, to reduce uncertainty. In conclusion of this study we recommend a tracer sampling design that reduces Fyw uncertainty.
2.1 Study site
The Wüstebach headwater catchment (38.5 ha) is located in the Eifel National Park (Germany; Fig. 1). It is also part of the Eifel/Lower Rhine Observatory of the Terrestrial Environmental Observatories (TERENO) network (Bogena et al., 2018). The mean annual precipitation amounts to 1107 mm (1961–1990), with a mean annual temperature of 7 ∘C (Zacharias et al., 2011). Soil is up to 2 m deep, with an average depth of 1.6 m (Graf et al., 2014). Cambisol and planosol–cambisol soil types are found on hillslopes, whereas gleysols, histosols, and planosols are found in the riparian zone. The catchment is mostly covered with Norway spruce (Picea abies) and Sitka spruce (Picea sitchensis; Etmann, 2009). Eight hectares (∼21 %) of the forest were clear-cut in August–September 2013 (Wiekenkamp et al., 2016b). A severe heat wave occurred in Wüstebach during summer 2015 (Duchez et al., 2016).
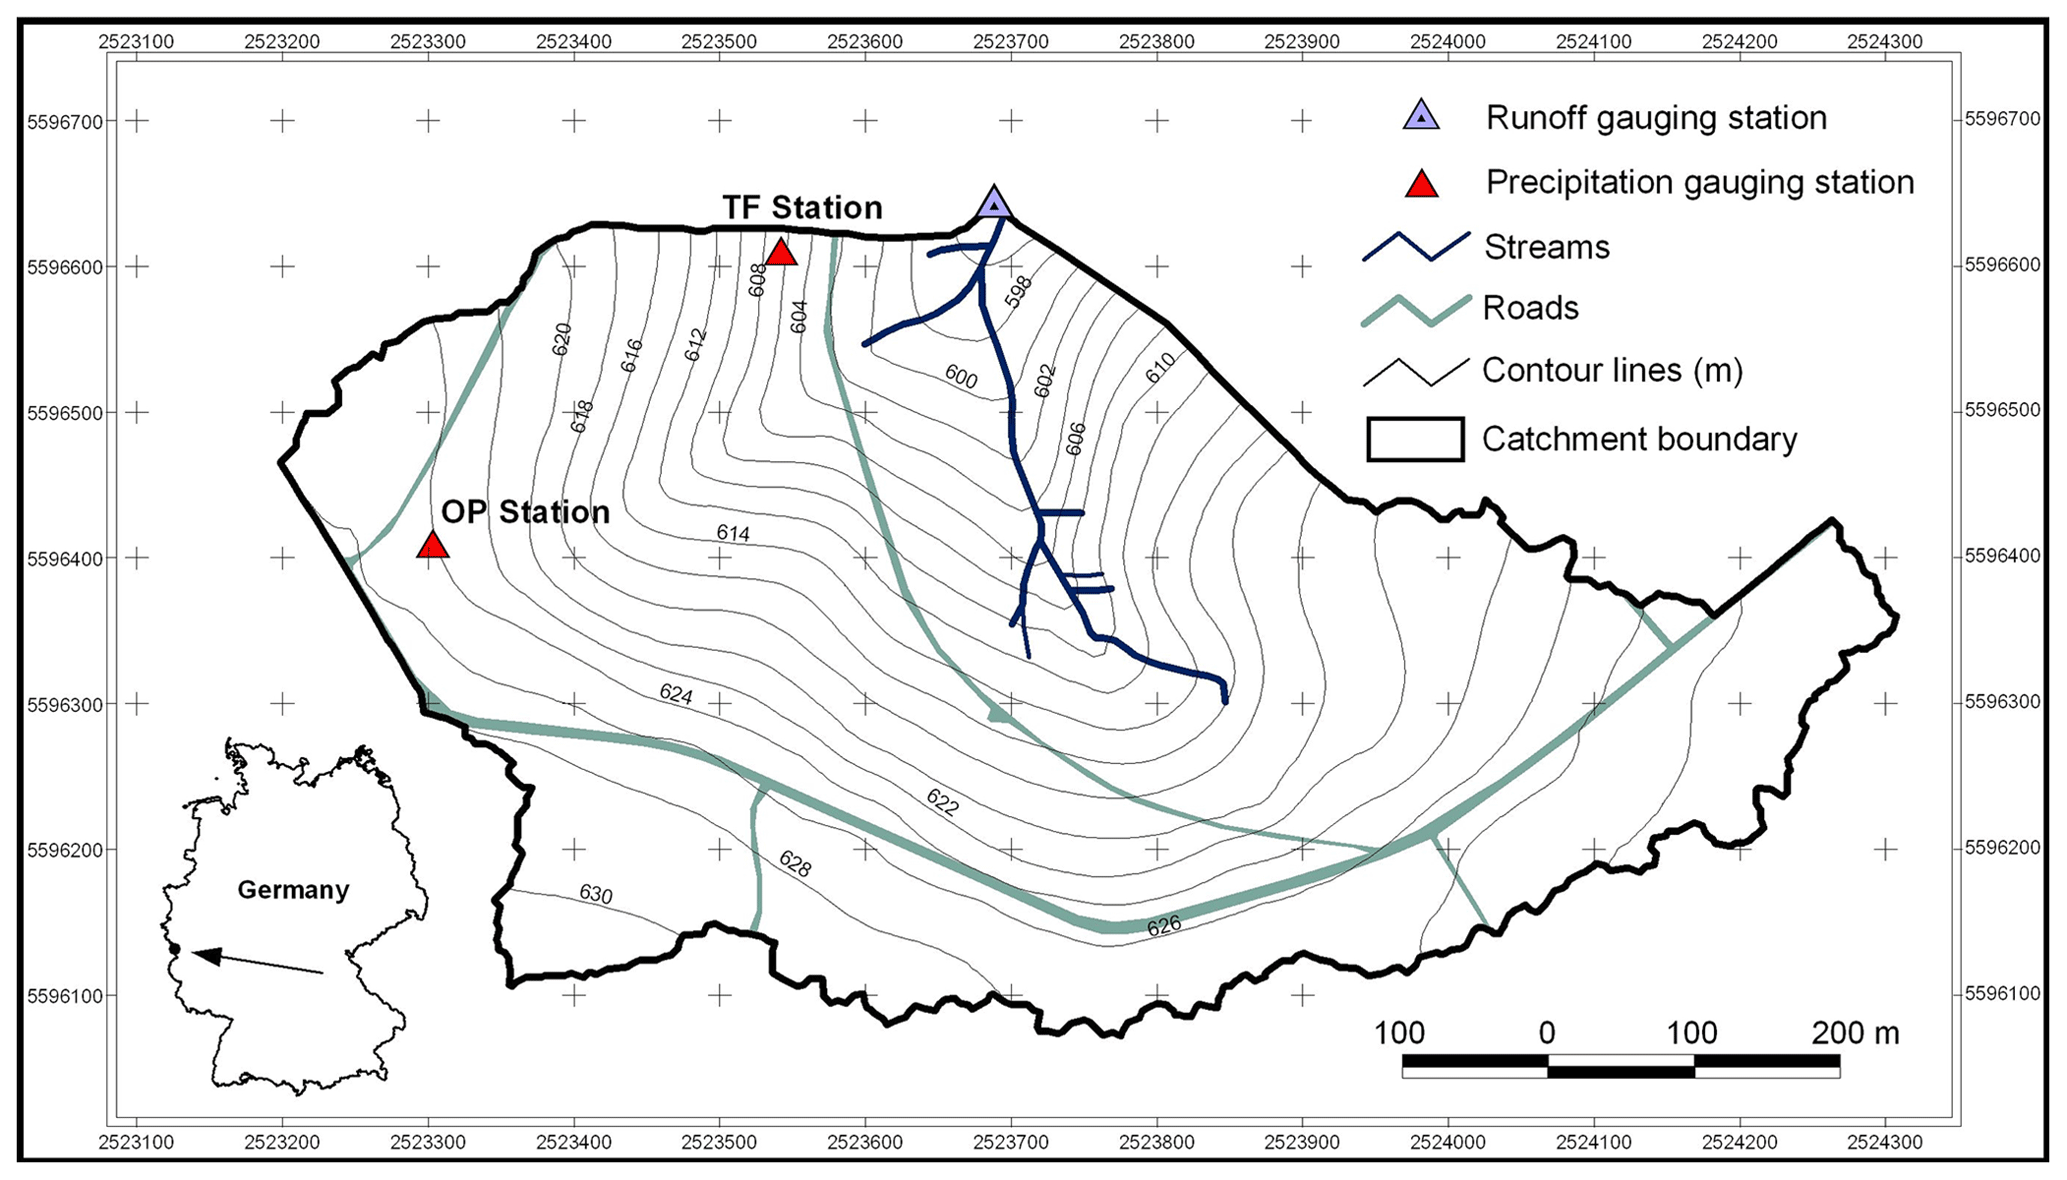
Figure 1Map showing the Wüstebach catchment and the used monitoring stations. OP Station is the open precipitation collection site, while TF Station is the throughfall station.
2.2 Data preparation
We used hourly hydrometric and weekly δ18O isotope data of precipitation (composite sample) and streamflow (grab sample) from October 2012 to June 2017. We did not use δ2H due to the strong correlation of δ18O and δ2H (R2=0.97 for throughfall and 0.87 for streamflow) and therefore redundancy of information. Precipitation depths were measured hourly in 0.1 mm increments for rainfall and daily in 1 cm increments for snowfall at the meteorological station Monschau-Kalterherberg of the German Weather Service (Deutscher Wetterdienst – DWD – station 3339, 535 m a.s.l.), located 9 km northwest of the catchment. Runoff was measured at the outlet by a v-notch weir for lower and a Parshall flume for higher runoff depths in 10 min intervals. We collected throughfall samples for isotopic analysis as the Wüstebach catchment is forested, and the canopy passage of precipitation influences Fyw (Stockinger et al., 2017). The samples were collected with six RS200 samplers (UMS GmbH, Germany) with a distance of 2 m to each other and to trees. The samplers consisted of a 50 cm long, 20 cm diameter plastic pipe which was buried in the ground. On top of it a 100 cm long plastic pipe with the same diameter was installed. An HDPE sample bottle (max. volume of 5000 mL) was placed inside the buried pipe and connected with plastic tubing to a funnel on top of the 100 cm long pipe. The funnel had a collecting area of 314 cm2 and was protected by a wire mesh against foliage, and a table tennis ball in the funnel served as an additional evaporation barrier. Tests of the system showed the reliability in protecting the collected water from evaporation and in consequence isotopic fractionation for several weeks (Stockinger et al., 2015). Two samplers of the same design were placed in a clearing of the Wüstebach catchment to sample open precipitation, i.e., precipitation that has not passed through the spruce canopy. Streamflow samples for isotopic analysis were collected weekly as grab samples in HDPE bottles at the outlet of the catchment.
Isotopic analysis was carried out using laser-based cavity ring-down spectrometers (models L2120-i and L2130-i, Picarro Inc., USA). Internal standards calibrated against VSMOW, Standard Light Antarctic Precipitation (SLAP2), and Greenland Ice Sheet Precipitation (GISP) were used for calibration and to ensure long-term stability of analyses (Brand et al., 2014). The long-term precision of the analytical system was ≤0.1 ‰ for δ18O.
We calculated weekly volume-weighed means of δ18O for throughfall and open precipitation, which were further weighed according to the respective land-use percentage of spruce forest (79 %) and clear-cut (21 %) areas to generate a time series of precipitation δ18O for the whole catchment. The derived precipitation isotope time series was then used together with the weekly stream water grab samples to calculate Fyw. While streamflow never ceased and thus a time series of weekly isotope values was available for the whole time series, there were weeks of no precipitation and thus gaps in the time series. Because of this, for a 1-year calculation window, on average 43 precipitation isotope values compared to 53 streamflow values were available. The total number of isotope values amounted to 156 for precipitation and 195 for streamflow. We could not always sample precipitation in weekly intervals, leading to bulk samples of 2–3 weeks on occasion. In this case, we assigned the measured bulk isotope value to each week, while the measured bulk precipitation depth was proportionally assigned to each week according to the distribution of hourly precipitation measured at the meteorological station Kalterherberg.
For further hydrometeorological and isotopic analyses, several additional data were collected: we measured air temperature and relative humidity in 10 min intervals at the TERENO meteorological station Schleiden-Schöneseiffen (Meteomedia station, 572 m a.s.l.), located 3 km northeast of the catchment. We also calculated the runoff coefficient from runoff (Q) and open precipitation (P) as Q∕P and used it for further analysis. Isotope data were complemented by δ18O values of groundwater, sampled in four different locations in weekly intervals since 2009. Groundwater was sampled by pumping first to avoid sampling stagnant water. Lastly, we calculated the d excess of the precipitation samples using the slope and intercept of the global meteoric water line (d excess ; Craig, 1961; Merlivat and Jouzel, 1979).
2.3 Fraction of young water
This study will use “Fyw(all)” to refer to the Fyw calculated by using one sine wave each for the complete 4.5-year time series of precipitation and streamflow isotope data and “Fyw(189)” for the 189 individual Fyw results calculated using a 1-year calculation window which was moved in 7 d steps. A minimum time-window length of 1 year was chosen to fully capture the annual isotope signal. Fyw is calculated by fitting sine waves to both the seasonally varying precipitation and streamflow isotope signals. We used the multiple regression algorithm IRLS (iteratively reweighted least squares; available in the software R) to minimize the influence of outliers:
with CP(t) and CS(t) being the simulated precipitation and streamflow isotope values of time t, a, and b regression coefficients, and k and f are the vertical shift and frequency of the sine wave. The difference of CP(t) and CS(t) to the measured isotope time series in precipitation and streamflow is minimized to fit the parameters a, b, and k, while the frequency f of the sine wave is known due to its annual character (i.e., if CP(t) and CS(t) are calculated in hourly time steps, then the frequency f is 1/8766; once per 24×365.25 h). Precipitation isotope values were weighed using collected precipitation volumes, while streamflow was weighed using runoff volumes. The goodness of fit of the sine waves is expressed as the adjusted coefficient of determination R2 (), which accounts for the number of predictors in the regression model. If not otherwise stated, we will use the mean of the streamflow and precipitation , as both sine waves are needed to estimate the fraction of young water. After fitting the multiple regression equations, the amplitudes AP and AS and Fyw can be calculated:
Shifting the calculation window in 7 d steps resulted in a time series of varying Fyw(189) estimates which cannot be considered to be independent of each other. This precludes the use of regression analysis to derive predictor variables (e.g., temperature and relative humidity) for the independent variable (Fyw(189)). However, we used regression analysis to describe the average meteorological conditions during each Fyw(189) time window. The thus derived “predictor” variables may have influenced Fyw(189) and could be investigated in future studies that use independent Fyw estimates.
Fyw calculation was done in a two-step process, as the initial Fyw(189) results had large uncertainties that originated from a strong influence of the 2015 European heat wave (see Results and Supplement). Thus, in a second step we considered its influence and recalculated results while omitting precipitation isotope data of summer 2015. This greatly reduced uncertainty. Apart from the Fyw(189) results we also calculated Fyw(all) for the whole time series with one sine wave, as was the standard of previous studies. We compared its peak timing and amplitude to the timing of peaks and amplitudes of the 189 sine waves.
2.4 Hypotheses testing
For clarity we want to highlight that each Fyw(189) result was placed in the midpoint of the year it represents – that is, a data point located at any date represents the value for the 6 months before and 6 months after this date. For example, a Fyw(189) result of 0.2 on 6th August 2013 means that between 5 February 2013 and 4 February 2014, on average 20 % of runoff consisted of water younger than 3 months. The same logic applies to values, amplitudes, phase shifts, and hydrometeorological data if not explicitly stated otherwise. The hydrometeorological data were calculated as mean values for the 189 individual calculation years to facilitate comparison to the Fyw(189) results that are averages valid for the respective calculation time window.
Prior studies in the Wüstebach catchment identified changes of Fyw between 0.02 and 0.04 as significant (Stockinger et al., 2016, 2017). Here, we employed Gauss error propagation on the sine wave fit parameters to carry their respective standard errors through to the Fyw results. Doing this resulted in uncertainty estimates for the Fyw(189) as well as for Fyw(all). We used the latter as the threshold value for testing the null hypothesis. In doing so, the time-variable Fyw(189) values were tested against the uncertainty of the complete time series. In our study we found a threshold value of 0.04.
Based on this, three hypotheses were tested according to the following rules of acceptance.
-
Fyw estimates do not change over time (time invariance).
This hypothesis is accepted if more than 90 % of Fyw(189) values are within ±0.04 of the mean value of all Fyw(189) values. We chose a minimum percentage of 90 % to ensure that the long-term time invariance is captured. Larger changes of Fyw(189) over time would indicate either flow path changes or a change in the relative contribution of different flow paths.
-
Short-term changes in the start of a tracer sampling campaign do not influence Fyw estimate (sampling invariance).
This hypothesis is accepted if four consecutive Fyw(189) results (i.e., four weekly shifts of the 1-year time window) do not differ by more than ±0.04. We thus investigated 186 four-week time windows of the total 189 Fyw(189) estimates. The short time span of 4 weeks ensures that the influence of possible long-term changes in catchment flow paths are not captured and that only the influence of the start and end time of sampling 1 year of isotope data is investigated. In case that Fyw(189) shows stronger variations, the sampling time will likely have influenced Fyw(189) results. Patterns to help identify such situations beforehand are then searched by analyzing the time of occurrence of these situations.
-
Fyw estimates are similar for calculation years that are centered around a given calendar month (seasonal invariance).
This hypothesis tests if the Fyw(189) results centered around a specific month do not differ by more than ±0.04 within this month. With this we test (1) if the starting month of a 1-year sampling campaign can influence Fyw(189) variability and (2) if a “seasonal pattern” can be detected with, for example, larger Fyw(189) results during 1-year periods centered around specific months. To clarify, we did not calculate Fyw on a monthly basis but simply sorted the Fyw(189) results by the month they were assigned to (midpoint of the calculation year; see also explanation above). If the hypothesis is accepted, it would indicate seasonal changes in the Fyw(189) as a function of the start date of a 1-year sampling campaign. This would allow the pre-planning of sampling campaigns to establish comparable Fyw results. However, it is also possible that the hypothesis is accepted if Fyw(189) is constant for all 189 results, as only the intra-month variance matters with this hypothesis. Contrary to the acceptance of the hypothesis, rejecting it for most months would indicate that there are no distinct seasonal patterns imprinted on Fyw(189).
This study does not claim to have found the final rules for judging differences in Fyw but presents one possible way of doing this by using the threshold value of 0.04. An example of a theoretical Fyw time series is given in Fig. 2. All three hypotheses are accepted in this case: the Fyw results are (1) time-invariant, as all are within the average Fyw plus or minus its uncertainty (0.04 in this example), (2) sampling-invariant, as within any 4 weeks the maximum difference of Fyw results is less than 0.04, and (3) seasonally varying, as they show a stable seasonal behavior. Therefore, these results would represent a runoff with a fraction of young water that systematically varies with the start of the sampling campaign, from a catchment with stable environmental conditions and water transport properties and low sampling uncertainties. Under these conditions, starting a 1-year sampling campaign in different seasons will lead to different Fyw results, and one needs to take this into consideration when comparing results from different time periods. However, deciding to wait up to 4 weeks with the start of the campaign will have no impact on Fyw, while in the long term the Fyw can be considered stable.
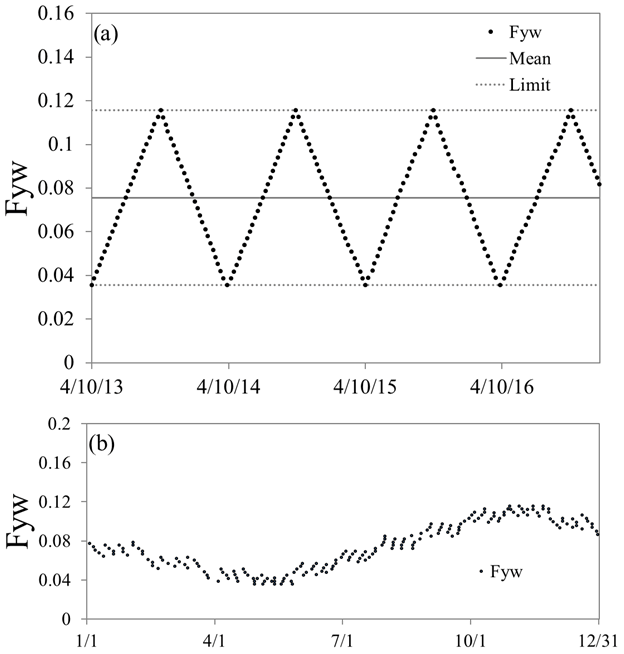
Figure 2(a) Example of a theoretical Fyw time series, where despite the time variance, all three null hypotheses are accepted: (1) more than 90 % of Fyw values lie within ±0.04 of the mean of all values, (2) Fyw does not change more than ±0.04 over the course of 4 weeks, and (3) Fyw for each month does not change more than ±0.04 within a month (b).
3.1 Isotopic and hydrometric data
Precipitation isotope ratios ranged from −3.04 ‰ to −17.80 ‰, spanning a range of 14.76 ‰ in δ18O values. In comparison, streamflow values ranged from −7.78 ‰ to −8.74 ‰, with a range of 0.96 ‰ or only 1∕15th of precipitation values. The volume-weighed groundwater isotope value was ‰. The maximum and minimum air temperatures were 27.0 and −7.4 ∘C, respectively, with a mean value of 7.6 ∘C. Relative humidity ranged from 96.8 % to 32.3 %, with a mean of 82.2 %. All the sampling years except for the winter season 2013–2014 experienced a build-up of snowpack with a mean height of 15 cm. The absence of snow in 2013–2014 correlated with on average higher temperatures (3.5 times the average temperature of the other years) and lower relative humidity (5 % lower average relative humidity compared to the other years). The hydrometeorological and isotope data are presented in more detail in Sect. 3.3.
3.2 Climatological influence on preliminary dataset analysis
Before presenting final Fyw estimates, we briefly introduce the detection and subsequent remedy of a climatological influence on the initial results and uncertainties: the initial Fyw(189) values and their uncertainty increased from July 2014 to December 2015 (Fig. S1 in the Supplement). The uncertainty reached peak values of ± 0.43. Concurrent with this, values dropped close to 0 while being above 0.2 for most other results. The low goodness of fit and the consequential large uncertainty could have been caused by outlier values or extraordinary catchment conditions in Wüstebach. The hydrometeorological and isotopic data pointed to an influence of the 2015 European heat wave (see Supplement). The heat wave was detectable in the Wüstebach catchment by the lowest relative air humidity, second lowest rainfall amounts, lowest runoff coefficient, high temperatures, and the complete disconnection of precipitation and streamflow amplitudes (Fig. S2). In addition, the 2015 European heat wave coincided with the lowest surface water temperatures of the North Atlantic since 1948 (Duchez et al., 2016), which were visible by the loss of the seasonal d-excess signal. This created a situation where several months of precipitation isotope signal did not reach streamflow in Wüstebach. The Fyw method depends on comparable signals in precipitation and streamflow. Consequently, this disconnection of precipitation and streamflow added uncertainty to Fyw estimation. Therefore, we decided to omit the precipitation isotope values between April and July 2015 (11 out of 156 precipitation isotope data; 7 % of the measurements; Fig. 3a), resulting in less Fyw(189) uncertainty (average: 0.08; maximum: 0.31). We did not omit streamflow data during the same period, as it contained Fyw information of the previous 3 months of precipitation, and streamflow sine wave fitting had no impact on Fyw(189) uncertainty (see results of Fig. 4b).
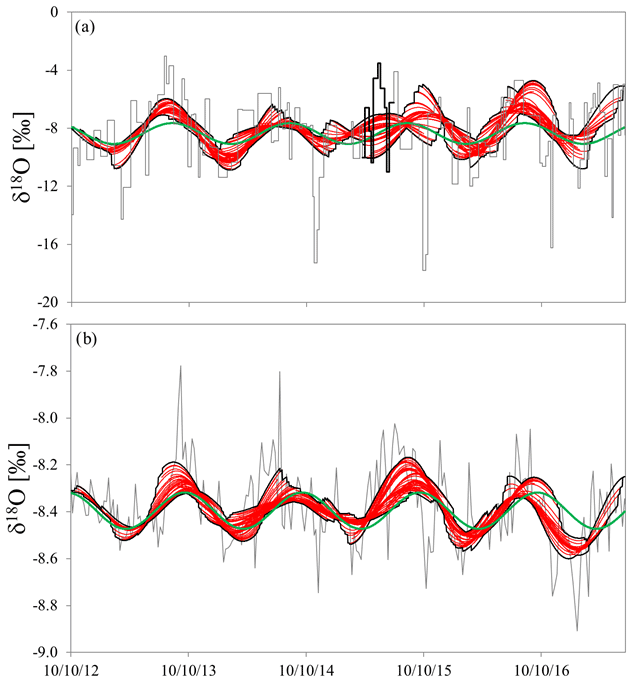
Figure 3Sine waves (red lines) were fitted to (a) throughfall and (b) streamflow stable isotope data (grey line), with maximum and minimum values at each point in time (black enveloping curve). In comparison a single sine wave was fitted to the complete dataset for both throughfall and streamflow (green lines). The omitted precipitation isotope values of the 2015 European summer heat wave are shown in panel (a) with bold black lines.

Figure 4(a) Fyw(189) results and their uncertainty (black and grey lines) plotted against for throughfall (TF R2; solid orange line) and runoff (Q R2; dashed orange line) sine wave fits and their average (mean R2; red line). All values are shown at the midpoint of the respective year they are valid for. Panel (b) shows throughfall amplitudes (TF amplitude) versus the Fyw uncertainty. The regression equation is TF amplitude , with an R2 of 0.79. A similar comparison between runoff amplitudes and Fyw uncertainty showed no relationship (R2 of 0.04; not shown). The inset shows the Fyw uncertainty against mean values of streamflow and precipitation.
3.3 Isotopic and hydrometric data
After omitting summer 2015 precipitation data the sine waves for the whole study period had an of 0.09 for precipitation and 0.23 for streamflow (Fig. 3). The precipitation amplitude AP=0.72 ‰ and the streamflow amplitude AS=0.08 ‰ resulted in a Fyw(all) of 0.12±0.04. Thus, the threshold value for hypothesis testing was chosen as the absolute value 0.04.
The 189 fitted sine waves had a wide range of values: precipitation ranged from −0.02 to 0.63, with a mean of 0.22, and streamflow ranged from 0.00 to 0.55, with a mean of 0.25. The mean (arithmetic average of precipitation and streamflow ) for each calculation year ranged from 0.03 to 0.59, with a mean of 0.24. The sine waves showed strong variations in terms of amplitudes and phase shifts, leading to distinct deviations from the sine wave fitted to the whole time series (Fig. 3). Precipitation amplitudes ranged between 0.35 ‰ and 2.60 ‰, with a mean value of 1.26 ‰, while streamflow amplitudes ranged between 0.03 ‰ and 0.19 ‰, with a mean value of 0.10 ‰. The mean of all streamflow amplitudes was closer to the single sine wave amplitude (0.10 ‰ vs. 0.08 ‰) than those for precipitation (1.26 ‰ vs. 0.72 ‰). If we use the average of the Fyw(189), the result would be 0.09 instead of 0.12 of Fyw(all). This is less than the 0.04 difference in Fyw used by this study. Leaving out the period of low values, the single sine wave and the average of Fyw(189) would both yield approximately 0.07. The overall pattern of the individual peaks was similar to the single sine wave peaks, except for the period of the 2015 European heat wave, when between June and October 2015, a distinct double peak in precipitation was visible. The individual sine waves followed the general pattern of enriched isotopic values during summer months and depleted values in winter.
The mean showed a marked decrease during July 2014 to October 2015, with values falling well below 0.2 (Fig. 4a). Approximately at the same time, the Fyw(189) varied strongly (mean and maximum change between consecutive 1-year windows: 0.02 and 0.12) and the uncertainty was large (mean uncertainty: ±0.11). Contrary to this, during periods of larger the change was more modest (mean and maximum change between consecutive 1-year windows: 0.01 and 0.05) with lower uncertainty (mean uncertainty: ±0.04). To find possible modeling influences on the Fyw(189) uncertainty, we first compared the mean with it and found that they were correlated (Fig. 4b inset; R2=0.65). Following this, we further investigated relationships between Fyw(189) uncertainty and the amplitudes, phase shifts, and vertical shifts of the 189 sine waves but only show results for throughfall amplitudes, as the other parameters had no correlation (Fig. 4b). The throughfall amplitudes were correlated with R2=0.79, while contrary to this streamflow amplitudes had an R2 of 0.04. Thus, the Fyw(189) uncertainty was strongly controlled by the amplitudes of the precipitation sine waves, while the streamflow sine waves barely influenced it.
The baseline for Fyw(189) was around 0.05 (Fig. 4). Before the low period, Fyw(189) was around 0.05, increased to about 0.1 for a short time, and then fell back to 0.05. After the low period, Fyw(189) also fell to about 0.05 before rising in the end. Thus, during the 4.5 years, Fyw(189) values seldom fell below the baseline of 0.05, and we assumed that during any 1-year period the Wüstebach catchment will have at least a 0.05 Fyw. Overall, the Fyw(189) values were positively skewed (Fig. 5). Around 30 % of results indicated a Fyw of 0.06, followed by 55 % of results that indicated a Fyw up to 0.08. Few values are higher than 0.16, with possible outliers between 0.26 and 0.28. Leaving out the period of low values does not change the skewness of the histogram. However, values larger than 0.16 disappeared in favor of 0.06 that shifted from 30 % to 40 % relative frequency.
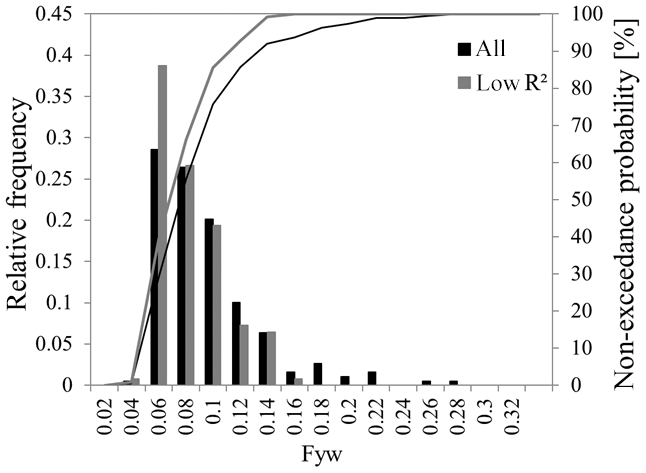
Figure 5Histograms and cumulative distribution functions of all Fyw(189) results (black) and of the results when the low period is left out (low R2; grey).
3.4 Hypothesis 1: time invariance
The mean of Fyw(189) was 0.09. Consequently, 90 % of all Fyw(189) results must lie within 0.05 to 0.13 to accept hypothesis 1; 159 Fyw results (84 % of the 189) were within those boundaries (Fig. 6a). It could be possible that the period between July 2014 and October 2015 with low significantly influenced the rejection of the hypothesis. Therefore, in a second step, we excluded this period, calculated the mean for those values and evaluated the results again (Fig. 6b). The new mean Fyw was 0.07, with 93 % of results found between 0.03 and 0.11. Thus, contrary to using all data, the hypothesis could be accepted if the period of large uncertainty is left out. We then compared the time-variable Fyw(189) to hydrometeorological measurements (Fig. 7) and found that neither temperature nor relative humidity were correlated with it (not shown). While throughfall volume, runoff volume, and snow height were also not correlated (Fig. 7a–c), the runoff coefficient (Q∕P) was negatively correlated with R2=0.25 and (Fig. 7d). Leaving out again the period from July 2014 to October 2015 reduced the correlation to R2=0.08 and .

Figure 6Fyw(189) compared to the mean Fyw (solid grey line) and a ±0.04 margin around it (dotted grey lines) to test hypothesis 1 (90 % of all Fyw results are within the mean Fyw ±0.04). Red data points are periods where within 4 weeks, Fyw differed by more than 0.04 (testing hypothesis 2). Once all data were used (a), subsequently data of the low period between July 2014 and October 2015 were left out (b).

Figure 7Fyw(189) plotted against hydrometric data (red and black dots): (a) throughfall volumes, (b) runoff volumes, (c) snow height, and (d) the runoff coefficient. Red dots are data points where hypothesis 2 was rejected (Fyw does not differ by more than ±0.04 within 4 consecutive weeks).
3.5 Hypothesis 2: sampling invariance
Here we tested if deciding to delay the start of a 1-year sampling campaign up to 4 weeks could influence Fyw(189). The hypothesis is accepted if any four consecutive Fyw(189) results did not differ by more than 0.04. On multiple occasions this rule was violated for the full dataset as well as for the reduced one (discounting the low period), so we rejected hypothesis 2 (Fig. 6). Thus, the start time of a 1-year sampling campaign influenced Fyw(189). The periods when hypothesis 2 was violated were neither equally spaced in time (Fig. 6) nor showed significant correlations to hydrometric (Fig. 7) or meteorological (not shown) variables. The only observation made was that hypothesis 2 seems to have preferentially failed around the 2015 European heat wave.
3.6 Hypothesis 3: seasonal invariance
As mentioned in the methods, the Fyw(189) results were put in the middle of the 1-year calculation period (calculating from February 2016 to February 2017, the result would be displayed as a data point in August 2016). We grouped together all Fyw(189) values that were assigned to a specific calendar month and used a boxplot to detect possible seasonality (Fig. 8). Only in January and February was the difference below 0.04. When leaving out the period with low , January to August stayed within ±0.04. Thus, we also rejected hypothesis 3 based on all data, as our results did not indicate pronounced seasonality. Nonetheless, a trend of declining Fyw(189) from January to June was visible that reversed from July onwards. Additionally, the standard deviation of Fyw(189), the interquartile range of the boxplots, and the number of outliers increased starting with June until October–November. We compared this behavior qualitatively to the start and end time of snow influence in Wüstebach, which usually started in December, and the last melt event happened in February. Since the influence of this delayed signal transmission from precipitation to streamflow does not immediately end with the final snowmelt in February, we assumed that snowmelt still influenced streamflow for the following 2 months, i.e., until April. This comparison showed that calculation years that included one year's winter had lower interquartile ranges, a lower number of outliers, and smaller standard deviations. On the other hand, calculation years that included winters of two different years (e.g., a calculation year starting and ending in December) matched the boxplot results with increased uncertainty (Table 1).
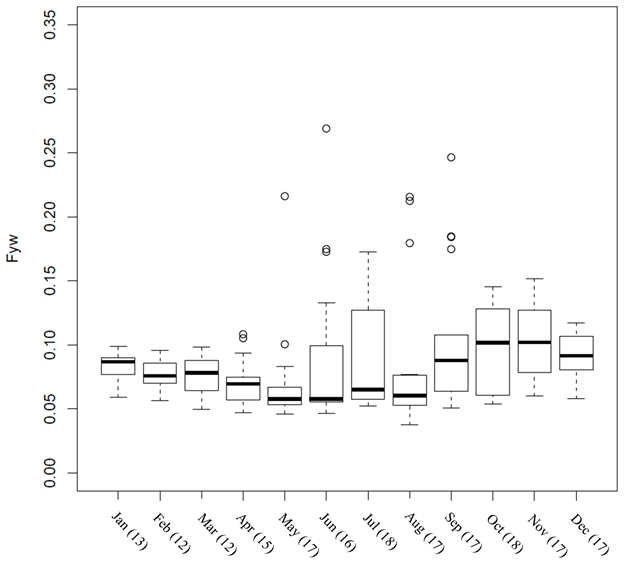
Figure 8Testing hypothesis 3 (Fyw centered around a specific month does not differ by more than ±0.04 within this month): boxplot of all Fyw results of a specific month. Whiskers are the upper and lower 1.5 interquartile range, and circles are outlier values. The number of data points for each month is given in the brackets on the horizontal axis.
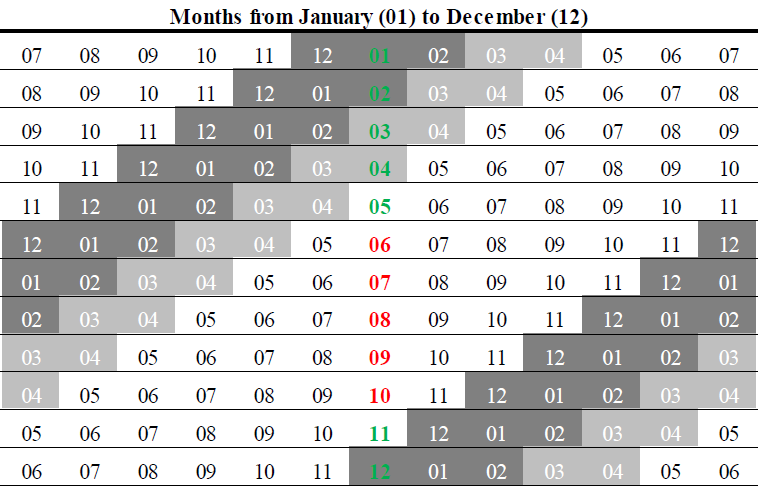
Table 1The calculation years used for the boxplots of Fig. 8. For example, the first row shows a calculation year starting in July and ending in July, where the Fyw result was assigned to January. Grey shaded areas are the usual beginning of snowfall and the final snowmelt (December to February; dark shading), with an assumed prolonged influence of snowmelt on streamflow until April (light shading). Green calculation years highlight snow influence of only one winter within this year, while red calculation years highlight influence of two different winters.
Judging by the isotope data, we generally expect that groundwater was recharged locally from precipitation, as the long-term, volume-weighed δ18O of precipitation with −8.53 ‰ was close to the quasi-constant δ18O of groundwater with a 5-year mean of ‰. Streamflow was substantially comprised of groundwater, as its volume-weighed δ18O was −8.40 ‰, the precipitation isotope signal was strongly attenuated in streamflow, and Fyw(189) values were generally low, which indicates a strong groundwater influence. The study by Weigand et al. (2017) came to the same conclusion for the Wüstebach catchment using wavelet analysis of nitrate and DOC data collected at mainstream and tributary locations. While lower-altitude locations of the catchment near the outlet were dominated by groundwater, higher-altitude areas were less affected. This finding was additionally supported by field observations of shallow groundwater.
4.1 Sine wave fits
The single sine wave fits to all data had low values (0.09 for throughfall and 0.23 for streamflow). Compared to this, the 189 individual sine waves reached a maximum of 0.63 and were often larger than 0.2. This indicated that the single sine wave fit to multi-year data is an oversimplification of the inter-annual variability in meteoric and streamflow isotope data, and annual sine waves better capture the variability. One might argue that sine waves are a non-adequate function to describe the data variability if their is low. However, Fyw estimation is based on comparing sine wave amplitudes (Kirchner, 2016a), and no similar method exists to calculate it with different functions.
Completely undetectable by a single sine wave fit, the 189 sine waves highlighted a hydrologic change in the Wüstebach catchment caused by the 2015 European heat wave: the disconnection of precipitation and runoff. First, the general shapes of the 189 precipitation and 189 streamflow sine waves were similar (Fig. 3), which can be seen, for example, in the positive and negative peaks occurring around September 2014 and 2016 and February 2013 and 2014, respectively. Additionally, throughfall and streamflow amplitudes generally matched each other (Fig. S2a). This indicated that throughout the 4.5-year time series the characteristic of the precipitation δ18O signal was for the most part consistently and quickly transferred to the streamflow δ18O signal within a year. However, the relationship between precipitation and streamflow considerably changed due to the influence of the 2015 European heat wave: while the double peak of the sine fits to the precipitation isotopes in summer 2015 was not transferred to streamflow (Fig. 3), the seasonal cycle amplitudes of the isotopes in streamflow and precipitation lost their close relationship at the same time (Fig. S2a). After the heat wave the general shape of precipitation and streamflow sine waves matched each other again while their respective amplitudes regained their former, albeit weakened, relationship: the large amplitude peak in throughfall in April 2016 again led to increasing streamflow peaks. The 2015 European heat wave greatly disturbed the usually occurring runoff-generation process in Wüstebach, leading to a disconnection of precipitation and streamflow signal.
A fast transmission of precipitation to streamflow was also found by Jasechko et al. (2016), and the fact that a part of precipitation quickly becomes streamflow is already inherent in Fyw. The new insight of the present study is the unexpected close resemblance of the 189 sine waves for precipitation and streamflow, although the groundwater influence seems to have dominated in Wüstebach. The simultaneous strong attenuation of the δ18O streamflow signal while at the same time retaining much of the precipitation δ18O signal characteristics can be explained by mixing with a quasi-constant δ18O source, e.g., with groundwater. This would not alter the pattern but only attenuate the signal. Thus, the 189 sine waves strongly indicated that streamflow in Wüstebach consisted of precipitation and groundwater with no additional, unaccounted sources of runoff such as subsurface flows from outside the catchment boundaries, although additional sources are still theoretically possible. This supports a previous study that closed the water balance for the Wüstebach catchment using only precipitation, evapotranspiration, and runoff data (Graf et al., 2014) and is essential information for, for example, endmember-mixing analysis (Barthold et al., 2011; Katsuyama et al., 2001) or isotope hydrograph separation (Klaus and McDonnell, 2013). The 189 sine wave fits to precipitation and streamflow isotope data facilitated finding this hydrological information about the Wüstebach catchment.
4.2 Fraction of young water
The fact that the average of Fyw(189) was within the ±0.04 boundary of Fyw(all) (0.09 vs. 0.12) indicated that the single sine wave generally averaged the behavior of the 189 ones. If the isotope data and Fyw(189) results of the period of low values were left out, the average Fyw of the 189 sine waves compared even better to Fyw(all) (approximately 0.07 in both cases). Thus, if a study is interested in the overall behavior of a multi-year time series, a single sine wave fit would seem sufficient. Nevertheless, hypothesis 1 was rejected, as Fyw(189) varied within this multi-year time series (Fig. 6). Using a moving time window to calculate a host of Fyw values ensures that the entire range of possible Fyw estimates is considered with an average estimate and most importantly its uncertainty.
Most of the isotope data between 7 d calculation window shifts were the same. Still, during the low period, Fyw(189) occasionally fluctuated on the order of 0.12 between 1-week shifts. From a hydrological standpoint, it is difficult to imagine a short-term change in flow paths of this magnitude for annual averages. Given that the Fyw calculation is based on comparing the amplitudes of precipitation and streamflow and a low indicates a weak fit to a sine wave shape, we assumed that in our case the Fyw calculation method reached its limit below an average of . Fyw(189) became highly sensitive to a small change in input data and, in consequence, highly uncertain. We recommend further investigations of the sensitivity of Fyw to the goodness of fit (not necessarily only measured with for future studies. It remains to be seen if a value of 0.2 for is a general critical threshold for Fyw or if different catchments show varying results. Such studies should consider that the Fyw uncertainty was correlated with throughfall amplitudes (Fig. 4b), raising the question of whether a curve fit with is objectively better than a fit with when the underlying isotope data have completely different amplitudes. A decrease in the goodness of fit of the sine wave when amplitudes are low was also found by Lutz et al. (2018).
A difference of ±0.04 was defined as the threshold value for differences in Fyw(189) by this study. The acceptance or rejection of our null hypotheses will thus inform if the time variability in Fyw(189) is large in comparison to Fyw(all) and its uncertainty. We recommend using different thresholds that are suited to the purpose of calculating a Fyw estimate. Purposes can range from any application of the method to answer questions about the quantity and quality of water resources for various industrial, touristic, or infrastructural uses. First, a critical difference in Fyw should be defined by each application that reflects, for example, the vulnerability of aquatic ecosystems to certain pollutant loads. If an increase or decrease by less than this value does not impact the results of a risk assessment, for example, then these Fyw changes are negligible for the practical purpose at hand. The present study did not aim to answer any specific question related to Fyw that would justify setting a threshold value a priori but investigated the time variability in Fyw and used the uncertainty as its threshold value. Thus, the results of the hypothesis tests might change completely if we answer practical questions about Wüstebach, such as the vulnerability to pollutant loads of a certain chemical substance. Choosing different rules for the acceptance or rejection of our hypotheses has a large impact on the results. The hypotheses and rules of acceptance should be fitted to the task at hand, and we urge further studies to investigate appropriate rules for the practical usage of Fyw, as we do not claim to have found the absolute answer in deciding which Fyw results are different and which are not.
The 2015 European heat wave was among the top 10 heat waves of the past 65 years and was accompanied by the lowest surface water temperatures of the North Atlantic in the period of 1948 to 2015 (Duchez et al., 2016). The North Atlantic influences the European summer climate (Ghosh et al., 2017) and is an important vapor source for precipitation over Europe (Hurrell, 1995; Trigo et al., 2004). The combined effects of low ocean water temperatures and high air temperatures in Europe were visible in the d excess that lost its clear seasonal signal in summer 2015 (Fig. S2d). The d excess of precipitation samples is strongly controlled by the relative humidity of the moisture source (Pfahl and Sodemann, 2014; Steen-Larsen et al., 2014), which in turn would change with changing surface water temperatures and thus changing evaporation rates. Additionally, the increased European air temperatures during the heat wave would increase secondary evaporation of falling raindrops, further altering the d excess of precipitation samples. The North Atlantic and European temperature anomalies of 2015 explain the behavior of the d excess as well as the unusual double peak of the 189 sine waves that was observed for summer 2015 in Wüstebach.
Apart from affecting the isotopic input signal into the Wüstebach catchment, the temperature anomalies of 2015 also changed the hydrological behavior of Wüstebach: precipitation was largely disconnected from streamflow, and the isotopic signal was not transferred (Fig. S2a–c). This directly increased Fyw(189) uncertainty during this period. Future studies must be careful in comparing Fyw estimates of different time periods, especially if a heat wave occurred during those periods. We assume that mostly small headwater catchments with shallow soils are strongly affected by this effect but do not exclude the possibility of other catchments being affected in varying degrees too. It is highly advisable to investigate further in this direction, as the probability of heat waves in the period from 2021 to 2040 is poised to increase (Russo et al., 2015). This, by extension, means that the probability of getting highly uncertain Fyw results will increase too. We argue that heat waves are actively disturbing the estimation of Fyw by potentially decoupling the input from the output isotope signal. This can be more clearly illustrated by the theoretical worst-case scenario: the decoupling of precipitation and streamflow signal for a full year and streamflow being solely fed by another source, e.g., groundwater. Why, in this case, would we trust the Fyw result, no matter the magnitude of the uncertainty and goodness of fit of the sine wave? Thus, it is reasonable to assume that any amount of decoupling will add uncertainty to Fyw, as demonstrated by our data and results. Only by comparison to other time frames where the uncertainty was smaller was it possible for us to detect that the uncertainties for summer 2015 were unusually large.
4.3 Hypothesis 1 – Fyw is time-variant
Hypothesis 1 was rejected because the Fyw varied in the long term. For example, in December 2013, Fyw was 0.06, while 2 months later it increased to 0.1, almost doubling. From summer 2016 to the end of the time series, Fyw even tripled, from 0.06 to 0.15. These differences in Fyw results complicate catchment comparisons, as the result does not only depend on catchment characteristics but also on when isotope data were collected. As far as we can tell, the recent Fyw catchment comparison study of Lutz et al. (2018) used the same sampling period for precipitation and streamflow for all 24 investigated catchments. In contrast, the studies of Jasechko et al. (2016) and von Freyberg et al. (2018) had isotope sampling periods varying in start date and overall length for the 254 and 22 investigated catchments, respectively, potentially influencing the uncertainty for the inter-catchment comparison according to the results of our study.
In the Wüstebach catchment the baseline for Fyw(189) was around 0.05. This lower boundary is useful in assessing pollutant risk and nutrient loss in the catchment, as it defines a minimum expected load that will quickly appear in the stream if combined with precipitation volumes and chemical substance concentrations. The lower boundary of this study is only valid for the Wüstebach catchment, as other catchments might have different lower Fyw boundaries.
The variability in Fyw(189) of this study could not be explained by meteorological or hydrometric variables. Lutz et al. (2018) found a negative correlation between annual precipitation and Fyw. The study of 22 Swiss catchments by von Freyberg et al. (2018) found significant positive correlations between Fyw and mean monthly discharge and precipitation volumes. Fyw(189) of this study neither correlated with precipitation nor with runoff (Fig. 7a and b). Such contradictions could be explained by the different sampling periods of our study and the mentioned studies but also by differing catchment characteristics. Additionally, the present study investigated the same catchment temporally, while the other studies investigated spatially different catchments. Furthermore, Lutz et al. (2018) found complex interactions between several catchment characteristics and Fyw, possibly resulting in nonsignificant linear regressions between Fyw and individual catchment characteristics. However, the runoff coefficient Q∕P was negatively correlated with Fyw(189) (Fig. 7d). Physically, this could be explained by the fact that if annual runoff volumes increase per annual precipitation volume, then the additional runoff volumes were provided by catchment storage. This increased the percentage of old water in streamflow and relatively decreased the Fyw(189), since catchment storage consists of old water (Gabrielli et al., 2018).
4.4 Hypothesis 2 and 3 – Fyw is sensitive to sampling and has no clear seasonal pattern
While hypothesis 1 concentrated on long-term changes, hypothesis 2 focused on short-term changes where choosing to start a 1-year sampling campaign 1 to 4 weeks later could lead to different results. On several occasions, Fyw(189) differed more than ±0.04 within 4 weeks (Fig. 6). This means that the choice of the sampling period has a large potential for uncertainty in the Fyw estimates for studies that can monitor the water stable isotopes in precipitation and streamflow for only 1 year. The obtained Fyw could be a potential outlier, a larger value, or part of a theoretical Fyw baseline. As the timing of the violation of hypothesis 2 did not correlate with any meteorological or hydrometric data, it was not possible to determine the conditions under which the sampling period led to higher Fyw(189) uncertainty. A relationship with the 2015 European heat wave is possible, albeit not fully evident. Nonetheless, as discussed above, the choice of another threshold value besides ±0.04 may lead to an increase in the number of short-term Fyw(189) changes. The results of this study indicate that estimating Fyw with data of a single year might not be enough for fully understanding catchment behavior. Quoting Kirchner et al. (2004): “If we want to understand the full symphony of catchment hydrochemical behavior, then we need to be able to hear every note”. A single Fyw result is one note in the symphony of potential Fyw results in multi-year datasets.
Fyw(189) did not have a clear seasonal pattern in that not all the months had differences of less than ±0.04 (Fig. 8). A pattern was nonetheless visible with larger Fyw(189) values with less uncertainty when the sampling campaign was centered around winter months compared to lower Fyw(189) values with larger uncertainties when the campaign was centered around summer months. Thus, the starting month of a 1-year sampling campaign did influence Fyw(189) variability, and 1-year periods centered around winter months led to generally larger values in our study. The behavior of Fyw(189) uncertainty can potentially be explained by the influence of snow and is similar to the proposed problem that the 2015 European heat wave introduced: a tracer signal in precipitation and streamflow that does not have any instantaneous connection with its counterpart streamflow and precipitation. This disconnection by snow could be explained by the longer delay in signal transmission of snowfall compared to rainfall due to snowpack build-up. Consider a winter at the start of a sampling campaign: it is likely that streamflow will feature the snowmelt isotope signal originating from snowfall of, for example, several weeks ago that is not featured in the precipitation isotope data of this calculation year. Currently, we recommend that if studies can only sample 1 year of data in snow-influenced catchments, they should not sample winters of two different calendar years and should design the sampling such that only one year's winter is in the time series. Future studies should provide more evidence if Fyw calculated by 1 year of isotope data shows a seasonal behavior or not and how snow influences the uncertainty. We highly recommend calculating a time series of Fyw, e.g., with the method of this study, to understand the temporal behavior of Fyw for the investigated catchment and to be able to evaluate possible uncertainties for Fyw estimation.
A difference in Fyw when only 1 year of isotope data are available was also observed by Stockinger et al. (2017) for the same catchment using only two calculation years without any further investigations in this direction, as it was not the main objective of their study to investigate Fyw time variability and uncertainty. Only two Fyw values were calculated in contrast to the 189 results of the present study. This low number of results made it impossible to investigate possible causes of varying Fyw results and to judge if those results were the rule or an exception. Fyw values for these years were 0.06 and 0.13, respectively. The authors assumed that using the complete time series averages sub-sets of the time series as the Fyw for the whole time series was approximately 0.13, so in between 0.06 and 0.13. However, this happened by coincidence. The present study shows that the two Fyw values could have been very different, e.g., both near 0.05. Then, the Fyw of the whole time series would not have averaged the results of the two individual years. Thus, only the complete picture of all 189 individual Fyw(189) results allowed a better judgment of time variability and uncertainty. With knowledge from the current study, we would even consider one of the hydrological calculation years of Stockinger et al. (2017) to be highly uncertain and possibly influenced by the 2015 European heat wave.
The fraction of young water (Fyw) is a promising new measure to estimate the fast transport of precipitation through a catchment to the stream. To calculate Fyw, sine waves are fitted to the water stable isotopes in precipitation and streamflow and their respective amplitudes compared. This is usually done for the complete time series available, ranging from less than a year to multiple years. This study used a moving 1-year window to investigate the temporal variance in Fyw and its uncertainty for a 4.5-year time series. Using 189 Fyw results instead of a single multi-year one, we were able to increase our hydrometeorological knowledge about the study catchment: (1) a potential strong influence of the 2015 European heat wave on Fyw estimates and uncertainties was discovered, which is a problem which could be magnified in the future when considering global warming, and (2) a lower boundary for Fyw was found, aiding, for example, pollutant risk studies in calculating minimum expected loads. Testing three hypotheses about the time variability in Fyw(189), we found that both in the long term and short term, Fyw(189) was time-variable as defined by this study by the ±0.04 threshold, while showing no clear seasonal pattern. The long-term variability has implications for catchment comparison studies when different time periods are investigated. Short-term variability indicated a potentially high sensitivity to the sampling period, where a shift of 1–4 weeks in the start of a 1-year sampling campaign influenced Fyw. No pronounced seasonality of Fyw(189) could be derived. However, a possible influence of snowpack led to the recommendation of sampling one year's winter and avoiding sampling the winters of two different years. If feasible, we recommend investigating a multi-year time series of tracer data with the method suggested in this study to enhance our knowledge of the sensitivity of Fyw to the chosen time frame in different catchment situations and the behavior of its uncertainty – that is, to use a 1-year moving time window and estimate an ensemble of Fyw results and its uncertainty. Based on the goodness of fit for all 189 calculated sine waves and the corresponding Fyw(189) behavior, we recommend considering that Fyw based on below 0.2 might be highly uncertain. This must be verified by other dedicated studies of different catchments and would allow for a better comparability of Fyw results with various goodness of fits. The present study shows the importance of considering inter-annual fluctuations in the amplitudes of isotope tracer data and consequently of derived Fyw estimates in further learning about the uncertainty of Fyw and in aiding in catchment comparison studies.
The data used in this study can be acquired from the corresponding author.
The supplement related to this article is available online at: https://doi.org/10.5194/hess-23-4333-2019-supplement.
MPS designed the study and carried out the calculations. HRB, AL, CS, and HV contributed to the interpretation of results, and all authors contributed to the writing of the paper.
The authors declare that they have no conflict of interest.
We gratefully acknowledge the support by the SFB-TR32 “Patterns in Soil-Vegetation-Atmosphere Systems: Monitoring, Modelling, and Data Assimilation” funded by the Deutsche Forschungsgemeinschaft (DFG) and TERENO (Terrestrial Environmental Observatories) funded by the Helmholtz-Gemeinschaft. Holger Wissel, Werner Küpper, Rainer Harms, Ferdinand Engels, Leander Fürst, Sebastian Linke, and Isabelle Fischer are thanked for supporting the isotope analysis, sample collection, and the ongoing maintenance of the experimental setup. We appreciate the helpful comments of four anonymous reviewers that greatly improved the present study and the work of editor Patricia Saco. We additionally thank Giuseppe Brunetti for proofreading the paper.
This research has been supported by the Deutsche Forschungsgemeinschaft (grant no. SFB TR 32).
The article processing charges for this open-access
publication were covered by a Research
Centre of the Helmholtz Association.
This paper was edited by Patricia Saco and reviewed by four anonymous referees.
Barthold, F. K., Tyralla, C., Schneider, K., Vaché, K. B., Frede, H. G., and Breuer, L.: How many tracers do we need for end member mixing analysis (EMMA)? A sensitivity analysis, Water Resour. Res., 47, W08519, https://doi.org/10.1029/2011WR010604, 2011.
Bogena, H. R., Montzka, C., Huisman, J. A., Graf, A., Schmidt, M., Stockinger, M., von Hebel, C., Hendricks-Franssen, H. J., van der Kruk, J., Tappe, W., Lücke, A., Baatz, R., Bol, R., Groh, J., Pütz, T., Jakobi, J., Kunkel, R., Sorg, J., and Vereecken, H.: The TERENO-Rur Hydrological Observatory: A Multiscale Multi-compartment Research Platform for the Advancement of Hydrological Science, Vadose Zone J., 17, 1–22, https://doi.org/10.2136/vzj2018.03.0055, 2018.
Bourgault, R. R., Ross, D. S., Bailey, S. W., Bullen, T. D., McGuire, K. J., and Gannon, J. P.: Redistribution of soil metals and organic carbon via lateral flowpaths at the catchment scale in a glaciated upland setting, Geoderma, 307, 238–252, 2017.
Brand, W. A., Coplen, T. B., Vogl, J., Rosner, M., and Prohaska, T.: Assessment of international reference materials for isotope-ratio analysis (IUPAC Technical Report), Pure Appl. Chem., 86,, 425–467, 2014.
Christidis, N., Jones, G. S., and Stott, P. A.: Dramatically increasing chance of extremely hot summers since the 2003 European heatwave, Nat. Clim. Change, 5, 46–50, https://doi.org/10.1038/nclimate2468, 2015.
Craig, H.: Isotopic variations in meteoric waters, Science, 133, 1702–1703, 1961.
Dansgaard, W.: Stable isotopes in precipitation, Tellus A, 16, 436–468, https://doi.org/10.1111/j.2153-3490.1964.tb00181.x, 1964.
Duchez, A., Frajka-Williams, E., Josey, S. A., Evans, D. G., Grist, J. P., Marsh, R., McCarthy, G. D., Sinha, B., Berry, D. I., and Hirschi, J. J. M.: Drivers of exceptionally cold North Atlantic Ocean temperatures and their link to the 2015 European heat wave, Environ. Res. Lett., 11 074004, https://doi.org/10.1088/1748-9326/11/7/074004, 2016.
Etmann, M.: Dendrologische Aufnahmen im Wassereinzugsgebiet Oberer Wüstebach anhand verschiedener Mess- und Schätzverfahren, MS thesis, Institut für Landschaftsökologie, University of Münster, Münster, Germany, 2009.
Gabrielli, C. P., Morgenstern, U., Stewart, M. K., and McDonnell, J. J.: Contrasting groundwater and streamflow ages at the Maimai watershed, Water Resour. Res., 54, 3937–3957, https://doi.org/10.1029/2017WR021825, 2018.
Gannon, J. P., McGuire, K. J., Bailey, S. W., Bourgault, R. R., and Ross, D. S.: Lateral water flux in the unsaturated zone: a mechanism for the formation of spatial soil heterogeneity in a headwater catchment, Hydrol. Process., 31, 3568–3579, https://doi.org/10.1002/hyp.11279, 2017.
Ghosh, R., Müller, W. A., Baehr, J., and Bader, J.: Impact of observed North Atlantic multidecadal variations to European summer climate: a linear baroclinic response to surface heating, Clim. Dynam., 48, 3547, https://doi.org/10.1007/s00382-016-3283-4, 2017.
Gottselig, N., Bol, R., Nischwitz, V., Vereecken, H., Amelung, W., and Klumpp, E.: Distribution of phosphorus-containing fine colloids and nanoparticles in stream water of a forest catchment, Vadose Zone J., 13, 1–11, https://doi.org/10.2136/vzj2014.01.0005, 2014.
Graf, A., Bogena, H. R., Drüe, C., Hardelauf, H., Pütz, T., Heinemann, G., and Vereecken, H.: Spatiotemporal relations between water budget components and soil water content in a forested tributary catchment, Water Resour. Res., 50, 4837–4857, https://doi.org/10.1002/2013WR014516, 2014.
Harman, C. J.: Time-variable transit time distributions and transport: Theory and application to storage-dependent transport of chloride in a watershed, Water Resour. Res., 51, 1–30, https://doi.org/10.1002/2014WR015707, 2015.
Heidbüchel, I., Troch, P. A., and Lyon, S. W.: Separating physical and meteorological controls of variable transit times in zero-order catchments, Water Resour. Res., 49, 7644–7657, https://doi.org/10.1002/2012WR013149, 2013.
Hurrell, J. W.: Decadal trends in the North Atlantic oscillation: Regional temperatures and precipitation, Science, 269, 676–679, 1995.
Jasechko, S., Kirchner, J. W., Welker, J. M., and McDonnell, J. J.: Substantial proportion of global streamflow less than three months old, Nat. Geosci., 9, 126–129, 2016.
Katsuyama, M., Ohte, N., and Kobashi, S.: A three-component end-member analysis of streamwater hydrochemistry in a small Japanese forested headwater catchment, Hydrol. Process., 15, 249–260, 2001.
Kirchner, J. W.: Aggregation in environmental systems – Part 1: Seasonal tracer cycles quantify young water fractions, but not mean transit times, in spatially heterogeneous catchments, Hydrol. Earth Syst. Sci., 20, 279–297, https://doi.org/10.5194/hess-20-279-2016, 2016a.
Kirchner, J. W.: Aggregation in environmental systems – Part 2: Catchment mean transit times and young water fractions under hydrologic nonstationarity, Hydrol. Earth Syst. Sci., 20, 299–328, https://doi.org/10.5194/hess-20-299-2016, 2016b.
Kirchner, J. W., Feng, X., Neal, C., and Robson, A. J.: The fine structure of water-quality dynamics: the (high-frequency) wave of the future, Hydrol. Process., 18, 1353–1359, https://doi.org/10.1002/hyp.5537, 2004.
Klaus, J. and McDonnell, J. J.: Hydrograph separation using stable isotopes: review and evaluation, J. Hydrol., 505, 47–64, 2013.
Lutz, S. R., Krieg, R., Müller, C., Zink, M., Knöller, K., Samaniego, L., and Merz, R.: Spatial patterns of water age: Using young water fractions to improve the characterization of transit times in contrasting catchments, Water Resour. Res., 54, 4767–4784, https://doi.org/10.1029/2017WR022216, 2018.
McGuire, K. J. and McDonnell, J. J.: A review and evaluation of catchment transit time modeling, J. Hydrol., 330, 543–563, 2006.
Merlivat, L. and Jouzel, J.: Global climatic interpretation of the deuterium-oxygen 18 relationship for precipitation, J. Geophys.Res., 84, 5029–5033, 1979.
Miyata, S., Kosugi, K., Gomi, T., and Mizuyama, T.: Effects of forest floor coverage on overland flow and soil erosion on hillslopes in Japanese cypress plantation forests, Water Resour. Res., 45, W06402, https://doi.org/10.1029/2008WR007270, 2009.
Ogrinc, N., Kanduč, T., Stichler, W., and Vreča, P.: Spatial and seasonal variations in δ18O and δD values in the River Sava in Slovenia, J. Hydrol., 359, 303–312, https://doi.org/10.1016/j.jhydrol.2008.07.010, 2008.
Pendergrass, A. G. and Hartmann, D. L.: Changes in the distribution of rain frequency and intensity in response to global warming, J. Climate, 27, 8372–8383, https://doi.org/10.1175/JCLI-D-14-00183.1, 2014.
Pfahl, S. and Sodemann, H.: What controls deuterium excess in global precipitation?, Clim. Past, 10, 771–781, https://doi.org/10.5194/cp-10-771-2014, 2014.
Russo, S., Sillmann, J., and Fischer, E. M.: Top ten European heatwaves since 1950 and their occurrence in the coming decades, Environ. Res. Lett., 10, 124003, https://doi.org/10.1088/1748-9326/10/12/124003, 2015.
Song, C., Wang, G., Liu, G., Mao, T., Sun, X., and Chen, X.: Stable isotope variations of precipitation and streamflow reveal the young water fraction of a permafrost watershed, Hydrol. Process., 31, 935–947, https://doi.org/10.1002/hyp.11077, 2017.
Steen-Larsen, H. C., Sveinbjörnsdottir, A. E., Peters, A. J., Masson-Delmotte, V., Guishard, M. P., Hsiao, G., Jouzel, J., Noone, D., Warren, J. K., and White, J. W. C.: Climatic controls on water vapor deuterium excess in the marine boundary layer of the North Atlantic based on 500 days of in situ, continuous measurements, Atmos. Chem. Phys., 14, 7741–7756, https://doi.org/10.5194/acp-14-7741-2014, 2014.
Stockinger, M. P., Bogena, H. R., Lücke, A., Diekkrüger, B., Weiler, M., and Vereecken, H.: Seasonal soil moisture patterns: Controlling transit time distributions in a forested headwater catchment, Water Resour. Res., 50, 5270–5289, https://doi.org/10.1002/2013WR014815, 2014.
Stockinger, M. P., Lücke, A., McDonnell, J. J., Diekkrüger, B., Vereecken, H., and Bogena, H. R.: Interception effects on stable isotope driven streamwater transit time estimates, Geophys. Res. Lett., 42, 5299–5308, 2015.
Stockinger, M. P., Bogena, H. R., Lücke, A., Diekkrüger, B., Cornelissen, T., and Vereecken, H.: Tracer sampling frequency influences estimates of young water fraction and streamwater transit time distribution, J. Hydrol., 541, 952–964, https://doi.org/10.1016/j.jhydrol.2016.08.007, 2016.
Stockinger, M. P., Lücke, A., Vereecken, H., and Bogena, H. R.: Accounting for seasonal isotopic patterns of forest canopy intercepted precipitation in streamflow modeling, J. Hydrol., 555, 31–40, https://doi.org/10.1016/j.jhydrol.2017.10.003, 2017.
Tetzlaff, D., Seibert, J., and Soulsby, C.: Inter-catchment comparison to assess the influence of topography and soils on catchment transit times in a geomorphic province; the Cairngorm mountains, Scotland, Hydrol. Process., 23, 1874–1886, 2009a.
Tetzlaff, D., Seibert, J., McGuire, K. J., Laudon, H., Burn, D. A., Dunn, S. M., and Soulsby, C.: How does landscape structure influence catchment transit time across different geomorphic provinces?, Hydrol. Process., 23, 945–953, 2009b.
Trenberth, K. E.: Changes in precipitation with climate change, Clim. Res., 47, 123–138, https://doi.org/10.3354/cr00953, 2011.
Trigo, R. M., Pozo-Vazquez, D., Osborn, T. J., Castro-Diez, Y., Gamiz-Fortis, S., and Esteban-Parra, M. J.: North Atlantic oscillation influence on precipitation, river flow and water resources in the Iberian Peninsula, Int. J. Climatol., 24, 925–944, 2004.
Tsuboyama, Y., Sidle, R. C., Noguchi, S., and Hosoda, I.: Flow and solute transport through the soil matrix and macropores of a hillslope segment, Water Resour. Res., 30, 879–890, 1994.
von Freyberg, J., Allen, S. T., Seeger, S., Weiler, M., and Kirchner, J. W.: Sensitivity of young water fractions to hydro-climatic forcing and landscape properties across 22 Swiss catchments, Hydrol. Earth Syst. Sci., 22, 3841–3861, https://doi.org/10.5194/hess-22-3841-2018, 2018.
Weigand, S., Bol, R., Reichert, B., Graf, A., Wiekenkamp, I., Stockinger, M., Luecke, A., Tappe, W., Bogena, H., Puetz, P., Amelung, W., and Vereecken, H.: Spatiotemporal analysis of dissolved organic carbon and nitrate in waters of a forested catchment using wavelet analysis, Vadose Zone J., 16, 3, https://doi.org/10.2136/vzj2016.09.0077, 2017.
Wiekenkamp, I., Huisman, J. A., Bogena, H. R., Lin, H. S., and Vereecken, H.: Spatial and temporal occurrence of preferential flow in a forested headwater catchment, J. Hydrol., 534, 139–149, https://doi.org/10.1016/j.jhydrol.2015.12.050, 2016a.
Wiekenkamp, I., Huisman, J. A., Bogena, H., Graf, A., Lin, H., Drüe, C., and Vereecken, H.: Changes in Spatiotemporal Patterns of Hydrological Response after Partial Deforestation, J. Hydrol., 542, 648–661, https://doi.org/10.1016/j.jhydrol.2016.09.037, 2016b.
Wilusz, D. C., Harman, C. J., and Ball, W. P.: Sensitivity of catchment transit times to rainfall variability under present and future climates, Water Resour. Res., 53, 10231–10256, https://doi.org/10.1002/2017WR020894, 2017.
Zacharias, S., Bogena, H. R., Samaniego, L., Mauder, M., Fuß, R., Pütz, T., Frenzel, M., Schwank, M., Baessler, C., Butterbach-Bahl, K., Bens, O., Borg, E., Brauer, A., Dietrich, P., Hajnsek, I., Helle, G., Kiese, R., Kunstmann, H., Klotz, S., Munch, J. C., Papen, H., Priesack, E., Schmid, H. P., Steinbrecher, R., Rosenbaum, U., Teutsch, G., and Vereecken, H.: A Network of Terrestrial Environmental Observatories in Germany, Vadose Zone J., 10, 955–973, 2011.