the Creative Commons Attribution 4.0 License.
the Creative Commons Attribution 4.0 License.
Statistical characteristics of raindrop size distribution during rainy seasons in the Beijing urban area and implications for radar rainfall estimation
Yu Ma
Guangheng Ni
Chandrasekar V. Chandra
Fuqiang Tian
Raindrop size distribution (DSD) information is fundamental in understanding the precipitation microphysics and quantitative precipitation estimation, especially in complex terrain or urban environments which are known for complicated rainfall mechanism and high spatial and temporal variability. In this study, the DSD characteristics of rainy seasons in the Beijing urban area are extensively investigated using 5-year DSD observations from a Parsivel2 disdrometer located at Tsinghua University. The results show that the DSD samples with rain rate < 1 mm h−1 account for more than half of total observations. The mean values of the normalized intercept parameter (log 10Nw) and the mass-weighted mean diameter (Dm) of convective rain are higher than that of stratiform rain, and there is a clear boundary between the two types of rain in terms of the scattergram of log 10Nw versus Dm. The convective rain in Beijing is neither continental nor maritime, owing to the particular location and local topography. As the rainfall intensity increases, the DSD spectra become higher and wider, but they still have peaks around diameter D∼0.5 mm. The midsize drops contribute most towards accumulated rainwater. The Dm and log 10Nw values exhibit a diurnal cycle and an annual cycle. In addition, at the stage characterized by an abrupt rise of urban heat island (UHI) intensity as well as the stage of strong UHI intensity during the day, DSD shows higher Dm values and lower log 10Nw values. The localized radar reflectivity (Z) and rain rate (R) relations (Z=aRb) show substantial differences compared to the commonly used NEXRAD relationships, and the polarimetric radar algorithms R(Kdp), R(Kdp, ZDR), and R(ZH, ZDR) show greater potential for rainfall estimation.
- Article
(4554 KB) - Full-text XML
-
Supplement
(499 KB) - BibTeX
- EndNote
Raindrop size distribution (DSD) provides fundamental information on precipitation microphysics. Understanding the DSD variability is of great importance in remote sensing observations of precipitation and microphysical parameterizations in numerical weather prediction (NWP) models. For example, the DSD serves as a fundamental bridge in deriving the Z–R relationships used by ground-based weather radar (Battan, 1973; Uijlenhoet and Stricker, 1999) and spaceborne radar (i.e., TRMM PR: Iguchi et al., 2000; and GPM DPR: Hou et al., 2014) for quantitative precipitation estimation (QPE). The NWP systems coupled with various DSD models can capture more detailed horizontal and/or vertical rainfall information so as to improve the accuracy of precipitation predictions (Abel and Boutle, 2012; Fadnavis et al., 2014; McFarquhar et al., 2015; Saleeby and Cotton, 2004). In addition, the DSD is highly related to the kinetic energy of rainfall that has substantial impact on the soil erosions (Angulo-Martinez and Barros, 2015; Caracciolo et al., 2011; Ellison, 1945; Kinnell, 2005; Lim et al., 2015), which is critical to further understanding of the runoff processes and mitigation of subsequent flood hazards (Angulo-Martinez and Barros, 2015; Smith et al., 2009).
Numerous studies have been devoted to the statistical characteristics of DSD worldwide. It is found that the DSD characteristics vary with geographical locations, climate regimes, seasons, rain types, and even diurnal cycles (Dolan et al., 2018; Ji et al., 2019; Seela et al., 2018; Tokay and Short, 1996; L. Wen et al., 2017). Dolan et al. (2018) classified the global DSD characteristics into six groups by analyzing 12 global disdrometer datasets across three latitudes using principal component analysis. They found that the physical processes shaping the DSD characteristics were likely to vary as a function of location. The comparison of DSD in northern and southern China in Tang et al. (2014) showed that there was a clear difference in precipitation microphysical parameters between different regimes during convective rain, while the difference was less notable for stratiform events. The DSD analysis in Beijing (G. Wen et al., 2017) and Taiwan (Seela et al., 2018) also indicated that there were significant differences in DSD between summer and winter rainfall, and both showed the diurnal variation. In addition, the DSD may exhibit high variability in special weather systems. For example, DSD of the tropical cyclones has a higher concentration of small and middle size drops as well as a lower mass-weighted mean diameter (i.e., Dm) in all types of rain compared with the non-tropical cyclone in Darwin (Deo and Walsh, 2016).
Beijing, the capital of China, is a very densely populated metroplex with a population higher than 21 million. It is more vulnerable to extreme weather events such as torrential rainfall and floods (Zhang et al., 2013). Since the hydrology response in urban areas is sensitive to the spatial and temporal variability of rainfall (Cristiano et al., 2017), rainfall monitoring networks with high temporal and spatial resolution (e.g., dense network of automatic weather stations by de Vos et al., 2017; remote sensing network described by Chen and Chandrasekar, 2015, and Cifelli et al., 2018) have been established in several metropolitan areas. The rapid urbanization and complex topography have further exacerbated the high variability of precipitation in the Beijing urban area, posing challenges to precipitation observations and forecast (Song et al., 2014; Yang et al., 2013a, 2016). This also highlights the importance of understanding local DSD characteristics to better quantify the urban precipitation.
Several studies on DSD characteristics in the Beijing area have been conducted. Tang et al. (2014) studied the DSD characteristics and the polarimetric radar parameters for convective and stratiform rain from July to October 2008 and compared with other regions using a first-generation laser-based optical Particle Size and Velocity (Parsivel1) disdrometer manufactured by OTT Messtechnik, Germany. G. Wen et al. (2017) investigated the statistical properties of summer and winter precipitation in Beijing, including the bulk properties, raindrop fall velocity, axis ratio, and DSD, using a two-dimensional video disdrometer (2DVD) and a micro-rain radar (MRR). Ji et al. (2019) analyzed the microphysical structure of DSD using 14-month DSD measurements from a second-generation Particle Size and Velocity (Parsivel2) disdrometer in Beijing.
However, these studies are mainly focused on summer time (June–September or July–October) or with very limited measurements from one season or two, which are not sufficient to represent local DSD characteristics, especially the monthly variability, during the rainy seasons ranging from May to October. In addition, the impacts of the urban heat island (UHI) effect on rainfall microphysical properties have never been studied in the literature, as the DSD measurements used in previous studies are more likely collected in the suburban area.
This paper presents a comprehensive study of DSD properties using 5-year (2014–2018) continuous observations in the Beijing urban area, aiming to advance our understanding and characterizations of DSD in urban regions as well as parameterization in remote sensing retrievals and NWP models. The DSD properties, their variabilities, as well as the potential applications in radar QPE are detailed.
This paper is organized as follows. Section 2 describes the dataset and methods for data quality control and analysis. The characteristics of DSD parameters for all rainfall events combined, different rainfall types, different rain rate classes, different periods of a day, and different months are detailed in Sect. 3. Section 4 presents the implications for radar QPE and the parameterization errors of different DSD-based radar rainfall algorithms. Summary and conclusion are given in Sect. 5.
2.1 Dataset
In this study, a Parsivel2 disdrometer is used, which is deployed at Tsinghua University campus, Beijing, China (hereafter referred to as THUD). Figure 1 illustrates the specific location of THUD (40.002∘ N, 116.324∘ E; 91 m a.s.l. – above sea level) relative to the Beijing metroplex. It is an optical disdrometer with a 54 cm2 horizontal sample area, and it is configured with 1 min sampling resolution to measure the DSD and fall velocity of raindrops (Löffler-Mang and Joss, 2000). The velocity and particle sizes are divided into 32 non-uniform bins, varying from 0.05 to 20.8 m s−1 for velocity and 0.062 to 24.5 mm for particle diameter.
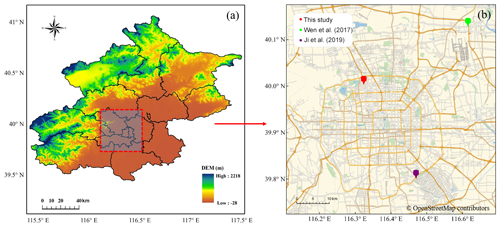
Figure 1(a) The topography of Beijing and (b) the locations of DSD studies in the Beijing area; the red mark represents the location of the Parsivel2 disdrometer deployed at Tsinghua University campus in this study and the green and purple makers represent locations in the studies by G. Wen et al. (2017) and Ji et al. (2019), respectively. The map data are available under the Open Database License. © OpenStreetMap contributors 2019. Distributed under a Creative Commons BY-SA License.
The DSD measurements were collected from June 2014 to December 2018. Lyu et al. (2018) compared the accumulated rainfall computed from the DSD data with the rainfall measurements from an automatic weather station 350 m away from THUD to cross-check the reliability of both instruments. Since most rainfall in the Beijing area occurs during the warm season, which usually lasts from May to the end of October (Song et al., 2014), this study uses the data collected from May to October to analyze the DSD characteristics.
2.2 Method
The direct measurements from the disdrometer are the number of raindrops at each velocity (i) and diameter (j) bin. Here, we take the mid value of each bin as the corresponding value. Then the maximum diameter Dmax (mm) of raindrops can be obtained directly from the data and the total number of raindrops Td can be calculated:
where ni,j stands for the drop number at each bin.
The number concentration of raindrops per unit volume for the jth diameter bin can be calculated as follows:
where Dj (mm) is the mid value of the jth diameter bin; N(Dj) is in m−3 mm−1; A is the sampling area in m2; Δt is the sampling time interval in s; A and Δt are, respectively, 0.0054 m2 and 60 s in this study; ΔDj (mm) is the diameter spread for the jth diameter bin; Vi (m s−1) is the mid-value fall speed for the ith velocity class.
Because of the measurement error, especially for larger size drops (Tokay et al., 2014), the empirical terminal velocity–diameter (V–D) relationship in Atlas et al. (1973) is adopted in this study:
The Gamma model (Ulbrich, 1983) in the following form has been proven to be suitable for describing the raindrop spectra.
where D (mm) is the raindrop diameter; N(D) (mm−1 m−3) is the number concentration of raindrops per unit volume per diameter interval; N0 (mm m−3), μ and Λ are the scale, shape and slope parameters of the Gamma distribution, and these three parameters can be derived using gamma moments (GMs) (Kozu and Nakamura, 1991; Tokay and Short, 1996) or maximum likelihood methods (Montopoli et al., 2008). When μ=0, the Gamma form DSD degenerates into an exponential DSD model.
In this study, we use the normalized gamma DSD described by Testud et al. (2000) to describe the natural variations of DSD (Bringi and Chandrasekar 2001; Dolan et al., 2018).
where Nw (m−3 mm−1) is the normalized intercept parameter; Dm (mm) is the mass-weighted mean diameter. Nw, Dm, and f(μ) are calculated as follows:
The integral parameters of total number concentration Nt (m−3), rain rate R (mm h−1), liquid water content W (g m−3) and the mass spectrum standard deviation σm (mm) are also calculated in this study based on the following equations.
where ρw is the water density (1.0 g cm−3); R(Dj) (mm h−1 mm−1) is the rain rate at the jth diameter class, and it is normalized by the total rain rate R as in the analysis to resolve the contribution of different raindrop sizes to the rainfall intensities. The median volume diameter D0 (mm) is defined such that drops smaller than D0 contribute to half the total liquid water content (W), as follows:
is also computed and included in the analysis.
Considering that a high-resolution dual-polarization X-band radar network is being deployed in Beijing for urban hydrometeorological applications, a series of polarimetric radar variables are simulated at X-band frequency based on the DSD measurements using the T-matrix method (Waterman, 1965; Leinonen, 2014), including horizontal reflectivity ZH (mm6 m−3), differential reflectivity Zdr (dB), and specific differential phase Kdp (∘ km−1). The drop-shaped model used in the simulation is the one proposed by Thurai et al. (2007). The temperature data are obtained from an automatic weather station collocated with the THUD disdrometer. In addition, various DSD-based radar QPE relations are derived and their parameterization errors are investigated for future development of the Beijing urban radar rainfall system.
2.3 Quality control
To minimize the measurement errors and improve data reliability, several quality control procedures have been applied to the 1 min DSD data. First, because of the low signal-to-noise ratios, the lowest two diameter bins are not used. That is, the raindrops less than 0.312 mm are eliminated in the analysis. Second, the 1 min sample data with total raindrop number smaller than 10 or the derived rain rate less than 0.1 mm h−1 are considered noise and are removed (Sreekanth et al., 2017). Then, if the continuous data satisfying the above conditions last less than 5 min, they will be ignored to avoid spurious and erratic measurements (Jash et al., 2019). In addition, to focus on rainfall, all the data contaminated by hail are removed, and raindrops at a diameter of larger than 8 mm are eliminated (Bringi and Chandrasekar, 2001) since the biggest raindrops ever reported globally in the literature are around 8 mm (Baumgardner and Colpitt, 1995; Beard et al., 1986). Also, thresholds on the simulated radar parameters (i.e., dBZ, Zdr>0 dB, and Kdp>0 ∘ km−1) are implemented to further guarantee the creditability of DSD data.
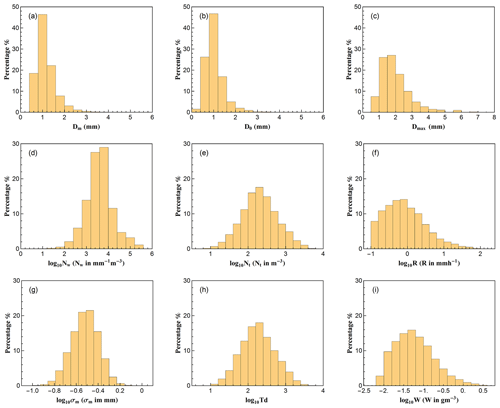
Figure 2Histograms of different DSD parameters for all selected rainfall: (a) mass-weighted mean diameter, Dm (mm); (b) median volume diameter, D0 (mm); (c) maximum diameter, Dmax (mm); (d) generalized intercept parameter, log 10Nw (Nw in m−3 mm−1); (e) total number concentration, log 10Nt (Nt in m−3); (f) rain rate, log 10R (R in mm h−1); (g) mass spectrum standard deviation, log 10σm (σm in mm); (h) total number of raindrops, log 10Td; (i) liquid water content, log 10W (W in g m−3).
3.1 Distribution of DSD parameters
A total number of 43 618 1 min DSD spectra have been selected after data quality control, covering the wet seasons (May to October) from 2014 to 2018 except for May 2014 (no observation then). In this study, the raindrops below 1 mm are considered small drops; 1–3 mm are midsize drops; and large drops if larger than 3 mm (Krishna et al., 2016; Seela et al., 2017, 2018; Tokay et al., 2014). The distribution and statistics of the DSD parameters are shown in Fig. 2 and Table 1. D0 and Dm have similar distributions, although D0 has a larger range with a larger maximum and a smaller minimum value. It is more concentrated to small values, showing a smaller mean and median diameter with higher standard deviation, skewness and kurtosis values. The relationship (Ulbrich, 1983) may be explained for such a phenomenon when Λ>0. The distribution of Dmax shows that during most of the rain events, the biggest drops are the middle class size, indicating that most of the rainfall is potentially made up of small and moderate raindrops. The statistical characteristics of log 10Nw show almost equal median (3.596) and mean values (3.595), as well as a very small skewness value (0.040), indicating that log 10Nw follows a symmetry distribution. The mean, median and skewness values of log 10Nt, log 10Td, and log 10σm also exhibit symmetry distributions. Moreover, the kurtosis of these three parameters is close to 3, which indicates that Nt, Td, and σm obey the lognormal distribution. Since a threshold of 0.1 mm h−1 is applied to the rain rate field (i.e., log 10R is truncated by −1), the R meets a positive skew distribution. Because of this, log 10W also has a positive skew distribution. It is worth noting that DSD samples with a rain rate about 0.8–1 mm h−1 have the highest frequency and samples with a rain rate less than 1 mm h−1 account for more than half of the total rain.
3.2 DSD properties for different rain types
Previous studies in different climate regions have shown that DSD may substantially differ in the two general precipitation types (i.e., convective and stratiform), which has a great impact on the parameterization in both NWP models and remote sensing observations. In this study, rainfall events are separated into stratiform and convective cases using a method combining Bringi et al. (2003) and Chen et al. (2013). In particular, if the standard derivation of rain rate for a consequent 10 min is greater than 1.5 mm h−1 and the rain rate is greater than 5 mm h−1, it is classified as convective rain; otherwise, it is classified as stratiform rain.
Figure 3 shows the histograms of Dm and log 10Nw for all the rainfall events and for the convective and stratiform subsets. The three key statistics are also indicted in Fig. 3, including mean, standard deviation (SD), and skewness. For the total dataset (Fig. 3a), the Dm histogram is highly positively skewed, while the skewness of log 10Nw is near to zero, suggesting that the distribution of log 10Nw is more symmetrical. The standard deviations of Dm and log 10Nw are large (0.46 mm for Dm and 0.62 for log 10Nw), indicating a high variability of both Dm and log 10Nw. The mean values of Dm and log 10Nw are 1.15 mm and 3.60, respectively. It should be noted that both mean values are slightly smaller compared with those obtained in the Beijing area during the summer time of 2015 (from 30 July to 30 September) and 2016 (from 9 June to 26 September) (G. Wen et al., 2017), which means that the DSD during summer time may be more concentrated than the whole rainy seasons.
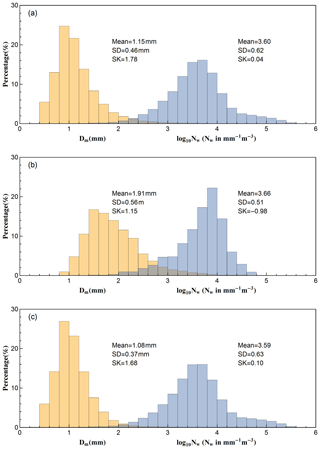
Figure 3Histograms of Dm and log 10Nw for (a) all the rainfall events, (b) convective events, and (c) stratiform events. Mean values, standard deviation (SD), and skewness (SK) are also shown in the respective panels.
Considering different rain types, it can be found that the Dm for both types are positively skewed, while the skewness of log 10Nw for convective is negative. The spread of log 10Nw for convective rain is narrower compared to that of stratiform rain, and the skewness of log 10Nw is larger than that of stratiform rain (−0.98 versus 0.10). The spreads and skewness of Dm for these two rainfall types perform oppositely (see Fig. 3b and c). In addition, histograms of Dm and log 10Nw during convective rain tend to shift toward the large values relative to stratiform rain, indicating that convective events have higher Dm and log 10Nw values than stratiform cases (1.91 mm and 3.66 for convective versus 1.08 mm and 3.59 for stratiform, respectively).
As Fig. 4 shows, in both convective and stratiform rains, with the increase in rain rate, the Dm increases (the positive exponents of the fitted power-law relationships), but the distributions of Dm become narrower. Note that at a higher rain rate, the Dm values tend to be stable, indicating that the DSD may have come to an equilibrium state where the coalescence and breakup of raindrops are in near balance (Hu and Srivastava, 1995). It can be seen in Fig. 4a that the Dm values reach a stable value around 2–2.5 mm when the rain rate R>60 mm h−1, which means the increase in rain rate is mainly caused by an increase in concentration (Bringi and Chandrasekar, 2001). With respect to the Dm–R relationship, the coefficient and exponent values of convective rain are slightly higher than stratiform, suggesting a larger Dm of convective rain than stratiform rain for a given rain rate, which is different from the findings in eastern China (Wen et al., 2016) or southern China (A. S. Zhang et al., 2019).
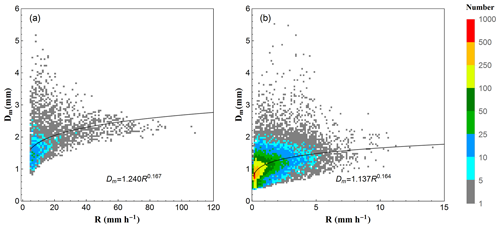
Figure 4Scatter density plot for Dm (mm) versus R (mm h−1) for (a) convective events and (b) stratiform events. The fitted power-law relationships are also provided in each panel adopting a least-squares method.
Figure 5 shows the distribution of log 10Nw versus Dm derived from the DSD data for all the rainfall events, as well as two different rain types. The two black rectangles correspond to the maritime and continental convective clusters and the dashed line corresponds to the stratiform (hereafter called “stratiform line”) case described by Bringi et al. (2003). For all the events combined, the distribution has a wide scale, but most points concentrate in the area of high log 10Nw with low Dm. For convective and stratiform events, the distributions are concentrated in different areas (stratiform: 3.3–4.0 for log 10Nw, 0.8–1.2 mm for Dm; convective: 3.7–4.2 for log 10Nw, 1.4–2.0 mm for Dm). There is a rather clear boundary between the two rainfall types, although there are some overlaps. For convective rain, there are more points in the “Continental cluster” than the “Maritime cluster”, but most points are neither in the “Continental cluster” nor in the “Maritime cluster” and have a tendency to approach the stratiform rain. This indicates that the wet season convective rain in Beijing is neither maritime or continental as described by Bringi et al. (2003), which is likely due to the certain distance between Beijing and the nearest ocean (about 160 km). For stratiform rainfall, the points are more concentrated, even with a wide range of log 10Nw versus Dm. More than 85 % of the stratiform points appear on the left side of the “stratiform line”. The average point of log 10Nw−Dm for all the rainfall events combined (magenta hollow star) also appears on the left side of the “stratiform line” due to the highest population of stratiform in the summer monsoon season (see also Table 2). These indicate the lower diameter and higher concentration characteristics of rainfall in the Beijing area. The relationship of log 10Nw−D0 (see Fig. S1 in the Supplement) shows that the line to classify rain types based on log 10Nw−D0 (Thurai et al., 2016) would misclassify more convective rain as stratiform rain. This is probably due to the complex terrain in Beijing (Fig. 1a), where the high mountain to the west may have a substantial impact on the rain evolving from the western mainland.
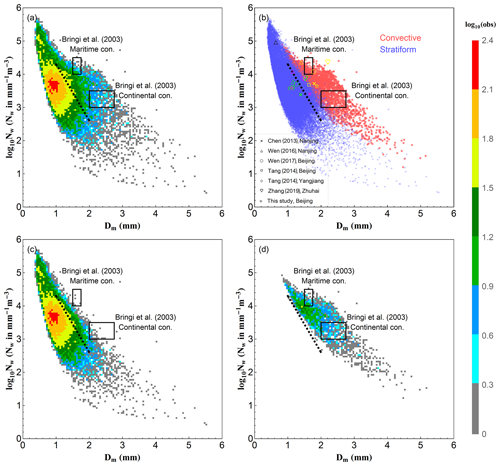
Figure 5Scatter density plot of log 10Nw versus Dm: (a) the total rainfall events; (c) stratiform events; (d) convective events. (b) is the scatterplot of log 10Nw versus Dm for the convective (red circle dots) and stratiform (blue square dots) cases. The two black rectangles in each subplot correspond to the maritime and continental convective clusters, and the black dashed line is the log 10Nw–Dm relationship for stratiform rain reported by Bringi et al. (2003). The cross, hollow triangles, circle, squares, diamonds, and hearts in (b) represent the averaged values obtained in previous studies by Chen et al. (2013), Wen et al. (2016), G. Wen et al. (2017), Tang et al. (2014), and A. S. Zhang et al. (2019) for different parts of China. The colors of these symbols represent different events: magenta for total rainfall events; green for convective events; yellow for stratiform events; and black for the shallow events, a third type of precipitation besides convective and stratiform suggested by a few researchers, based on data from vertically pointing radar observations (Fabry and Zawadzki, 1995; Cha et al., 2009) in the study by Wen et al. (2016).
The comparison of DSDs in different parts of China shows interesting results. Even in the same region, the DSDs measured by different instruments have notable differences, such as the differences in Beijing between results from G. Wen et al. (2017) (2DVD, circle) and Tang et al. (2014) (Parsivel, square). In order to reduce the errors caused by different measurement instruments, only DSDs measured by Parsivel disdrometers are analyzed in this study. It is concluded that the eastern part of China has the lowest mean value of log 10Nw (3.42) and highest mean value of Dm (1.66), while southern China has the highest mean value of log 10Nw (3.86) with a middle value of Dm (1.46), and the northern part of China has the middle value of log 10Nw (3.60) with a lowest value of Dm (1.15). This highlights that the DSD characteristics are highly dependent on the specific geographical locations and associated climate regimes. The results of Beijing from this study and Tang et al. (2014) show great differences in convective rain and lesser differences in stratiform rain, which is attributed to different convective systems during different years.
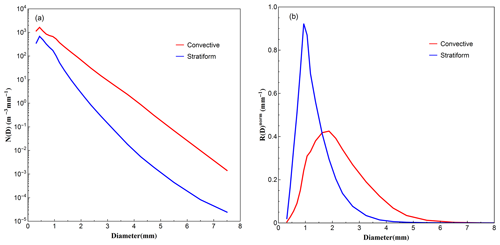
The DSD spectra and R(D) distributions of two rain types are shown in Fig. 6. Substantial differences are observed between these two rainfall types in both DSD spectra and R(D) distributions. The peaks of DSD spectra for both rainfall types are at the same diameter bin around D∼0.5 mm, while the spectrum for convective is higher than that of stratiform. The peak of R(D) distribution for stratiform rain is at the diameter around 0.9 mm and 1.9 mm for convective rain, which is much larger than where the DSD spectra peaks occur due to the D3 dependency of R(D). In addition, the distribution of R(D) for convective rain is much lower and broader. The differences in DSD spectra and R(D) distributions indicate that the convective rainfall has a higher concentration of moderate- to large-sized drops, and the large drops contribute more to convective rainfall compared to stratiform rainfall.
3.3 DSD characteristics in different rain rate classes
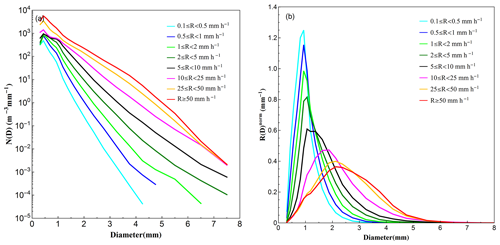
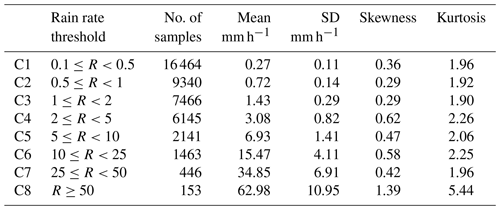
To further understand the characteristics of DSD at different rainfall intensities in the Beijing area, the DSD measurements are divided into eight classes according to the associated rain rate (R): C1, ; C2, ; C3, ; C4, ; C5, ; C6, ; C7, ; C8, R≥50 mm h−1. Such classification is based on the fact of high frequency of low rain rates in the Beijing area as well as several previous studies, including Das and Maitra (2016), Harikumar et al. (2010), Krishna et al. (2016), Sarkar et al. (2015), and Tokay and Short (1996). The DSD sample numbers and rain rate statistics for each category are summarized in Table 3. For each rain rate class, the composite DSD spectrum is shown in Fig. 7a. Note that for almost all raindrop size bins, the concentration of a higher rain rate class is higher than that of a lower rain rate class. Furthermore, the breadth of the DSD shape increases and the tail of DSD shifts gradually to the larger diameter as the rainfall intensity increases, which is similar to previous findings in Taiwan (Seela et al., 2017), southern India (Jash et al., 2019), Palau (Krishna et al., 2016), and the UK (Islam et al., 2012). All the DSD spectra only have one peak, which differs from Krishna et al. (2016), where the spectrum becomes bimodal when the rain rate R>8 mm h−1. In addition, the peaks of all DSD spectra are at a diameter around D∼0.5 mm, which is different from Jash et al. (2019) for India, where the peak position shifts towards larger diameters as the rain rate increases.
The mean normalized R(D) of each rain rate class is shown in Fig. 7b, illustrating the contribution of each diameter bin to the total rainwater. The normalized rain rate distributions are unimodal and the peaks are around D∼0.9–2.5 mm. The peak position shifts to a larger diameter and the distribution becomes lower and broader as rain rate increases. These results are similar to those in Jash et al. (2019) for India but different from those in Peters et al. (2002) for Germany, where the R(D) distribution has a secondary peak at lower rain rate intensity (R<1 mm h−1). This analysis implies that raindrops of diameter 0.9–2.5 mm (i.e., moderate size) contribute most towards accumulated rainwater during the rainy season in the Beijing area, and the size of drops contributing the most rainfall increases as the rainfall intensity increases.
Variations of the normalized intercept parameter (log 10Nw) and mass-weighted mean diameter (Dm) in each rain rate class are provided in Fig. 8 with a box-whisker plot. It can be seen that Dm values increase with the increase in rainfall intensity, while the increasing trend of log 10Nw is not as clear. This could be due to the imbalance between the decrease in small drop concentration and the increase in midsize and large drop concentration at a higher rain rate (R>10 mm h−1, from C6 to C8). The means and standard deviations of Dm, log 10Nw, Nt, W, μ, and Λ for each rain rate class are provided in Table 4, which clearly shows that with the increase in rainfall intensity, the mean values of total number concentration (Nt) and liquid water content (W) increase, while the mean values of the shape parameter (μ) and slope parameter (Λ) show a decreasing trend, resulting in a wider breadth and lower peak of DSD at high rain rates.
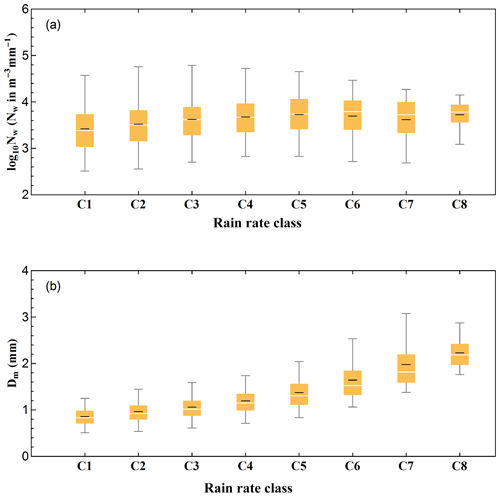
Figure 8Variation of the normalized intercept parameter log 10Nw (a) and the mass-weighted mean diameter Dm (b) for different rain rate classes. The white central line of the box indicates the median, the black central line in the box indicates the mean values, and the bottom and top lines of the box indicate the 25th and 75th percentiles, respectively. The bottom and top lines of the vertical lines out of the box indicate the 5th and 95th percentiles, respectively.
3.4 Diurnal variations of DSD characteristics
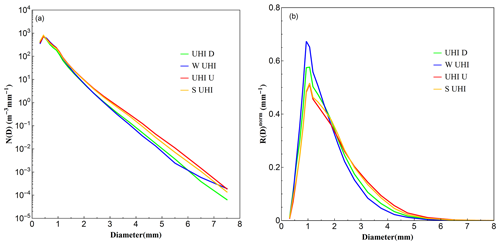
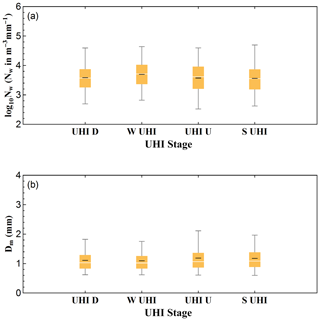
Since the 1980s, Beijing has been experiencing rapid urbanization, causing a lot of problems, among which UHI is one of the most well-known phenomena (Yang et al., 2013b). Some studies showed that extreme precipitation events are more likely to occur during the period when the UHI intensity is high, usually from late afternoon to early morning in Beijing local time (LST) (Li et al., 2008; Song et al., 2014; Yang et al., 2013a, 2017; Y. Y. Zhang et al., 2019). In order to explore the DSD variations during the day, the diurnal periods are divided into four parts based on the UHI variation described in Yang et al. (2013b): strong UHI stage (S UHI, 21:00–06:00 LST), weak UHI stage (W UHI, 11:00–16:00 LST), UHI down stage characterized by a fast decline of UHI intensity (UHI D, 06:00–11:00 LST) and UHI up stage characterized by an abrupt rise of UHI intensity (UHI U, 16:00–21:00 LST). The rain rate and DSD characteristics corresponding to these four stages are shown in Table 5. The DSD spectra and R(D) distributions are shown in Fig. 9.
Table 5Mean and standard deviation (SD) values of R, Dm, log 10Nw, Nt, W, μ, and Λ for different diurnal periods based on UHI intensity.

The DSD spectra of different diurnal periods are quite similar to those of different rain rate classes, showing a unimodal shape and peak position at the diameter D∼0.5 mm. It is notable that the DSD spectra are almost the same at small drop size bins (D<1 mm) and have the same width. As the diameter becomes larger, variations in the DSD spectra start showing up. The DSD spectra of the S UHI stage and UHI U stage show a similar and higher concentration, whereas the DSD spectra of the W UHI stage and UHI D stage have a similar but lower concentration, indicating that during the UHI U stage and S UHI stage, high-intensity rainfall is more likely to occur. This is in line with the study in Yang et al. (2017), which showed that the short-term high-intensity rainfall was more likely to happen at the UHI U stage and end at the late S UHI stage. The frequency and variation of the rain rate for different UHI stages (see Fig. S2) can also indicate this point.
The R(D) distributions for different diurnal periods in Fig. 9b show little difference between UHI U stage and S UHI stage, and the distributions at these two stages are lower and broader than the other two stages. At the W UHI stage, the R(D) distribution is the highest and the peak is at diameter around D∼0.9 mm, and the UHI D stage almost has the same peak around D∼0.9–1 mm, while the peaks during other two stages are at the diameter around D∼1 mm. That is, the drop size at the W UHI stage which contributes most to the accumulated rainwater is smaller than those at the UHI U stage or S UHI stage. The box-whisker plots of variation of Dm and log 10Nw for each diurnal period show the same results (see Fig. 10). The W UHI stage has the highest mean concentration and the lowest mean Dm value, while the UHI U stage has the largest mean Dm value and the S UHI stage has the lowest mean concentration.
3.5 DSD characteristics in different months
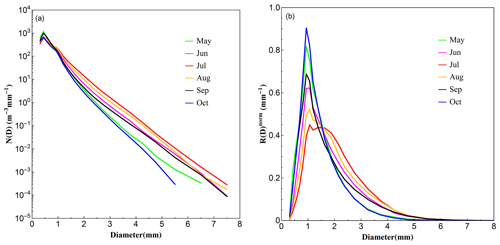
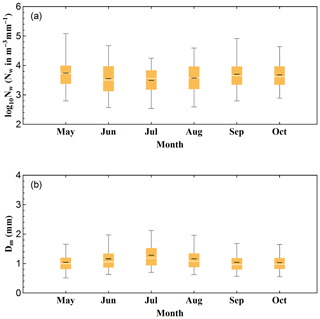
To obtain a better understanding of the seasonal variations of DSD characteristics in the Beijing urban area, rain data collected in different months are analyzed. The rain rate and DSD characteristics for different months are shown in Table 6. Figure 11 illustrates the corresponding DSD spectra and R(D) distributions.
As shown in Fig. 11, all the DSD spectra have peaks at diameter D∼0.5 mm, which are consistent with other classifications in this study. The DSD in May has a relatively higher concentration and a relatively lower concentration in July. At small drop size bins (D<1 mm), the spectra for May and September are similar, while the spectra for the other 4 months are similar. As the diameter increases, the differences between these spectra become larger, and the DSD spectrum for July has the highest concentration and October the lowest concentration. The rainfall with higher concentration and large drops is more likely to happen in July, leading to a high rain rate intensity (see also Fig. S3).
It is also noted that the R(D) distributions for each month are different from each other. The distributions of May, October, and September have a peak at diameter around D∼0.9 mm, while the distributions of June and August have a peak at diameter around D∼1 mm. The R(D) distribution of July has two peaks at diameter around D∼1 and D∼1.5 mm. In addition, the R(D) distribution of July is the widest and lowest, suggesting that a wide range of moderate drops contribute mostly to the rain in July. The Dm and log 10Nw in Fig. 12 show an interesting annual cycle: the Dm (log 10Nw) first goes up and (down) then goes down (up), while in July Dm (log 10Nw) reaches the highest (lowest) value.
4.1 Single polarized radar applications
The power-law relationship between radar reflectivity (in mm6 m−3) and rain rate (in mm h−1) (Z=aRb) is the most widely used algorithm for single polarized radar QPE (including the current operational radars in Beijing). However, the coefficient a and exponent b greatly rely on the DSD variability (Bringi et al., 2003; Rosenfeld and Ulbrich, 2003; Uijlenhoet, 2001). The default Z–R relationship applied for the operational Weather Surveillance Radar – 1988 Doppler (WSR-88D) systems in the United States is Z=300R1.4 (Fulton et al., 1998), whereas Z=200R1.6 is commonly used in the continental area for stratiform rain (Marshall and Palmer, 1948, hereafter referred to as the MP-Stratiform relationship). The more appropriate and localized a and b are expected to improve regional radar rainfall estimation. In the following, the localized Z–R relationships for different rain types are derived by the nonlinear least-squares method, aiming to provide references for operational S-band radar rainfall applications in Beijing.
Figure 13 shows the scatter density plot of rain rate versus horizontal reflectivity, as well as the fitted power-law relations for different rain types. Figure 13 shows that most of the samples are at low values where both ZH and R are small, which also suggests that the DSD may be under size-controlled conditions (Steiner et al., 2004). Meanwhile, the relationship for total rainfall (Z=238R1.57) underestimates the rain rate at low values compared with the stratiform relationship (Z=171R2.15), due to the inconsistent rain rate–reflectivity structures of two rain types.
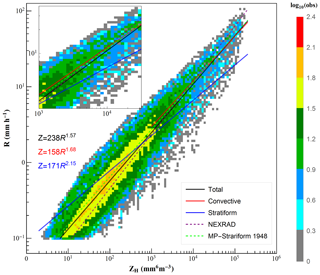
Figure 13Scatter density plot of R (mm h−1) versus ZH (mm6 m−3) for all rain events. The black, red, and blue curves, respectively, stand for the fitted power-law relations for total rain, convective rain, and stratiform rain. The purple and green dashed lines denote the default NEXRAD Z–R relation (Fulton et al., 1998) and a commonly used continental stratiform rain relation (Marshall and Palmer, 1948), respectively.
The default NEXRAD algorithm and MP-Stratiform relationship for continental stratiform rain are also indicated in Fig. 13 for comparison. At low reflectivity values (ZH<23 dBZ), the curve of the MP-Stratiform relationship is below the local stratiform relation, but at higher values, it reverses. As the mean reflectivity of stratiform rain (21 dBZ) is less than 23 dBZ (see Table 2), the MP-Stratiform relationship may introduce underestimation of rainfall. The default NEXRAD relationship behaves similarly: underestimation at lower reflectivity values and overestimation at higher reflectivity values. Considering the mean reflectivity value of convective rain, the default NEXRAD relationship may cause overestimation of rainfall. In other words, the default relationship Z=300R1.4 should be used with caution for local applications in Beijing.
4.2 High-frequency (X-band) polarimetric radar applications
A high-resolution dual-polarization X-band radar network is being deployed for urban hydrometeorological applications in the Beijing area. To support the radar deployment and facilitate the rainfall applications, the polarimetric parameters, including differential reflectivity Zdr (dB) and specific differential propagation-phase shift Kdp (∘ km−1), are computed from the DSD measurements. Therein, the T-matrix method (Waterman, 1965) is adopted and the computations are made at X-band frequency. In addition, the polarimetric rainfall relations are derived based on the nonlinear least-squares method, including R(Kdp), R(Kdp, ZDR), and R(ZH, ZDR). Here is the differential reflectivity in the linear scale.
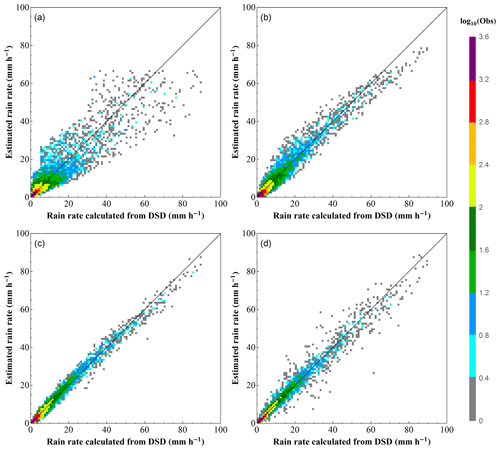
Figure 14Scatter density plots of rainfall rates estimated from radar rainfall relations versus rain rates calculated directly from DSD: (a) R(ZH), (b) R(Kdp), (c) (Kdp, ZDR), and (d) R(ZH, ZDR). The black diagonal line in each panel represents the 1–1 relationship.
The derived X-band radar rainfall relations are as follows:
Note that there are differences in the Z–R relationships between the X-band and S-band due to Mie scattering at higher frequency. Previous studies showed that the parameterization errors associated with various radar rainfall relations are among the key factors affecting the derived rainfall performance (Bringi and Chandrasekar, 2001). Hence, the parameterization errors in the X-band radar rainfall algorithms are investigated and quantified in this study. Figure 14 illustrates the scatter density plots of rain rates derived from R(ZH), R(Kdp), R(Kdp, ZDR), and R(ZH, ZDR) versus the rain rates directly computed from DSD. To quantify the parameterization errors, the normalized mean absolute error (NMAE) of the estimated rainfall rate is calculated, which is defined as
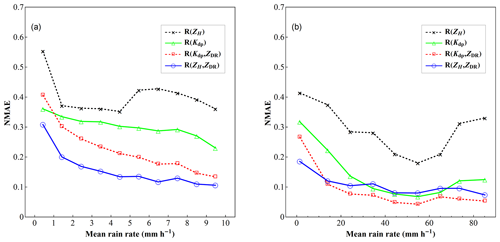
where the angle brackets stand for sample average; REP and RD denote the estimated rain rates derived from parameterized radar rainfall algorithms and DSD information, respectively. The NMAERR is calculated for different rainfall rate intervals from 0 to 100 mm h−1. Figure 15 shows the parameterization error structure of R(ZH), R(Kdp), R(Kdp, ZDR), and R(ZH, ZDR) as a function of rainfall rate.
It can be seen from Figs. 14 and 15 that the algorithms based on dual-polarization radar parameters can provide better estimates than the Z–R relationship. In addition, the dual-parameter algorithms, namely R(Kdp, ZDR) and R(ZH, ZDR), have even better performance than the single-parameter-based algorithm including R(Kdp). The NMAE has a decreasing trend as the rain rate increases from 1 to 60 mm h−1. The fluctuation when rain rate is greater than 60 mm h−1 may be due to the random errors caused by a few samples of large values. The parameterization errors of R(Kdp), R(Kdp, ZDR), and R(ZH, ZDR) become stable when rain rate becomes higher than 10 mm h−1. It is also noted that at low rain rate (less than 10 mm h−1), the NMAE of R(ZH, ZDR) is the smallest, while at higher rain rate (higher than 10 mm h−1) the NMAE of R(Kdp, ZDR) becomes the smallest. This again highlights the importance of selecting appropriate rain rate relations for local radar applications.
In this paper, 5-year (2014–2018) observations of DSD from a disdrometer deployed at Tsinghua University are analyzed to explore the microphysical characteristics of precipitation during rainy seasons (May–October) in the Beijing urban area. The main conclusions are as follows.
-
For all rain events, all the DSD parameters (Dm, D0, Dmax, log 10Nw, log 10Nt, log 10R, log 10σm, log 10Td and log 10W) except σm have a positive skewness, indicating a high frequency of low values and a low frequency of high values in the Beijing urban area. More than half of the DSD measurements are characterized by a rainfall rate of less than 1 mm h−1.
-
The mean values of log 10Nw and Dm of convective rain are higher than that of stratiform rain, indicating a higher raindrop concentration and larger drop size during convective events. This is also in line with the raindrop spectra and normalized R(D) distribution. In addition, log 10Nw of convective rain is negatively skewed, which is opposite to that of stratiform rain. For both rainfall types, the Dm values are higher but the distributions are narrower at higher rainfall intensities.
-
There is a clear boundary to distinguish between convective and stratiform rain from the scatterplot of log 10Nw versus Dm. However, the convective rain in the Beijing area is neither continental nor maritime as described by Bringi et al. (2003), due to the particular location and complex topography. Moreover, the comparison with different parts of China shows that the DSD variability is closely related to geographic location, climate regimes and study periods.
-
Stratified by rain rate, the DSD spectra become higher and wider as the rain rate increases, but all have peaks at the similar diameter size D∼0.5 mm. The peaks of the normalized R(D) distribution shift to larger diameter size (still within the midsize range) and the distribution becomes lower and wider as the rain rate increases. Meanwhile, the Dm and log 10Nw show an increasing trend and the slope parameter (μ) shows a decreasing trend as the rain rate increases.
-
During the periods of strong UHI and UHI up stages, the DSD spectra trend to have a higher concentration at large size drops and larger Dm values than other periods, indicating intense rainfall during these periods. The DSD has similar characteristics in July and August. In addition, the Dm and log 10Nw values show a diurnal cycle and an annual cycle. All these findings indicate substantial temporal variabilities of DSD in Beijing.
-
The Z–R relationship derived from local DSD in Beijing is quite different from the operational NEXRAD algorithm (MP-Stratiform) which may overestimate (underestimate) rainfall at high (low) rain intensity. The error structures of different algorithms show that the polarimetric radar rainfall relations R(Kdp), R(Kdp, ZDR), and R(ZH, ZDR) have greater potential than Z–R methods for urban QPE.
The DSD characteristics presented in this study not only provide further understanding of precipitation microphysical variabilities in Beijing, but also provide indications of future model development to improve local precipitation forecast. In addition, a high-resolution X-band dual-polarization radar network is being deployed in Beijing. This study is expected to provide references for future development of localized radar rainfall algorithms. Nevertheless, the DSD spectra also show the limitations of the Parisvel2 disdrometer in measuring small raindrops. Future study should be carried out with multiple instruments including a two-dimensional video disdrometer just deployed in this area. We also want to note that combining additional observations such as the vertically pointing profiler radar data (White et al., 2003) can further enhance the classification results of different rainfall types, which should be considered in future studies. In addition, further investigation on the spatial variability of DSD induced by the complex micro-topography in urban areas should be conducted.
Disdrometer data used in this study are available by contacting the authors.
The supplement related to this article is available online at: https://doi.org/10.5194/hess-23-4153-2019-supplement.
YM, GN, FT and HC conceived the idea; GN and FT provided financial support and observation data; YM conducted the detailed analysis; HC and CVC provided comments on the analysis; all the authors contributed to the writing and revisions.
The authors declare that they have no conflict of interest.
This research was supported by the Ministry of Science and Technology of the People's Republic of China under grant 2013DFG72270 and the National Key Research and Development Program of China under grant 2018YFA0606002. Yu Ma was also supported by the China Scholarship Council and Tsinghua University Tutor Research Fund. Participation of Chandrasekar V. Chandra and Haonan Chen was also supported by the US National Science Foundation Hazards SEES program and the California Department of Water Resources, respectively.
This research has been supported by the Ministry of Science and Technology of the People's Republic of China (grant no. 2013DFG72270) and the National Key Research and Development Program of China (grant no. 2018YFA0606002).
This paper was edited by Xing Yuan and reviewed by Long Yang and one anonymous referee.
Abel, S. J. and Boutle, I. A.: An improved representation of the raindrop size distribution for single-moment microphysics schemes, Q. J. Roy. Meteorol. Soc., 138, 2151–2162, https://doi.org/10.1002/qj.1949, 2012.
Angulo-Martinez, M. and Barros, A. P.: Measurement uncertainty in rainfall kinetic energy and intensity relationships for soil erosion studies: An evaluation using PARSIVEL disdrometers in the Southern Appalachian Mountains, Geomorphology, 228, 28–40, https://doi.org/10.1016/j.geomorph.2014.07.036, 2015.
Atlas, D., Srivastava, R. C., and Sekhon, R. S.: Doppler Radar Characteristics of Precipitation at Vertical Incidence, Rev. Geophys., 11, 1–35, https://doi.org/10.1029/RG011i001p00001, 1973.
Battan, L. J.: Radar observation of the atmosphere, University of Chicago Press, Chicago, 324 pp., 1973.
Baumgardner, D. C. and Colpitt, A.: Monster drops and rain gushes: unusual precipitation phenomena in Florida marine cumulus, in: Proc. Conf. Cloud Physics, January 1995, Boston, USA, 15–20, 1995.
Beard, K. V., Johnson, D. B., and Baumgardner, D.: Aircraft Observations of Large Raindrops in Warm, Shallow, Convective Clouds, Geophys. Res. Lett., 13, 991–994, https://doi.org/10.1029/GL013i010p00991, 1986.
Bringi, V. N. and Chandrasekar, V.: Polarimetric Doppler weather radar: principles and applications, Cambridge University Press, Cambrigde, 2001.
Bringi, V. N., Chandrasekar, V., Hubbert, J., Gorgucci, E., Randeu, W. L., and Schoenhuber, M.: Raindrop size distribution in different climatic regimes from disdrometer and dual-polarized radar analysis, J. Atmos. Sci., 60, 354–365, https://doi.org/10.1175/1520-0469(2003)060<0354:Rsdidc>2.0.Co;2, 2003.
Caracciolo, C., Napoli, M., Porcù, F., Prodi, F., Dietrich, S., Zanchi, C., and Orlandini, S.: Raindrop size distribution and soil erosion, J. Irrig. Drain. Eng., 138, 461–469, https://doi.org/10.1061/%28ASCE%29IR.1943-4774.0000412, 2011.
Cha, J.-W., Chang, K.-H., Yum, S. S., and Choi, Y.-J.: Comparison of the bright band characteristics measured by Micro Rain Radar (MRR) at a mountain and a coastal site in South Korea, Adv. Atmos. Sci., 26, 211–221, 2009.
Chen, B. J., Yang, J., and Pu, J. P.: Statistical Characteristics of Raindrop Size Distribution in the Meiyu Season Observed in Eastern China, J. Meteorol. Soc. Jpn., 91, 215–227, https://doi.org/10.2151/jmsj.2013-208, 2013.
Chen, H. and Chandrasekar, V.: The quantitative precipitation estimation system for Dallas–Fort Worth (DFW) urban remote sensing network, J. Hydrol., 531, 259–271, https://doi.org/10.1016/j.jhydrol.2015.05.040, 2015.
Cifelli, R., Chandrasekar, V., Chen, H. N., and Johnson, L. E.: High Resolution Radar Quantitative Precipitation Estimation in the San Francisco Bay Area: Rainfall Monitoring for the Urban Environment, J. Meteorol. Soc. Jpn., 96a, 141–155, https://doi.org/10.2151/jmsj.2018-016, 2018.
Cristiano, E., ten Veldhuis, M.-C., and van de Giesen, N.: Spatial and temporal variability of rainfall and their effects on hydrological response in urban areas – a review, Hydrol. Earth Syst. Sci., 21, 3859–3878, https://doi.org/10.5194/hess-21-3859-2017, 2017.
Das, S. and Maitra, A.: Vertical profile of rain: Ka band radar observations at tropical locations, J. Hydrol., 534, 31–41, https://doi.org/10.1016/j.jhydrol.2015.12.053, 2016.
Deo, A. and Walsh, K. J. E.: Contrasting tropical cyclone and non-tropical cyclone related rainfall drop size distribution at Darwin, Australia, Atmos. Res., 181, 81–94, https://doi.org/10.1016/j.atmosres.2016.06.015, 2016.
de Vos, L., Leijnse, H., Overeem, A., and Uijlenhoet, R.: The potential of urban rainfall monitoring with crowdsourced automatic weather stations in Amsterdam, Hydrol. Earth Syst. Sci., 21, 765–777, https://doi.org/10.5194/hess-21-765-2017, 2017.
Dolan, B., Fuchs, B., Rutledge, S. A., Barnes, E. A., and Thompson, E. J.: Primary Modes of Global Drop Size Distributions, J. Atmos. Sci., 75, 1453–1476, https://doi.org/10.1175/Jas-D-17-0242.1, 2018.
Ellison, W. D.: Some effects of raindrops and surface-flow on soil erosion and infiltration, Eos T. Am. Geophys. Union, 26, 415–429, https://doi.org/10.1029/TR026i003p00415, 1945.
Fabry, F. and Zawadzki, I.: Long-term radar observations of the melting layer of precipitation and their interpretation, J. Atmos. Sci., 52, 838–851, 1995.
Fadnavis, S., Deshpande, M., Ghude, S. D., and Raj, P. E.: Simulation of severe thunder storm event: a case study over Pune, India, Nat. Hazards, 72, 927–943, https://doi.org/10.1007/s11069-014-1047-1, 2014.
Fulton, R. A., Breidenbach, J. P., Seo, D. J., Miller, D. A., and O'Bannon, T.: The WSR-88D rainfall algorithm, Weather Forecast., 13, 377–395, https://doi.org/10.1175/1520-0434(1998)013<0377:Twra>2.0.Co;2, 1998.
Harikumar, R., Sampath, S., and Kumar, V. S.: Variation of rain drop size distribution with rain rate at a few coastal and high altitude stations in southern peninsular India, Adv. Space Res., 45, 576–586, https://doi.org/10.1016/j.asr.2009.09.018, 2010.
Hou, A. Y., Kakar, R. K., Neeck, S., Azarbarzin, A. A., Kummerow, C. D., Kojima, M., Oki, R., Nakamura, K., and Iguchi, T.: The Global Precipitation Measurement Mission, B. Am. Meteorol. Soc., 95, 701–722, https://doi.org/10.1175/Bams-D-13-00164.1, 2014.
Hu, Z. L. and Srivastava, R. C.: Evolution of Raindrop Size Distribution by Coalescence, Breakup, and Evaporation – Theory and Observations, J. Atmos. Sci., 52, 1761–1783, https://doi.org/10.1175/1520-0469(1995)052<1761:Eorsdb>2.0.Co;2, 1995.
Iguchi, T., Kozu, T., Meneghini, R., Awaka, J., and Okamoto, K.: Rain-profiling algorithm for the TRMM precipitation radar, J. Appl. Meteorol., 39, 2038–2052, https://doi.org/10.1175/1520-0450(2001)040<2038:Rpaftt>2.0.Co;2, 2000.
Islam, T., Rico-Ramirez, M. A., Thurai, M., and Han, D.: Characteristics of raindrop spectra as normalized gamma distribution from a Joss–Waldvogel disdrometer, Atmos. Res., 108, 57-73, 10.1016/j.atmosres.2012.01.013, 2012.
Jash, D., Resmi, E. A., Unnikrishnan, C. K., Sumesh, R. K., Sreekanth, T. S., Sukumar, N., and Ramachandran, K. K.: Variation in rain drop size distribution and rain integral parameters during southwest monsoon over a tropical station: An inter-comparison of disdrometer and Micro Rain Radar, Atmos. Res., 217, 24–36, https://doi.org/10.1016/j.atmosres.2018.10.014, 2019.
Ji, L., Chen, H., Li, L., Chen, B., Xiao, X., Chen, M., and Zhang, G. J. R. S.: Raindrop Size Distributions and Rain Characteristics Observed by a PARSIVEL Disdrometer in Beijing, Northern China, Remote Sens., 11, 1479, https://doi.org/10.3390/rs11121479, 2019.
Kinnell, P. I. A.: Raindrop-impact-induced erosion processes and prediction: a review, Hydrol. Process., 19, 2815–2844, https://doi.org/10.1002/hyp.5788, 2005.
Kozu, T. and Nakamura, K.: Rainfall Parameter-Estimation from Dual-Radar Measurements Combining Reflectivity Profile and Path-Integrated Attenuation, J. Atmos. Ocean. Tech., 8, 259–270, https://doi.org/10.1175/1520-0426(1991)008<0259:Rpefdr>2.0.Co;2, 1991.
Krishna, U. V. M., Reddy, K. K., Seela, B. K., Shirooka, R., Lin, P. L., and Pan, C. J.: Raindrop size distribution of easterly and westerly monsoon precipitation observed over Palau islands in the Western Pacific Ocean, Atmos. Res., 174, 41–51, https://doi.org/10.1016/j.atmosres.2016.01.013, 2016.
Leinonen, J.: High-level interface to T-matrix scattering calculations: architecture, capabilities and limitations, Opt. Express, 22, 1655–1660, https://doi.org/10.1364/OE.22.001655, 2014.
Li, J., Yu, R. C., and Wang, J. J.: Diurnal variations of summer precipitation in Beijing, Chin. Sci. Bull., 53, 1933–1936, https://doi.org/10.1007/s11434-008-0195-7, 2008.
Lim, Y. S., Kim, J. K., Kim, J. W., Park, B. I., and Kim, M. S.: Analysis of the relationship between the kinetic energy and intensity of rainfall in Daejeon, Korea, Quatern. Int., 384, 107–117, https://doi.org/10.1016/j.quaint.2015.03.021, 2015.
Löffler-Mang, M. and Joss, J.: An optical disdrometer for measuring size and velocity of hydrometeors, J. Atmos. Ocean. Tech., 17, 130–139, https://doi.org/10.1175/1520-0426(2000)017<0130:Aodfms>2.0.Co;2, 2000.
Lyu, H., Ni, G. H., Cao, X. J., Ma, Y., and Tian, F. Q.: Effect of Temporal Resolution of Rainfall on Simulation of Urban Flood Processes, Water, 10, 880, https://doi.org/10.3390/w10070880, 2018.
Marshall, J. S. and Palmer, W. M.: The Distribution of Raindrops with Size, J. Meteorol., 5, 165–166, https://doi.org/10.1175/1520-0469(1948)005<0165:Tdorws>2.0.Co;2, 1948.
McFarquhar, G. M., Hsieh, T.-L., Freer, M., Mascio, J., and Jewett, B. F.: The Characterization of Ice Hydrometeor Gamma Size Distributions as Volumes in N0–λ–μ Phase Space: Implications for Microphysical Process Modeling, J. Atmos. Sci., 72, 892–909, https://doi.org/10.1175/jas-d-14-0011.1, 2015.
Montopoli, M., Marzano, F. S., and Vulpiani, G.: Analysis and synthesis of raindrop size distribution time series from disdrometer data, IEEE T. Geosci. Remote, 46, 466–478, https://doi.org/10.1109/Tgrs.2007.909102, 2008.
Peters, G., Fischer, B., and Andersson, T.: Rain observations with a vertically looking Micro Rain Radar (MRR), Boreal Environ. Res., 7, 353–362, 2002.
Rosenfeld, D. and Ulbrich, C. W.: Cloud microphysical properties, processes, and rainfall estimation opportunities, in: Radar and Atmospheric Science: A Collection of Essays in Honor of David Atlas, American Meteorological Society, Boston, MA, 237–258, https://doi.org/10.1175/0065-9401(2003)030<0237:CMPPAR>2.0.CO;2, 2003.
Saleeby, S. M. and Cotton, W. R.: A large-droplet mode and prognostic number concentration of cloud droplets in the Colorado State University Regional Atmospheric Modeling System (RAMS). Part I: Module descriptions and supercell test simulations, J. Appl. Meteorol., 43, 182–195, https://doi.org/10.1175/1520-0450(2004)043<0182:Almapn>2.0.Co;2, 2004.
Sarkar, T., Das, S., and Maitra, A.: Assessment of different raindrop size measuring techniques: Inter-comparison of Doppler radar, impact and optical disdrometer, Atmos. Res., 160, 15–27, https://doi.org/10.1016/j.atmosres.2015.03.001, 2015.
Seela, B. K., Janapati, J., Lin, P. L., Reddy, K. K., Shirooka, R., and Wang, P. K.: A Comparison Study of Summer Season Raindrop Size Distribution Between Palau and Taiwan, Two Islands in Western Pacific, J. Geophys. Res.-Atmos., 122, 11787–11805, https://doi.org/10.1002/2017jd026816, 2017.
Seela, B. K., Janapati, J., Lin, P. L., Wang, P. K., and Lee, M. T.: Raindrop Size Distribution Characteristics of Summer and Winter Season Rainfall Over North Taiwan, J. Geophys. Res.-Atmos., 123, 11602–11624, https://doi.org/10.1029/2018jd028307, 2018.
Smith, J. A., Hui, E., Steiner, M., Baeck, M. L., Krajewski, W. F., and Ntelekos, A. A.: Variability of rainfall rate and raindrop size distributions in heavy rain, Water Resour. Res., 45, W04430, https://doi.org/10.1029/2008wr006840, 2009.
Song, X. M., Zhang, J. Y., AghaKouchak, A., Sen Roy, S., Xuan, Y. Q., Wang, G. Q., He, R. M., Wang, X. J., and Liu, C. S.: Rapid urbanization and changes in spatiotemporal characteristics of precipitation in Beijing metropolitan area, J. Geophys. Res.-Atmos., 119, 11250–11271, https://doi.org/10.1002/2014jd022084, 2014.
Sreekanth, T. S., Varikoden, H., Sukumar, N., and Kumar, G. M.: Microphysical characteristics of rainfall during different seasons over a coastal tropical station using disdrometer, Hydrol. Process., 31, 2556–2565, https://doi.org/10.1002/hyp.11202, 2017.
Steiner, M., Smith, J. A., and Uijlenhoet, R.: A microphysical interpretation of radar reflectivity–rain rate relationships, J. Atmos. Sci., 61, 1114–1131, https://doi.org/10.1175/1520-0469(2004)061<1114:AMIORR>2.0.CO;2, 2004.
Tang, Q., Xiao, H., Guo, C. W., and Feng, L.: Characteristics of the raindrop size distributions and their retrieved polarimetric radar parameters in northern and southern China, Atmos. Res., 135, 59–75, https://doi.org/10.1016/j.atmosres.2013.08.003, 2014.
Testud, J., Le Bouar, E., Obligis, E., and Ali-Mehenni, M.: The rain profiling algorithm applied to polarimetric weather radar, J. Atmos. Ocean. Tech., 17, 332–356, https://doi.org/10.1175/1520-0426(2000)017<0332:TRPAAT>2.0.CO;2, 2000.
Thurai, M., Huang, G. J., Bringi, V. N., Randeu, W. L., and Schönhuber, M.: Drop Shapes, Model Comparisons, and Calculations of Polarimetric Radar Parameters in Rain, J. Atmos. Ocean. Tech., 24, 1019–1032, https://doi.org/10.1175/jtech2051.1, 2007.
Thurai, M., Gatlin, P. N., and Bringi, V. N.: Separating stratiform and convective rain types based on the drop size distribution characteristics using 2D video disdrometer data, Atmos. Res., 169, 416–423, https://doi.org/10.1016/j.atmosres.2015.04.011, 2016.
Tokay, A. and Short, D. A.: Evidence from tropical raindrop spectra of the origin of rain from stratiform versus convective clouds, J. Appl. Meteorol., 35, 355–371, https://doi.org/10.1175/1520-0450(1996)035<0355:Eftrso>2.0.Co;2, 1996.
Tokay, A., Wolff, D. B., and Petersen, W. A.: Evaluation of the New Version of the Laser-Optical Disdrometer, OTT Parsivel2, J. Atmos. Ocean. Tech., 31, 1276–1288, https://doi.org/10.1175/jtech-d-13-00174.1, 2014.
Uijlenhoet, R.: Raindrop size distributions and radar reflectivity–rain rate relationships for radar hydrology, Hydrol. Earth Syst. Sci., 5, 615–628, https://doi.org/10.5194/hess-5-615-2001, 2001.
Uijlenhoet, R. and Stricker, J. N. M.: A consistent rainfall parameterization based on the exponential raindrop size distribution, J. Hydrol., 218, 101–127, https://doi.org/10.1016/S0022-1694(99)00032-3, 1999.
Ulbrich, C. W.: Natural Variations in the Analytical Form of the Raindrop Size Distribution, J. Clim. Appl. Meteorol., 22, 1764–1775, https://doi.org/10.1175/1520-0450(1983)022<1764:Nvitaf>2.0.Co;2, 1983.
Waterman, P. C.: Matrix formulation of electromagnetic scattering, Proc. IEEE, 53, 805–812, https://doi.org/10.1109/PROC.1965.4058, 1965.
Wen, G., Xiao, H., Yang, H. L., Bi, Y. H., and Xu, W. J.: Characteristics of summer and winter precipitation over northern China, Atmos. Res., 197, 390–406, https://doi.org/10.1016/j.atmosres.2017.07.023, 2017.
Wen, L., Zhao, K., Zhang, G. F., Xue, M., Zhou, B. W., Liu, S., and Chen, X. C.: Statistical characteristics of raindrop size distributions observed in East China during the Asian summer monsoon season using 2-D video disdrometer and Micro Rain Radar data, J. Geophys. Res.-Atmos., 121, 2265–2282, https://doi.org/10.1002/2015jd024160, 2016.
Wen, L., Zhao, K., Zhang, G. F., Liu, S., and Chen, G.: Impacts of Instrument Limitations on Estimated Raindrop Size Distribution, Radar Parameters, and Model Microphysics during Mei-Yu Season in East China, J. Atmos. Ocean. Tech., 34, 1021–1037, https://doi.org/10.1175/Jtech-D-16-0225.1, 2017.
White, A. B., Neiman, P. J., Ralph, F. M., Kingsmill, D. E., and Persson, P. O.: Coastal Orographic Rainfall Processes Observed by Radar during the California Land-Falling Jets Experiment, J. Hydrometeorol., 4, 264–282, 2003.
Yang, P., Ren, G. Y., Hou, W., and Liu, W. D.: Spatial and diurnal characteristics of summer rainfall over Beijing Municipality based on a high-density AWS dataset, Int. J. Climatol., 33, 2769–2780, https://doi.org/10.1002/joc.3622, 2013a.
Yang, P., Ren, G. Y., and Liu, W. D.: Spatial and Temporal Characteristics of Beijing Urban Heat Island Intensity, J. Appl. Meteorol. Clim., 52, 1803–1816, https://doi.org/10.1175/Jamc-D-12-0125.1, 2013b.
Yang, P., Ren, G. Y., and Yan, P. C.: Evidence for a Strong Association of Short-Duration Intense Rainfall with Urbanization in the Beijing Urban Area, J. Climate, 30, 5851–5870, https://doi.org/10.1175/Jcli-D-16-0671.1, 2017.
Yang, W.-Y., Li, Z., Sun, T., and Ni, G.-H.: Better knowledge with more gauges? Investigation of the spatiotemporal characteristics of precipitation variations over the Greater Beijing Region, Int. J. Climatol., 36, 3607–3619, https://doi.org/10.1002/joc.4579, 2016.
Zhang, A. S., Hu, J. J., Chen, S., Hu, D. M., Liang, Z. Q., Huang, C. Y., Xiao, L. S., Min, C., and Li, H. W.: Statistical Characteristics of Raindrop Size Distribution in the Monsoon Season Observed in Southern China, Remote Sens., 11, 432, https://doi.org/10.3390/rs11040432, 2019.
Zhang, D.-L., Lin, Y., Zhao, P., Yu, X., Wang, S., Kang, H., and Ding, Y.: The Beijing extreme rainfall of 21 July 2012: “Right results” but for wrong reasons, Geophys. Res. Lett., 40, 1426–1431, https://doi.org/10.1002/grl.50304, 2013.
Zhang, Y. Y., Pang, X., Xia, J., Shao, Q. X., Yu, E. T., Zhao, T. T. G., She, D. X., Sun, J. Q., Yu, J. J., Pan, X. Y., and Zhai, X. Y.: Regional Patterns of Extreme Precipitation and Urban Signatures in Metropolitan Areas, J. Geophys. Res.-Atmos., 124, 641–663, https://doi.org/10.1029/2018jd029718, 2019.


