the Creative Commons Attribution 4.0 License.
the Creative Commons Attribution 4.0 License.
 | 01 Oct 2019
Temporally dependent effects of rainfall characteristics on inter- and intra-event branch-scale stemflow variability in two xerophytic shrubs
Chuan Yuan
Guangyao Gao
Bojie Fu
Daming He
Xingwu Duan
Xiaohua Wei
Stemflow is important for recharging root-zone soil moisture in arid regions. Previous studies have generally focused on stemflow volume, efficiency and influential factors but have failed to depict stemflow processes and quantify their relations with rainfall characteristics within events, particularly for xerophytic shrubs. Here, we measured the stemflow volume, intensity, funneling ratio and time lags to rain at two dominant shrub species (Caragana korshinskii and Salix psammophila) and rainfall characteristics during 54 events at the semiarid Liudaogou catchment of the Loess Plateau, China, during the 2014–2015 rainy seasons. The funneling ratio was calculated as the ratio between stemflow and rainfall intensities at the inter- and intra-event scales. Our results indicated that the stemflow of C. korshinskii and S. psammophila, on average, started at 66.2 and 54.8 min, maximized 109.4 and 120.5 min after rain began, and ended 20.0 and 13.5 min after rain ceased. The two shrubs had shorter stemflow duration (3.8 and 3.4 h) and significantly larger stemflow intensities (517.5 and 367.3 mm h−1) than those of rain (4.7 h and 4.5 mm h−1). As branch size increased, both species shared the decreasing funneling ratios (97.7–163.7 and 44.2–212.0) and stemflow intensities (333.8–716.2 and 197.2–738.7 mm h−1). Tested by the multiple correspondence analysis and stepwise regression, rainfall amount and duration controlled stemflow volume and duration, respectively, at the event scale by linear relations (p < 0.01). Rainfall intensity and raindrop momentum controlled stemflow intensity and time lags to rain for both species within the event by linear or power relationships (p < 0.01). Rainfall intensity was the key factor affecting stemflow process of C. korshinskii, whereas raindrop momentum had the greatest influence on stemflow process of S. psammophila. Therefore, rainfall characteristics had temporally dependent influences on corresponding stemflow variables, and the influence also depended on specific species.
- Article
(6934 KB) - Full-text XML
- BibTeX
- EndNote


Stemflow directs the intercepted rain from canopy to the trunk base. The funnel-shaped canopy and underground preferential paths, i.e., roots, worm paths and soil macropores, converge rain to recharge the root-zone moisture (Johnson and Lehmann, 2006; Li et al., 2008). Stemflow is important for concentrating water (Levia and Germer, 2015), nutrients (Dawoe et al., 2018), pathogens (Garbelotto et al., 2003) and bacteria (Bittar et al., 2018) from the phyllosphere into the pedosphere (Teachey et al., 2018) even though stemflow accounts for only a minor part of the rainfall amount (RA; 6.2 %) in contrast to throughfall (69.8 %) and interception loss (24.0 %) in dryland ecosystems with annual mean rainfall ranging from 154 to 900 mm (Magliano et al., 2019). Stemflow greatly contributes to the survival of xerophytic plant species (Návar, 2011), the maintenance of patch structures in arid areas (Kéfi et al., 2007) and the normal functioning of rain-fed dryland ecosystems (Wang et al., 2011).
To quantify the ecohydrological importance of stemflow, numerous studies have been conducted on stemflow production and efficiency from various aspects, including the stemflow volume (mL), depth (mm), percentage (%), funneling ratio (unitless) and productivity (mL g−1; the branch stemflow volume of unit biomass; Herwitz, 1986; Yuan et al., 2016; Zabret et al., 2018; Yang et al., 2019). By installing automatic recording devices, the stemflow process has been gradually determined at 1 h intervals (Spencer and van Meerveld, 2016), 5 min intervals (André et al., 2008; Levia et al., 2010) and 2 min intervals (Dunkerley, 2014b). This determination allowed us to compute stemflow intensity (mm h−1; Germer et al., 2010), flux (mL min−1; Yang, 2010) and time lag after rain (Cayuela et al., 2018). Differing from an event-based calculation, the stemflow process provided insights into the fluctuation of stemflow production at a high temporal resolution. It permits a better interpretation of the “hot-moment” and “hotspot” effects of many ecohydrological processes (Bundt et al., 2001; McClain et al., 2003). Quantifying the short-intensity burst and temporal characteristics shed light on the dynamic process and pulse nature of stemflow (Dunkerley, 2019).
Stemflow cannot be initiated until canopies are saturated by the rain (Martinez-Meza and Whitford, 1996). The minimal RA needed to start stemflow was usually calculated by regressing stemflow volume with the RA at different plant species (Levia and Germer, 2015). It also varied with canopy states, i.e., 10.9 and 2.5–3.4 mm for the leafed oak and beech trees and 6.0 mm and 1.5–1.9 mm for them in the leafless period (André et al., 2008; Staelens et al., 2008). Stemflow also frequently continued after rain ceased due to the rainwater retained on the canopy or branch surface (Iida et al., 2017). Salix psammophila and an open tropical forest started stemflow 5–10 and 15 min later than the beginning of a rain event in the Mu Us desert of China (Yang, 2010) and the Amazon Basin of Brazil (Germer et al., 2010), respectively. However, 1 and 1.5 h were needed to start stemflow after the beginning of a rain event for pine and oak trees in northeastern Spain, respectively (Cayuela et al., 2018). For S. psammophila, stemflow flux was maximized 20–210 min after the beginning of a rain event (Yang, 2010), and stemflow ceased 11 h after rain ceased in an open tropical forest (Germer et al., 2010). Time lags of stemflow generation, maximization and the end of rain depicted dynamic stemflow process and were conducive to better understanding the hydrological process that occurred at the interface between the intercepted rain and soil moisture (Sprenger et al., 2019). It was important to discuss the temporal persistence in spatial patterns of soil moisture particularly at the intra-event scale (Gao et al., 2019). However, stemflow time lags have not been systematically studied for xerophytic shrubs.
The preferential paths at the underside of branches for delivering stemflow complicate stemflow processes within events (Dunkerley, 2014a). The influences of bark microrelief on stemflow are strongly affected by dynamic rain processes, such as rainfall intensity and raindrop striking within events (van Stan and Levia, 2010). While exceeding the holding capacity of branches, high rainfall intensity could overload and interrupt this preferential path (Carlyle-Mose and Price, 2006). Raindrops hit the canopy surface and create splashes on the surface. This process is conducive to wetting branches at the lower layers and accelerating the establishment of the preferential paths of stemflow transportation (Bassette and Bussière, 2008). Nevertheless, the interaction between the stemflow process and intra-event rainfall characteristics has not been substantially studied.
This study was designed at the event and process scales to investigate inter- and intra-event stemflow variability in two dominant xerophytic shrubs. The stemflow volume, intensity, funneling ratio and temporal dynamics of Caragana korshinskii and S. psammophila were recorded during the 2014–2015 rainy seasons on the Loess Plateau of China. Temporal dynamics were expressed as stemflow duration and time lags of stemflow generation, maximization and cessation to rain. Raindrop momentum was introduced to represent the comprehensive effects of the raindrop size, velocity, inclination angle and kinetic energy at the stemflow process. The funneling ratio was calculated at the event base and the 100 s intervals to assess the convergence effects of stemflow. This study specifically aimed to (1) depict the stemflow process in terms of stemflow intensity and temporal dynamics, (2) identify the dominant rainfall characteristics influencing inter- and intra-event stemflow variables, and (3) quantify the relationships between stemflow process variables and rainfall characteristics. Achieving these objectives would advance our knowledge of the process-based stemflow production to better understand the pulse nature of stemflow and its interactions with dynamic rain processes.
2.1 Site description
This study was conducted in the Liudaogou catchment (38∘46′–38∘51′ N, 110∘21′–110∘23′ E) in Shenmu, Shaanxi province, China, during the 2014–2015 rainy seasons. This catchment is 6.9 km2 and 1094–1273 m a.s.l. (meters above sea level). A semiarid continental climate prevails in this area. The mean annual precipitation (MAP) is 414 mm (1971–2013). Most MAP (77 %) occurs from July to September (Jia et al., 2013). The mean annual potential evaporation is 1337 mm (Yang et al., 2019). The mean annual temperature is 9.0 ∘C. The dominant shrubs include C. korshinskii, S. psammophila and Amorpha fruticosa. The dominant grasses are Artemisia capillaris, Artemisia sacrorum, Medicago sativa, Stipa bungeana, etc.
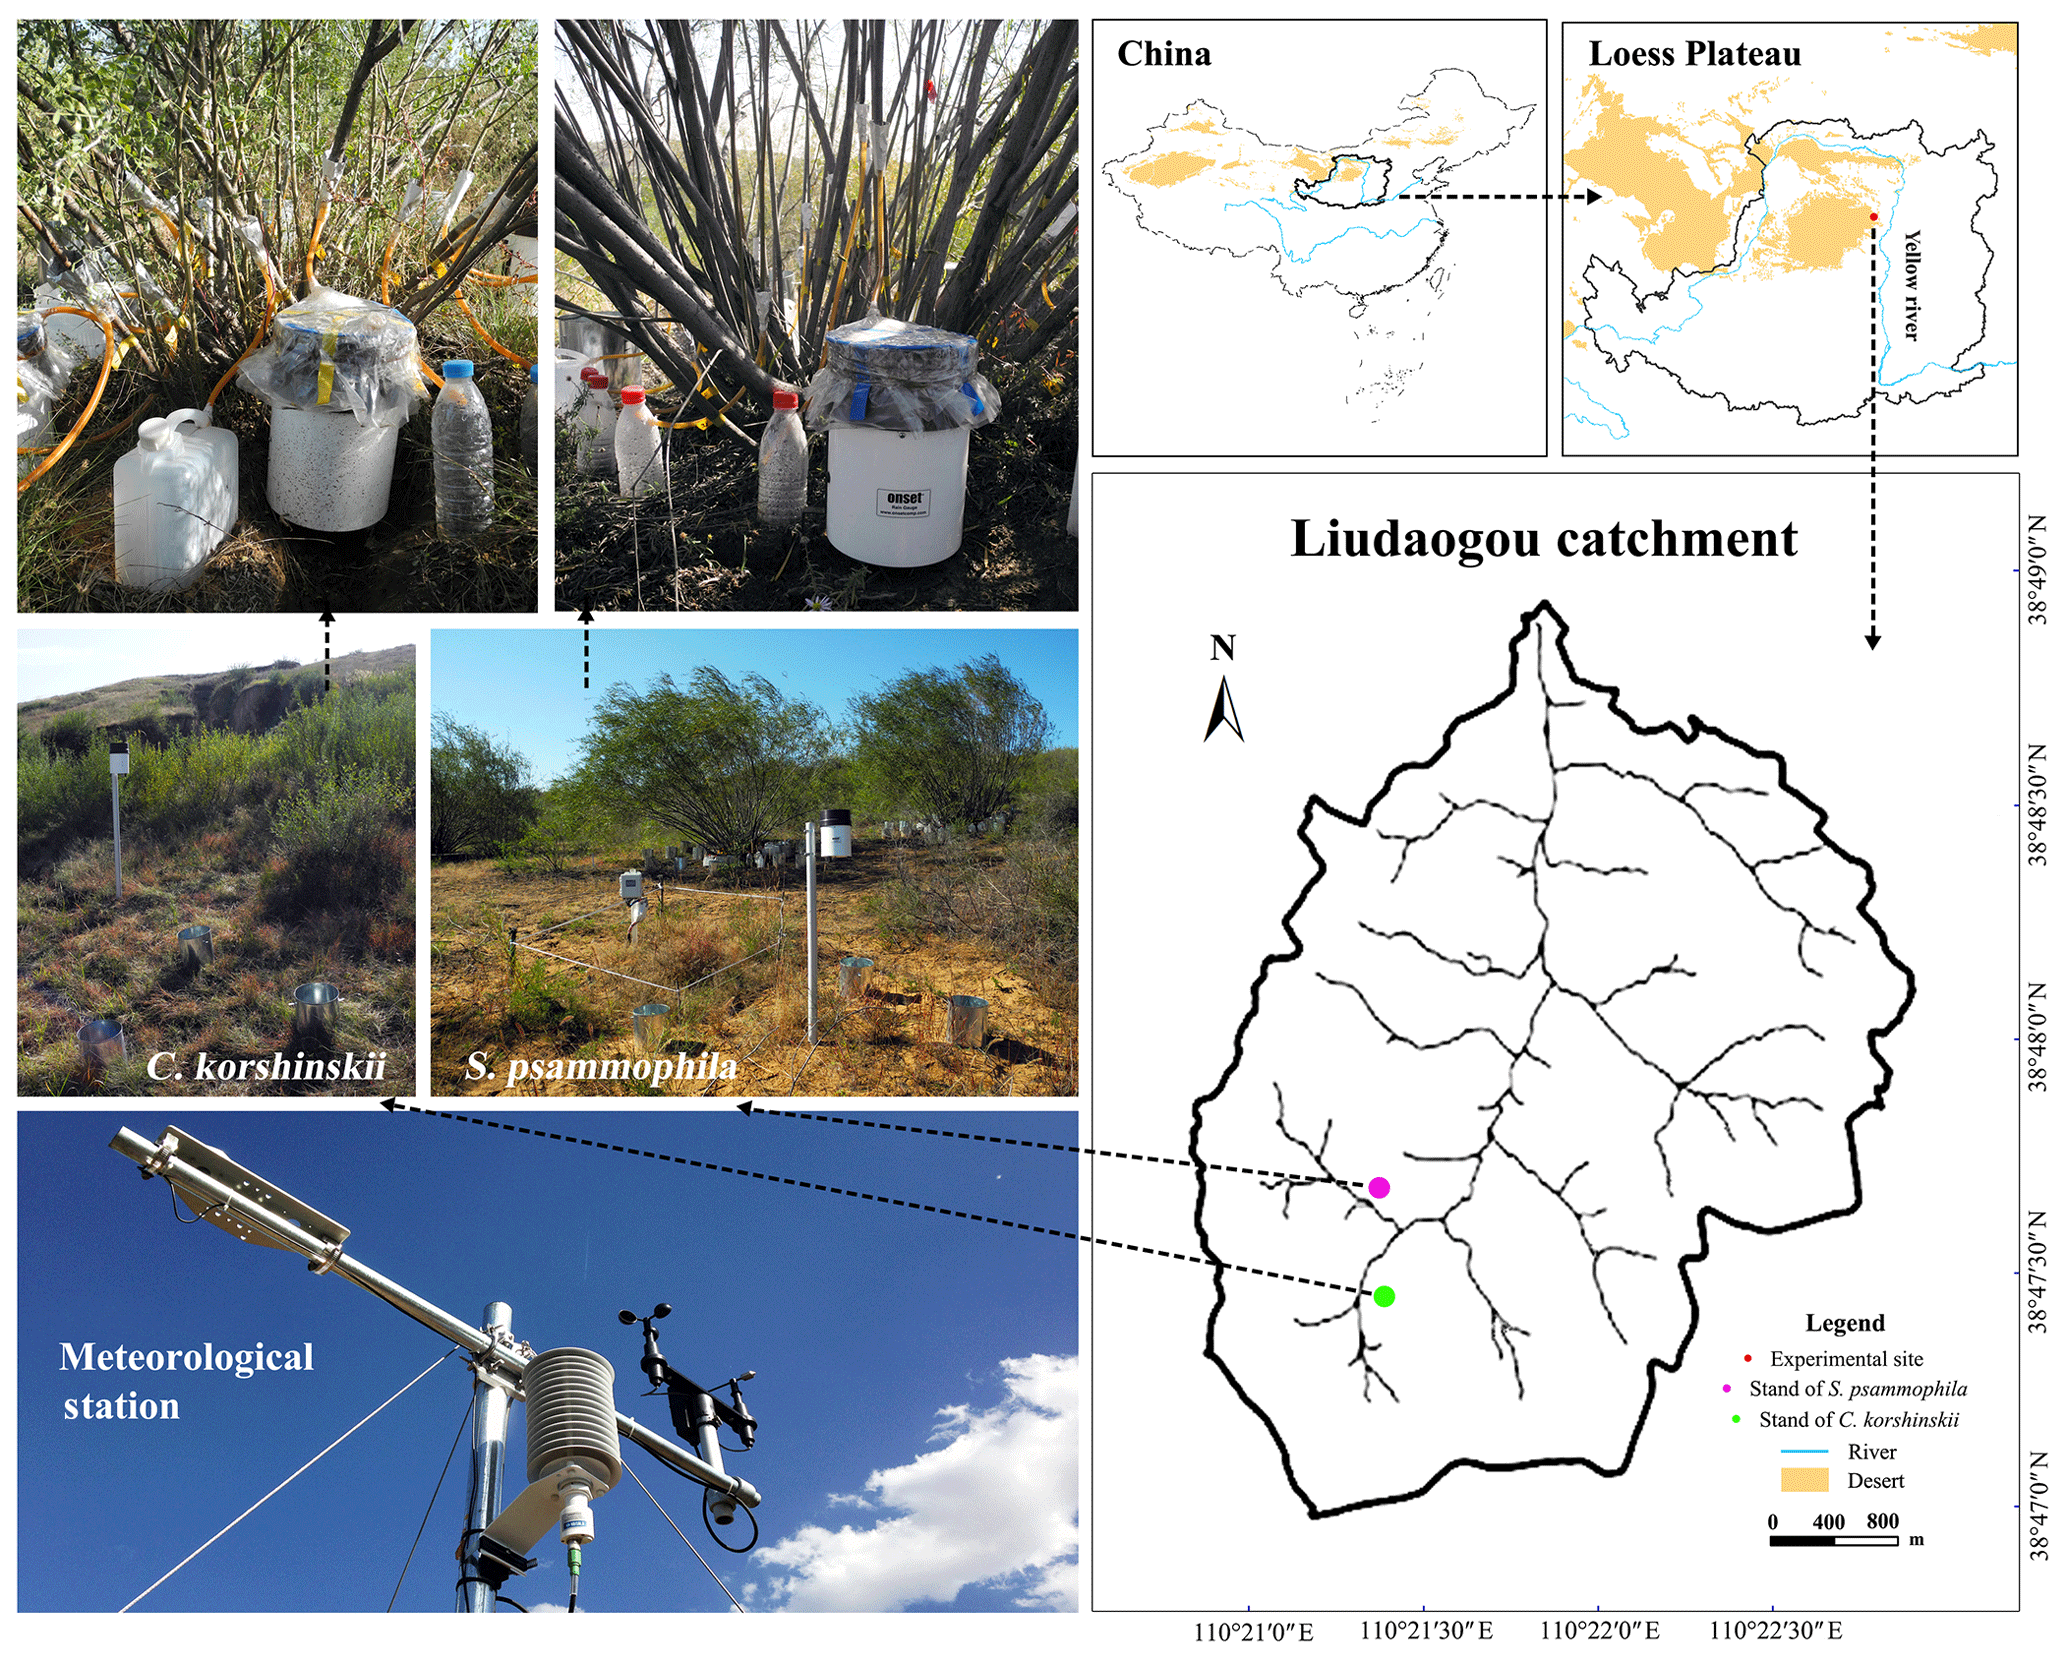
Figure 1Locations and experimental settings in the plots of C. korshinskii and S. psammophila.
C. korshinskii and S. psammophila are dominant shrub species at the arid and semiarid regions of northwestern China (Hu et al., 2016; Liu et al., 2016). They were commonly planted for soil and water conservation, for sand fixation, and as a wind barrier and had extensive distributions at this region (Li et al., 2016). Both species have inverted-cone crowns and no trunks, with multiple branches running obliquely from the base. As modular organisms and multi-stemmed shrub species, their branches live as independent individuals and compete with each other for water and light (Firn, 2004). Two plots were established in the southwestern catchment for these two xerophytic shrubs planted in the 1990s (Fig. 1). C. korshinskii and S. psammophila plots share similar stand conditions, with elevations of 1179 and 1207 m a.s.l., slopes of 13 and 18∘, and sizes of 3294 and 4056 m2, respectively. The C. korshinskii plot has a ground surface of loess and aspect of 224∘, while the S. psammophila plot has a ground surface of sand and an aspect of 113∘.
2.2 Meteorological measurements and calculations
A meteorological station was installed at the experimental plot of S. psammophila to record rainfall characteristics and wind speed (WS; m s−1; Model 03002, R. M. Young Company, USA), air temperature (T; ∘C) and relative humidity (H; %; Model HMP155, Vaisala, Finland). They were logged at 10 min intervals by a data logger (Model CR1000, Campbell Scientific, Inc., USA). The evaporation coefficient (E; unitless) was calculated to present the evaporation intensity (Eqs. 1–3) via aerodynamic approaches (Carlyle-Mose and Schooling, 2015). Tipping-bucket rain gauges (hereinafter referred to as TBRGs) automatically recorded the volume and timing of rainfall and stemflow (Herwitz, 1986; Germer et al., 2010; Spencer and Meerveld, 2016; Cayuela et al., 2018). To mitigate the systematic errors for missing the records of inflow during tipping intervals (Groisman and Legates, 1994), we chose the Onset® (Onset Computer Corp., USA) RG3-M TBRG with the relatively smaller underestimation for its smaller bucket volume (3.73±0.01 mL; Iida et al., 2012). Besides this, three 20 cm diameter standard rain gauges were placed around the TBRG with a 0.5 m distance at the 120∘ separation (Fig. 1). The regression (R2=0.98, p < 0.01) between manual measurements and automatic recording further mitigated the understanding of inflow water by applying TBRG (Eq. 4):
where es is the saturation vapor pressure (kPa), T is air temperature (∘ C), H is relative air humidity (%), VPD is the vapor pressure deficit (kPa) and E is the evaporation coefficient (unitless),
where IWR is the recording of inflow water (including rainfall and stemflow) via TBRG (mm), and IWA is the adjusted inflow water (mm).
Discrete rainfall events were defined by a measurable RA of 0.2 mm (the resolution limit of the TBRG) and the smallest 4 h gap without rain. That was the same period of time to dry canopies from antecedent rain as reported by Giacomin and Trucchi (1992), Zhang et al. (2015, 2017), and Yang et al. (2019). Rainfall interval (RI; h) was calculated to indirectly represent the bark wetness. Other rainfall characteristics were also computed, including the RA (mm), rainfall duration (RD; h), the average and 10 min maximum rainfall intensity of incident rain (I and I10; mm h−1), and the 10 min average rainfall intensity after rain begins (Ib10, mm h−1) and before rain ends (Ie10, mm h−1). By assuming the raindrop to be a perfect sphere (Uijlenhoet and Torres, 2006), raindrop momentum in the vertical direction (F; mg m s−1; Eqs. 8 and 9) was computed to comprehensively represent the effects of raindrop size (D; mm; Eq. 5), terminal velocity (v; m s−1; Eq. 6) and average inclination angle (θ; ∘; Eq. 7) affecting the stemflow process (Brandt, 1990; Kimble, 1996; van Stan et al., 2011; Carlyle-Moses and Schooling, 2015). The 10 min maximum raindrop momentum (F10; mg m s−1) and the average raindrop momentum at the first and last 10 min (Fb10 and Fe10, respectively; mg m s−1) could be calculated with I10, Ib10 and Ie10, as indicated in Eqs. (5)–(9), respectively. For the 0.8 km distance between the two plots, the following meteorological data were used at the C. korshinskii plot:
where D is raindrop diameter (mm), I is the average rainfall intensity of incident rain (mm h−1), v is raindrop velocity (m s−1), θ is the average inclination angle of raindrops (∘), WS is the average wind speed of incident rain (m s−1), F0 is the average raindrop momentum (mg m s−1), m is the average raindrop mass (g), and ρ is the density of freshwater at standard atmospheric pressure and 20∘ (0.998 g cm−3).
Table 1Branch morphologies of C. korshinskii and S. psammophila for stemflow recording.
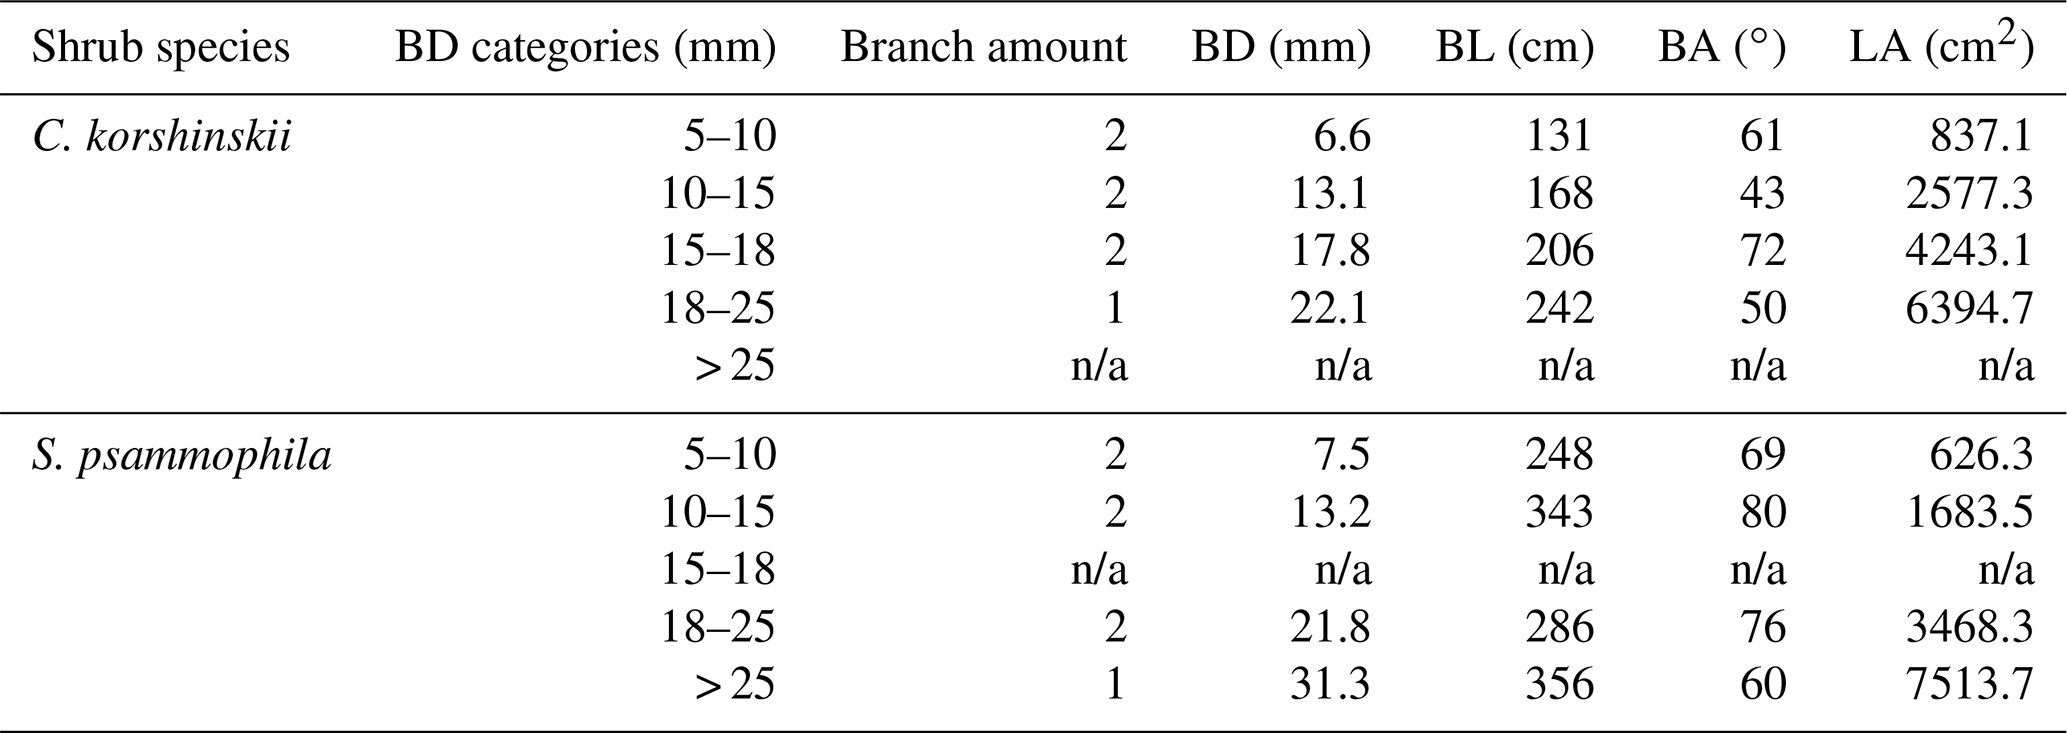
Notes: BD, BL and BA are branch basal diameter, length and inclination angle, respectively. LA is leaf area of individual branches. n/a means not applicable.
2.3 Experimental branch selection and measurements
This study focused on the branch-scale stemflow production of the 20-year-old C. korshinskii and S. psammophila. Based on plot investigation, the canopy traits of standard shrubs were determined. Four shrubs were selected accordingly at each species with similar crown areas and heights (5.1±0.3 m2 and 2.1±0.2 m for C. korshinskii and 21.4±5.2 m2 and 3.5±0.2 m for S. psammophila, respectively). The approximately 10 m gap between them guaranteed that the shrubs would be exposed to the similar meteorological conditions (Yuan et al., 2016). We measured branch morphologies of all 180 and 261 branches at experimental shrubs of C. korshinskii and S. psammophila, respectively, including BD (basal diameter; mm) with a vernier calliper (Model 7D-01150, Forgestar Inc., Germany), branch length (BL; cm) with a measuring tape, and branch angle (BA; ∘) with a pocket geologic compass (Model DQL-8, Harbin Optical Instrument Factory, China). Thus, BD categories were determined at 5–10, 10–15, 15–18, 18–25 and > 25 mm to guarantee the appropriate branch amounts within categories for meeting the statistical significance. Two representative branches with median BDs were selected in each category for stemflow recording. The experimental branches had no intercrossing with neighboring ones and no turning point in height from branch tip to base. The positions in the outer layer of the canopy avoided overshading by the upper-layer branches and permitted convenient measurements. Since the qualified branch with the > 25 mm size was not enough for C. korshinskii and the TBRG malfunctioned at the 15–18 mm branches of S. psammophila, stemflow data were not available in these BD categories. In total, seven branches were selected for stemflow measurements at each species (Table 1). As the important interface to intercept rain at the growing season, the well-verified allometric growth equations were performed to estimate the branch leaf area (LA; cm2) of C. korshinskii (LA BD1.63, R2=0.98; Yuan et al., 2017) and S. psammophila (LA BD1.74, R2=0.90; Yuan et al., 2016).
2.4 Stemflow measurements and calculations
A total of 14 TBRGs were applied to automatically record the branch stemflow production of C. korshinskii and S. psammophila. The data of stemflow volume and timing were automatically recorded at dynamic intervals between neighboring tips. We installed aluminum foil collars to trap stemflow at branches nearly 40 cm off the ground, higher than the TBRG orifice, with the height of 25.7 cm (Fig. 1). They were fitted around the entire branch circumference and sealed by neutral silicone caulking. The limited orifice diameter of foil collars minimized the access of throughfall and rain into them (Yuan et al., 2017). The 0.5 cm diameter polyvinyl chloride hoses hung vertically and channeled stemflow from the collars to TBRGs with minimum travel time. TBRGs were covered with the polyethylene films to prevent the accessing of throughfall and splash (Fig. 1). These apparatuses were periodically checked against leakages or blockages by insects and fallen leaves. Stemflow variables were computed as follows.
-
Stemflow volume (SFV; mL) is the average stemflow volume of individual branches. Adjusted with Eq. (4) firstly, SFV was computed with the TBRG recordings (SFRG, mm) by multiplying its orifice area (186.3 cm2; Eq. 10),
-
The stemflow intensity is the branch stemflow volume per branch basal area per unit of time. SFI (mm h−1) is the average stemflow intensity of incident rain, which is computed by the event-based SFV (mL), branch basal area (BBA; mm2) and RD (h; Eq. 11; Herwitz, 1986; Spencer and Meerveld, 2016). SFI10 (mm h−1) is the 10 min maximum stemflow intensity, which is calculated with the 10 min maximum stemflow volume (SFV10, mL), and BBA (mm2; Eq. 12). SFIi (mm h−1) is the instantaneous stemflow intensity, which is calculated by the tip volume of TBRG (3.73 mL), BBA (mm2) and time intervals between neighboring tips (ti, h; Eq. 13). The comparison between SFIi and the corresponding rainfall intensity depicted the synchronicity of stemflow with rain within events:
-
Stemflow temporal dynamics are the stemflow duration and time lags to rain. These include the following: SFD (h), stemflow duration, which is computed by different timings between the first and last tips of stemflow via TBRGs; TLG (min), the time lag of stemflow generation after rain begins, which is computed by different first-tip timings between rainfall and stemflow via TBRGs; TLM (min), the time lag of stemflow maximization after rain begins, which is computed by different timings between the largest-SFIi and first-rainfall tips via TBRGs; and TLE (min), the time lag of stemflow ending after rain ceases, which is computed by different last-tip timings between rainfall and stemflow via TBRG.
-
The funneling ratio is the efficiency for capturing and delivering raindrops from the canopies to the trunk and/or branch base (Siegert and Levia, 2014; Cayuela et al., 2018). By introducing RD at both the numerator and denominator of the original equation (Herwitz, 1986), the FR (unitless) was transformed as the ratio between stemflow and rainfall intensities at the event base (Eq. 14). FR100 described the within-event funneling ratio at the 100 s interval after rain began (Eq. 15):
where FR100i, SFI100i and I100i are the funneling ratio, stemflow intensity and rainfall intensity at the internal i with the 100 s pace after rain begins, respectively.
2.5 Data analysis
Stemflow variables were averaged at different BD categories to analyze the most influential rainfall characteristics affecting them. Pearson correlation analyses were firstly performed to test the relationships between rainfall characteristics (RA, RD, RI, I, I10, Ib10, Ie10, F, F10, Fb10, Fe10 and E) and stemflow variables (SFV, SFI, SFI10, FR, TLG, TLM, TLE and SFD). The significantly correlated factors were grouped in terms of median value and compiled into indicator matrices. They were standardized for a cross-tabulation check as required by the multiple correspondence analysis (MCA; Levia et al., 2010; van Stan et al., 2011, 2016). All qualified data were restructured into orthogonal dimensions (Hair et al., 1995), where distances between row and column points were maximized (Hill and Lewicki, 2007). As shown at correspondence maps, the clustering rainfall characteristics were tightly correlated to the centered stemflow variable. Finally, stepwise regressions were operated to identify the most influential rainfall characteristics (Carlyle-Moses and Schooling, 2015). The quantitative relations were established in terms of the qualified level of significance (p < 0.05) and the highest coefficient of determination (R2). One-way analysis of variance (ANOVA) with the least significant difference (LSD) post hoc test was used to determine whether rainfall characteristics and stemflow variables significantly differed among event categories and whether the funneling ratio and stemflow intensity significantly differed among BD categories for C. korshinskii and S. psammophila. The level of significance was set at the 95 % confidence interval (p=0.05). SPSS 21.0 (IBM Corporation, USA), Origin 8.5 (OriginLab Corporation, USA) and Excel 2019 (Microsoft Corporation, USA) were used for data analysis.
Table 2Rainfall characteristics during events with different intensity peak amounts.
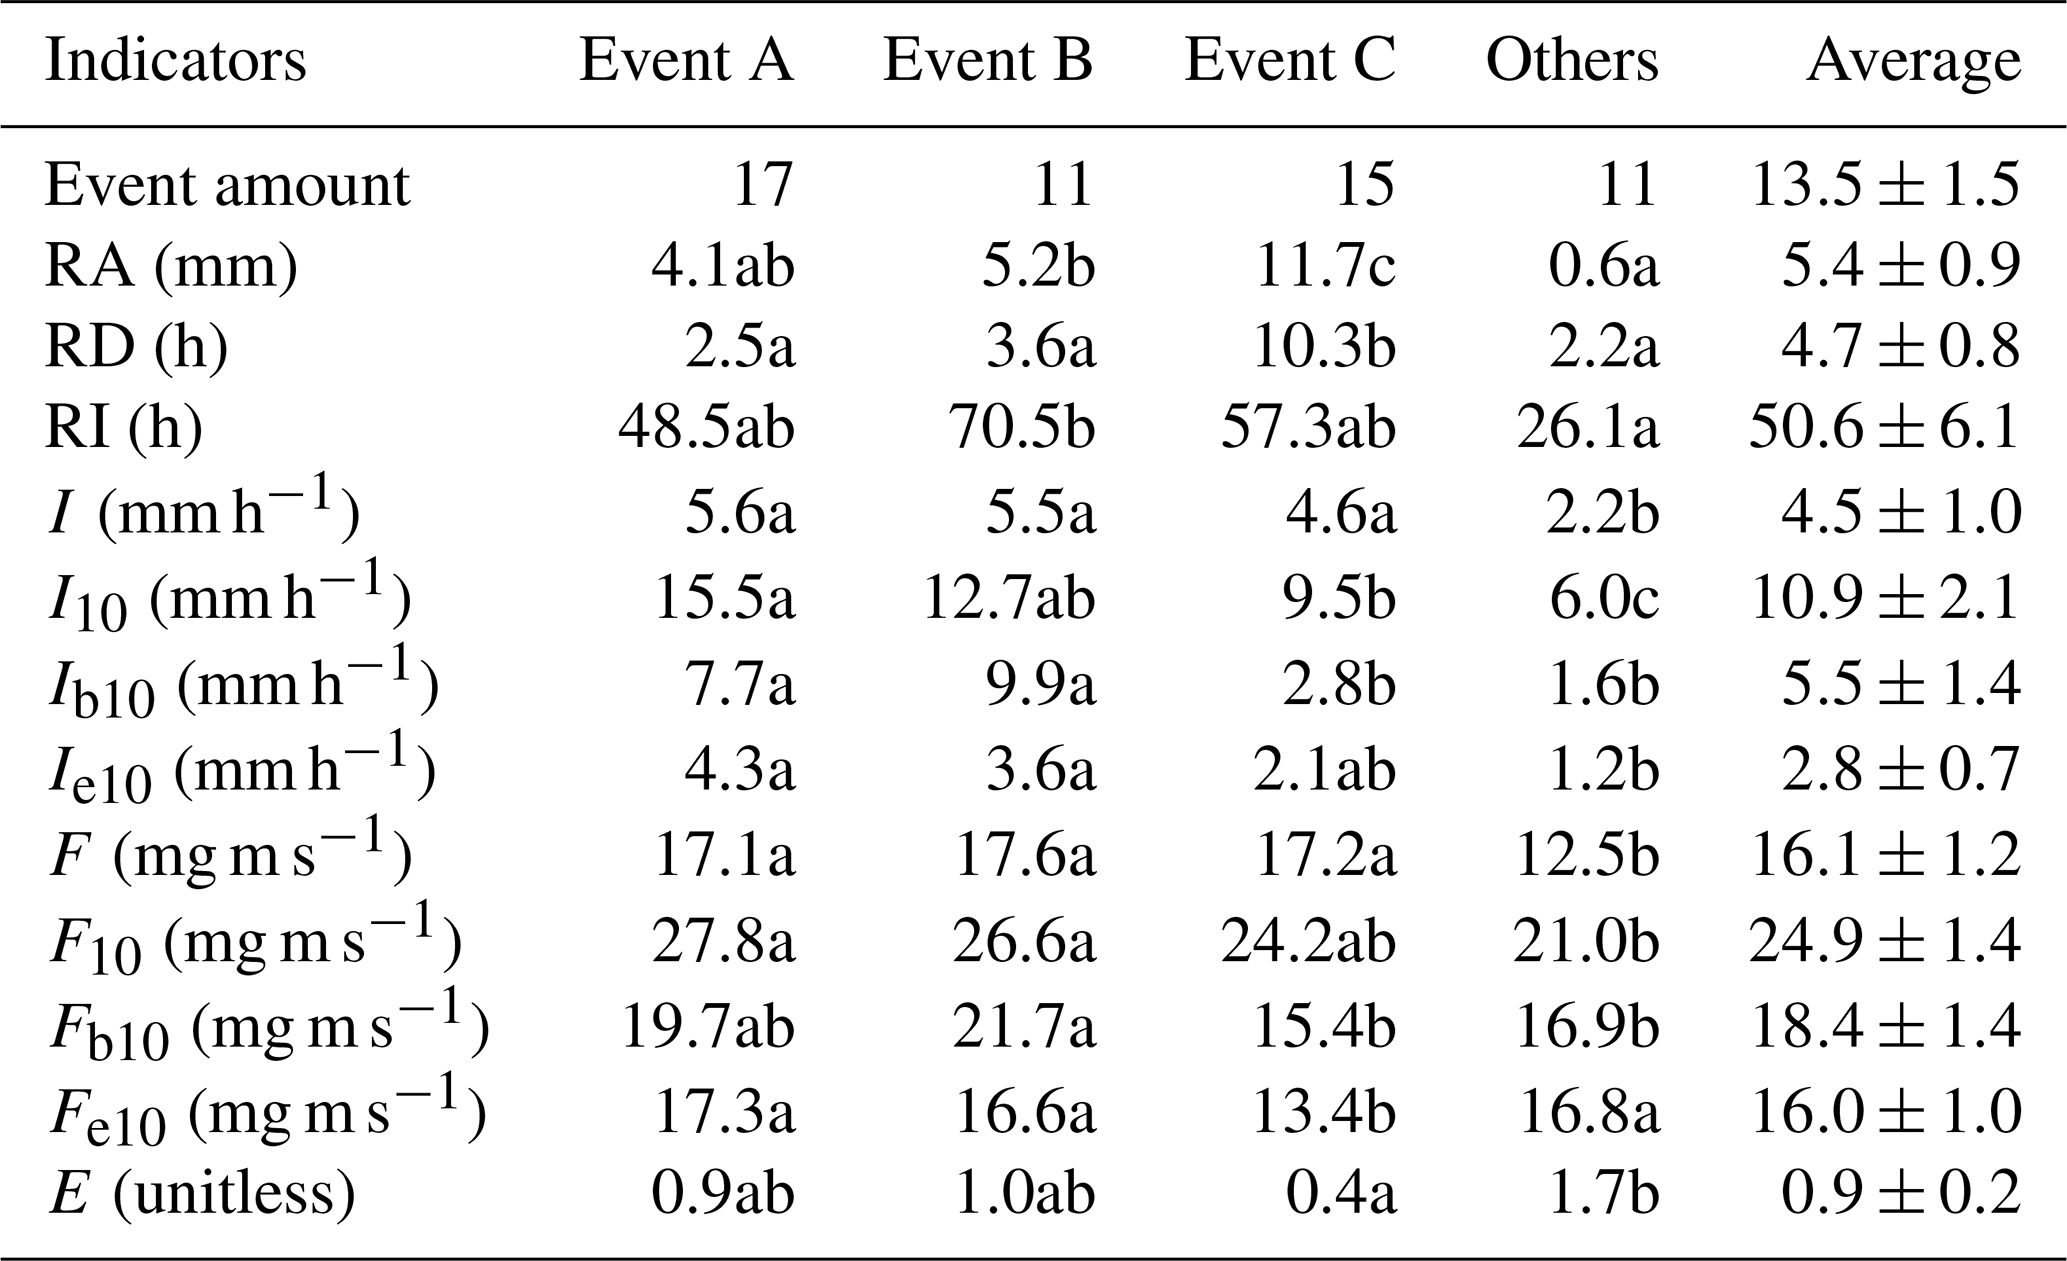
Note: Event A, Event B and Event C are events with the single, double and multiple rainfall intensity peaks, respectively. Others are the events that excluded from the categorization. RA, RD and RI are rainfall amount, duration and interval, respectively. I and I10 are the average and 10 min maximum rainfall intensities, respectively. Ib10 and Ie10 are the average rainfall intensities in 10 min after rain begins and before rain ends, respectively. F and F10 are the average and 10 min maximum raindrop momentums, respectively. Fb10 and Fe10 are the average raindrop momentums in 10 min after rain begins and before rain ends, respectively. E is evaporation coefficient. Different letters indicate significant differences of rainfall characteristics between event categories (p < 0.05; rows at the table).
3.1 Rainfall characteristics
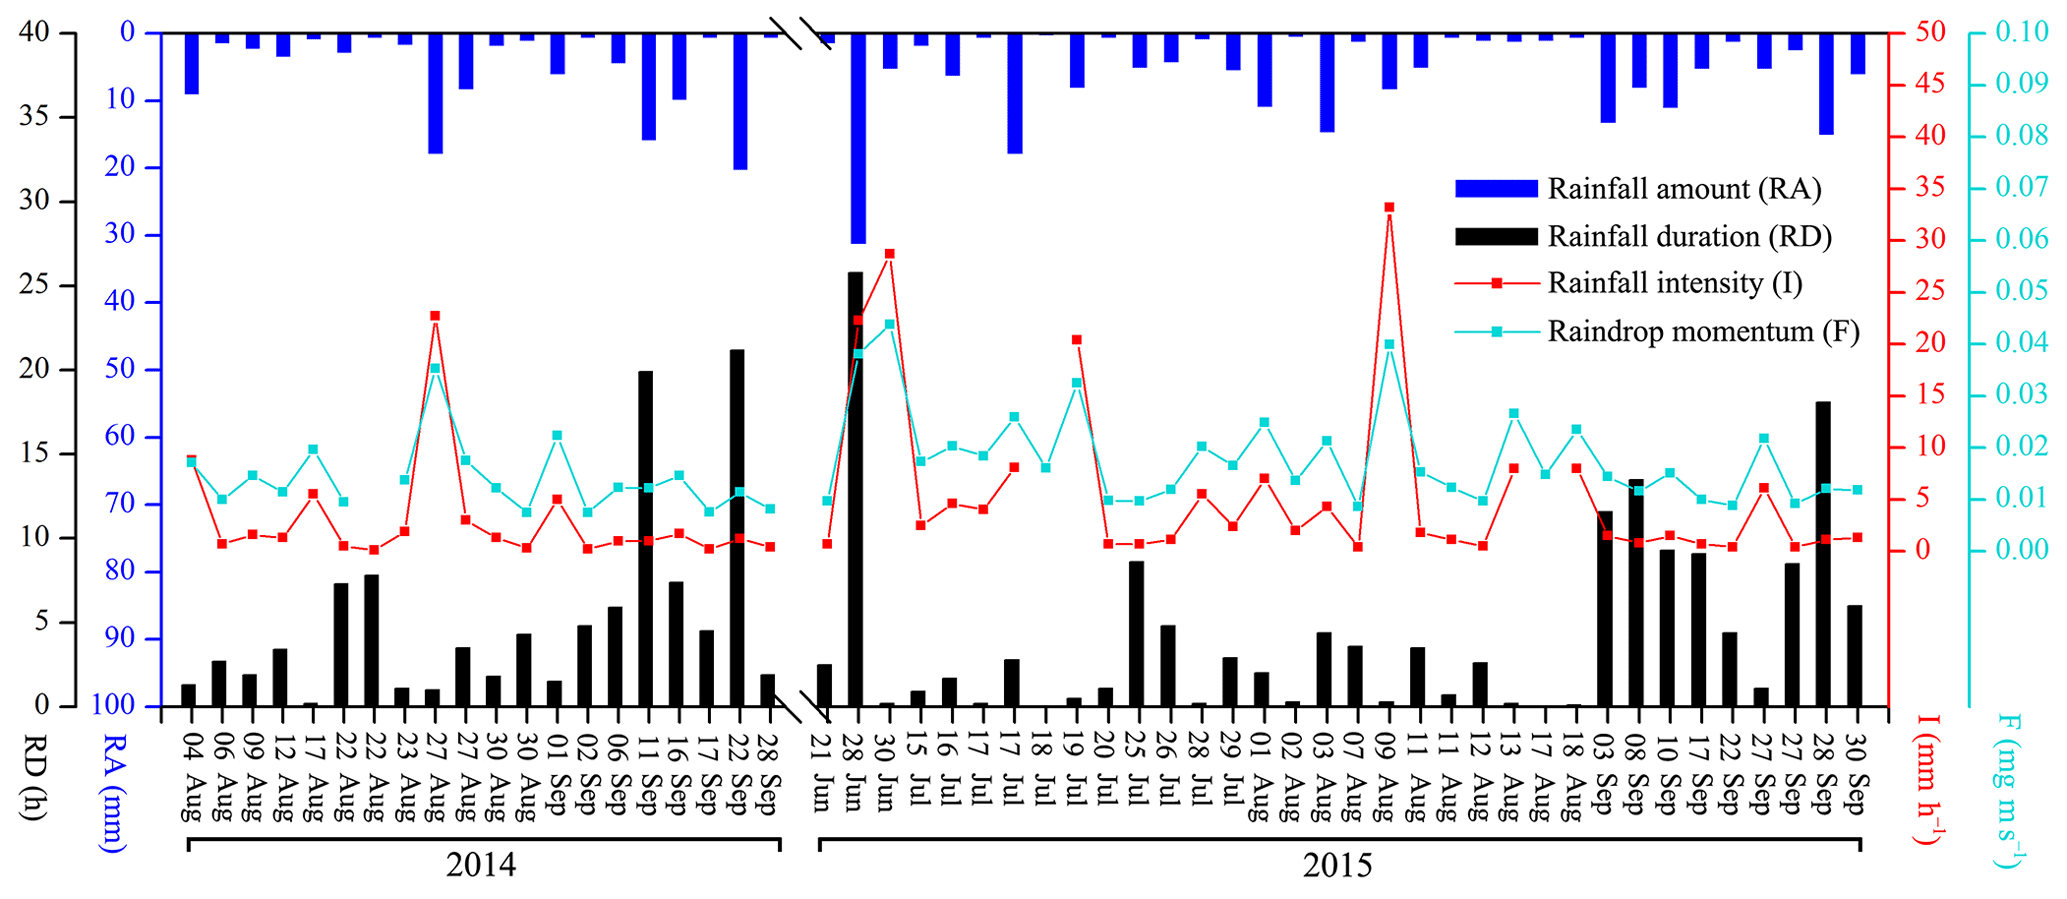
A total of 54 rainfall events were recorded for stemflow measurements for the 2014–2015 rainy seasons (Fig. 2). In these experimental periods, 20, 8, 10, 8, 4 and 4 events were at the RA categories of ≤2, 2–5, 5–10, 10–15, 15–20 and > 20 mm, respectively. The total RAs at these categories were 22.1, 26.1, 68.8, 93.3, 74.8 and 110.0 mm, respectively. During these events, the average I, I10, Ib10 and Ie10 were 4.5±1.0, 10.9±2.1, 5.5±1.4 and 2.8±0.7 mm h−1, respectively. The average F, F10, Fb10 and Fe10 were 16.1±1.2, 24.9±1.4, 18.4±1.4 and 16.0±1.0 mg m s−1, respectively. RD, RI and E averaged at 4.7±0.8 h, 50.6±6.1 h and 0.9±0.2, respectively (Table 2).
Rainfall events were further categorized in terms of rainfall-intensity peak amount, including Event A (the single-peak events), B (the double-peak events) and C (the multiple-peak events). There were 17, 11 and 15 events at Event A, B and C, respectively. Because the remaining 11 events had the average RA of 0.6 mm, no more than three recordings were observed within events, which were limited by the 0.2 mm resolution of TBRGs. Therefore, they could not be categorized and grouped as “Others” (Table 2). Compared with Event A and B, Event C possessed significantly different rainfall characteristics, e.g., a significantly larger RA (11.7 vs. 4.1 and 5.2 mm) and RD (10.3 vs. 2.5 and 3.6 h) but significantly smaller I10 (9.5 vs. 15.5 and 12.7 mm h−1), Ib10 (2.8 vs. 7.7 and 9.9 mm h−1), Fb10 (15.4 vs. 19.7 and 21.7 mg m s−1) and Fe10 (13.4 vs. 17.3 and 16.6 mg m s−1) and a non-significantly smaller Ie10 (2.1 vs. 4.3 and 3.6 mm h−1), F10 (24.2 vs. 27.8 and 26.6 mg m s−1) and E (0.4 vs. 0.9 and 1.0), respectively (Table 2).
In general, rainfall events were unevenly distributed in terms of RA. The occurrences of events with a RA ≤2 mm dominated the experimental period (40.7 %), but the events with RA > 20 mm were the greatest contributor to the total RA (28.0 %). However, a relatively equal distribution was noted during events with single (17 events), double (11 events) and multiple (15 events) rainfall-intensity peaks. Comparatively, the multiple-peak events had significantly larger rainfall amounts, durations, intensities and raindrop momentums.
Table 3Stemflow variables of C. korshinskii and S. psammophila during rainfall events with different intensity peak amounts.
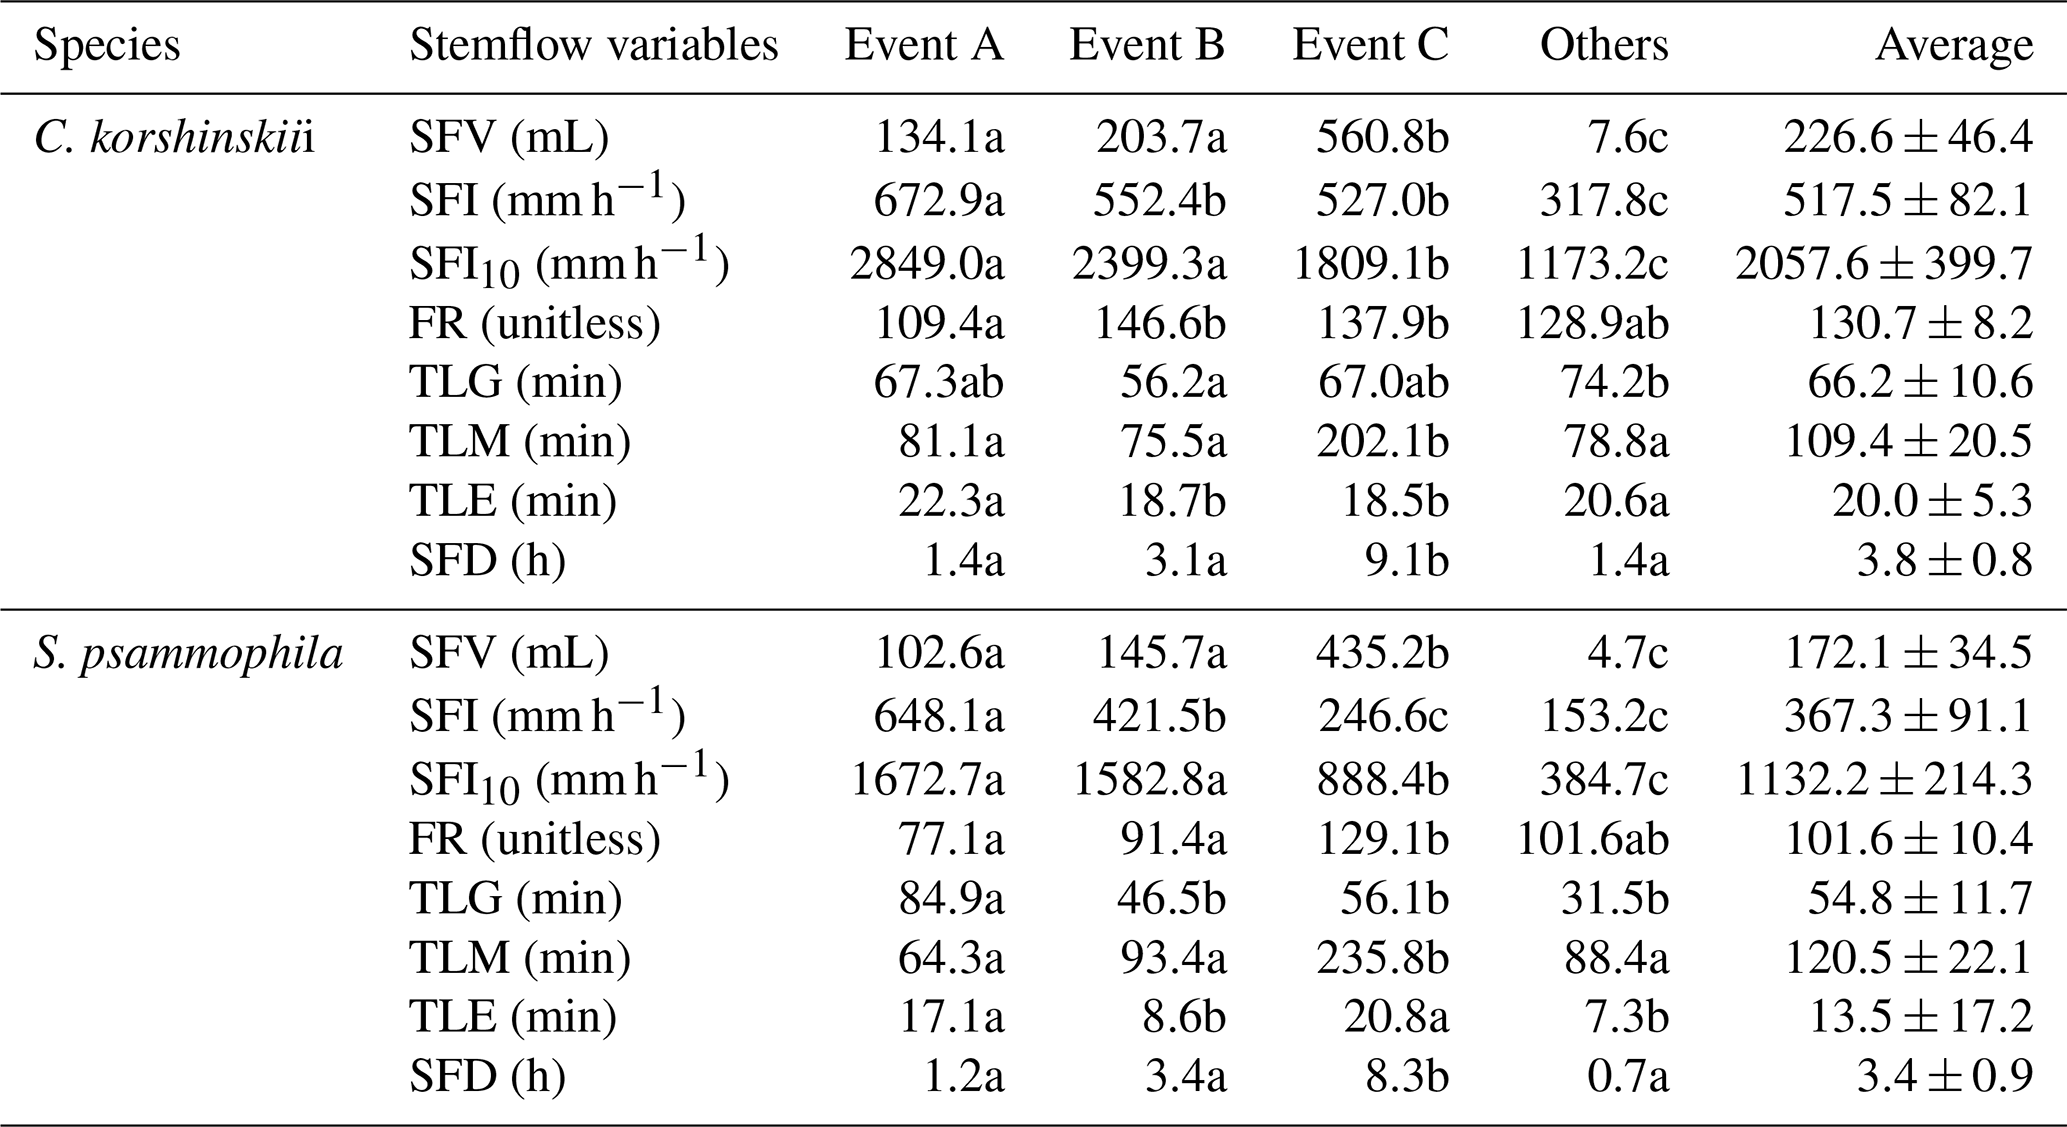
Note: Event A, Event B and Event C are events with the single, double and multiple rainfall intensity peaks, respectively. Others are the events that excluded from the categorization. SFV is stemflow volume. SFI and SFI10 are the average and 10 min maximum stemflow intensities at incident rain, respectively. FR is the funneling ratio of stemflow at incident rain. TLG and TLM are time lags of stemflow generating and maximizing after rain begin, respectively. TLE is time lag of stemflow ending after rain ceases. SFD is stemflow duration. Different letters indicate significant differences of stemflow variables between event categories (p < 0.05; rows at the table).
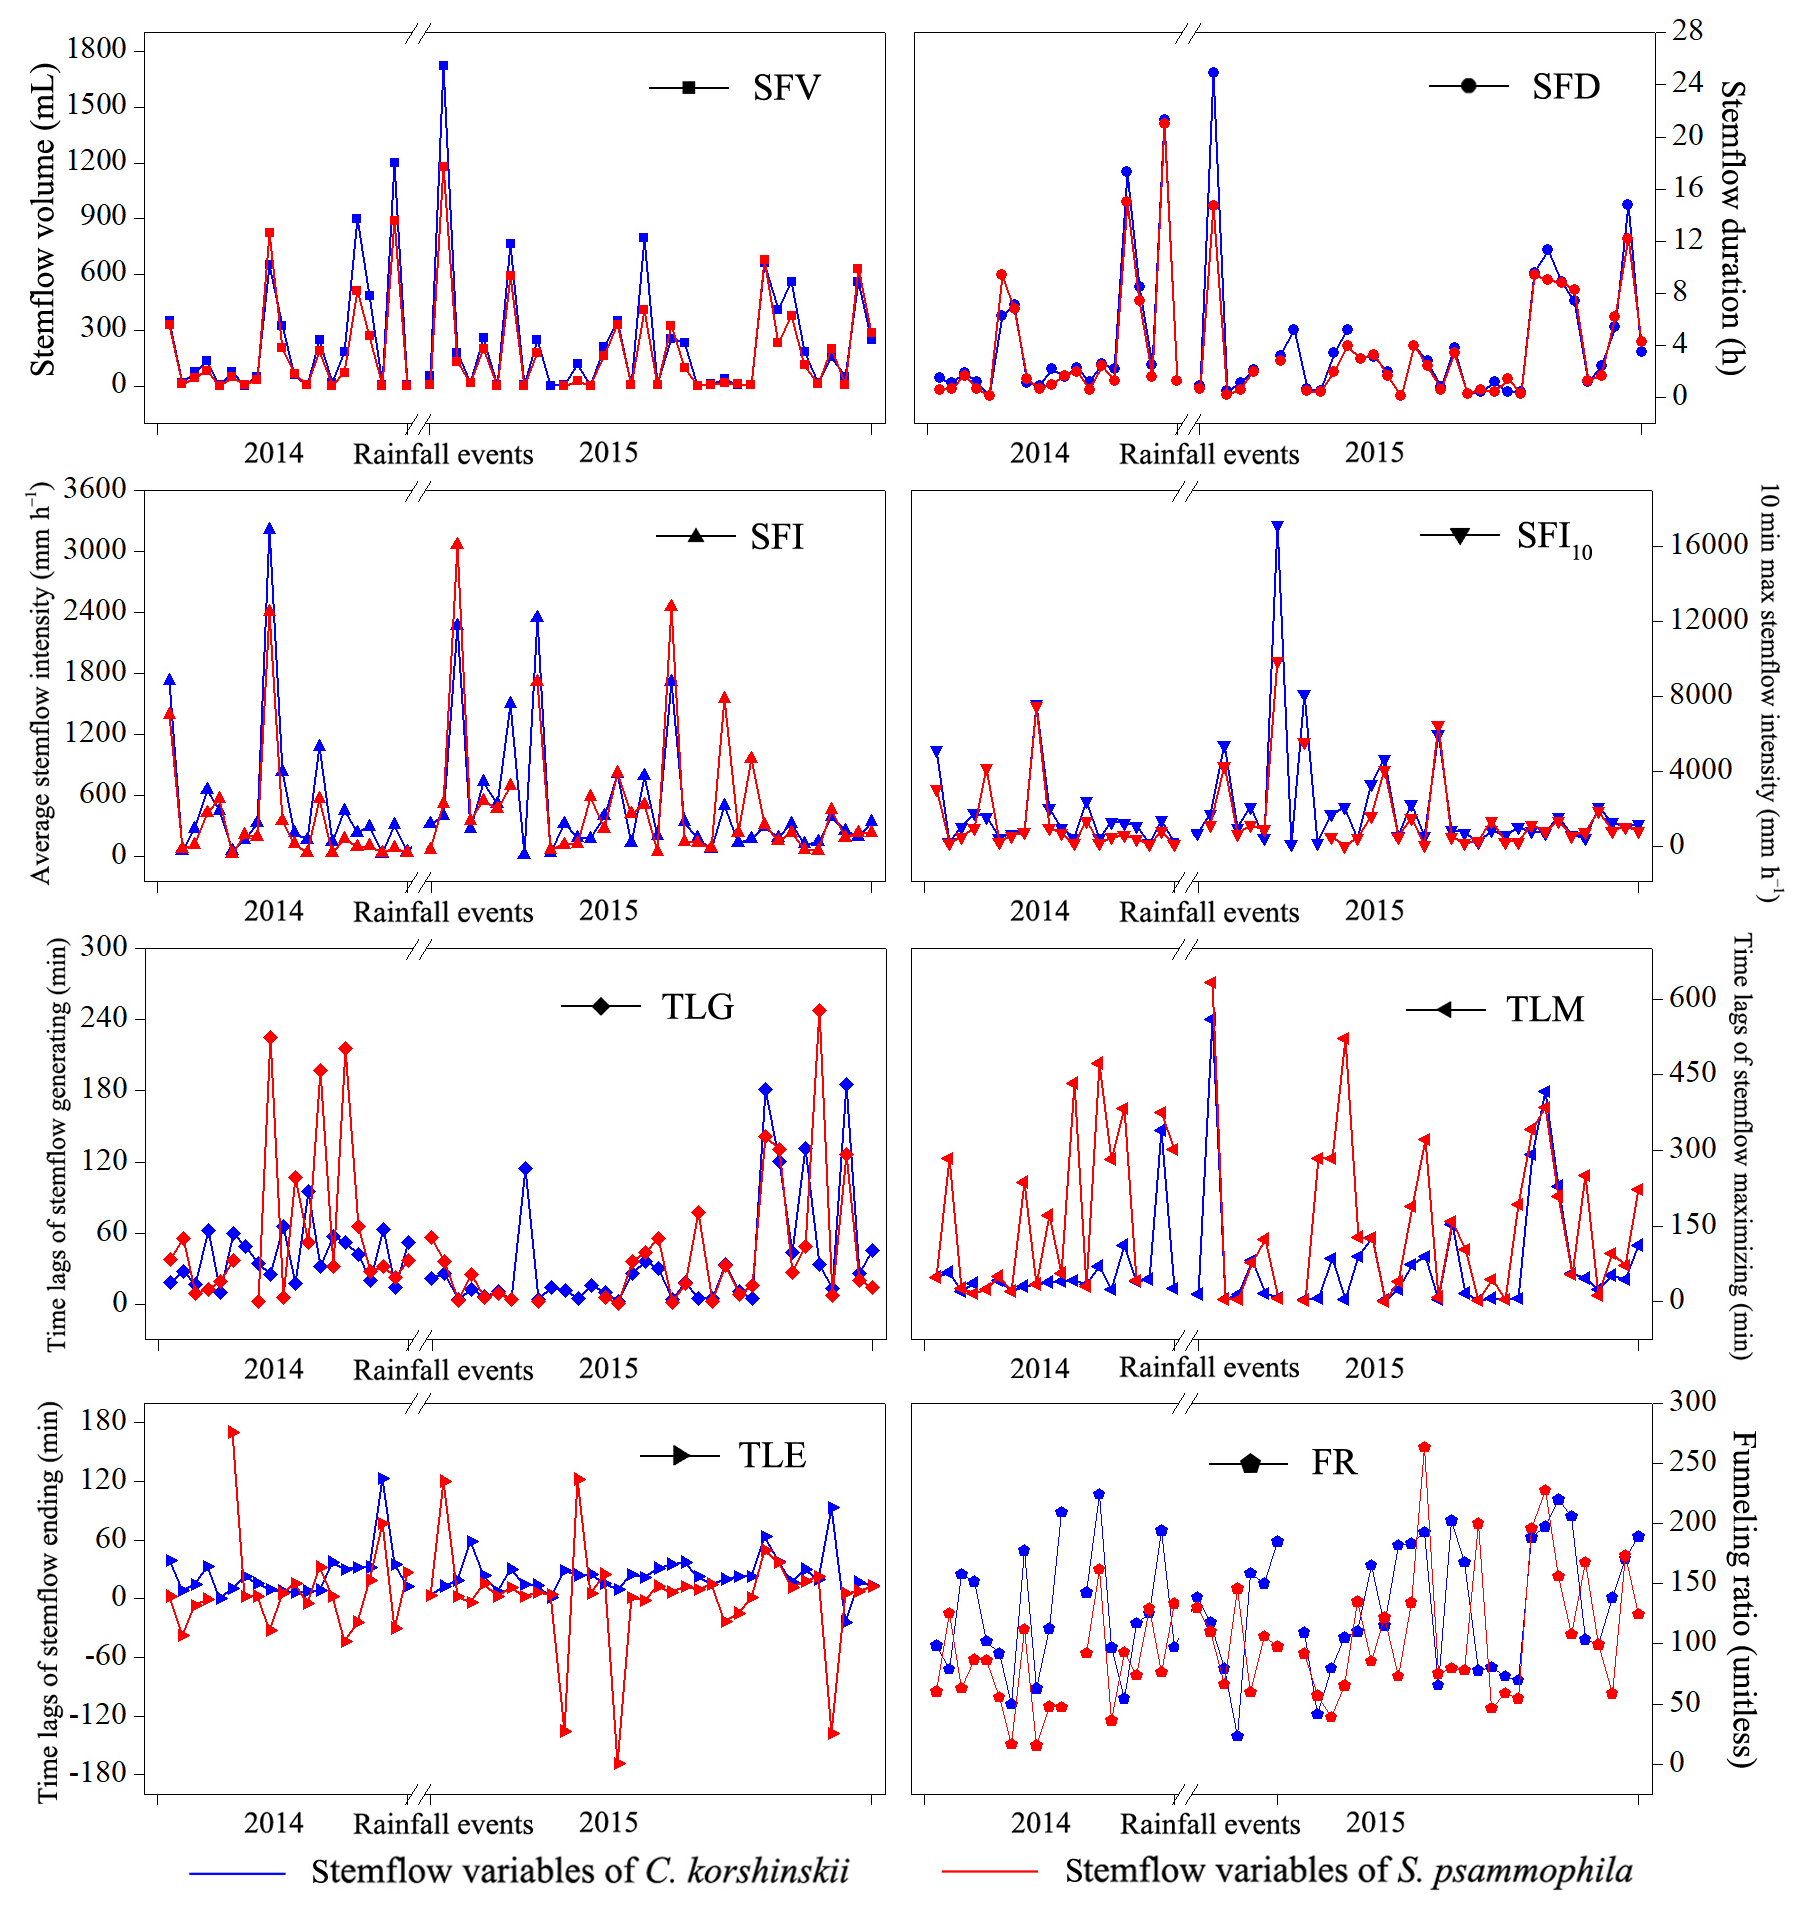
Figure 3Inter-event variations in stemflow variables of C. korshinskii and S. psammophila during the experimental period.
3.2 Inter- and intra-event stemflow variability
Stemflow variables of C. korshinskii and S. psammophila showed great inter-event variations during the experimental period (Fig. 3). C. korshinskii had larger SFV, SFI, SFI10, FR, SFD, TLG and TLE (226.6±46.4 mL, 517.5±82.1 mm h−1, 2057.6±399.7 mm h−1, 130.7±8.2, 3.8±0.8 h, 66.2±10.6 min and 20.0±5.3 min, respectively), but smaller TLM (109.4±20.5 min), than those of S. psammophila (172.1±34.5 mL, 367.3±91.1 mm h−1, 1132.2±214.3 mm h−1, 101.6±10.4, 3.4±0.9 h, 54.8±11.7 min, 13.5±17.2 min and 120.5±22.1 min, respectively; Table 3). During the 54 events, no negative values were observed for TLG and TLM, but they were observed for TLE. This indicated that stemflow generally initiated and maximized after rain started for both species. However, stemflow might end before (negative TLE) and after (positive TLE) rain ceased.
Stemflow synchronized well with rain with similar intensity peak shapes, amounts and positions for both species. These results were vividly demonstrated at representative rain events with different intensity peak amounts and RAs, including events on 17 July (Event A – 20.7 mm), 29 July (Event B – 7.3 mm) and 10 September 2015 (Event C – 13.3 mm; Fig. 4). C. korshinskii had larger FR100 values (91.7, 76.1 and 94.0, respectively) than those of S. psammophila (32.8, 26.3 and 43.7, respectively) during representative events. This indicated a comparatively greater ability of converging rain for C. korshinskii within events.
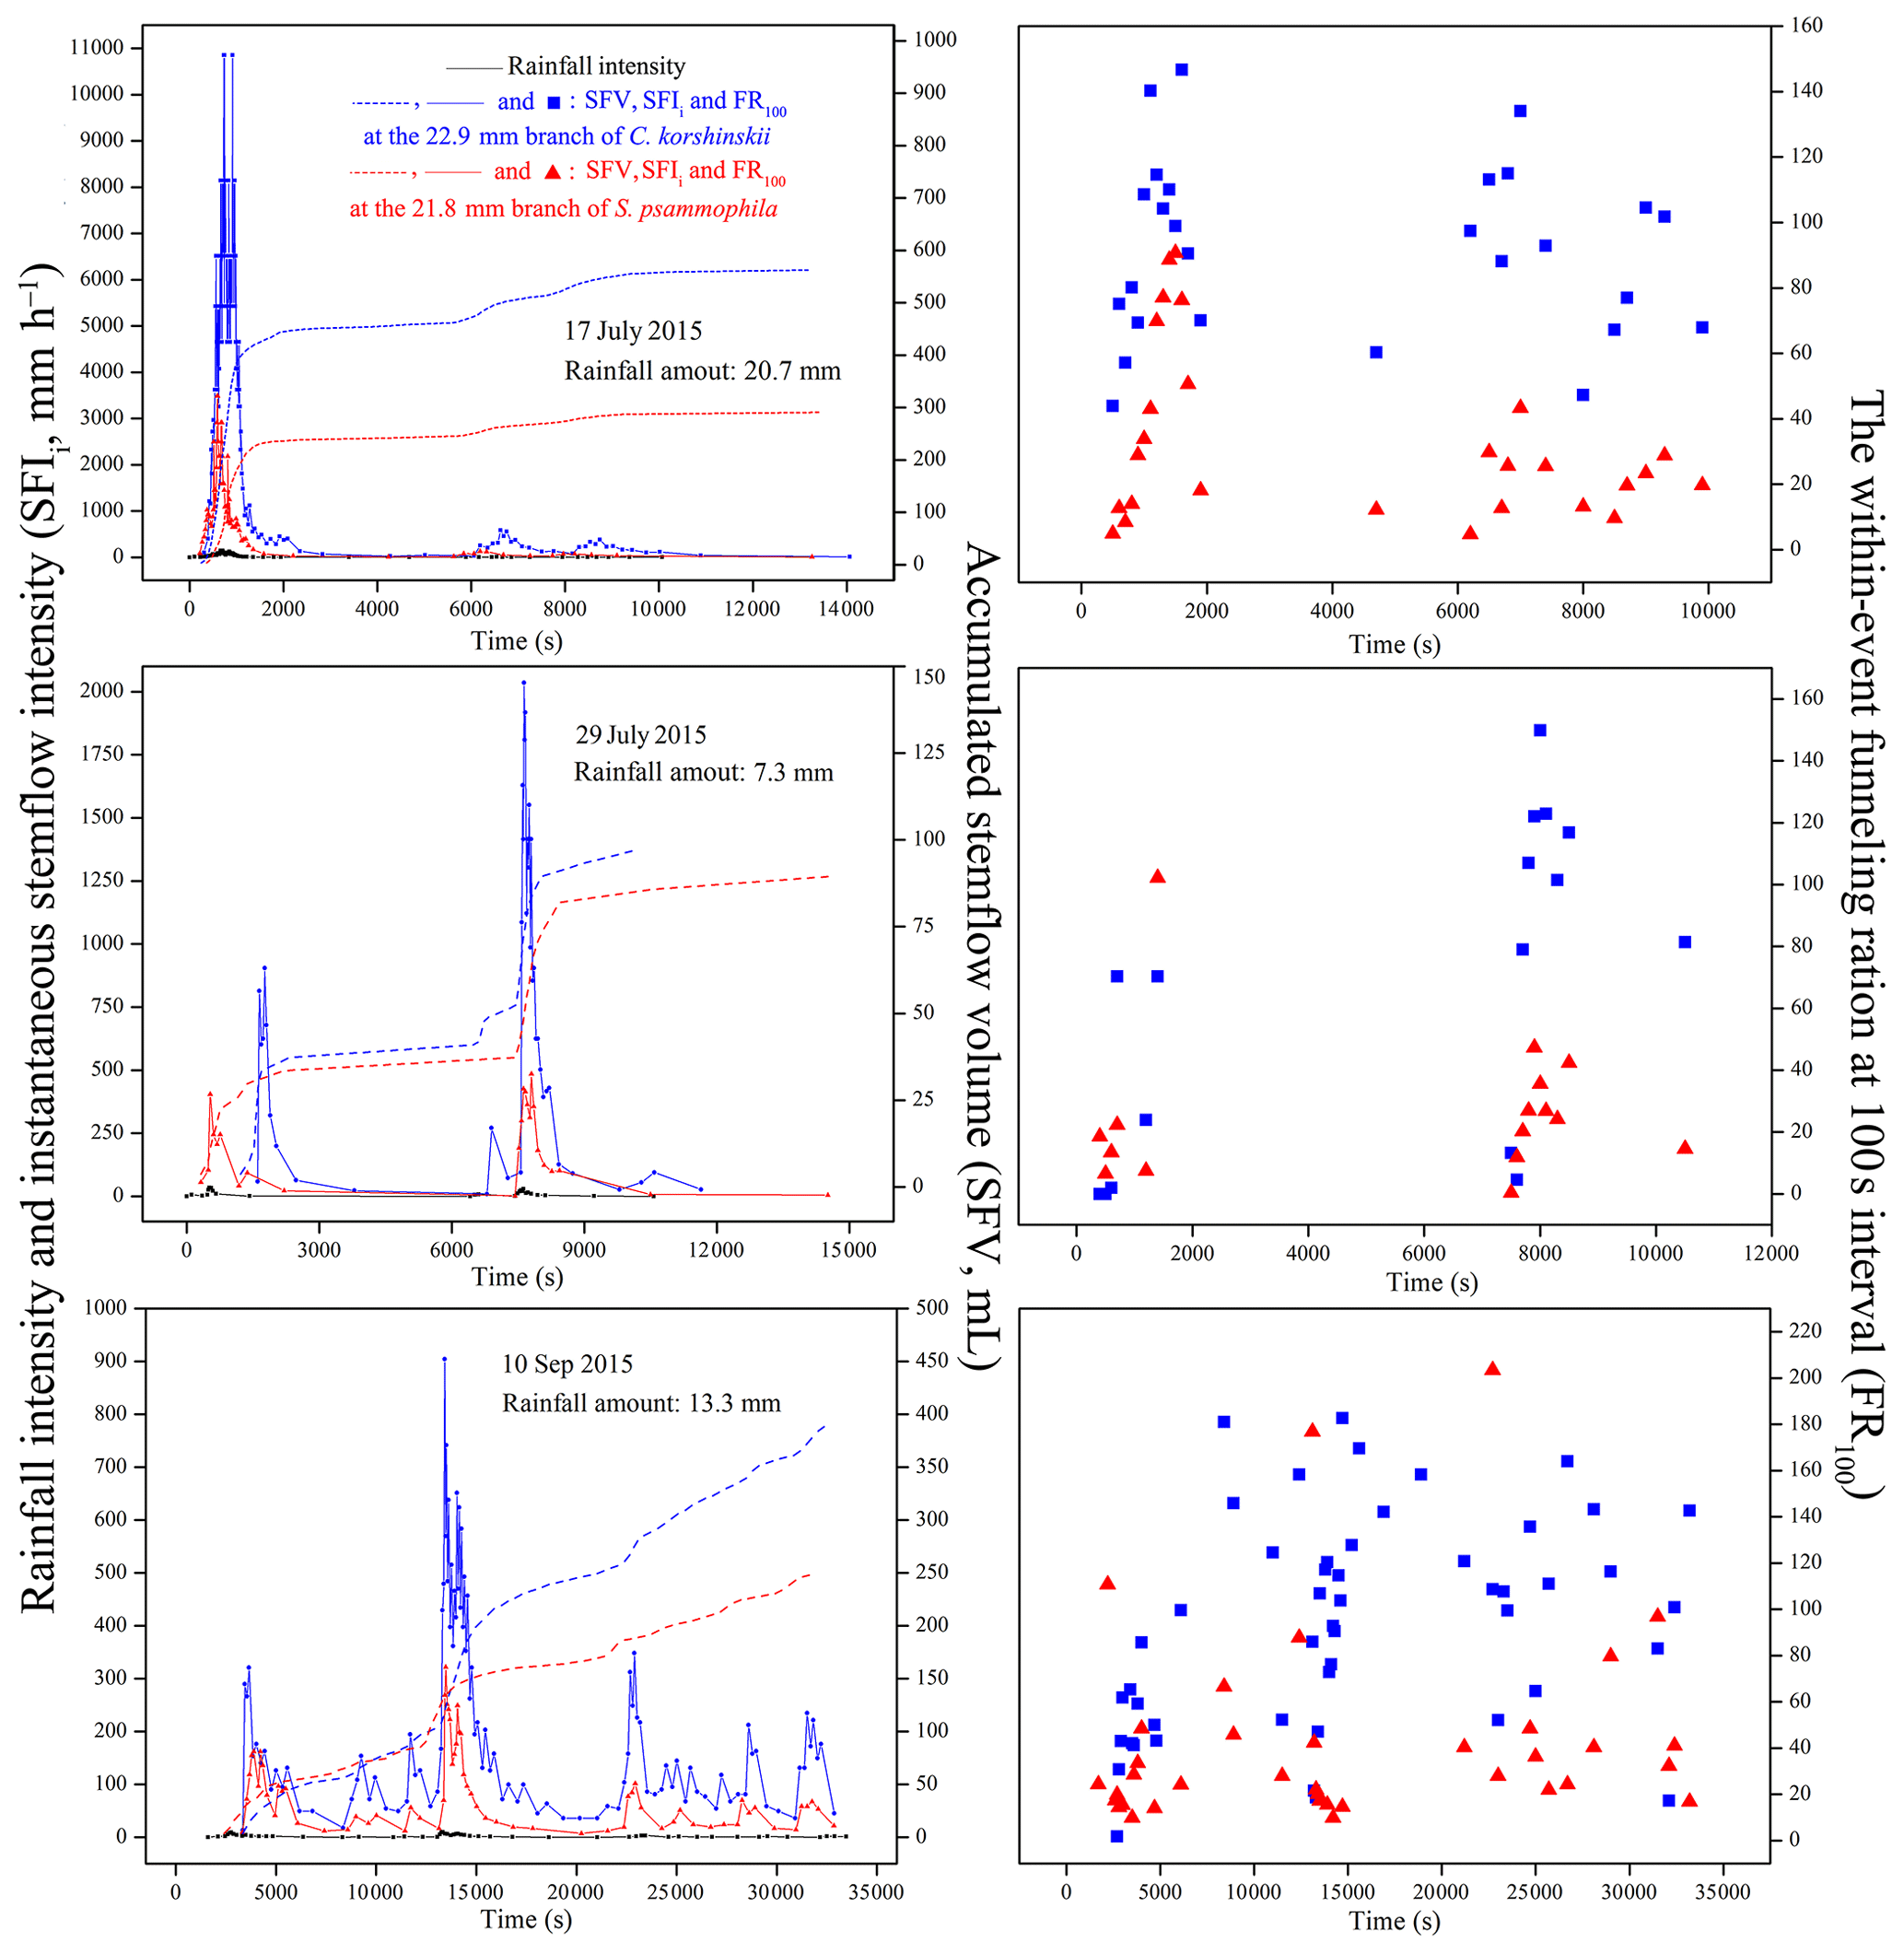
Figure 4Stemflow synchronicity of C. korshinskii and S. psammophila to rain during representative events with different rainfall-intensity peak amounts.
Stemflow variables differed between rainfall event categories. For Event C, in comparison with Event A and B, S. psammophila had significantly larger SFV (435.2 vs. 102.6 and 145.7 mL), SFD (8.3 vs. 1.2 and 3.4 h), TLM (235.8 vs. 64.3 and 93.4 min) and FR (129.1 vs. 77.1 and 91.4) and non-significantly larger TLE (20.8 vs. 17.1 and 8.6 min) but significantly smaller SFI (246.6 vs. 648.1 and 421.5 mm h−1) and SFI10 (888.4 vs. 1672.7 and 1582.8 mm h−1), respectively (Table 3). SFI decreased at events with increasing intensity peak amounts, as shown in Event A–C. The drop of SFI was offset by the decreasing I to some extent (Table 2), which might partly explain the increasing trend of FR from Event A to C; C. korshinskii shared similar changing trends of stemflow variables between event categories with those of S. psammophila, except for the non-significantly smaller TLE (18.5 min) at Event C, in contrast to TLE at Event A and B (22.3 and 18.7 min).
Table 4Comparisons of the stemflow intensity and funneling ratio at different basal diameter categories.
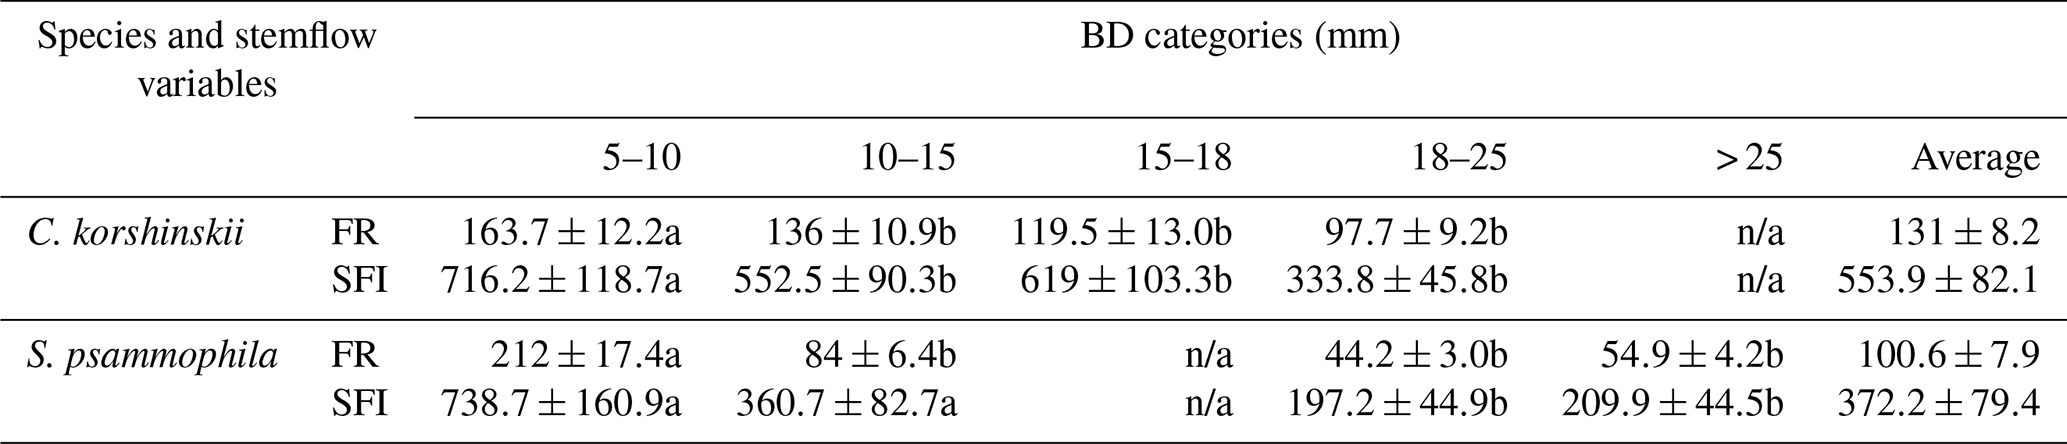
Note: SFI and FR are the average stemflow intensity and funneling ratio at incident rain, respectively. BD is branch basal diameter (mm). n/a means not applicable. Different letters indicate significant differences of stemflow variables between event categories (p < 0.05; rows at the table).
The funneling ratio and stemflow intensity were negatively related to branch size. C. korshinskii and S. psammophila had significantly greater FR, SFI and SFI10 at the 5–10 mm branches than those at the larger branches (Table 4). For C. korshinskii, FR decreased from 163.7±12.2 at the 5–10 mm branches to 97.7±9.2 at the 18–25 mm branches, respectively. It was consistent with decreasing SFI (333.8–716.2 mm h−1) at the corresponding BD categories (Table 4). As branch size increased, S. psammophila shared similar decreasing trends of FR (44.2–212.0) and SFI (197.2–738.7 mm h−1).
3.3 Relationships between stemflow variables and rainfall characteristics
C. korshinskii and S. psammophila had similar correspondence patterns between rainfall characteristics and stemflow variables. Shown in Fig. 5, the 1 : 1 correspondences were observed for SFV and TLE. The larger (or smaller) SFV and TLE corresponded to the larger (or smaller) RA and RI, respectively. This result demonstrated the dominant influences of RA and RI on SFV and TLE, respectively. The 1 : 2 correspondences were noted for SFD with RD and E. The larger (or smaller) SFD corresponded to the larger (or smaller) RD and smaller (or larger) E. RA was identified as the dominant rainfall characteristic affecting FR based on the analysis for 53 branches of C. korshinskii and 98 branches of S. psammophila at the same plots during the same experimental period (Yuan et al., 2017). It seemed that event-based stemflow production (the volume, duration and efficiency) were strongly influenced by rainfall characteristics at the inter-event scale (the rainfall amount and duration).
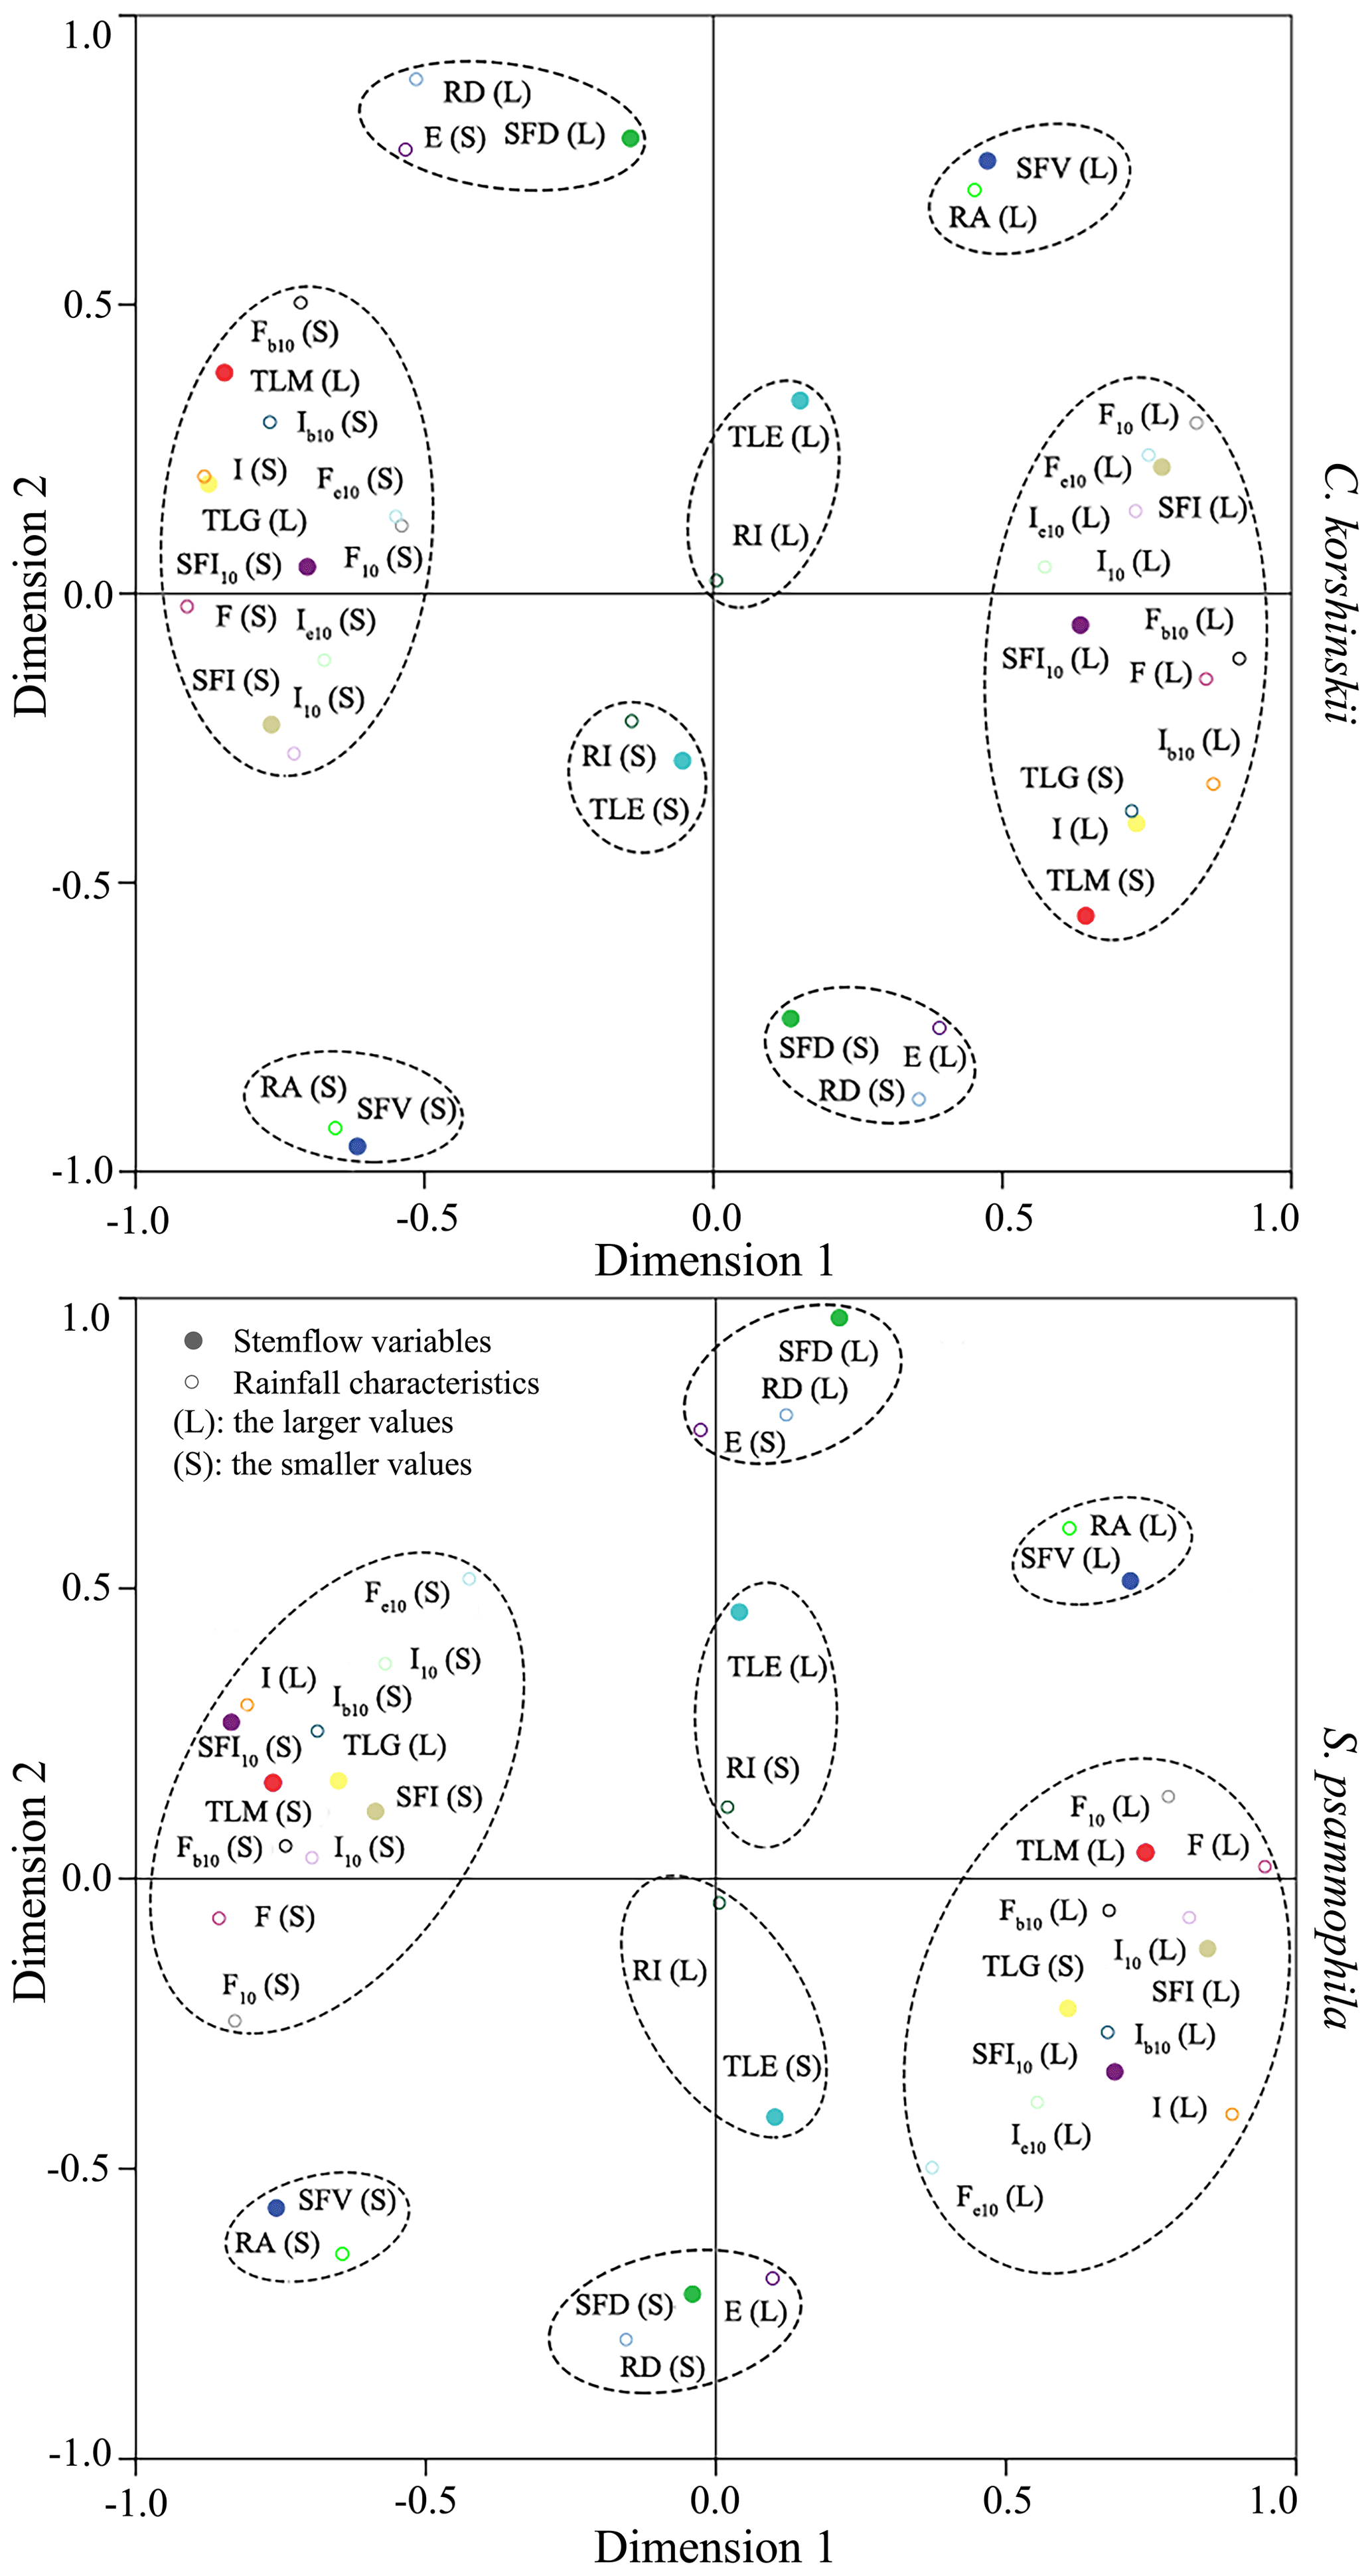
Figure 5Correspondence maps of stemflow variables with rainfall characteristics for C. korshinskii and S. psammophila.
The one-to-many correspondences were observed for TLM, TLG, SFI and SFI10 (Fig. 5). The larger (or smaller) TLM corresponded to the smaller (or larger) rainfall characteristics of I, I10, Ib10, Ie10, F, F10, Fb10 and Fe10. The same correspondences were applied to the larger (or smaller) TLG and the smaller (or larger) SFI and SFI10. It seemed that the within-event stemflow processes (SFI, SFI10, TLG and TLM) were strongly affected by rainfall characteristics at intra-event scale (the rainfall intensity and raindrop momentum). Therefore, these results indicated that rainfall characteristics influenced stemflow variables at the corresponding temporal scales. This influence occurred at the inter-event scale between SFV and RA, FR and RA, and SFD and RD and at the intra-event scale for stemflow time lags (TLG and TLM) and intensities (SFI and SFI10) with rainfall intensity (I, I10, Ib10 and Ie10) and raindrop momentum (F, F10, Fb10 and Fe10). The only exception was noted between TLE and RI for the mismatched temporal sales.
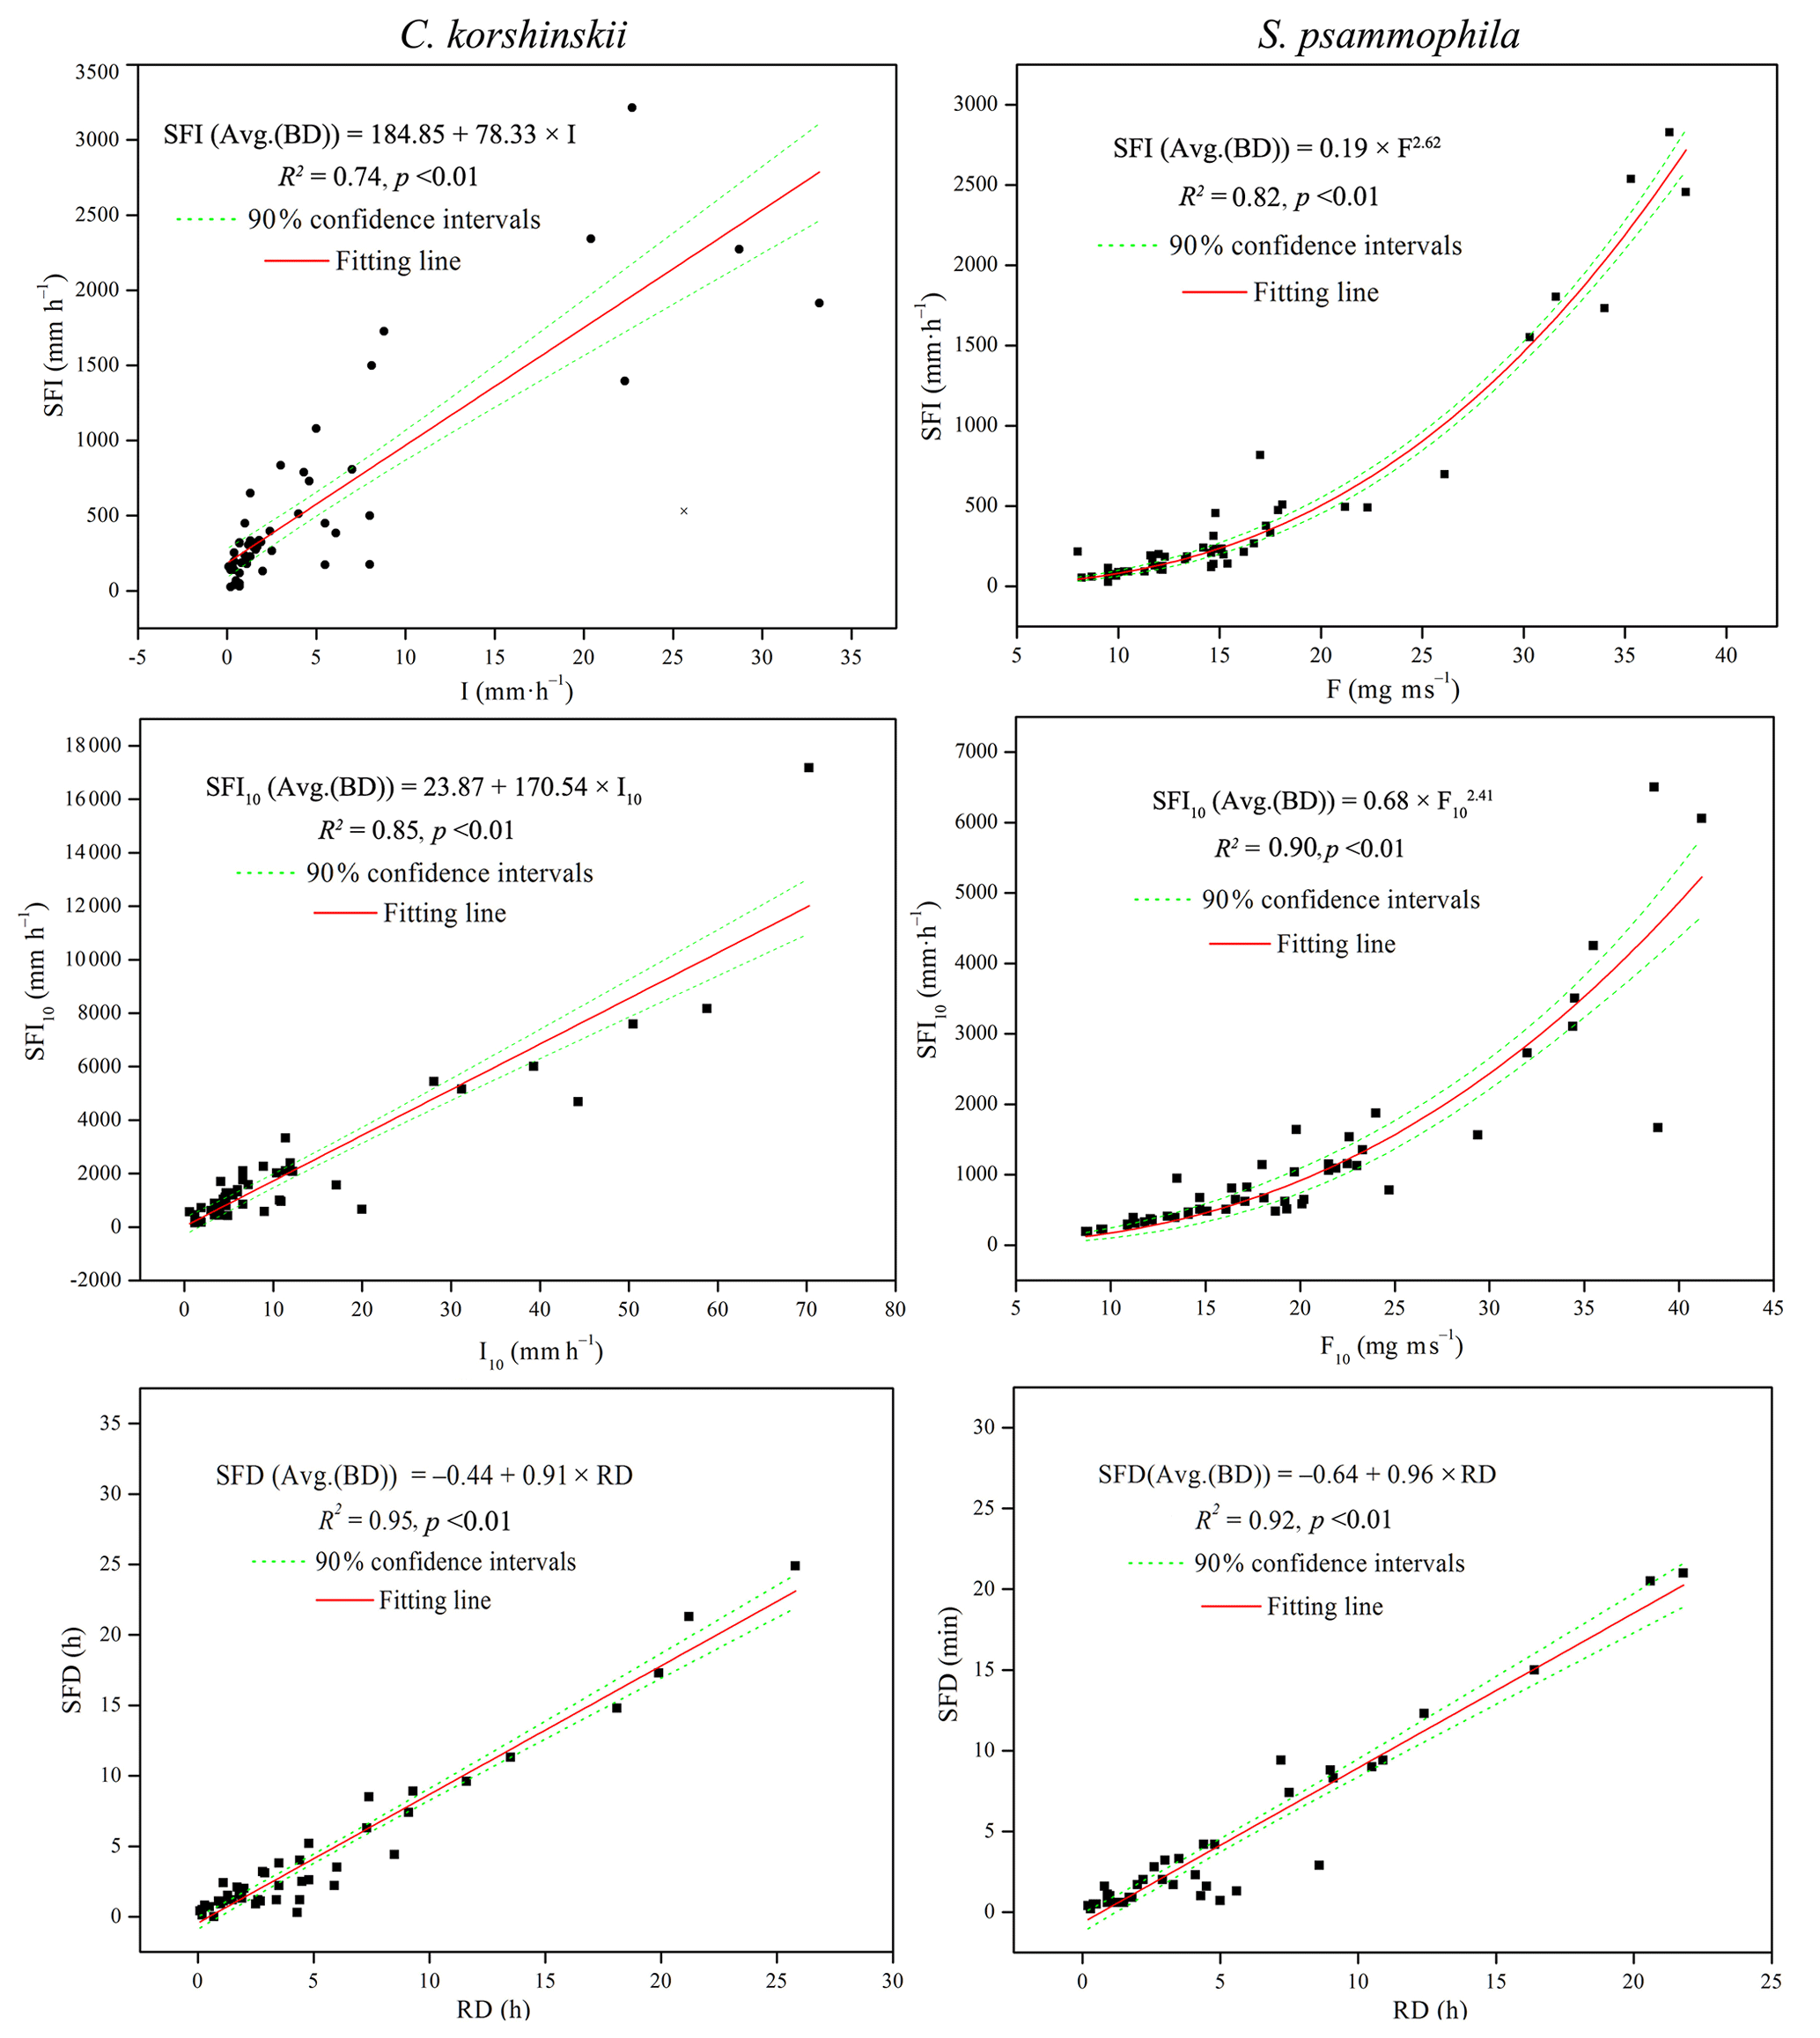
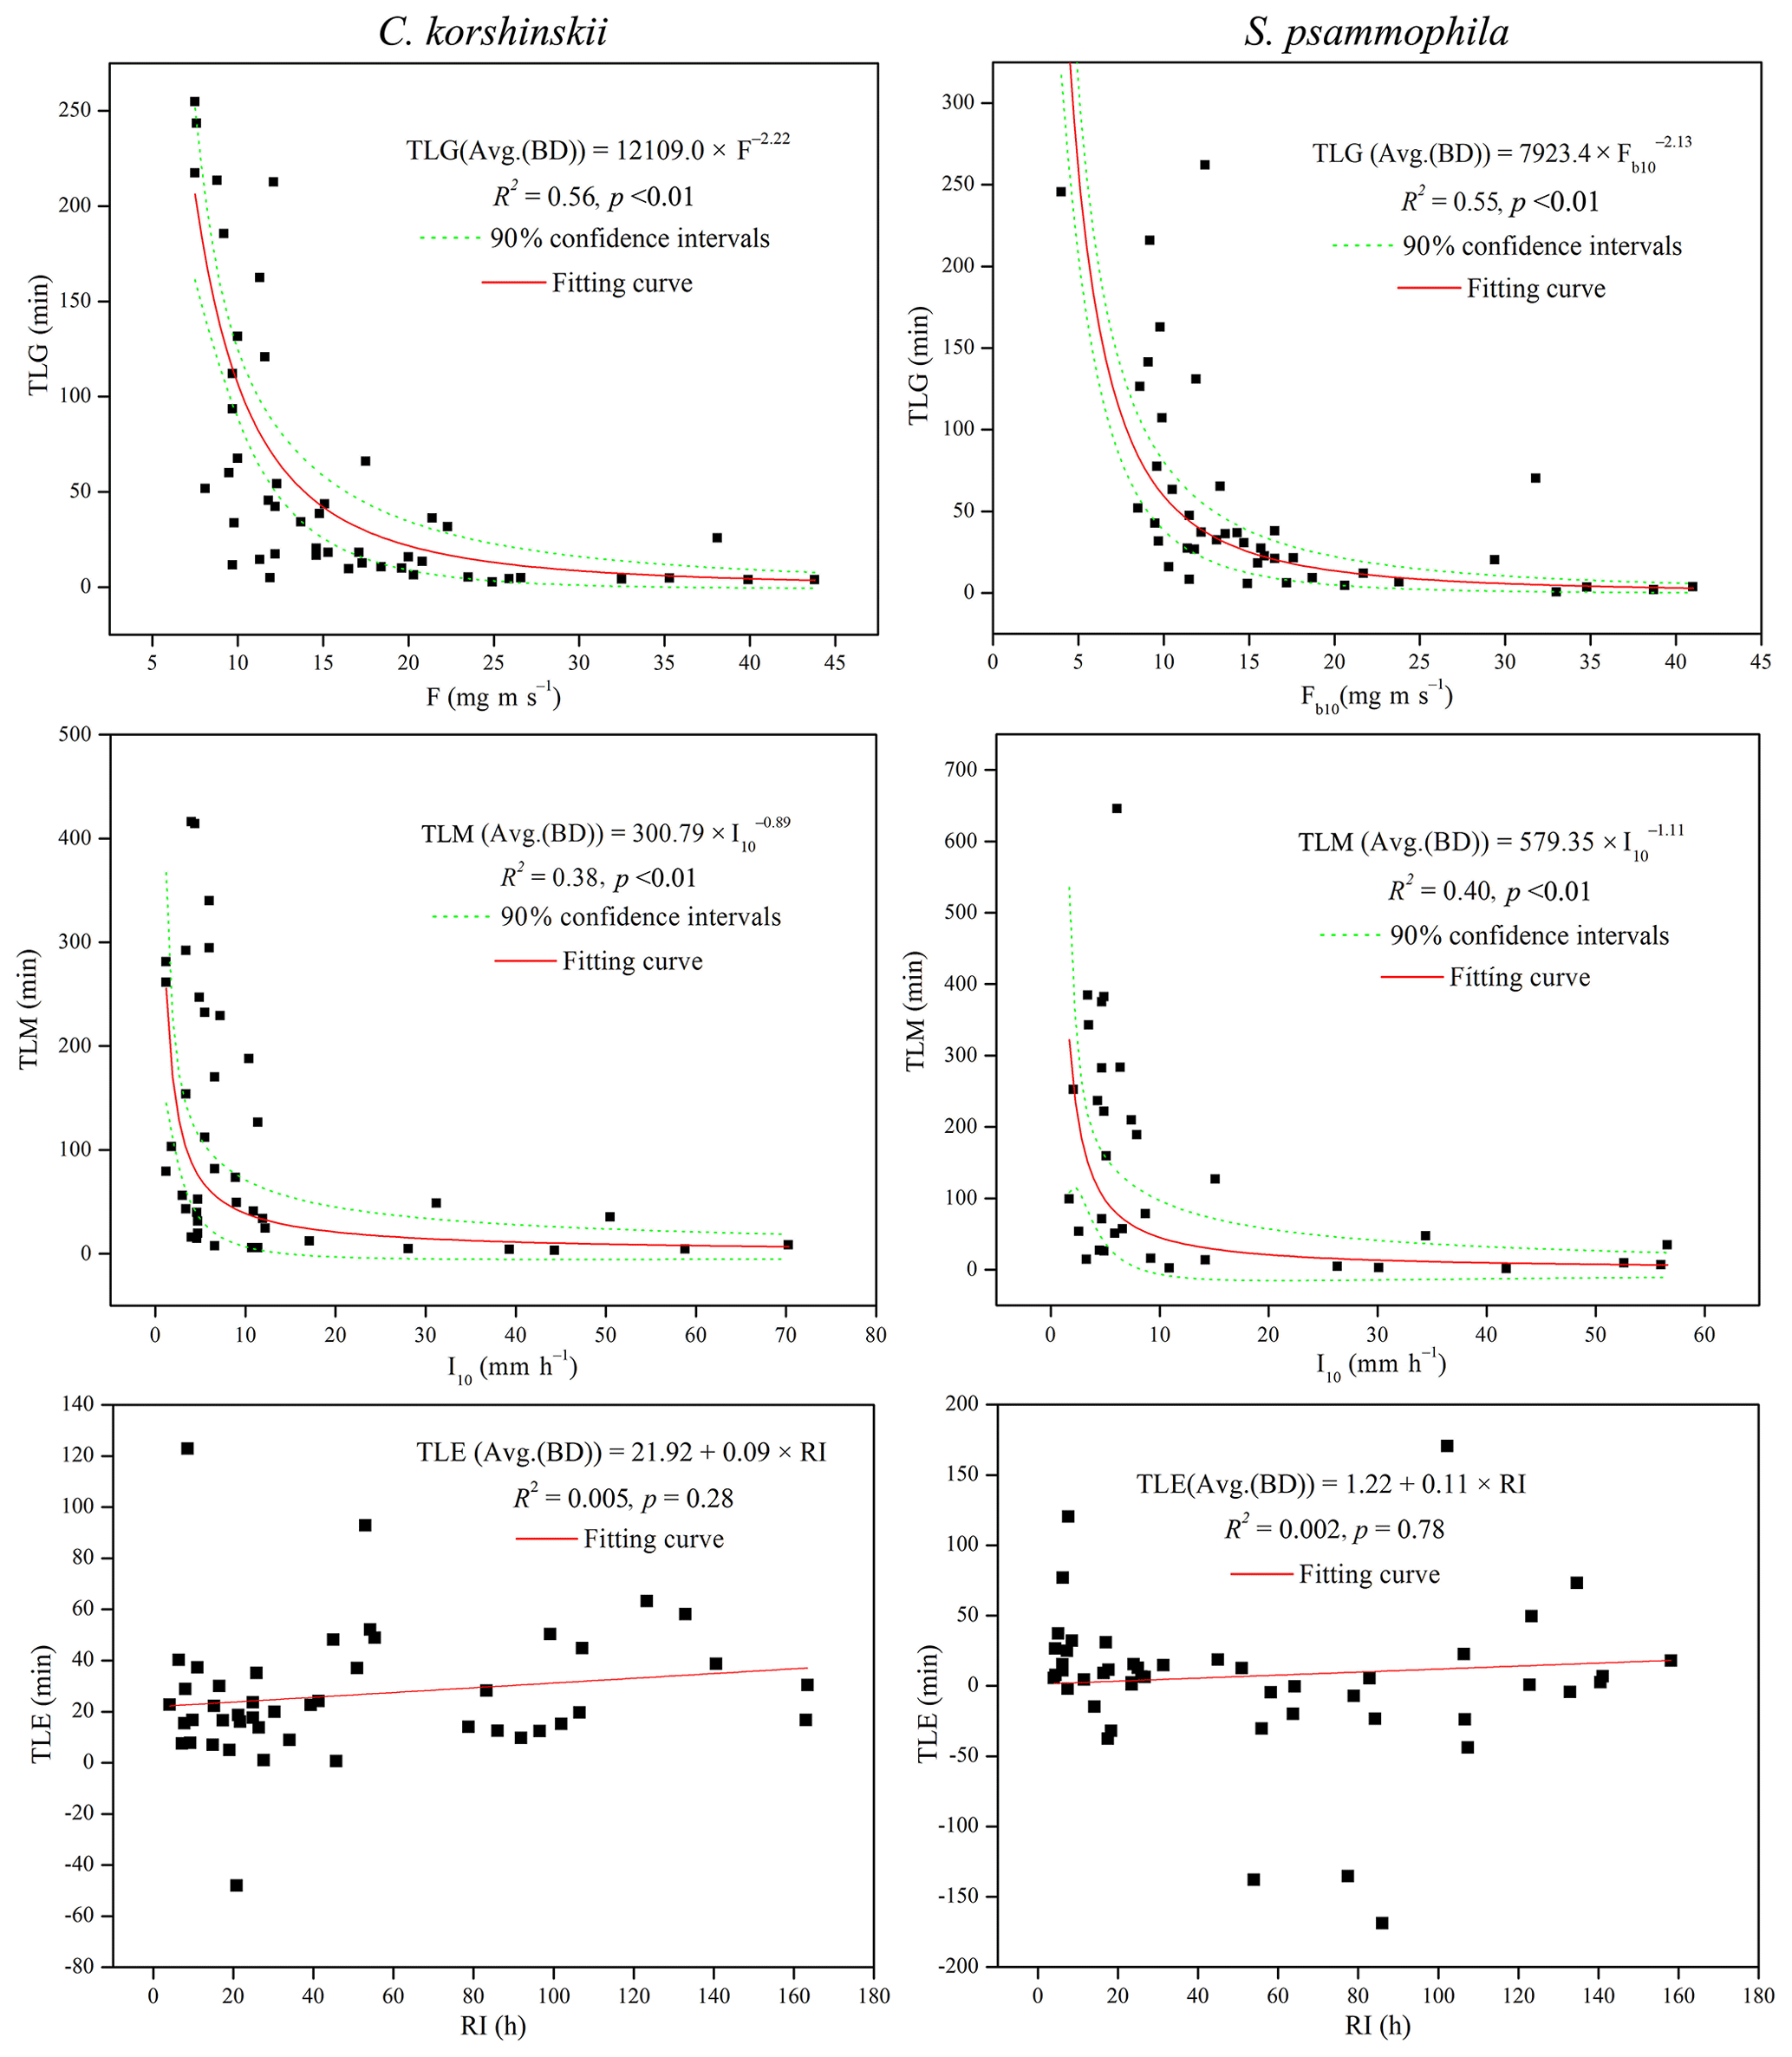
Stepwise regression analysis identified the most influential rainfall characteristics affecting stemflow intensities and temporal dynamics. RD was the dominant rainfall characteristics affecting SFD. I10 significantly affected the TLM of both species. For C. korshinskii, I, I10 and F were the most influential factors on SFI, SFI10 and TLG, respectively. However, for S. psammophila, F, F10 and Fb10 significantly affected SFI, SFI10 and TLG, respectively. The results of multiple regression analyses indicated that there were linear relationships between SFI and I (R2=0.74, p < 0.01) and SFI10 and I10 (R2=0.85, p < 0.01) for C. korshinskii and between SFD and RD for C. korshinskii (R2=0.95, p < 0.01) and S. psammophila (R2=0.92, p < 0.01; Fig. 6). Moreover, power-functional relations were found between SFI and F (R2=0.82, p < 0.01), SFI10 and F10 (R2=0.90, p < 0.01; Fig. 6), TLG and Fb10 (R2=0.55, p < 0.01), and TLM and I10 (R2=0.40, p < 0.01; Fig. 7) for S. psammophila and TLG and F (R2=0.56, p < 0.01) and TLM and I10 (R2=0.38, p < 0.01; Fig. 7) for C. korshinskii. However, there was no significant quantitative relationship between TLE and RI for C. korshinskii (R2=0.005, p=0.28) or S. psammophila (R2=0.002, p=0.78; Fig. 7).
4.1 Stemflow intensity and funneling ratio
Stemflow intensity is generally greater than rainfall intensity for different plant life forms. The xerophytic shrubs of C. korshinskii and S. psammophila had larger average stemflow intensities than the average rainfall intensity (517.5 and 367.3 vs. 4.5 mm h−1). Broadleaf and coniferous species (Quercus pubescens Willd. and Pinus sylvestris L., respectively) also have larger maximum stemflow intensities than the maximum rainfall intensity in northeastern Spain (Cayuela et al., 2018). The gap between stemflow and rainfall intensities generally increased as the recording time intervals decreased. While recording at the 1 h intervals, approximately 20-, 17-, 13- and 2.5-fold greater peak stemflow intensities were observed for cedar, birch, Douglas fir and hemlock trees, respectively, at the coastal British Columbia forest (Spencer and van Meerveld, 2016). For C. korshinskii and S. psammophila, in comparison to I10 (10.9 mm h−1) at 10 min intervals, the SFI10 (2057.6 and 1132.2 mm h−1, respectively) was over 103.9-fold greater. The recordings at 6 min interval indicated a 157-fold larger stemflow intensity (18 840 mm h−1) than rainfall intensity (120 mm h−1) in the cyclone-prone tropical rainforest with an extremely high MAP of 6570 mm (Herwitz, 1986). While calculating the dynamic time interval between neighboring tips of TBRG, SFIi (10816.2 mm h−1) was 150.2-fold greater than the corresponding rainfall intensity (72 mm h−1). Therefore, stemflow recorded at a higher temporal resolution might provide more information into the dynamic nature of stemflow and real-time responses to rainfall characteristics within events.
Greater stemflow intensity than rainfall intensity is hydrologically significant at terrestrial ecosystems. This scenario indicates the convergence of the canopy-intercepted rain into the limited area around trunk or branch bases within a certain time period, i.e., 8.0 % and 3.5 % of rain being directed to the trunk base only accounting for 0.3 % and 0.4 % of plot area in the open rainforest (Germer et al., 2010) and undisturbed lowland tropical rainforest (Manfroi et al., 2004), respectively. Besides this, FR, which compared SFV with the RA that would have been collected at the same area as the basal area at an event scale (Herwitz, 1986), is commonly applied to assess the convergence effect via stemflow volume, rainfall amount and basal area (Carlyle-Moses et al., 2010; Siegert and Levia, 2014; Fan et al., 2015; Yang et al., 2019). If FR is greater than 1, more water is collected at the trunk or branch base than at the clearings. Both methods successfully quantified the convergence effects of stemflow. However, the former provided a possibility of assessing it at high temporal resolutions within events.
This study established the quantitative connection between FR and stemflow intensity. As per Eq. (14) and the average stemflow and rainfall intensities listed at Tables 2 and 3, FR could be estimated to be 115.0 and 81.6 for C. korshinskii and S. psammophila, respectively. Those results approximately agreed with FR of 173.3 and 69.3 (Yuan et al., 2017) and 124.9 and 78.2 (Yang et al., 2019) for the two species by applying the traditional calculation based on SFV and RA (Herwitz, 1986). As branch size increased, FR of C. korshinskii decreased from 163.7 at the 5–10 mm branches to 97.7 at the 18–25 mm branches. The decreasing trend of FR of S. psammophila was also noted in the range of 44.2–212.0 with increasing BD. The negative relation between BD and FR agreed with the reports for trees and babassu palms in an open tropical rainforest in Brazil (Germer et al., 2010), for the mixed-species coastal forest in British Columbia in Canada (Spencer and van Meerveld, 2016), and for trees (Pinus tabuliformis and Armeniaca vulgaris) and shrubs (C. korshinskii and S. psammophila) on the Loess Plateau of China (Yang et al., 2019). It might be partly explained by the decreasing stemflow intensities with increasing branch size as per Eq. (14). Our results found that SFI decreased from 716.2 to 333.8 for C. korshinskii and 738.7 to 197.2 for S. psammophila as branch size increased (Table 4). It justified the importance of branch size on stemflow intensity well. Associated with the infiltration rate, the stemflow-induced hydrological process might be strongly affected, i.e., with respect to soil moisture recharge, Hortonian overland flow (Herwitz, 1986), saturation overland flow (Germer et al., 2010), soil erosion (Liang et al., 2011), nutrient leaching (Corti et al., 2019), etc. Therefore, more attention should be paid to tree or branch size and size-related stand age at future studies while modeling the stemflow-induced terrestrial hydrological fluxes.
The importance was addressed to study the funneling ratio at the stand scale (Carlyle-Moses et al., 2018); however, it had not been adequately studied at the intra-event scale. This study calculated the average funneling ratio at the event base and the 100 s intervals after rain began. Thus, the convergence effect of stemflow could be better understood at the inter- and intra-event scales. Our results found that FR100 values were over 1.8-fold greater than FR of C. korshinskii (282.7 vs. 130.7) and S. psammophila (203.4 vs. 101.6), respectively. It indicated that the funneling ratio fluctuated dramatically within events. Therefore, computing FR at events and ignoring it at high temporal resolutions within events might underestimate the ecohydrological significance of stemflow.
In general, stemflow intensity highly related to the funneling ratio. For addressing its ecohydrological importance, stemflow intensity should be precisely defined. It was expressed as the stemflow volume per basal area of branches and/or trunks per unit of time with the unit of millimeters per hour (Herwitz, 1986; Spencer and van Meerveld, 2016) and millimeters per 5 min (Cayuela et al., 2018). However, stemflow intensity was described as stemflow volume per unit of time with the unit of liters per week (Schimmack et al., 1993) and liters per hour (Liang et al., 2011; Germer et al., 2013). We highly recommended the former definition. Because of its highly spatially related attribution (Herwitz, 1986; Liang et al., 2011, 2014), the ecohydrological significance of stemflow would be underestimated by ignoring the basal area over which stemflow was received. Moreover, as per this definition, stemflow intensity quantitatively connected with the funneling ratio via Eq. (14). Thus, the funneling ratio could be used to assess the convergence effect of stemflow at both inter- and intra-event scales.
4.2 Stemflow temporal dynamics
Stemflow synchronized well with the rain. It agreed with the report of Levia et al. (2010), who demonstrated a marked synchronicity between SFV and RA in 5 min intervals for Fagus grandifolia. The duration and time lags to rain were critical for describing stemflow temporal dynamics. Our results indicated that in comparison to S. psammophila, C. korshinskii takes a longer time to initiate (66.2 vs. 54.8 min), end (20.0 vs. 13.5 min) and produce stemflow (3.8 vs. 3.4 h) but a shorter time to maximize stemflow (109.4 vs. 120.5 min). Moreover, the TLMs of both species were in the range of the TLMs for S. psammophila (20–210 min) in the Mu Us desert of China (Yang, 2010).
Varying TLGs were documented for different species. Approximately 15 min, 1 h and 1.5 h were needed to initiate the stemflow of palms (Germer, 2010), pine trees and oak trees (Cayuela et al., 2018), respectively. In addition, an almost instantaneous start of stemflow was also observed as rain began for Quercus rubra (Durocher, 1990), Fagus grandifolia and Liriodendron tulipifera (Levia et al., 2010). Compared to the positive TLE dominating xerophytic shrubs, the TLE greatly varied with tree species. TLE was as much as 48 h for Douglas fir, oak and redwood in California, USA (Reid and Levia, 2009), and almost 11 h for palm trees in Brazil (Germer, 2010). However, for sweet chestnut and oak, almost no stemflow continued when rain ceased in Bristol, England (Durocher, 1990). These scenarios might occur due to the sponge effect of the canopy surface (Germer, 2010), which buffered stemflow generation, maximization and cessation before saturation. These conclusions were more consistent with the smaller stemflow intensities of C. korshinskii and S. psammophila than the rainfall intensity when rain began, as part of the rain was used to wet canopies (Fig. 4). The hydrophobic bark traits benefited stemflow initiation with the limited time lags to rain. In contrast, the hydrophilic bark traits were conducive to continuing stemflow after rain ceased, which kept the preferential flow paths wetter for longer time periods (Levia and Germer, 2015). As a result, it took time to transfer intercepted rain from the leaf, branch and trunk to the base. This process strongly affects the stemflow volume, intensity and loss from evaporation.
The dynamics of intra-event rainfall intensity complicated the stemflow time lags to rain. A 1 h lag to begin and stop stemflow with the beginning and ending of rain was observed for Ashe juniper trees during high-intensity events, but no stemflow was generated in low-intensity storms (Owens et al., 2006). Rainfall intensity was an important dynamic rainfall characteristic affecting stemflow volume. Owens et al. (2006) found the most significant difference between various rainfall intensities to be located in the stemflow patterns other than throughfall and interception loss. During events with a front-positioned, single rainfall-intensity peak, S. psammophila maximized stemflow in a shorter time than C. korshinskii in the Mu Us desert (30 and 50 min; Yang, 2010). These results highlighted the amounts and occurrence time of the rainfall-intensity peak affecting the stemflow process, which was consistent with the findings of Dunkerley (2014b).
Raindrops presented rainfall characteristics at finer spatiotemporal scales. They were usually ignored because rain was generally regarded as a continuum rather than a discrete process consisting of individual raindrops of various sizes, velocities, inclination angles and kinetic energies. Raindrops hit the canopy surface and created splashes at different canopy layers (Bassette and Bussière, 2008; Li et al., 2016). This process accelerated canopy wetting and increased water supply for stemflow production. Therefore, raindrop momentum was introduced in this study to represent the comprehensive effects of raindrop attributes. Our results indicated that raindrop momentum was sensitive to predicting the variations in stemflow intensity and temporal dynamics with significant linear or power-functional relations (Figs. 6 and 7). Compared with the importance of rainfall intensity for C. korshinskii, raindrop momentum more significantly affected the stemflow process of S. psammophila. This result might be related to the larger canopy size and height of S. psammophila (21.4±5.2 m2 and 3.5±0.2 m, respectively) than those of C. korshinskii (5.1±0.3 m2 and 2.1±0.2 m, respectively). More layers were available within canopies of S. psammophila to intercept the splashes created by raindrop striking (Bassette and Bussière, 2008; Li et al., 2016), thus shortening the paths and having a bigger water supply for stemflow production.
4.3 Temporally dependent influences of rainfall characteristics on stemflow variability
This study discussed stemflow variables and rainfall characteristics at inter- and intra-event scales. We found that rainfall characteristics affected stemflow variables at the corresponding temporal scales. RA and RD controlled SFV, FR and SFD, respectively, at the inter-event scale. However, stemflow intensity (e.g., SFI and SFI10) and temporal dynamics (e.g., TLG and TLM) were strongly influenced by rainfall intensity (e.g., I, I10 and Ib10) and raindrop momentum (e.g., F, F10 and Fb10) at the intra-event scales. These results were verified by the well-fitting linear or power-functional equations among them (Figs. 6 and 7). Furthermore, the influences of rainfall intensity and raindrop momentum on stemflow process were specific to species. In contrast to the significance of rainfall intensity on the stemflow process of C. korshinskii, raindrop momentum imposed a greater influence on the stemflow process of S. psammophila.
In general, rainfall characteristics had temporally dependent influences on the corresponding stemflow variables. The only exception was found between TLE and RI. RI tightly corresponded to TLE for both species tested by the MCA, but there was no significant quantitative relationship between them (R2=0.005, p=0.28, for C. korshinskii; R2=0.002, p=0.78, for S. psammophila). This result might be related to the mismatched temporal scales between TLE and RI. TLE represented stemflow temporal dynamics at the intra-event scale, while RI was the interval times between neighboring rain at the inter-event scale. The mismatched temporal scales might also partly explain the long-standing debates on the controversial positive and negative influences and even a lack of significant influences of rainfall intensity (depicting raining process at 5, 10, 60 min, etc.) on event-based stemflow volume (Owens et al., 2006; André et al., 2008; Zhang et al., 2015).
Stemflow intensity and temporal dynamics are important in depicting the stemflow process and its interactions with rainfall characteristics within events. We categorized stemflow variables into the volume, intensity, funneling ratio and temporal dynamics, thus representing the stemflow yield, efficiency and process. The funneling ratio was calculated as the ratio between stemflow and rainfall intensities, which enabled assessing the convergence of stemflow at the inter- and intra-event scales. FR100 values that were over 1.8-fold greater were noted than FR at representative events for C. korshinskii and S. psammophila. FR decreased with the increasing branch size of both species. It could be partly explained by the decreasing trends of SFI as branch size increased. The rainfall characteristics had temporally dependent influences on stemflow variables. RA and RD controlled SFV, FR and SFD at the inter-event scale. Rainfall intensity and raindrop momentum significantly affected stemflow intensity and time lags to rain at the intra-event scale except for TLE. The ecohydrological significance of stemflow might be underestimated by ignoring stemflow production at high temporal resolutions within events. These findings advance our understanding of the stemflow process and its influential mechanism and help with modeling the critical process-based hydrological fluxes of terrestrial ecosystems.
The data collected in this study are available upon request to the authors.
| Abbreviation | Descriptions | Unit |
| a.s.l. | Above sea level | Not applicable |
| BA | Branch angle | ∘ |
| BBA | Branch basal area | mm2 |
| BD | Branch diameter | mm |
| BL | Branch length | cm |
| D | Diameter of raindrop | mm |
| es | Saturation vapor pressure | kPa |
| E | Evaporation coefficient | unitless |
| F | Average raindrop momentum in the vertical direction of incident event | mg m s−1 |
| F0 | Average raindrop momentum of incident event | mg m s−1 |
| F10 | The 10 min maximum raindrop momentum | mg m s−1 |
| Fb10 | Average raindrop momentum at the first 10 min | mg m s−1 |
| Fe10 | Average raindrop momentum at the last 10 min | mg m s−1 |
| FR | Average funneling ratio of incident event | unitless |
| FR100 | Funneling ratio at the 100 s intervals after rain begins | unitless |
| H | Relative air humidity | % |
| I | Average rainfall intensity of incident event | mm h−1 |
| I10 | The 10 min maximum rainfall intensity | mm h−1 |
| Ib10 | Average rainfall intensity at the first 10 min of incident event | mm h−1 |
| Ie10 | Average rainfall intensity at the last 10 min of incident event | mm h−1 |
| IWA | The adjusted inflow water at TBRG | mm |
| IWR | The recorded inflow water at TBRG | mm |
| LA | Leaf area of individual branch | cm2 |
| MAP | Mean annual precipitation | mm |
| MCA | Multiple correspondence analysis | Not applicable |
| p | Level of significance | Not applicable |
| R2 | Coefficient of determination | Not applicable |
| RA | Rainfall amount | mm |
| RD | Rainfall duration | h |
| RI | Rainfall interval | h |
| SE | Standard error | Not applicable |
| SFD | Stemflow duration from its beginning to ending | h |
| SFI | Average stemflow intensity of incident event | mm h−1 |
| SFI10 | The 10 min maximum stemflow intensity of incident event | mm h−1 |
| SFIi | Instantaneous stemflow intensity | mm h−1 |
| SFRG | Stemflow depth recorded by TBRG | mm |
| SFV | Stemflow volume | mL |
| ti | Time intervals between neighboring tips | h |
| T | Air temperature | ∘ C |
| TBRG | Tipping-bucket rain gauge | Not applicable |
| TLE | Time lag of stemflow ending to rainfall ceasing | min |
| TLG | Time lag of stemflow generation to rainfall beginning | min |
| TLM | Time lag of stemflow maximization to rainfall beginning | min |
| v | Terminal velocity of raindrop | m s−1 |
| VPD | Vapor pressure deficit | kPa |
| WS | Wind speed | m s−1 |
| ρ | Density of freshwater at standard atmospheric pressure and 20∘ | g cm−3 |
| θ | Inclination angle of raindrop | ∘ |
GYG and CY set the research goals and designed field experiments. CY measured and analyzed the data. GYG and BJF provided the financial support for the experiments and supervised the execution. CY created the figures and wrote the original draft. GYG, BJF, DMH, XWD and XHW reviewed and edited the draft in several rounds of revision.
The authors declare that they have no conflict of interest.
This research was sponsored by the National Natural Science Foundation of China (nos. 41390462, 41822103 and 41901038), the National Key Research and Development Program of China (no. 2016YFC0501602), the Chinese Academy of Sciences (no. QYZDY-SSW-DQC025), the Youth Innovation Promotion Association of the Chinese Academy of Sciences (no. 2016040), and the China Postdoctoral Science Foundation (no. 2018M633427). We appreciate Delphis F. Levia at the University of Delaware for reviewing and improving this paper. We thank Liwei Zhang for the catchment GIS mapping. Special thanks are given to Shenmu Erosion and Environment Research Station for experimental support to this research. We thank David Dunkerley and two anonymous reviewers for their professional comments, which greatly improved the quality of this paper.
This research was sponsored by the National Natural Science Foundation of China (grant nos. 41390462, 41822103 and 41901038), the National Key Research and Development Program of China (grant no. 2016YFC0501602), the Chinese Academy of Sciences (grant no. QYZDY-SSW-DQC025), the Youth Innovation Promotion Association of the Chinese Academy of Sciences CE21 (grant no. 15 2016040), and the China Postdoctoral Science Foundation (grant no. 2018M633427).
This paper was edited by Lixin Wang and reviewed by David Dunkerley and two anonymous referees.
André, F., Jonard, M., and Ponette, Q.: Influence of species and rain event characteristics on stemflow volume in a temperate mixed oak-beech stand, Hydrol. Process., 22, 4455–4466, https://doi.org/10.1002/hyp.7048, 2008.
Bassette, C. and Bussière, F.: Partitioning of splash and storage during raindrop impacts on banana leaves, Agr. Forest Meteorol., 148, 991–1004, https://doi.org/10.1016/j.agrformet.2008.01.016, 2008.
Bittar, T. B., Pound, P., Whitetree, A., Moore, L. D., and van Stan John, T.: Estimation of throughfall and stemflow bacterial flux in a subtropical oak-cedar forest, Geophys. Res. Lett., 45, 1410–1418, https://doi.org/10.1002/2017GL075827, 2018.
Brandt, C. J.: Simulation of the size distribution and erosivity of raindrops and throughfall drops, Earth. Surf. Proc. Land., 15, 687–698, https://doi.org/10.1002/esp.3290150803, 1990.
Bundt, M., Widmer, F., Pesaro, M., Zeyer, J., and Blaser, P.: Preferential flow paths: biological `hot spots' in soils, Soil. Biol. Biochem., 33, 729–738, https://doi.org/10.1016/S0038-0717(00)00218-2, 2001.
Carlyle-Moses, D. E. and Price, A. G.: Growing-season stemflow production within a deciduous forest of southern Ontario, Hydrol. Process., 20, 3651–3663, https://doi.org/10.1002/hyp.6380, 2006.
Carlyle-Moses, D. E. and Schooling, J.: Tree traits and meteorological factors influencing the initiation and rate of stemflow from isolated deciduous trees, Hydrol. Process., 29, 4083–4099, https://doi.org/10.1002/hyp.10519, 2015.
Carlyle-Moses, D. E., Park, A. D., and Cameron, J. L.: Modelling rainfall interception loss in forest restoration trials in Panama, Ecohydrology, 3, 272–283, https://doi.org/10.1002/eco.105, 2010.
Carlyle-Moses, D. E., Iida, S. I., Germer, S., Llorens, P., Michalzik, B., Nanko, K., Tischer, A., and Levia, D. F.: Expressing stemflow commensurate with its ecohydrological importance, Adv. Water Resour., 121, 472–479, https://doi.org/10.1016/j.advwatres.2018.08.015, 2018.
Cayuela, C., Llorens, P., Sánchez-Costa, E., Levia, D. F., and Latron, J.: Effect of biotic and abiotic factors on inter- and intra-event variability in stemflow rates in oak and pine stands in a Mediterranean mountain area, J. Hydrol., 560, 396–406, https://doi.org/10.1016/j.jhydrol.2018.03.050, 2018.
Corti, G., Agnelli, A., Cocco, S., Cardelli, V., Masse, J., and Courchesne, F.: Soil affects throughfall and stemflow under Turkey oak (Quercus cerris L.), Geoderma, 333, 43–56, https://doi.org/10.1016/j.geoderma.2018.07.010, 2019.
Dawoe, E. K., Barnes, V. R., and Oppong, S. K.: Spatio-temporal dynamics of gross rainfall partitioning and nutrient fluxes in shaded-cocoa (Theobroma cocoa) systems in a tropical semi-deciduous forest, Agroforest. Syst., 92, 397–413, https://doi.org/10.1007/s10457-017-0108-3, 2018.
Dunkerley, D. L.: Stemflow production and intrastorm rainfall intensity variation: an experimental analysis using laboratory rainfall simulation, Earth. Surf. Proc. Land., 39, 1741–1752, https://doi.org/10.1002/esp.3555, 2014a.
Dunkerley, D. L.: Stemflow on the woody parts of plants: dependence on rainfall intensity and event profile from laboratory simulations, Hydrol. Process., 28, 5469–5482, https://doi.org/10.1002/hyp.10050, 2014b.
Dunkerley, D. L.: Rainfall intensity bursts and the erosion of soils: an analysis highlighting the need for high temporal resolution rainfall data for research under current and future climates, Earth Surf. Dynam., 7, 345–360, https://doi.org/10.5194/esurf-7-345-2019, 2019.
Durocher, M. G.: Monitoring spatial variability of forest interception, Hydrol. Process., 4, 215–229, https://doi.org/10.1002/hyp.3360040303, 1990.
Fan, J. L., Baumgartl, T., Scheuermann, A., and Lockington, D. A.: Modeling effects of canopy and roots on soil moisture and deep drainage, Vadose Zone J., 14, 1–18, https://doi.org/10.2136/vzj2014.09.0131, 2015.
Firn, R.: Plant intelligence: an alternative point of view, Ann. Bot., 93, 345–351, https://doi.org/10.1093/aob/mch058, 2004.
Gao, X. D., Zhao, X. N., Pan, D. L., Yu, L. Y., and Wu, P. T.: Intra-storm time stability analysis of surface soil water content, Geoderma, 352, 33–37, https://doi.org/10.1016/j.geoderma.2019.06.001, 2019.
Garbelotto, M. M., Davidson, J. M., Ivors, K., Maloney, P. E., Hüberli, D., Koike, S. T., and Rizzo, D. M.: Non-oak native plants are main hosts for sudden oak death pathogen in California, Calif. Agr., 57, 18–23, https://doi.org/10.3733/ca.v057n01p18, 2003.
Germer, S.: Development of near-surface perched water tables during natural and artificial stemflow generation by babassu palms, J. Hydrol., 507, 262–272, https://doi.org/10.1016/j.jhydrol.2013.10.026, 2013.
Germer, S., Werther, L., and Elsenbeer, H.: Have we underestimated stemflow? Lessons from an open tropical rainforest, J. Hydrol., 395, 169–179, https://doi.org/10.1016/j.jhydrol.2010.10.022, 2010.
Giacomin, A. and Trucchi, P.: Rainfall interception in a beech coppice (Acquerino, Italy), J. Hydrol., 137, 141–147, https://doi.org/10.1016/0022-1694(92)90052-W, 1992.
Groisman, P. Y. and Legates, D. R.: The accuracy of United States precipitation data, B. Am. Meteorol. Soc., 75, 215–227, https://doi.org/10.1175/1520-0477(1994)075<0215:TAOUSP>2.0.CO;2, 1994.
Hair, J. F., Anderson, R. E., Tatham, R. L., and Black, W. C.: Multivariate Data Analysis, fourth ed., Prentice Hall College Division, 745 pp., 1995.
Herwitz, S. R.: Infiltration-excess caused by Stemflow in a cyclone-prone tropical rainforest, Earth Surf. Proc. Land, 11, 401–412, https://doi.org/10.1002/esp.3290110406, 1986.
Hill, T. and Lewicki, P.: Statistics: Methods and Applications, Statsoft, Tulsa, 800 pp., 2007.
Hu, R., Wang, X. P., Zhang, Y. F., Shi, W., Jin, Y. X., and Chen, N.: Insight into the influence of sand-stabilizing shrubs on soil enzyme activity in a temperate desert, Catena, 137, 526–535, https://doi.org/10.1016/j.catena.2015.10.022, 2016.
Iida, S., Shimizu, T., Kabeya, N., Nobuhiro, T., Tamai, K., Shimizu, A., Ito, E., Ohnuki, Y., Abe, T., Tsuboyama, Y., Chann, S. ,and Keth, N.: Calibration of tipping-bucket flow meters and rain gauges to measure gross rainfall, throughfall, and stemflow applied to data from a Japanese temperate coniferous forest and a Cambodian tropical deciduous forest, Hydrol. Process., 26, 2445–2454, https://doi.org/10.1002/hyp.9462, 2012.
Iida, S., Levia, D. F., Shimizu, A., Shimizu, T., Tamai, K., Nobuhiro, T., Kabeya, N., Noguchi, S., Sawano, S., and Araki, M.: Intrastorm scale rainfall interception dynamics in a mature coniferous forest stand, J. Hydrol., 548, 770–783, https://doi.org/10.1016/j.jhydrol.2017.03.009, 2017.
Jia, X. X., Shao, M. A., Wei, X. R., and Wang, Y. Q.: Hillslope scale temporal stability of soil water storage in diverse soil layers, J. Hydrol., 498, 254–264, https://doi.org/10.1016/j.jhydrol.2013.05.042, 2013.
Johnson, M. S. and Lehmann, J.: Double-funneling of trees: Stemflow and root-induced preferential flow, Ecoscience, 13, 324–333, https://doi.org/10.2980/i1195-6860-13-3-324.1, 2006.
Kéfi, S., Rietkerk, M., Alados, C. L., Pueyo, Y., Papanastasis, V. P., ElAich, A., and De Ruiter, P. C.: Spatial vegetation patterns and imminent desertification in Mediterranean arid ecosystems, Nature, 449, 213–217, https://doi.org/10.1038/nature06111, 2007.
Kimble, P. D.: Measuring the momentum of throughfall drops and raindrops, Master Thesis, Western Kentucky University, Bowling Green, 126 pp., 1996.
Levia, D. F. and Germer, S.: A review of stemflow generation dynamics and stemflow-environment interactions in forests and shrublands, Rev. Geophys., 53, 673714, https://doi.org/10.1002/2015RG000479, 2015.
Levia, D. F., van Stan, J. T., Mage, S. M.. and Kelley-Hauske, P. W.: Temporal variability of stemflow volume in a beech-yellow poplar forest in relation to tree species and size, J. Hydrol., 380, 112–120, https://doi.org/10.1016/j.jhydrol.2009.10.028, 2010.
Liang, W. L., Kosugi, K., and Mizuyama, T.: Soil water dynamics around a tree on a hillslope with or without rainwater supplied by stemflow, Water Resour. Res., 47, W02541, https://doi.org/10.1029/2010WR009856, 2011.
Liang, W. L., Kosugi, K., and Mizuyama, T.: Soil water redistribution processes around a tree on a hillslope: the effect of stemflow on the drying process, Ecohydrology, 8, 1381–1395, https://doi.org/10.1002/eco.1589, 2014.
Li, X., Xiao, Q. F., Niu, J. Z., Dymond, S., van Doorn, N. S., Yu, X. X., Xie, B. Y., Lv, X. Z., Zhang, K. B., and Li, J.: Process-based rainfall interception by small trees in Northern China: The effect of rainfall traits and crown structure characteristics, Agr. Forest Meteorol., 218–219, 65–73, https://doi.org/10.1016/j.agrformet.2015.11.017, 2016.
Li, X. Y., Liu, L. Y., Gao, S. Y., Ma, Y. J., and Yang, Z. P.: Stemflow in three shrubs and its effect on soil water enhancement in semiarid loess region of China, Agr. Forest Meteorol., 148, 1501–1507, https://doi.org/10.1016/j.agrformet.2008.05.003, 2008.
Li, Y. Y., Chen, W. Y., Chen, J. C., and Shi, H.: Contrasting hydraulic strategies in Salix psammophila and Caragana korshinskii in the southern Mu Us Desert, China, Ecol. Res., 31, 869–880, https://doi.org/10.1007/s11284-016-1396-1, 2016.
Liu, Y. X., Zhao, W. W., Wang, L. X., Zhang, X., Daryanto, S., and Fang, X. N.: Spatial variations of soil moisture under Caragana korshinskii kom. from different precipitation zones: field based analysis in the Loess Plateau, China, Forests, 7, 31, https://doi.org/10.3390/f7020031, 2016.
Magliano, P. N., Whitworth-Hulse, J. I., and Baldi, G.: Interception, throughfall and stemflow partition in drylands: Global synthesis and meta-analysis, J. Hydrol., 568, 638–645, https://doi.org/10.1016/j.jhydrol.2018.10.042, 2019.
Manfroi, O. J., Koichiro, K., Nobuaki, T., Masakazu, S., Nakagawa, M., Nakashizuka, T., and Chong, L.: The stemflow of trees in a Bornean lowland tropical forest, Hydrol. Process., 18, 2455–2474, https://doi.org/10.1002/hyp.1474, 2004.
Martinez-Meza, E. and Whitford, W.: Stemflow, throughfall and channelization of stemflow by roots in three Chihuahuan desert shrubs, J. Arid Environ., 32, 271–287, https://doi.org/10.1006/jare.1996.0023, 1996.
Mcclain, M. E., Boyer, E. W., Dent, C. L., Gergel, S. E., Grimm, N. B., Groffman, P. M., Hart, S. C., Harvey, J. W., Johnston, C. A., and Mayorga, E.: Biogeochemical hot spots and hot moments at the interface of terrestrial and aquatic ecosystems, Ecosystems, 6, 301–312, https://doi.org/10.1007/s10021-003-0161-9, 2003.
Návar, J.: Stemflow variation in Mexico's northeastern forest communities: Its contribution to soil moisture content and aquifer recharge, J. Hydrol., 408, 35–42, https://doi.org/10.1016/j.jhydrol.2011.07.006, 2011.
Owens, M. K., Lyons, R. K., and Alejandro, C. L.: Rainfall partitioning within semiarid juniper communities: effects of event size and canopy cover, Hydrol. Process., 20, 3179–3189, https://doi.org/10.1002/hyp.6326, 2006.
Reid, L. M. and Lewis, J.: Rates, timing, and mechanisms of rainfall interception loss in a coastal redwood forest, J. Hydrol., 375, 459–470, https://doi.org/10.1016/j.jhydrol.2009.06.048, 2009.
Schimmack, W., Förster, H., Bunzl, K., and Kreutzer, K.: Deposition of radiocesium to the soil by stemflow, throughfall and leaf-fall from beech trees, Radiat. Environ. Bioph., 32, 137–150, https://doi.org/10.1007/bf01212800, 1993.
Siegert, C. M. and Levia, D. F.: Seasonal and meteorological effects on differential stemflow funneling ratios for two deciduous tree species, J. Hydrol., 519, 446–454, https://doi.org/10.1016/j.jhydrol.2014.07.038, 2014.
Spencer, S. A. and van Meerveld, H. J.: Double funnelling in a mature coastal British Columbia forest: spatial patterns of stemflow after infiltration, Hydrol. Process., 30, 4185–4201, https://doi.org/10.1002/hyp.10936, 2016.
Sprenger, M., Stumpp, C., Weiler, M., Aeschbach, W., Allen, S. T., Benettin, P., Dubbert, M., Hartmann, A., Hrachowitz, M., Kirchner, J. W., McDonnell, J. J., Orlowski, N., Penna, D., Pfahl, S., Rinderer, M., Rodriguez, N., Schmidt, M., and Werner, C.: The Demographics of Water: A Review of Water Ages in the Critical Zone, Rev. Geophys., 57, 1–35, https://doi.org/10.1029/2018RG000633, 2019.
Staelens, J., De Schrijver, A., Verheyen, K., and Verhoest N.E.: Rainfall partitioning into throughfall, stemflow, and interception wit hin a single beech (Fagus sylvatica L.) canopy: influence of foliation, rain event characteristics, and meteorology, Hydrol. Process., 22, 33–45, https://doi.org/10.1002/hyp.6610, 2008.
Teachey, M. E., Pound, P., Ottesen, E. A., and van Stan, J. T.: Bacterial community composition of throughfall and stemflow, Front. Plant Sci., 1, 1–6, https://doi.org/10.3389/ffgc.2018.00007, 2018.
Uijlenhoet, R. and Sempere Torres, D.: Measurement and parameterization of rainfall microstructure, J. Hydrol., 328, 1, 1–7, https://doi.org/10.1016/j.jhydrol.2005.11.038, 2006.
van Stan, J. T. and Levia, D. F.: Inter- and intraspecific variation of stemflow production from Fagus grandifolia Ehrh. (American beech) and Liriodendron tulipifera L. (yellow poplar) in relation to bark microrelief in the eastern United States, Ecohydrology, 3, 11–19, https://doi.org/10.1002/eco.83, 2010.
van Stan, J. T., Siegert, C. M., Levia D. F., and Scheick, C. E.: Effects of wind-driven rainfall on stemflow generation between codominant tree species with differing crown characteristics, Agr. Forest Meteorol., 151, 1277–1286, https://doi.org/10.1016/j.agrformet.2011.05.008, 2011.
van Stan, J. T., Gay, T. E., and Lewis, E. S.: Use of multiple correspondence analysis (MCA) to identify interactive meteorological conditions affecting relative throughfall, J. Hydrol., 533, 452–460, https://doi.org/10.1016/j.jhydrol.2015.12.039, 2016.
Wang, X.-P., Wang, Z.-N., Berndtsson, R., Zhang, Y.-F., and Pan, Y.-X.: Desert shrub stemflow and its significance in soil moisture replenishment, Hydrol. Earth Syst. Sci., 15, 561–567, https://doi.org/10.5194/hess-15-561-2011, 2011.
Yang, X. L., Shao, M. A., and Wei, X. H.: Stemflow production differ significantly among tree and shrub species on the Chinese Loess Plateau, J. Hydrol., 568, 427–436, https://doi.org/10.1016/j.jhydrol.2018.11.008, 2019.
Yang, Z. P.: Rainfall partitioning process and its effects on soil hydrological processes for sand-fixed shrubs in Mu us sandland, Northwest China, PhD Thesis, Beijing Normal University, Beijing, 123 pp., 2010 (in Chinese with English abstract).
Yuan, C., Gao, G. Y., and Fu, B. J.: Stemflow of a xerophytic shrub (Salix psammophila) in northern China: Implication for beneficial branch architecture to produce stemflow, J. Hydrol., 539, 577–588, https://doi.org/10.1016/j.jhydrol.2016.05.055, 2016.
Yuan, C., Gao, G., and Fu, B.: Comparisons of stemflow and its bio-/abiotic influential factors between two xerophytic shrub species, Hydrol. Earth Syst. Sci., 21, 1421–1438, https://doi.org/10.5194/hess-21-1421-2017, 2017.
Zabret, K., Rakovec, J., and Šraj, M.: Influence of meteorological variables on rainfall partitioning for deciduous and coniferous tree species in urban area, J. Hydrol., 558, 29–41, https://doi.org/10.1016/j.jhydrol.2018.01.025, 2018.
Zhang, Y., Li, X. Y., Li, W., Wu, X. C., Shi, F. Z., Fang, W. W., and Pei, T. T.: Modeling rainfall interception loss by two xerophytic shrubs in the Loess Plateau, Hydrol. Process., 31, 1926–1937, https://doi.org/10.1002/hyp.11157, 2017.
Zhang, Y. F., Wang X. P., Hu, R., Pan Y. X.. and Paradeloc, M.: Rainfall partitioning into throughfall, stemflow and interception loss by two xerophytic shrubs within a rain-fed re-vegetated desert ecosystem, northwestern China, J. Hydrol., 527, 1084–1095, https://doi.org/10.1016/j.jhydrol.2015.05.060, 2015.