the Creative Commons Attribution 4.0 License.
the Creative Commons Attribution 4.0 License.
 | 23 Sep 2019
The importance of city trees for reducing net rainfall: comparing measurements and simulations
Vincent Smets
Willy Bauwens
Martin Hermy
Ben Somers
Boud Verbeiren
An in situ tree interception experiment was conducted to determine the hydrological impact of a solitary standing Norway maple and a small-leaved lime in an urban environment. During the 2-year experiment, rainfall data were collected and divided into interception, throughfall and stemflow. With approximately 38 % of the gross precipitation intercepted by both trees, the interception storage was higher than for similar studies carried out in Mediterranean regions. The specialized forest interception models from Gash (first published in 1978) and Rutter (first published in 1971), as well as an adapted solitary tree version of the Water and Energy Transfer between Soil, Plants and Atmosphere model (WetSpa), were tested for their accuracy in modeling the measured interception storage. The models generally overestimated interception storage for small interception events (< interception storage) and underestimated interception storage for bigger interception events (> interception storage). Gash's method slightly outperformed WetSpa and Rutter for all events throughout seasons and trees. However, WetSpa showed better performance for rainfall events > 10 mm. The similar performance of WetSpa and the Gash and Rutter models is noteworthy because the WetSpa interception model is part of a larger modeling framework that models the whole hydrological balance, whereas the Gash and Rutter methods are specialized stand-alone interception models. Thus, WetSpa is recommended to gain a more complete understanding of the impact of city trees on the full hydrological balance. This study emphasizes the potential effect of city trees on the whole hydrological balance via a combination of field data and simulation experiments using both specialized interception models (Gash and Rutter) and the relatively simple interception module of a holistic water balance model (WetSpa).
- Article
(2676 KB) - Full-text XML
- BibTeX
- EndNote


1.1 The context
Currently 54 % of the world's population is living in an urban environment, with an expected increase to 66 % by 2050 (United Nations, 2014). The migration of the growing population towards cities gives rise to a whole new set of challenges. An urban environment exhibits built-up areas that significantly alter natural processes (Grimm et al., 2008). This leads to problems such as the urban heat island effect (UHI; Lauwaet et al., 2015) and the increased density of particulate matter (Zhang et al., 2015). Another prominent problem modern cities face is the increase in runoff during and after rain events (Paul and Meyer, 2001). Due to urban expansion and the use of impervious materials such as concrete and asphalt, the hydrological cycle is altered and natural processes such as infiltration and interception are impeded. This results in an increased runoff that causes significant economic losses, especially during heavy rainfall events. For western Europe, the Intergovernmental Panel on Climate Change (IPCC) predicts that the amount and intensity of precipitation will increase considerably in the coming decades, leading to more extreme events, and concludes that an efficient water regulation policy will be the most important challenge of the 21st century (IPCC, 2013).
1.2 The urban green
Part of the solution to the issue of efficient water regulation is the strategic use of rainwater in urban environments; this approach has been referred to using terms such as “Water Sensitive Urban Design” (WSUD; Wong et al., 2013), “Low Impact Development” (LID; Dietz, 2007) and “Sustainable Drainage Systems” (SuDS; Ciria, 2013). One of the main goals of the approach is to try to use rainwater as efficiently as possible within the city itself. Among other measures, this approach emphasizes the role of urban trees in the hydrological cycle. Urban trees are known to intercept rainwater, thereby creating a buffer for peak runoff during intense rainfall events (Livesley et al., 2016; Xiao and McPherson, 2011). Urban built-up areas also benefit from trees during less intense events due to the reduced amount of rainwater that needs to be processed by the sewage system (Szota et al., 2019). Xiao and McPherson (2002) found that the trees in Santa Monica, California, intercepted 1.6 % of annual precipitation, thereby saving USD 110 890 that would otherwise have been used for flood control, which equates to a saving of USD 3.60 per tree. They further advise that planting more large, evergreen trees would increase the long-term benefits with respect to runoff reduction; this benefit has been found to be USD 47.8 per tree in Lisbon (Soares et al., 2011). Most of the rainfall that trees intercept evaporates into the atmosphere, diminishing and redistributing the net rainfall that reaches the ground which is converted to surface runoff. Moreover, green spaces disrupt the impervious cover and allow rainwater to infiltrate and contribute to the often depleted groundwater tables under cities (Armson et al., 2013; Farrugia et al., 2013; Shields and Tague, 2015).
Urban trees normally display different behavior than forest trees due to interactions with anthropogenic structures. Urban built-up areas affect wind orientation and rainfall, and create microclimates which influence tree growth and well-being and, in turn, rainfall interception (Pretzsch et al., 2017; Zipperer et al., 1997). Asadian and Weiler (2009) found that urban trees intercept twice as much water as their forest counterparts, possibly due to the UHI effect, the greater distance between trees (boundary layer effect) and the open-grown canopies. Thus, studies carried out on natural forest interception cannot easily be translated to urban trees.
Several authors have attempted to quantify the contribution of urban trees to the total water balance. Some authors have looked at large areas of urban cover and have determined the water storage potential of the urban forest based on land-cover-derived maps (Gill et al., 2007; Haase, 2009; Verbeeck et al., 2013). To do so, they assign empirical storage capacity values to certain vegetation classes based on the literature. These studies can give an accurate estimate of the total outflow at the catchment scale, but often fail to account for the smaller scale and complex heterogeneity specific to an urban environment. Other authors have looked at the interception process of a single urban tree (Asadian and Weiler, 2009; Guevara-Escobar et al., 2007; Véliz-Chávez et al., 2014; Xiao et al., 2000a,b). While these studies generally succeed in describing the interception process for an isolated urban tree, they usually find it difficult to extrapolate to larger areas and/or other tree species due to the use of complex variables for the prediction of the interception process. To fully understand the potential hydrological impact of urban trees there is a need to integrate a solitary tree interception model in a larger modeling framework that is capable of simulating the whole water balance. This solitary tree interception model should be able to accurately model interception on the individual tree level while not being too complex to make extrapolation too complicated.
1.3 The hydrological processes
During the initial stage of the rain event, most water is intercepted by the tree canopy. Tree interception is defined as the process of precipitation falling on the tree surface where it is temporally stored. This water then either evaporates into the atmosphere, is absorbed by the leaves, flows down the tree as stemflow or falls through/drips off to the ground surface (Xiao et al., 2000a). The water that reaches the ground surface is called the net precipitation. A part of this water infiltrates into the ground, while the remaining water becomes runoff. The infiltration ∕ runoff ratio depends on the surface and soil properties. Part of the infiltrated water is taken up by the tree roots and is transpired back in the atmosphere through the leaves. The other part of the infiltrated water replenishes the groundwater table. The total amount of water intercepted during an event and that never reaches the ground is called the interception storage (and is expressed in millimeters). The main vegetation characteristic influencing the interception storage is the interception storage capacity (which is expressed in millimeters). This is the maximum amount of water the tree can hold for a given time. There is some confusion in the literature regarding the exact definition of the interception storage capacity. This study utilizes the definition used by Xiao and McPherson (2016), which outlines two types of interception storage capacity. The first is the surface saturation or minimum storage capacity, which is the amount of intercepted water that is needed on a vegetation unit for flow to begin. This water evaporates back into the atmosphere and does not contribute to throughfall. This type of storage is relatively independent of meteorological characteristics. Vegetation characteristics determining the minimum storage capacity are the canopy architecture, the leaf and stem surface areas, the seasonal vegetation development and the tree's health (Asadian and Weiler, 2009; Véliz-Chávez et al., 2014; Xiao et al., 2000b). The second type of storage is the detention or maximum storage, this is the maximum amount of water that can temporally be stored on a vegetation unit. The maximum storage can temporarily exceed the minimum storage during very intense rainfall periods when the amount of water that falls through is smaller than the amount of water that is intercepted. However, once a threshold is reached or rain ceases, this extra water quickly drips off until the minimum storage is reached again. This process was clearly observed by Keim et al. (2006) in rainfall simulator experiments on woody vegetation. They defined the two types of storage as the static and dynamic storage, respectively. In our study, we will use the surface saturation or minimum storage; as this is the volume of water that never reaches the ground and does not contribute to runoff, it is of the most useful to hydrological modelers. The interception storage of an event can be larger than the interception storage capacity when intra-event evaporation or drip-off is present and the interception storage capacity is partially emptied and then filled again with new precipitation.
1.4 Measurement methods
Interception storage experiments can be conducted both in ex situ and in in situ conditions. Ex situ experiments usually involve simulating rainfall events in a controlled environment. This allows for the accurate determination of the amount of rainfall intercepted and which vegetation and meteorological characteristics are most influential (Keim et al., 2006; Smets et al., 2019; Xiao and McPherson, 2016). The advantages of this method are that experiments are repeatable, that experiments can be designed to optimally determine the influencing variables and that many individual plants can be used. This method is usually used for smaller green elements like shrubs and grasses. Trees are impractical to transport to laboratories due to their above- and belowground biomass. Laboratory experiments have been carried out on tree branches (Keim et al., 2006; Xiao and McPherson, 2016), but upscaling to the whole tree level complicates the applicability of the results.
In situ interception experiments usually involve the collection of rainwater above or beside the canopy and the comparison of this water with rainwater collected under the canopy. The difference between the two is the amount of intercepted water. A commonly used measurement method is the placement of tipping buckets under the tree canopy (Asadian and Weiler, 2009; Link et al., 2004). However, this method only catches part of the throughfall. Furthermore, throughfall is usually not equally distributed under the canopy, which makes upscaling results to the whole tree canopy level difficult. Another in situ measurement method is the collection of all throughfall under a tree via the construction of a v-catchment construction large enough to cover the canopy area (Véliz-Chávez et al., 2014; Xiao et al., 2000b). Throughfall and stemflow are usually collected in separate containers. A disadvantage of this method is that it is resource intensive and only a few individuals can be measured. Moreover, high wind speeds can cause lateral rain to be intercepted by the v-catchment and can confuse the measurements. However, because upscaling results from individual branches or leaves to the individual tree level remains difficult (Friesen et al., 2015), measurements on the whole tree scale are currently viewed as the most accurate method of quantifying rainfall interception by solitary trees and are the preferred method in this research.
1.5 Interception models
The most commonly used methods for calculating interception storage of a forest canopy are the model from Rutter (Rutter et al., 1971) and the analytical adaptation of this model by Gash (Gash and Morton, 1978). Their conceptual models include gross precipitation, crown storage, throughfall, stemflow and evaporation. These models serve as a starting point for most ulterior interception models (Muzylo et al., 2009). They are most commonly used on weekly/monthly temporal scales and at the spatial scale of a forest stand. Rutter calculates the interception storage using a running water balance approach, whereas Gash considers a wetting, saturation and drying phase to include the different water balance components. An important difference between the Gash and Rutter models is that Gash considers rainfall events as discrete events. His model assumes an empty storage compartment at the start of each event and after reaching the saturation phase the amount of water intercepted is held constant and throughfall is assumed to start. Furthermore, Gash and Morton (1978) treat throughfall as a factor in the water balance, whereas Rutter et al. (1971) uses empirical relationships. Gash later refined his model to include open spaces in forests by including a canopy fraction cover (Gash et al., 1995). The canopy fraction cover enables the prediction of interception in open forest structures and of the amount of interception with a changing leaf cover. Van Dijk and Bruijnzeel (2001) later adapted the refined Gash model to include the leaf area index (LAI). They assumed a linear relationship between the LAI and the interception storage, thereby highlighting the importance of the leaf area in predicting the interception storage capacity. The first model to estimate interception storage on a single tree was developed by Xiao (Xiao et al., 2000b). Xiao adapted the Rutter model into a three-dimensional physically based stochastic model to gain a better understanding of the interception processes from a single leaf to the branch segment and then to the individual tree. He found the interception storage capacity to be the most important factor determining the amount of rain intercepted, followed by the LAI. The most influential meteorological factor for the interception storage was gross precipitation (Xiao et al., 2000b). The model provides a good tool to better understand the influence of the tree architecture and the detailed meteorological factors on the interception of a single tree in an urban environment. However, the intense model parameterization makes it difficult to apply.
Interception storage is the first part within a water balance simulation and estimates the net rainfall available for infiltration, evapotranspiration and surface runoff. Therefore, it is important to not only focus on interception models but also to investigate the capacities of a water balance model to simulate interception storage. The Water and Energy Transfer between Soil Plants and Atmosphere simulator (WetSpa) allows for detailed modeling of the land surface processes (Wang et al., 1996). The flexibility of the model further allows for easy adaptation of the interception module for our purposes. In order to adapt the model to our study of a solitary tree we set up a v-catchment simulation including the LAI for the calculation of interception storage (Salvadore, 2015; Wirion et al., 2017).
1.6 Research questions
Downscaling current hydrological interception models, which are mainly built for forested areas using the stand scale, to an individual urban tree might not provide satisfactory simulation results. Interception models developed on the individual tree scale are usually complex and require many variables that are difficult to measure in the field. This study tries to bridge this gap by adjusting the interception module of a water balance model (WetSpa) to our solitary tree setup. The simplicity of the interception calculation of WetSpa is compared with the more specialized forest interception models that have been standard in the literature for decades (Gash and Rutter).
The objectives of this study are as follows:
-
to evaluate the interception storage of two urban trees in Belgium;
-
to evaluate how the WetSpa model, which is part of a whole water balance framework, compares with the standard stand-alone interception models of Gash and Rutter to estimate the interception of two solitary trees.
2.1 The study area
The study area is located in Belgium. The Belgian climate can be classified as a Cfb climate according to the Köppen climate classification system (Kottek et al., 2006): a temperate oceanic climate with the coldest month averaging above 0 ∘C, all months with average temperatures below 22 ∘C and at least 4 months with average temperatures above 10 ∘C. Rainfall averages between 750 and 850 mm annually and is fairly evenly distributed throughout the year. We hypothesize that a larger percentage of rainfall can be intercepted by urban trees in temperate climates than in Mediterranean climates, where rainfall is usually restricted to the winter season.
2.2 The selected tree species
Two deciduous trees of similar dimensions were selected for this study: a Norway maple (Acer platanoides L.) and a small-leaved lime (Tilia cordata Mill.). Both trees are native to extensive regions of western and eastern Europe and have been introduced to large areas of the European continent. They are popular street trees in urban environments due to their pollution removal abilities (Yang et al., 2015) and their rapid growth rate (Moser et al., 2015). The Norway maple is located at the VUB Etterbeek campus (50∘49′ N, 4∘23′ E) in the capital region of Brussels. The small-leaved lime is found in “Kasteelpark Arenberg” (50∘52′ N, 4∘41′ E). The Norway maple and the small-leaved lime were located at least 8 m from obstructions, minimizing the possible influence of nearby trees or buildings (Fig. 1). These two trees represent solitary urban trees. As the urban environment is very heterogeneous, trees are found in widely varying private gardens and on streets. Due to the limitations of an experimental setup (safety, space and logistics) we decide to use solitary urban trees that were free from obstructions and that were subject to full sun and wind exposure. Thus, the results of our experiment cannot simply be translated to other solitary urban trees without making certain assumptions about the environmental conditions.
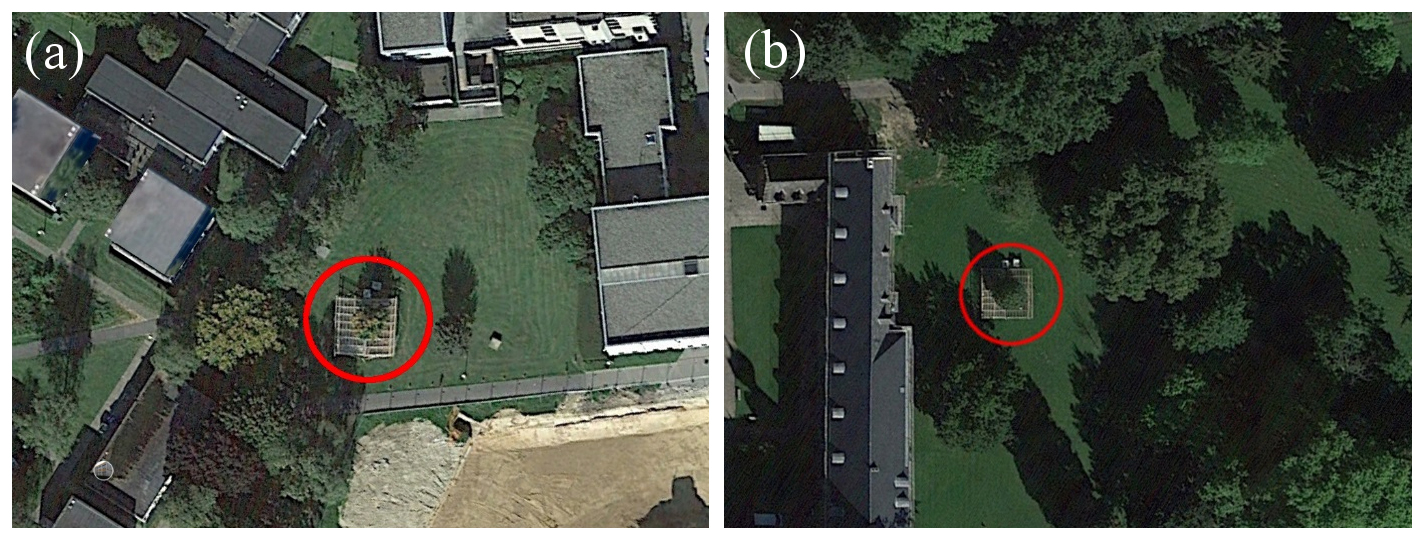
Figure 1© Google Earth images of the Norway maple on 1 October 2015 (a) and the small-leaved lime on 25 August 2016(b). Map data sourced from © Google, Landsat/Copernicus.
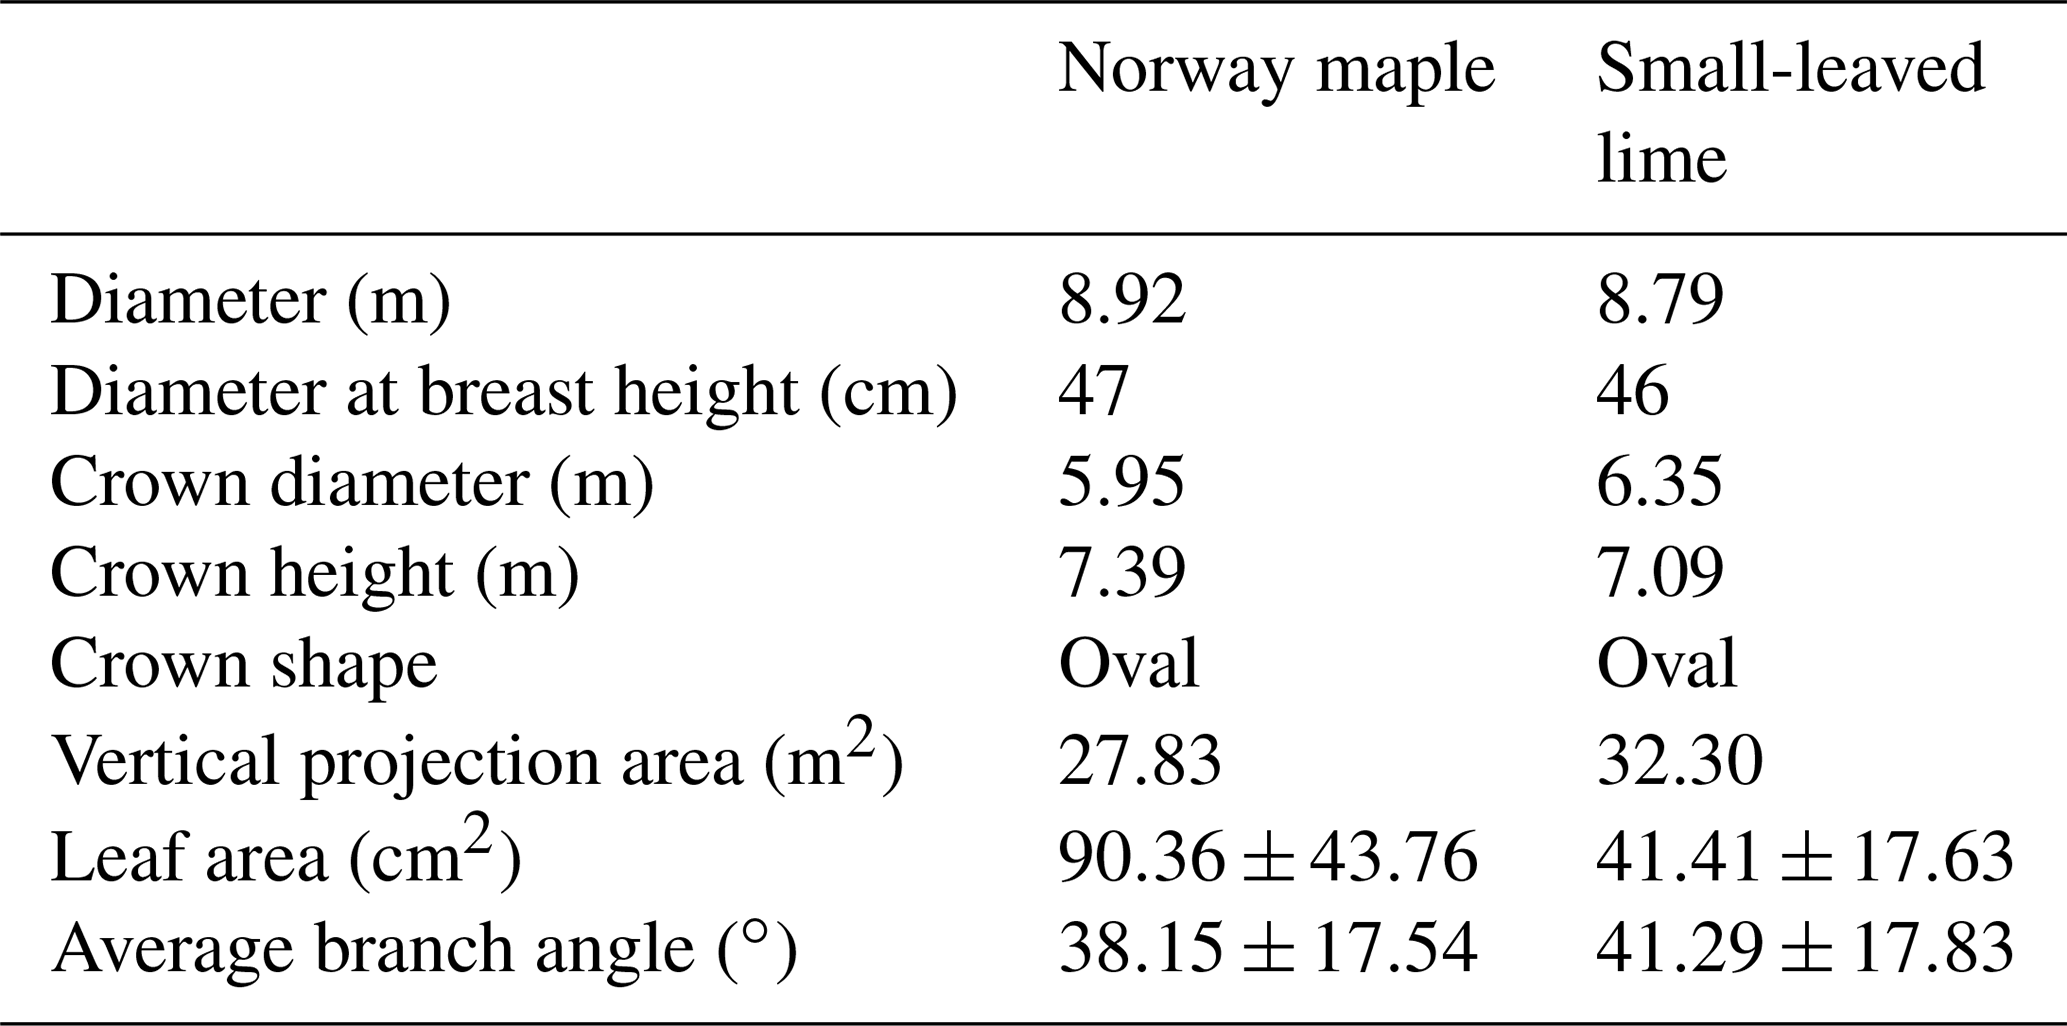
The vegetative characteristics of both trees are described in Table 1.
Table 1Vegetation characteristics of the Norway maple and the small-leaved lime.
The LAI was measured periodically with the SunScan system (type SS1-COM-R4). This system uses photodiodes to measure global and diffuse radiation either as photosynthetically active radiation (PAR; in units of mmol m−2 s−1) or energy (in units of W m−2). By measuring the incoming radiation in eight compass directions under the tree, an approximation of the energy received by the ground surface under the tree can be made. By comparing these values with a reference sensor that is placed outside the tree canopy, an estimation of the energy absorbed and reflected by the tree is made. A conversion to the LAI is carried out using an equation based on the Beer–Lambert law. For a full description of the methodology and validation of this procedure we refer to Wirion et al. (2017).
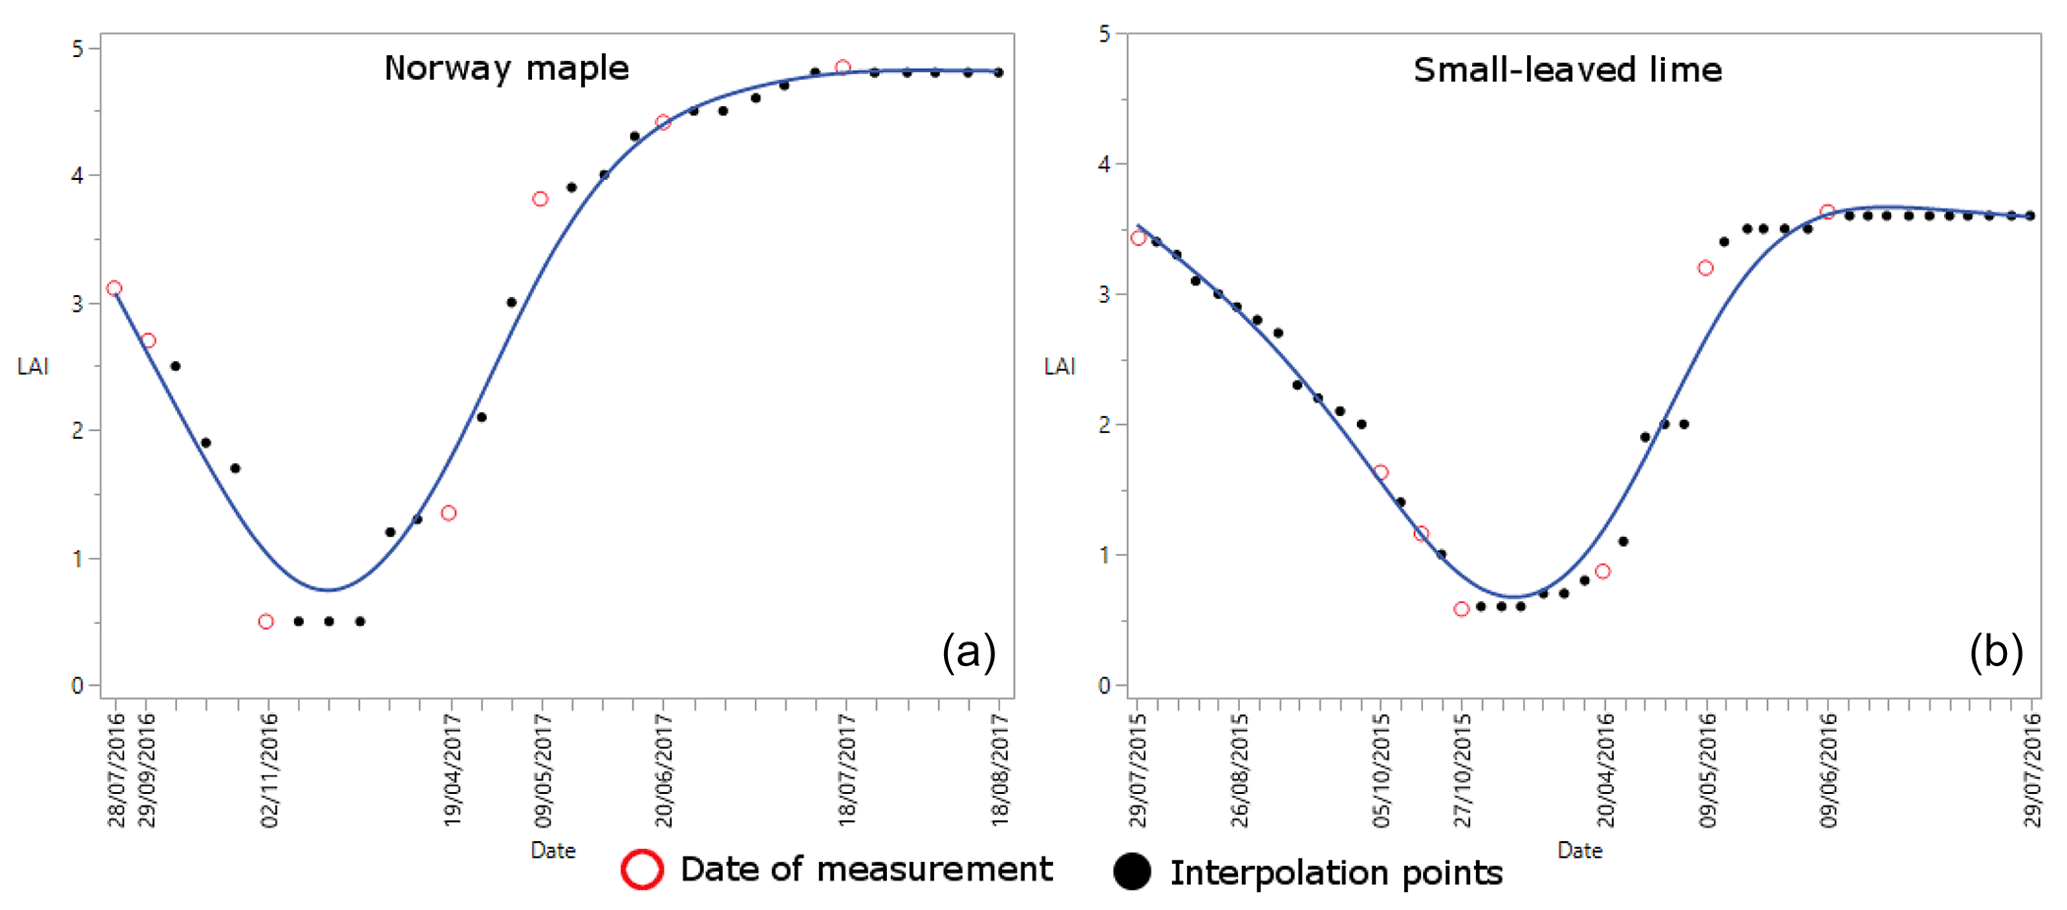
Figure 2The variation of the LAI of the Norway maple (a) and the small-leaved lime (b). Hollow red dots indicate the dates of the measurements, and black dots indicate interpolations between the hollow red dots.
The change in the LAI of both trees can be seen in Fig. 2. For both trees we measured the LAI at seven moments during the season, to cover low-, medium- and full-leaf conditions. We then used a linear interpolation between each measurement to assign a LAI value for each rain event. The LAI of the small-leaved lime (LAI = 4.8) under full-leaf conditions is higher than the LAI of the Norway maple (LAI = 3.6). Under minimum-leaf conditions the LAI is lower for the small-leaved lime (LAI = 0.5) than for the Norway maple (LAI = 0.58). Thus, changes in the LAI during the season are more important for the small-leaved lime.
The free throughfall coefficient was calculated using the method of Leyton et al. (1967). This method plots the gross precipitation (Pg) vs. the throughfall (Tf) of all rainfall events. The method is dependent on identifying an inflection point that represents the amount of rainfall necessary to saturate the canopy. By drawing a line through the points with the least amount of throughfall left of this point, the free throughfall coefficient is found as the parameter of Pg. The Pg vs. Tf graphs of both trees, including their equations and free throughfall coefficients are given in Appendix A.
2.3 The v-catchment design
A rainfall catchment was constructed under both trees to make throughfall measurements. The design of the construction was inspired by Xiao et al. (2000a). The frame was made out of Pinus sylvestris and was covered with corrugated sheets (Super-Kristal, 450 g m−2) that intercepted rainfall and guided the water into a gutter that fed into a catchment container which had a volume of 1 m3. The corrugated sheets were attached to the wooden frame using screws on the crests of the corrugations. These screws were then topped with a rubber seal to avoid water leakage. Stemflow was collected by spiraling a half-open garden hose (Ø 2.5 cm) around the tree stem. This hose led to a separate stemflow container with a storage capacity of 26.75 L (Fig. 3).
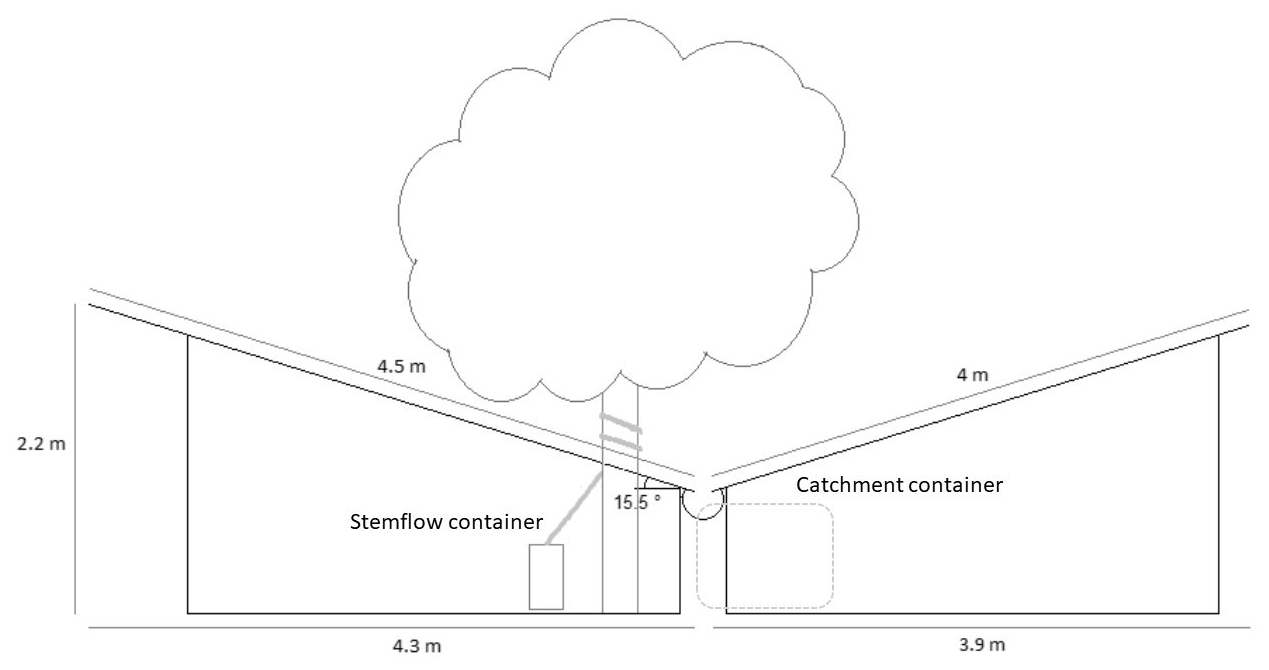
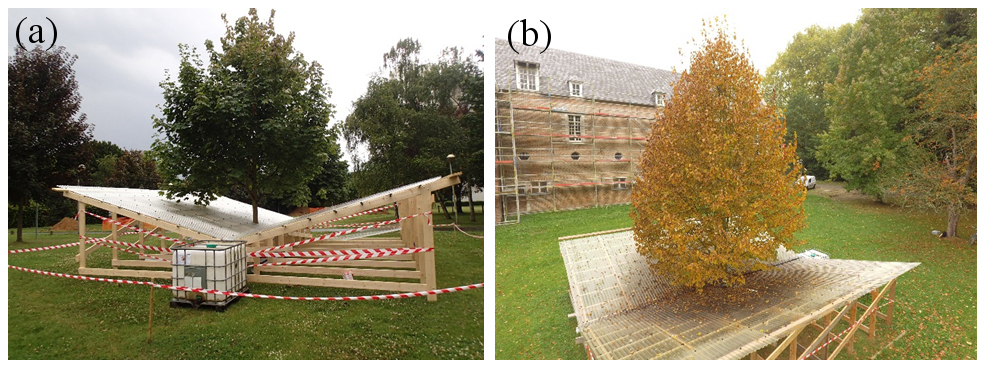
Figure 4Images of the v-catchment under the Norway maple (picture taken 30 July 2015) (a) and the small-leaved lime (picture taken 21 October 2016) (b).
The catchment measured throughfall under the Norway maple from August 2015 to August 2016, whereas it was operational from September 2016 to August 2017 under the small-leaved lime (Fig. 4). During winter, when no leaves were present on the trees and throughfall registration could be affected by frost and snow, no measurements were performed. Measurements resumed when the trees started to grow leaves again. Measurements were paused from 15 October 2015 to 23 March 2016 for the Norway maple and from 13 November 2016 to 14 April 2017 for the small-leaved lime. No substantial adaptation had to be made to the catchment due to the similar size of both trees. The v-catchment under the Norway maple had a total surface area of 66.4 m2 and a vertical projection area of 65.04 m2; the v-catchment under the small-leaved lime had a total surface area of 68.9 m2 and a vertical projection area of 66.4 m2.
After a rainfall event, a certain amount of water is retained on the corrugated sheets of the v-catchment and re-evaporates into the atmosphere. To quantify this amount, a detention storage measurement was performed. A 0.209 m2 corrugated sheet was positioned at the same angle as the construction (15.5∘) and sprayed with water until droplets started flowing off the bottom edge. The remaining water was then collected after 1 min using highly absorbent tissues. The difference in the tissue weight before and after absorbing water gave the amount of water retained on the corrugated sheet. The balance had a precision of ±1 g. This process was repeated 10 times, which led to an average water retention on the corrugated sheet of 16 g, which was equivalent to 0.077 mm m−2.
To calculate the detention storage of the rain gutter, a spare piece of gutter measuring 3.27 m was hung at the same angle as the rain gutter on the construction (1 cm descent per meter, or 0.57 ∘ m−1). A known volume of water (2000 mL) was poured into the gutter and was collected again at the lower end. Three repetitions were carried out and an average of 1974 mL was recollected. This means that 8 mL of water was retained per meter of rain gutter. For the whole construction the gutter measured 8.25 m, which equates to a total of 66 mL of water retained. The detention storage of the corrugated sheet and rain gutter were taken into account when analyzing the data.
2.4 The sensors
The water level in both the catchment and stemflow containers was monitored by pressure sensors (Mini-Diver Dl501, Schlumberger Water Services). The sensors are calibrated by the manufacturer and have an accuracy of ±5 mm. They store up to 24 000 measurements and are programmed to measure at specific time intervals. For this study, the sensors were set to measure every 30 s. Using this time interval, the sensors register data for 8.33 d before the memory is full. An identical sensor was installed at the same height under the tree to act as a barometer. Thus, the measurements in the containers are compensated for atmospheric pressure before being translated to the water column height (cmH20).
To calculate the water stored in the container after a rainfall event, two diver readings had to be made (an initial and an end value). Thus, the resulting accuracy is the sum of the two reading accuracies (±10 mm). As the vertical projection area of the container was 1.12 m2, 10 mm of water level rise translates to a volume difference of 11.2 L. Because the catchment container had rounded corners, the water level was always kept between 200 and 700 L, meaning that no correction factor was needed to calculate throughfall. This meant that the maximum capacity of the storage container was reached after an event of approximately 7.5 mm (493 L), without taking the storage of the tree into account. Due to the storage capacity of the tree, the actual rain event size needed to fill the storage container was slightly higher. The stemflow container was cylindrically shaped with a vertical projection area of 0.0625 m2. A 1 cm rise in the water level equalled a volume difference of 0.3125 L. The total volume of the stemflow container was 26.75 L, which was large enough to capture stemflow of a rain event of any realistic size.
Because the sensor inaccuracy is a constant (11.2 L or a 10 mm water level rise in the storage container), it will have a smaller effect for larger rainfall events. To quantify this effect, a sensitivity analysis was carried out. For both the Norway maple and the small-leaved lime, rain events of several sizes were analyzed. For every rain event size, the decrease in the percentage interception storage with a 10 mm water level rise of the container was analyzed. This percentage reflects the uncertainty in interception storage estimates. Results are slightly different for both trees because the vertical projection area of the trees differ slightly. The equations obtained are shown in Table 2.
Table 2Uncertainty estimates for the Norway maple and the small-leaved lime. x is the rain event size (mm), and y is the uncertainty of the interception storage (%).
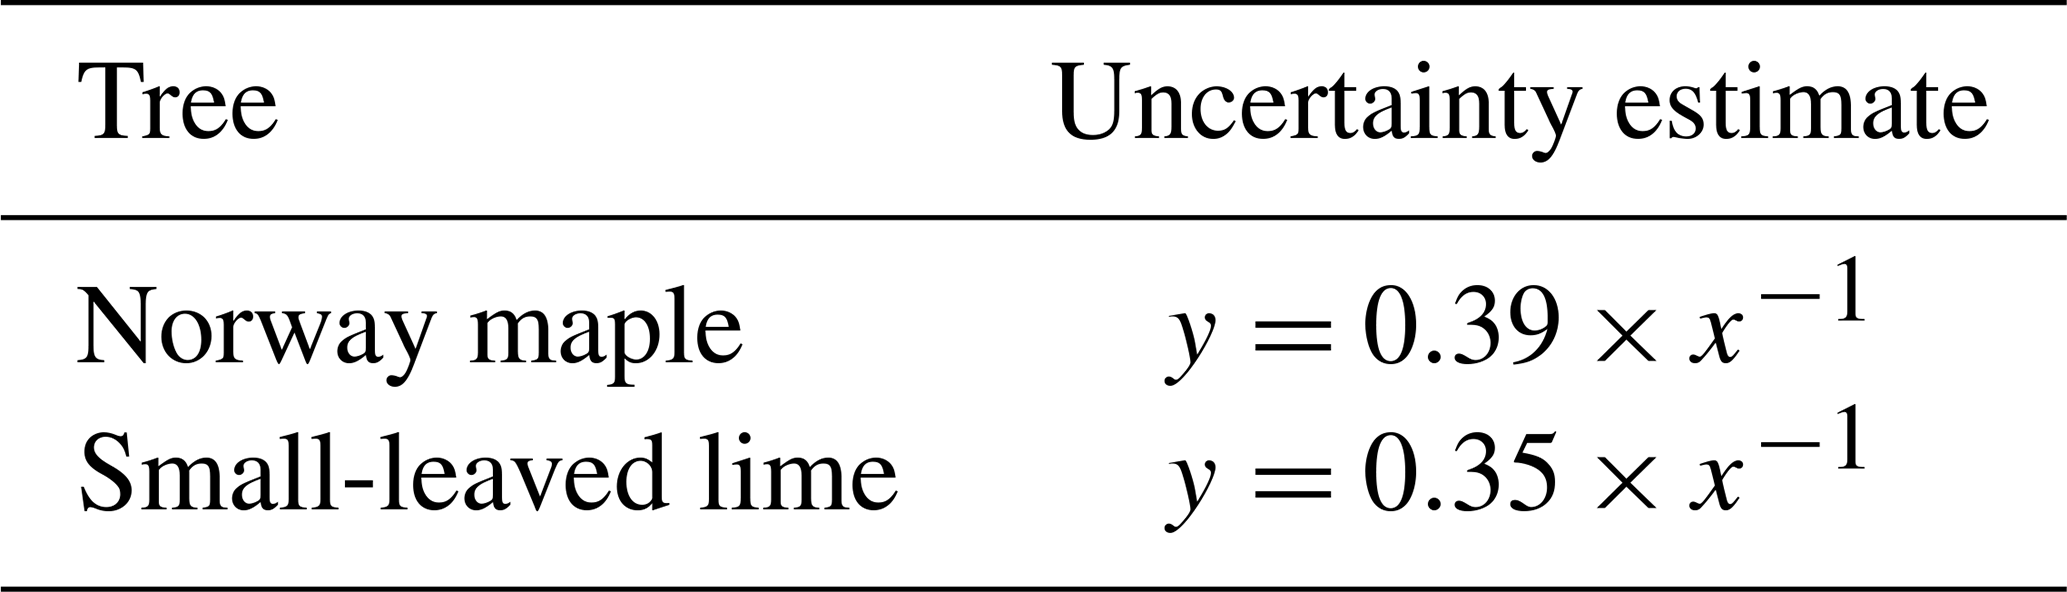
For small events of 1 mm, uncertainty is quite high: 39 % for the Norway maple and 35 % for the small-leaved lime. However, this uncertainty drops quickly, and for events of 2 mm, the uncertainty for both trees is below 20 %. For events larger than 4 mm, uncertainty drops below 10 %, and for events larger than 7 mm, uncertainty is around 5 %. Due to their negligible importance from a hydrological perspective and the high uncertainties associated with them, we decided to exclude events < 1 mm from the analysis. No uncertainty analysis of the stemflow was carried out as very few events displayed significant stemflow.
2.5 The meteorological stations
Reference data from a meteorological station were used for the measurement of the gross precipitation. A rain event was defined as a rain volume record of minimum 0.1 mm, registered by the tipping bucket. In accordance with authors such as Asadian and Weiler (2009) and Staelens et al. (2006), rain events were separated by a dry gap of a minimum of 4 h. For each rain event, characteristics such as duration and intensity were determined.
For the period from August 2015 to November 2015, a tipping bucket was installed on the top of a flat roof, approximately 20 m from the Norway maple. Additional meteorological data for the period from August to November 2015 were gathered from a nearby weather station (RMI, Uccle). For the period from March to August 2016, a meteo station was installed approximately 100 m from the Norway maple. Besides a tipping bucket (0.02 mm per tip), this meteo station also included measurements of temperature, humidity, wind speed, wind orientation and solar radiation. These data had a temporal resolution of 5 min. For the period from September 2016 to August 2017, a commercially operated meteo station was used which was located approximately 1.8 km from the small-leaved lime. The precipitation data from the tipping bucket had a resolution of 0.01 mm and a time resolution of 15 min. This station also provided several other meteorological measurements such as temperature, humidity and wind speed (Table 3). The difference in the time resolution between the reference stations did not affect measurement results in a significant way due to the abovementioned definition of a rain event.

Rain events on both sites are predominantly low with respect to precipitation amount, duration and intensity. For the Norway maple site, an average event contained 3.7 mm of rain and lasted for 325 min with an intensity of 1.3 mm h−1. An average event at the small-leaved lime site contained 4.7 mm of rain and lasted for 392 min with an intensity of 0.9 mm h−1. These intensities are lower than those reported in Mediterranean climates where an average intensity of > 2 mm h−1 is common (Pereira et al., 2009). Average wind speeds were low for the Norway maple site (1.1 m s−1) compared with the small-leaved lime site where an average wind speed of 5.2 m s−1 was measured during rain events. This is probably due to the complex wind patterns typically present in urban environments and the more exposed location of the weather station at the small-leaved lime site.
2.6 The data processing and model comparison
The water balance for a rainfall event states the following:
where Pg is the gross precipitation, I is the interception storage of the tree, Tf is the throughfall under the tree and St is the stemflow of the tree.
Pg (mm) is recorded by a pluviometer close to the v-catchment and is extrapolated to the vertical projection area of the construction to calculate the total water volume that falls on catchment surface. Part of the Pg falls directly onto the catchment and is guided to the catchment container (Pg free). Another part of Pg falls onto the tree (Pg tree), from which a small portion is free throughfall that never comes into contact with the tree. The majority of water, however, is intercepted by the tree's leaf and stem surfaces. Once the interception storage capacity of the tree is filled, throughfall will occur. Water that flows downwards on the stem is collected in a separate stemflow container. The interception storage of the tree is then calculated as the difference between the gross precipitation that falls on the entire construction during the event and the sum of the precipitation that falls on the free construction (the part of the v-catchment not covered by the tree), the throughfall and stemflow readings. For the v-catchment the water balance reads as follows:
After including the vertical projection areas, the water level readings of the pressure sensors and rearranging Eq. (3) becomes
VPAconstr, VPAfree, VPAcont and VPAst are the vertical projection areas of the whole v-catchment construction, the part of the construction not covered by the tree, the catchment container and the stemflow container, respectively. ΔHcont and ΔHSt are the height differences recorded after a rain event in the catchment and in the stemflow container, respectively.
Not taking the tree interception into account, the catchment container reached its maximum capacity (493 L) when a rain event of 7.5 mm occurred. To take larger rainfall events into account, we followed the procedure explained below.
Each rain event that filled the catchment container was divided in two parts: the first part lasted until the container was filled and the second part started when the container was full and all additional rain overflowed to the ground. If the amount of rain that had fallen until the moment the container filled was larger than the interception storage capacity of the tree, it was assumed that the interception storage capacity was reached and that all additional water would be converted to throughfall. Otherwise, the event was discarded. The assumption that all excess water, after the container has been filled, is converted to throughfall only holds when intra-event evaporation is negligible. If intra-event evaporation is not negligible, the canopy storage would be underestimated and throughfall would be overestimated. To make sure that there were no intermittent dry periods at these times that would promote intra-event evaporation, time intensity and cumulative rainfall graphs were made for each rain event. After a rain event passed this test, the throughfall values of the first and second part of the event were summed and compared to the interception storage values of the first part of the event. The stemflow container never filled completely and was analyzed on a whole-event basis.
The interception storage capacity (S; mm) was calculated using an empirical equation based on the LAI (–) (Gómez et al., 2001):
Due to the empirical background of the equation, it might not be fully applicable in our case. However, we prefer to use the equation from Gómez over the more widely known method from Leyton et al. (1967) for three reasons: (1) Eq. (5) has no subjective interpretation, (2) Eq. (5) is based on the LAI which can be easily measured or retrieved from optical imagery and (3) because seasonal changes in interception storage can be taken into account. The latter is crucial for deciduous trees in temperate climates.
Table 4Characteristics of the different simulation approaches.
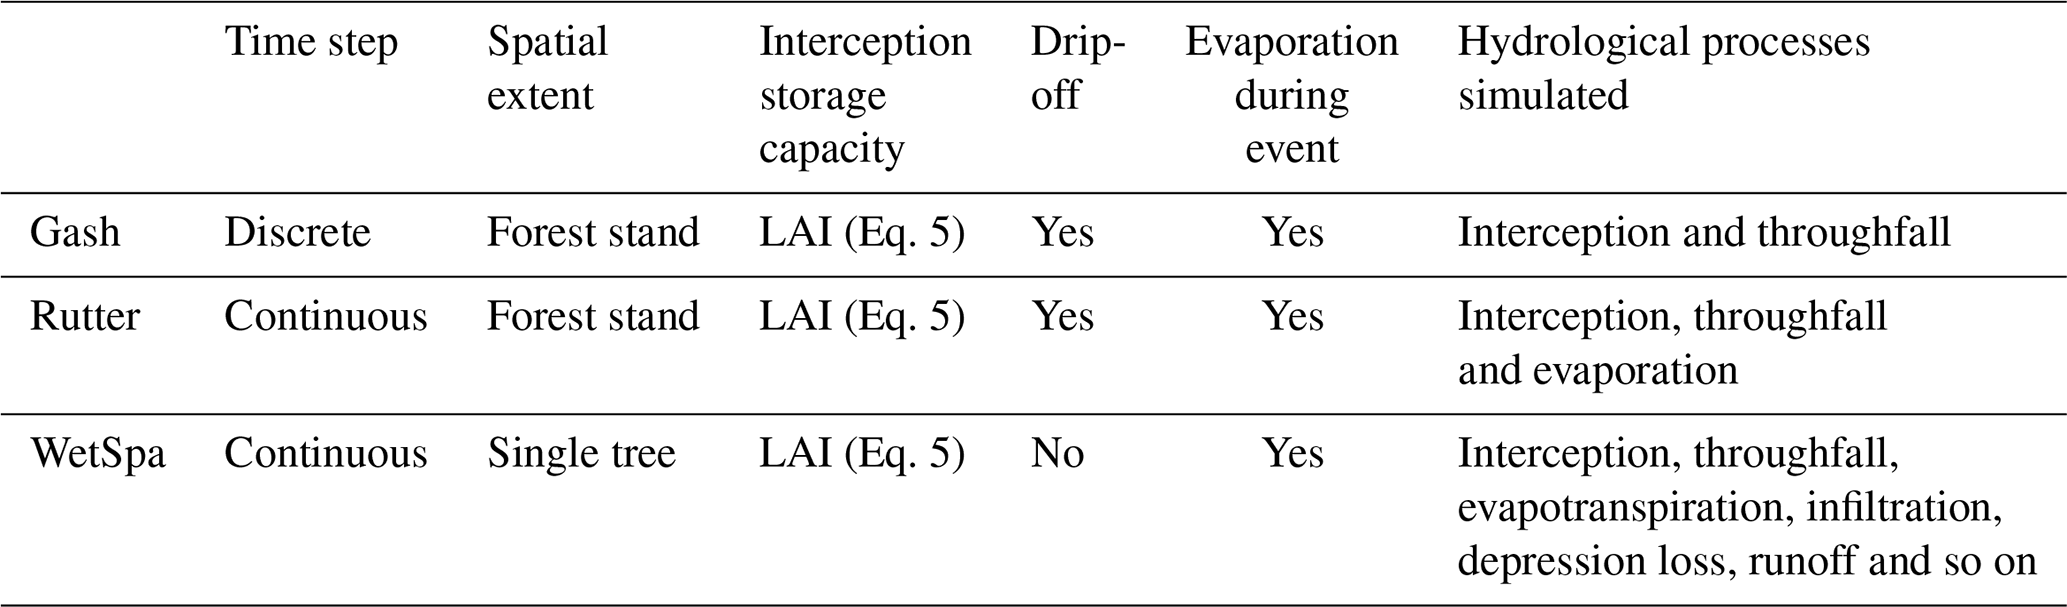

The measured interception storage is compared to different simulation approaches: the Gash, Rutter and WetSpa models (Table 4). The equations for the different simulations of the interception storage can be found in Appendix C. The Gash and Rutter models have been developed for a forest stand, whereas the WetSpa model has been adapted for a solitary tree. The Gash model considers separate rainfall events, and the interception storage capacity is assumed to be completely emptied before each event. The continuous simulations with Rutter and WetSpa are performed at the same time step as the rainfall measurements (see Sect. 2.4). This approach enables an emptying of the storage by evaporation during the event. For all models, we estimate the interception storage capacity with the measured LAI (Eq. 5, Gómez et al., 2001). Gash, Rutter and WetSpa empty the storage via evaporation from the leaves based on the potential evapotranspiration estimated using the Penman–Monteith equation (Monteith, 1965). Gash estimates free throughfall using the gap fraction (Gash and Morton, 1978; Leyton et al., 1967; Rutter et al., 1971; Xiao et al., 1998). Further drip-off from leaves is estimated using the simplification of Gash et al. (1999), in order to avoid empirical parameterization (Rutter et al., 1971).
3.1 Event summary
The gross precipitation of each event was divided into throughfall, interception storage and stemflow (Table 5).

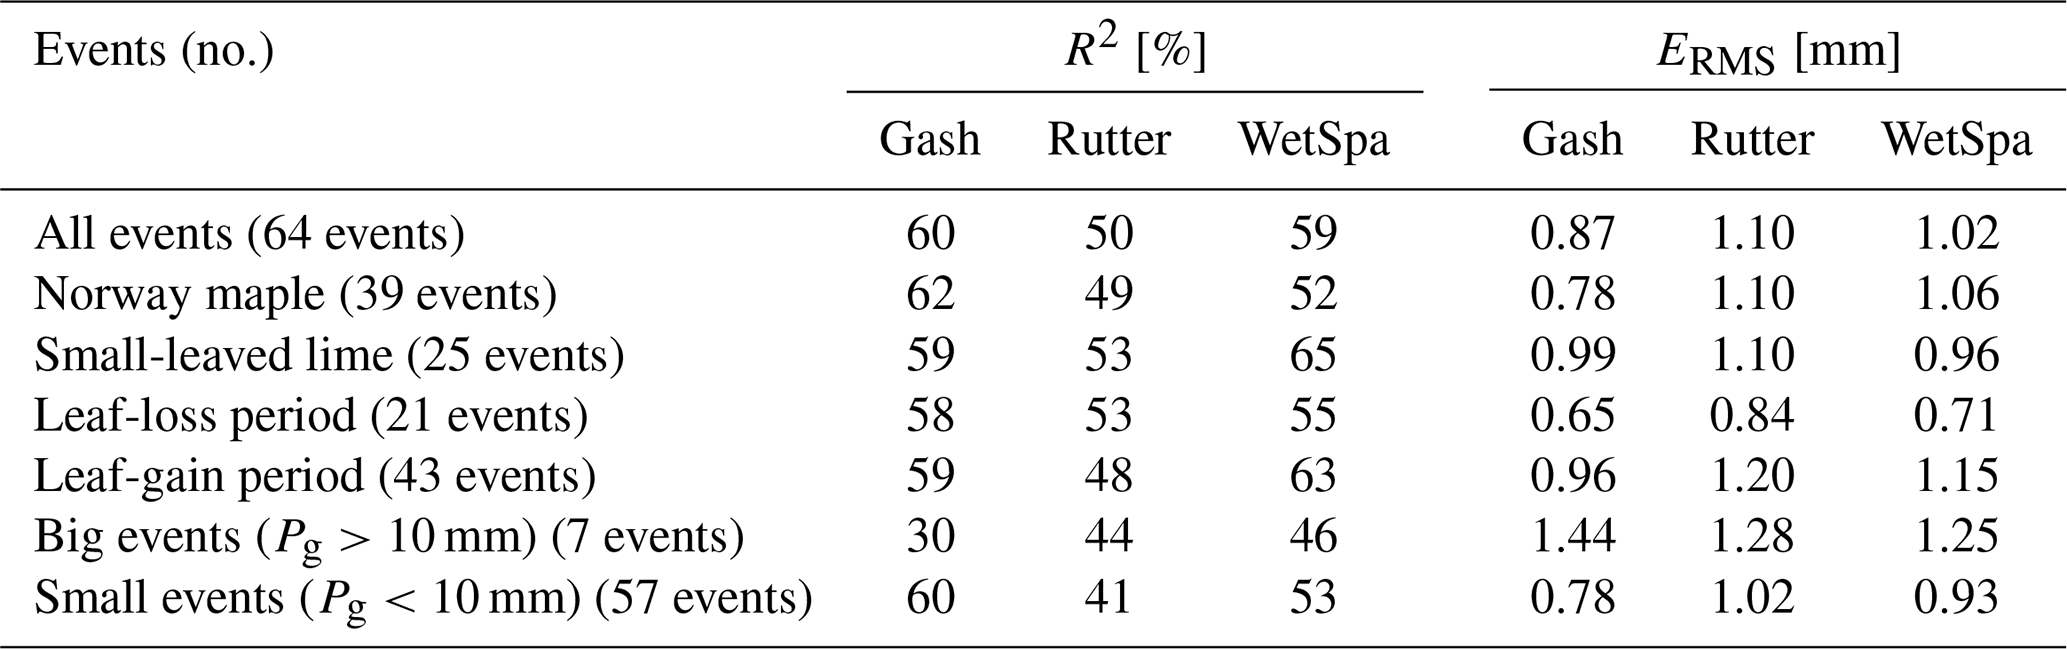
Table 7Correlation between measured and simulated interception storage (R2 and ERMS).
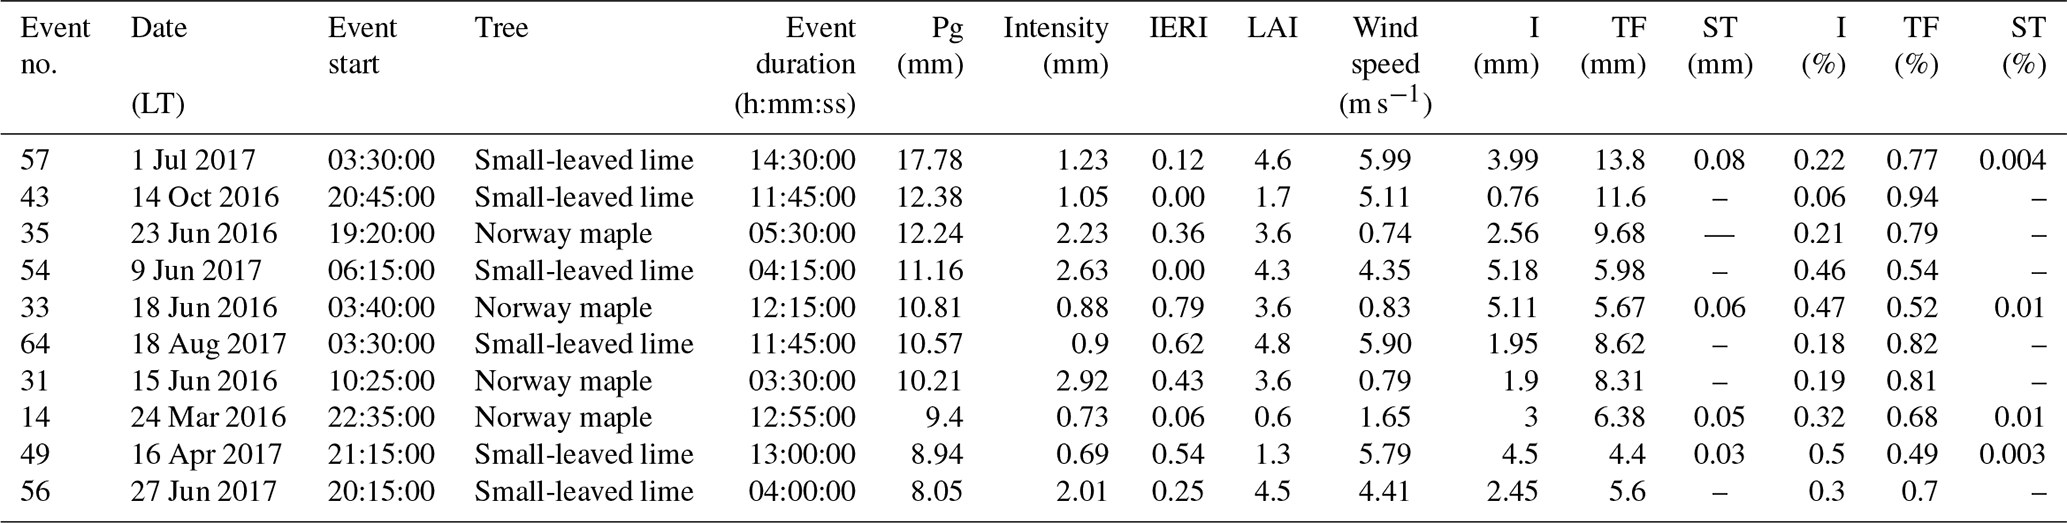
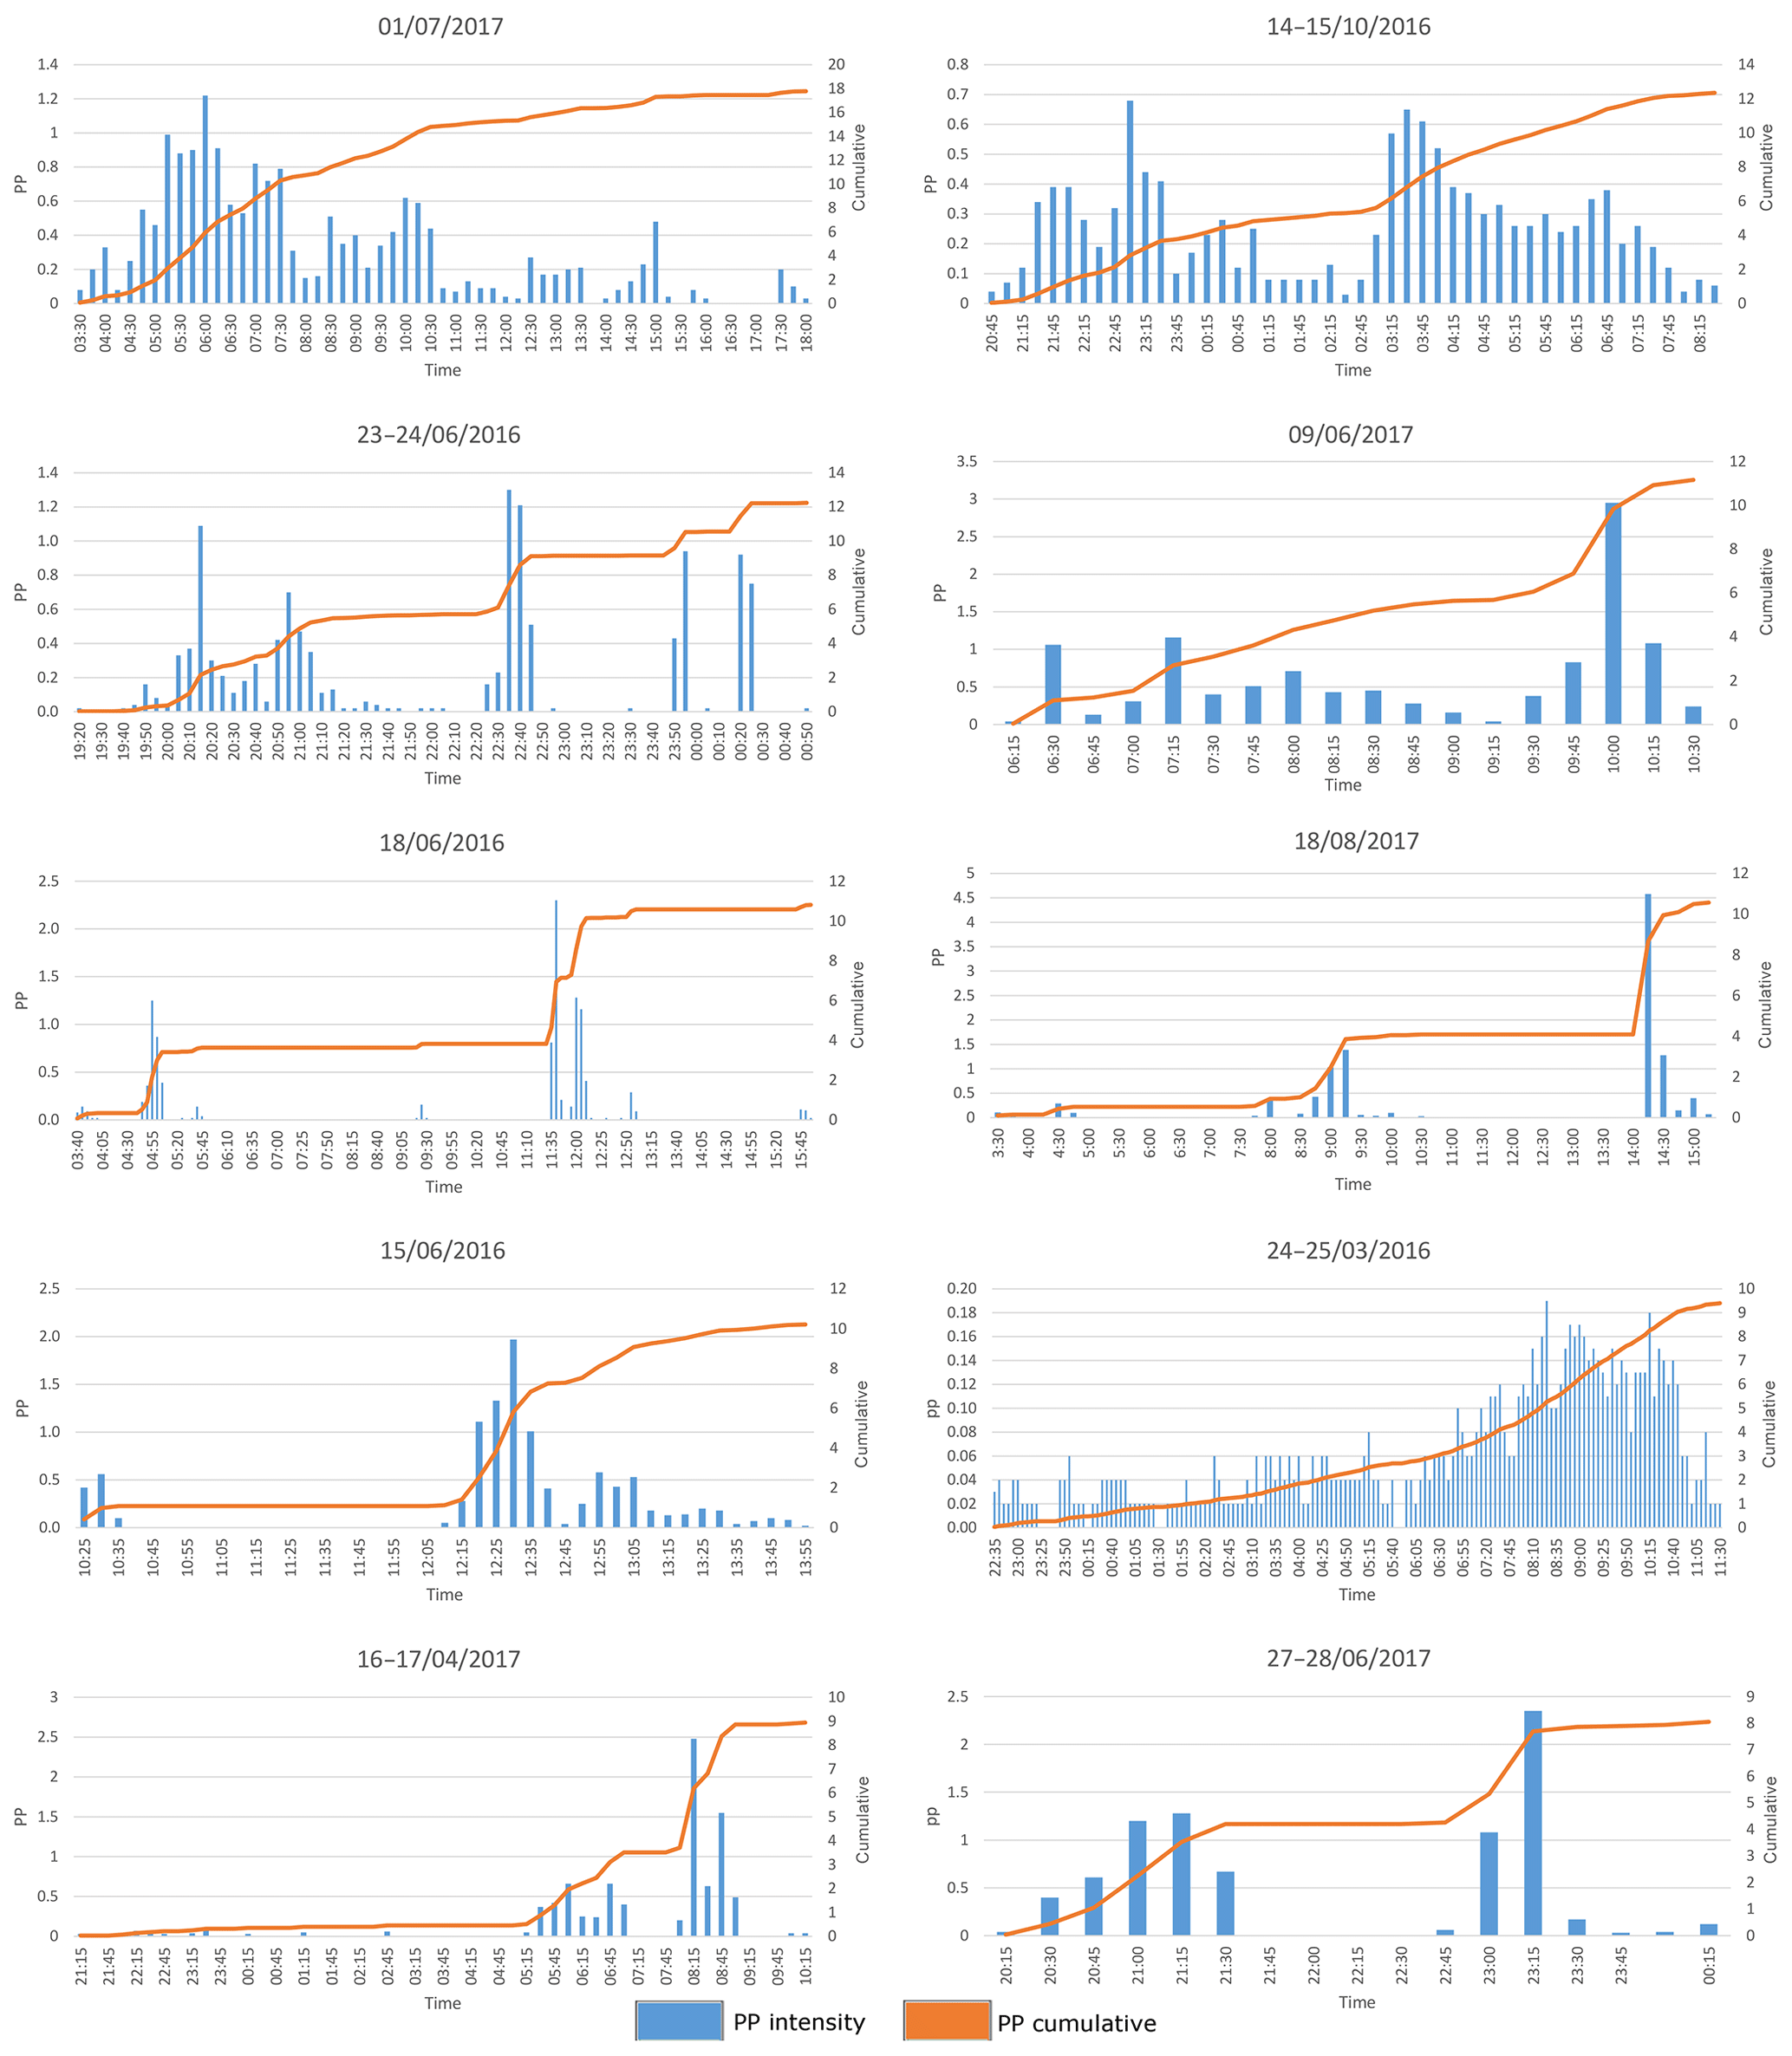
From the 64 rain events analyzed, 10 were larger than 7.5 mm and exceeded the maximum storage capacity of the catchment container. Hence, all additional precipitation that fell after the catchment container was full was considered to be throughfall. These events were carefully analyzed for intermittent dry periods that could give rise to an overestimation of throughfall and an underestimation of canopy storage. Several of these events occurred during nighttime or early morning hours, when possible intra-event evaporation during intermittent dry periods was negligible. For other rain events, an intermittent dry period occurred when the catchment container was not yet full. In two events, intermitted dry periods occurred during sunlight hours after the catchment container was full (the event on 1 July 2017 and the event on 18 June 2016). However only 0.33 and 0.23 mm of rain fell after the intermittent dry periods, respectively, which is negligible in comparison to 17.78 and 10.81 mm of rain that fell during the whole events, respectively. After carefully analyzing these events, we decided that they should be used in the analysis. These 10 rainfall events, along with their time intensity and cumulative graphs are given in Appendix B.
Taking all events into consideration, both trees show very similar behavior. Both trees intercept 38 % of rainfall, and stemflow is negligible for both trees. The largest difference is found in the events between 5 and 10 mm, where the Norway maple intercepts 40 % of the rainfall and the small-leaved lime intercepts 57 %. Another noticeable difference is seen when we compare the measurement periods. In the first measurement period, the Norway maple intercepts significantly more (47.9 %) than the small-leaved lime (19.9 %). Interception storage in the second measurement period is more similar between the trees with 35 % of rain intercepted by the Norway maple and 42.9 % by the small-leaved lime.
3.2 The interception storage capacity and simulations
Considering the whole year, interception storage capacities (S) for the small-leaved lime are higher than for the Norway maple as expected when we consider the LAI measurements. Furthermore, we separate the measurements into measurement period 1 and 2, based on our measurement campaign. The time spans that these periods cover are shown in Table 6. In general, measurement period 1 and 2 cover both low- and high-leaf coverage. Therefore, differences in S are not large. However, during the period where trees lose their leaves S seems to be a bit lower than during the period where trees gain new leaves. The differences are higher for the small-leaved lime, which is also what we expect from LAI measurements. In their paper, Gómez et al. (2001) acknowledge a slight overestimation of the interception storage capacity. We find that the interception storage capacity values are within the range of expected interception storage capacity values found in the literature and range between 0.2 and 3.58 mm (André et al., 2008; Aston, 1979; Breuer et al., 2003; Gash and Morton, 1978; Gómez et al., 2001; Liu and De Smedt, 2004; Valente et al., 1997; Xiao et al., 2000a).
The v-catchment measurements include free throughfall, drip-off and stemflow. As our stemflow measurements are very low (<0.2 %), we exclude stemflow from our simulations. In general all simulation methods perform similarly and predict an interception storage close to the measurements ( % of rainfall; Fig. 5). For bigger rainfall events (Pg>10 mm), the measurements indicate an average interception of 25 % of rainfall, whereas for smaller rainfall events (Pg<10 mm), we measure an average interception rate of 47 %.
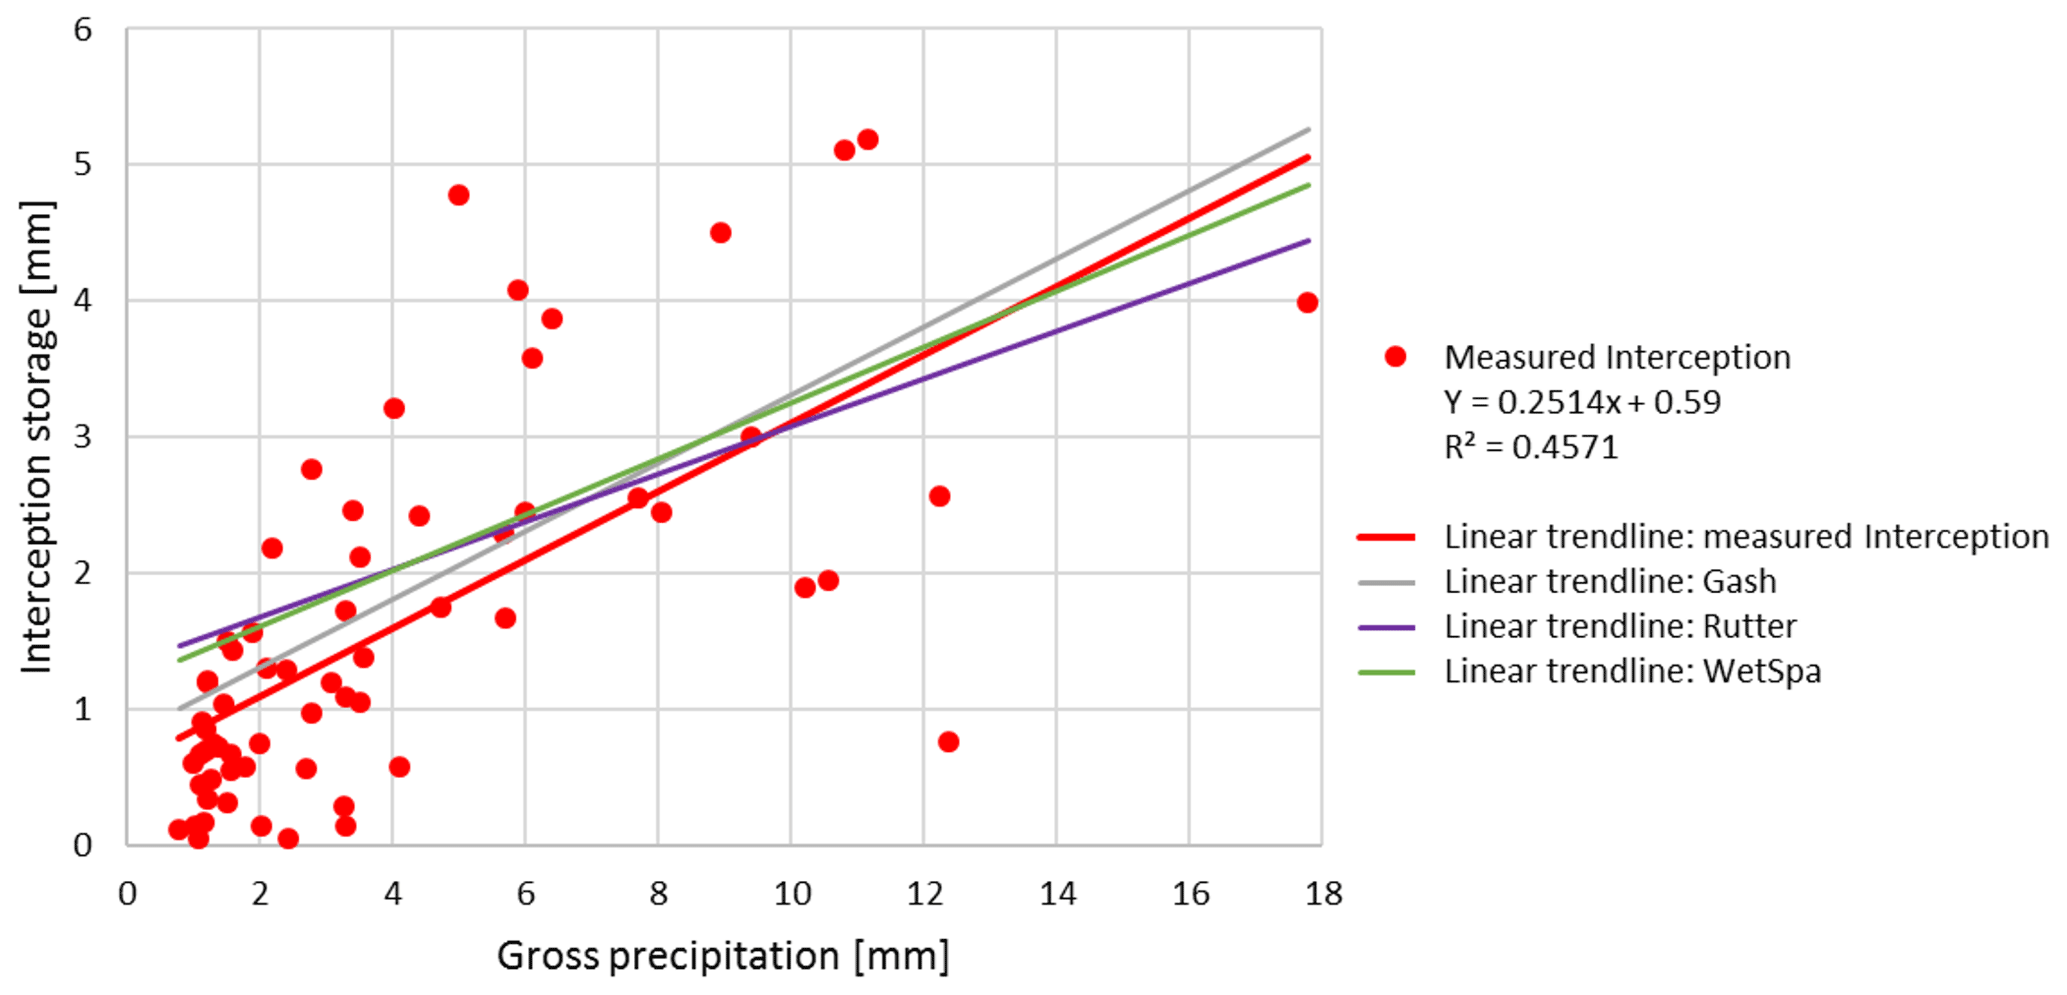
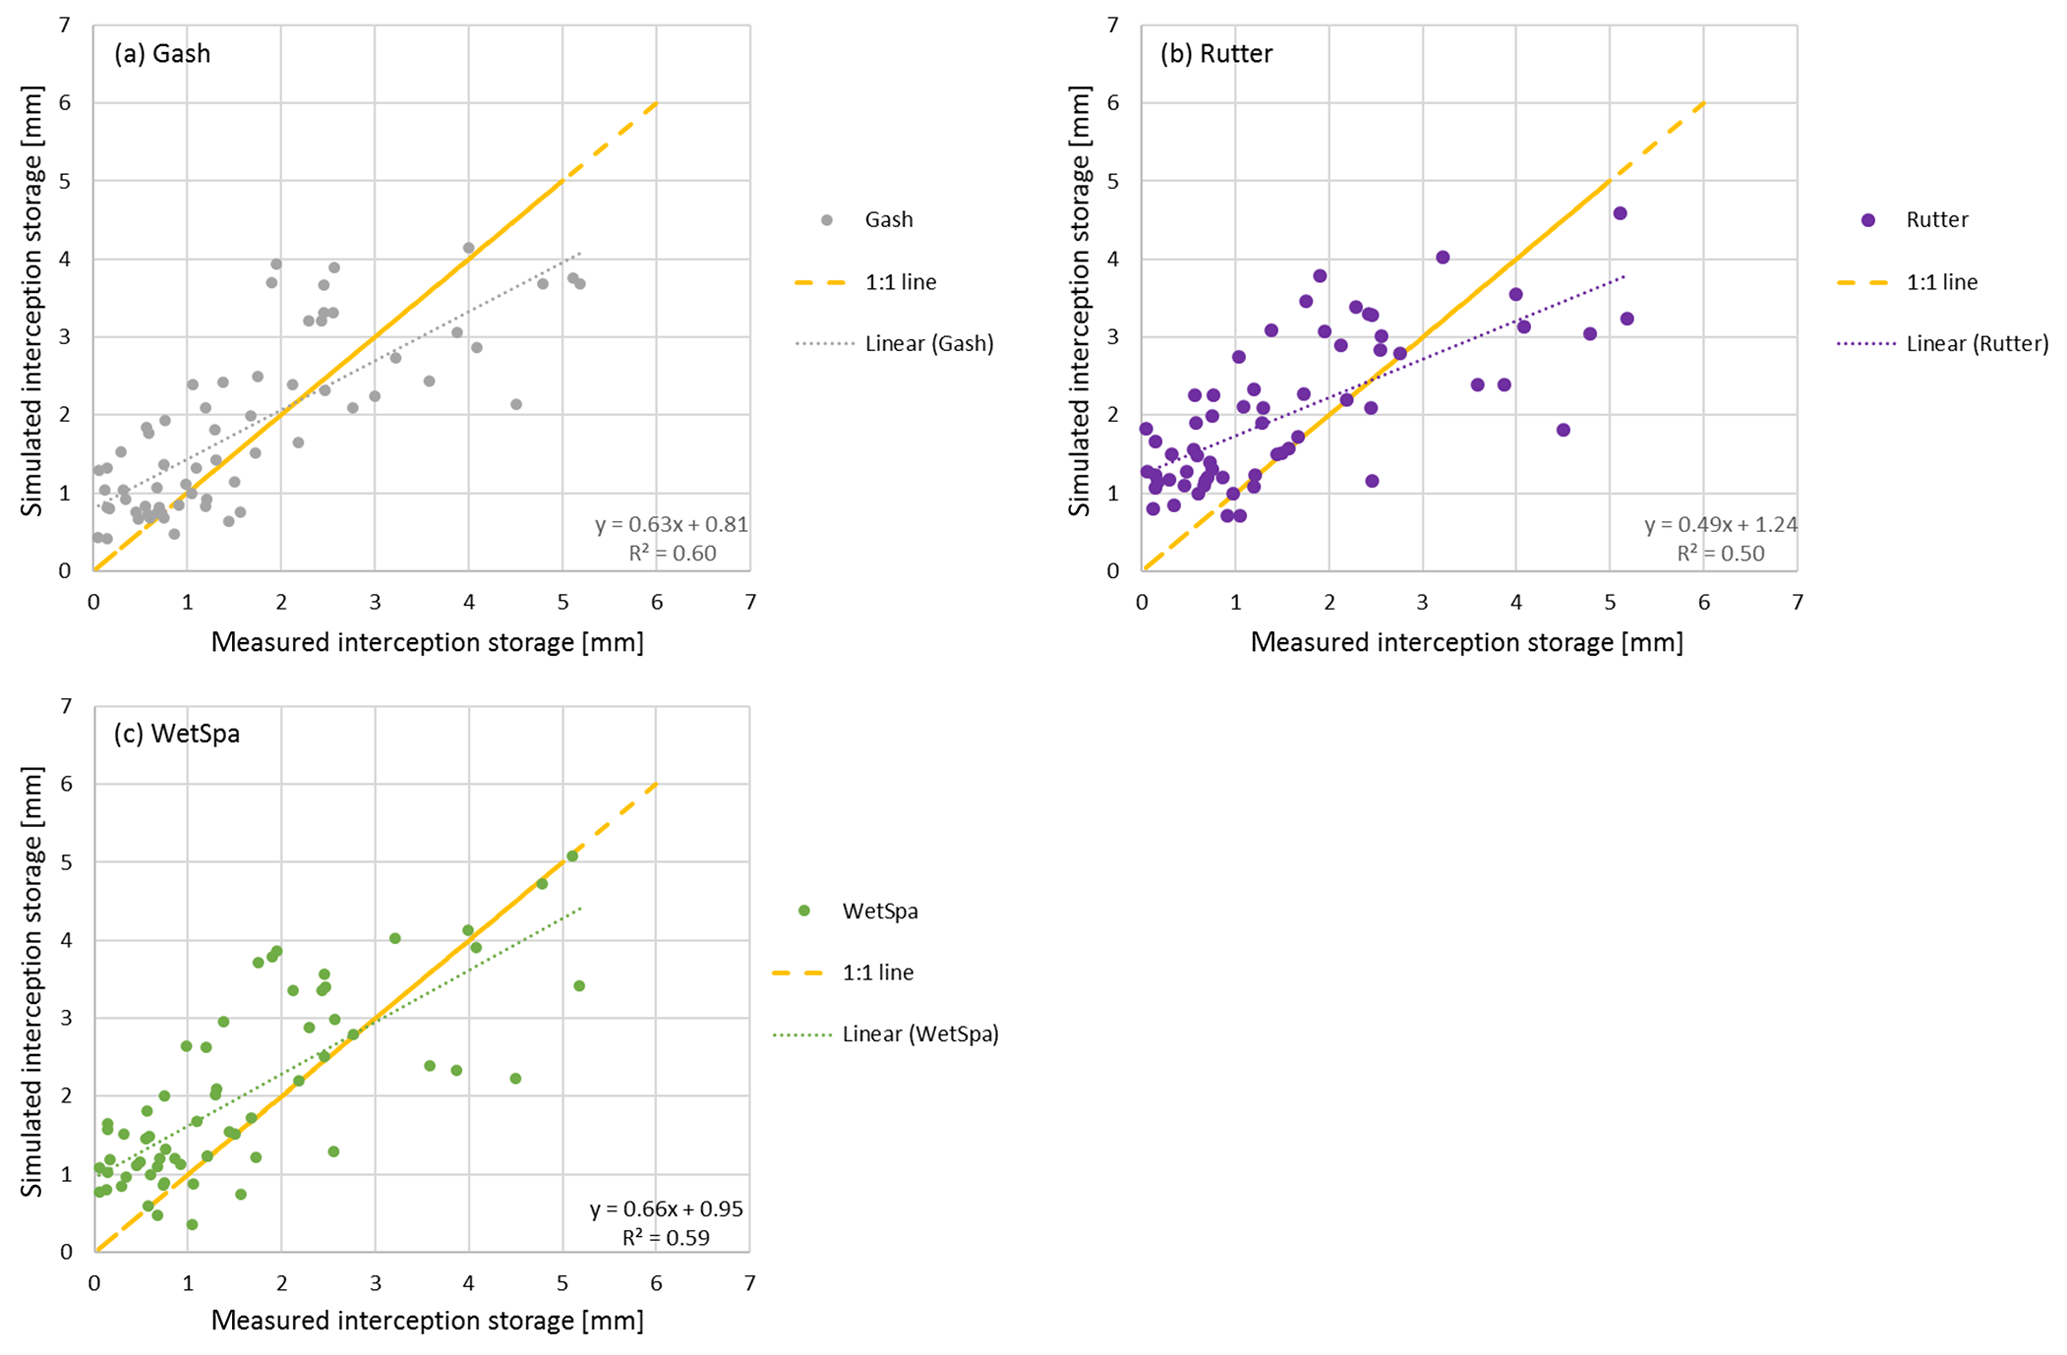
Figure 6Measured vs. simulated interception storage of the Gash (a), Rutter (b) and WetSpa (c) models.
Table 7 shows that the Gash method is the most stable between the two trees and among seasons (R2=60 % ± 2 %, mm), whereas the other methods show more variation. As reported by Véliz-Chávez et al. (2014), the performance of the Rutter model is not as good as the performance of the Gash method. Similarly, we also observe an underestimation of the interception storage for higher rainfall events (Pg>10 mm) using the Rutter method (Fig. 5). WetSpa performs best for rainfall events Pg>10 mm and Gash performs worst. This might be related to the Gash method's discrete behavior vs. the continuous simulations of Rutter and WetSpa (Table 7, Figs. 5 and 6). For small events (Pg<10 mm), all simulations overestimate the interception storage with Gash showing the best performance.
In Fig. 6, we can observe that all models simulate lower interception storage than measured for the bigger interception events (> tree storage capacity) and higher interception storage than measured for smaller interception events (< tree storage capacity). For small interception events, the storage capacity is not filled in our simulations, and trees intercept all rainfall water. However, due to wind speed and direction, rain inclination angle, leaf zenith angle, and other meteorological and tree architectural parameters not all rainwater is intercepted, even for small events. Although we calculate the storage capacity using the method from Gómez et al. (2001) (Sect. 3.2), our models still underestimate the interception storage for bigger interception events. We assume that the emptying of the storage via evaporation from leaves during the event is underestimated in our simulations.
With regards to the correlation values, WetSpa performs better than Rutter but worse than Gash. For the small-leaved lime tree, WetSpa shows the best performance for the leaf-gain period and for rainfall events where Pg>10 mm.
4.1 The tree interception storage
Average interception storages during the measurement periods for both trees are very similar: 38.70 % for the Norway maple and 37.60 % for the small-leaved lime. In general, the interception storage we measured is relatively high in comparison with other studies (Gómez et al., 2001; Staelens, 2008; Pereira et al., 2009; Xiao et al., 2000b; Xiao and McPherson, 2011). However, one should be cautious when directly comparing interception storage values as measurement conditions are different. Our measurement periods only covered full leaf area periods and transition periods. Defoliated trees were not monitored and, if included, these would lower the average amount of rain intercepted. Moreover, to our knowledge most studies are usually undertaken in Mediterranean climates that have a distinct precipitation pattern with dry summers and wet winters. In comparison, temperate climates have a more evenly distributed rainfall pattern. There are, however, meaningful comparisons to be made. For example, an evergreen Gingko biloba in the study of Xiao and McPherson (2011) and an evergreen Quercus ilex in the study of Pereira et al. (2009) were found to intercept 25 % and 23 % of gross precipitation, respectively. Although no defoliation occurred and leaf coverage was high, these interception storage values are still far below the values measured in this study. In another study, Xiao et al. (2000a) derived interception storage values of a Pyrus calleryana “Bradford” and a Quercus suber with a constant LAI in a Mediterranean climate and found that they intercepted 15 % and 27 % of the gross precipitation, respectively. The higher interception storage values we find indicate the suitability of the conditions for tree interception in our temperate climate in comparison with the Mediterranean climate. Measured rain intensities in our study are low in comparison with those mentioned in studies performed in the Mediterranean region, where average intensities larger than 2 mm h−1 are common (Pereira et al., 2009). Xiao et al. (2000a) found that when small rain events of low duration follow one another with a high frequency, the amount of intercepted water increases due to the consecutive wetting and drying of the crown surface.
4.2 The model comparisons
The Gash, Rutter and WetSpa models show similar performances. For bigger interception events (> interception storage capacity), we simulate lower interception storage than we measure. We assume that the emptying of the storage by evaporation is higher than we simulate with our models especially for the Gash model, which does not account for continuous evapotranspiration during the event. The worse performance of the Gash and Rutter models compared with WetSpa for big interception events might be related to their origins (based on forest stands and not on solitary trees). Evaporative behavior in forest stands differs from solitary urban trees due to differences in canopy architecture, tree physiology and their response to the urban climate (Grygoruk et al., 2014; Zipperer et al., 1997). To gain deeper a understanding at a single tree level, more specialized interception models such as the method from Xiao et al. (2000b) might be more suitable. Unfortunately we could not measure all of the parameters needed for this method and were not able to evaluate its performance for our trees. This indicates the operational limitations of such a model. Due to the LAI-based calculations, the biophysical characteristics of solitary trees in an urban environment are represented (Wirion et al., 2017; Degerickx et al., 2018) and the need for measuring physical parameters for the simulations is avoided. This is of particular interest if we want to evaluate the net rainfall potential and further water balance components (infiltration, runoff and evaporation) in an urban context. The simplicity of the WetSpa model and its water balance framework, as well as the high similarity in the performance of the specialized interception models (Gash and Rutter), and its relatively good performance for big interception events make it a competitive tool to evaluate the retention of rainwater on city trees.
4.3 The potential benefit of trees in an urban context
In our v-catchment experiment, 38 % of gross precipitation was intercepted. This amount is very significant and proves that trees can be an important addition to an integral water management plan. The temperate climate that the experiments were conducted in is beneficial for tree interception due to the relatively even rainfall distribution throughout the year and its characteristic long, low-intensity rainfall events. In the case of heavy rainfall events, the interception storage capacity of the trees is quickly reached and most rainfall consequently contributes to surface runoff. Although urban trees alone cannot be considered a flood control measure, they help to delay and spread out peak runoff and reduce pollutant wash-off, thereby limiting the pressure on the drainage system (Szota et al., 2019; Wang et al., 2008). Another hydrological benefit of urban trees, not covered in this research, is that they create openings in the impervious surface, thereby giving runoff water the opportunity to infiltrate (Armson et al., 2013). Our experimental setup reflects an ideal case of a solitary city tree, unobstructed by buildings with full sun and wind exposure. However, in reality urban trees are found in a wide variety of conditions and interception will diverge from our experiments (Xiao and McPherson, 2016; Asadian and Weiler, 2009; Xiao et al., 1998; Zipperer et al., 1997). To represent the diversity of urban trees, an LAI-based simulation is proposed. The experimental results and our simulations show that city trees should be considered for urban water management and that the WetSpa tool could be a good alternative to assess the interceptive potential of trees.
To evaluate the importance of city trees for reducing net rainfall in a temperate climate, an in situ tree interception experiment was designed that measured the throughfall underneath a solitary standing Norway maple and a small-leaved lime. Both trees were found to intercept 38 % of gross precipitation on average for all measurements, 46 % on average for events with Pg<10 mm (57 events) and 26 % on average for events with Pg>10 mm (7 events). These results emphasize the importance of interception storage for reducing net rainfall and accounting for interception storage in an urban water balance model. The measured data were used as inputs for a whole water balance model (WetSpa) and the specialized interception models from Gash and Rutter. All three models showed similar performance when compared to the measurements (R2 0.5–0.6). The models underestimated interception storage for bigger rainfall events (>10 mm), which we relate to a poor understanding of the evaporative behavior of intercepted rainwater during rain events in an urban environment. WetSpa showed the best performance for bigger rainfall events. Thus, the relatively good performance of WetSpa for bigger rainfall events, along with its similarity in performance compared to the specialized interception models, its simplicity and its water balance framework, promote it as a tool for assessing the interceptive potential of urban trees.
The measured interception, throughfall and stemflow data for the Norway maple and the small-leaved lime can be found in Smets (2019) (https://doi.org/10.17632/bj46kgstfx.2).
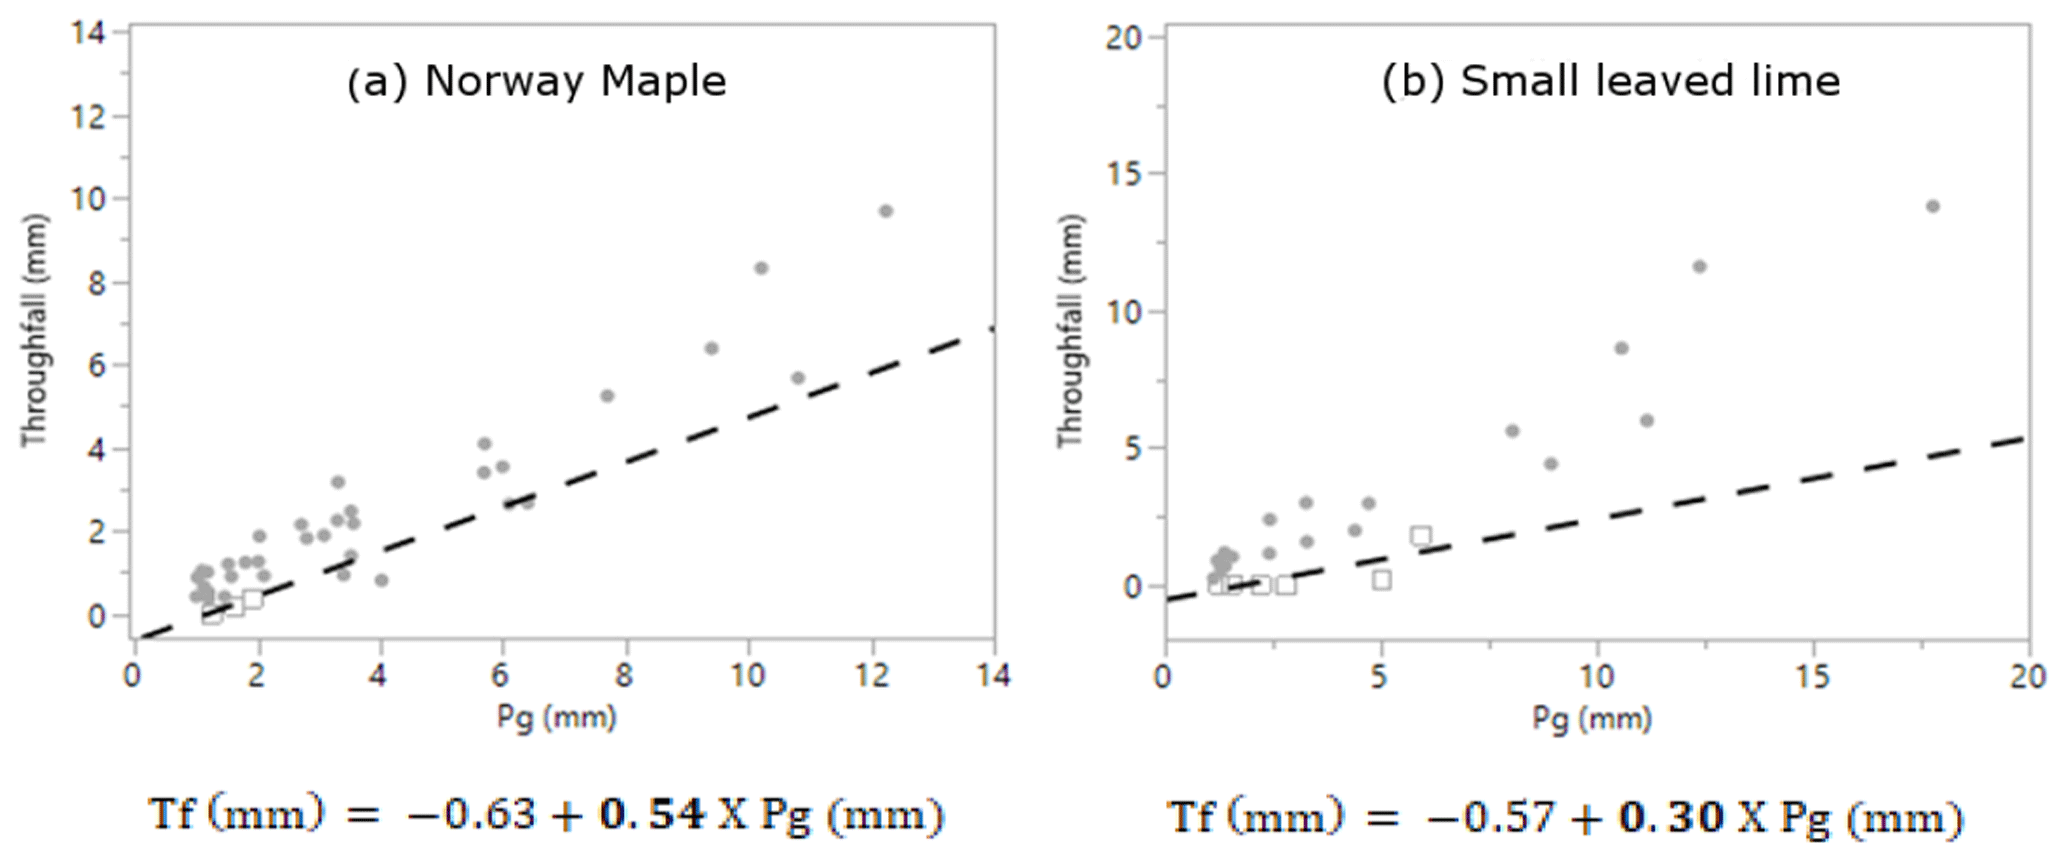
Figure A1Graphs constructed following the Leyton method for the Norway Maple (a) (all year n=39) and small-leaved lime (b) (all year n=25).
Table A1Free throughfall coefficients of the Norway maple and small-leaved lime.

Table B1Rainfall events > 7.5 mm ranked from largest to smallest. (IERI – intra-event rainfall intermittency; LAI – leaf area index; I – interception; TF – throughfall; ST – stemflow.)
The first equation from Xiao et al. (1998) used in this paper is
where I is the interception storage (mm), S is the crown surface storage capacity = interception storage capacity (mm), E is the evaporation (mm), Pg is the gross rainfall (mm), Tf is the free throughfall (mm), D is drip-off (mm) and Sf is the stemflow (mm).
The second equation from Xiao et al. (1998) used in this paper is as follows:
where P is the gap fraction (–).
The equation from Valente et al. (1997) used in this study is
The Gash and Morton (1978) equation is as follows:
where Ea is the mean evaporation/canopy cover (–), R is the mean rainfall/saturated canopy cover (–) and P′ is the precipitation reaching canopy saturation (mm).
The Rutter et al. (1971) equation used is
and the equation from Vegas Galdos et al. (2012) is as follows:
where Psoil is the precipitation reaching the ground (net precipitation) (mm), and Ia is the antecedent interception storage (at a time step before actual rainfall in units of millimeters).
where Ep is the potential evapotranspiration estimated with the Penman–Monteith equation (Monteith, 1965).
The WetSpa equation (Liu and De Smedt, 2004) is as follows:
and
and
VS, CW, BS and BV conceived and designed the ground-truthing experiments and the simulation strategy. VS and CW set up the v-catchment and performed the ground-truthing measurements. VS took the lead on the analysis of the measurement results, and CW carried out the simulations. VS, CW, BS and BV analyzed the results, and prepared the structure of the paper. VS and CW wrote the initial draft of the paper. WB, MH, BS and BV supervised the research and contributed to improving the paper prior to submission.
The authors declare that they have no conflict of interest.
We wish to thank Sarah Mommers and Anne-Sophie Mulier as well as the technical assistants Christophe Coeck, Eric Van Beek and Remi Chevalier for their contribution to the measurement campaigns. The meteorological data set was provided by the Royal Meteorological Institute (Uccle) and Flowbru (depot communal).
This research has been supported by the UrbanEARS project (grant no. SR/00/307), the BELAIR-SONIA (grant no. SR/03/333) and the FWO-SB (grant no. 121124).
This paper was edited by Markus Weiler and reviewed by two anonymous referees.
André, F., Jonard, M., and Ponette, Q.: Influence of species and rain event characteristics on stemflow volume in a temperate mixed oak – beech, Hydrol. Process., 22, 4455–4466, https://doi.org/10.1002/hyp.7048, 2008.
Armson, D., Stringer, P., and Ennos, A. R.: The effect of street trees and amenity grass on urban surface water runoff in Manchester, UK, Urban For. Urban Green., 12, 282–286, https://doi.org/10.1016/j.ufug.2013.04.001, 2013.
Asadian, Y. and Weiler, M.: A new approach in measuring rainfall interception by urban trees in coastal British Columbia, Water Qual. Res. J. Canada, 44, 16–25, https://doi.org/10.2166/wqrj.2009.003, 2009.
Aston, A. R.: Rainfall interceptcion by eight small trees, J. Hydrol., 42, 383–396, https://doi.org/10.1016/0022-1694(79)90057-X 1979.
Breuer, L., Eckhardt, K., and Frede, H.: Plant parameter values for models in temperate climates, Ecol. Model., 169, 237–293, https://doi.org/10.1016/S0304-3800(03)00274-6, 2003.
Ciria: Demonstrating the multiple benefits of SuDS – a business case (Phase 2), MWH, available at: https://www.susdrain.org/files/resources/ciria_guidance/ciria_rp993_literature_review_october_2013_.pdf (last access: 19 September 2019), 2013.
Degerickx, J., Roberts, D. A., McFadden, J. P., Hermy, M., and Somers, B.: Urban tree health assessment using airborne hyperspectral and LiDAR imagery, Int. J. Appl. Earth Observ. Geoinf., 73, 26–38, https://doi.org/10.1016/J.JAG.2018.05.021, 2018.
Dietz, M. E.: Low impact development practices: A review of current research and recommendations for future directions, Water Air Soil Pollut., 186, 351–363, https://doi.org/10.1007/s11270-007-9484-z, 2007.
Farrugia, S., Hudson, M. D., and McCulloch, L.: An evaluation of flood control and urban cooling ecosystem services delivered by urban green infrastructure, Int. J. Biodivers. Sci. Ecosyst. Serv. Manage., 9, 136–145, https://doi.org/10.1080/21513732.2013.782342, 2013.
Friesen, J., Lundquist, J., and Van Stan, J. T.: Evolution of forest precipitation water storage measurement methods, Hydrol. Process., 29, 2504–2520, https://doi.org/10.1002/hyp.10376, 2015.
Gash, J. H. C. and Morton, A. J.: An application of the Rutter model to the estimation of the interception loss from Thetford Forest, J. Hydrol., 38, 49–58, https://doi.org/10.1016/0022-1694(78)90131-2, 1978.
Gash, J. H. C., Lloyd, C. R., and Lachaud, G.: Estimating sparse forest rainfall interception with an analytical model, J. Hydrol., 170, 79–86, https://doi.org/10.1016/0022-1694(95)02697-N, 1995.
Gash, J. H. C., Valente, F., and David, J. S.: Estimates and measurements of evaporation from wet, sparse pine forest in Portugal, Agr. Forest. Meteorol., 94, 149–158, https://doi.org/10.1016/S0168-1923(99)00008-8, 1999.
Gill, S., Handley, J., Ennos, A., and Pauleit, S.: Adapting Cities for Climate Change: The Role of the Green Infrastructure, Built Environ., 33, 115–133, https://doi.org/10.2148/benv.33.1.115, 2007.
Gómez, J. A., Gira, J. V., and Fereres, E.: Rainfall interception by olive trees in relation to leaf area, Agr. Water Manage., 49, 65–76, https://doi.org/10.1016/S0378-3774(00)00116-5, 2001.
Grimm, N. B., Faeth, S. H., Golubiewski, N. E., Redman, C. L., Wu, J., Bai, X., and Briggs, J. M.: Global Change and the Ecology of Cities, Science, 319, 756–760, https://doi.org/10.1126/science.1150195, 2008.
Grygoruk, M., Batelaan, O., Mirosław-Świątek, D., Szatyłowicz, J., and Okruszko, T.: Evapotranspiration of bush encroachments on a temperate mire meadow – A nonlinear function of landscape composition and groundwater flow, Ecol. Eng., 73, 598–609, https://doi.org/10.1016/j.ecoleng.2014.09.041, 2014.
Guevara-Escobar, A., González-Sosa, E., Véliz-Chávez, C., Ventura-Ramos, E., and Ramos-Salinas, M.: Rainfall interception and distribution patterns of gross precipitation around an isolated Ficus benjamina tree in an urban area, J. Hydrol., 333, 532–541, https://doi.org/10.1016/j.jhydrol.2006.09.017, 2007.
Haase, D.: Effects of urbanisation on the water balance – A long-term trajectory, Environ. Impact Assess. Rev., 29, 211–219, https://doi.org/10.1016/j.eiar.2009.01.002, 2009.
IPCC: Climate Change: The Physical Science Basis, available at: http://www.ipcc.ch/report/ar5/wg1/ (last access: 19 September 2019), 2013.
Keim, R. F., Skaugset, A. E., and Weiler, M.: Storage of water on vegetation under simulated rainfall of varying intensity, Adv. Water Resour., 29, 974–986, https://doi.org/10.1016/j.advwatres.2005.07.017, 2006.
Kottek, M., Grieser, J., Beck, C., Rudolf, B., and Rubel, F.: World map of the Köppen–Geiger climate classification updated, Meteorol. Z., 15, 259–263, https://doi.org/10.1127/0941-2948/2006/0130, 2006.
Lauwaet, D., Hooyberghs, H., Maiheu, B., Lefebvre, W., Driesen, G., Van Looy, S., and De Ridder, K.: Detailed Urban Heat Island Projections for Cities Worldwide: Dynamical Downscaling CMIP5 Global Climate Models, Climate, 3, 391–415, https://doi.org/10.3390/cli3020391, 2015.
Leyton, L., Reynolds, E. R., and Thompson, F. B.: Rainfall interception in Forest and Moorland, Forest. Hydrol., 5, 163–178, 1967.
Link, T. E., Unsworth, M., and Marks, D.: The dynamics of rainfall interception by a seasonal temperate rainforest, Agr. Forest Meteorol., 124, 171–191, https://doi.org/10.1016/j.agrformet.2004.01.010, 2004.
Liu, Y. B. and De Smedt, F.: WetSpa Extension, A GIS-based Hydrologic Model for Flood Prediction and Watershed Management Documentation and User Manual, VUB, available at: https://www.vub.be/WetSpa/downloads/WetSpa_manual.pdf (last access: 19 September 2019), 2004.
Livesley, S. J., McPherson, G. M., and Calfapietra, C.: The urban forest and ecosystem services: impacts on urban water, heat, and pollution cycles at the tree, street, and city scale, J. Environ. Qual., 45, 119–124, https://doi.org/10.2134/jeq2015.11.0567, 2016.
Monteith, J. L.: Evaporation and Environment, Symp. Soc. Exp. Biol., 19, 205–223, 1965.
Moser, A., Rötzer, T., Pauleit, S., and Pretzsch, H.: Structure and ecosystem services of small-leaved lime (Tilia cordata Mill.) and black locust (Robinia pseudoacacia L.) in urban environments, Urban For. Urban Green., 14, 1110–1121, https://doi.org/10.1016/j.ufug.2015.10.005, 2015.
Muzylo, A., Llorens, P., Valente, F., Keizer, J. J., Domingo, F., and Gash, J. H. C.: A review of rainfall interception modelling, J. Hydrol., 370, 191–206, https://doi.org/10.1016/j.jhydrol.2009.02.058, 2009.
Paul, M. J. and Meyer, J. L.: Streams in the urban landscape, Annu. Rev. Ecol. Syst., 32, 333–365, https://doi.org/10.1146/annurev.ecolsys.32.081501.114040, 2001.
Pereira, F. L., Gash, J. H. C., David, J. S., David, T. S., Monteiro, P. R., and Valente, F.: Modelling interception loss from evergreen oak Mediterranean savannas: Application of a tree-based modelling approach, Agr. Forest Meteorol., 149, 680–688, https://doi.org/10.1016/j.agrformet.2008.10.014, 2009.
Pretzsch, H., Biber, P., Uhl, E., Dahlhausen, J., Schütze, G., Perkins, D., Rötzer, T., Caldentey, J., Koike, T., Van Con, T., Chavanne, A., du Toit, B., Foster, K., and Lefer, B.: Climate change accelerates growth of urban trees in metropolises worldwide, Sci. Rep., 7, 15403, https://doi.org/10.1038/s41598-017-14831-w, 2017.
Rutter, A. J., Kershaw, K. A., Robins, P. C., and Morton, A. J.: A predictive model of rainfall interception in forests, 1. Derivation of the model from observations in a plantation of Corsican pine, Agr. Meteorol., 9, 367–384, https://doi.org/10.1016/0002-1571(71)90034-3, 1971.
Salvadore, E.: Development of a flexible process-based spatially-distributed hydrological model for urban catchments, PhD thesis, Faculty of Engineering, Vrije Universiteit Brussel, Brussels, Belgium, 2015.
Shields, C. and Tague, C.: Ecohydrology in semiarid urban ecosystems: Modeling the relationship between connected impervious area and ecosystemproductivity, Water Resour. Res., 51, 302–319, https://doi.org/10.1002/2014WR016108, 2015.
Smets, V.: Rain events Norway maple and small leaved lime, Mendeley Data, V2, https://doi.org/10.17632/bj46kgstfx.2, 2019.
Smets, V., Akkermans, W., Verbeiren, B., Hermy, M., and Somers, B.: Ex-situ estimation of interception storage capacity of small urban plant species, J. Hydrol., 572, 869–883, https://doi.org/10.1016/j.jhydrol.2019.03.047, 2019.
Soares, A. L., Rego, F. C., Mcpherson, E. G., Simpson, J. R., Peper, P. J., and Xiao, Q.: Benefits and costs of street trees in Lisbon, Portugal, Urban For. Urban Green., 10, 69–78, https://doi.org/10.1016/j.ufug.2010.12.001, 2011.
Staelens, J., De Schrijver, A., Verheyen, K., and Verhoest, N. E. C.: Spatial variability and temporal stability of throughfall water under a dominant beech (Fagus sylvatica L.) tree in relationship to canopy cover, J. Hydrol., 330, 651–662, https://doi.org/10.1016/j.jhydrol.2006.04.032, 2006.
Staelens, J., De Schrijver, A., Verheyen, K., and Verhoest, N. C. E.: Rainfall partitioning into throughfall, stemflow, and interception within a single beech (Fagus sylvatica L.) canopy: influence of foliation, rain event characteristics, and meteorology, Hydrol. Process., 22, 33–45, 2008.
Szota, C., Coutts, A. M., Thom, J. K., Virahsawmy, H. K., Fletcher, T. D., and Livesley, S. J.: Street tree stormwater control measures can reduce runoff but may not benefit established trees, Landsc. Urban Plan., 182, 144–155, https://doi.org/10.1016/j.landurbplan.2018.10.021, 2019.
United Nations: World Urbanization Prospects: the 2014 Revision, Hightlights, Departement of Economic and Social Affairs, available at: https://www.un.org/development/desa/publications/2014-revision-world-urbanization-prospects.html (last access: 19 September 2019), 2014.
Valente, F., David, J. S., and Gash, J. H. C.: Modelling interception loss for two sparse eucalypt and pine forests in central Portugal using reformulated Rutter and Gash analytical models, J. Hydrol., 190, 141–162, https://doi.org/10.1016/S0022-1694(96)03066-1, 1997.
van Dijk, A. I. J. and Bruijnzeel, L.: Modelling rainfall interception by vegetation of variable density using an adapted analytical model. Part 1. Model description, J. Hydrol., 247, 230–238, https://doi.org/10.1016/S0022-1694(01)00392-4, 2001.
Vegas Galdos, F., Álvarez, C., García, A., and Revilla, J. A.: Estimated distributed rainfall interception using a simple conceptual model and Moderate Resolution Imaging Spectroradiometer (MODIS), J. Hydrol., 468–469, 213–228, https://doi.org/10.1016/j.jhydrol.2012.08.043, 2012.
Véliz-Chávez, C., Mastachi-Loza, C. A., González-Sosa, E., Becerril-Piña, R., and Ramos-Salinas, N. M.: Canopy storage implications on interception loss modeling, Am. J. Plant Sci., 5, 3032–3048, https://doi.org/10.4236/ajps.2014.520320, 2014.
Verbeeck, K., Van Rompuy, R., Hermy, M., and Van Orshoven, J.: Infiltrating into the paved garden – a functional evaluation of parcel imperviousness in terms of water retention efficiency, J. Environ. Plan. Manage., 57, 1552–1571, https://doi.org/10.1080/09640568.2013.819317, 2013.
Wang, J., Endreny, T. A., and Nowak, D. J.: Mechanistic Simulation of Tree Effects in an Urban Water Balance Model, J. Am. Water Resour. Assoc., 44, 75–85, https://doi.org/10.1111/j.1752-1688.2007.00139.x, 2008.
Wang, Z. M., Batelaan, O., and De Smedt, F.: A distributed model for water and energy transfer between soils, plants and atmosphere (WetSpa), Phys. Chem. Earth, 21, 189–193, https://doi.org/10.1016/S0079-1946(97)85583-8, 1996.
Wirion, C., Bauwens, W., and Verbeiren, B.: Location- and time-specific hydrological simulations with multi-resolution remote sensing data in urban areas, Remote Sens., 9, 645, https://doi.org/10.3390/rs9070645, 2017.
Wong, T. H. F., Allen, R., Brown, R. R., Deletić, A., Gangadharan, L., Gernjak, W., Jakob, C., Johnstone, P., Reeder, M., Tapper, N., Vietz, G., and Walsh, C. J.: blueprint2013 – Stormwater management in a water sensitive city, Melbourne, Australia, ISBN 978-1-921912-02-3, 2013.
Xiao, Q. and McPherson, E. G.: Rainfall interception by Santa Monica's municipal urban forest, Urban Ecosyst., 6, 291–302, https://doi.org/10.1023/B:UECO.0000004828.05143.67, 2002.
Xiao, Q. and McPherson, E. G.: Rainfall interception of three trees in Oakland, California, Urban Ecosyst., 14, 755–769, https://doi.org/10.1007/s11252-011-0192-5, 2011.
Xiao, Q. and McPherson, E. G.: Surface water storage capacity of twenty tree species in Davis, California, J. Environ. Qual., 45, 188–198, https://doi.org/10.2134/jeq2015.02.0092, 2016.
Xiao, Q., McPherson, E. G., Simpson, J. R., and Ustin, S. L.: Rainfall interception by Sacramento's urban forest, J. Arboric., 24, 235–243, 1998.
Xiao, Q., Mcpherson, E. G., Forest, U., Ustin, S. L., Grismer, M. E., and Abstract, A.: A new approach to modeling tree rainfall interception, J. Geophys. Res., 105, 29173–29188, https://doi.org/10.1029/2000JD900343, 2000a.
Xiao, Q., Mcpherson, E. G., Ustin, S. L., Grismer, M. E., and Simpson, J. R.: Winter rainfall interception by two mature open-grown trees in Davis, California, Hydrol. Process., 14, 763–784, https://doi.org/10.1002/(SICI)1099-1085(200003)14:4<763::AID-HYP971>3.0.CO;2-7, 2000b.
Yang, J., Chang, Y., and Yan, P.: Ranking the suitability of common urban tree species for controlling PM2.5 pollution, Atmos. Pollut. Res., 6, 267–277, https://doi.org/10.5094/APR.2015.031, 2015.
Zhang, R., Wang, G., Guo, S., Zamora, M. L., Ying, Q., Lin, Y., Wang, W., Hu, M., and Wang, Y.: Formation of Urban Fine Particulate Matter, Chem. Rev., 115, 3803–3855, https://doi.org/10.1021/acs.chemrev.5b00067, 2015.
Zipperer, W. C., Sisinni, S. M., Pouyat, R. V., and Foresman, T. W.: Urban tree cover: An ecological perspective, Urban Ecosyst., 1, 229–246, https://doi.org/10.1023/A:1018587830636, 1997.
- Abstract
- Introduction
- Materials and methods
- Results
- Discussion
- Conclusions
- Data availability
- Appendix A: Free throughfall coefficient estimation
- Appendix B: Time intensity and cumulative graphs of rain events exceeding the maximum storage capacity of the catchment container (>7.5 mm)
- Appendix C: Model equations
- Author contributions
- Competing interests
- Acknowledgements
- Financial support
- Review statement
- References