the Creative Commons Attribution 4.0 License.
the Creative Commons Attribution 4.0 License.
 | 18 Sep 2019
Using nowcasting technique and data assimilation in a meteorological model to improve very short range hydrological forecasts
Maria Laura Poletti
Francesco Silvestro
Silvio Davolio
Flavio Pignone
Nicola Rebora
Forecasting flash floods some hours in advance is still a challenge, especially in environments made up of many small catchments. Hydrometeorological forecasting systems generally allow for predicting the possibility of having very intense rainfall events on quite large areas with good performances, even with 12–24 h of anticipation. However, they are not able to predict the exact rainfall location if we consider portions of a territory of 10 to 1000 km2 as the order of magnitude. The scope of this work is to exploit both observations and modelling sources to improve the discharge prediction in small catchments with a lead time of 2–8 h.
The models used to achieve the goal are essentially (i) a probabilistic rainfall nowcasting model able to extrapolate the rainfall evolution from observations, (ii) a non-hydrostatic high-resolution numerical weather prediction (NWP) model and (iii) a distributed hydrological model able to provide a streamflow prediction in each pixel of the studied domain. These tools are used, together with radar observations, in a synergistic way, exploiting the information of each element in order to complement each other. For this purpose observations are used in a frequently updated data assimilation framework to drive the NWP system, whose output is in turn used to improve the information as input to the nowcasting technique in terms of a predicted rainfall volume trend; finally nowcasting and NWP outputs are blended, generating an ensemble of rainfall scenarios used to feed the hydrological model and produce a prediction in terms of streamflow.
The flood prediction system is applied to three major events that occurred in the Liguria region (Italy) first to produce a standard analysis on predefined basin control sections and then using a distributed approach that exploits the capabilities of the employed hydrological model. The results obtained for these three analysed events show that the use of the present approach is promising. Even if not in all the cases, the blending technique clearly enhances the prediction capacity of the hydrological nowcasting chain with respect to the use of input coming only from the nowcasting technique; moreover, a worsening of the performance is observed less, and it is nevertheless ascribable to the critical transition between the nowcasting and the NWP model rainfall field.
- Article
(7222 KB) - Full-text XML
- BibTeX
- EndNote


The Liguria region, located in north-western Italy, has been recurrently affected in the last century by severe rainfall events that produced flash floods and landslides (Acquaotta et al., 2018). This type of event causes severe damage to the coastal urbanized areas and sometimes also human casualties, not only in the Liguria region (Faccini et al., 2009, 2012; Silvestro et al., 2012, 2016; Davolio et al., 2015) but also in other areas of the Mediterranean (Drobinski, 2014; Delrieu et al., 2004; Ducrocq et al., 2008). All the aforementioned events were associated with well-organized, very intense and localized convective systems affecting the same area of a few square kilometres for several hours (Parodi et al., 2012; Rebora et al., 2013; Fiori et al., 2014; Buzzi et al., 2014). A forecast suitable for the small spatial and short temporal scales of these events is needed, but these scales are hardly predictable by meteorological models. Nowcasting models can predict the evolution of the rainfall pattern at a regional scale, starting from the last observed radar rainfall images (i.e. radar-based rainfall nowcasting) and merging different sources of information to provide a short-term forecast (usually a few hours).
Radar-based rainfall nowcasting can be achieved by extrapolating the future rainfall distribution from a sequence of radar images; it has been found that the radar-based rainfall nowcast has good skill for forecasting with a short lead time. The basic techniques to produce quantitative precipitation forecasts (QPFs) from radar echoes are based on cross-correlation or individual radar echo-tracking (Collier, 1981). Progress in the nowcasting procedure was the development of nowcasting methods operating in the Fourier domain (Seed, 2003; Xu and Chandrasekar, 2005) to take into account the fact that the predictability of rainfall depends on the spatial scale of the precipitation structures (Wilson et al., 1998; Germann and Zawadzki, 2002). Among the techniques that follow a probabilistic approach, Metta et al. (2009) developed a stochastic spectral-based nowcasting technique that predicts the future rainfall scenarios starting from the rainfall fields observed by radar and evolving them through Fourier decomposition. Also, Berenguer et al. (2011) presented a method based on the String of Beads model, while Foresti et al. (2016) analysed the performance of a nowcasting algorithm that accounts stochastically for the process of growth and decay of rainfall cells.
The main limit of such nowcasting procedures is that the accuracy of rainfall prediction is quite high for very short lead times (20–120 min), but, since it is based only on the extrapolation of the observed rainfall field, it rapidly decreases for longer ranges. As a consequence, the hydrological forecast is also useful from a hydrological nowcasting perspective for limited lead times (Silvestro et al., 2015a), with applications also to urban hydrology (Thorndahl et al., 2017). One of the reasons why the accuracy rapidly decreases with increasing lead times is that radar nowcasting techniques do not model (or models them stochastically) processes such as growth and decay of precipitation (Golding, 1998) that become important for longer lead times. So, for a very short range (0–3 h), radar nowcasting performs best, whereas for longer lead times, forecasts based on NWP are better (Kilambi and Zawadzki, 2005; Lin et al., 2005; Kober et al., 2012; Wang et al., 2015). On the other hand, NWP does not allow rainfall predictions with sufficient spatial and time detail (Davolio et al., 2015; Silvestro et al., 2016).
Therefore, after the very first hours (usually 0–3 h) of radar-based nowcasting, NWP forecasts can be merged to generate a seamless 0–6 h prediction with higher skill. This procedure requires an accurate QPF in the very short term from the meteorological model, at a high resolution of a few kilometres, since the tolerance for timing or location errors is very limited, especially in case of severe storms (Sun et al., 2014). In fact, a correct forecast allows a smooth transition from radar extrapolation to model prediction. To meet the nowcasting requirements, NWP models have to be run at convection-permitting resolution (1-4 km; Kain et al., 2006; Weisman et al., 2008), starting from a better initial condition that also reduces the spin-up period. Therefore, several methodologies for rapid data assimilation have been developed in order to be suitable for nowcasting application. rapid update cycle procedures have been widely used in an operational framework (Wilson and Roberts, 2006; Benjamin et al., 2004) to provide a “warm start” and, hence, reduce the model spin-up. Also, radar reflectivity has been employed to improve the initial condition, e.g. exploiting the information on latent heating through the application of the nudging technique (Sokol and Zacharov, 2012; Dow and Macpherson, 2013; Bick et al., 2016; Davolio et al., 2017a), eventually reducing the intensity or position error in rainfall prediction. Also other studies attempted to improve the hydrological forecast by improving the rainfall prediction using both observations and models. Rossa et al. (2010) assimilated radar data in an NWP system; Davolio et al. (2017a) assimilated the rainfall field derived from both radar and gauge observations (Sinclair and Pegram, 2005) in a convection-permitting NWP model and used the rainfall prediction in a probabilistic hydrometeorological forecasting chain. Liechti et al. (2013) and Liechti and Zappa (2019) explored the impact on hydrological prediction of different techniques of the rainfall forecast based on both NWP and radar data (Panziera et al., 2011). Kyznarova et al. (2012, 2013) tried to use the Integrated Nowcasting through Comprehensive Analysis (INCA) system (Haiden et al., 2011) precipitation products as input to a hydrological model, evaluating the benefit with respect to extrapolation techniques.
Within this framework, the present study attempts to use, in an integrated way, a nowcasting model (PhaSt), a high-resolution NWP model (MOLOCH) and rainfall observations. Rainfall estimates derived from both radar and rain gauges (Sinclair and Pegram, 2005) are used for frequent (60 min) data assimilation by the NWP model in order to better reproduce observations in terms of the spatial and time location, on the one hand, and to improve QPF (Davolio et al., 2017a), on the other hand. A probabilistic nowcasting model is adapted in order to use the QPF provided by NWP models. A blending technique based on previous studies (Kilambi and Zawadzki, 2005; Kober et al., 2012; Bowler et al., 2006) is finally applied to smoothly mix nowcasting rainfall scenarios and the NWP QPF. The use of forecast rainfall fields in nowcasting can effectively extend the lead time by several hours, making it suitable for issuing flood and flash flood warnings. The possibility to predict, with more accuracy, the rainfall fields as input to the hydrological model can improve significantly the accuracy of the hydrological forecast applied with short lead times (Berenguer et al., 2005; Silvestro and Rebora, 2012). The last module of the present nowcasting chain is represented by the distributed hydrological model Continuum (Silvestro et al., 2013; Silvestro et al., 2015b; Cenci et al., 2016), which is used to transform QPF in streamflow predictions in a frequently updated flood forecasting system (20 min). Using the forecast rainfall as described above as input, it provides a probabilistic output, with many predicted discharge scenarios, which useful in real-time management operations in an emergency.
Although the elements of the chain are not innovative by themselves, some new elements are introduced within this study. First, the blending is performed not only by combining the rainfall fields forecasted by the nowcasting and the NWP model in its spatial distribution, as in more standard approaches (Kilambi and Zawadzki, 2005), but also by modifying the nowcasting rainfall fields along the forecast window according to the information related to the time variation in rainfall volume derived from the NWP model, and this could be considered to be a matter of fact, a sort of blending of the rainfall volume. Second, the NWP model forecast is frequently “updated” with observations through a data assimilation technique before its information content is used to trigger the nowcasting model. Finally, verification is done in a hydrological perspective following both a point approach and a distributed approach in order to enhance the sample of data. The system is applied to three major flood events that occurred in the Liguria region in autumn 2014; results are presented, comparing streamflow forecasts obtained using rainfall predictions from different configurations of the system in order to evaluate the benefit of using some modules rather than others.
The paper is organized as follows: in Sect. 2 the area of study and the data used are introduced. In Sect. 3 the models, the methods and the type of analysis performed are explained. The results of the work are presented in Sect. 4, while the conclusions are drawn and final considerations are made in Sect. 5.
The area of study is the Liguria region, which is located in north-western Italy (Fig. 1a) and is mainly mountainous; it faces the Ligurian Sea, and most of its urban areas were developed along the coast. The presence of a large number of catchments, characterized by a small drainage area (often less than 100 km2) and short response time (a few hours at most), with outlet to the Ligurian Sea, represents a critical factor that increases the risk of floods. Therefore, it is clear that high-resolution precipitation and hydrological measurements are crucial in urban areas like Genoa and that new approaches to modelling urban catchment properties and hydrological and hydraulic response are needed.
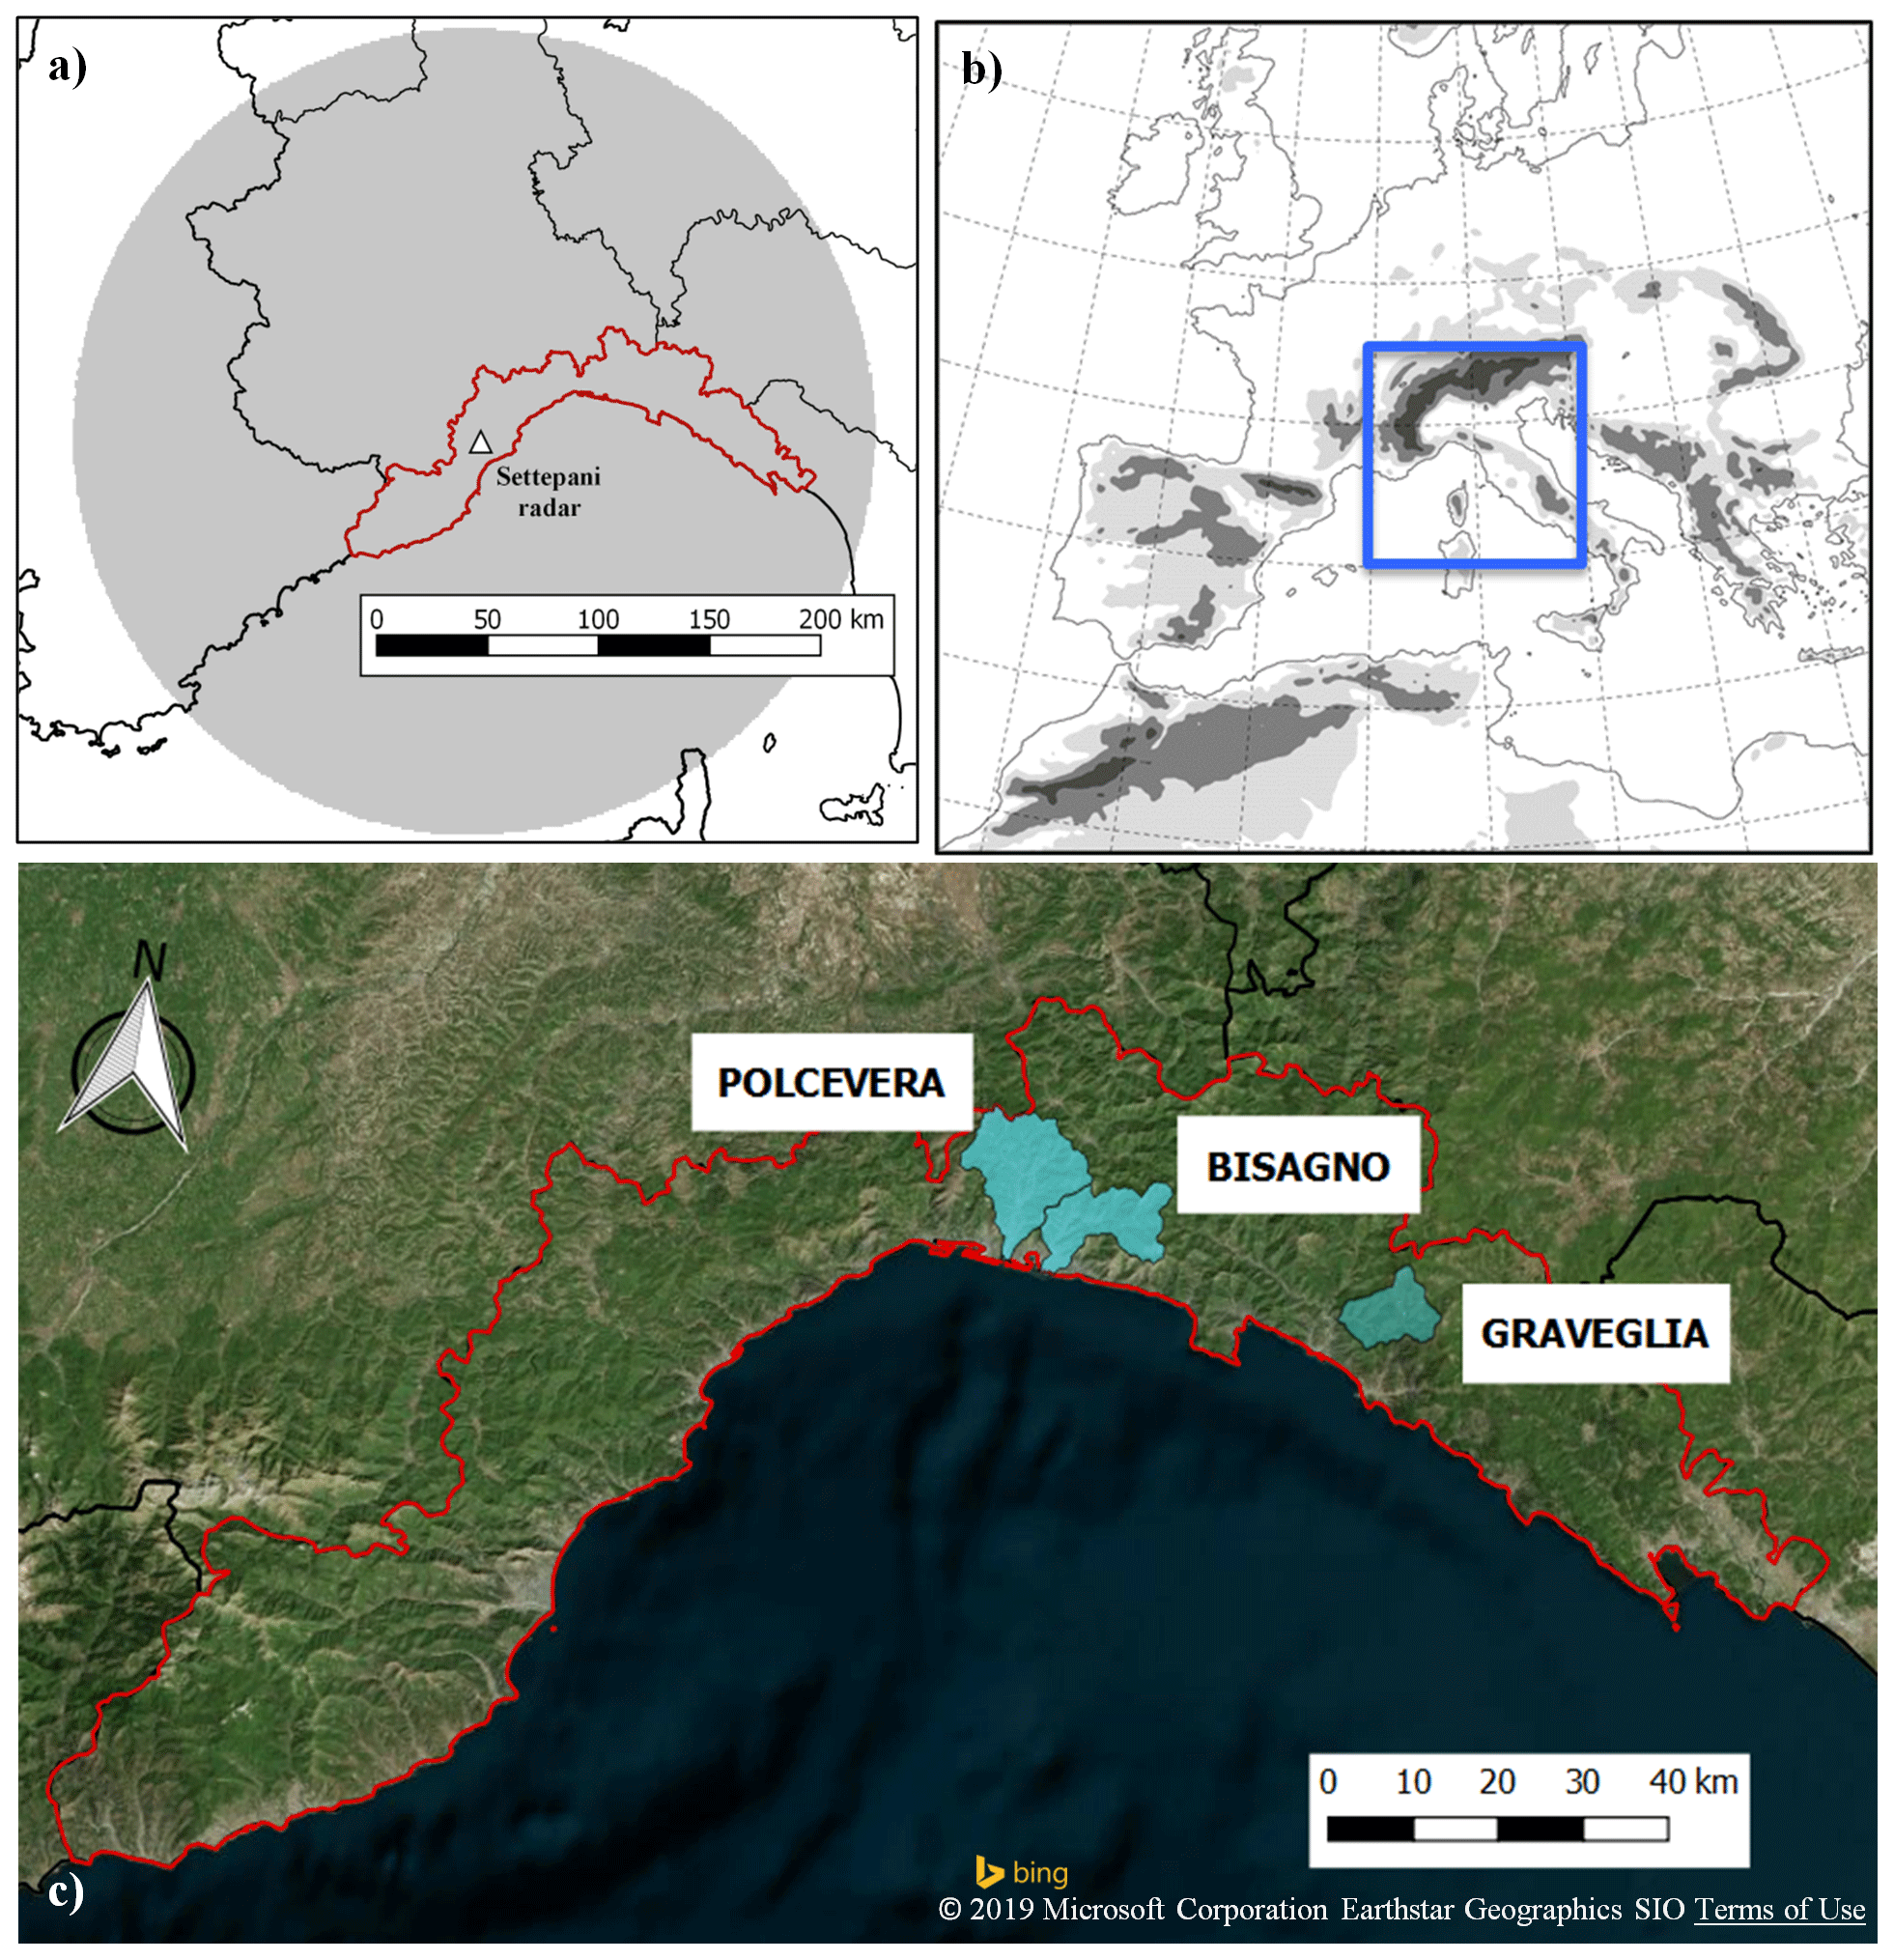
Figure 1Area of interest. (a) Location of the radar in the Liguria region and its covered area. (b) BOLAM and MOLOCH (blue shapes) integration domains. (c) The Liguria region and the drained area of the analysed basins for the three events: Polcevera and Bisagno, flowing inside the urban area of Genoa, and Graveglia, one of the main tributaries of Entella basin, the biggest basin of the Liguria region.
The main input for the hydrological forecasting chain is the observed rainfall. This observed rainfall field comes from the Doppler polarimetric C-band radar, located on Mount Settepani (Fig. 1a) at an altitude of 1386 m, that works operationally with a 10 min scansion time and 1 km×1 km spatial resolution. The rainfall field is estimated through the algorithm described in Silvestro et al. (2009), currently used by the Meteorological Weather Service in the Italian regions of Piedmont and Liguria and by the Italian Civil Protection Department. The observed rainfall field is also the input for the nowcasting model, and it is used in the assimilation scheme, as described in the following section.
The analysis has been performed according to a distributed approach all over the Liguria region domain, considering all the points with a drainage area larger than 15 km2. In addition, some control sections have been used for a detailed analysis. The relevant sections analysed belong to three basins (highlighted in Fig. 1c) mainly affected by the analysed events of 2014: in particular, results for 9 October, at the Bisagno creek (drained area 97 km2), which flooded the municipality of Genoa during that event; for 11 November, at Graveglia (42 km2), a tributary of Entella; and for 15 November, at Polcevera (140 km2), are shown.
3.1 The meteorological model and the assimilation scheme
The NWP model used in this work is MOLOCH (details in Malguzzi et al., 2006; Buzzi et al., 2014; Davolio et al., 2017b), which integrates the non-hydrostatic, fully compressible equations for the atmosphere on a latitude–longitude rotated Arakawa C grid, with a resolution of 0.02∘, equivalent to about 2.2 km, and on 60 vertical levels (hybrid terrain-following coordinates). The integration domain (Fig. 1b) covers northern and central Italy, and initial and boundary conditions are provided at a 1 h interval by the BOLAM model forecasts, as in the current operational practice at CNR ISAC. BOLAM is a limited-area hydrostatic model (Buzzi et al., 2004) based on primitive equations, with a convective parameterization derived from Kain (2004). Initial and boundary conditions for BOLAM (domain shown in Fig. 1b) are defined with ECMWF (European Centre for Medium-Range Weather Forecasts) analyses. MOLOCH is nested in a 3 h forecast of BOLAM to avoid direct downscaling from the global analysis to the high-resolution grid and runs for 21 h. BOLAM and MOLOCH differ mainly in the dynamical core, including the fact that MOLOCH resolves explicitly deep convection, while the following parameterization schemes are common in the two models: atmospheric radiation, the atmospheric boundary layer and surface layer, soil processes, and, to a large extent, microphysical processes.
The assimilation method, whose implementation in MOLOCH is shown in Fig. 2, is based on nudging. During the assimilation window, model-specific humidity profiles at each grid point are progressively modified depending on the comparison between observed and forecasted rainfall. To attain this aim, hourly precipitation estimates provided by the Settepani radar are used as observations. The assimilation scheme is explained in detail in Davolio et al. (2017a). The set-up conceived for the present application takes into account the time requirements for an operational implementation. Considering the timing for global data availability and radar estimates of delivery and processing, the first assimilation windows covers the first 6 h of the forecast. At the end of this period, the model state is stored and a free forecast is run to cover the following hours. In this way, once a new hourly rainfall observation is available, an additional 1 h assimilation is performed, restarting the model from the stored condition. This procedure can proceed for several hours, at least until the following global analysis is available, and allows for updating and improving forecasts, as a consequence of a longer assimilation period. In the present application, an appropriate time window for frequent assimilation was chosen for each event in order to minimize the amount of computational resources.

Figure 2MOLOCH forecasts and data assimilation implementation. The first assimilation (MOLOCH CNTR; on the top) is performed during the first 6 h of forecast, while after that a 1 h assimilation is conducted, restarting the model from the stored conditions of the previous run (dots).
3.2 The nowcasting technique
The nowcasting technique used in this paper is a radar-based probabilistic technique, PhaSt (Metta et al., 2009). PhaSt is a “phase stochastic” spectral-based nowcasting procedure that, starting from two following rainfall fields observed by radar, realizes a nonlinear–empirical transformation and stochastically evolves the fields within the spectral space. The use of the spectral space allows for preserving the spatial correlation within the rainfall fields. The evolution of Fourier phases through the stochastic process generates many realizations to be used as members of an ensemble of precipitation nowcasts. All the ensemble members are characterized by the same amplitude distribution and very similar power spectra. However, the phase evolution (i.e. the positioning of rainfall structures) evolves differently in the altered realizations, providing an estimate of the probability of occurrence of precipitation at a given point in space and a given instant in time. The main equations of the algorithm are reported below (Eq. 1):
where ks is the spectral phase, dependent on the wave numbers kx and ky. Through this relation, it is possible to give more weight to the smaller scales and less weight to the larger ones; T is the decorrelation time after which the rainfall field is assumed to stop, σ2 is the variance in the process, and dW is a random increment drawn from a normal distribution with a zero mean and second-order moment (W is a Wiener process).
To allow for the presence of time correlations in the angular frequencies, a Langevin-type model is used: the temporal evolution of the Fourier phase ϕ (kx, ky) at a given wave number (kx, ky) is written in terms of a linear Ornstein–Uhlenbeck stochastic process for the angular frequency. The Ornstein–Uhlenbeck process generates angular frequencies that have a Gaussian distribution with a zero mean and variance σ2 and an exponentially decaying temporal autocorrelation. The representation of the noise of the forecast rainfall field is disentangled into two components, one related to a noise constant in time and the other to a noise changing in time and space in order to have different forecast rainfall fields, but is coherent with the initial observed rainfall.
3.3 Modification of nowcasting technique with NWP information
To improve the nowcasting algorithm, its original formulation (Metta et al., 2009) is modified in a constraint regarding the spectral amplitude of the rainfall field. This spectral amplitude was previously kept constant along the forecast horizon, which means fixing, in the real space, the total volume of the forecast rainfall fields equal to that of the last observed radar image. This hypothesis of constant volume is relaxed. Therefore, the volume is modified according to the information provided by the NWP model corrected through the data assimilation technique. The volume trend is calculated for the hours of the forecast, using the information about the total volume of precipitation on the radar domain (Fig. 3), according to the following formula (Eq. 2):
where x and y are the coordinates in the radar rainfall field, en identifies the ensemble member (20 members in this application), and T is the lead time of the forecast (from 10 min to 6 h).
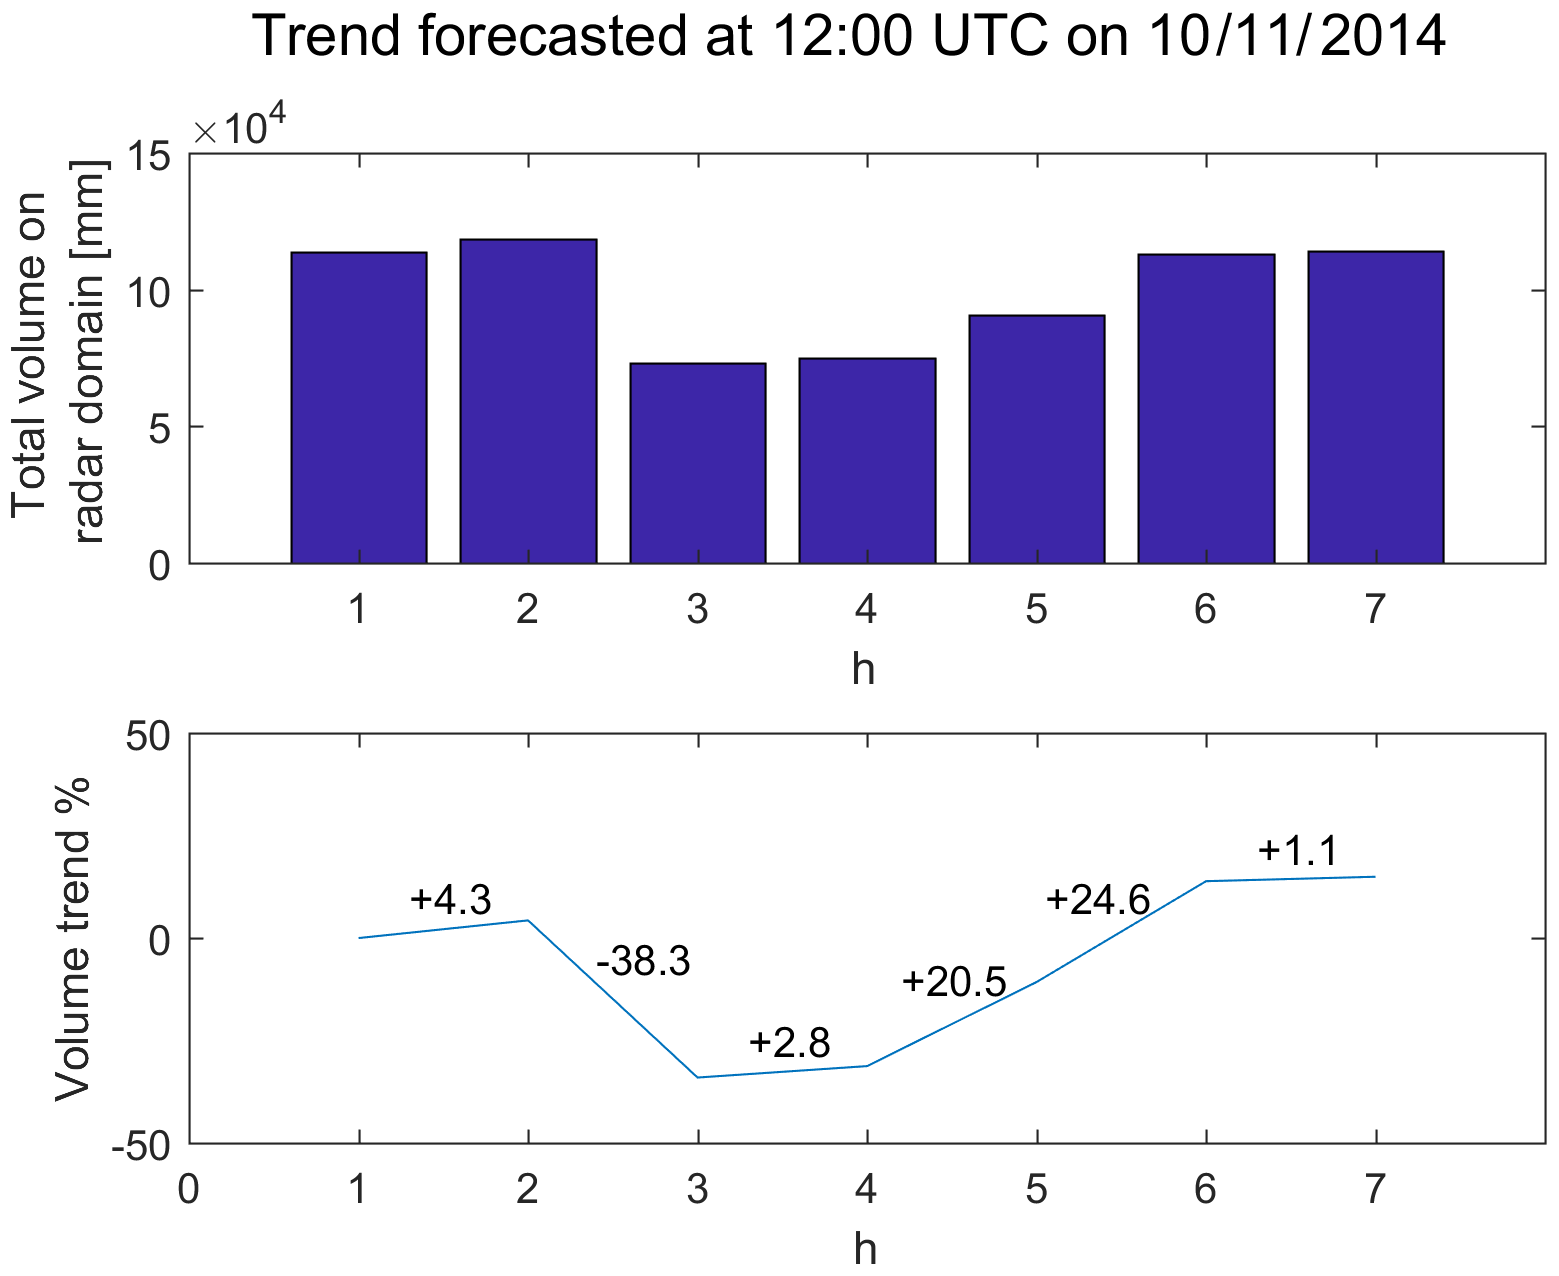
Figure 3Volume trend for rainfall field modification (example for 10 November 2014 at 12:00 UTC). The total volume on the domain considered is summed for each time step of MOLOCH forecast with data assimilation (DA). The trend volume is applied to the first rainfall forecast by the nowcasting technique.
In this way, the information about the potential growth and decay of the rainfall structures is provided as additional information to the nowcasting rainfall field. The idea is to make the forecast able to include, in a simple way, the tendency of decreasing or increasing precipitation volume, leaving the task of describing the spatial and temporal distribution of the rainfall field to the original scheme.
3.4 Blending method
The nowcasting models have shown a predictability limit after several hours of forecasting. This limit is also valid for the nowcasting model PhaSt according to previous studies (Metta et al., 2009). This behaviour is mainly due to the fact that in the nowcasting model the evolution of the precipitation systems is not included: the physics that represents growth and decay of the precipitation systems becomes progressively more important with an increasing lead time (Germann et al., 2006). These physical processes are represented in the NWP model so that it is worth connecting the nowcasting and the meteorological model in a resulting rainfall forecast that is possibly more accurate. The blending technique tries to overcome this limit, connecting these two components. Blending has been previously analysed in some studies with the purpose of improving the rainfall forecast (Golding, 1998; Kober et al.,2012; Atencia et al., 2010; Kilambi and Zawadzky, 2005; Nerini et al., 2018). In this application, a blending function is written in order to balance the forecast reliability of the two models.
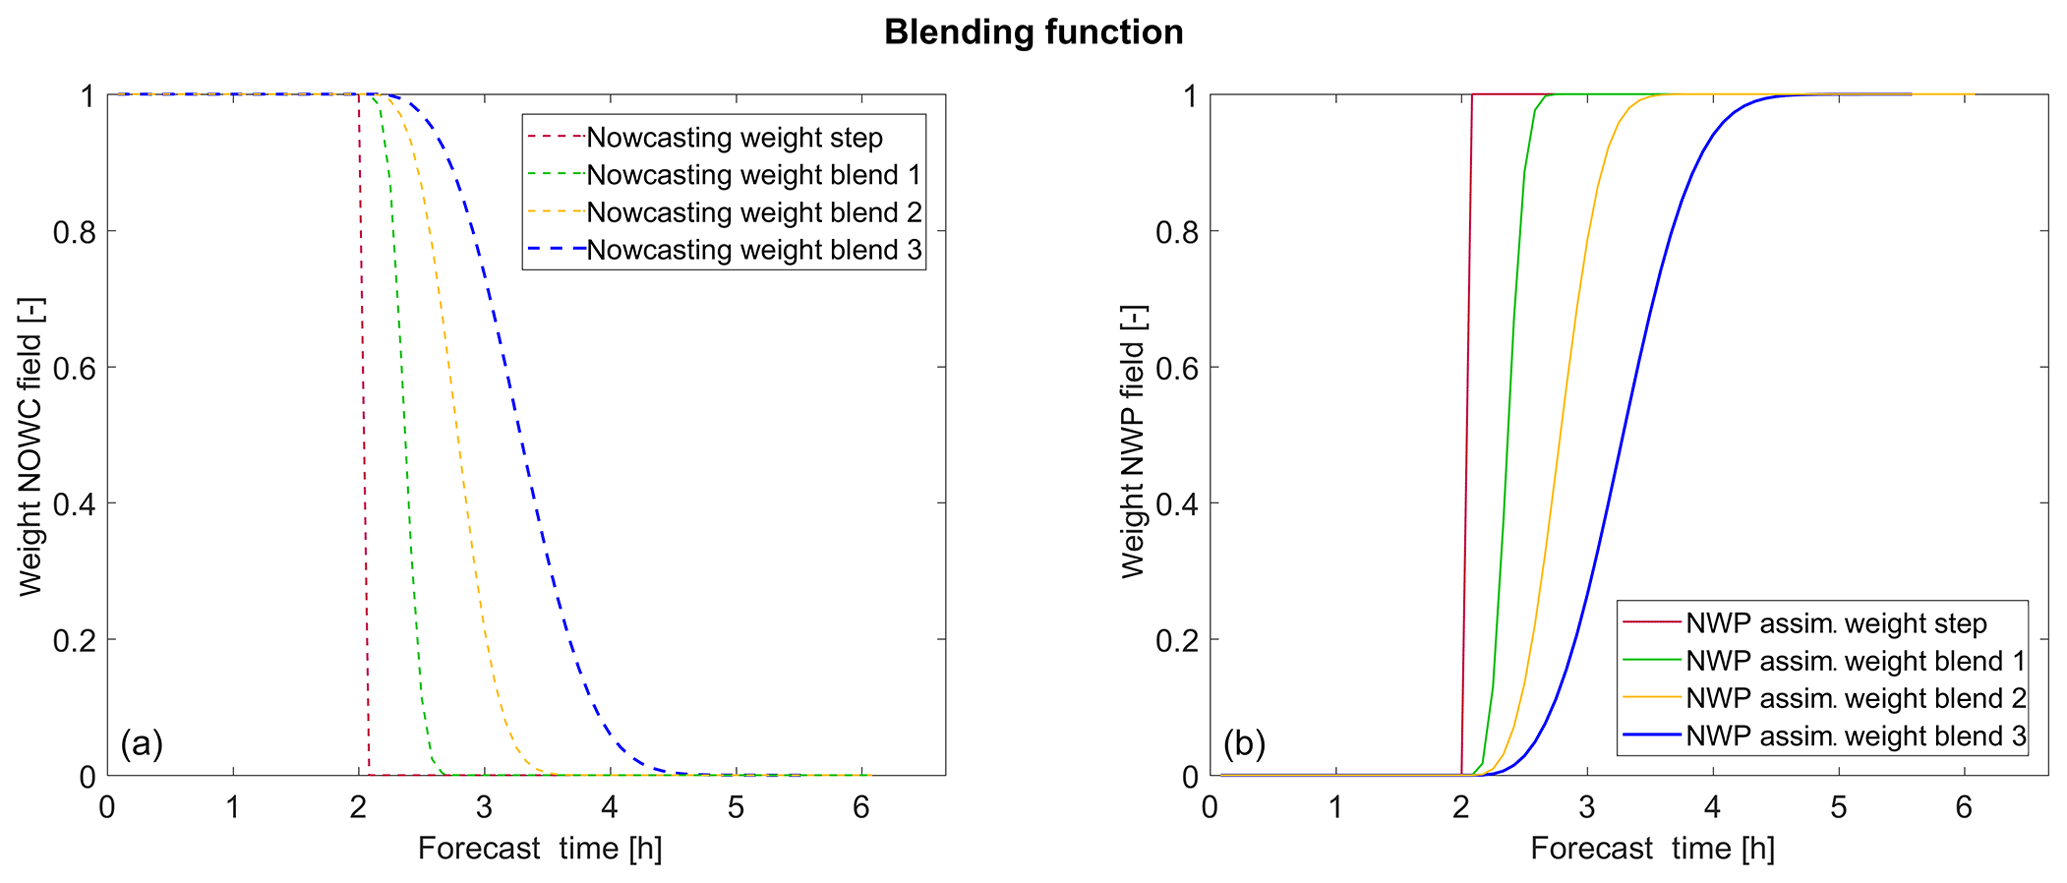
Figure 4Different blending functions analysed: in panel (a) is the weighting function applied to the nowcasting rainfall field, and in panel (b) is the complementary function, used to weight the NWP model forecast. The first weighting function (red line) is a step function, while the other functions are increasingly smoother.
Many of the previous methodologies to estimate the blending function started from the statistical indices computed on the forecast rainfall field for the two models. These indices allow the calculation of the weight for the two different forecast rainfall fields. This strategy cannot be applied in this case due to the scarcity of the rainfall events considered: having only three case studies, it is not possible to have representative scores for the two methodologies. In this work, while being aware of the blending functions already presented in the literature and according to the arguments presented before concerning the capacity of the model to represent the physical processes after the first hours of forecasting, a first guess of the blending functions is selected, as shown in Fig. 4.
It is worth noting that the weight of the NWP model forecast rainfall is calculated as the complementary function (Eq. 3)
The first function, which will be hereinafter referred to as the “step function”, gives all the weight to the nowcasting rainfall field for the first 2 h and then, up to the end of the forecast, gives it to the NWP model as an on–off switch between the two models. The other three functions are a progressive smoothing of this step function, trying to produce an intermediate forecast rainfall field between the nowcasting and the NWP through a linear combination of them.
At first glance it could seem that all blending functions give too much weight in the first time steps to the nowcasting model. However, it must be kept in mind that the nowcasting rainfall field is obtained by exploiting the information from the NWP model corrected with data assimilation to modify the radar rainfall volume (as described in Sect. 3.3). Moreover we expect that forecasts derived by extrapolation from observation can capture the spatio-temporal pattern better than NWP during the first 2 h of the forecast (Metta et al., 2009; Collier, 1981; Seed, 2003; Xu and Chandrasekar, 2005; Berenguer et al., 2011). In this way more weight is given to the information of the nowcasting model regarding the positioning of the rainfall structures, and a first correction of the forecast is done through the modification of the volume. Then, for longer forecast times, less weight is given to the nowcasting rainfall field in favour of the NWP model forecast. The latter gains progressively more importance up to almost 5 h ahead of the event. After this, the rainfall field is entirely provided by the meteorological model. Hence, the blended rainfall field at a certain forecast time T results from the linear combination as follows (Eq. 4):
and it is used as input for the hydrological model for 6 h of the forecast.
Since the forecast of the NWP model is deterministic (rainNWP), the rainfall field that is combined with the 20 members generated with PhaSt (rainNOWC) is always the same. As a consequence, for a short forecast time (values of weightnowc close to 1), PhaSt leads to different rainfall scenarios, while, as long as the forecast time increases (values of weightnowc close to 0), each rainfall scenario will tend to be equal to the only one NWP QPF.
3.5 The hydrological model
Continuum is a continuously distributed hydrological model that relies on a morphological approach that identifies the drainage network components from a digital elevation model (DEM; Giannoni et al., 2000, 2005). The DEM resolution generally coincides with the model spatial resolution. Flow in the soil is divided into a sub-surface flow component that is based on a Horton schematization (Gabellani et al., 2008) and that follows the drainage network directions and a deep flow component that moves based on the hydraulic head obtained by the water-table modelling. The energy balance is solved explicitly at the cell scale by using the force–restore equation. A complete description of the model is reported in Silvestro et al. (2013).
The hydrological model is implemented at a spatial resolution of 0.005∘ (about 480 m) and with a time resolution of 10 min. The implementation and calibration of the model in the testing area is described in detail in Davolio et al. (2017a) and Silvestro et al. (2018); the latter work evidenced good values of the employed statistics during the calibration and validation process.
It is worth noting for the scope of the present study that the model is distributed so that the streamflow is available in each point of the modelled drainage network; this characteristic is exploited for the verification (presented in the Sect. 4). Due to the limited horizontal resolution of the model in this application, the grid points, and, as a consequence, the basins with drainage area lower than 15 km2, are not considered (Silvestro et al., 2018).
3.6 The hydrological nowcasting chain
Within the hydrological nowcasting chain, all the elements presented in the previous sections are connected together. The main input is the observed radar rainfall, which is used up to the “now” as is; then it is used to evolve the last radar image within the nowcasting phase, and it is used in the data assimilation process of the NWP model. Then, for the rainfall forecasting time window, three configurations are considered and compared. These configurations differ for the 6 h forecast rainfall field that is provided as input to the same hydrological model (Fig. 5), which is computed as follows:
-
Nowcasting is done with PhaSt without volume variation (as described in Sect. 3.2) and no blending with the NWP model (Fig. 5a). This is hereinafter referred to as NOWC.
-
Nowcasting is done with PhaSt with volume variation according to the NWP model with data assimilation (as described in Sect. 3.3); there is no blending with the NWP model (Fig. 5b). This is hereinafter referred to as NOWC VOL.
-
Blending occurs between rainfall fields from nowcasting with volume variation (as in step 2) and from the NWP model (deterministic forecast), using a blending function varying in time, as presented in Sect. 3.4 (Fig. 5c). This is hereinafter referred to as NOWC BLEND; specifically, it uses the observed rainfall fields to build the rainfall scenarios in the recent past and the nowcasting model with volume correction for the first 2 h of forecast. Then, from the second to the sixth hour, the rainfall field is a linear combination between nowcasting and NWP model outputs according to the blending function.
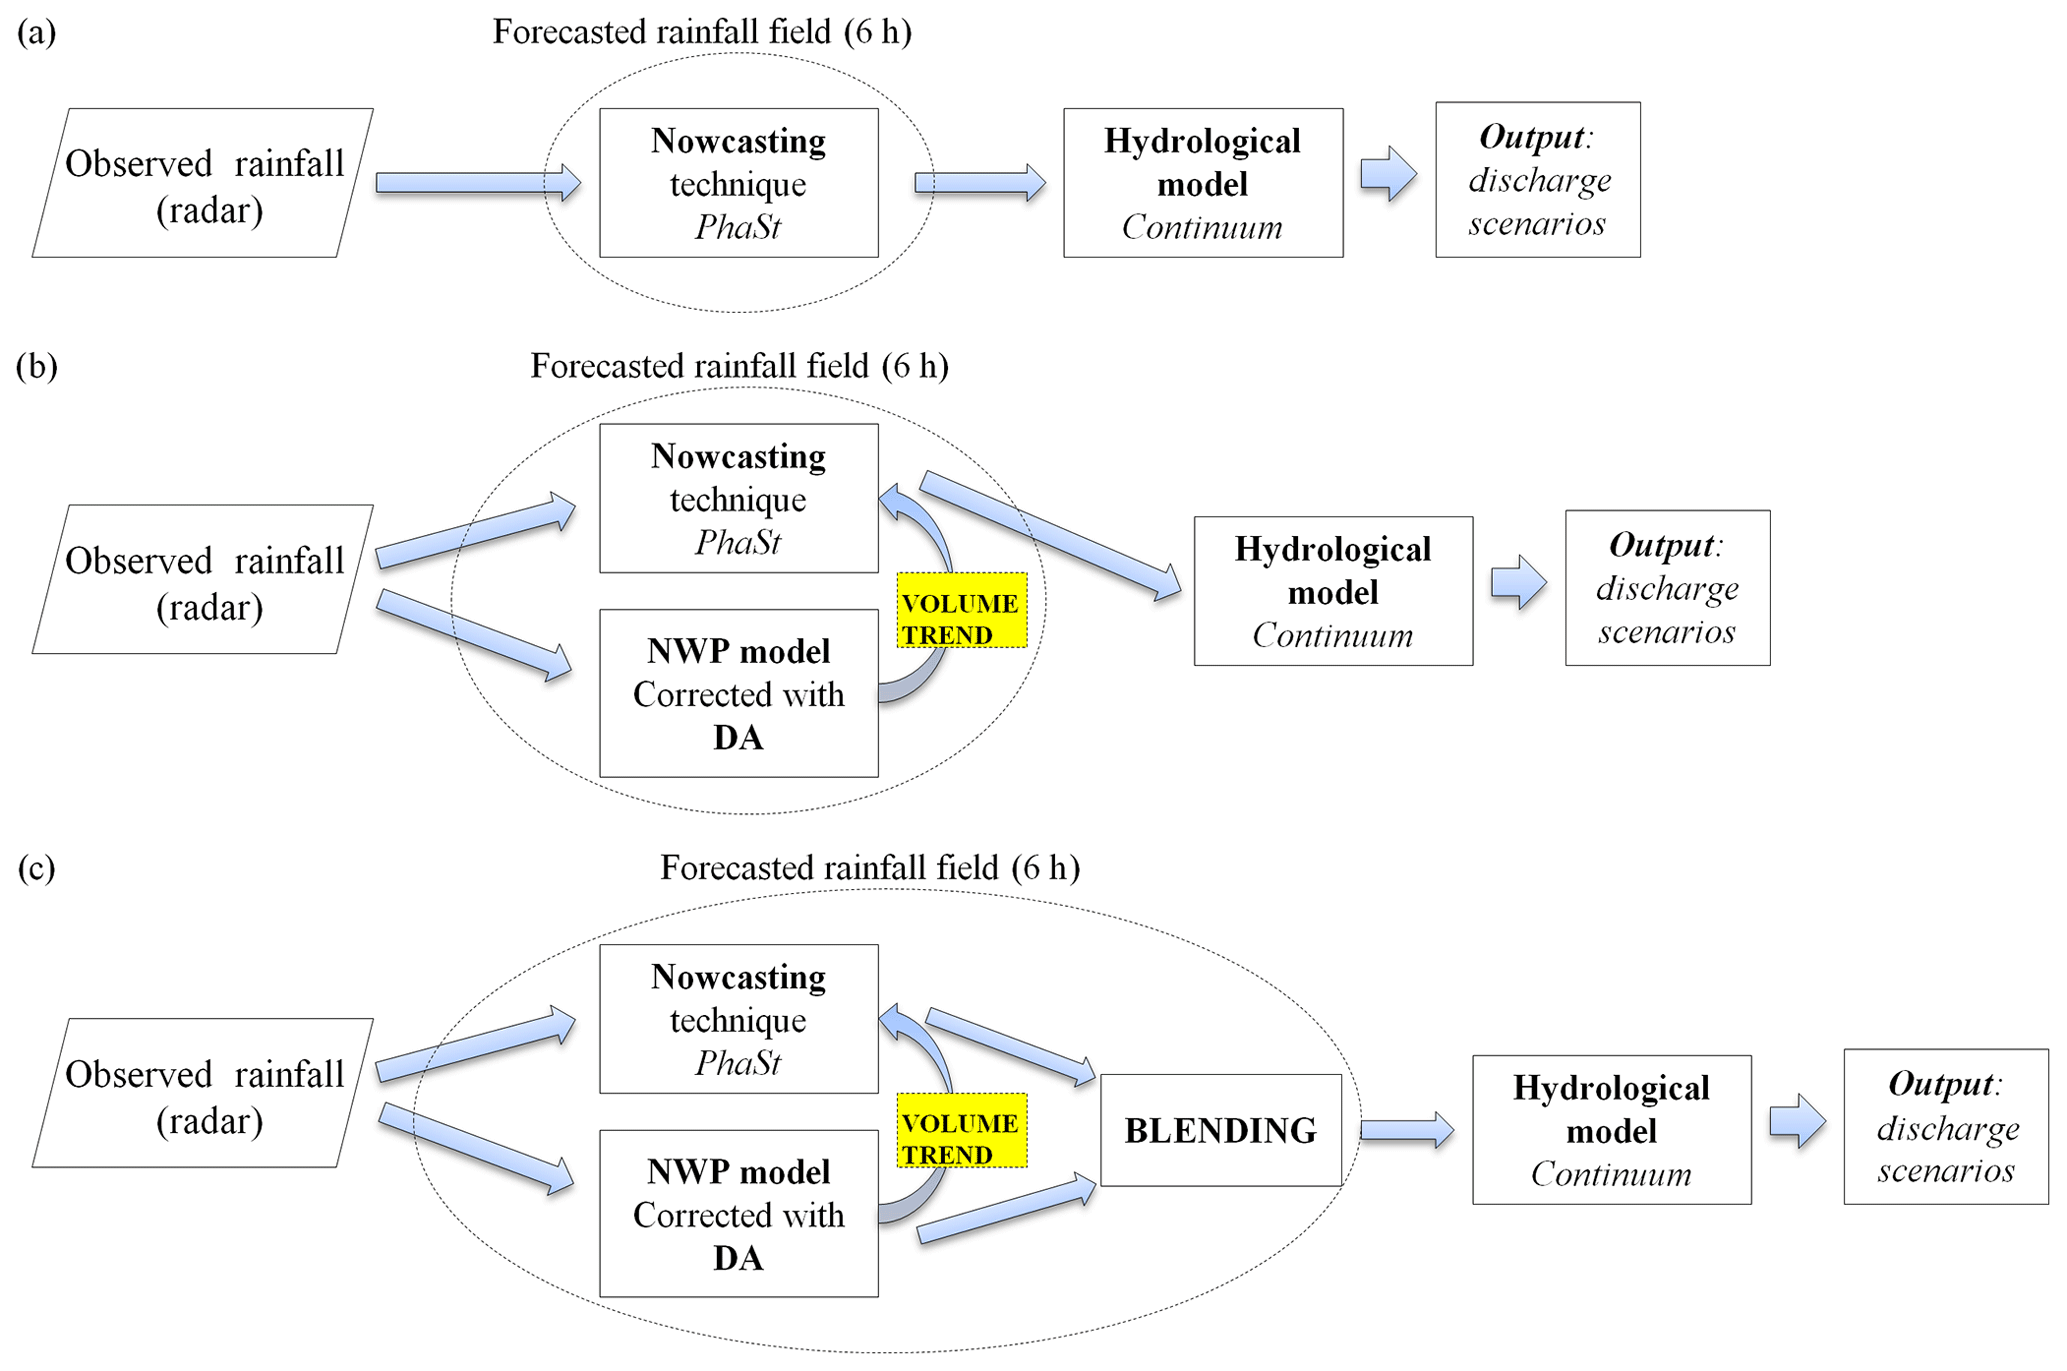
Figure 5The hydrological nowcasting chain in its three configurations: the first one, which is used only the nowcasted rainfall field without volume modification (a), the second one with the nowcasted rainfall field modified with the trend retrieved by the NWP model (b), and the last one in which the nowcasted rainfall fields with volume modification are combined through blending with the fields forecasted by NWP model corrected with DA (c).
For all the configurations, the hydrological model takes, as input, the rainfall scenarios and produces the forecast in terms of streamflow. The output of the chain is an ensemble of possible discharge scenarios (20 ensembles) for the following 12 h.
3.7 Methodology of analysis
The comparison against observations is done in terms of the final output of the chain, namely the discharge forecast. This comparison is performed, taking, as a reference, the discharge forecast obtained using the radar rainfall estimates as input to the distributed hydrological model (hereinafter referred to as the “reference hydrograph”). This approach does not consider errors in the hydrological model, since it is aimed at evaluating possible improvements in the rainfall forecast (Borga, 2002; Vieux and Bedient, 2004; Berenguer et al., 2005).
Before comparing the three configurations described in Sect. 3.6, a preliminary analysis is performed to evaluate different blending functions (as described in Sect. 3.4). This allows us to identify the best function for every event and an overall (on average) best function. Then the comparison is made between the three configurations in order to investigate the importance of each element used to build the rainfall scenarios in the streamflow prediction.
A first analysis evaluates the performances of the hydrological forecast in three control sections, with one for each considered event. In this analysis, three scores are used: the Nash–Sutcliffe (NS) coefficient (Nash and Sutcliffe, 1970), the variance of the discharge (Var) and the continuous rank probability score (CRPS).
The Nash–Sutcliffe (see Eq. 5) coefficient is chosen, since it is one of the widely used measures to evaluate model performance, especially for streamflow reproduction:
where Qm(t) and Qobs(t) are the modelled and reference streamflow at time t. In order to compare the discharge forecast at different lead times, we used the approach presented in Berenguer et al. (2005). Using a probabilistic forecast, the index is calculated for each of the 20 realizations, and then a mean value is considered.
To relate this index to the spread of the ensemble of the discharge forecast, the variance is calculated for the analysis on the punctual section (Eq. 6):
where X is the forecasted discharge and μ is the mean of the forecast.
The reduced continuous rank probability score (RCRPS; Eq. 7; Trinh et al., 2013) is computed as the CRPS (Brown, 1974; Matheson and Winkler, 1976; Unger, 1985; Stanki et al., 1989; Hersbach, 2000), reduced with the standard deviation of the observed discharge over the analysed time period (hereafter σ2):
where F(y) is the probability cumulative distribution function (CDF) for the forecast and 𝟙 is the step function of the observed value. A value of RCRPS that equals zero means a perfect forecast: observations and the forecast coincide. Increasing values correspond to a bigger distance between observations and the forecast.
The NS coefficient and Var(X) are applied to the mean of the streamflow ensemble following a deterministic approach in the comparison, while the RCRPS is used to evaluate results in a probabilistic perspective (Trinh et al., 2013; Davolio et al., 2017a). The values of all the scores are expressed as function of lead time; to cope with the large number of values of the RCRPS, its visualization was done using a box plot, as shown in Sect. 4.
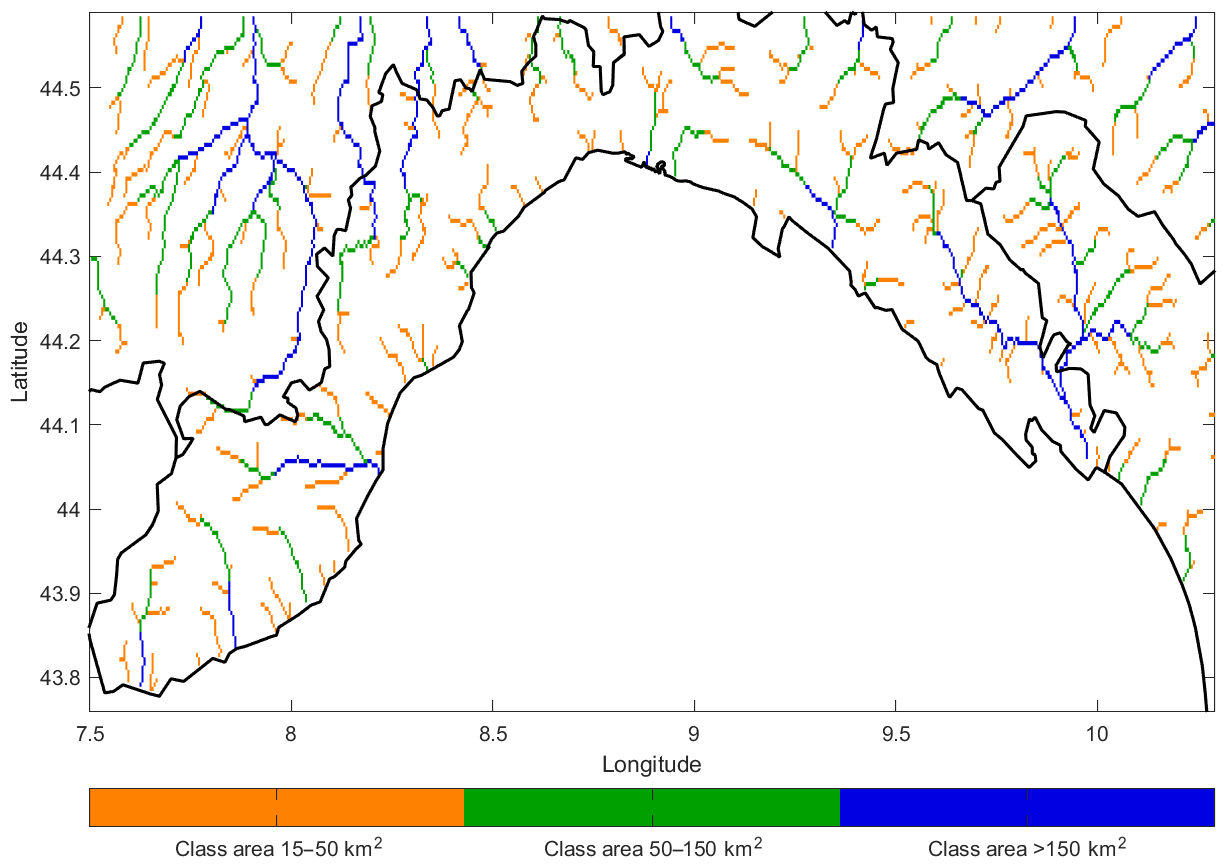
Figure 6River network grid points divided in three classes of drained area for the Continuum computational domain: small catchments of 15–50 km2, medium size catchments of 50–150 km2 and big catchments >150 km2.
The distributed analysis is carried out by exploiting the distributed maps of discharge produced by Continuum. This allows us to use several sampling points for the comparison even if only three events are analysed. In this case distinction is done by grouping all the relevant points according to their upstream drained area into three classes (see Fig. 6):
-
points with an upstream drainage area in the range of 15 to 50 km2 (small catchments),
-
points with an upstream drainage area in the range of 50 to 150 km2 (medium-sized catchments),
-
points with an upstream drainage area in the range of 150 to 500 km2 (big catchments).
This distinction is made by the concentration time related to the different size of catchments: a longer-lasting influence of the forecast rain can be found for the basins with a greater drained area and a bigger concentration time. Hence, when analysing the performance indices and relating them to the lead time, a longer lead time will be considered in calculating the indices for the bigger catchments. In particular, beyond the 6 h of lead time corresponding to the rainfall forecast, a further window of forecast discharge is considered: 1 additional hour for the first class of catchments, 2 additional hours for the second class and 3 additional hours for the third class.
The distributed analysis, executed on the entire domain on which the hydrological model is run, provides more general information about the performance of the hydrological nowcasting chain. The score used for the distributed analysis is the RCRPS, calculated for each point of the domain interested by the event (a filter on the pixel in which the forecast discharge does not exceed a threshold is performed). Also the RCRPS is expressed as a function of lead time and for the three classes of drained areas.
4.1 Impact of the blending function on hydrological forecasts
A first analysis is performed to evaluate the performance of the complete chain implemented using four different blending functions to linearly combine nowcasting and NWP rainfall fields. This analysis is done by evaluating the discharge forecast using the RCRPS score; the distributed approach is applied, and hence the predictions in all the points of the domain are considered. The results are then analysed for the three classes of drainage area presented in Sect. 3.7.
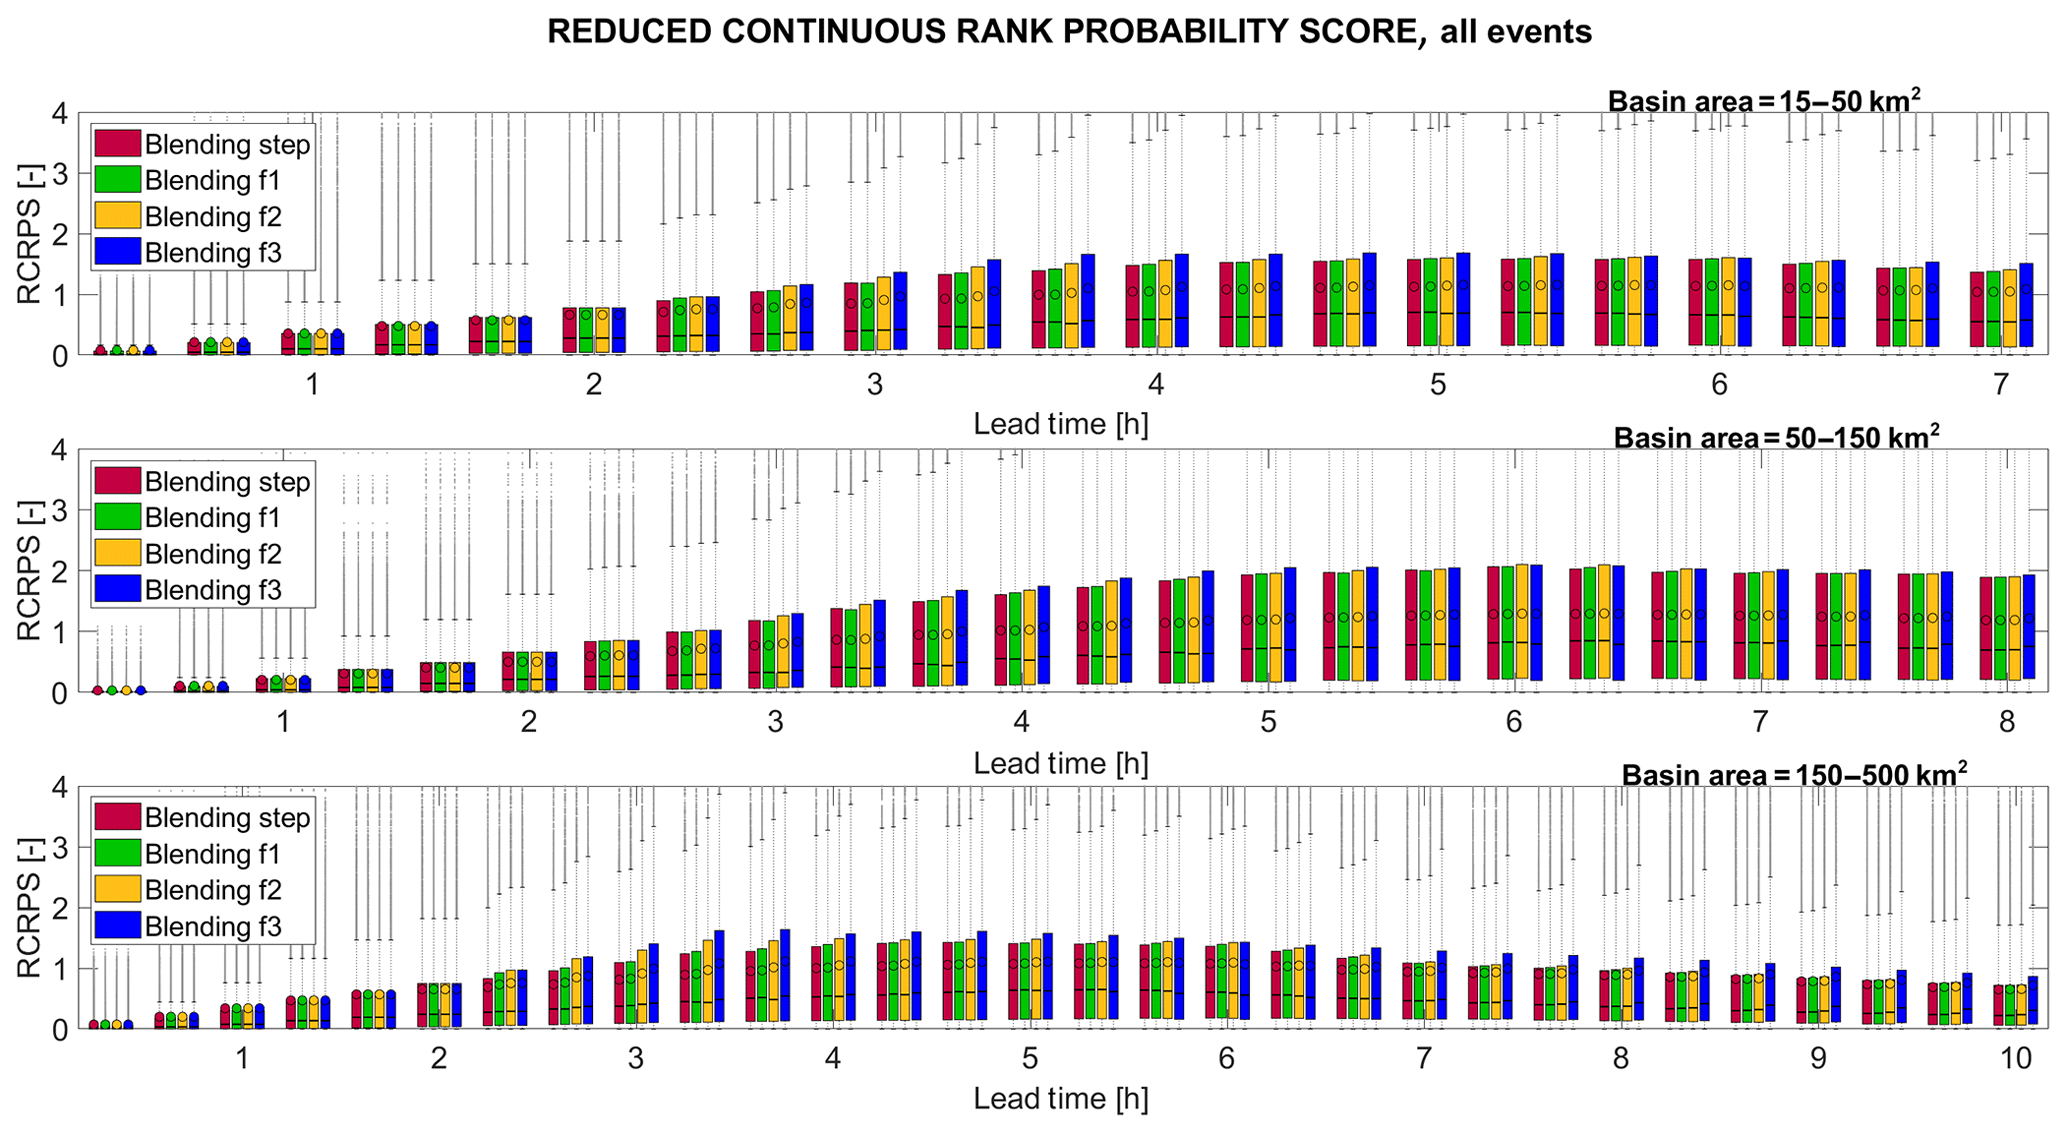
Figure 7RCRPS for all the events: analysis of the discharge output with the four different blending functions. The red column represents the results obtained by applying the step function, and the other three columns refer to the other three smoothed blending functions (see Sect. 3.4). Inside each box, the circle indicates the mean value, while the line indicates the median. The results are presented in the form of a box plot for the three classes of drainage area (15–20 km2, 50–150 km2 and 150–500 km2).
Figure 7 presents a summary of the results concerning the entire sample of data for the three events; in fact, for each grid point, for each time of the forecast and for each lead time, it is possible to estimate a value of the RCRPS. The box plot represents the RCRPS's variability (y axis) as a function of the lead time (x axis). Each box indicates the values of the 25 % and 75 % quantiles, and the horizontal line inside the box represents the median value, while the circle indicates the mean. The whiskers extend to the most extreme values of RCRPSs that are not considered outliers, and the outliers are plotted individually with points. The four columns represent the results related to the use of the different blending functions: the first column (dark red) is related to the step blending function, the second (green; hereafter defined as f1) and the third (yellow; f2) refer to the use of intermediate functions, and the last column (blue; f3) is related to the smoothest blending functions, as presented in Sect. 3.4. Results show clearly that there are no large differences among the four configurations of the blending functions, but in general it seems ideal to rapidly move from nowcasting to the NWP model forecast, avoiding long smoothing periods. In fact the scores for all the classes of the drainage area indicate a worse performance (large values of RCRPS) around 4–5 h of lead time. This result is probably due to the fact that, even if data assimilation in the NWP model is performed with hourly updating, often PhaSt rainfall scenarios and NWP rainfall fields are not seamless (Fig. 8). These discontinuities can affect the blending process, generating a final rainfall scenario which may result in rather different results from both PhaSt and NWP rainfall fields.
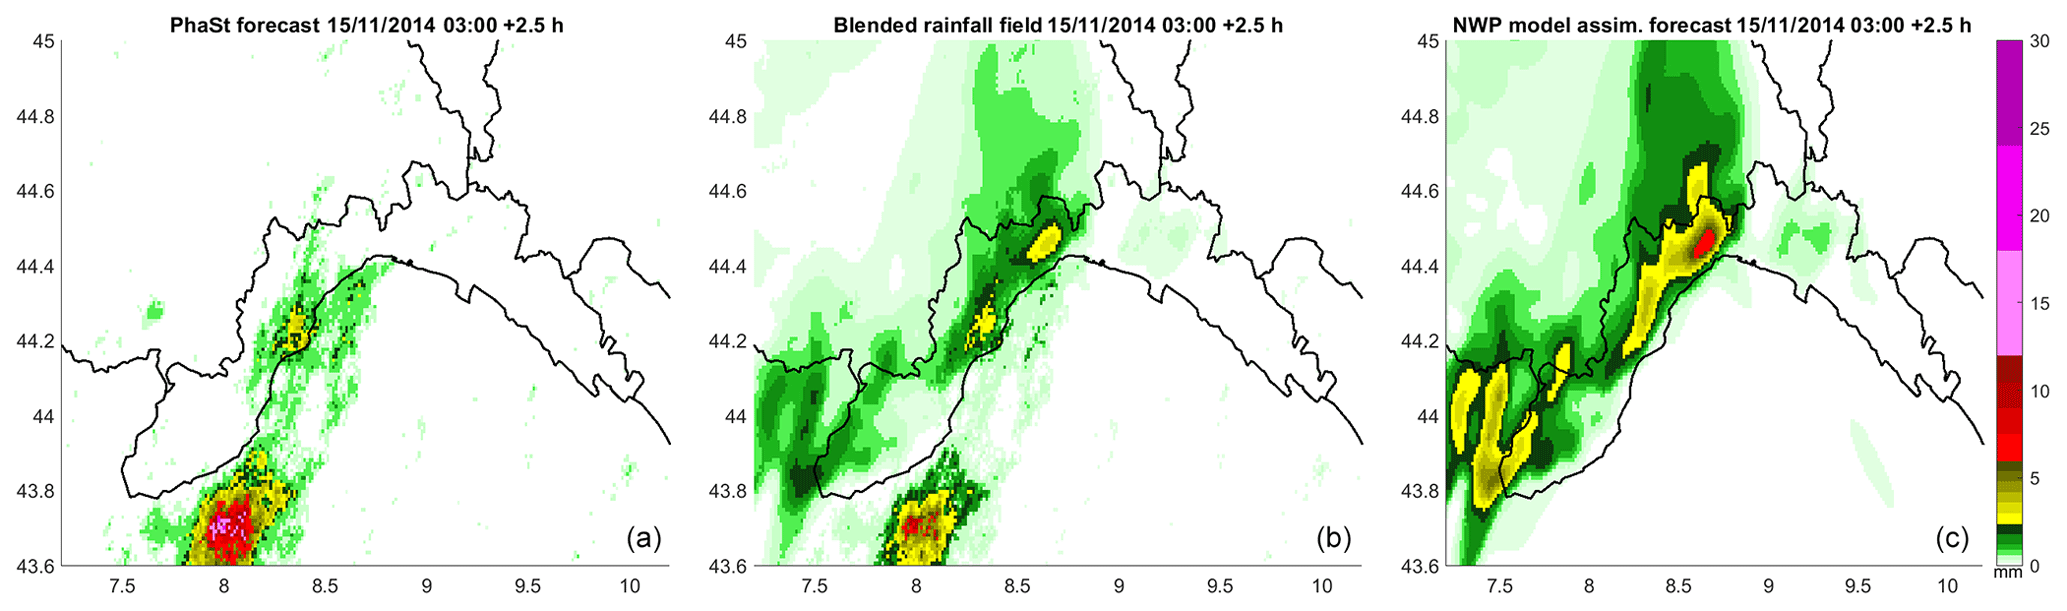
Figure 8Example of transition from a rainfall field forecast through nowcasting (a) and another forecast by the NWP model corrected with DA (c) through the linear combination of the field obtained by applying a blending function. Since the two forecast rainfall fields show relevant differences between each other, the rainfall field resulting from blending (b) is rather different with respect to the other two fields.
In general, the best score is obtained with the step function. However, this is an average behaviour for the three events; each event has its own best blending function, as shown in Sect. 4.2 and 4.3.
4.2 Basin-scale analysis at river sections
The results regarding the discharge forecasts for the main basins struck by the analysed events are examined starting from a first qualitative visualization of the comparison between the hydrographs for each configuration at every time step (every 20 min). Two examples are shown in Fig. 9. The first one is the forecast at 20:10 UTC on 9 October 2014 at the Bisagno creek, which was mainly responsible for the flood of the municipality of Genoa during this event. The second one is the forecast at 19:40 UTC on 11 November 2014 for the Entella basin, mainly interesting during this event for its tributaries Graveglia and Lavagna. The figures show the envelopes of the discharge forecasts for one time step during the considered time window of the event. The black thick line is the reference hydrograph, the black stars are the observed discharge, and the dashed lines represent the mean of the discharge ensemble forecast for each lead time. The first hydrograph envelope (light blue) refers to the configuration NOWC obtained with 6 h of nowcasting without volume modification. For the second hydrograph (orange), 6 h of rainfall is predicted by the configuration NOWC VOL. For the last hydrograph (red) the input rainfall field results from the blending (configuration NOWC BLEND), using the mean best function for the three events identified in Sect. 4.1, which is the blending step function.
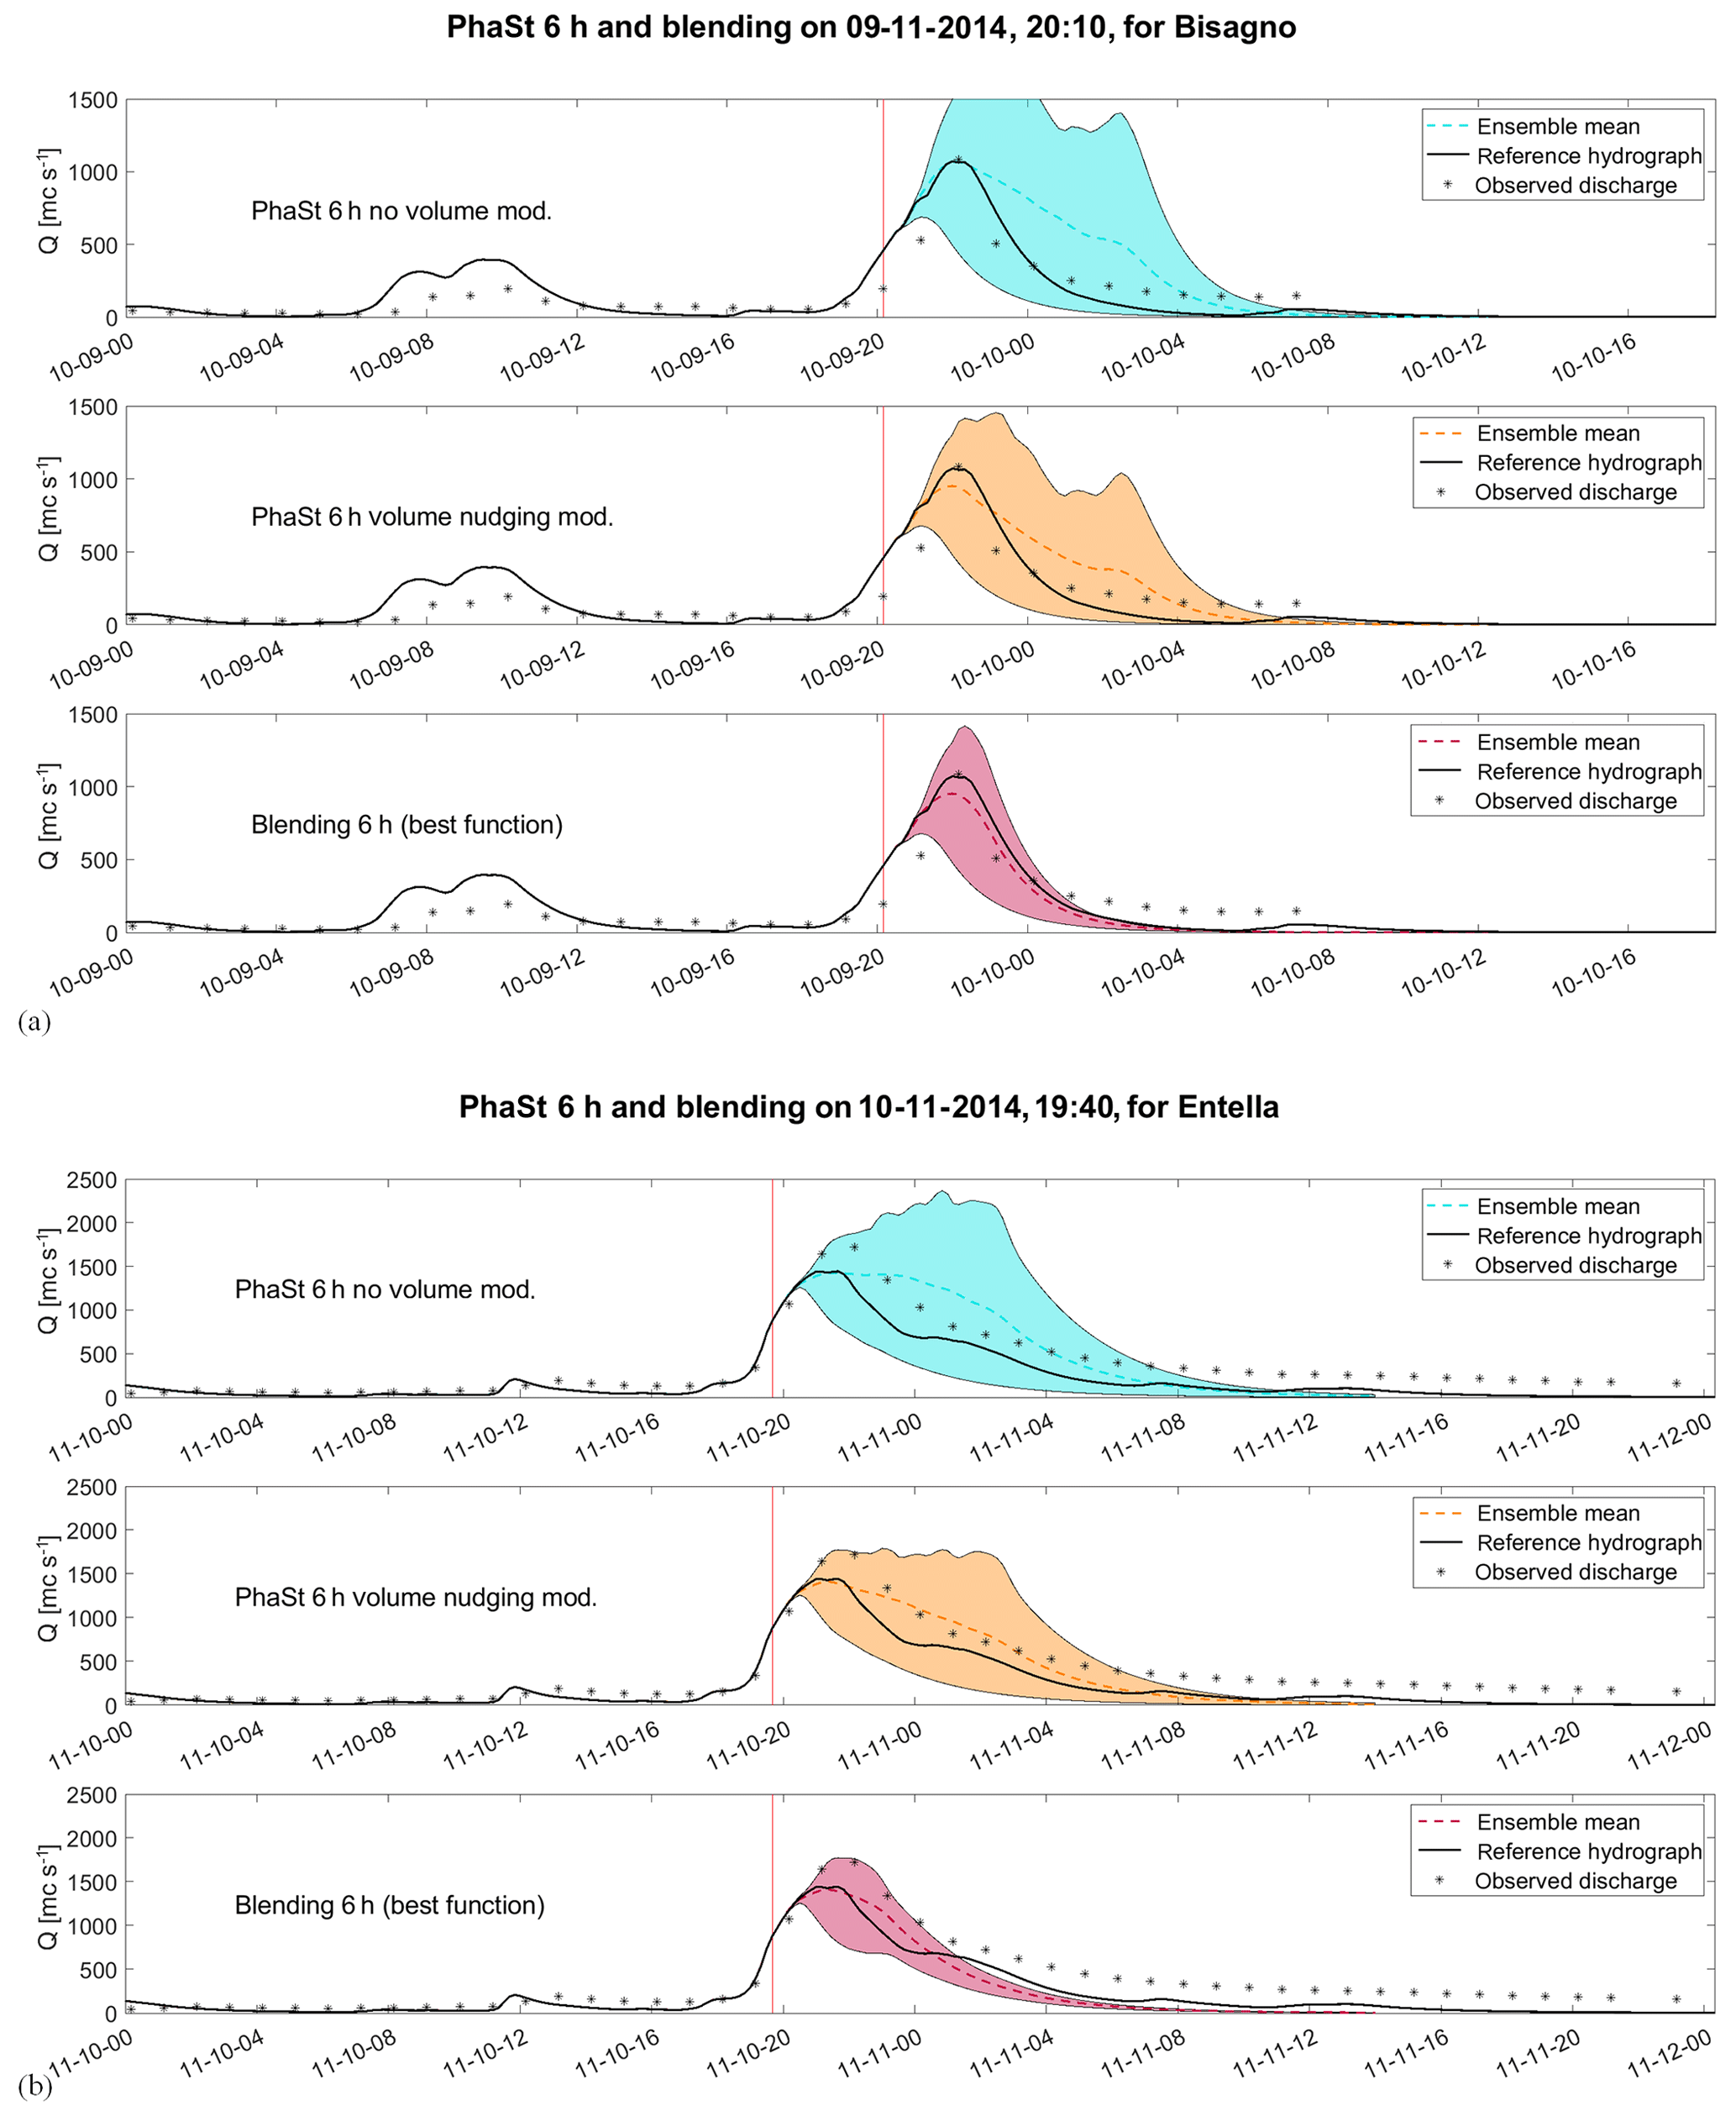
Figure 9Example of hydrographs for 9 October and 11 November events, for Bisagno and Entella outlet sections, respectively. In both figures, discharges are obtained using, as input, the 6 h rainfall field from NOWC (light blue), NOWC VOL (orange) and NOWC BLEND (pink).
Results clearly indicate that the spread of the discharge forecast ensemble is markedly smaller when input rainfall is provided by blending, instead of nowcasting alone (with or without volume trend modification). This is possibly ascribable to the fact that, while nowcasting provides a probabilistic forecast (20 ensembles) of different rainfall scenarios, blending connects a deterministic forecast from the NWP model with the nowcasting ensemble. Since each member of this ensemble is blended with the same NWP model forecast, the spread of the final ensemble is smaller.
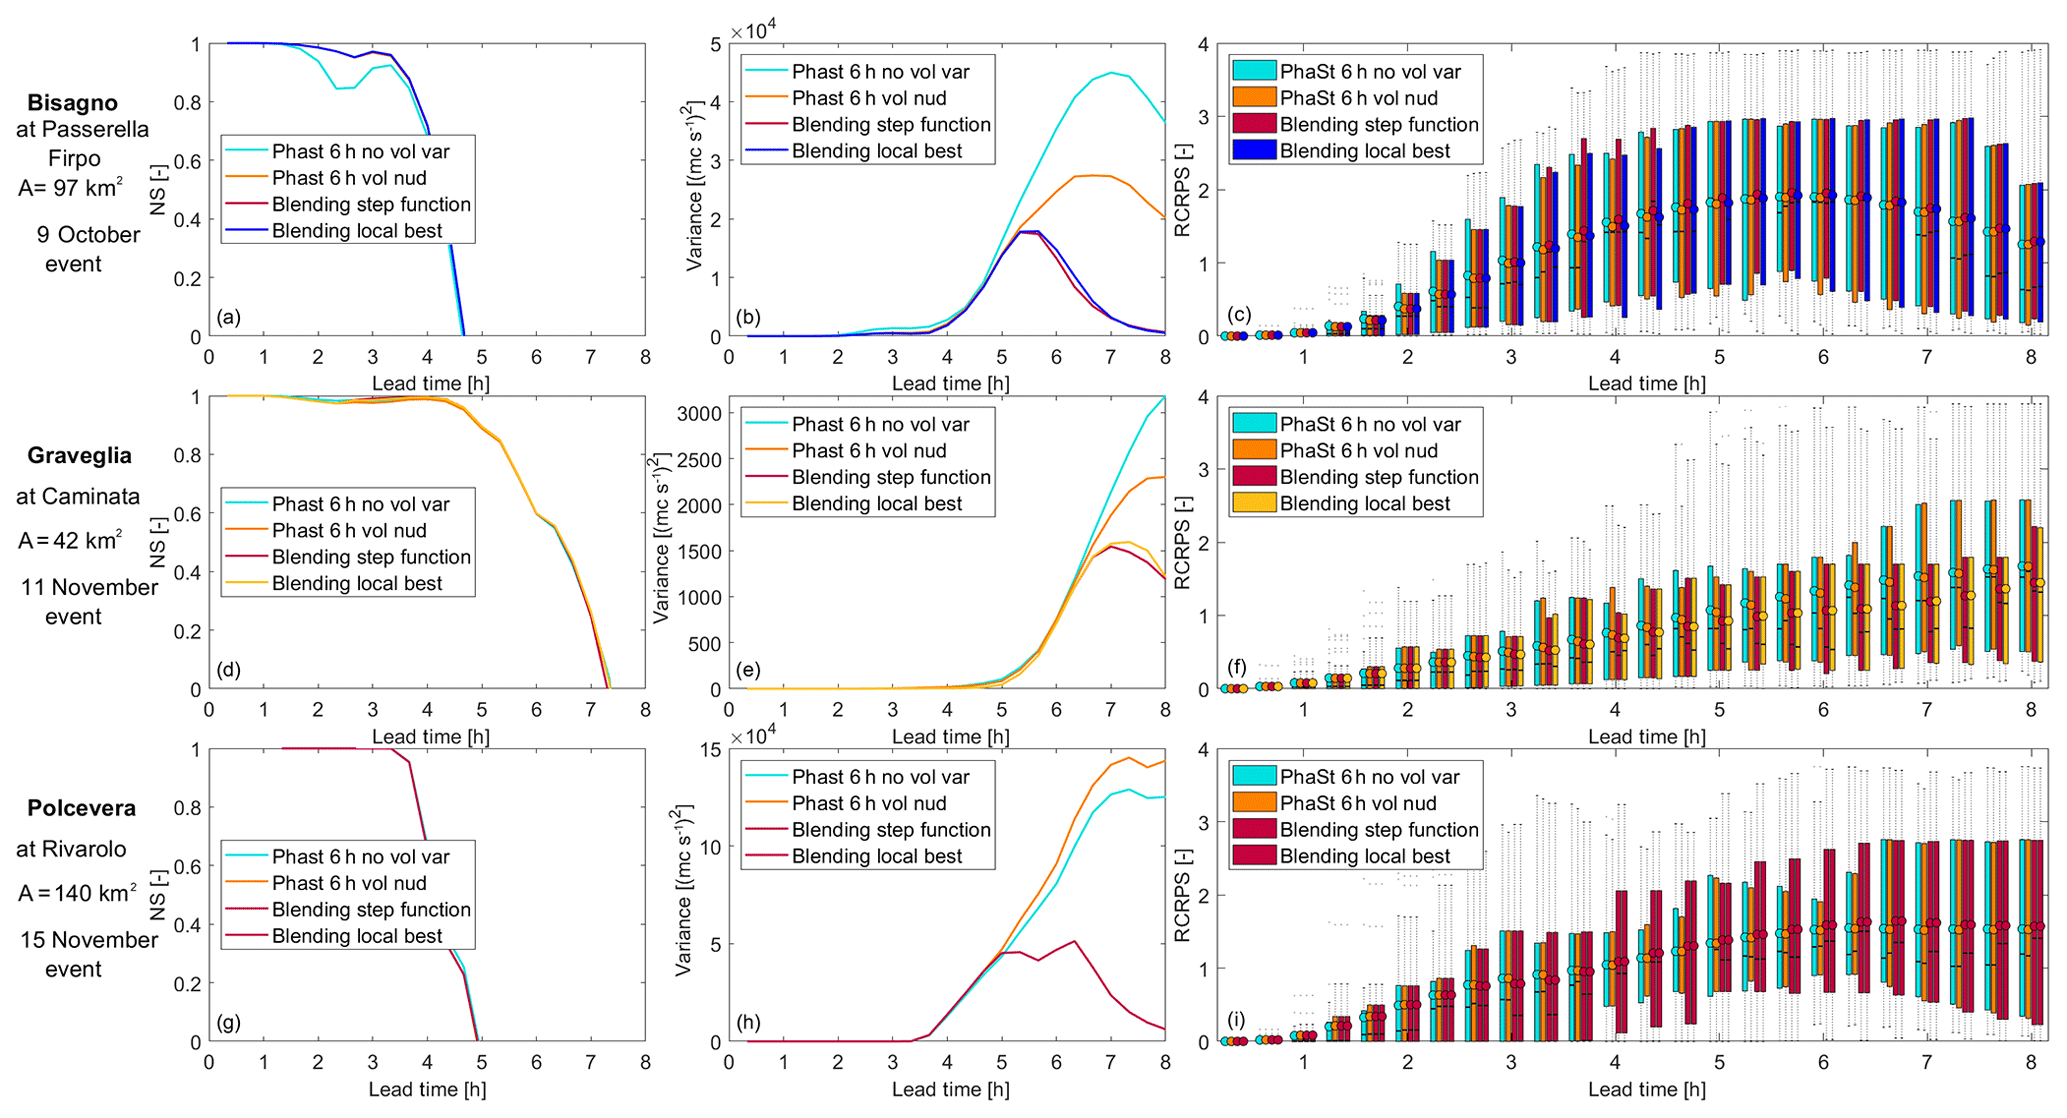
Figure 10Analysis at basin scale for the three events, namely 9 October 2014 at Bisagno creek (a–c), 11 November 2014 at Graveglia (d–f) and 15 November 2014 at Polcevera (g–i). The following scores are shown: Nash–Sutcliffe (NS) efficiency (a, d, g), variance (b, e, h) and RCRPS (c, f, i). Four configurations of the system are evaluated (Phast 6 h no vol var – PhaSt no-volume variation; Phast 6 h no vol nud – PhaSt no-volume nudged; blending step function; blending local best function; see text).
Figure 10 summarizes the results for some representative basins for each event, using the statistical scores described in Sect. 3.7. The three configurations of the hydrological chain presented in Sect. 3.7 are compared; for the blending configuration, the best blending function (for the blending step, see Sect. 4.1) and the local best blending function, which is different for each event, are applied.
The event of 9 October is sadly known for the flood that affected the municipality of Genoa during the evening. The main creek interested by the flood was the Bisagno creek, and the results at the Passerella Firpo section (A≈97 km2) are shown in Fig. 10a, b and c. While for the NS the performances of the hydrological nowcasting chain are really similar among each other, the variance in the forecast obtained using the blending is smaller than that obtained using nowcasting, thus providing a forecast with less variability, which could be an advantage because it theoretically reduces false alarms or a disadvantage because it can increase the missed warning, depending on the single case. The RCRPS shows variable behaviour for different lead times: in the beginning, the best performing configuration is NOWC VOL. In the intermediate phase, when nowcasting and the NWP model forecast are combined with blending, there is no configuration overperforming the others; for longer lead times, the configuration NOWC produces the best performance. For this event, the forecast of the meteorological model, even corrected with data assimilation, is not able to improve the QPF.
Although the event on 11 November affected the whole region of Liguria, the main effects on the ground were caused by the Entella river, which flooded the urban area of Chiavari, and by its tributaries Lavagna and Graveglia. The scores for the Graveglia basin at the Caminata section (A≈42 km2) are shown in Fig. 10d, e and f. Unlike the previous case, here the use of the NWP model has a clearly positive impact. In this event the rainfall fields from nowcasting techniques lead to an overestimation of the discharge, while the rainfall fields obtained through the blending improve markedly the discharge forecast.
For the event of 15 November, the performance of the system is evaluated for Polcevera at the Rivarolo section (140 km2) and shown in Fig. 10g, h and i. It is worth noting that the RCRPS box plot shows that the performance of the system fed with blending becomes worse between 4 and 6 h lead time. As already explained, this can be related to the unrealistic rainfall field produced by the blending when the nowcasting and the NWP model forecast differ too much between each other.
4.3 Distributed analysis
While in the previous section the scores were computed for single punctual sections of the basins, here the distributed analysis is carried out, aimed at giving a more general picture of the performance of the hydrological nowcasting chain fed with different rainfall inputs. In fact, with the distributed analysis, it is possible to compute the score, in this case the RCRPS, over all the points of the domain, increasing the data sample used for the analysis.
4.3.1 9 October 2014 event
For this event the best blending function (Sect. 3.4) is f3. Figure 11 shows the general behaviour during the entire event: the use of the information retrieved by the NWP model in the rain forecast worsens the hydrological forecast. This can be due to the peculiar type of event characterized by stationary and persistent heavy precipitation on the same portion of territory that was not forecasted precisely by the NWP model but reproduced well by the nowcasting model. However, even if the information regarding the location of the rainfall, coming from the meteorological model, is misleading for the hydrological forecast, the information about the total volume on the domain adds value to the nowcasting rainfall field.

Figure 119 October 2014 event: RCRPS for three distinct classes of area. Each column refers to a different configuration of the forecasting system: NOWC (light blue), NOWC VOL (orange), NOWC BLEND using the step blending function (red) and NOWC BLEND using the best local blending function (blue), which in this case is the function f3.
4.3.2 11 November 2014 event
For this event the best blending function is f2. As already pointed out in the previous basin-scale analysis, the distributed analysis (Fig. 12) confirms, even more clearly, that for this event the system using the blending performs markedly better. Especially for the bigger basins, due to their response time, the effects of a proper rainfall forecast provided with blending are beneficial for longer lead times, probably due to the slow response of the basins.
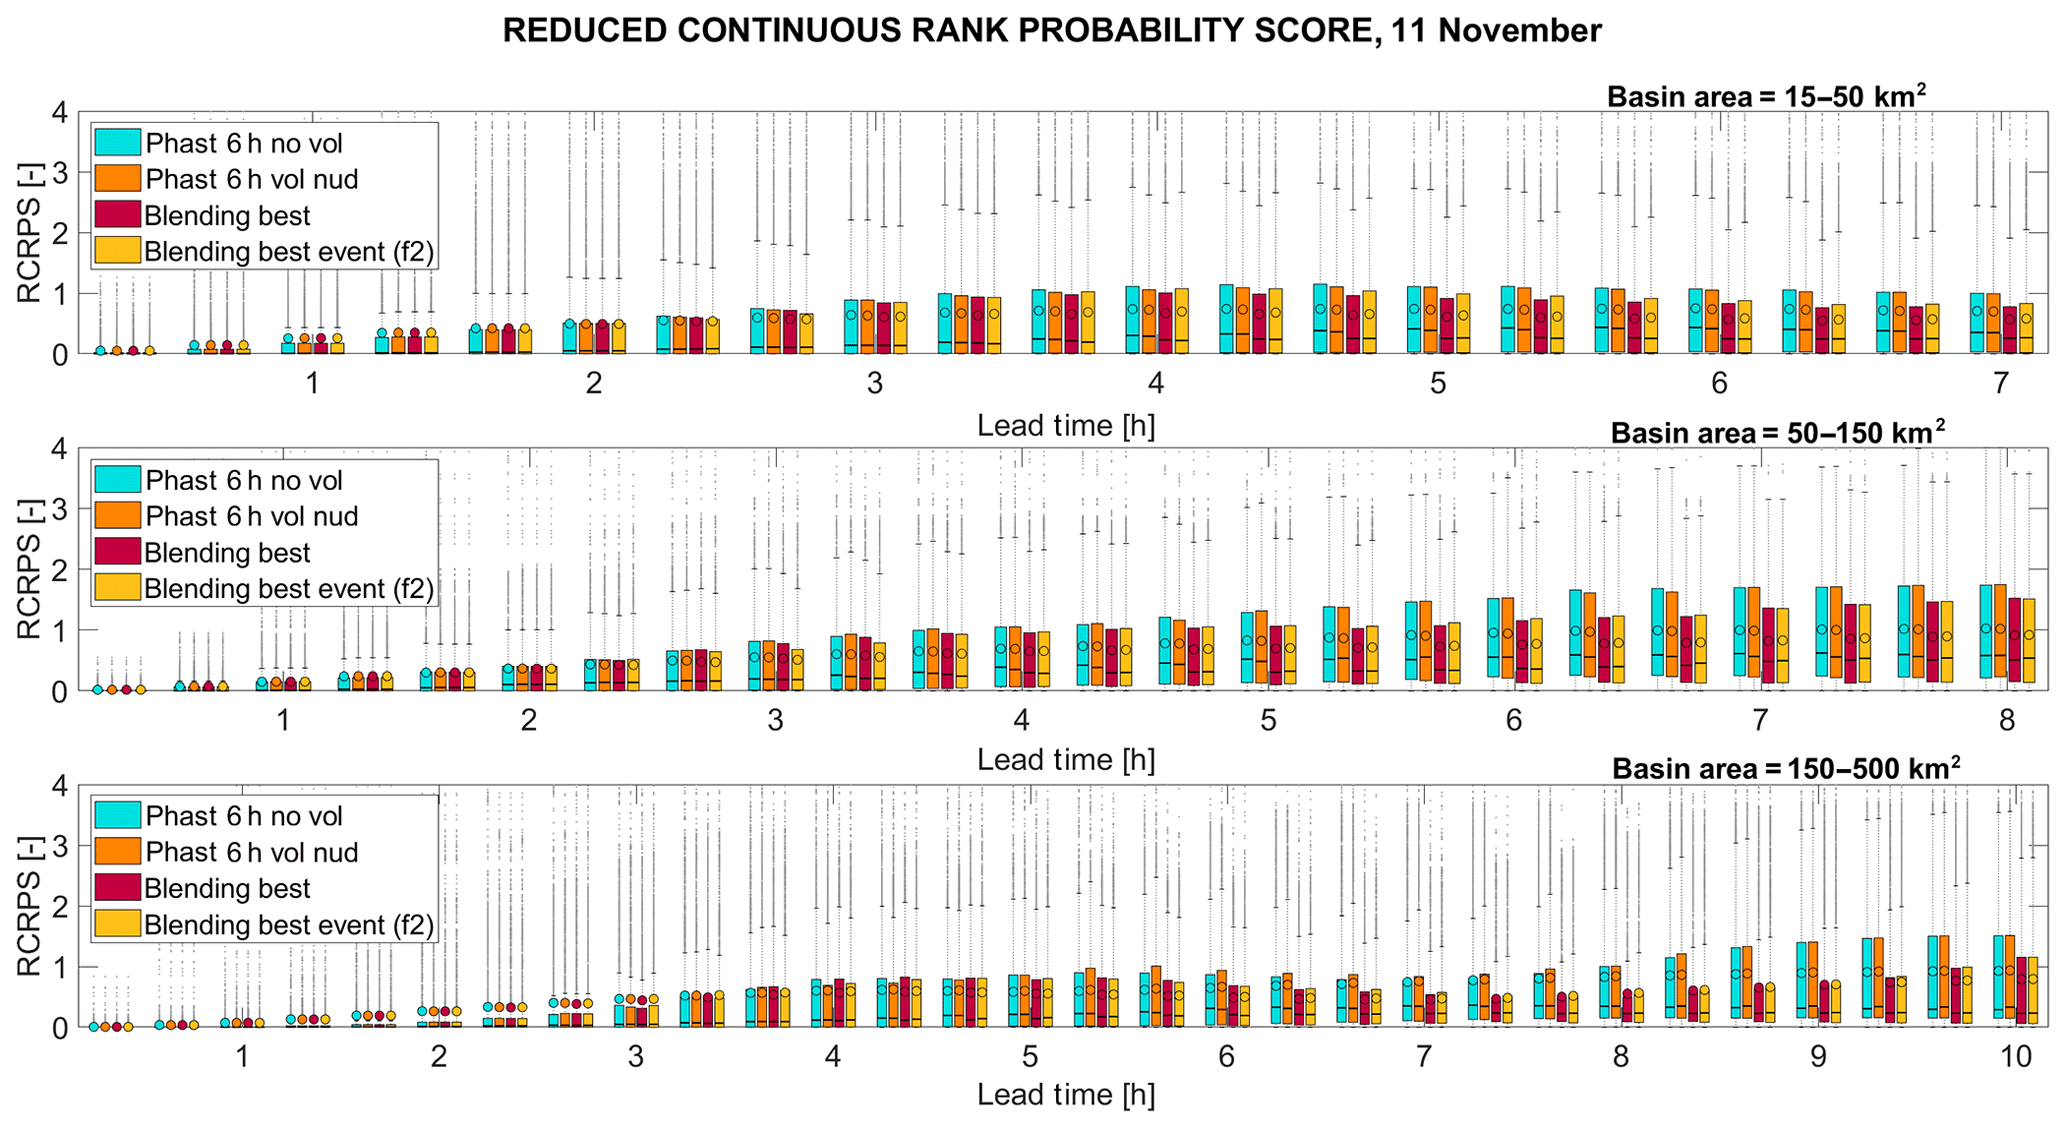
Figure 1211 November 2014 event: RCRPS for three distinct classes of area. Each column refers to a different configuration of the forecasting system: NOWC (light blue), NOWC VOL (orange), NOWC BLEND using the step blending function (red) and NOWC BLEND using the best local blending function (yellow), which in this case is the function f2.
4.3.3 15 November 2014
For this event the best blending function coincides with the best on average for all the three events, which is the step function. In this case (Fig. 13) the differences among the configurations can be noticed mostly in the first two classes of the area, where the use of the blending technique improves the rainfall forecast: the column related to the NOWC BLEND configuration is always lower and presents less spread with respect to NOWC and NOWC VOL configurations. In the last class of the area (larger basin) the behaviour is different, especially at the lead time corresponding to the transition in the blending between the rainfall field from nowcasting and from the NWP model. This transition is confirmed to be the most critical phase for the blending, as it can produce unrealistic rainfall fields.
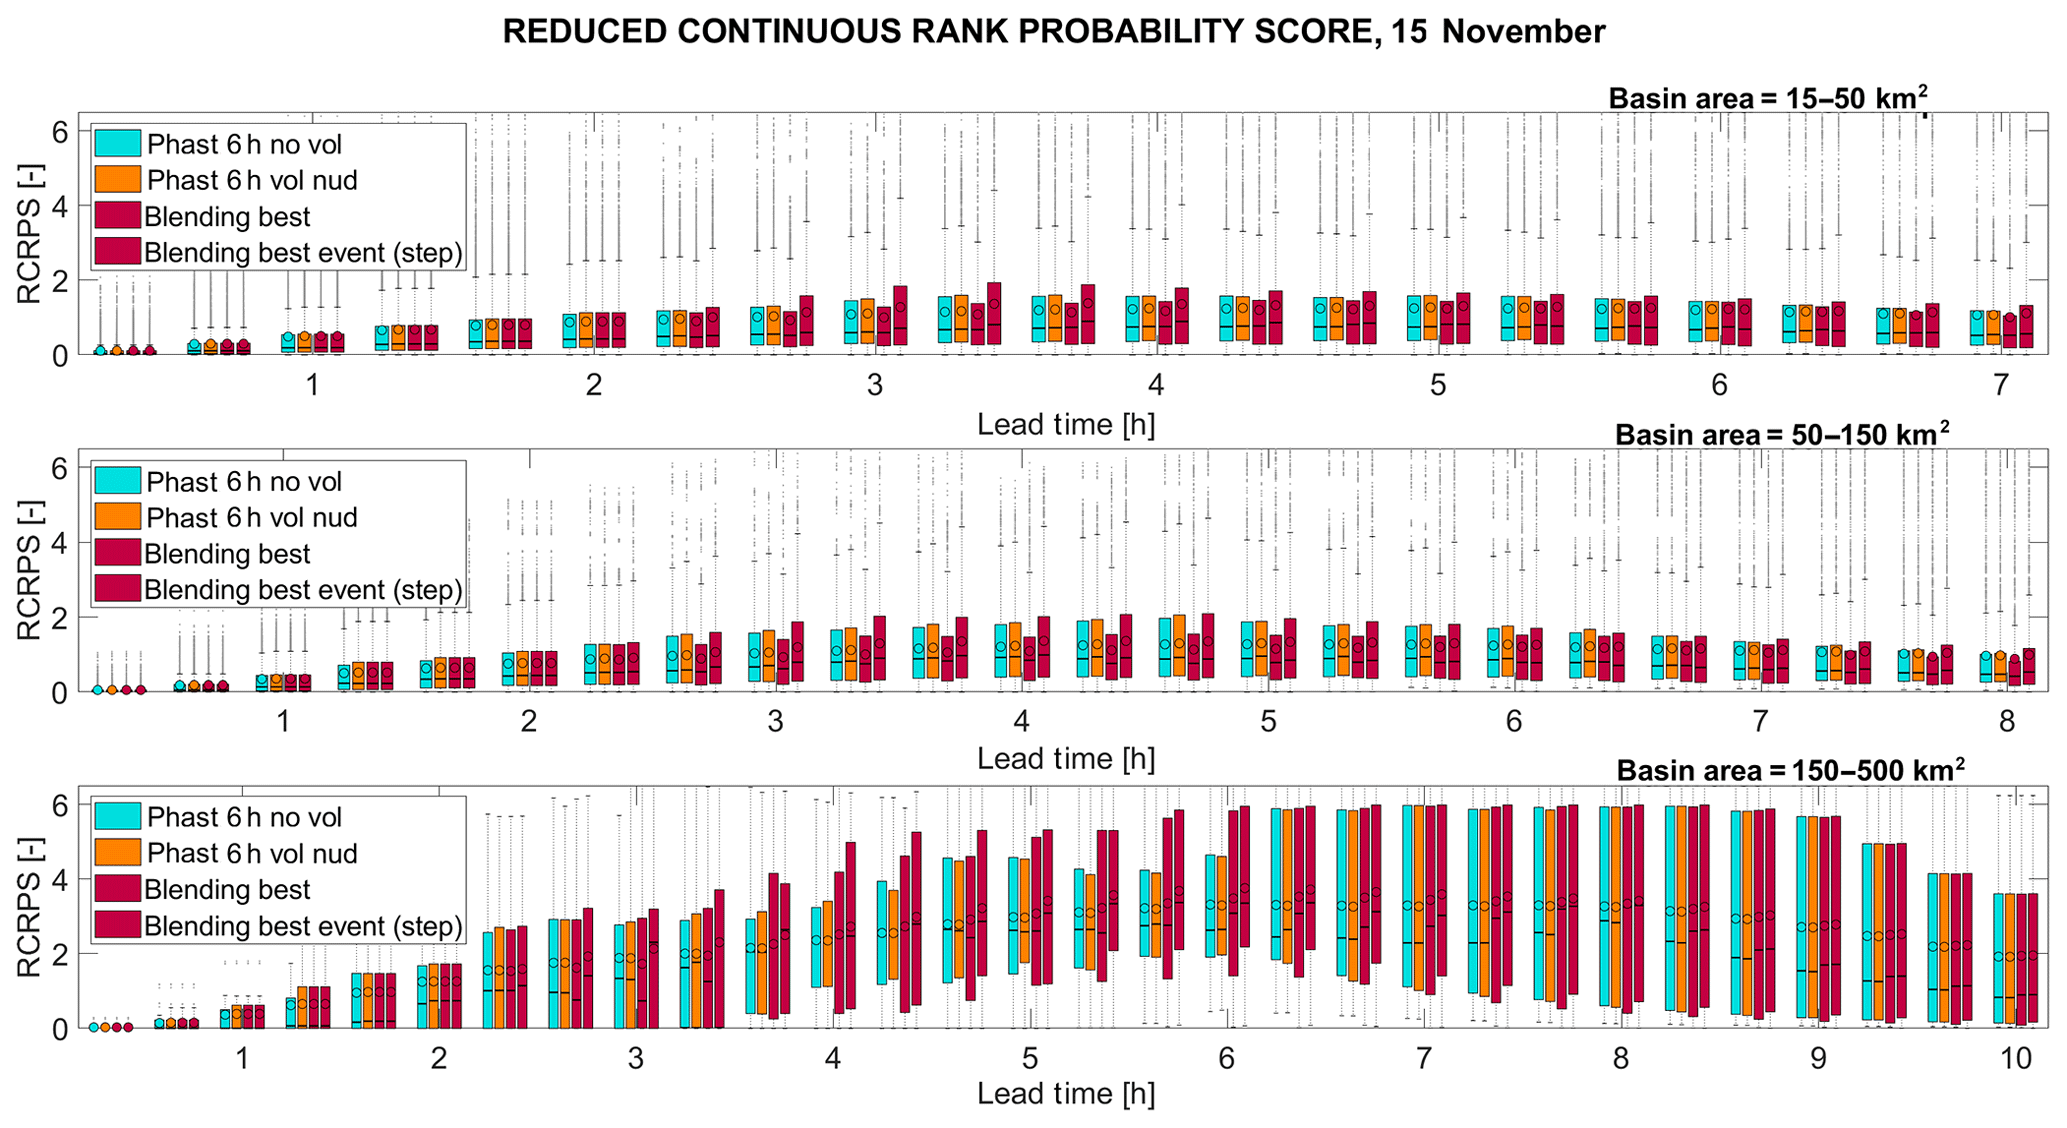
Figure 1315 November 2014 event: RCRPS for three distinct classes of area. Each column refers to a different configuration of the forecasting system: NOWC (light blue), NOWC VOL (orange), NOWC BLEND using the step blending function (red) and NOWC BLEND using the best local blending function, which in this case coincides with the step function (red).
A hydrological nowcasting chain is a useful instrument for flood and flash flood warnings. The use of an accurate QPF for input to the hydrological model is essential in extending the lead time of the hydrological forecast. The aim of this study is to improve the single elements in order to provide, in real time, an accurate forecast of the rainfall field which is able to improve the performance of the hydrological prediction at a temporal scale of up to 6–8 h.
The elements involved in the chain are the convection-permitting NWP model MOLOCH, which is able to provide high-resolution rainfall forecasts and to assimilate rainfall estimates with rapid updates, the probabilistic nowcasting model PhaSt, which extrapolates the rainfall evolution from observations, and the hydrological distributed model Continuum, which predicts the ground effects of the precipitation in terms of streamflow over all the basins of the studied region. The way in which these elements are combined with each other and integrated with observations from radar and available rain gauges represents the major novelty of the present study with respect to similar existing nowcasting procedures. Instead of just combining the spatial distribution of two rainfall fields, obtained independently of a nowcasting algorithm and an NWP model, first the nowcasting fields are modified according to information provided by the NWP. This can be considered to be a first blending step, during which the predicted rainfall fields produced by PhaSt are modified along the forecast horizon according to the predicted variation in rainfall volume from the NWP model corrected with assimilation. Specifically the rainfall volume trend by the NWP model is used to overcome the current limitation of the PhaSt algorithm, which is based on the hypothesis that the most recent observed rainfall volume is kept constant along the prediction. This first blending is aimed at better taking into account the processes of growth and decay of the precipitation structures as described by the NWP model that progressively gain importance at increasing lead times and cannot be realistically reproduced by nowcasting alone. Then a standard blending technique is applied to linearly combine the rainfall fields from nowcasting and the NWP model, based on a blending function that gives different weight to the QPF, depending on the lead time. The probabilistic QPF obtained (20 rainfall ensembles) is the input of the distributed hydrological model Continuum, which produces an ensemble of discharge forecasts in a frequently updated flood forecasting system (every 20 min).
The meteo-hydrological chain is tested for three main floods occurred during the autumn of 2014 that affected different areas of the Liguria region: the 9 October event with the flood of the Bisagno creek that hit the municipality of Genoa, the 11 November event, involving the Graveglia catchment, and the 15 November event, in which the flood of Polcevera occurred. Even if the number of analysed events is restricted, the resulting distributed maps produced by Continuum allow us to verify the performance of the chain on a large data sample.
A first analysis compared the results of the application of various blending functions to combine the forecast fields, highlighting the presence of a best function on average for the three events and a best function for each single event. This evaluation, however, suffers from the limited statistics due to the low number of analysed events. In order to identify the best blending function with more confidence, a larger sample of events is needed. In any case, using the best function for any single event, a comparison between three configurations of the hydrological nowcasting chains is performed. In the first two configurations, rainfall input is provided by nowcasting, with or without volume modification, while in the third one the blended rainfall fields are used.
Statistical scores show that in various cases the use of the rainfall fields resulting from the blending process leads to an improvement in the performances of the whole chain with respect to the use of nowcasting alone. In other cases, the benefit gained using the complete configuration with the blending is not so evident, and the performances results are similar to the use of the nowcasting for the whole lead time. However, a worsening of the performance is rarely observed and occurs in the time window corresponding to the transition between nowcasting and the NWP model forecast rainfall field. Hence, there is added value in the use of the blending between nowcasting and the NWP model, as it produces better or equal scores with respect to the use of the nowcasting alone.
A limitation of the presented study is related to the reduced number of considered events, which is mainly due to computational costs. A direct consequence is that it is not possible to provide a complete and exhaustive evaluation of the system performances, especially in terms of false alarms (Antonetti et al., 2019). In any case, this study can be considered to be a first step in the implementation and evaluation of a novel nowcasting procedure, which provides positive and encouraging results but still requires a much more robust validation, already planned for the future. However, it is worth noticing that the distributed analysis tries to partially overcome this issue because it considers a large number of grid points, increasing the sample size for the analysis, although in many cases the sample elements are evidently not independent, so it should be desirable in any case to increase the number of events for further analysis.
Future works and improvements to the chain presented in this work will be always explored in terms of improvement of the elements that compose it. Other techniques of data assimilation with increasing degrees of complexity can be used to assimilate not only the observed precipitation field but also other variables in the NWP model. Following recent works (Atencia et al., 2010), further investigations can be carried out using another type of blending, called spatial blending, which introduces spatial dependence of weights as a distance function to rainfall structures.
MOLOCH forecast rainfall data are available through a THREDDS Data Server upon request to s.davolio@isac.cnr.it, while the radar rainfall data used can be requested from the Regional Environmental Protection Agency of Liguria, Italy (ARPAL; https://www.arpal.gov.it/, last access: 4 March 2019).
MLP, FS and SD designed the study. MLP and FS planned and coordinated the collection of data and performed the research activity related to the nowcasting, the blending technique and the hydrological application including the analysis of the results. SD carried out radar data assimilation into the NWP and meteorological simulations. All authors contributed to the analysis and to writing and revising the paper.
The authors declare that they have no conflict of interest.
This article is part of the special issue “Hydrological cycle in the Mediterranean (ACP/AMT/GMD/HESS/NHESS/OS inter-journal SI)”. It is not associated with a conference.
This work is a contribution to the HyMeX international programme, and it is supported by the Italian Civil Protection Department. We acknowledge the Regional Environmental Protection Agency of Liguria, Italy (ARPAL), for fruitful discussions and for providing the data.
This research has been developed within the 2017–2019 framework agreement stipulated between the CIMA Research Foundation and the Civil Protection Department.
This paper was edited by Uwe Ehret and reviewed by Massimiliano Zappa and one anonymous referee.
Acquaotta, F., Faccini, F., Fratianni, S., Paliaga, G., and Sacchini, A.: Rainfall intensity in the Genoa Metropolitan Area: secular variations and consequences, Weather, 73, 356–362, https://doi.org/10.1002/wea.3208, 2018.
Antonetti, M., Horat, C., Sideris, I. V., and Zappa, M.: Ensemble flood forecasting considering dominant runoff processes – Part 1: Set-up and application to nested basins (Emme, Switzerland), Nat. Hazards Earth Syst. Sci., 19, 19–40, https://doi.org/10.5194/nhess-19-19-2019, 2019.
Atencia, A., Rigo, T., Sairouni, A., Moré, J., Bech, J., Vilaclara, E., Cunillera, J., Llasat, M. C., and Garrote, L.: Improving QPF by blending techniques at the Meteorological Service of Catalonia, Nat. Hazards Earth Syst. Sci., 10, 1443–1455, https://doi.org/10.5194/nhess-10-1443-2010, 2010.
Berenguer, M., Corral, C., Sánchez-Diezma, R., and Sempere-Torres, D.: Hydrological validation of a radar-based nowcasting technique, J. Hydrometeorol., 6, 532–549, https://doi.org/10.1175/JHM433.1 , 2005.
Berenguer, M., Sempere-Torres, D., and Pegram, G. G.: SBMcast – An ensemble nowcasting technique to assess the uncertainty in rainfall forecasts by Lagrangian extrapolation, J. Hydrol., 404, 226–240, https://doi.org/10.1016/j.jhydrol.2011.04.033 , 2011.
Bick, T., Simmer, C., Trömel, S., Wapler, K., Hendricks Franssen, H. J., Stephan, K., Blahak, U., Schraff, C., Reich, H., Zeng, Y., and Potthast, R.: Assimilation of 3D radar reflectivities with an ensemble Kalman filter on the convective scale, Q. J. Roy. Meteor. Soc., 142, 1490–1504, https://doi.org/10.1002/qj.2751, 2016
Borga, M.: Accuracy of radar rainfall estimates for streamflow simulation. J. Hydrol., 267, 26–39, https://doi.org/10.1016/S0022-1694(02)00137-3, 2002.
Bowler, N. E., Pierce, C. E., and Seed, A. W.: STEPS: A probabilistic precipitation forecasting scheme which merges an extrapolation nowcast with downscaled NWP, Q. J. Roy. Meteor. Soc., 132, 2127–2155, https://doi.org/10.1256/qj.04.100, 2006.
Brown, T. A.: Admissible scoring systems for continuous distributions. Manuscript P-5235, The Rand Corporation, Santa Monica, CA, USA, 22 pp., 1974.
Buzzi, A., Davolio, S., D'Isidoro, M., and Malguzzi, P.: The impact of resolution and of MAP reanalysis on the simulations of heavy precipitation during MAP cases, Meteorol. Z., 13, 91–97, https://doi.org/10.1127/0941-2948/2004/0013-0091, 2004.
Buzzi, A., Davolio, S., Malguzzi, P., Drofa, O., and Mastrangelo, D.: Heavy rainfall episodes over Liguria in autumn 2011: numerical forecasting experiments, Nat. Hazards Earth Syst. Sci., 14, 1325–1340, https://doi.org/10.5194/nhess-14-1325-2014, 2014.
Cenci, L., Laiolo, P., Gabellani, S., Campo, L., Silvestro, F., Delogu, F., Boni, G., and Rudari, R.: Assimilation of H-SAF Soil Moisture Products for Flash Flood Early Warning Systems. Case Study: Mediterranean Catchments, IEEE J. Sel. Top. Appl., 9, 5634–5646, https://doi.org/10.1109/JSTARS.2016.2598475, 2016.
Collier, C. G.: Objective rainfall forecasting using data from the United Kingdom weather radar network. In Nowcasting: Mesoscale Observations and Short-Range Prediction. Proceedings of International Symposium, Hamburg, Germany, 25–28 August, 1981, edited by: Battrick, B. and Mort, J., ESA SP-165, p. 201, 1981.
Davolio, S., Silvestro, F., and Malguzzi, P.: Effects of increasing horizontal resolution in a convection-permitting model on flood forecasting: The 2011 dramatic events in Liguria, Italy, J. Hydrometeorol., 16, 1843–1856, https://doi.org/10.1175/JHM-D-14-0094.1, 2015.
Davolio, S., Silvestro, F., and Gastaldo, T.: Impact of Rainfall Assimilation on High-Resolution Hydrometeorological Forecasts over Liguria, Italy, J. Hydrometeorol., 18, 2659–2680, https://doi.org/10.1175/JHM-D-17-0073.1, 2017a.
Davolio, S., Henin, R., Stocchi, P., and Buzzi, A.: Bora wind and heavy persistent precipitation: Atmospheric water balance and role of air–sea fluxes over the Adriatic Sea, Q. J. Roy. Meteor. Soc., 143, 1165–1177, https://doi.org/10.1002/qj.3002, 2017b.
Delrieu, G., Nicol, J., Yates, E., Kirstetter, P. E., Creutin, J. D., Anquetin, S., Obled, C., Saulnier G. M., and Payrastre, O.: The catastrophic flash-flood event of 8–9 September 2002 in the Gard Region, France: a first case study for the Cévennes–Vivarais Mediterranean Hydrometeorological Observatory, J. Hydrometeorol., 6, 34–52, https://doi.org/10.1175/JHM-400.1, 2005.
Dow, G. and Macpherson, B.: Benefit of convective-scale data assimilation and observing systems in the UK models, Forecasting Research Technical Report 585, Met Office, UK, 2013.
Drobinski, P., Ducrocq, V., Alpert, P., Anagnostou, E., Béranger, K., Borga, M., Braud, I., Chanzy, A., Davolio, S., Delrieu, G., Estournel, C., Filali Boubrahmi, N., Font, J., Grubisic, V., Gualdi, S., Homar, V., Ivancan-Picek, B., Kottmeier, C., Kotroni, V., Lagouvardos, K., Lionello, P., Llasat, M. C., Ludwig, W., Lutoff, C., Mariotti, A., Richard, E., Romero R., Rotunno, R., Roussot, O., Ruin, I., Somot, S., Taupier-Letage, I., Tintore, J., Uijlenhoet, R., and Wernli, H.: HyMeX: A 10-year multidisciplinary program on the Mediterranean water cycle, B. Am. Meteorol. Soc., 95, 1063–1082, https://doi.org/10.1175/BAMS-D-12-00242.1, 2014.
Ducrocq, V., Nuissier, O., Ricard, D., Lebeaupin, C., and Thouvenin, T.: A numerical study of three catastrophic precipitating events over southern France. II: Mesoscale triggering and stationarity factors, Q. J. Roy. Meteor. Soc., 134, 131–145, https://doi.org/10.1002/qj.199, 2008.
Faccini, F., Piccazzo, M., and Robbiano, A.: Natural hazards in San Fruttuoso of Camogli (Portofino Park, Italy): a case study of a debris flow in a coastal environmen, B. Soc. Geol. Ital., 128, 641–654, https://doi.org/10.3301/IJG.2009.128.3.641, 2009.
Faccini, F., Robbiano, A., and Sacchini, A.: Geomorphic hazards and intense rainfall: the case study of the Recco Stream catchment (Eastern Liguria, Italy), Nat. Hazards Earth Syst. Sci., 12, 893–903, https://doi.org/10.5194/nhess-12-893-2012, 2012.
Fiori, E., Comellas, A., Molini, L., Rebora, N., Siccardi, F., Gochis, D. J., Tanelli, S., and Parodi, A.: Analysis and hindcast simulations of an extreme rainfall event in the Mediterranean area: The Genoa 2011 case, Atmos. Res., 138, 13–29, https://doi.org/10.1016/j.atmosres.2013.10.007, 2014.
Foresti, L., Reyniers, M., Seed, A., and Delobbe, L.: Development and verification of a real-time stochastic precipitation nowcasting system for urban hydrology in Belgium, Hydrol. Earth Syst. Sci., 20, 505–527, https://doi.org/10.5194/hess-20-505-2016, 2016.
Gabellani, S., Silvestro, F., Rudari, R., and Boni, G.: General calibration methodology for a combined Horton-SCS infiltration scheme in flash flood modeling, Nat. Hazards Earth Syst. Sci., 8, 1317–1327, https://doi.org/10.5194/nhess-8-1317-2008, 2008.
Germann, U. and Zawadzki, I.: Scale-dependence of the predictability of precipitation from continental radar images. Part I: Description of the methodology, Mon. Weather Rev., 130, 2859–2873, https://doi.org/10.1175/1520-0493(2002)130<2859:SDOTPO>2.0.CO;2, 2002.
Germann, U., Zawadzki, I., and Turner, B.: Predictability of precipitation from continental radar images. Part IV: Limits to prediction, J. Atmos. Sci., 63, 2092–2108, https://doi.org/10.1175/JAS3735.1, 2006.
Giannoni, F., Roth., G., and Rudari, R.: A Semi – Distributed Rainfall – Runoff Model Based on a Geomorphologic Approach, Phys. Chem. Earth, 25, 665–671 https://doi.org/10.1016/S1464-1909(00)00082-4, 2000.
Giannoni, F., Roth., G., and Rudari, R.: A procedure for drainage network identification from geomorphology and its application to the prediction of the hydrologic response, Adv. Water Resour., 28, 567–581, https://doi.org/10.1016/j.advwatres.2004.11.013, 2005.
Golding, B. W.: Nimrod: A system for generating automated very short range forecasts, Meteorol. Appl., 5, 1–16, https://doi.org/10.1017/S1350482798000577, 1998.
Haiden, T., Kann, A., Wittmann, C., Pistotnik, G., Bica, B., and Gruber, C.: The Integrated Nowcasting through Comprehensive Analysis (INCA) system and its validation over the Eastern Alpine region, Weather Forecast., 26, 166–183, https://doi.org/10.1175/2010WAF2222451.1, 2011.
Hersbach, H.: Decomposition of the continuous ranked probability score for ensemble prediction systems, Weather Forecast., 15, 559–570, https://doi.org/10.1175/1520-0434(2000)015<0559:DOTCRP>2.0.CO;2, 2000.
Kain, J. S.: The Kain–Fritsch convective parameterization: An up-date, J. Appl. Meteorol., 43, 170–181, https://doi.org/10.1175/1520-0450(2004)043<0170:TKCPAU>2.0.CO;2, 2004.
Kain, J. S., Weiss, S. J., Levit, J. J., Baldwin, M. E., and Bright, D. R.: Examination of convection-allowing configurations of the WRF model for the prediction of severe convective weather: The SPC/NSSL Spring Program 2004, Weather Forecast., 21, 167–181, https://doi.org/10.1175/WAF906.1, 2006.
Kilambi, A. and Zawadzki, I.: An evaluation of ensembles based upon MAPLE precipitation nowcasts and NWP precipitation forecasts, in: Preprints, 32nd Conf. on Radar Meteorology, 22–29 October 2005, Albuquerque, NM, USA, Amer. Meteor. Soc., vol. 4, P3R, 2005.
Kober, K., Craig, G. C., Keil, C., and Dörnbrack, A.: Blending a probabilistic nowcasting method with a high-resolution numerical weather prediction ensemble for convective precipitation forecasts, Q. J. Roy. Meteor. Soc., 138, 755–768, https://doi.org/10.1002/qj.939, 2012.
Kyznarova, H., Salek, M., and Novak, P.: Preliminary results of use of INCA system in the Czech Hydrometeorological Institute, Proceedings of ERAD2012, 25–29 June 2012, Toulouse, France, 2012.
Kyznarova, H., Novak, P., Brezkova, L., Janal, P., and Salek, M.: Precipitation output of INCA system: evaluation and use. In EGU General Assembly Conference Abstracts, vol. 15, EGU General Assembly, 7–12 April 2013, Vienna, Austria, 2013EGUGA..15.9089K, 2013.
Liechti, K. and Zappa, M.: Verification of Short-Range Hydrological Forecasts, Handbook of Hydrometeorological Ensemble Forecasting, Springer, Berlin, Heidelberg, Germany, 953–975, 2019.
Liechti, K., Panziera, L., Germann, U., and Zappa, M.: The potential of radar-based ensemble forecasts for flash-flood early warning in the southern Swiss Alps, Hydrol. Earth Syst. Sci., 17, 3853–3869, https://doi.org/10.5194/hess-17-3853-2013, 2013.
Lin, C., Vasić, S., Kilambi, A., Turner, B., and Zawadzki, I.: Precipitation forecast skill of numerical weather prediction models and radar nowcasts, Geophys. Res. Lett., 32, L14801, https://doi.org/10.1029/2005GL023451, 2005.
Malguzzi, P., Grossi, G., Buzzi, A., Ranzi, R., and Buizza, R.: The 1966 “century” flood in Italy: A meteorological and hydrological revisitation, J. Geophys. Res., 111, D24106, https://doi.org/10.1029/2006JD007111, 2006.
Matheson, J. E. and Winkler, R. L.: Scoring rules for continuous probability distributions, Manage. Sci., 22, 1087–109, https://doi.org/10.1287/mnsc.22.10.1087, 1976.
Metta, S., von Hardenberg, J., Ferraris, L., Rebora, N., and Provenzale, A.: Precipitation nowcasting by a spectral-based nonlinear stochastic model, J. Hydrometeorol., 10, 1285–1297, https://doi.org/10.1175/2009JHM1120.1, 2009.
Nash, J. E. and Sutcliffe, J. V.: River flow forecasting through conceptual models part I – A discussion of principles, J. Hydrol., 10, 282–290, https://doi.org/10.1016/0022-1694(70)90255-6, 1970.
Nerini, D., Germann, U., and Foresti, L.: A Bayesian framework based on the ensemble Kalman filter for flow-dependent integration of weather radar extrapolation nowcasts and NWP precipitation fields, in: EGU General Assembly Conference Abstracts, vol. 20, p. 4865, EGU General Assembly, 4–13 April 2018, Vienna, Austria, 2018EGUGA..20.4865N, 2018.
Panziera, L., Germann, U., Gabella, M., and Mandapaka, P. V.: NORA – Nowcasting of Orographic Rainfall by means of Analogues, Q. J. Roy. Meteorol. Soc., 137, 2106–2123, https://doi.org/10.1002/qj.878, 2011.
Parodi, A., Boni, G., Ferraris, L., Siccardi, F., Pagliara, P., Trovatore, E., and Kranzlmueller, D.: The “perfect storm”: From across the Atlantic to the hills of Genoa, Eos, Transactions American Geophysical Union, 93, 225–226, https://doi.org/10.1029/2012EO240001, 2012.
Rebora, N., Molini, L., Casella, E., Comellas, A., Fiori, E., Pignone, F., Siccardi, F., Silvestro, F., Tanelli, S., and Parodi, A.: Extreme rainfall in the Mediterranean: What can we learn from observations?, J. Hydrometeorol., 14, 906–922, https://doi.org/10.1175/JHM-D-12-083.1, 2013.
Rossa, A. M., Del Guerra, F. L., Borga, M., Zanon, F., Settin, T., and Leuenberger, D.: Radar-driven high-resolution hydro-meteorological forecasts of the 26 September 2007 Venice flash flood, J. Hydrol., 394, 230–244, https://doi.org/10.1016/j.jhydrol.2010.08.035, 2010.
Seed, A. W.: A dynamic and spatial scaling approach to advection forecasting, J. Appl. Meteorol., 42, 381–388, https://doi.org/10.1175/1520-0450(2003)042<0381:ADASSA>2.0.CO;2, 2003.
Silvestro, F. and Rebora, N.: Operational verification of a framework for the probabilistic nowcasting of river discharge in small and medium size basins, Nat. Hazards Earth Syst. Sci., 12, 763-776, https://doi.org/10.5194/nhess-12-763-2012, 2012.
Silvestro, F., Rebora, N., and Ferraris, L.: An algorithm for real-time rainfall rate estimation by using polarimetric radar: RIME, J. Hydrometeorol., 10, 227–240, https://doi.org/10.1175/2008JHM1015.1, 2009.
Silvestro, F., Gabellani, S., Giannoni, F., Parodi, A., Rebora, N., Rudari, R., and Siccardi, F.: A hydrological analysis of the 4 November 2011 event in Genoa, Nat. Hazards Earth Syst. Sci., 12, 2743–2752, https://doi.org/10.5194/nhess-12-2743-2012, 2012.
Silvestro, F., Gabellani, S., Delogu, F., Rudari, R., and Boni, G.: Exploiting remote sensing land surface temperature in distributed hydrological modelling: the example of the Continuum model, Hydrol. Earth Syst. Sci., 17, 39–62, https://doi.org/10.5194/hess-17-39-2013, 2013.
Silvestro, F., Rebora, N., Cummings, G., and Ferraris, L.: Experiences of dealing with flash floods using an ensemble hydrological nowcasting chain: implications of communication, accessibility and distribution of the results, J. Flood Risk Manage., 10, 446–462, https://doi.org/10.1111/jfr3.12161, 2015a.
Silvestro, F., Gabellani, S., Rudari, R., Delogu, F., Laiolo, P., and Boni, G.: Uncertainty reduction and parameter estimation of a distributed hydrological model with ground and remote-sensing data, Hydrol. Earth Syst. Sci., 19, 1727–1751, https://doi.org/10.5194/hess-19-1727-2015, 2015b.
Silvestro, F., Rebora, N., Giannoni, F., Cavallo, A., and Ferraris, L.: The flash flood of the Bisagno Creek on 9th October 2014: An “unfortunate” combination of spatial and temporal scales, J. Hydrol., 541, 50–62, https://doi.org/10.1016/j.jhydrol.2015.08.004, 2016.
Silvestro, F., Parodi, A., Campo, L., and Ferraris, L.: Analysis of the streamflow extremes and long-term water balance in the Liguria region of Italy using a cloud-permitting grid spacing reanalysis dataset, Hydrol. Earth Syst. Sci., 22, 5403–5426, https://doi.org/10.5194/hess-22-5403-2018, 2018.
Sinclair, S. and Pegram, G.: Combining radar and rain gauge rainfall estimates using conditional merging, Atmos. Sci. Lett., 6, 19–22, https://doi.org/10.1002/asl.85, 2005.
Sokol, Z. and Zacharov, P.: Nowcasting of precipitation by an NWP model using assimilation of extrapolated radar reflectivity, Q. J. Roy. Meteor. Soc., 138, 1072–1082, https://doi.org/10.1002/qj.970, 2012.
Stanki, H. R., Wilson, L. J., and Burrows, W. R.: Survey of common verification methods in meteorology, WMO/TD 358, World Meteorological Organization, Geneva, Switzerland, 114 pp., 1989.
Sun, J., Xue, M., Wilson, J. W., Zawadzki, I., Ballard, S. P., Onvlee-Hooimeyer, J., Joe, P., Barker, D. M., Li, P.-W., Golding, B., Xu, M., and Pinto, J.: Use of NWP for nowcasting convective precipitation. Recent progress and challenges, B. Am. Meteorol. Soc., 95, 409–426, https://doi.org/10.1175/BAMS-D-11-00263.1, 2014.
Thorndahl, S., Einfalt, T., Willems, P., Nielsen, J. E., ten Veldhuis, M.-C., Arnbjerg-Nielsen, K., Rasmussen, M. R., and Molnar, P.: Weather radar rainfall data in urban hydrology, Hydrol. Earth Syst. Sci., 21, 1359–1380, https://doi.org/10.5194/hess-21-1359-2017, 2017.
Trinh, B. N., Thielen-del Pozo, J., and Thirel, G.: The reduction continuous rank probability score for evaluating discharge forecasts from hydrological ensemble prediction systems, Atmos. Sci. Lett., 14, 61–65, https://doi.org/10.1002/asl2.417, 2013.
Unger, D. A.: A method to estimate the continuous ranked probability score. Preprints, Ninth Conf. on Probability and Statistics in Atmospheric Sciences, 9–11 October 1985, Virginia Beach, VA, USA, Amer. Meteor. Soc., 206–213, 1985.
Vieux, B. E. and Bedient, P. B.: Assessing urban hydrologic prediction accuracy through event reconstruction, J. Hydrol., 299, 217–236, https://doi.org/10.1016/j.jhydrol.2004.08.005, 2004.
Wang, G., Wong, W. K., Hong, Y., Liu, L., Dong, J., and Xue, M.: Improvement of forecast skill for severe weather by merging radar-based extrapolation and storm-scale NWP corrected forecast, Atmos. Res., 154, 14–24, https://doi.org/10.1016/j.atmosres.2014.10.021, 2015.
Weisman, M. L., Davies, C., Wang, W., Manning, K. W., and Klemp, J. B.: Experiences with 0-36-h explicit convective fore- casts with the WRF-ARW model, Weather Forecast., 23, 407–437, https://doi.org/10.1175/2007WAF2007005.1, 2008.
Wilson, J. W. and Roberts, R. D.: Summary of convective storm initiation and evolution during IHOP: Observational and modeling perspective, Mon. Weather Rev., 134, 23–47, https://doi.org/10.1175/MWR3069.1, 2006.
Wilson, J. W., Crook, N. A., Mueller, C. K., Sun, J., and Dixon, M.: Nowcasting thunderstorms: A status report, B. Am. Meteorol. Soc., 79, 2079, https://doi.org/10.1175/1520-0477(1998)079<2079:NTASR>2.0.CO;2, 1998.
Xu, G. and Chandrasekar, V.: Operational feasibility of neural-network-based radar rainfall estimation, IEEE Geosci. Remote Sens. Lett., 2, 13–17, https://doi.org/10.1109/LGRS.2004.842338, 2005.