the Creative Commons Attribution 4.0 License.
the Creative Commons Attribution 4.0 License.
 | 03 Sep 2019
Partitioning snowmelt and rainfall in the critical zone: effects of climate type and soil properties
John C. Hammond
Adrian A. Harpold
Sydney Weiss
Stephanie K. Kampf
Streamflow generation and deep groundwater recharge may be vulnerable to loss of snow, making it important to quantify how snowmelt is partitioned between soil storage, deep drainage, evapotranspiration, and runoff. Based on previous findings, we hypothesize that snowmelt produces greater streamflow and deep drainage than rainfall and that this effect is greatest in dry climates. To test this hypothesis we examine how snowmelt and rainfall partitioning vary with climate and soil properties using a physically based variably saturated subsurface flow model, HYDRUS-1D. We developed model experiments using observed climate from mountain regions and artificial climate inputs that convert all precipitation to rain, and then evaluated how climate variability affects partitioning in soils with different hydraulic properties and depths. Results indicate that event-scale runoff is higher for snowmelt than for rainfall due to higher antecedent moisture and input rates in both wet and dry climates. Annual runoff also increases with snowmelt fraction, whereas deep drainage is not correlated with snowmelt fraction. Deep drainage is less affected by changes from snowmelt to rainfall because it is controlled by deep soil moisture changes over longer timescales. Soil texture modifies daily wetting and drying patterns but has limited effect on annual water budget partitioning, whereas increases in soil depth lead to lower runoff and greater deep drainage. Overall these results indicate that runoff may be substantially reduced with seasonal snowpack decline in all climates, whereas the effects of snowpack decline on deep drainage are less consistent. These mechanisms help explain recent observations of streamflow sensitivity to changing snowpack and highlight the importance of developing strategies to plan for changes in water budgets in areas most at risk for shifts from snow to rain.
- Article
(7382 KB) - Full-text XML
-
Supplement
(847 KB) - BibTeX
- EndNote


Snowmelt is the dominant source of streamflow generation and groundwater recharge in many high-elevation and high-latitude locations (Regonda et al., 2005; Stewart et al., 2005; Earman et al., 2006; Clow, 2010; Jefferson, 2011; Furey et al., 2012). Soils modulate the partitioning of snowmelt into subsurface storage, deep drainage, evaporative losses, and surface runoff. Snow persistence, the fraction of time with snow cover, shows declines around the globe (Hammond et al., 2018b), and these snow losses may lead to changes in water input magnitude and timing (Harpold et al., 2015; Musselman et al., 2017; Harpold and Brooks, 2018). As areas of “at risk snow” become more apparent (Nolin and Daly, 2006), there is an urgent need for mechanistic studies that quantify the partitioning of snowmelt in the critical zone among vapor losses, surface flow, and subsurface flow and storage (Brooks et al., 2015; Meixner et al., 2016).
Changes in precipitation phase from snow to rain can modify hydrological partitioning by altering the timing and rate of inputs. Daily snowmelt rates typically do not reach the extreme intensities of rainfall (Yan et al., 2018), meaning that most areas (i.e., the Cascades) are predicted to receive more intense water inputs with more winter rainfall, whereas some other areas (i.e., Southern Rockies) will likely experience a decline in input intensity with snow loss (Harpold and Kohler, 2017). Warmer areas like the maritime western US may experience near complete loss of snowpack as snow fully transitions to rain by the end of the 21st century (Klos et al., 2014). Unlike rainfall, which is typically episodic, snow can accumulate over time and melt as a concentrated pulse of soil water input (Loik et al., 2004). This means that at 7 to 30 d scales snowmelt inputs are of greater magnitude than rainfall (Harpold and Kohler, 2017). Concentrated snowmelt can lead to a large proportion of runoff and deep drainage (Earman et al., 2006; Berghuijs et al., 2014; Li et al., 2017). With climate warming, future snowmelt rates may be reduced in many areas because earlier melt occurs when solar radiation is lower (Musselman et al., 2017). Along with warmer temperatures, increasing atmospheric humidity is leading to more frequent mid-winter melt events in humid regions yet increased snowpack sublimation and/or evaporation in dry regions (Harpold and Brooks, 2018). Given the considerable heterogeneity in climate, soils, topography, and vegetation across mountain ranges, the water budgets of different locations respond unevenly to a loss of snow.
Water inputs from rain or snowmelt during periods of low potential evapotranspiration and high antecedent moisture conditions are more likely to generate runoff and deep drainage (Molotch et al., 2009). Prior research has shown that near-surface soil moisture response is closely related to snow disappearance (Harpold and Molotch, 2015; Webb et al., 2015; Harpold et al., 2015), with strong links between snowmelt and soil moisture dynamics at multiple spatial and temporal scales (Loik et al. 2004; Williams et al. 2009; Blankinship et al. 2014; Kormos et al., 2014; Harpold and Molotch, 2015; Webb et al., 2015; Kampf et al., 2015). Earlier snow disappearance can lead to lower average soil moisture conditions not as conducive to streamflow generation as later snowmelt (Kampf et al., 2015; Harpold, 2016). The effects of earlier snowmelt on soil moisture dynamics may also vary with precipitation after snowmelt. Late-spring precipitation can overwrite the signal of earlier snowmelt timing on spring and summer soil moisture (Liator et al., 2008; Conner et al., 2016), whereas a lack of spring and summer precipitation can cause effects of earlier snowmelt on soil moisture to persist longer (Blankenship et al., 2014; Harpold, 2016). A transition to earlier, slower, and lesser snowmelt may increase overall evapotranspiration losses (Kim et al., 2016; Foster et al., 2015; Trujillo et al., 2012) while simultaneously decreasing the water use efficiency of conifer forests during snowmelt (Knowles et al., 2018). However, even at a well-studied location in Colorado the projected effects of shifts from snow to rain on tree water use and carbon uptake differ between modeling (Moore et al., 2008; Scott-Denton et al., 2003) and observational studies (Hu et al., 2010; Winchell et al., 2016).
Both surface runoff and deep drainage are affected by soil texture, soil depth, rooting depth (Cho and Olivera, 2009; Seyfried et al., 2005), and topography. These properties have limited variability over time spans of hydrologic analysis and can produce temporally stable spatial patterns of soil moisture, where some parts of the landscape are consistently wetter than others (Williams et al., 2009; Kaiser and McGlynn, 2018). Aspect modifies the snowpack energy balance, leading to higher sustained soil moisture content on north-facing slopes compared to south-facing slopes with the same input (in the Northern Hemisphere; Williams et al., 2009; Hinckley et al., 2014; Webb et al., 2015, 2018). Landscape evolution may lead to deeper profiles and more deeply weathered rock due to wetter conditions on north-facing slopes, making these slopes more conducive to deep drainage in some locations (Hinckley et al., 2014; Langston et al., 2015). Where soils are shallow, winter precipitation may exceed the soil storage capacity, leading to both runoff generation and deep drainage (Smith et al., 2011). Deeper soil profiles have greater storage capacity, which can sustain streamflow, even with snow loss; however, given consecutive years of low input these profiles will be depleted of storage, leading to lower flows (Markovich et al., 2016). Deeper soils can also help sustain transpiration during the late spring and summer, when shallow soils have dried (Foster et al., 2016; Jepsen et al., 2016). Streamflow can be insensitive to inputs under dry conditions, but respond rapidly once a threshold soil moisture storage value is exceeded (McNamara et al., 2005; Liu et al., 2008; Seyfried et al., 2009). McNamara et al. (2005) hypothesized that when dry-soil barriers are breached, there is sudden connection to upslope soils, leading to delivery of water to areas that were previously disconnected. In their semi-arid study area, such breaching of dry-soil barriers was only observed for periods of concentrated and sustained input from high-magnitude spring snowmelt. Together, the complex interactions of soil properties, antecedent conditions, water inputs, and evaporative demand make it challenging to determine how changes from snow to rain affect hydrologic response even in idealized settings.
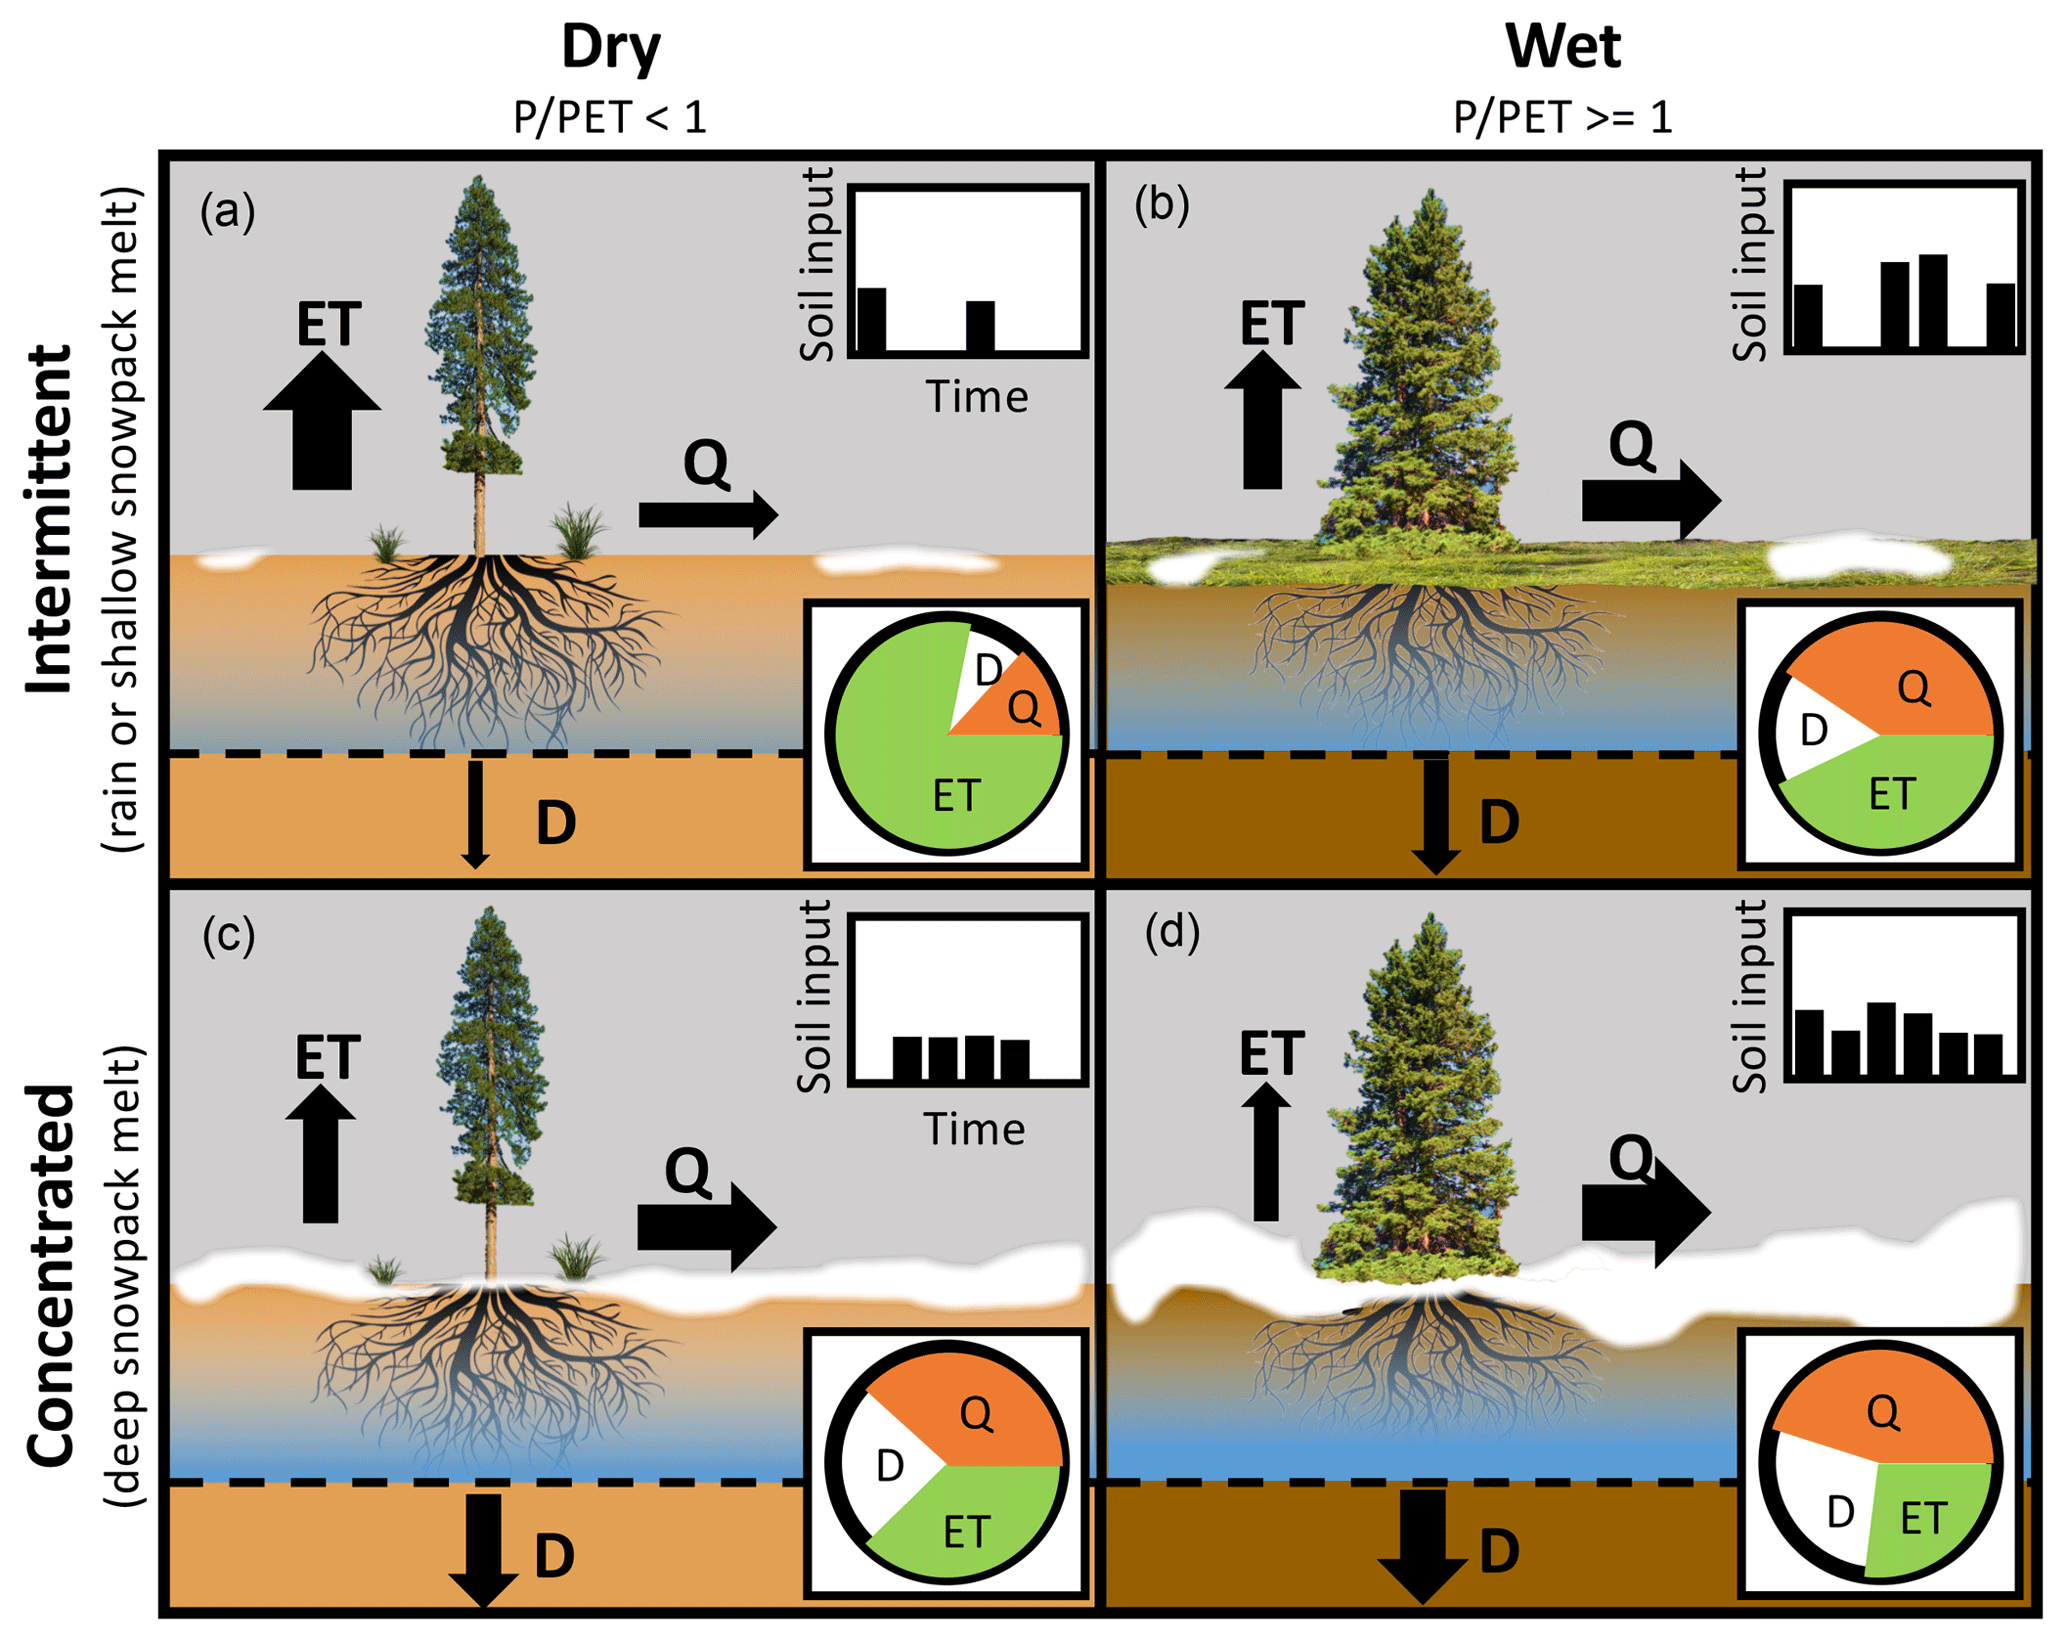
Figure 1Conceptual illustration of study hypotheses indicating the importance of concentrated snowmelt input (c, d) vs. intermittent input (a, b) for runoff generation. The wet climate (b, d) generates more runoff (Q) and deep drainage (D) and less evapotranspiration (ET) compared to the dry climate (a, c). In both climates, concentrated input can increase both Q and D because it is more likely to allow soil saturation than intermittent input, which allows ET during periods of drying. The concentrated input from snowmelt leads to greater increases in Q and D in the dry climate than in the wet climate because snowmelt is the most likely cause of soil saturation in dry climates.
The goal of this study is to improve our understanding of how changes in precipitation phase from snow to rain affect hydrological partitioning in a one-dimensional (1-D) representation of the critical zone. Partitioning of precipitation input, P, can be into runoff, Q, defined as lateral export of water from the domain, evaporation, E, transpiration, T, deep drainage below the root zone, D, and storage within the soil root zone, ΔS. Throughout this study, the term runoff refers to non-infiltrated input that exits the domain laterally due to infiltration or saturation excess mechanisms. Over a given time increment, partitioning can be tracked using the water balance (Eq. 1).
We address the following questions: (1) are snowmelt and rain partitioned differently between Q, ET, and D? And (2) how is snowmelt and rain partitioning affected by climate, soil type, and soil depth? We use a physically based 1-D modeling approach to address these questions and systematically test hypotheses about hydrologic response to snow loss. The 1-D modeling approach allows for isolated comparison of climatic and edaphic factors on input partitioning; it is a simplified approach that neglects lateral redistribution of water.
We hypothesize that reducing the fraction of precipitation falling as snow leads to lower runoff and deep drainage because it reduces the concentration of input in time (Fig. 1). Concentrated input during melt of a seasonal snowpack often saturates soils, causing saturation excess runoff and deep drainage below the root zone (Hunsaker et al., 2012; Kampf et al., 2015; Webb et al., 2015; Barnhart et al., 2016). Diffuse input over time reduces the likelihood of saturation because it allows more water redistribution and evapotranspiration between inputs. We also hypothesize that snowmelt is critical for runoff generation and deep drainage in dry climates and deep soils, where snowmelt is the dominant cause of soil saturation (McNamara et al., 2005; Tague and Peng, 2013), whereas the partitioning of rain and snowmelt may be more similar in wet climates and shallow soils, which are more frequently saturated by either rain or snowmelt inputs (Loik et al., 2004) (Fig. 1).
To evaluate soil moisture response to rainfall and snowmelt over a wide range of climate and soil conditions, we used HYDRUS-1D (Šimůnek et al., 1998), a physically based finite-element numerical model for simulating one-dimensional water movement in variably saturated, multi-layer, porous media.
2.1 Study design, site selection, and data sources
We utilized daily input data from five United States Department of Agriculture Natural Resources Conservation Service (NRCS) snow telemetry (SNOTEL) sites in each of three regions that span a wide range of climate and snow conditions: the Cascades, Sierra Nevada, and Uinta mountains, for a total of 15 sites. Daily rather than hourly data were chosen to limit the effects of missing and incorrect values on the analyses. The three regions were chosen to represent dominant climate types in the western US, and within each region, sites were selected to span a snow persistence (SP) gradient, where SP is the mean annual fraction of time that an area is snow covered between 1 January and 3 July (Moore et al., 2015) (Fig. 2a, Table 1).
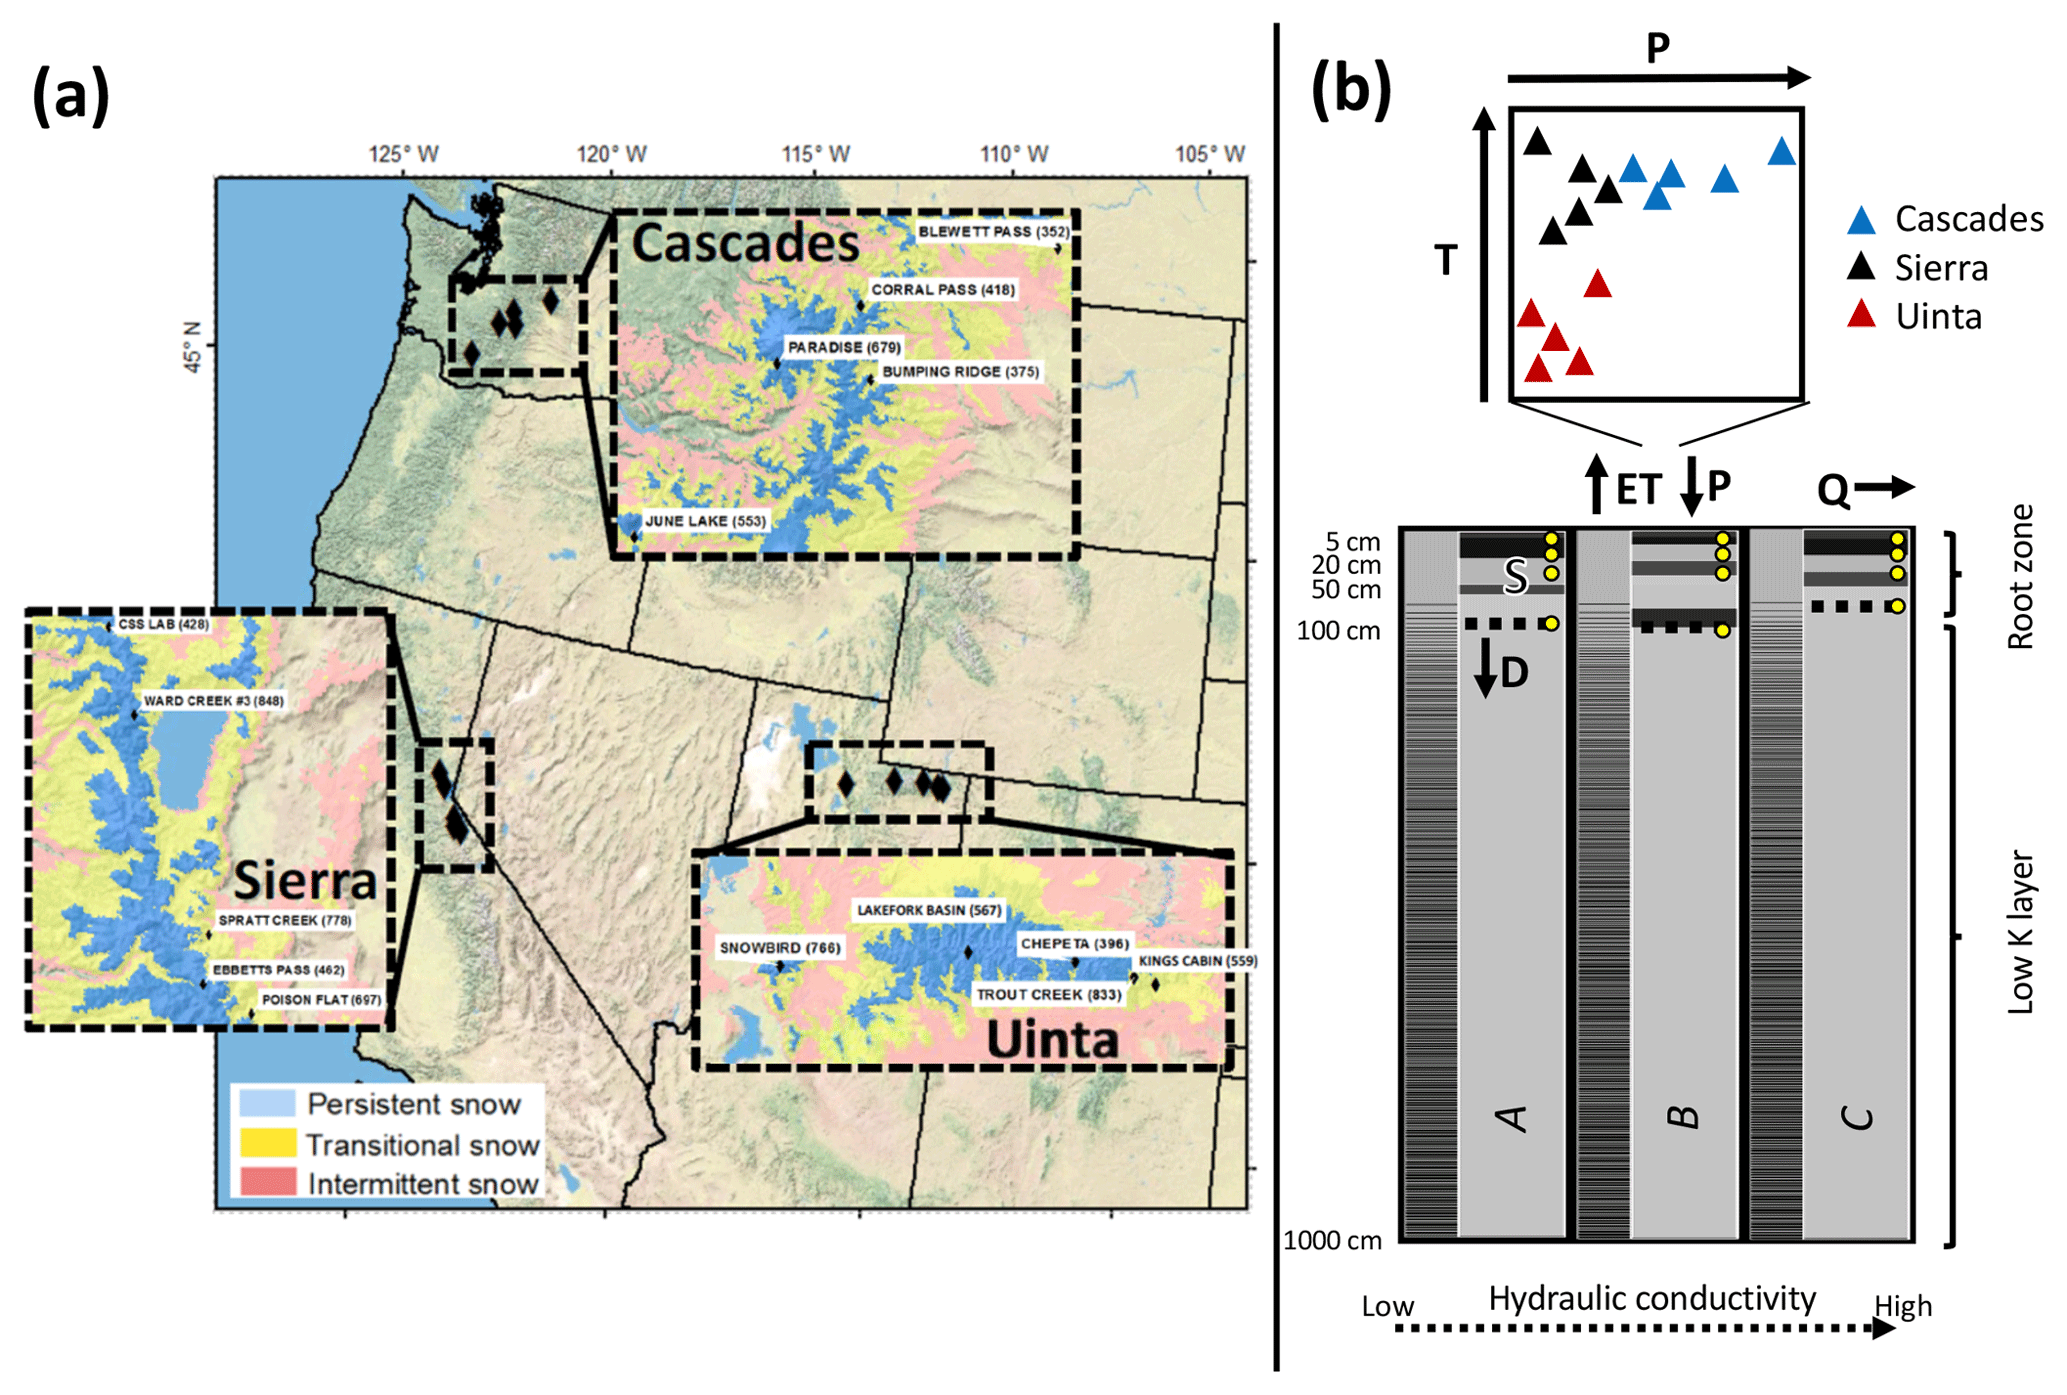
Figure 2(a) SNOTEL sites utilized for climate scenarios in this study with insets displaying snow zones classified by mean annual snow persistence (Moore et al., 2015). (b) Modeling domain layout with yellow points showing 5, 20, and 50 cm depths where volumetric water content time series were used for model calibration. The deepest yellow point is the depth where time series were extracted to calculate deep saturation. Symbols in the graph above the discretized soil profile represent the range of climate scenarios used plotted by mean annual precipitation (P) and mean annual temperature (T), and the three soil profiles below represent the soil parameter sets labeled with italicized capital letters: (a) loam, (b) sandy clay loam, and (c) sandy loam. Different layers in each soil profile are represented as shades of gray; shading does not indicate any property of the soil layer.
Table 1SNOTEL station properties including the start and end of data records, site elevation, and mean annual climatic characteristics: precipitation (P), temperature (T), snow persistence (SP, %), and aridity index (P∕PET).

With each climate scenario we simulated vertical profiles of volumetric water content (VWC), which were depth-integrated to compute soil moisture storage (S). For these simulations deep drainage (D) is any flux of water downward below the root zone. Runoff (Q) is any water that does not infiltrate into the soil, either because of saturated conditions or because input rates exceed infiltration capacity. Evaporation (E) is direct evaporation from the soil, and transpiration (T) is mediated by plant roots. For this study, these values are combined into evapotranspiration (ET) to represent the bulk loss of water to the atmosphere.
Daily precipitation (P), snow water equivalent (SWE), and volumetric water content (VWC) at 5, 20, and 50 cm were obtained for each SNOTEL site using the NRCS National Weather and Climate Center (NWCC, 2016) Report Generator (Table 1). The records were quality controlled to ensure reasonable precipitation, SWE, and VWC values as in Harpold and Molotch (2015). Unrealistic values were removed (i.e., negative SWE and VWC below zero or above unity); all daily VWC outside of 3 standard deviations from the mean were removed, and a manual screening was performed on VWC data to identify shifts and other artifacts not captured by the first two automated procedures. Daily potential evapotranspiration (PET) was extracted from daily gridMET (Abatzoglou, 2013) for the 4 km pixel containing each SNOTEL site. This product uses the ASCE Penman–Monteith method to compute PET.
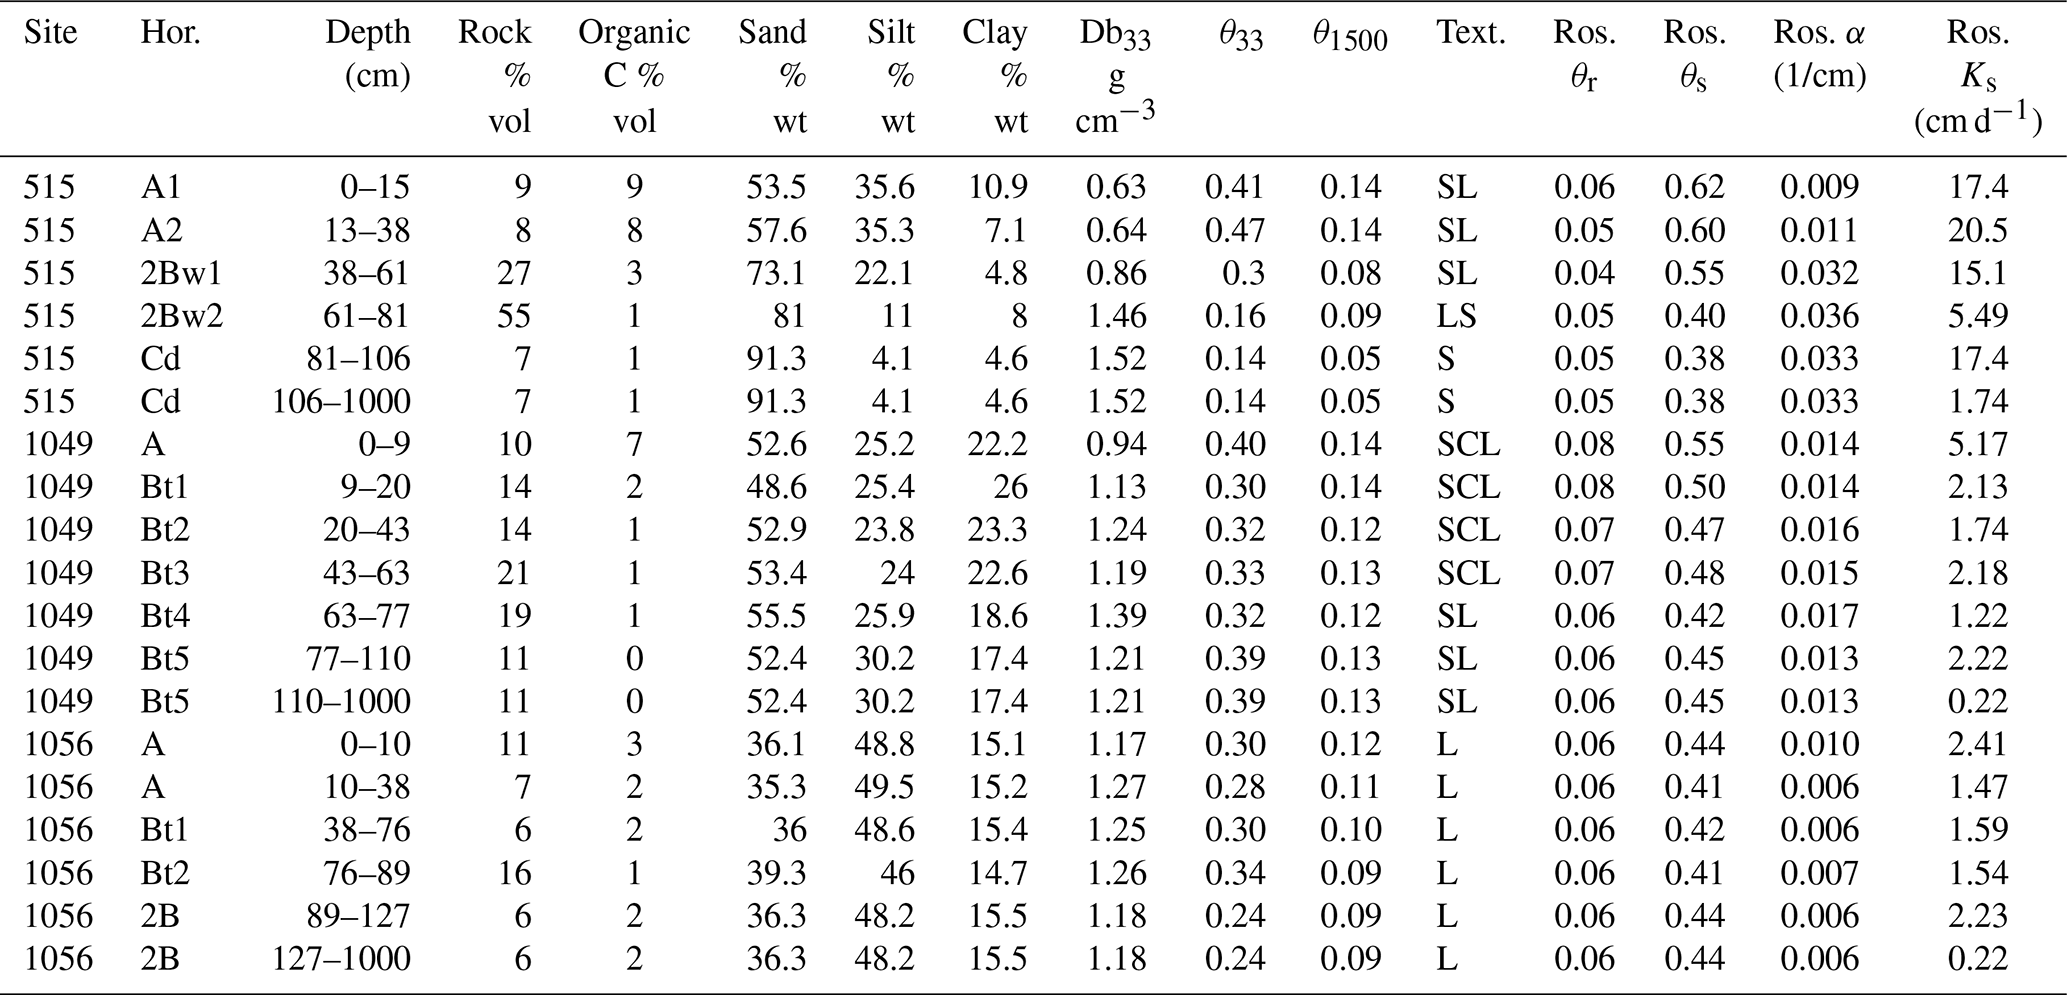
We chose three SNOTEL sites (432 Currant Creek, 698 Pole Creek R.S., 979 Van Wyck) to represent soil profile characteristics. While 365 of the 747 SNOTEL sites in the western US have soil moisture sensors, only a fraction of these sites have detailed soil profile data. The sites with soil profile data have information obtained from soil samples taken in the soil pits and processed in the NRCS Soil Survey Laboratory in Lincoln, NE, for texture, water retention properties, and hydraulic conductivity. We obtained detailed soil profile data in the form of pedon primary characterization files from the NRCS, and selected profiles (Fig. 2b, Table 2) that represent the range of soil textures and hydraulic conductivity values present at SNOTEL locations. Each had detailed NRCS pedon primary characterizations to depths greater than 100 cm and >15 years of daily soil moisture records at 5, 20, and 50 cm depths.
Table 2Soil profile properties derived from NRCS pedon reports and the ROSETTA (Ros.) neural network. Columns are SNOTEL site, soil profile horizon, depth range of horizon, rock percent of sample volume, organic carbon percent of sample volume, sand percent of sample weight, silt percent of sample weight, clay percent of sample weight, Db33 bulk density of soil sample desorbed to 33 kPa, θ33 volumetric water content at field capacity, θ1500 volumetric water content at wilting point, soil texture, residual volumetric water content θr, saturated volumetric water content θs, pore size distribution parameter α, and Ks saturated hydraulic conductivity. The lowest horizon Ks value was calibrated. Soil textures abbreviated as follows: sandy loam (SL), sand (S), loamy sand (LS), sandy clay loam (SCL), and loam (L). SNOTEL 515, Harts Pass, WA, SNOTEL 1049, Forestdale Creek, CA, SNOTEL 1056, Lightning Ridge, UT.
2.2 Simulations
In HYDRUS-1D, we simulated water flow and root water uptake for a vertical domain 10 m deep (Fig. 2b). The domain was discretized into 500 nodes with higher node density near the surface (∼0.15 cm for the top 5 to ∼5 cm for the bottom of the profile). For the surface boundary, we used a time-variable atmospheric boundary condition, which allows specification of input (snowmelt and rain) and potential evapotranspiration (PET) time series. Runoff can also be generated at the surface boundary. For the lower boundary, we allowed free drainage from the bottom of the soil profile at 10 m. Surface soil water input was calculated by totaling snowmelt and rainfall input at the daily time step from SNOTEL precipitation and SWE values. Melt was computed for any day when SWE decreased; if SWE decreased, and the precipitation was greater than 0, total soil water input was assumed to be melt plus precipitation. The atmospheric boundary condition requires PET, leaf area index (LAI), and a radiation extinction coefficient used in the estimation and separation of potential evaporation and transpiration. We assigned a constant LAI of 3, as this value generally fits the mixed conifer forests (Jensen et al., 2011) where SNOTEL sites are installed. We assumed a radiative extinction coefficient of 0.39, which is the default value. Root water uptake in the model was estimated using Feddes parameters for a conifer forest (Lv, 2014: h1=0 cm, h2=0 cm, cm, cm, cm, cm d−1, cm d−1), with roots uniformly distributed from the soil surface to the interface with a lower hydraulic conductivity layer, as we lacked any more detailed information on root distribution or soil depth at these sites.
We created soil layers with depths and textures taken from the NRCS soil pedon measurements. From this information we applied the neural network capability of HYDRUS-1D, which draws from the USDA ROSETTA pedotransfer function model (Schaap et al., 2001), to determine soil hydraulic parameters. Using the NRCS pedon primary characterizations we input percent sand, silt and clay, bulk density, wilting point, and field capacity. The neural network model then estimates soil hydraulic parameters based on these inputs. Below the depth of the soil pedon measurements, we configured the simulations to have a deep “bedrock” or regolith layer with lower saturated hydraulic conductivity (Ks) but the same water retention parameters as the layer above. Any water entering this lower layer is considered deep drainage. The hydraulic conductivity of this lower layer was set at one-tenth that of the layer above. This value was determined through iterative testing of Ks values (see Supplement). We extended the “bedrock” or regolith layer to 10 m depth to allow for deep drainage to occur without boundary effects that could be caused by a shallower regolith. The initial VWC for all layers in each simulation was 0.2, and simulations were run with a year of surface boundary condition inputs to establish initial conditions. We tested the simulation configuration by comparing to observed VWC at 5, 20, and 50 cm depths for the three selected soil profile sites (Fig. S1, Table S1 in the Supplement). Rather than force fitting, our goal was to produce simulations with similar timing of wetting and drying to observations. This approach is consistent with other studies using HYDRUS-1D, which also started with basic soils data and application of the ROSETTA pedotransfer function (Scott et al., 2000) and then calibrated to observed water content measurements by adjusting permeability of the “bedrock” layer (Flint et al., 2008).
We applied climate scenarios from each of the 15 SNOTEL sites selected (Table 1) to each of the soil profiles to examine how climate and soil type affect partitioning. We then conducted additional experiments to modify inputs using just the loam profile. First, to examine whether snowmelt and rainfall are partitioned differently, we changed all precipitation to rain and compared the simulation output to those with the original climate data. Second, to examine the effects of input concentration, the temporal clustering of input through time, we artificially produced intermittent input (four 5-day periods of low magnitude) and concentrated input (one 20-day period of high magnitude) of the same annual total for one wet (559) and one dry (375) site using the loam profile (1056) for all years of data. Third, to examine how soil depth affects partitioning, we altered the depth of rooting zones to 0.5, 1.5, and 2 times their original depth. For 0.5 depth scenarios, we replaced soil layers deeper than 0.5 times the original depth with the bedrock/regolith layer. For 1.5× and 2× scenarios, the layer above bedrock/regolith was extended downward and the rooting zone extended to the new soil depth.
2.3 Analysis
Using the simulation results, we examined how rain and snowmelt were partitioned into soil storage (S), deep drainage (D), evapotranspiration (ET), and runoff (Q). Daily soil storage is reported as the total soil water within the rooting zone only, and D is any water passing below the rooting zone (106–127 cm depending on the soil profile). We assessed partition components both in units of length (cm) and as ratios to total input (unitless, e.g., Q∕P) at both event and annual timescales.
To analyze hydrologic partitioning at event timescale we defined rainfall events as days with precipitation while SWE equaled zero and snowmelt events for days with declining SWE and no simultaneous precipitation. To focus on differences between rainfall and snowmelt, only events with entirely rainfall or entirely snowmelt input were considered in this analysis; mixed events were excluded, though mixed input accounts for an average of 47 % of annual input across all sites and years (Table S6). Events could last as long as the conditions were continuously satisfied, and only those followed by at least 5 days of no input were used in analysis. Total depths of each variable were computed for each defined event time period. Input rain and snowmelt were summed over the event time period, and response variables (Q, ET, D) also included the day after the event ended to account for lag in event response. Antecedent S for each event was determined by taking the root zone storage from the day prior to the first event input.
At the annual scale, soil water input and partitioning components (rain, snowmelt, Q, ET, D) were totaled for each year and the change in water year storage (ΔS) determined by subtracting the values of S at the end of the year from the value at the beginning of the year. In addition to ΔS, mean saturation (Sat) at each observed depth was calculated as the average annual VWC divided by soil porosity. We use mean saturation (Sat) as an alternative to change in water year storage (ΔS) because mean saturation is much easier to quantify at a field site than root zone storage, and this extends the application of our study to other areas with daily VWC data. Sat also provides a measure of soil water conditions throughout the year as opposed to ΔS, which represents only changes between the start and end of the water year.
To characterize climate conditions at the mean annual scale, each site was classified as dry (precipitation deficit, PET > P) or wet (precipitation surplus, PET < P). This separation by aridity index is based on our hypothesis that the influence of concentrated snowmelt is greater in dry climates than in wet climates (Hammond et al., 2018a). We also report the maximum SWE and snowmelt fraction as the annual total snowmelt divided by annual total input. Following the methods for computing the precipitation concentration index (PCI), which represents the continuity or discrete nature of input through time (Martin-Vide, 2004; Raziei et al., 2008; Li et al., 2011), we computed the input concentration index (ICI) using snowmelt and rain input. When calculated with daily data on an annual basis, PCI commonly ranges between 0 and 100, where higher values correspond to precipitation that is irregularly spaced in time and low values correspond to precipitation evenly distributed throughout the year (Cortesi et al., 2012). Our use of the terms input concentration and the input concentration index refer to the temporal clustering of input in time and do not refer to the intensity of melt. Pearson correlation tests were conducted between explanatory variables (P, PET, P∕PET, peak SWE, average melt rate, and ICI) and dependent variables (Q, ET, D, mean saturation at 100 cm: Sat100).
Using both the event and annual results, we examined (1) whether partitioning of rainfall input differed from that of snowmelt input, and (2) how partitioning was affected by climate, soil texture, and soil depth. For question 1, we tested for differences in event partitioning between input type (rain or snowmelt) and differences in annual partitioning between historical and all rain scenarios using ANOVA. For question 2, we tested for differences in annual partitioning between climate (wet, dry) and soil depth groupings, also using ANOVA. Additionally, for question 2 we tested the pairwise difference in linear regression slopes using the regression with interaction test in JMP (SAS-based statistical software) to determine whether the rate of change between explanatory and response variables differed by climate or soil depth grouping. By comparing the slopes of regressions run on standardized data, it is possible to assess the influence of independent variables on dependent variables in different groupings. In this study, we use this test to assess the influence of snowmelt fraction of input and input concentration index on runoff and deep drainage response for all, wet, and dry groupings as well as soil texture groupings.
Simulations for each of the 15 climate scenarios exhibit substantial variability at the annual scale in precipitation (P), runoff (Q), and deep drainage (D) (Fig. 3). All regions have a wide range of annual P, but overall the highest P was in the Cascades region and lowest in the Uinta. The wide range of climate conditions simulated allows for an evaluation of climate effects on Q, ET, D, and Sat100 (Table S3). Annual precipitation (P) is positively correlated with runoff (Q, r=0.97), deep drainage (D, r=0.92), and Sat100 (r=0.73) (Table S3). The relationship is linear for Q but nonlinear for D and Sat100. Sat100 plateaus at ∼250 cm P with further P partitioned to Q instead of D. Evapotranspiration (ET) has the weakest correlations with P (r=0.08) of all partitioned components. Q∕P increases with P up to around 250 cm of P, and D∕P increases with P up to around 100 cm (Fig. 3). ET∕P decreases with precipitation, whereas ΔS∕P is unrelated to P. At values of P greater than around 300 cm, all variables have relatively consistent values even as P increases.

Figure 3(a) Annual runoff (Q), mean saturation at 100 cm depth (Sat100), deep drainage (D), and evapotranspiration (ET) vs. annual precipitation (P) classified by region and climate type. (b) Q∕P, ΔS∕P, D∕P, and ET∕P vs. P classified by region and climate type. Dry sites P∕PET ≤ 1, wet P∕PET > 1. Data from historical input scenarios for soil profile 1056, loam.
3.1 Snowmelt vs. rainfall and climatic influences on partitioning
Our first research question asks whether snowmelt and rainfall are partitioned differently. At the event scale, input rates are significantly greater on average for snowmelt than for rainfall in each of the three regions and for the full dataset (ANOVA p<0.0001, mean snowmelt 1.1 cm d−1, mean rainfall 0.9 cm d−1, Fig. 4), though rainfall events have a higher maximum input rate (maximum snowmelt 8.0 cm d−1, maximum rainfall 14.7 cm d−1). Snowmelt events tend to occur on wetter soils, as estimated by antecedent soil moisture storage for the rooting zone (ANOVA p<0.0001, mean S for snowmelt 56.6 cm, mean S for rainfall 48.2 cm). Average runoff ratios (Q∕P) are higher for snowmelt than for rainfall (ANOVA p<0.0001, mean Q∕P snowmelt 0.20, mean Q∕P rainfall 0.03), whereas ET∕P is lower for snowmelt as compared to rainfall (mean snowmelt 0.24, mean rainfall 0.40). Deep drainage responses are affected by longer timescales than single events, so we did not include these in the event analysis. This event analysis only considered binary snowmelt or rainfall events.
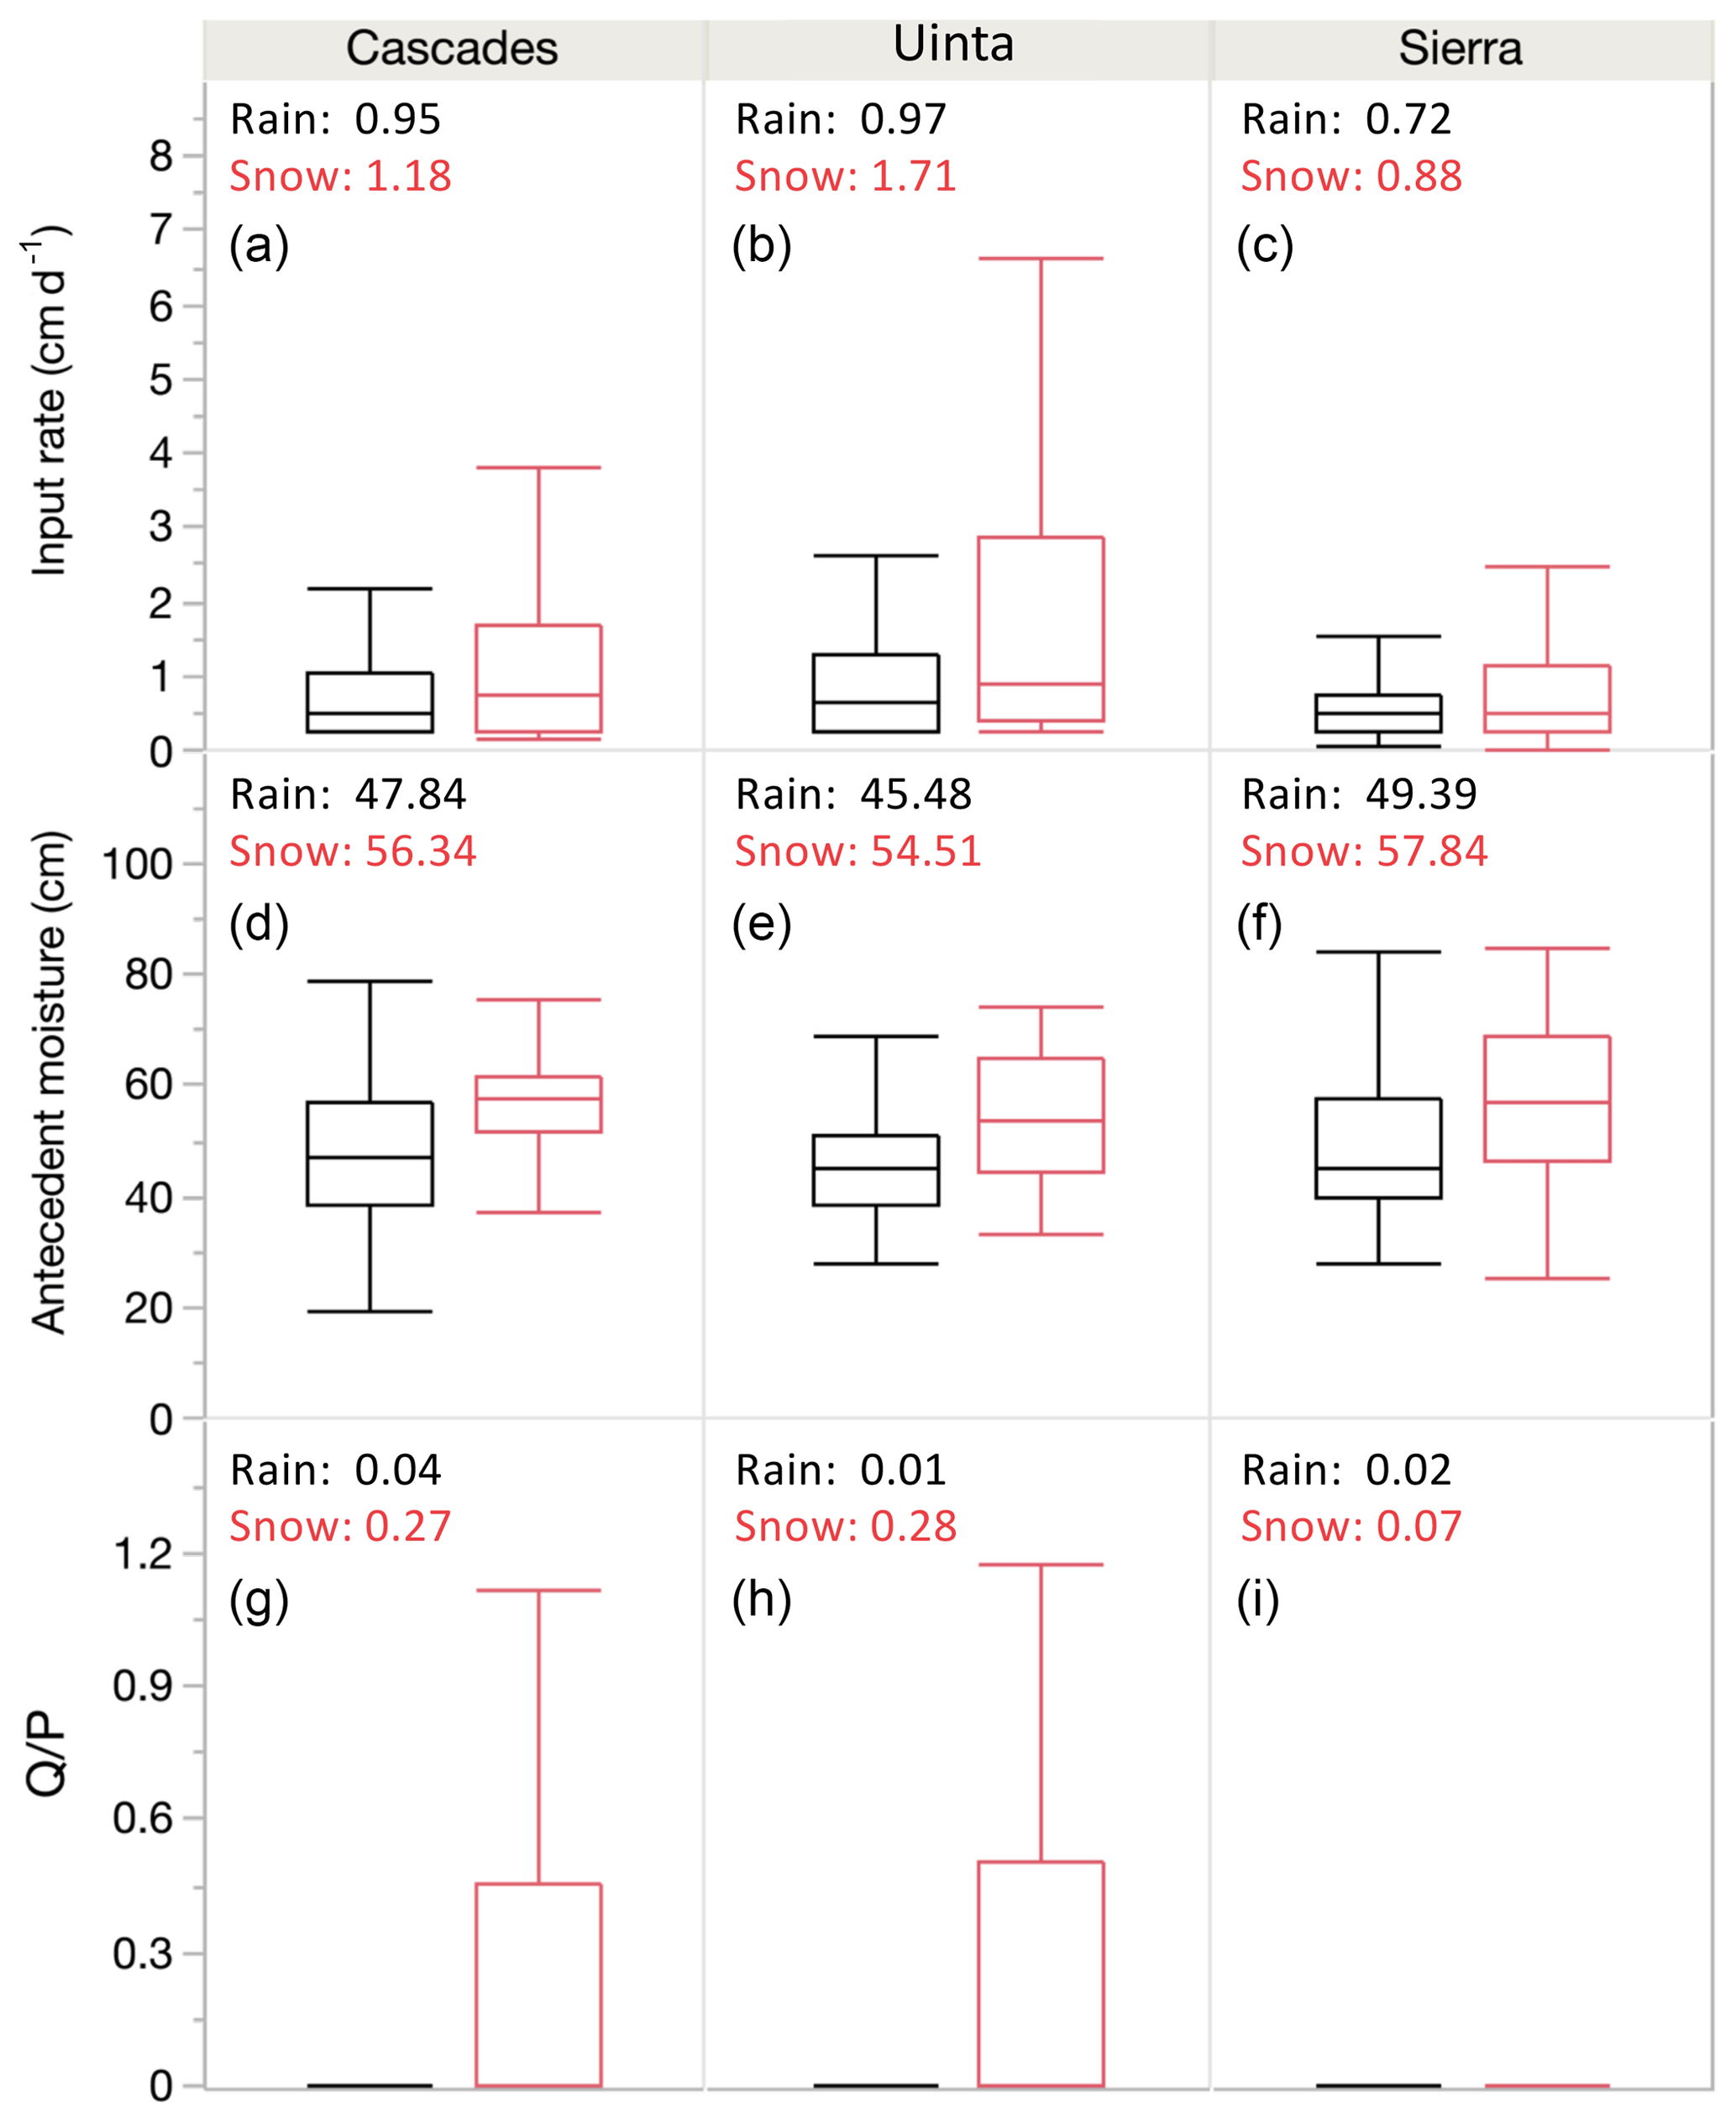
Figure 4Boxplots of event input rate (cm d−1) (a–c), antecedent soil moisture storage (S, cm) (d–f), and event runoff ratio (Q∕P, g–i) by region and event type (rain black, snowmelt red). The text in each subplot gives mean values. All ANOVA comparisons between values for rain and snowmelt have p values < 0.0001. Results from historical simulations on loam profile.
At the annual scale, input at all sites is a mixture of rain and snowmelt. To examine the importance of snow to partitioning, we used snowmelt fraction, defined as the fraction of snowmelt to total precipitation, and ICI. Snowmelt fraction and snow persistence are generally positively correlated with ICI at dry sites in the Uinta and Sierra, but this correlation declines with wetter sites in the Cascades (Fig. S7). Q∕P increases with snowmelt fraction (r=0.41), most noticeably where snowmelt fraction is >0.5, and increases with ICI (r=0.80) (Fig. 5). The ranges of Q∕P are higher in wet than in dry climates, though dry climates show greater rates of change with increasing snowmelt fraction and input concentration (Table S4). D∕P is somewhat correlated with snowmelt fraction (r=0.20) and ICI (r=0.43). D∕P ranges are higher in wet than in dry climates, and many years in dry climates do not generate D. ET∕P is not related to snowmelt fraction and generally declines with ICI (). Ranges are lower for wet climates, where greater input is partitioned to Q and D.
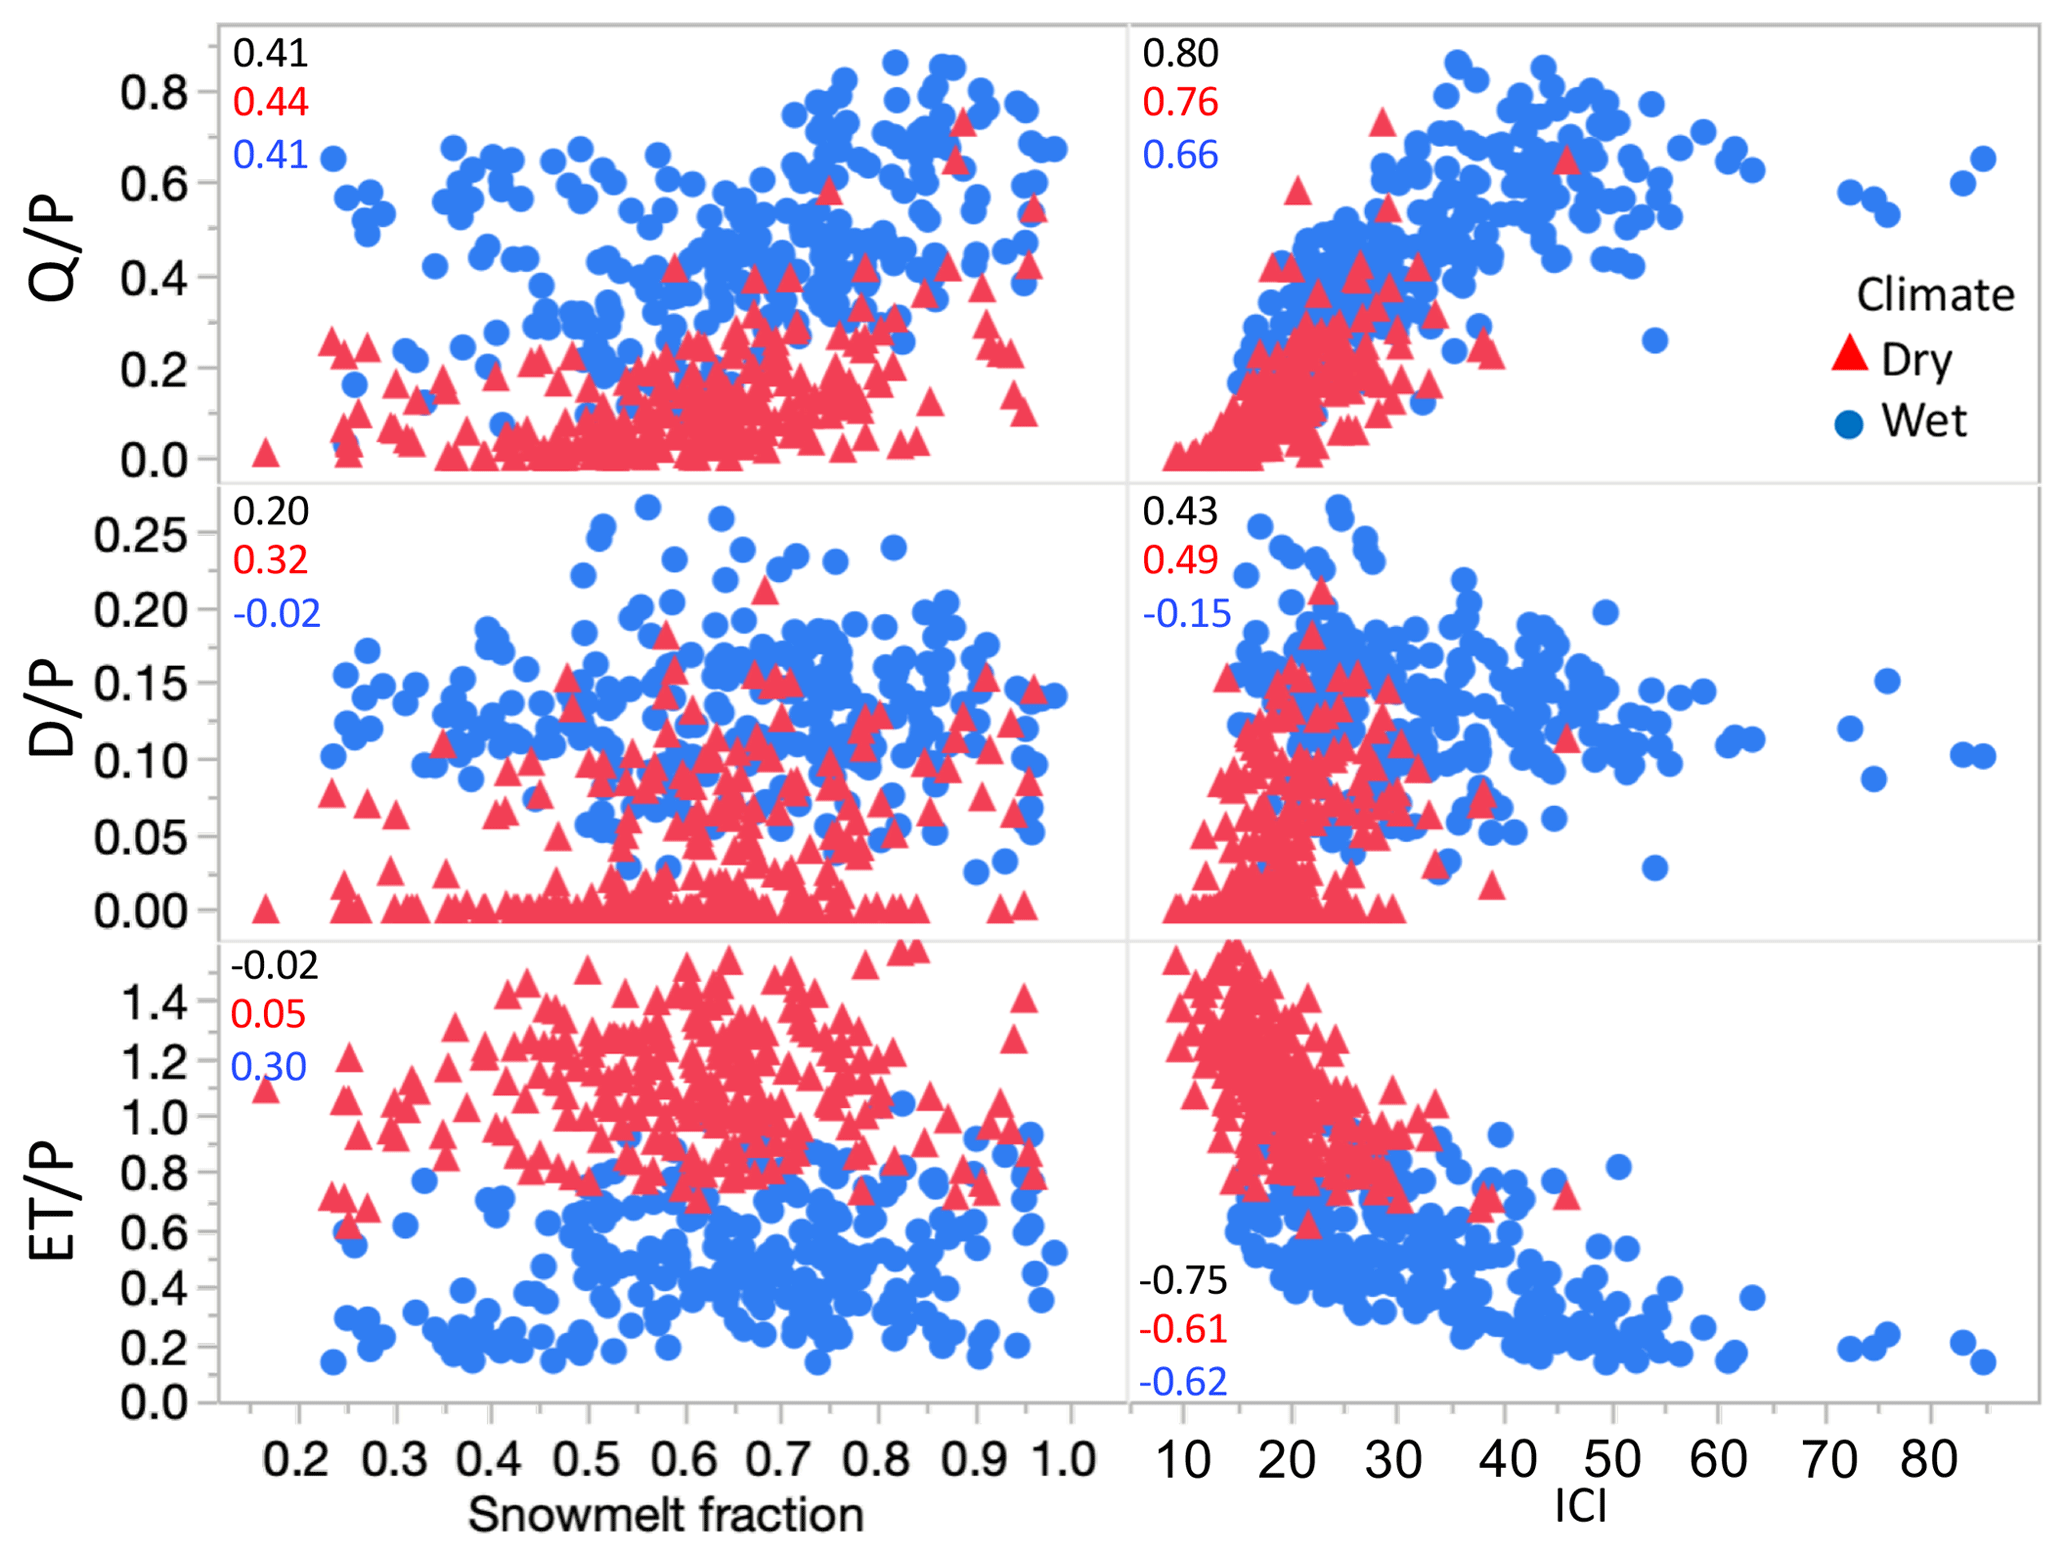
Figure 5Ratio of runoff (Q), deep drainage (D), and evapotranspiration (ET) to input (P) vs. snowmelt fraction of input and input concentration index (ICI) at the annual timescale. Data from historical simulations on loam profile. Dry sites P∕PET , wet P∕PET > 1. Correlation values between explanatory and dependent variables displayed in each panel colored by all (black), dry (red), and wet (blue) classifications. Correlation values also shown in Table S4.
We then compared the hypothetical scenarios where we treated all precipitation as rain to snow-dominated historical scenarios. All rain leads to significantly lower Q∕P (p<0.0001, all rain mean 0.17; historical mean 0.31) for both wet and dry sites (Table 3, Fig. 6). This partly relates to lower near-surface saturation in all rain scenarios. The mean fraction of annual runoff from saturation excess is 88 % when all input is rain as compared to 97 % with historical rain and snow input. All rain also leads to higher ET∕P for dry sites (p<0.0001, all rain mean 0.95; historical mean 0.83), lower D∕P for dry sites (all rain mean 0.01; historical mean 0.03), and higher D∕P at wet sites (p=0.011, all rain mean 0.14; historical mean 0.12) (Table 3, Fig. 6).
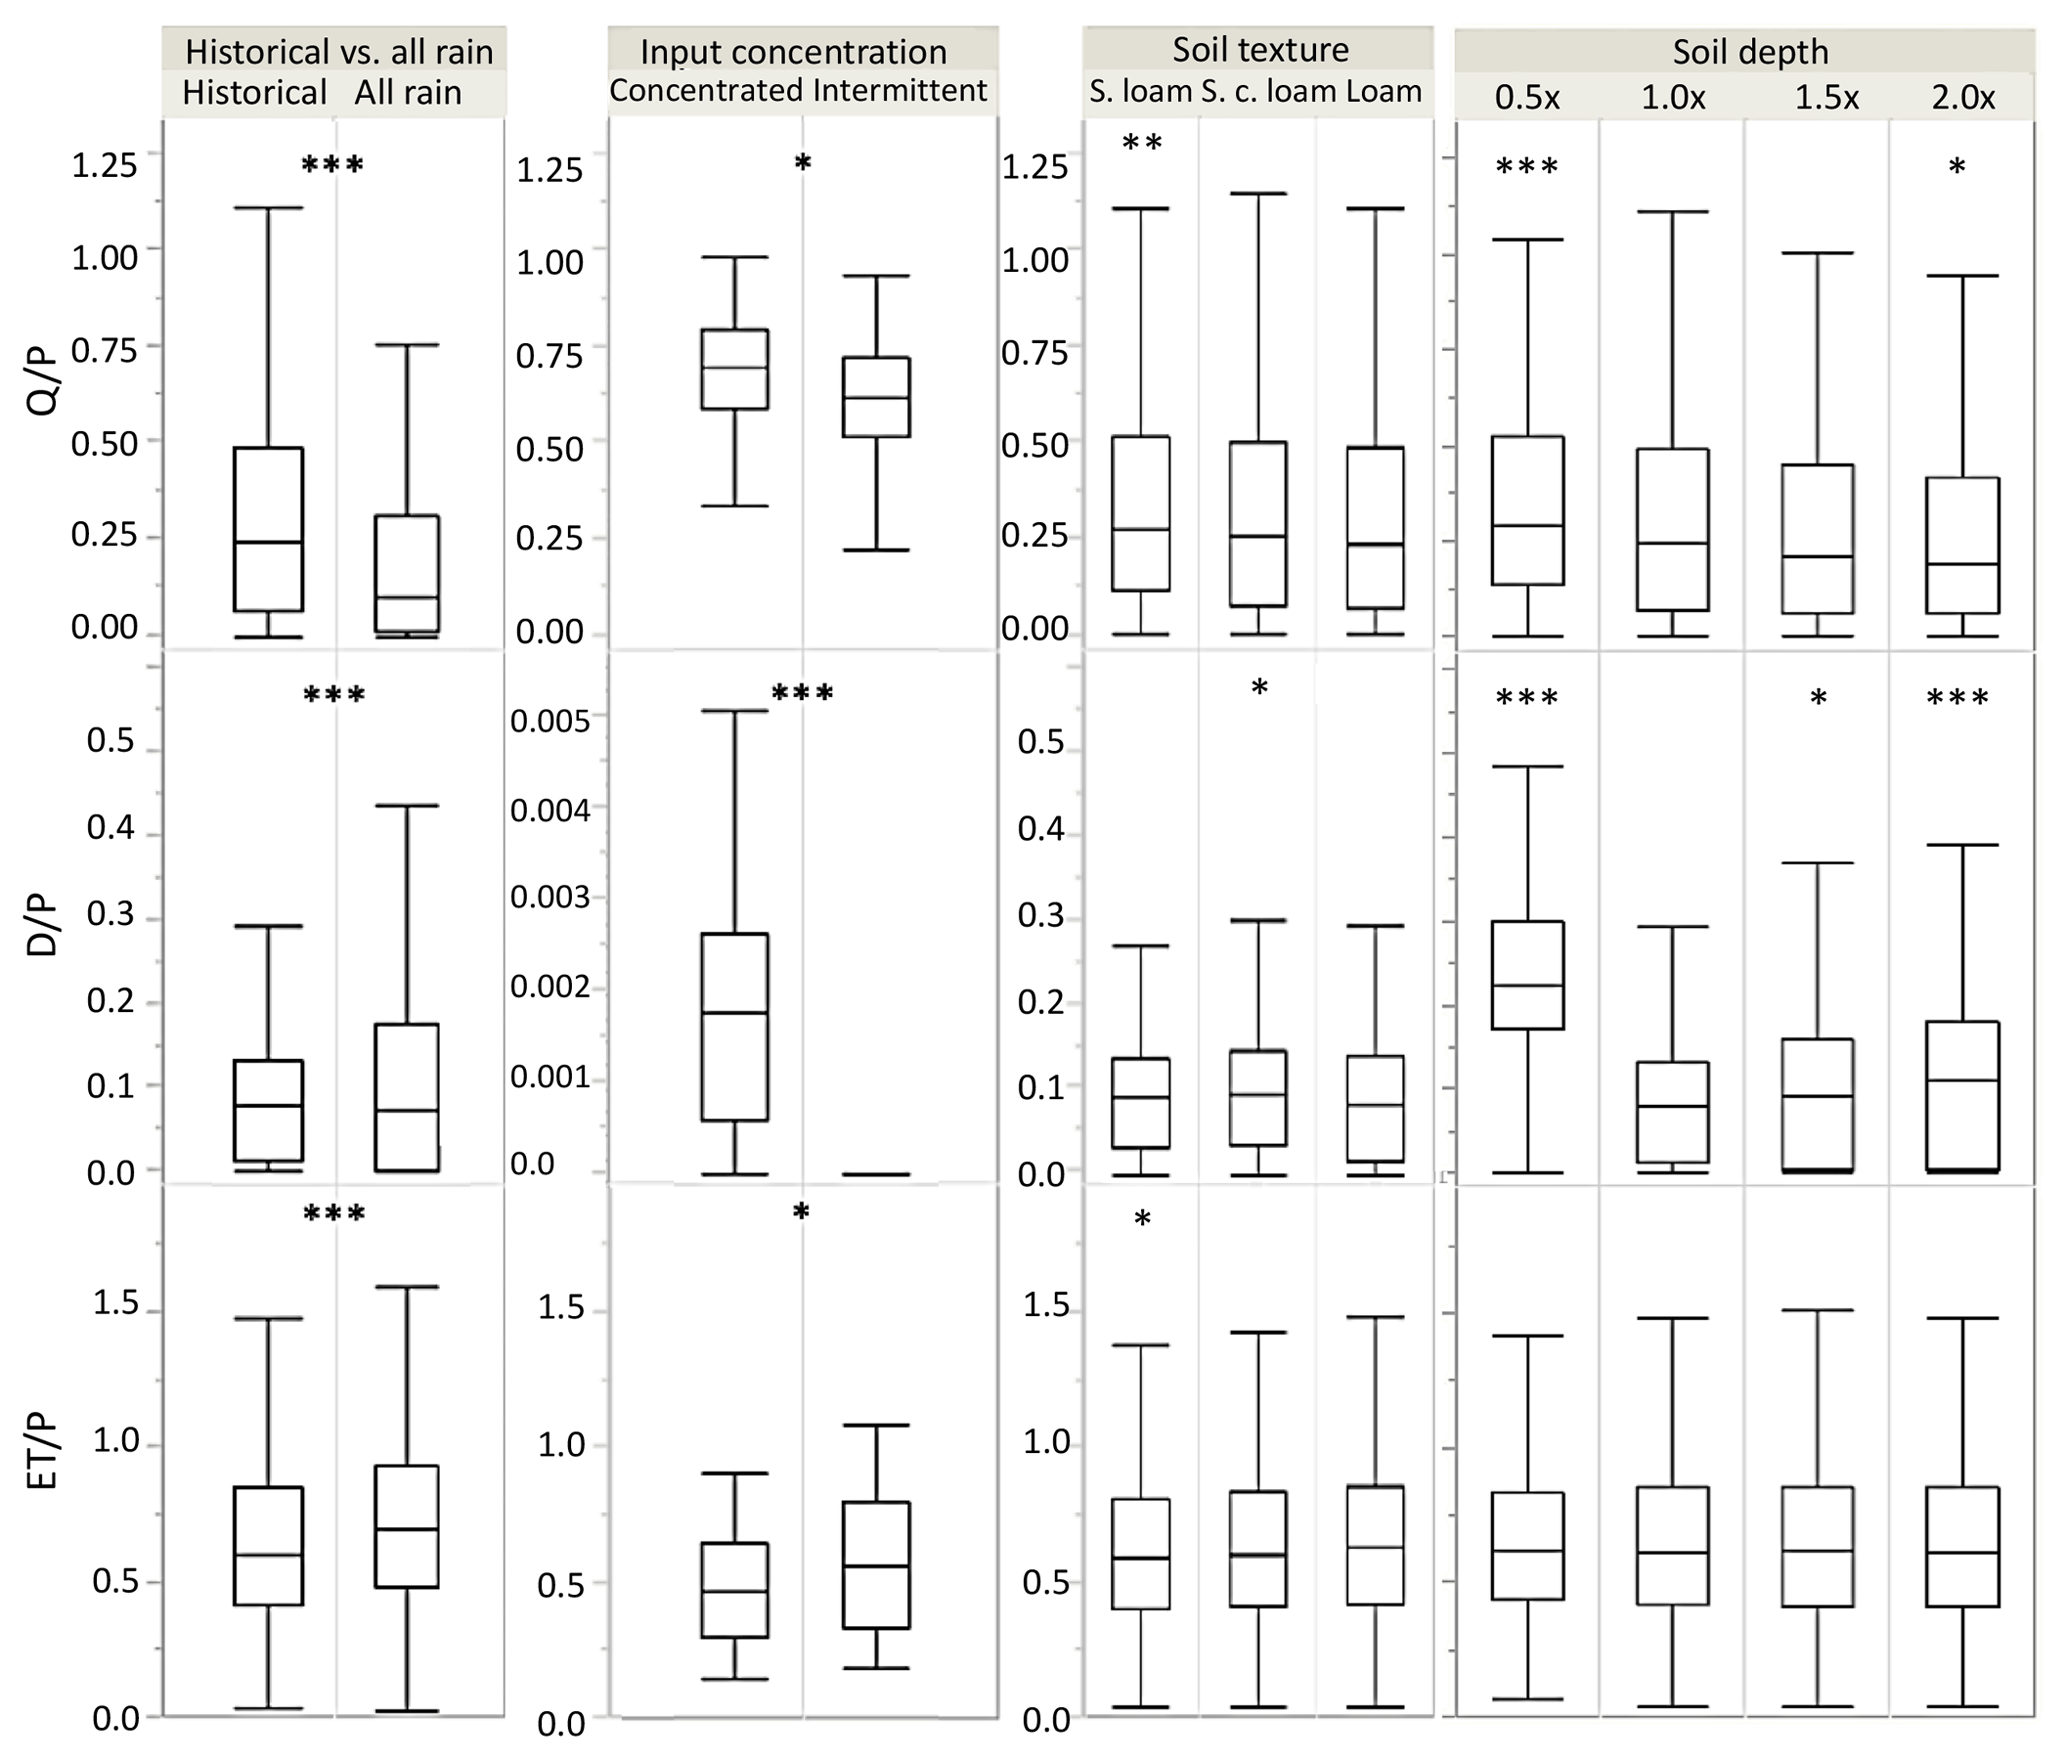
Figure 6Boxplots of Q∕P, D∕P, and ET∕P for four different experiments: historical vs. all rain input on loam soil and constant 1× depth, intermittent vs. concentrated input on loam soil and constant 1× depth, different soil textures with constant 1× depth, and different soil depths all with loam soil texture. Asterisks denote significance of ANOVA tests between groupings. P value of ANOVA, * <0.05, <0.01, and <0.001. Boxplots correspond to values in Table 3. Soil texture and soil depth scenarios are compared to 1× depth and loam texture profile for ANOVAs.
Table 3Mean values of unitless response variables Q∕P, D∕P, and ET∕P compared by climate type for four hypothetical scenarios: (1) historical vs. all rain input, (2) intermittent vs. concentrated input, (3) historical input on sandy loam, sandy clay loam, and loam profiles, and (4) historical input on 0.5×, 1×, 1.5×, and 2× original rooting zone depth. Dry sites P∕PET ≤ 1, wet P∕PET > 1. All scenarios in the table besides those explicitly altering soil texture use the loam profile (1056). Asterisks denote the significance of ANOVA tests between groupings of simulations and arrows show the direction of change relative to the base scenario: historical input on 1× depth profile with loam texture. P value of ANOVA, * <0.5, <0.01, <0.001. Boxplots correspond to values in Table 3.
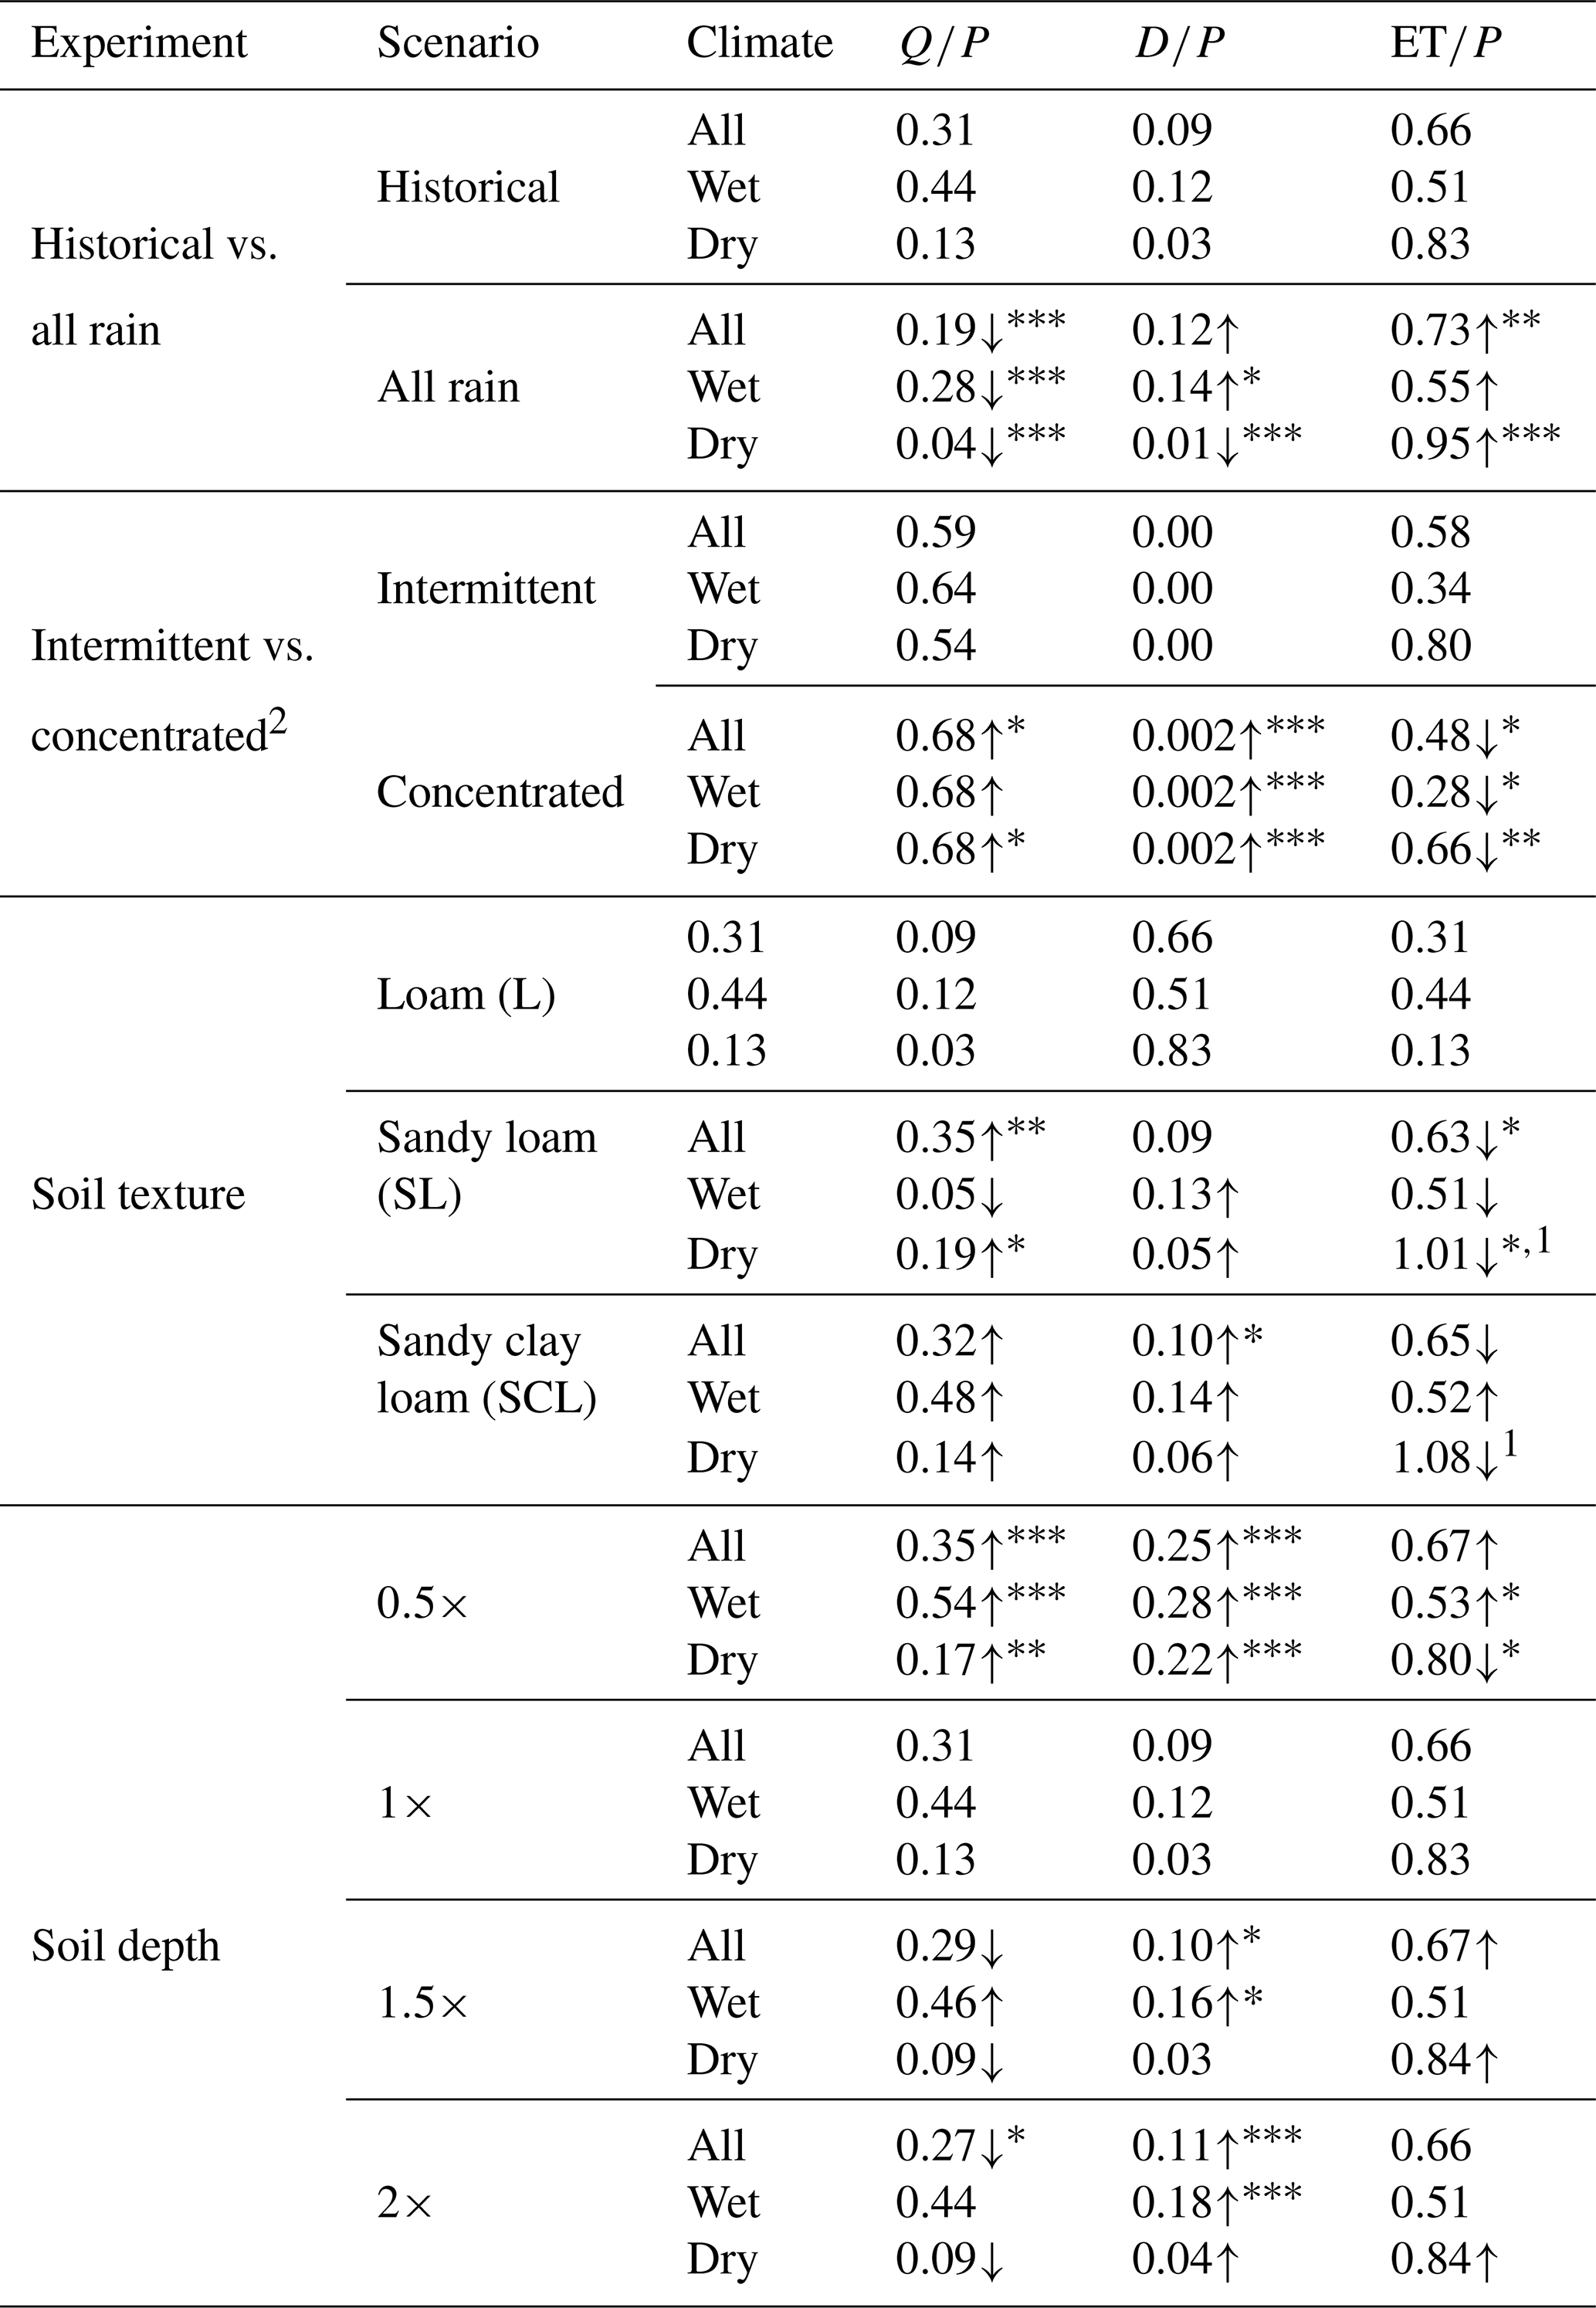
1 Values of ET indicate root uptake from soil storage for years with low input (Fig. S5). 2 For a dry site (375) and a wet site (559). Intermittent simulations have annual total input separated into four 5-day periods, whereas concentrated input simulations have all input in a 20-day period of high magnitude.
Another effect of snow loss can be a decrease in input concentration. Experimental scenarios with constant P separated into intermittent and concentrated inputs for a wet site (375) and a dry site (559) show that increasing input concentration leads to significantly greater Q∕P in the dry site (p<0.05, intermittent mean 0.54, concentrated mean 0.68, Table 3, Fig. 6) but no significant difference in the wet site. In contrast, D∕P is significantly greater (p<0.0001) for the concentrated input scenarios for both dry and wet sites, as no deep drainage is produced with intermittent input. ET∕P is significantly lower in concentrated input scenarios, with a greater difference in dry climates (p=0.004, mean intermittent 0.80 vs. concentrated 0.66) than in wet climates (p=0.013, mean intermittent 0.34 vs. concentrated 0.28).
3.2 Soil property influences on partitioning
Soil stores water that may later be partitioned into Q, ET, and D. Using Sat100 as an indicator of soil moisture storage, Fig. 7 displays the relationships between Q∕P, D∕P, and ET∕P vs. Sat100 as separated by climate type, soil texture, and root zone depth. Sat100 has strong relationships with Q∕P, D∕P, and ET∕P for all, wet, and dry sites (Fig. 7, Table S5). Q∕P is generally low (Fig. 7a, <0.3) until Sat100 is greater than >0.5. D∕P in the simulations also increases with Sat100, and many simulation years have limited D when Sat100<0.5. ET∕P generally decreases with saturation for Sat100 values >0.5.
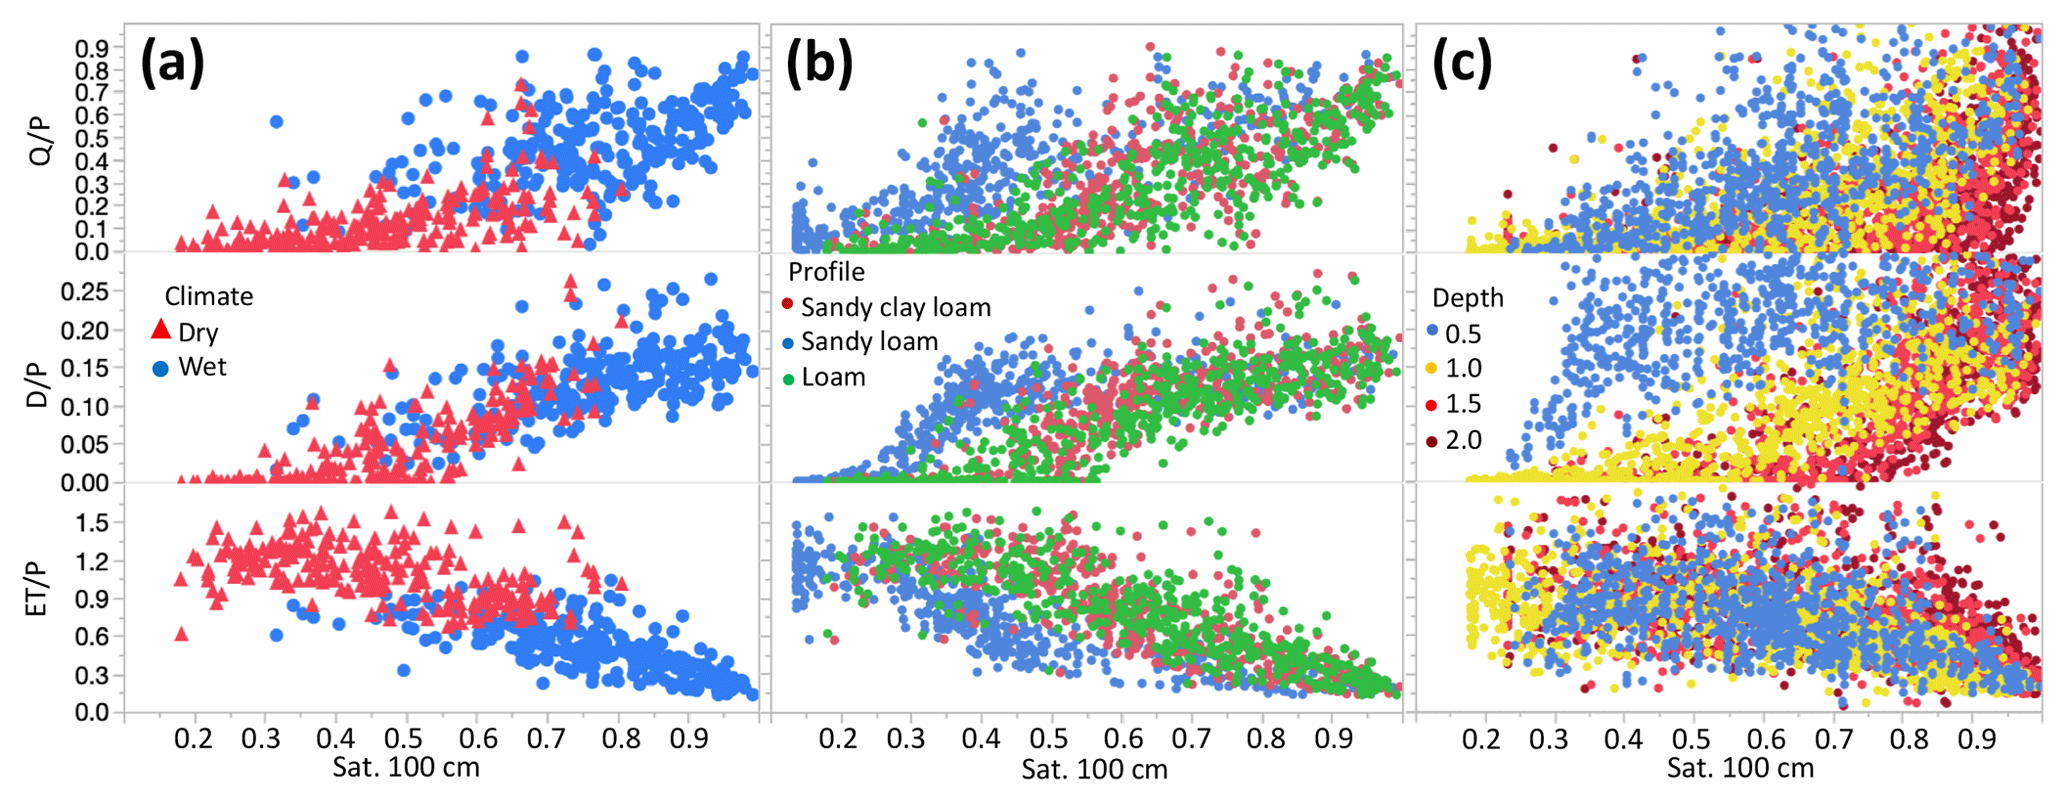
Figure 7(a) Annual surface runoff (Q), deep drainage (D), and evapotranspiration (ET) as a fraction of annual precipitation (P) vs. annual mean saturation at 100 cm depth (Sat100) and classified by climate type on the loam profile, dry sites P∕PET 1, wet P∕PET > 1. (b) The same variables displayed in (a) but classified by soil texture on three different soil profiles. (c) The same variables in A but classified by root zone depth on four different profiles of differing root zone depth. All simulations use historical input.
When these same relationships are separated by soil texture rather than wet/dry climate (Fig. 7b, Table S5), the response patterns are similar between soil types except for the sandy loam profile, which displays higher Q∕P and D∕P than the loam and sandy clay loam profiles at similar Sat100 levels. Differences between responses by soil texture are more evident at sub-annual timescales (Fig. 8a). For the example time period shown in Fig. 8a, the 100 cm depth in loam and sandy clay loam profiles wet up each spring during snowmelt 5 d prior to the sandy loam profile, and they generated deep drainage earlier and on more occasions than sandy loam due to higher water retention. The latter soils ultimately reached the highest annual D∕P values at higher Sat100 values, leading to more runoff generation via saturation excess, whereas the drier conditions in sandy loam led to more infiltration excess runoff. While this example time period and site display noticeable differences in cumulative response between soil textures, when the data for all sites and years are combined few significant differences in annual partitioning between soil textures emerge (Figs. 6 and 7).

Figure 8(a) Daily time series of cumulative runoff (Q), saturation at 100 cm depth (Sat100), and cumulative deep drainage (D) for SNOTEL site 698 input on SNOTEL site 515 (sandy loam), 1049 (sandy clay loam), and 1056 (loam) profiles. (b) Daily series for the same variables plotted for four depth scenarios 0.5×, 1×, 1.5×, and 2× original rooting zone depth.
To assess the influence of soil profile depths on partitioning, we altered the loam soil profile to be 0.5×, 1.5×, and 2× times its original depth (Fig. 6, Table 3). For historical input, Q∕P and D∕P are greatest for the 0.5× depth scenario, and Q∕P declines significantly with deeper soils for both dry and wet sites (p<0.0001), with the greatest declines between 0.5× and 1× (original) depth. D∕P declines significantly between 0.5× and 1× depth, and then increases slightly for all sites with subsequent increases in depth to 1.5× and 2× (Fig. 6, Table 3). Q∕P and D∕P differences by depth are significant between 0.5× and 1× depth, but not for all subsequent depth comparisons for all, wet, and dry site classifications (Table 3). In pairwise comparisons between depth scenarios Q∕P is only significantly different between 0.5× and 1× depth categories (p<0.0001). Changes in ET∕P with soil depth are not significant according to ANOVA tests.
Figure 8b displays daily time series of surface runoff, deep saturation, deep drainage, and cumulative deep drainage during an example period for the four different soil root zone depth scenarios. The shallowest rooting zone of 0.5× original depth produces the greatest surface runoff as well as cumulative deep drainage throughout the example period. Each depth reaches and remains at saturation for different amounts of time, with the shallowest profile reaching saturation earliest and remaining saturated longest, but also decreasing more rapidly to the lowest ending saturation. The deepest profile takes the longest to increase Sat100, not reaching as high a peak, yet remaining higher at the end of the period. Deep drainage begins earliest for the shallowest depth scenario, though reaching a lower daily flux than the original depth. Deep drainage from the 1×, 1.5× and 2× original depth scenarios lags behind the 0.5× scenario following the same succession as their Sat100 patterns. These patterns in daily Sat100 and deep drainage result in the highest cumulative deep drainage for the shallowest scenario.
4.1 Snowmelt as an efficient runoff generator and factors accentuating snowmelt efficiency
The initial hypotheses for this study were that runoff and deep drainage would be greater from snowmelt than rainfall and that snowmelt is more important to generating runoff and deep drainage in deep soils and dry climates than in shallow soils and wet climates. Our results indicate that snowmelt is an efficient runoff generator, though not necessarily an efficient generator of deep drainage. Deep drainage is less affected by input type because it is controlled by deep soil moisture patterns over longer timescales. Soil texture modifies daily wetting and drying patterns but has limited overall effects on annual partitioning, whereas increases in soil depth decrease runoff and increase deep drainage. Overall these results indicate that runoff may be substantially reduced with seasonal snowpack decline in all climates, whereas the effects of snowpack decline on deep drainage are less consistent. We expand on these key findings in the paragraphs below and suggest that areas in dry watersheds with storage similar to peak SWE may be most likely to experience reductions in deep drainage with continued slow loss.
Multiple lines of evidence confirm snowmelt as a more efficient runoff generator on average than rainfall. At event scale runoff efficiency was elevated for snowmelt because of the 22 % greater input rate and 17 % wetter soils than rainfall. This is consistent with previous studies showing that snowpack development and subsequent melt tend to occur when soils are at elevated moisture contents due to lower ET (Liu et al., 2008; Williams et al., 2009; Bales et al., 2011). The effects of snowmelt vs. rainfall are weaker at annual timescales (Fig. 5, Table S3) because these longer time periods include a combination of snow, mixed, and rainfall inputs in contrast to the event analysis in which we analyzed only events that were exclusively snowmelt- or rainfall-dominated. Forcing all input into the extreme case of all rain produces 67 % declines in runoff efficiency (dry: 0.13 vs. 0.04; wet: 0.46 vs. 0.29) (Table 3, Fig. 6), likely because the input becomes less concentrated in time for the all-rain scenario, allowing more ET. We also hypothesized that the effects of changing snowpacks would be greatest in dry climates, where soil saturation is less frequent. However, simulations suggest that both wet and dry climates are as likely to show reduced surface runoff with declining snow water inputs.
The effects of snow loss on D were not as consistent across our simulations as the effects on Q. Prior research has demonstrated strong seasonality in groundwater recharge, attributable to thresholds in input intensity (Jasechko and Taylor, 2015) and seasonal differences in evapotranspiration (Jasechko et al., 2014, 2017). We had hypothesized based on additional research (Hunsaker et al., 2012; Langston et al., 2015; Barnhart et al., 2016; Li et al., 2017; Hammond et al., 2018a) that input concentration along with evapotranspiration seasonality would be the primary reason for elevated Q and D from snowmelt relative to rainfall. In this study, changes from snow to rain both increased and decreased D∕P (Figs. 6 and S2), and D∕P was not correlated with either snowmelt fraction or ICI in wet climates. In general, Q∕P was greater than D∕P, and the D∕P response to changing input was weaker because S mediates the connection between input and D. In the 1-D model Q is affected by infiltration rate and near-surface storage and can more rapidly respond to input changes. In the simulations shown here once subsurface storage is zero, D will plateau, and Q will increase with further input due to the saturation excess mechanism. Although these processes were simulated in 1-D, they are consistent with observations of saturation excess overland flow documented in the elevation bands of many SNOTEL sites (Newman et al., 2004; Eiriksson et al., 2013; Kampf et al., 2015). In wet climates, D∕P is less affected by input type because conditions are more likely to be wet, regardless of whether input is snow or rain. D∕P is more affected by changes from snow to rain in dry climates, likely because of the role that concentrated snowmelt can play in allowing water to reach the base of the soil column.
Soil texture and depth generally did not change partitioning at the annual timescale as much as the varying climate scenarios (Fig. 6), with the exception of changes in the shallowest soils (1× depth to 0.5× depth results in 12 % Q increase and 180 % D increase). D∕P generally increased with increasing soil depth, demonstrating the importance of lower boundary conditions to shallow vs. deep partitioning. Altering soil profile depth and the associated root zone depth produced the largest effects on Q∕P and D∕P from 0.5× to 1× depth. The responsiveness of fluxes to changes in soil depth from 0.5 to 1× may relate to storage capacity relative to input. The soil depths ranged from 106 to 127 cm, which with a porosity of 0.4 gives a storage capacity of 42–51 cm, large enough to store the mean annual precipitation in some dry watersheds. When this storage is reduced by half to 21–25 cm, it is smaller than the mean annual precipitation at the wetter sites, increasing the likelihood of soil saturation that leads to D and Q. Consequently, the change in profile depth from 0.5 to 1 m represents a shift from annual input greatly exceeding profile storage to storage approximately accommodating annual input. At the sites used in this study, mean annual P ranged from 0.8 to 11.3 times the storage of the 1× soil profile, and peak SWE ranges from 0.1 to 5.9 times the storage. Prior field-based studies have also documented SWE that is similar in magnitude to the maximum amount of water storage in the upper meter of soil (Bales et al., 2011) and have shown that reducing soil depth increases surface runoff and deep drainage (Smith et al., 2011).
Focusing on the influence of soil texture, simulations indicate that shorter durations of deep drainage for the coarser sandy loam compared to the finer texture soils are offset by higher rates of flux during deep drainage in the coarser profile (Fig. 8a). Similarly, lower likelihood of surface saturation in the sandy loam soil compared to other soils is offset by greater likelihood of infiltration excess runoff. Therefore, in this 1-D approach, soil depth exerts a stronger control on annual total input partitioning to Q and D, whereas soil texture has a limited effect on annual partitioning but can affect the timing of partitioning and water availability during different times of year. In natural landscapes, texture differences can result in spatially variable soil moisture (Williams et al., 2009; Kaiser and McGlynn, 2018). Combined variations in soil texture and depth within a watershed may result in significant differences in soil moisture storage across the basin (Bales et al., 2011), resulting in substantial differences in response throughout a watershed. The distribution of soil water storage capacity across the watershed likely exerts a strong control on locations where surface runoff, streamflow generation, and deep drainage are most efficiently generated, especially in dry watersheds where soil moisture is generally low except during snowmelt (Atkinson et al., 2002; Seyfried et al., 2009). Additionally, unsaturated soil water storage may be the dominant control on streamflow activation during dry periods, while total input depth is the dominant control on streamflow generation during wetter periods (Farrick and Branfireun, 2014). Combining the role of soil storage capacity in space and time, areas in dry watersheds with storage similar to peak SWE may be most likely to experience reductions in deep drainage with continued slow loss.
4.2 Limiting assumptions
Given the complex nature of soil water movement in heterogeneous mountain topography, this study makes several assumptions and simplifications. The simulations do not include the intricacies of vegetation water use, assuming a static leaf area index (LAI) with root uptake controlled only by PET and soil moisture, and we assume free drainage from the bottom boundary of the modeled domain. Changing static LAI has a substantial effect on soil moisture dynamics (Chen et al., 2014), though model performance to match simulated and observed soil moisture does not necessarily improve with the assimilation of dynamic LAI values (Pauwels et al., 2007). Incorporating site-specific constant LAI from field measurements or remotely sensed data may have improved model performance, especially during spring green-up and fall senescence, and is recommended for future site-specific studies. The water balance in hydrologic models can be highly sensitive to the method chosen to represent root uptake and plant water use (Gerten et al., 2004), and hydrologic models generally poorly capture or replicate the interactions between soil, vegetation, and atmospheric properties that combine to control plant water use (Gómez-Plaza et al., 2001; Gerten et al., 2004; Zeng et al., 2005). In addition, we did not allow for frozen soils in our simulations, but this can be a strong influence on soil input partitioning in places where snow depth was <50 cm and incapable of insulating the soil (Slater et al., 2017).
Additionally, simulations are generally wetter than measured water contents; therefore, the representation of partitioning shown here displays relative response between climates and soil profiles rather than absolute quantification of these partitioned components. The profile depths we simulated represent the minimum likely soil depth, as the collection of the pedon reports was limited by the depth of refusal for sample collection. Shallow soil profiles can also lead to a wet bias in simulations, and this can artificially elevate saturation excess flow, leading to our observations of greater Q∕P than D∕P in most site years. Our modeled domain included an extended “bedrock” or regolith layer to 10 m depth to allow for deep drainage without lower boundary effects. The choice of lower boundary condition affects the simulation of soil moisture and water balance partitioning, with free drainage generally resulting in lower soil moisture, evapotranspiration, and runoff than with a no-flux boundary condition controlled by an impervious layer or fluctuating water table (Chen et al., 2018). We created a domain much deeper than the soil zone to minimize this boundary condition effect; effects of lower boundary conditions are generally seen in deeper layers of the soil profile and during transition periods between soil water input events when capillary rise can influence transpiration and deep drainage (Leterme et al., 2012; Brantley et al., 2017). Though a no-flux boundary condition may be appropriate for sites where relatively shallow water tables exert a strong influence on soil moisture dynamics, the inclusion of a no-flux lower boundary for the sites in this study would have made simulations wetter, furthering the difference between observed and modeled VWC.
Sub-daily dynamics in snowmelt and ET are not captured by our use of a daily time step. We chose to model soil water response to rainfall and snowmelt at the daily time step due to better data quality, but processes affecting partitioning of these inputs take place at sub-daily scales. Comparisons of results from simulations using daily vs. hourly input demonstrate similar timing of response but greater cumulative surface runoff from hourly simulations and greater cumulative deep drainage from daily simulations (Table S2). The short hourly time period allows for higher intensity input, which causes infiltration excess overland flow, whereas daily input is of lower intensity, allowing for greater deep percolation. Additionally, SNOTEL sites do not have measured values of PET, so we relied on a modeled 4 km gridded product (Abatzoglou, 2013), which may better represent some sites than others. It was beyond the scope of this study to perform a sensitivity analysis of PET data source.
Hydrologic response in hillslopes and catchments is not fully captured in the 1-D modeling approach. Water partitioned into Q and D in a 1-D model may not represent the same Q and D observed at a stream: Q generated at a point location may reinfiltrate downslope; D may also emerge downslope to supply streamflow rather than remaining in the deep subsurface. Topography affects both soil moisture and snow patterns (Western et al., 2004; Liator et al., 2008; Williams et al., 2009; Brooks et al., 2015), and it leads to lateral surface or subsurface flow, which can be important in redistributing water downslope along the soil–snow interface (Webb et al., 2018) and within the shallow subsurface (Kampf et al., 2015, Kim et al., 2016). Lateral redistribution of water thus leads to spatially variable patterns of input, storage, runoff generation, and ET at the hillslope to watershed scales (Brooks et al., 2015). While simulating only vertical flow is reasonable for SNOTEL sites located in relatively flat forest openings, 1-D simulations will tend to be biased wet because they do not allow any lateral redistribution. A progression of the work shown here would be to simulate 3-D flow (ex. Weiler and McDonnell, 2007; Seyfried et al., 2009) and examine the spatial variability in effects of snow loss. For example, a decline in deep drainage near a ridge line, where flow paths are predominantly vertical, could reduce subsurface flow emergence at downslope locations, and this decreased groundwater emergence may reduce ET in areas where vegetation is reliant on the emergence of deeper flow paths.
The simulations used here only allow for matrix flow, excluding macropore flow, for a simplified representation of soil water movement. Preferential flow though the profile can enhance deep drainage relative to surface runoff, which is another potential reason why soil moisture simulations were biased wet; 60 %–80 % of deep drainage has been shown to occur as preferential rather than interstitial flow (Wood et al., 1997; Jaynes et al., 2001; Sukhija et al., 2003), although the amount of preferential flow varies substantially between climates and soils. The magnitudes of fluxes in our simulations are consistent with observation studies, however, lending more confidence to the simplified modeling approach. Simulated annual D∕P for dry climates (∼0.05) is similar to values reported from observations (Wood et al., 1997). The simulated Q∕P (∼0.0–0.9) vs. snowmelt fraction plots from HYDRUS-1D simulations follow the same general increasing pattern (r=0.41) as observed Q∕P (∼0.0–1.0) vs. SP in Hammond et al. (2018a) (r=0.39).
Future work could examine the potential sensitivity of the results to these limiting assumptions, In particular, researchers could examine the extent to which adding spatially and temporally varying vegetation processes and/or preferential flow pathways would change water balance partitioning. Simulations could expand to two dimensions to examine how downslope affects partitioning from ridgelines to valley bottoms or to three dimensions to examine effects of flow convergence and exfiltration in hillslope hollows. Because of the complexity of subsurface properties, this work would also benefit from more information about the hydraulic properties of the deep subsurface below the measured soil pedons. This could be linked with model analyses examining how both subsurface properties and boundary conditions affect the simulations.
This study helps to explain the mechanisms that lead to greater runoff from snowmelt. At event scale snowmelt generates more runoff because it tends to have a greater input rate and occurs on wetter soils than rainfall. Seasonal snowmelt elevates runoff in both wet and dry climates. Deep drainage can also decline with loss of snow, but it has a weaker response because soil storage buffers the impacts of snow loss. Soil properties can mediate the effects of snowmelt on rainfall changes, with soil depth having a greater effect than texture on input partitioning, particularly where soil water storage is less than mean annual precipitation. Soils that are shallower than observed soil depths generate the greatest runoff and deep drainage, indicating that shallow soils may show the largest changes in partitioning as input transitions from snowmelt to rainfall. Increasing soil depth above observed depths gradually reduces surface runoff while increasing deep drainage. Soil texture modifies short-term timing of soil moisture and runoff generation, but these effects are not large enough to alter the annual response of different soil types to changes in snow. The 1-D simulations provide basic hypotheses for hydrologic partitioning under changing snowmelt that should be further explored with 2-D or 3-D hydrological models and direct observations. Although more work is necessary to translate these findings to watershed-scale streamflow response, the findings highlight the importance of precipitation-phase shifts for runoff generation and groundwater recharge.
Underlying model output data along with description on the CUASHI hydroshare repository are available at: https://doi.org/10.4211/hs.4ff4b2391fe54bd2b6052b53500fb7fb (Hammond, 2019).
The supplement related to this article is available online at: https://doi.org/10.5194/hess-23-3553-2019-supplement.
JH, AH, and SK designed the experiments and JH and SW carried them out. JH and SW performed the simulations. JH conducted statistical analyses on model outputs. JH prepared the manuscript with contributions from all the co-authors.
The authors declare that they have no conflict of interest.
This research has been supported by the National Science Foundation, Division of Earth Sciences (grant no. 1446870).
This paper was edited by Nunzio Romano and reviewed by Bettina Schaefli and one anonymous referee.
Abatzoglou, J. T.: Development of gridded surface meteorological data for ecological applications and modelling, Int. J. Climatol., 33, 121–131, https://doi.org/10.1002/joc.3413, 2013.
Atkinson, S. E., Woods, R. A., and Sivapalan, M.: Climate and landscape controls on water balance model complexity over changing timescales, Water Resour. Res., 38, 1314, https://doi.org/10.1029/2002WR001487, 2002.
Bales, R. C., Hopmans, J. W., O'Geen, A. T., Meadows, M., Hartsough, P. C., Kirchner, P., Hunsaker, C. T., and Beaudette, D.: Soil Moisture Response to Snowmelt and Rainfall in a Sierra Nevada Mixed-Conifer Forest, Vadose Zone J., 10, 786–799, https://doi.org/10.2136/vzj2011.0001, 2011.
Barnhart, T. B., Molotch, N. P., Livneh, B., Harpold, A. A., Knowles, J. F., and Schneider, D.: Snowmelt rate dictates streamflow, Geophys. Res. Lett., 43, 8006–8016, https://doi.org/10.1002/2016GL069690, 2016.
Berghuijs, W. R., Woods, R. A., and Hrachowitz, M.: A precipitation shift from snow towards rain leads to a decrease in streamflow, Nat. Clim. Change, 4, 583–586, https://doi.org/10.1038/nclimate2246, 2014.
Blankinship, J. C., Meadows, M. W., Lucas, R. G., and Hart, S. C.: Snowmelt timing alters shallow but not deep soil moisture in the Sierra Nevada, Water Resour. Res., 50, 1448–1456, https://doi.org/10.1002/2013WR014541, 2014.
Brantley, S. L., Lebedeva, M. I., Balashov, V. N., Singha, K., Sullivan, P. L., and Stinchcomb, G.: Toward a conceptual model relating chemical reaction fronts to water flow paths in hills, Geomorphology, 277, 100–117, 2017.
Brooks, P. D., Chorover, J., Fan, Y., Godsey, S. E., Maxwell, R. M., McNamara, J. P., and Tague, C.: Hydrological partitioning in the critical zone: Recent advances and opportunities for developing transferable understanding of water cycle dynamics, Water Resour. Res., 51, 6973–6987, https://doi.org/10.1002/2015WR017039, 2015.
Chen, M., Willgoose, G. R., and Saco, P. M.: Spatial prediction of temporal soil moisture dynamics using HYDRUS-1D, Hydrol. Process., 28, 171–185, 2014.
Chen, X. D., Liang, X., Xia, J., and She, D. X.: Impact of lower boundary condition of Richards' equation on water, energy, and soil carbon based on coupling land surface and biogeochemical models, Pedosphere, 28, 497–510, 2018.
Cho, H. and Olivera, F.: Effect of the spatial variability of land use, soil type, and precipitation on streamflows in small watersheds, J. Am. Water Resour. Assoc., 45, 673–686, https://doi.org/10.1111/j.1752-1688.2009.00315.x, 2009.
Clow, D. W.: Changes in the timing of snowmelt and streamflow in Colorado: A response to recent warming, J. Climate, 23, 2293–2306, https://doi.org/10.1175/2009JCLI2951.1, 2010.
Conner, L. G., Gill, R. A., and Belnap, J.: Soil moisture response to experimentally altered snowmelt timing is mediated by soil, vegetation, and regional climate patterns, Ecohydrology, 9, 1006–1016, 2016.
Cortesi, N., González-Hidalgo, J. C., Brunetti, M., and Martín Vide, J.: Daily precipitation concentration across Europe 1971–2010, Nat. Hazards Earth Syst. Sci., 12, 2799–2810, https://doi.org/10.5194/nhess-12-2799-2012, 2012.
Earman, S., Campbell, A. R., Phillips, F. M., and Newman, B. D.: Isotopic exchange between snow and atmospheric water vapor: Estimation of the snowmelt component of groundwater recharge in the southwestern United States, J. Geophys. Res.-Atmos., 111, D09302, https://doi.org/10.1029/2005JD006470, 2006.
Eiriksson, D., Whitson, M., Luce, C. H., Marshall, H. P., Bradford, J., Benner, S. G., Black, T., Hetrick, H., and Mcnamara, J. P.: An evaluation of the hydrologic relevance of lateral flow in snow at hillslope and catchment scales, Hydrol. Process., 27, 640–654, https://doi.org/10.1002/hyp.9666, 2013.
Farrick, K. K. and Branfireun, B. A.: Soil water storage, rainfall and runoff relationships in a tropical dry forest catchment, Water Resour. Res., 50, 9236–9250, 2014.
Flint, A. L., Flint, L. E., and Dettinger, M. D.: Modeling Soil Moisture Processes and Recharge under a Melting Snowpack, Vadose Zone J., 7, 350–357, https://doi.org/10.2136/vzj2006.0135, 2008.
Foster, M. L., Bearup, A. L., Molotch, P. N., Brooks, D. P., and Maxwell, M. R.: Energy budget increases reduce mean streamflow more than snow-rain transitions: Using integrated modeling to isolate climate change impacts on Rocky Mountain hydrology, Environ. Res. Lett., 9, 044015, https://doi.org/10.1088/1748-9326/11/4/044015, 2016.
Furey, P. R., Kampf, S. K., Lanini, J. S., and Dozier, A. Q.: A Stochastic Conceptual Modeling Approach for Examining the Effects of Climate Change on Streamflows in Mountain Basins, J. Hydrometeorol., 13, 837–855, https://doi.org/10.1175/jhm-d-11-037.1, 2012.
Gerten, D., Schaphoff, S., Haberlandt, U., Lucht, W., and Sitch, S.: Terrestrial vegetation and water balance – Hydrological evaluation of a dynamic global vegetation model, J. Hydrol., 286, 249–270, https://doi.org/10.1016/j.jhydrol.2003.09.029, 2004.
Hammond, J.: HYDRUS-1D model output for study of rainfall and snowmelt partitioning by climate and soil type, HydroShare, https://doi.org/10.4211/hs.4ff4b2391fe54bd2b6052b53500fb7fb, 2019.
Gómez-Plaza, A., Martínez-Mena, M., Albaladejo, J., and Castillo, V. M.: Factors regulating spatial distribution of soil water content in small semiarid catchments, J. Hydrol., 253, 211–226, https://doi.org/10.1016/S0022-1694(01)00483-8, 2001.
Hammond, J. C., Saavedra, F. A., and Kampf, S. K.: How Does Snow Persistence Relate to Annual Streamflow in Mountain Watersheds of the Western U.S. With Wet Maritime and Dry Continental Climates?, Water Resour. Res., 54, 2605–2623, https://doi.org/10.1002/2017WR021899, 2018a.
Hammond, J. C., Saavedra, F. A., and Kampf, S. K.: Global snow zone maps and trends in snow persistence 2001–2016, Int. J. Climatol., 38, 4369–4383, https://doi.org/10.1002/joc.5674, 2018b.
Harpold, A. A.: Diverging sensitivity of soil water stress to changing snowmelt timing in the Western U.S., Adv. Water Resour., 92, 116–129, https://doi.org/10.1016/j.advwatres.2016.03.017, 2016.
Harpold, A. A. and Brooks, P. D.: Humidity determines snowpack ablation under a warming climate, P. Natl. Acad. Sci. USA, 115, 1215–1220, https://doi.org/10.1073/pnas.1716789115, 2018.
Harpold, A. A. and Kohler, M.: Potential for Changing Extreme Snowmelt and Rainfall Events in the Mountains of the Western United States, J. Geophys. Res.-Atmos., 122, 13219–13228, https://doi.org/10.1002/2017JD027704, 2017.
Harpold, A. A. and Molotch, N. P.: Sensitivity of soil water availability to changing snowmelt timing in the western U.S., Geophys. Res. Lett., 42, 8011–8020, https://doi.org/10.1002/2015GL065855, 2015.
Harpold, A. A., Molotch, N. P., Musselman, K. N., Bales, R. C., Kirchner, P. B., Litvak, M., and Brooks, P. D.: Soil moisture response to snowmelt timing in mixed-conifer subalpine forests, Hydrol. Process., 29, 2782–2798, https://doi.org/10.1002/hyp.10400, 2015.
Hinckley, E. L. S., Ebel, B. A., Barnes, R. T., Anderson, R. S., Williams, M. W., and Anderson, S. P.: Aspect control of water movement on hillslopes near the rain-snow transition of the Colorado Front Range, Hydrol. Process., 28, 74–85, https://doi.org/10.1002/hyp.9549, 2014.
Hu, J., Moore, D. J. P., Burns, S. P., and Monson, R.: Longer growing seasons lead to less carbon sequestration by a subalpine forest, Global Change Biol., 16, 771–783, https://doi.org/10.1111/j.1365-2486.2009.01967.x, 2010.
Hunsaker, C. T., Whitaker, T. W., and Bales, R. C.: Snowmelt Runoff and Water Yield Along Elevation and Temperature Gradients in California's Southern Sierra Nevada, J. Am. Water Resour. Assoc., 48, 667–678, https://doi.org/10.1111/j.1752-1688.2012.00641.x, 2012.
Jasechko, S. and Taylor, R. G.: Intensive rainfall recharges tropical groundwaters, Environ. Res. Lett., 10, 124015, https://doi.org/10.1088/1748-9326/10/12/124015, 2015.
Jasechko, S., Birks, S. J., Gleeson, T., Wada, Y., Fawcett, P. J., Sharp, Z. D., McDonnell, J. J., and Welker, J. M.: The pronounced seasonality of global groundwater recharge, Water Resour. Res., 50, 8845–8867, https://doi.org/10.1002/2014WR015809, 2014.
Jasechko, S., Wassenaar, L. I., and Mayer, B.: Isotopic evidence for widespread cold-season-biased groundwater recharge and young streamflow across central Canada, Hydrol. Process., 31, 2196–2209, https://doi.org/10.1002/hyp.11175, 2017.
Jaynes, D. B., Ahmed, S. I., Kung, K.-J. S., and Kanwar, R. S.: Temporal Dynamics of Preferential Flow to a Subsurface Drain, Soil Sci. Soc. Am. J., 65, 1368–1376, https://doi.org/10.2136/sssaj2001.6551368x, 2010.
Jefferson, A. J.: Seasonal versus transient snow and the elevation dependence of climate sensitivity in maritime mountainous regions, Geophys. Res. Lett., 38, L16402, https://doi.org/10.1029/2011GL048346, 2011.
Jensen, J. L., Humes, K. S., Hudak, A. T., Vierling, L. A., and Delmelle, E.: Evaluation of the MODIS LAI product using independent lidar-derived LAI: A case study in mixed conifer forest, Remote Sens. Environ., 115, 3625–3639, https://doi.org/10.1016/j.rse.2010.12.011, 2011.
Jepsen, S. M., Harmon, T. C., Meadows, M. W., and Hunsaker, C. T.: Hydrogeologic influence on changes in snowmelt runoff with climate warming: Numerical experiments on a mid-elevation catchment in the Sierra Nevada, USA, J. Hydrol., 533, 332–342, https://doi.org/10.1016/j.jhydrol.2015.12.010, 2016.
Kaiser, K. and McGlynn, B. L.: Nested scales of spatial and temporal variability of soil water content across a semiarid montane catchment, Water Resour. Res., 54, 7960–7980, https://doi.org/10.1029/2018WR022591, 2018.
Kampf, S., Markus, J., Heath, J., and Moore, C.: Snowmelt runoff and soil moisture dynamics on steep subalpine hillslopes, Hydrol. Process., 29, 712–723, https://doi.org/10.1002/hyp.10179, 2015.
Kim, J. and Mohanty, B. P.: Influence of lateral subsurface flow and connectivity on soil water storage in land surface modeling, J. Geophys. Res.-Atmos., 121, 704–721, https://doi.org/10.1002/2015JD024067, 2016.
Klos, P. Z., Link, T. E., and Abatzoglou, J. T.:. Extent of the rain-snow transition zone in the western US under historic and projected climate, Geophys. Res. Lett., 41, 4560–4568, 2014.
Knowles, J. F., Molotch, N. P., Trujillo, E., and Litvak, M. E.: Snowmelt-driven trade-offs between early and late season productivity negatively impact forest carbon uptake during drought, Geophys. Res. Lett., 45, 3087–3096, 2018.
Kormos, P. R., Marks, D., McNamara, J. P., Marshall, H. P., Winstral, A., and Flores, A. N.: Snow distribution, melt and surface water inputs to the soil in the mountain rain-snow transition zone, J. Hydrol., 519, 190–204, https://doi.org/10.1016/j.jhydrol.2014.06.051, 2014.
Langston, A. L., Tucker, G. E., Anderson, R. S., and Anderson, S. P.: Evidence for climatic and hillslope-aspect controls on vadose zone hydrology and implications for saprolite weathering, Earth Surf. Proc. Land., 40, 1254–1269, https://doi.org/10.1002/esp.3718, 2015.
Leterme, B., Mallants, D., and Jacques, D.: Sensitivity of groundwater recharge using climatic analogues and HYDRUS-1D, Hydrol. Earth Syst. Sci., 16, 2485–2497, https://doi.org/10.5194/hess-16-2485-2012, 2012.
Li, D., Wrzesien, M. L., Durand, M., Adam, J., and Lettenmaier, D. P.: How much runoff originates as snow in the western United States, and how will that change in the future?, Geophys. Res. Lett., 12, 6163–6172, https://doi.org/10.1002/2017GL073551, 2017.
Li, X., Jiang, F., Li, L., and Wang, G.: Spatial and temporal variability of precipitation concentration index, concentration degree and concentration period Xinjiang, China, Int. J. Climatol., 31, 1679–1693, https://doi.org/10.1002/joc.2181, 2011.
Litaor, M. I., Williams, M., and Seastedt, T. R.: Topographic controls on snow distribution, soil moisture, and species diversity of herbaceous alpine Vegetation, Netwot Ridge, Colorado, J. Geophys. Res.-Biogeo., 113, G02008, https://doi.org/10.1029/2007JG000419, 2008.
Liu, F., Parmenter, R., Brooks, P. D., Conklin, M. H., and Bales, R. C.: Seasonal and interannual variation of streamflow pathways and biogeocheical implications in semi-arid, forested catchemnts in Valles Caldera, New Mexico, Ecohydrology, 1, 239–252, https://doi.org/10.1002/eco.22, 2008.
Loik, M. E., Breshears, D. D., Lauenroth, W. K., and Belnap, J.: A multi-scale perspective of water pulses in dryland ecosystems: Climatology and ecohydrology of the western USA, Oecologia, 141, 269–281, https://doi.org/10.1007/s00442-004-1570-y, 2004.
Lv, L.: Linking montane soil moisture measurements to evapotranspiration using inverse numerical modeling, Utah State University, Logan, UT, USA, 2014.
Markovich, K. H., Maxwell, R. M., and Fogg, G. E.: Hydrogeological response to climate change in alpine hillslopes, Hydrol. Process., 30, 3126–3138, https://doi.org/10.1002/hyp.10851, 2016.
Martin-Vide, J.: Spatial distribution of a daily precipitation concentration index in peninsular Spain, Int. J. Climatol., 24, 959–971, https://doi.org/10.1002/joc.1030, 2004.
McNamara, J. P., Chandler, D., Seyfried, M., and Achet, S.: Soil moisture states, lateral flow, and streamflow generation in a semi-arid, snowmelt-driven catchment, Hydrol. Process., 19, 4023–4038, https://doi.org/10.1002/hyp.5869, 2005.
Meixner, T., Manning, A. H., Stonestrom, D. A., Allen, D. M., Ajami, H., Blasch, K. W., Brookfield, A. E., Castro, C. L., Clark, J. F., Gochis, D. J., Flint, A. L., Neff, K. L., Niraula, R., Rodell, M., Scanlon, B. R., Singha, K., and Walvoord, M. A.: Implications of projected climate change for groundwater recharge in the western United States, J. Hydrol., 534, 124–138, https://doi.org/10.1016/j.jhydrol.2015.12.027, 2016.
Molotch, N. P., Brooks, P. D., Burns, S. P., Litvak, M., Monson, R. K., McConnell, J. R., and Musselman, K.: Ecohydrological controls on snowmelt partitioning in mixed-conifer sub-alpine forests, Ecohydrology, 2, 129–142, https://doi.org/10.1002/eco.48, 2009.
Moore, C., Kampf, S., Stone, B., and Richer, E.: A GIS-based method for defining snow zones: application to the western United States, Geocarto Int., 30, 62–81, https://doi.org/10.1080/10106049.2014.885089, 2015.
Moore, D. J., Hu, J., Sacks, W. J., Schimel, D. S., and Monson, R. K.: Estimating transpiration and the sensitivity of carbon uptake to water availability in a subalpine forest using a simple ecosystem process model informed by measured net CO2 and H2O fluxes, Agr. Forest Meteorol., 148, 1467–1477, 2008.
Musselman, K. N., Clark, M. P., Liu, C., Ikeda, K., and Rasmussen, R.: Slower snowmelt in a warmer world, Nat. Clim. Change, 7, 214–219, https://doi.org/10.1038/nclimate3225, 2017.
Newman, B. D., Wilcox, B. P., and Graham, R. C.: Snowmelt-driven macropore flow and soil saturation in a semiarid forest, Hydrol. Process., 18, 1035–1042, https://doi.org/10.1002/hyp.5521, 2004.
Nolin, A. W. and Daly, C.: Mapping “At Risk” Snow in the Pacific Northwest, J. Hydrometeorol., 7, 1164–1171, https://doi.org/10.1175/jhm543.1, 2006.
NWCC – National Water and Climate Center: Report Generator 2.0, [10/01/2003–09/30/2015], Portland, Oregon, USA, 2016.
Pauwels, V. R. N., Verhoest, N. E. C., De Lannoy, G. J. M., Guissard, V., Lucau, C., and Defourny, P.: Optimization of a coupled hydrology–crop growth model through the assimilation of observed soil moisture and leaf area index values using an ensemble Kalman filter, Water Resour. Res., 43, W04421, https://doi.org/10.1029/2006WR004942, 2007.
Raziei, T., Bordi, I., and Pereira, L. S.: A precipitation-based regionalization for Western Iran and regional drought variability, Hydrol. Earth Syst. Sci., https://doi.org/10.5194/hess-12-1309-2008, 2008.
Regonda, S. K., Rajagopalan, B., Clark, M., and Pitlick, J.: Seasonal cycle shifts in hydroclimatology over the western United States, J. Climate, 18, 372–384, https://doi.org/10.1175/JCLI-3272.1, 2005.
Schaap, M. G., Leij, F. J., and Van Genuchten, M. T.: Rosetta: A computer program for estimating soil hydraulic parameters with hierarchical pedotransfer functions, J. Hydrol., 251, 163–176, https://doi.org/10.1016/S0022-1694(01)00466-8, 2001.
Scott, R. L., Shuttleworth, W. J., Keefer, T. O., and Warrick, A. W.: Modeling multiyear observations of soil moisture recharge in the semiarid American Southwest, Water Resour. Res., 36, 2233–2247, https://doi.org/10.1029/2000WR900116, 2000.
Scott-Denton, L. E., Sparks, K. L., and Monson, R. K.: Spatial and temporal controls of soil respiration rate in a high-elevation, subalpine forest, Soil Biol. Biochem., 35, 525–534, 2003.
Seyfried, M. S., Schwinning, S., Walvoord, M. A., Pockman, W. T., Newman, B. D., Jackson, R. B., and Phillips, F. M.: Ecohydrological control of deep drainage in arid and semiarid regions, Ecology, 86, 277–287, https://doi.org/10.1890/03-0568, 2005.
Seyfried, M. S., Grant, L. E., Marks, D., Winstral, A., and McNamara, J.: Simulated soil water storage effects on streamflow generation in a mountainous snowmelt environment, Idaho, USA, Hydrol. Process., 23, 858–873, https://doi.org/10.1002/hyp.7211, 2009.
Šimůnek, J., Šejna, M., and van Genuchten, M.: The HYDRUS-1D software package for simulating the one-dimensional movement of water, heat, and multiple solutes in variably saturated media, Version 1.0, IGWMC-TPS-70, Colorado School of Mines, International Ground Water Modeling Center, Golden, Colorado, 1998.
Slater, A. G., Lawrence, D. M., and Koven, C. D.: Process-level model evaluation: a snow and heat transfer metric, The Cryosphere, 11, 989–996, https://doi.org/10.5194/tc-11-989-2017, 2017.
Smith, T. J., Mcnamara, J. P., Flores, A. N., Gribb, M. M., Aishlin, P. S., and Benner, S. G.: Small soil storage capacity limits benefit of winter snowpack to upland vegetation, Hydrol. Process., 25, 3858–3865, https://doi.org/10.1002/hyp.8340, 2011.
Stewart, I. T., Cayan, D. R., and Dettinger, M. D.: Changes toward earlier streamflow timing across western North America, J. Climate, 18, 1136–1155, https://doi.org/10.1175/JCLI3321.1, 2005.
Sukhija, B. S., Reddy, D. V., Nagabhushanam, P., and Hussain, S.: Recharge processes: Piston flow vs preferential flow in semi-arid aquifers of India, Hydrogeol. J., 11, 387–395, https://doi.org/10.1007/s10040-002-0243-3, 2003.
Tague, C. and Peng, H.: The sensitivity of forest water use to the timing of precipitation and snowmelt recharge in the California Sierra: Implications for a warming climate, J. Geophys. Res.-Biogeo., 118, 875–887, https://doi.org/10.1002/jgrg.20073, 2013.
Trujillo, E., Molotch, N. P., Goulden, M. L., Kelly, A. E., and Bales, R. C.: Elevation-dependent influence of snow accumulation on forest greening, Nat. Geosci., 5, 705–709, https://doi.org/10.1038/ngeo1571, 2012.
Webb, R. W., Fassnacht, S. R., and Gooseff, M. N.: Wetting and Drying Variability of the Shallow Subsurface Beneath a Snowpack in California's Southern Sierra Nevada, Vadose Zone J., 14, https://doi.org/10.2136/vzj2014.12.0182, 2015.
Webb, R. W., Fassnacht, S. R., and Gooseff, M. N.: Hydrologic flow path development varies by aspect during spring snowmelt in complex subalpine terrain, The Cryosphere, 12, 287–300, https://doi.org/10.5194/tc-12-287-2018, 2018.
Weiler, M. and McDonnell, J. J.: Conceptualizing lateral preferential flow and flow networks and simulating the effects on gauged and ungauged hillslopes, Water Resour. Res., 43, W03403, https://doi.org/10.1029/2006WR004867, 2007.
Western, A. W., Zhou, S. L., Grayson, R. B., McMahon, T. A., Blöschl, G., and Wilson, D. J.: Spatial correlation of soil moisture in small catchments and its relationship to dominant spatial hydrological processes, J. Hydrol., 286, 113–134, https://doi.org/10.1016/j.jhydrol.2003.09.014, 2004.
Williams, C. J., McNamara, J. P., and Chandler, D. G.: Controls on the temporal and spatial variability of soil moisture in a mountainous landscape: the signature of snow and complex terrain, Hydrol. Earth Syst. Sci., 13, 1325–1336, https://doi.org/10.5194/hess-13-1325-2009, 2009.
Winchell, T. S., Barnard, D. M., Monson, R. K., Burns, S. P., and Molotch, N. P.: Earlier snowmelt reduces atmospheric carbon uptake in midlatitude subalpine forests, Geophys. Res. Lett., 43, 8160–8168, https://doi.org/10.1002/2016GL069769, 2016.
Wood, W. W., Rainwater, K. A., and Thompson, D. B.: Quantifying Macropore Recharge: Examples from a Semi-Arid Area, Ground Water, 35, 1097–1106, https://doi.org/10.1111/j.1745-6584.1997.tb00182.x, 2005.
Yan, H., Sun, N., Wigmosta, M., Skaggs, R., Hou, Z., and Leung, R.: Next-Generation Intensity-Duration-Frequency Curves for Hydrologic Design in Snow-Dominated Environments, Water Resour. Res., 54, 1093–1108, https://doi.org/10.1002/2017WR021290, 2018.
Zeng, X., Zeng, X., Shen, S. S. P., Dickinson, R. E., and Zeng, Q. C.: Vegetation-soil water interaction within a dynamical ecosystem model of grassland in semi-arid areas, Tellus B, 57, 189–202, https://doi.org/10.1111/j.1600-0889.2005.00151.x, 2005.