the Creative Commons Attribution 4.0 License.
the Creative Commons Attribution 4.0 License.
 | 17 Jul 2019
Icelandic snow cover characteristics derived from a gap-filled MODIS daily snow cover product
Sigurður M. Garðarsson
Óli G. B. Sveinsson
This study presents a spatio-temporal continuous data set for snow cover in Iceland based on the Moderate Resolution Imaging Spectroradiometer (MODIS) from 2000 to 2018. Cloud cover and polar darkness are the main limiting factors for data availability of remotely sensed optical data at higher latitudes. In Iceland the average cloud cover is 75 % with some spatial variations, and polar darkness reduces data availability from the MODIS sensor from late November until mid January. In this study MODIS snow cover data were validated over Iceland with comparison to manned in situ observations and Landsat 7/8 and Sentinel 2 data. Overall a good agreement was found between in situ observed snow cover, with an average agreement of 0.925. Agreement of Landsat 7/8 and Sentinel 2 was found to be acceptable, with R2 values 0.96, 0.92 and 0.95, respectively, and in agreement with other studies. By applying daily data merging from Terra and Aqua and a temporal aggregation of 7 d, unclassified pixels were reduced from 75 % to 14 %. The remaining unclassified pixels after daily merging and temporal aggregation were removed with classification learners trained with classified data, pixel location, aspect and elevation. Various snow cover characteristic metrics were derived for each pixel such as snow cover duration, first and last snow-free dates, deviation and dynamics of snow cover and trends during the study period. On average the first snow-free date in Iceland is 27 June, with a standard deviation of 19.9 d. For the study period a trend of increasing snow cover duration was observed for all months except October and November. However, statistical testing of the trends indicated that there was only a significant trend in June.
- Article
(5410 KB) - Full-text XML
- BibTeX
- EndNote


On a global scale snow cover has a strong interaction with the cryosphere and ocean systems and therefore the climate system of the Earth. The two main effects of snow on the cryosphere are its control on the reflection of radiation, reaching the surface of Earth and balancing its radiation budget (Barry, 2002; Warren, 1982) and isolating properties which can influence the length of the growing season (Keller et al., 2005; Barichivich et al., 2013). Snow albedo dominates the control of its irradiance feedback, which depends on various factors such as snow depth, snow cover extent, vegetation and cloud cover (Fernandes et al., 2009; Qu and Hall, 2007).
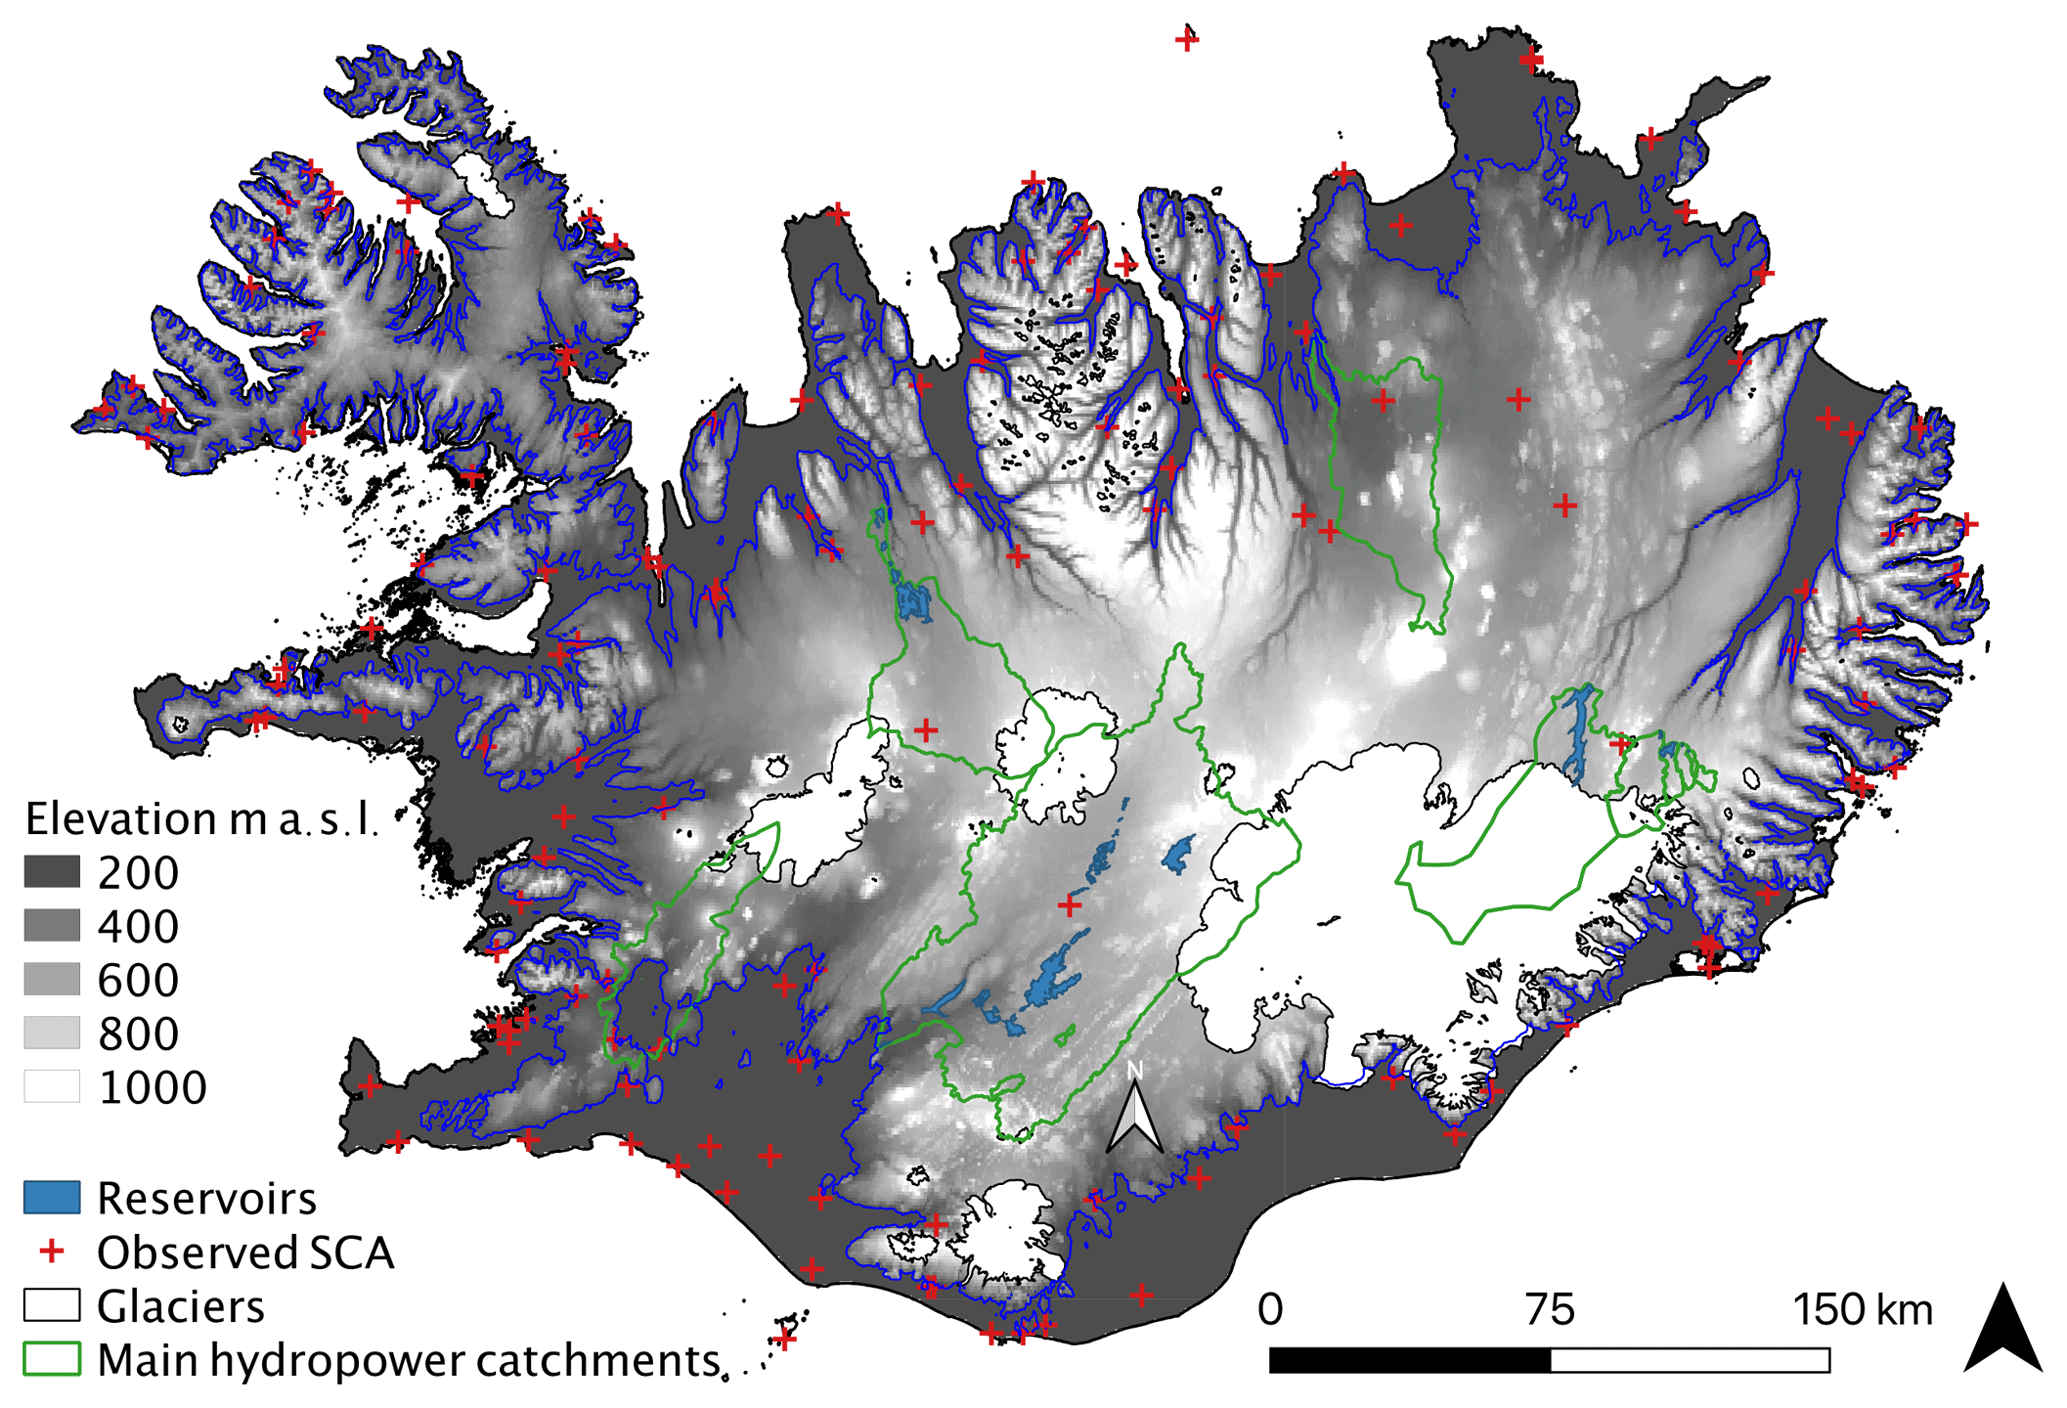
Figure 1Overview of Iceland. Red outlines show the main catchment boundaries for large hydropower diversions, reservoirs and power plants. Manned sites for observed snow cover are shown in green points. Contours are shown for the 200 m elevation band. A solid blue contour represents 200 m elevation.
In the Northern Hemisphere the spring snow cover extent has decreased significantly, influencing the dynamics of spring melt intensity and timing in recent years (Adam et al., 2008; Barnett et al., 2005; Choi et al., 2010; Hori et al., 2017). Various studies using remotely sensed data, observations and climate models unanimously agree that on the Northern Hemisphere scale snow cover extent is receding by 2.5 to 10 days per decade depending on the study period (Eythorsson et al., 2019; Fontrodona Bach et al., 2018; Choi et al., 2010; Hori et al., 2017; Wang et al., 2018; Liston and Hiemstra, 2011). On regional scales snow cover changes can vary depending on local climatology and its variability. Future projections with warming trends predict less precipitation to fall as snow and snowmelt to occur earlier in spring, affecting runoff and water resources downstream (Vaughan et al., 2013; IPCC, 2013).
On regional scales, seasonal snow is a vital part of water budgets in mountain and highland catchments where precipitation falls as snow during winter (Raleigh et al., 2013). Seasonal snow spring melt is also important for many applications such as irrigation for downstream agriculture areas, drinking water supply, and availability of water for hydropower energy production, and in some regions is critical for tourism, in particular ski resorts and winter tourism (Jóhannesson et al., 2007; Fischer et al., 2011; Kiparsky et al., 2014; Wagner et al., 2016).
Iceland is an island with an area of 103 100 km2 located in the North Atlantic Ocean, close to the Arctic Circle (between 63 and 66∘ N). The central highlands correspond to 40 % of the island, with an average altitude of ∼550 m a.s.l., and only a quarter of the island lies below 200 m a.s.l. (Figs. 1 and 2). About 50 % of Iceland's land area is classified as open spaces and bare soils with sparse vegetation and 37 % as non-vegetated where vegetation cover is less than 10 %. These two types include most of the central highlands. Less than 1 % is forested and, in general, low shrub, wetland and heathland are the main types of vegetation (Einarsson et al., 2005; Traustason and Snorrason, 2008). Precipitation climatology has been characterized by a precipitation reduction with higher latitudes controlled by the orographic generation of precipitation in mountainous regions corresponding to the dominating SE-to-SW wind direction (Crochet et al., 2007; Björnsson et al., 2018). Area average precipitation is ∼1.7 mH2O with the highest values at glacier peaks in the south (up to 10 mH2O). During winter heavy snowfall is frequently induced by cyclones crossing the North Atlantic, where air and water masses of tropical and Arctic origins meet (Einarsson, 1984; Ólafsson et al., 2007). In the highlands this leads to the formation of a seasonal snowpack and the sustainment of glaciers. At present, about 11 % of the country is covered by glaciers (Björnsson and Pálsson, 2008) (Figs. 1 and 2). During summer the average temperature at lower elevations (<400 m a.s.l.) ranges from 8 to 10 ∘C, with a country-wide average of 7 ∘C. In winter the average temperature is 0–3 ∘C at lower elevations and about −5 ∘C for the whole island (Björnsson, 2003; Henriksen, 2003). From the seasonal snow cover classification system proposed by Sturm et al. (1995, 2010), Icelandic snowpack is generally classified as a combination of taiga, tundra and maritime types with overall shallow snowpack in depth with high density, frequent melt and wind-blown features (Jóhannesson and Sigurðsson, 2014).
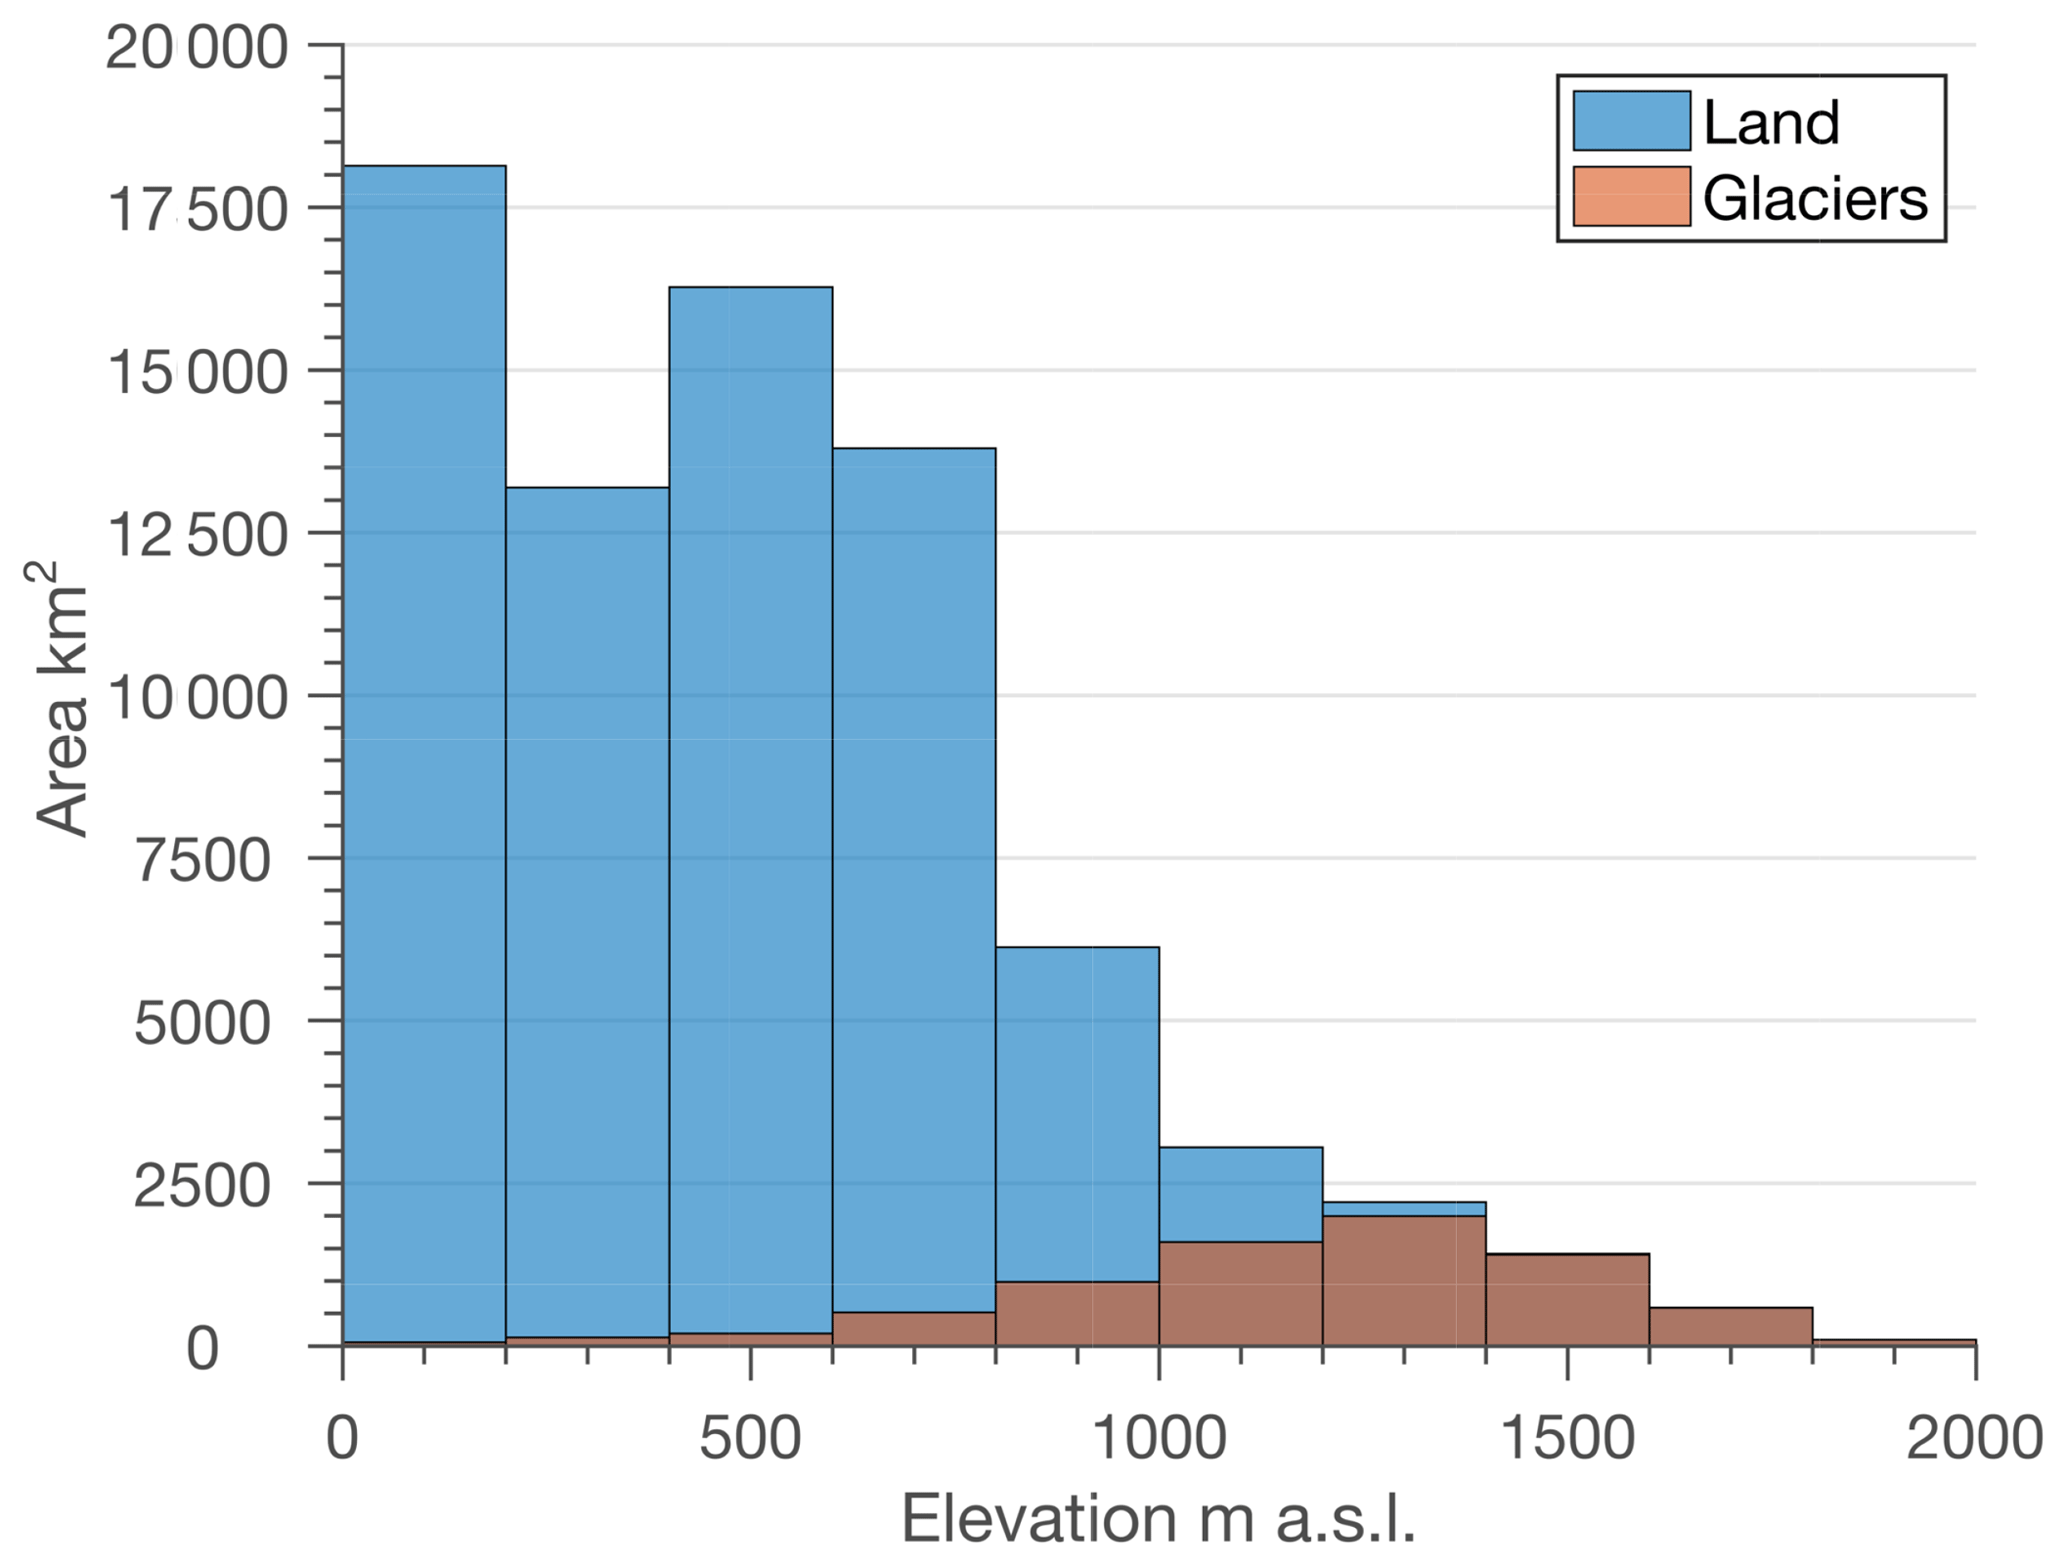
Figure 2Elevation distribution for Iceland for both land and glaciers. Glaciers cover about 11 % of Iceland.
In Iceland runoff from snowmelt is critical for hydropower production and reservoir storage as the energy system is strongly dependent on snowmelt and glacier melt. Over 13 % of the highland area in Iceland is developed for hydropower generation which provides over 72 % of the total average energy produced in Iceland (Hjaltason et al., 2018). A system of reservoirs and diversions stores melt water during the melt season in the spring and summer which generally consists of a seasonal snowmelt period (April–June) followed by a glacier melt period (June–September). As glacier melt recedes in the fall liquid precipitation is a large contributor to inflow (August–October). During winter reservoir storage provides regulation of water resources for energy production. The isolation and high natural climate variability pose a risk to the energy security of the power system as drought conditions and low-flow periods are usually not foreseen. In the longer term inflow to the energy systems is projected to increase due to climate warming and associated increase in glacier melt (Jóhannesson et al., 2007). Flow dynamics, i.e., timing and magnitude for seasonal snow, will also change, posing a challenge for operational control of energy infrastructure and climate change adaptation for both current energy projects as well as future development (Björnsson and Thorsteinsson, 2012; Sveinsson, 2016).
Spaceborne sensors operating in the visible and near-infrared range of electromagnetic spectrum have proven to be useful in effectively mapping snow cover for large areas since the early 1980s (Baumgartner et al., 1987; Dozier and Marks, 1987). Snow cover extent maps at various resolutions have been derived by the National Oceanic and Atmospheric Administration (NOAA) since 1966 (Dewey, 1987; Matson, 1991; Robinson et al., 1993). Since 2000 the MODIS sensor (Moderate Resolution Imaging Spectroradiometer) has provided daily global coverage of snow cover in cloud-free areas at a spatial resolution ranging from 250 to 1000 m. The sensor is carried on two Sun-synchronous, near-polar circular orbit satellites, Terra (descending node at approximately 10:30 local time) and Aqua (ascending node at approximately 13:30 local time). Terra was launched on 18 December 1999 and has had data available since September 2000, while Aqua was launched in May 2002. The sensor has 36 spectral bands that are used for various cryosphere, land, ocean and atmospheric scientific data sets and applications.
A range of snow cover products has been developed from the Aqua and Terra satellites carrying the MODIS sensor dating back to the early 2000s (Hall et al., 2002). The MODIS daily snow cover products (MOD10A1 from Terra and MYD10A1 from Aqua) have been a standard for snow cover monitoring at medium resolution since mid-year 2000 and are commonly used to analyze and monitor snow cover development in snow-dominated catchments, and their near-real-time availability makes them desirable for real-time applications such as for short-term forecasting and validation of runoff. The discrimination of snow and land is based on the Normalized Difference Snow Index (NDSI) which utilizes the spectral signature of snow being highly reflective in the visible spectral range (VIS) and has very low reflectance in the shortwave infrared spectral ranges (IR). In MODIS Terra bands 4 (VIS ∕ 0.545–0.565 µm) and 6 (IR ∕ 1.628–1652 µm) are used for the NDSI calculations, while the MODIS Aqua product relies on bands 4 and 7, as band 6 is non-functional (Salomonson and Appel, 2006).
MODIS snow cover products have been widely tested and validated for various land covers, topographic regions, and climates, with a typical average absolute accuracy of 93 % (Hall and Riggs, 2007; Huang et al., 2011; Klein and Barnett, 2003; Parajka and Blöschl, 2006). One of the main drawbacks of MODIS snow cover products, as well as other products that rely on optical satellite sensors, is the reliance on cloud-free conditions to produce snow cover maps. Various methods have been tested to provide gap-filled products of optical remote-sensing products including snow cover. Gao et al. (2010) used the MODIS high spatial resolution and cloud-penetrating ability of AMSR-E to reduce gaps in snow cover maps, while (Gascoin et al., 2015) applied a classification tree to gaps after merging daily Aqua and Terra snow cover tiles together and applying a temporal aggregating filter. Data from higher spatial resolution satellite platforms are available from high-resolution visible/near-infrared sensors such as from the USGS Landsat program (∼30 m) and ESA Sentinel 2 (∼20 m) program but at a lower temporal resolution, often making them less attractive for operational observations of snow cover.
The aim of this study was to create a gap-filled snow cover product for Iceland and extract snow cover characteristics for the period from 2000 to 2018. The first objective was a thorough validation of MODIS sensor-derived snow-covered maps over Iceland to validate the quality of the product and assess its limitations. Validation was an important and necessary step due to the annual and seasonal variability in climate, high average cloud cover and polar darkness during winter. The second objective of the study was to reduce the gaps to provide a spatio-temporal continuous product. By merging of data and temporal aggregation methods, data gaps are reduced and finally eliminated by using classification learners trained on topography and location of pixels. Based on the gap-filled data set snow cover characteristics on a regional scale over Iceland were derived showing relations to elevation, aspect and general trends in snow cover extent and duration.
2.1 Observational in situ data
In Iceland in situ snow cover and depth observations are sparse, especially in the highlands. Few sites have had automatic observations of properties of snow until recently. The Icelandic Meteorological Office (IMO) operates a network of synoptic meteorological observations including daily manned observation of snow cover at 09:00. Figure 1 shows the location of these sites (green points) and how few of them are in or near the central highland area. Data were obtained from the IMO for the time period from 1 February 2000 to 31 December 2017 spanning a total of 152 sites and 585 880 observations. The data set consists of daily observations with a site number, date and snow cover classifications as well as a metadata file with site number, site name and site location and elevation (Veðurstofa Íslands, 2017).
2.2 MODIS snow cover data
MOD10A1 (Terra) and MYD10A1 (Aqua) Version 6 were obtained from the National Snow and Ice Data Center (NSIDC) (Hall and Riggs, 2016a, b) for the period from 23 February 2000 to 31 June 2018, which corresponds to 6702 dates where 6640 (99 %) MOD10A1 granules were available and 5829 (87 %) MYD10A1 dates were available. For MOD10A1 62 dates were missing and 12 for MYD10A1 from NSIDC excluding data missing due to polar darkness. Polar darkness limits the data availability during winter from MODIS in Iceland from ∼20 November until 26 January (63 d) each year, reducing the data set during winter (Dietz et al., 2012). During polar darkness M∗D10A1 snow product pixels are classified as night when the solar zenith angle is larger than or equal to 85∘. Every granule from tile h17v02 was used in this project as it covers all the central highlands in Iceland and leaves out only a small portion of the western Snæfellsnes and the Westfjords.
2.3 Landsat 7/8 and Sentinel 2 data
Data acquired by the Landsat 7 Thematic Mapper (TM), Landsat 7 Enhanced Thematic Mapper Plus (ETM+), Landsat 8 Thematic Mapper (TM) and Landsat 8 Thermal Infrared Sensor (TIRS) were used. The data were downloaded from the United States Geological Survey (USGS) (https://earthexplorer.usgs.gov/, last access: 1 September 2018) using bulk download utilities. In total 264 Landsat 7 scenes were available from 12 April 2000 to 1 April 2015 and 124 scenes from Landsat 8 from 26 April 2013 to 22 June 2018 where land cloud cover was equal to or less than 20 % and the solar zenith angle not too large for processing the scene.
Data acquired by a European Space Agency (ESA) Sentinel 2A and B multispectral instrument (MSI) sensor were also used. The data were downloaded from the ESA's data hub (https://scihub.copernicus.eu/dhus, last access: 15 August 2018). In total 1090 Sentinel 2A/B scenes were acquired from 21 tracks covering Iceland. Only images where land cloud cover was equal to or less than 20 % were used. Images acquired in December and January each year have been left out due to polar darkness of MODIS data for all satellite products. Both Landsat and Sentinel products are in UTM/WGS84 projection.
2.4 Geospatial data
Digital elevation models (DEMs) and masking data for water bodies and glaciers were obtained from the National Land Survey of Iceland. The original DEM is a raster with a 10 m spatial resolution which is resampled to match the grid of the MODIS pixels using nearest neighbor sampling. From the resampled 500 m DEM the aspect data are calculated.
3.1 In situ data processing
Manned observations of snow cover from the IMO are reported daily at 09:00. Observations are made both at the local site where the instruments are located as well as in mountains where applicable; these are reported as local snow cover (SNC) and snow cover in mountains (SNCM). For each observation the local snow cover is reported as snow free (Code 0), patchy snow cover (Code 2) and fully snow covered (Code 4) (Veðurstofa Íslands, 2008). In accordance with the observational procedure of local snow cover the area observed was within 1 km of the observer and had no more than a 50 m elevation difference. We only used the local SNC for our analysis and omitted patchy snow cover classification from our comparison, but no further adjustments were made to the data set. In total 213 011 observations matches are found, i.e., where manned observations were available and a cloud-free pixel from MCDAT.
3.2 MODIS snow cover product processing
From the MOD10A1 and MYD10A1 daily data tiles we extracted the MOD Grid Snow 500 m grid and the variable NDSI snow cover was used for further analysis of snow cover. It is based on the MOD10-L2 algorithm which selects the best observation of the day to write to the daily data set. The variable NDSI snow cover ranges from 0 to 100, but in addition various other classifications are provided with the tile. As a preprocessing step data were reclassified to (a) snow, (b) no snow (land) and (c) no data (clouds, missing data, no decision, saturated detector). As the spatial extent of the tile is ∼1200 km × 1200 km (data dimension 2400 × 2400), values that are beyond the Icelandic coast were masked out, including values only on land. A processing pipeline of MODIS snow data was adopted from Gascoin et al. (2015) and Parajka and Blöschl (2008) with modifications. The main steps are the following.
-
Daily tile merging: daily tiles from Aqua and Terra are merged to a single data set to improve daily coverage with data. Data from Terra have priority over data from Aqua as previous studies have found data from Terra to be of higher accuracy (Gascoin et al., 2015). For the first 2 years only Terra was in orbit, so the period from 23 February 2000 to 4 May 2002 is only based on Terra. The output data set used for further processing is named MCDAT (MODIS Combined Data for Aqua and Terra).
-
Temporal aggregation: for the remaining unclassified pixels in the daily merged data tiles (MCDAT) we apply temporal aggregation to further reduce unclassified pixels due to clouds in the data. Each MCDAT tile from step 1 is given a center date as the date of acquisition (t=0) and a temporal aggregation range selected. The temporal aggregation range is set as the number of days backwards and forwards each center date data is allowed to search for classified pixel data which are missing in the original MCDAT center date data tile. Priority is given to data closest to the center date data (newest data relative to the center date) and from the forward date if both backward and forward dates have data. We select a temporal aggregation range as 3 d backward/forward ( d); i.e., in total 7 d can contribute data to the temporal aggregation product. The output data set used for further processing is named MCDAT7D.
-
Gap filling with classifiers: after the first two processing steps the remaining gaps are classified as snow or no snow with classification learners. For each data set the unclassified pixels are reclassified with four predicting variables, location (easting, northing), elevation (Z) and aspect. The final output data set used for further processing is named MCD7GFD.
Figure 3 shows a flow diagram of the daily Aqua and Terra tile merging (Step 1), temporal aggregation of the daily merged tiles for X number of days (Step 2) and finally the gap-filling step for the remaining unclassified pixels (Step 3).
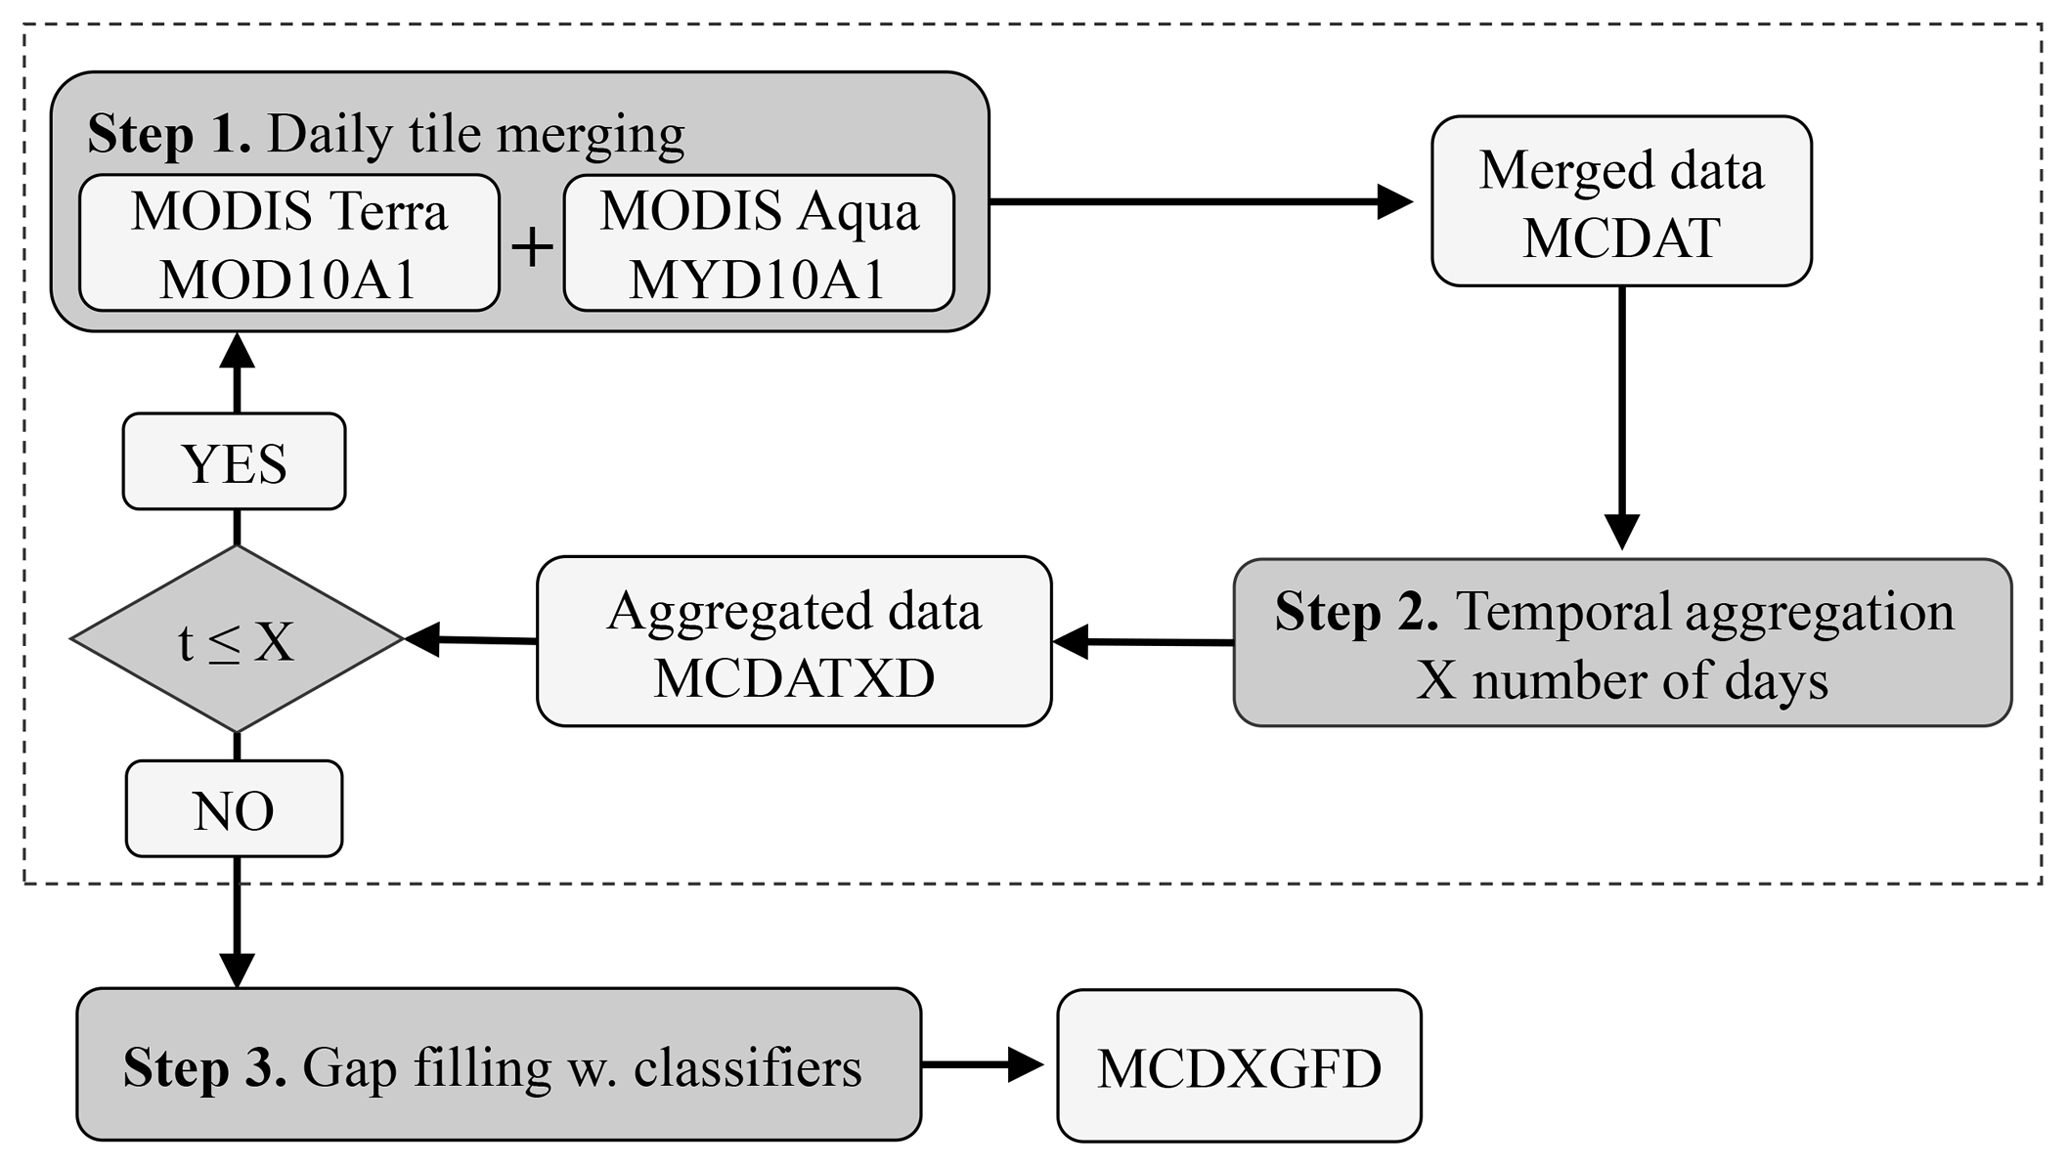
Figure 3A simple process flow diagram for the daily tile merging, temporal aggregation and gap filling. X denotes the number of days selected for temporal aggregation, which includes t number of aggregation steps.
3.3 Landsat and Sentinel 2A/B processing
Landsat 7 and 8 data were retrieved as L1TP surface reflectance products. These products have a terrain correction and are radiometrically calibrated. The U.S. Geological Survey (USGS) uses the Landsat Ecosystem Disturbance Adaptive Processing System (LEDAPS) for Landsat 7 Surface Reflectance generation, while Landsat 8 is processed with the Landsat Surface Reflectance Code system (LaSRC) (USGS, 2018, 2019). Systems include for each date tile a pixel quality map where classifications of clouds, shadows, land, water and snow are presented.
Sentinel 2 data were retrieved as an L1C ortho-image product. Images are in top-of-atmosphere reflectances in cartographic geometry and have undergone geometric transformation and radiometric interpolation with a constant GSD (ground sampling distance) (Delwart, 2015). Sentinel 2 L1C data were processed using the Sen2Corr application from ESA to produce Level 2A data (Louis et al., 2016; Müller-Wilm et al., 2013). Level 2A Sen2Corr output data were an atmospherically corrected bottom of the atmosphere (BOA) product and have a scene classification map (SCL) on a pixel basis discriminating the surface into 11 categories, including no data, various types of clouds, water and snow or ice, among other categories. Data were processed at 20 and 30 m spatial resolution for Sentinel 2 and Landsat 7 and 8, respectively. Data were then resampled to the MODIS data grid at 500 m spatial resolution using GDAL utilities (GDAL/OGR contributors, 2019) with an average resampling method. Classification from the classification map in the L2A product were used for further analysis. Snow and ice were classified with the NDSI method (Müller-Wilm, 2018; Salomonson and Appel, 2004).

Figure 4Comparison of observed snow cover and MODIS daily combined snow cover. For the whole data set the overall classification accuracy was 0.925.
3.4 Classification learners
To classify the data we need to select a classification method. In general terms a model is trained with the training data set and the trained fit applied to the data that need classification. Within the Matlab Classification Toolbox (Matlab, 2017) there are many methods and algorithms available, and no clear selection criteria are evident.
In general snowfall in a region and formation of a snowpack are dependent on several climate and geographic factors such as latitude, longitude, elevation, distance from moist sources (ocean and lakes) and regional air mass circulation (DeWalle and Rango, 2008). To classify the remaining unclassified pixel information about pixel location (latitude, longitude), pixel elevation and pixel aspect are derived to use for the gap-filling algorithm. To test different classification methods a simple workflow was applied where the pre-processed MODIS data set (after temporal aggregation) of 2400 by 2400 pixels for the tile covering (hv017v14) Iceland was masked with the coastline of Iceland, selecting only pixels that fell on land, reducing the data size from 5.75 million pixels to 472 000 pixels. Next all pixels were categorized depending on whether they had data or not (snow/no snow/cloud). All cloud-covered pixels were arranged to classify a data set and pixels with valid snow cover data were arranged to a training data set. Information on location (X,Y), elevation (Z) and aspect (A) data for each pixel was derived to train the classifiers. Finally the classifier was applied to the training data set and the classified data set reclassified as snow/no snow with the trained classification data set. To assess the accuracy of the classification method 25 % of the classified data set prior to classification was withheld for cross-correlation. Glaciers were set to a fixed snow cover and water bodies were masked out.
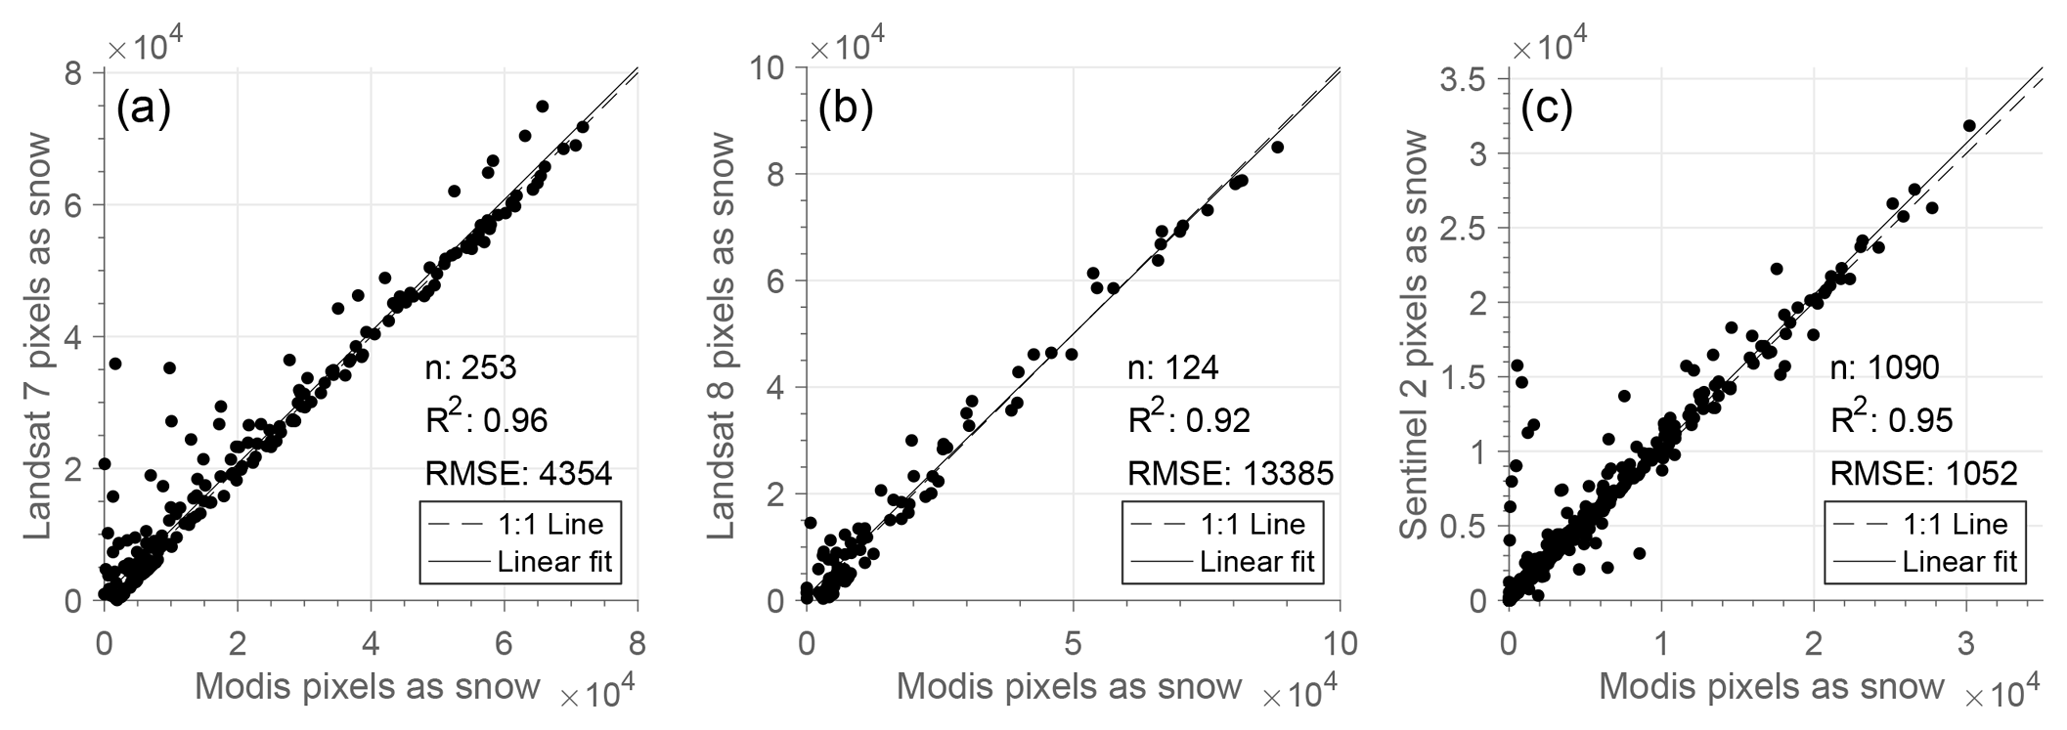
Figure 5Relationship of classified snow pixels for Landsat 7/8 and Sentinel 2 with the MCDAT product.
Table 1Confusion matrix for observations of snow compared to the Modis Aqua and Terra daily snow product combined.

4.1 Validation results
4.1.1 Comparison with observed snow cover
Overall a good agreement was found between in situ observed snow cover and MODIS daily combined snow cover (MCDAT). Figure 4 shows the average agreement for each of the 152 sites investigated compared to the MODIS product for the whole period where the circle size shows the number of observations for each site. Out of the 585 800 observations in the database 213 011 matches were found when data were available from the MCDAT daily product and manned observations. The average agreement between observed snow and MODIS was 0.925. Table 1 shows a confusion matrix for the agreement between manually observed snow and NDSI snow cover from MCDAT. Observations and MCDAT agreed 96.9 % of the time when there was no snow on the ground according to the manual observations and 88.6 % of the time when snow was present. The poorest agreement was for sites located in the bottom of fjords and sounds where snow was observed during the manual observation, but was not present at the 10:30 ∕ 01:30 UTC Terra ∕ Aqua overpass. Possible explanations for a higher agreement for no snow classification over snow classification (Table 1) could be related to many of the in situ snow cover sites being located within or close to cities and small municipalities where buildings, roads and other civil structures could influence the NDSI value from MODIS towards classifying the pixel as not snow covered while the manned observation would classify the site as snow covered.
Table 2Confusion matrix for snow cover derived from Landsat 7, Landsat 8 and Sentinel 2 compared to the Modis Aqua and Terra daily snow product combined.

4.1.2 Comparison to Landsat/Sentinel data
Table 2 shows confusion matrix classification results from pixel-based comparison of snow cover derived from the combined daily Aqua and Terra product from MODIS and snow cover derived from Landsat 7/8 and Sentinel 2. For Landsat 7 8.21 million pixels were compared, 8.6 million for Landsat 8 and 3.77 million for Sentinel 2. For Landsat 7 86.9 % of snow-covered pixels were correctly classified in the MCDAT product, while 93.2 % of snow-free pixels were correctly classified. For Landsat 8 83.8 % of snow-covered pixels were correctly classified in the MCDAT product, while 92.7 % of snow-free pixels were correctly classified. Finally, for Sentinel 2 85.6 % of snow-covered pixels were correctly classified in the MCDAT product, while 91.8 % of snow-free pixels were correctly classified. Validation data from all satellites provide data over all of Iceland for multiple times. Pixel density, i.e., the number of overlappping pixels for the study period, ranges from 110, 30 and 90 for Landsat 7, Landsat 8 and Sentinel 2, respectively. Figure 5 shows the average agreement for snow-covered pixels for Landsat 7/8 and Sentinel 2 compared to the MCDAT product. Visually the agreement is good in all cases, with R2 values of 96 %, 92 % and 95 % for Landsat 7/8 and Sentinel 2, respectively. No clear trends or correlation can be seen between months within the year and classification accuracy. These results are in agreement with similar studies where a pixel-based comparison was conducted (Huang et al., 2011; Gascoin et al., 2015).
For each Landsat 7/8 and Sentinel 2 tile a classification map was constructed. The classification maps show the agreement of different satellite sources to the MCDAT product. A selected sample of the maps was manually screened to identify patterns in misclassification. The screening reveals that disagreement was mainly located at snow cover boundaries, i.e., where snow-free land meets snow-covered land as well as boundaries of clouds and land. Previous studies in snow-covered Arctic and alpine areas have revealed a similar effect when comparing MODIS to higher-resolution data (Gascoin et al., 2015; Déry et al., 2005; Rittger et al., 2012). A source of misclassification has been related to effects of forested areas which should be limited in Iceland due to few forested areas and sparse vegetation in general, especially at higher elevations. The effect of the MODIS sensor view angle has also been identified as a source of errors where the M∗D10_L2 swath granule (source data for MODIS snow products) has different boundaries producing a “bow-tie” effect which can increase misclassification (Gómez-Landesa et al., 2004).
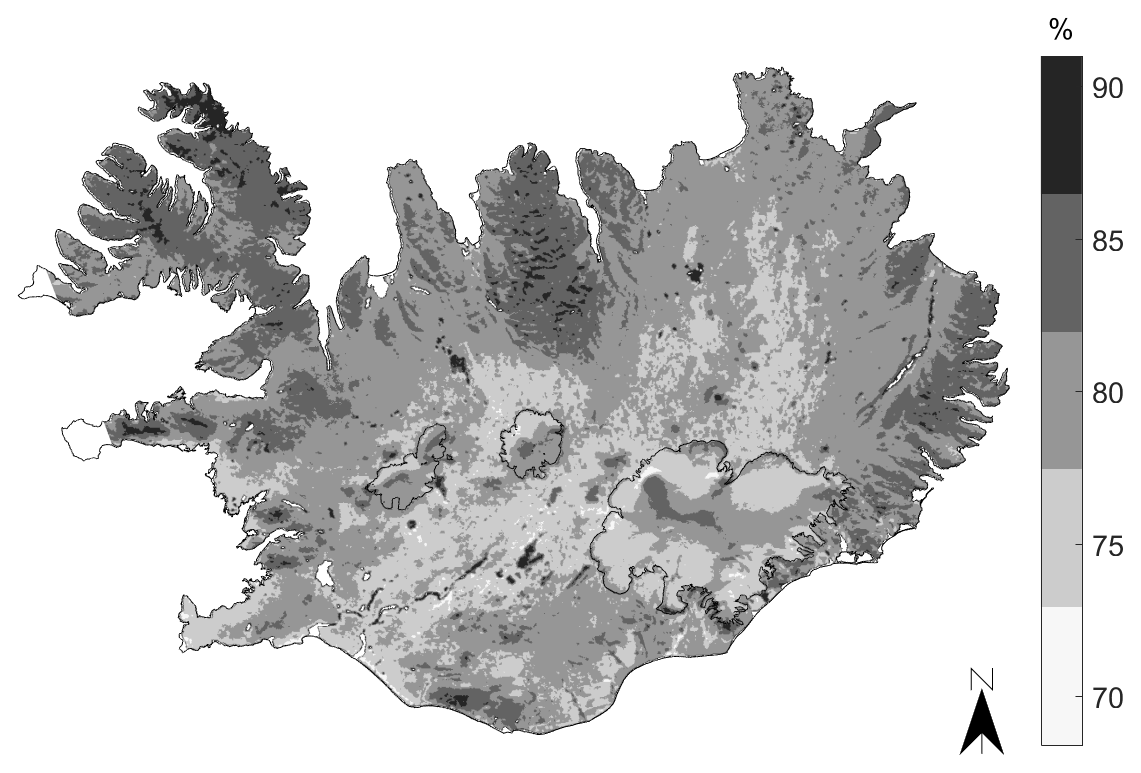
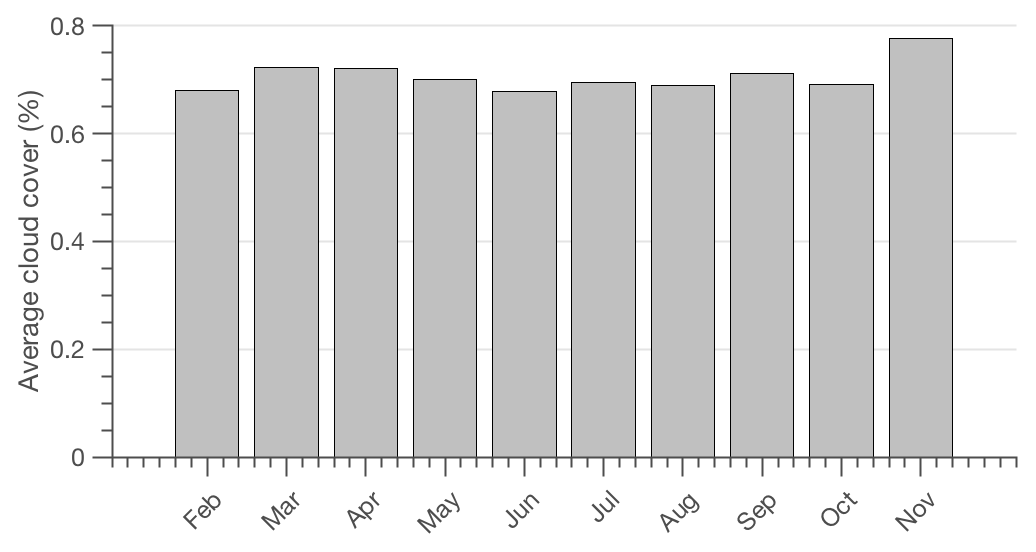
Figure 6Average cloud cover over Iceland based on the MCDAT product for February to November each year from 2000 to 2018.
4.2 Gap filling with merging and temporal filtering
Figures 7 and 6 show the average cloud cover frequency in Iceland based on 18 years of MODIS data from 2000 to 2018 (MCDAT). Average cloud cover for Iceland was 79 %, while certain patterns are observed in the central highlands, over glaciers and in mountainous areas near the coast. In general cloud cover was less in the highlands but highest near the coast and in mountainous areas and fjords, such as Tröllaskagi, Austfirðir and Strandir. This illustrates the cloud obscurity problem for optical satellite remote sensing in Iceland. Figure 8 shows the results from daily merging and temporal aggregation of snow cover data. The two daily snow cover tiles from MOD10A1 and MYD10A1 had similar average cloud cover (76 %–78 %). Data from Aqua (afternoon overpass) showed 1.5 % average more cloud-covered pixels than Terra. Merging of the Aqua and Terra daily data sets provided on average a 7 % reduction in cloud-obscured pixels which was mostly related to moving cloud patterns within the day. Temporal aggregation of daily merged tiles had an exponential decaying shape of unclassified pixel reduction with the highest benefit for aggregating 1 day. The disadvantage of aggregating more days to a center date to further reduce unclassified pixels is temporal dampening of events and rapid changes in the snow cover. For our study 3 d were aggregated to the center date, both forward and backward, meaning that for each date of aggregated data in total 7 d contributed data with priority to the most recent observations. On average the unclassified pixels were reduced from ∼70 % to 14 %.
In general the advantage of temporal aggregation of data is reduced cloud-obscured pixels, which provides a spatio-temporal continuous product. The trade-off of temporal aggregation contrasts with the dampening of the response of the snow cover to rapid melt or snowfall events. This poses a limitation on the use of the data in real-time applications such as short-term flow forecasting for water resources.
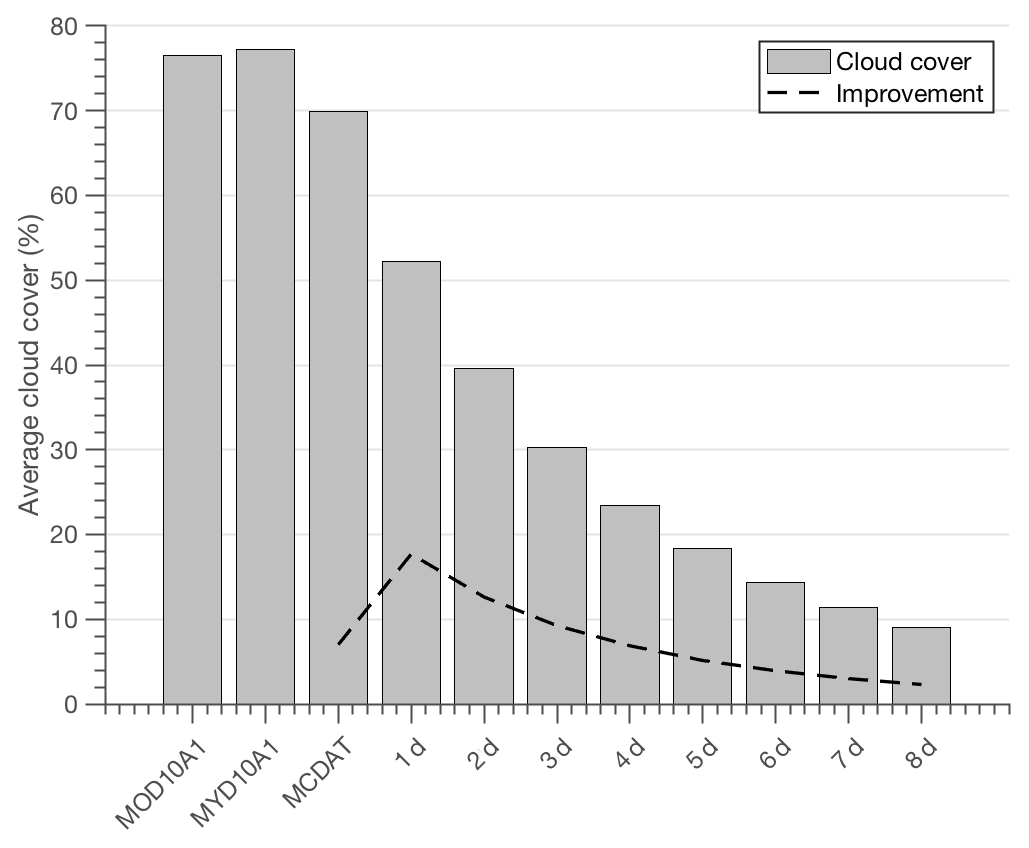
Figure 8Average gap-filling improvement with merging of daily data and temporal aggregation.
4.3 Gap filling with classification learners
After applying a temporal aggregation to the data, unclassified pixels still remained in the data set. To classify the remaining pixels, various classifiers were tested to assess their classification accuracy. Various configurations of classification trees, k nearest neighbor algorithms (fine, coarse, cubic, weighted, boosted), supportive vector machines (SVMs), and linear and quadratic discriminant classification learners were tested in various configurations. Overall no one method and configuration provided a significant classification accuracy improvement. Average classification accuracy ranged over 90 % for all methods tested and in general had lower classification accuracy during the melt season (April, May, June). The marginal best classification performance was by a weighted k nearest neighbor (wkNN) classifier which had 100 number of neighbors. The average classification accuracy for the whole data set was 96.4 % with a standard deviation of 2.7 % and a minimum classification accuracy of 83.4 %. This was based on a 25 % withheld classified population for every date classified in every method tested. The weighted k nearest neighbor was selected for further use.
4.4 Snow cover spatial and temporal characteristics in Iceland
A daily gap-filled snow cover product was derived for Iceland based on MODIS sensor bi-daily overpasses at a temporal resolution from 1 March 2000 to 30 June 2018. All water bodies and glaciers were excluded from the gap-filled snow cover product. Based on the data set, various descriptive spatio-temporal dynamics of snow cover in Iceland can be derived. The main limitation to the data set was polar darkness during December and January that limits the continuous temporal structure of the data set. Snow cover duration within a season is a parameter that is often used to describe characteristics of snow cover. The duration of snow cover is a property that can be linked to many applications such as seasonal snowmelt magnitude for operational water resources and length of vegetation growing season.
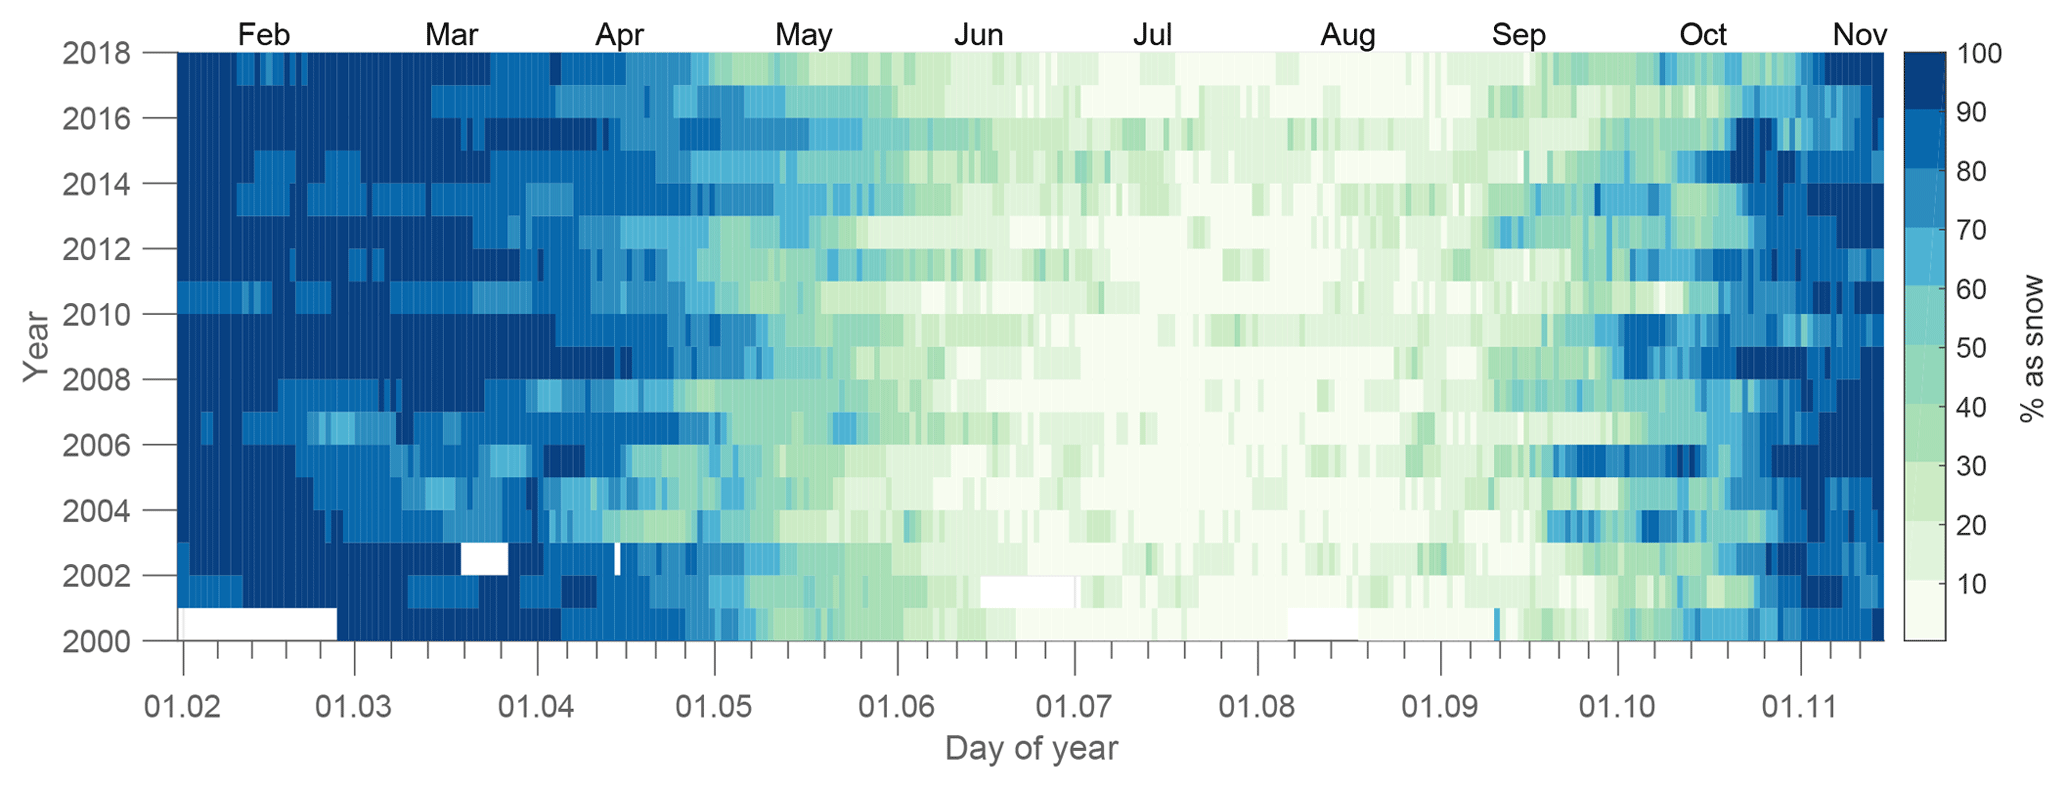
Figure 9Snow cover duration (SCD) in Iceland from 1 March 2000 to 31 December 2017; 100 % indicates full snow cover, while 0 % represents a snow-free area. Glaciers and water bodies are not included.
Figure 9 shows the distribution of snow cover over the whole country of Iceland from February 2000 to December 2017 as a percentage of land area in Iceland. A value of 100 % indicates that all non-glaciated land is fully covered with snow, while 0 % indicates a snow-free area. During late winter (February, March) most land area (>90 %) was snow covered, while during April, May and June seasonal snow cover recedes rapidly due to longer daylight hours and increasing average temperatures. Extended snow cover duration was seen in 2013, 2014, 2015 and 2016, with more than 50 % of Iceland snow covered until the end of May. Specific snowfall events can be seen in May, increasing snow cover extent, but generally these events had a short impact. In the fall many events can be observed where snow cover increases in a snowfall event and then melts a few days/weeks later. This shows quite well the temporal structure of Icelandic snow cover where large areas covered with snow can melt out quickly during fall and winter due to storm tracks bringing warm air masses that can precipitate as both liquid or solid precipitation. For hydropower operations in Iceland snowfall in the fall (late August, beginning of September) can be a critical point in time as it can indicate lowering of inflows to reservoirs and diversions and the start of the reservoir regulation season, i.e., more water is flowing out of storage than in. This is related to the influence fresh snow cover with high albedo has on the dark glacier ice in the ablation zone, reducing severely the available energy for melt.
Figure 10 shows descriptive fits for number of snow-free dates (SFDs), first snow-free date (FSFD) and last snow-free date (LSFD) for the gap-filled data set. The criteria were that the representative area had 10 % or less of the area snow covered for more than 5 consecutive days and in the case of the last snow-free date the area needed to have 10 % or higher snow cover for 5 consecutive days. The number of snow-free dates is the number of days between these values (FSFD and LSFD) annually. A commonly used valuable snow cover metric is length of snow season, i.e., the number of days where snow covers the ground. Due to polar darkness this limits the temporal continuity of the data set during winter, so length of snow season can not be described fully here.
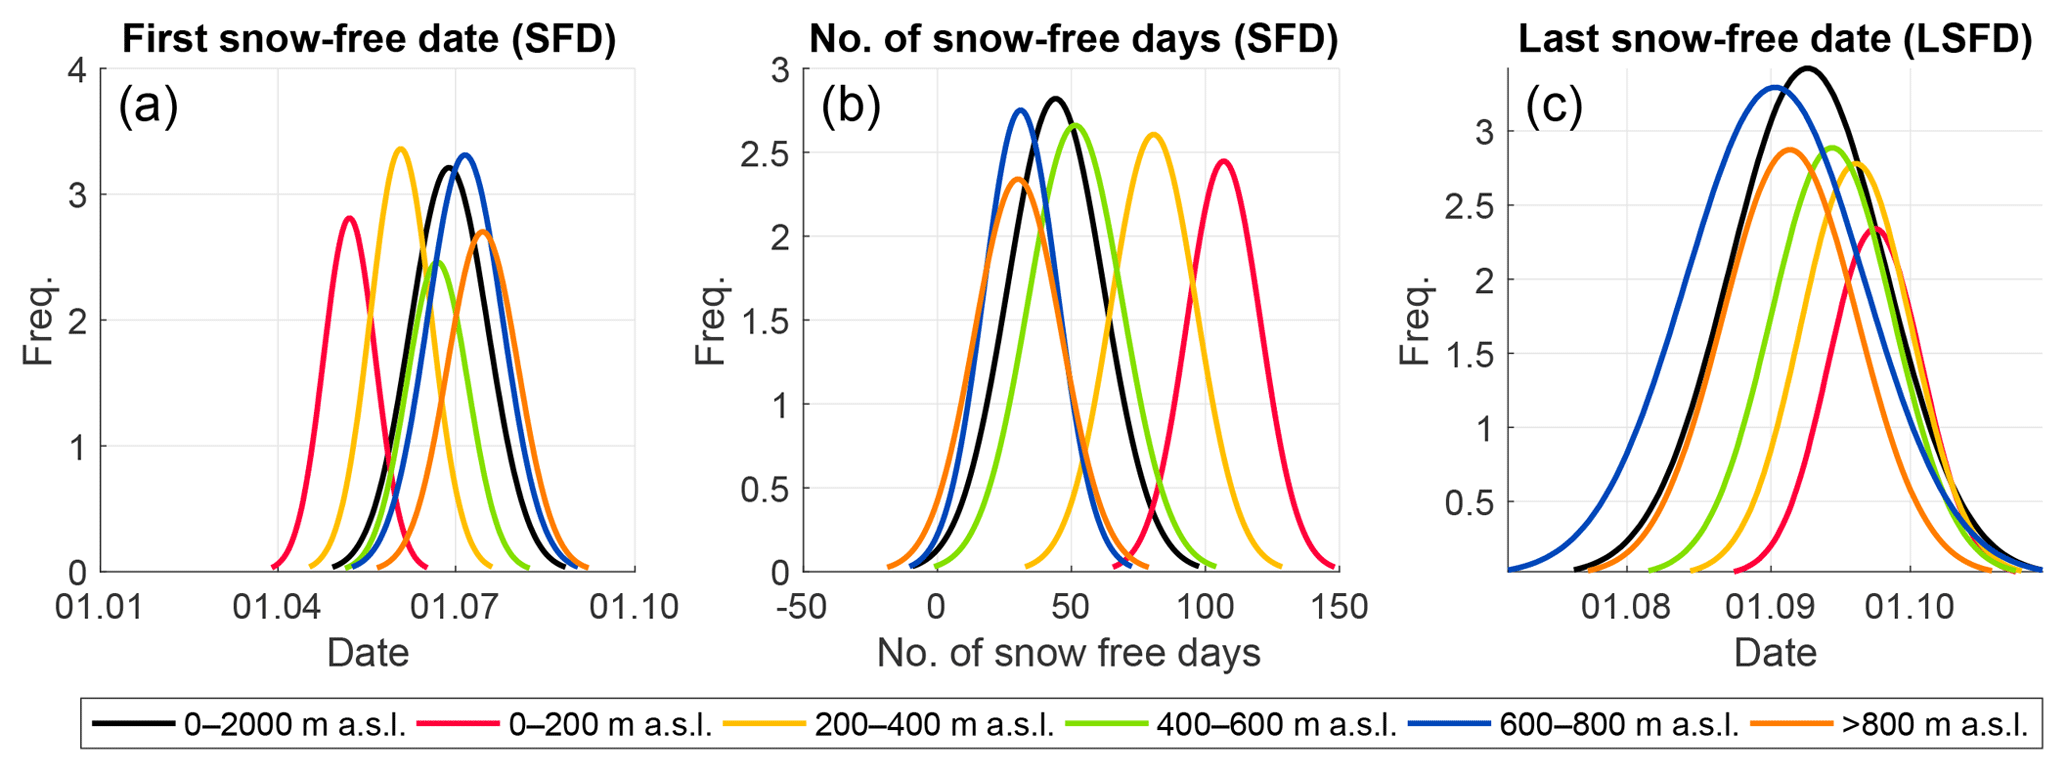
Figure 10Normal distributions for extracted first snow-free date, number of snow-free days and last snow-free date.
In various studies of snow cover where polar darkness applies, a filter assuming that if a pixel has snow at the beginning of polar darkness (late November in Iceland) and the same pixel still has snow when polar darkness recedes (mid January in Iceland), it can be assumed that the snow cover is continuous for that time period (Lindsay et al., 2015; Dietz et al., 2012). In Iceland the assumption of a continuous snow season during polar darkness is feeble as winter floods can influence large areas in a single depression low event (Kundzewicz, 2012; Rist, 1990).

Figure 11First column: mean snow cover duration as percentage of time for each period. Second column: standard deviation of days for each period. Third column: mean trend in snow cover duration as percentage of time for each period. Rows represent different combinations of monthly values and the bottom row is for the whole period from February to November.
Figure 10a shows the first snow-free date for each year in the data set and can be related to the timing when no snow remains within an area. An expected behavior is observed where lower-elevation areas experience meltout earlier in the year than higher-elevation areas. The average first snow-free date for Iceland is 27 June each year, with a standard deviation of 19.9 d (standard deviation is shown in parentheses from now on). The elevation band from 0 to 200 m a.s.l. (25 % of Iceland) has an earlier first snow-free date (7 May, ±13 d), while as with higher elevations the snow cover extent is prolonged into the summer months. Figure 10b shows the number of SFDs. For all of Iceland the number of snow-free days is 44.1 d with a standard deviation of 17.8 d. For elevations from 0 to 200 m a.s.l., 106.8 d are snow free with a deviation of 13.7 d. For higher elevations the snow cover is more persistent and snow cover days total 80.6 d (±15.9 d), 51.4 d (±17.5 d) and 31.0 d (±13.8 d) for 200–400, 400–600 and 600–800 m a.s.l., respectively. For the highest-elevation bands (>800 m a.s.l.) fewer pixels are non-glaciated (see Fig. 1), with 30 (±16.1) snow-free days. Figure 10c shows the LSFD, which is on average for Iceland 8 September (±16 d). This is highly influenced by snowfall events in the late fall in the highlands where snowfall events are frequently observed in late August or early September. These events will frequently melt out again, which can be seen in the variable snow cover duration in Fig. 9. In general higher elevations have snowfall events earlier in the fall, which coincides with a later snow-free date annually and fewer snow-free dates, as expected.

Figure 12Monthly mean results for snow cover. For each month mean snow cover extent is calculated and a linear fit applied. The results from the Mann–Kendall test are shown as 1 or 0, where 1 indicates a significant change in trend. A linear equation shows the results for a fitted linear model to the data set. Δy is a non-statistical parameter and shows the average linear slope of the trend.
Figure 11 (first column) shows the mean snow cover duration for pairs of months as well as for the whole period the data set covers from February to November. Monthly averages are combined for pairs of months February and March, April and May, June and July, August and September, and October and November. These 2-month period pairs can be related to seasonality of the snow cover where February and March represent late winter where rain on snow events or warm storms are dominant in reducing the snow cover extent. April and May represent the conventional snowmelt season with snowmelt commencing earlier at lower elevations and is mostly driven by gradually warming temperatures, and June and July represent the summer season where most areas are snow free except at higher elevations and glaciers. In general this also is the period when glacier melt becomes the dominating water source in glacier-fed rivers and succeeds seasonal snowmelt. August and September represent late summer and early fall where highlands start to have lower temperatures, freezing during the night can be common and snowfall events are observed. October and November then represent the early winter period. In February and March land above 200 m a.s.l. is on average 100 % covered with snow with a more varying snow cover extent at lower elevations, especially near the coastline and in the southeastern and southwestern parts. In April and May larger areas are snow free from 0 to 400 m a.s.l., while snow cover is persistent in the highlands on higher mountains and at glacier boundaries. Snow cover has more extent in the northern part of Iceland as well in the western and eastern fjords. In June and July snow cover is generally at its minimum, with patchy snow cover in the center highlands and on higher mountain tops and ridges, especially in the northern Westfjords on Tröllaskagi in the north. Generally the first snow is observed in August and September on glaciers and highlands with less frequent events at lower elevations in August, though often in September. On average the highlands are fully snow covered in October and November.
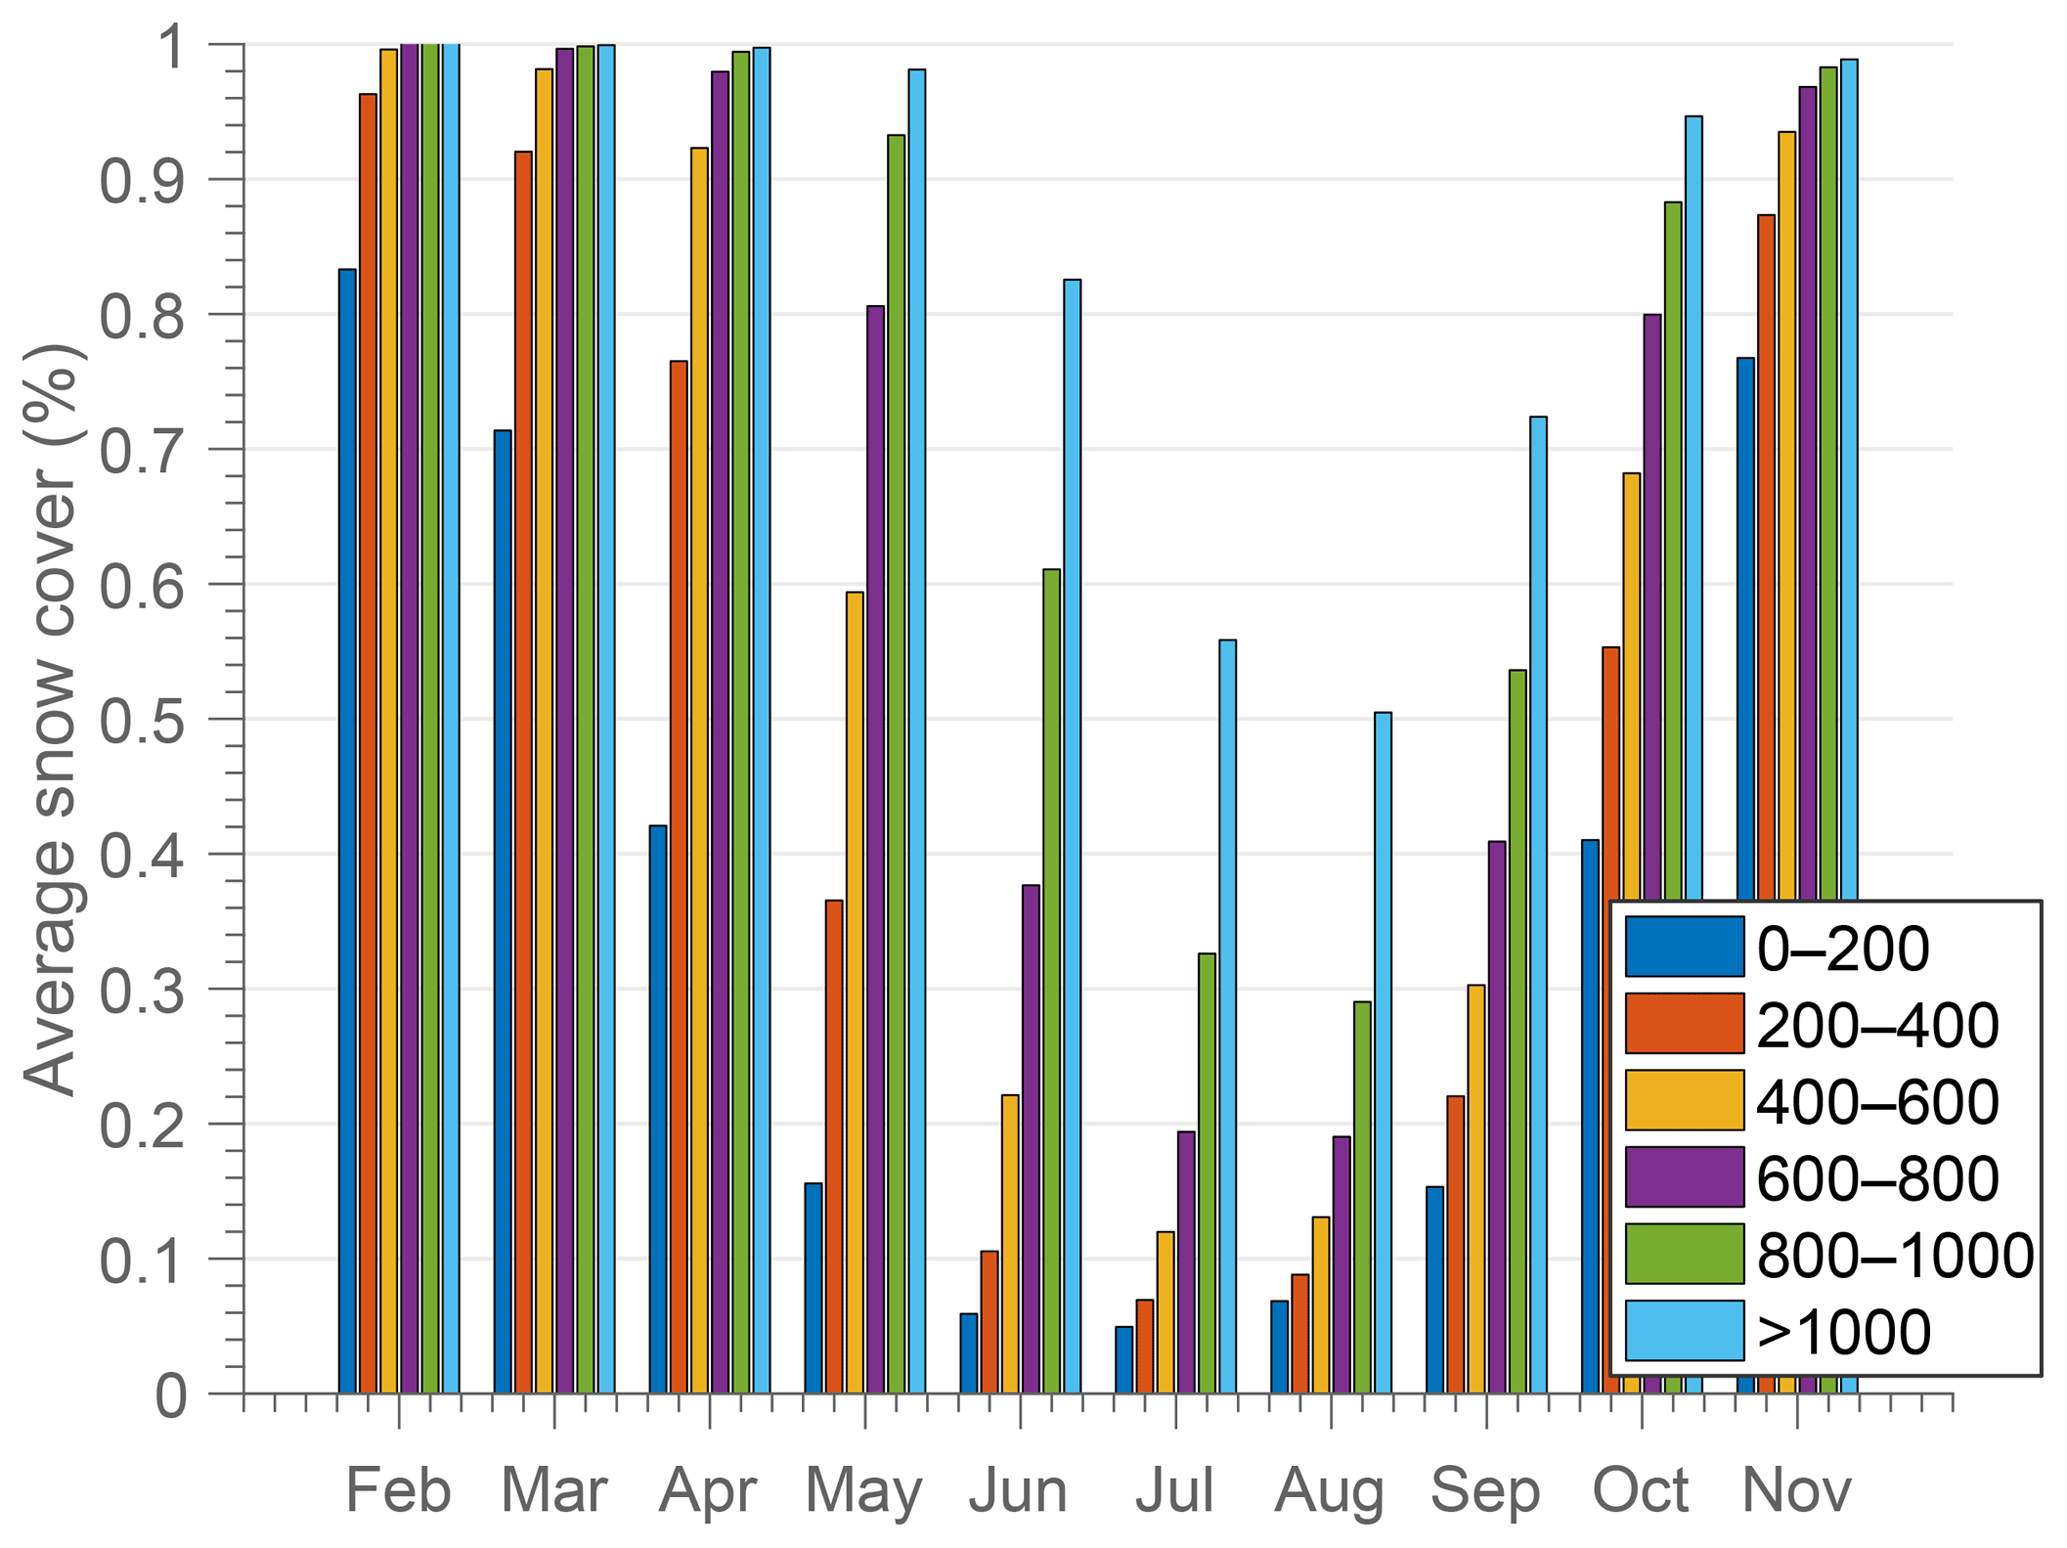
Figure 13Average elevation distribution of snow cover for 2000–2018. Fractions of area for each elevation band are 23.9 % for 0–200 m a.s.l., 17.5 % for 200–400 m a.s.l., 21.7 % for 400–600 m a.s.l., 18.4 % for 600–800 m a.s.l., 8.2 % for 800–1000 m a.s.l. and 9.9 % for elevations over 1000 m a.s.l.
Figure 11 (second column) shows changes in snow cover within each period, presented with the standard deviations of data. The data are identical to snow cover extent characteristics where there is more deviation in the lower elevations in general during winter and which moves higher in elevation during the melt season. In February and March deviation is highest below 200 m a.s.l. and near the coast. The highest deviation is observed on the southern central lowlands and along the southeastern coast, which relates to the governing storm track alignment during winter (Einarsson, 1984). In April and May the variability moves higher in elevation associated with seasonal snowmelt and is still the highest in areas in the north, while the east and west have less variability. In June and July the highest areas in the north, east and west are melting, extending into August and September. In early winter, October and November, the snow cover in the highlands has stabilized, with more variability at lower elevations.
Figure 11 (third column) shows trends in snow cover within each period. In February and March the average trend is close to zero (insignificant for all areas). For April/May, June/July and August/September the average trend for each period is positive, indicating that the snow cover extent was spanning a longer time, i.e., that snow cover was extending further into the spring and summer months. For early winter, October and November, the average trend was slightly negative, meaning that snow cover was on average less, especially in the east and north, on the order of 0.4 to 3 d. Further details of this are shown in Fig. 11, where monthly mean snow cover extent was calculated for all years and the data were fitted linearly.
As previously mentioned, the data set only spans 18 years, so statistical interpretation such as trends should be treated with care. To evaluate whether these trends are significant, a linear trend test and a Mann–Kendall test were performed on monthly mean snow cover extents for α equal to 0.05. The Mann–Kendall test was a non-parametric test to identify trends in data over time where no assumption of normality was required (Mann, 1945; Helsel and Hirsch, 2002). Results indicate that the observed trends in the data are insignificant for all months except June, tested with both the Mann–Kendall test as well as the linear trend test. As identified visually, of the data in Fig. 12 for May, June and July, the steep trend was governed by snow cover extent in 2013, 2014 and 2015, which were abnormal years compared to previous years, with below-normal spring and summer temperatures which resulted in an extended length of the seasonal snow cover season which was also reflected in a positive mass balance of all Icelandic glaciers for the first time in over 20 years (Pálsson and Gunnarsson, 2016b, a; Þorsteinsson et al., 2017). Similarly, a slightly negative trend for October and November was calculated from a linear fit and was also governed, less though, by extended liquid precipitation events in these months in 2014, 2015 and 2016. A non-statistical parameter, Δy, was calculated to represent the average change over the period. This is merely the average slope of the linear fit but provides insight into the average characteristic of the snow cover trend.
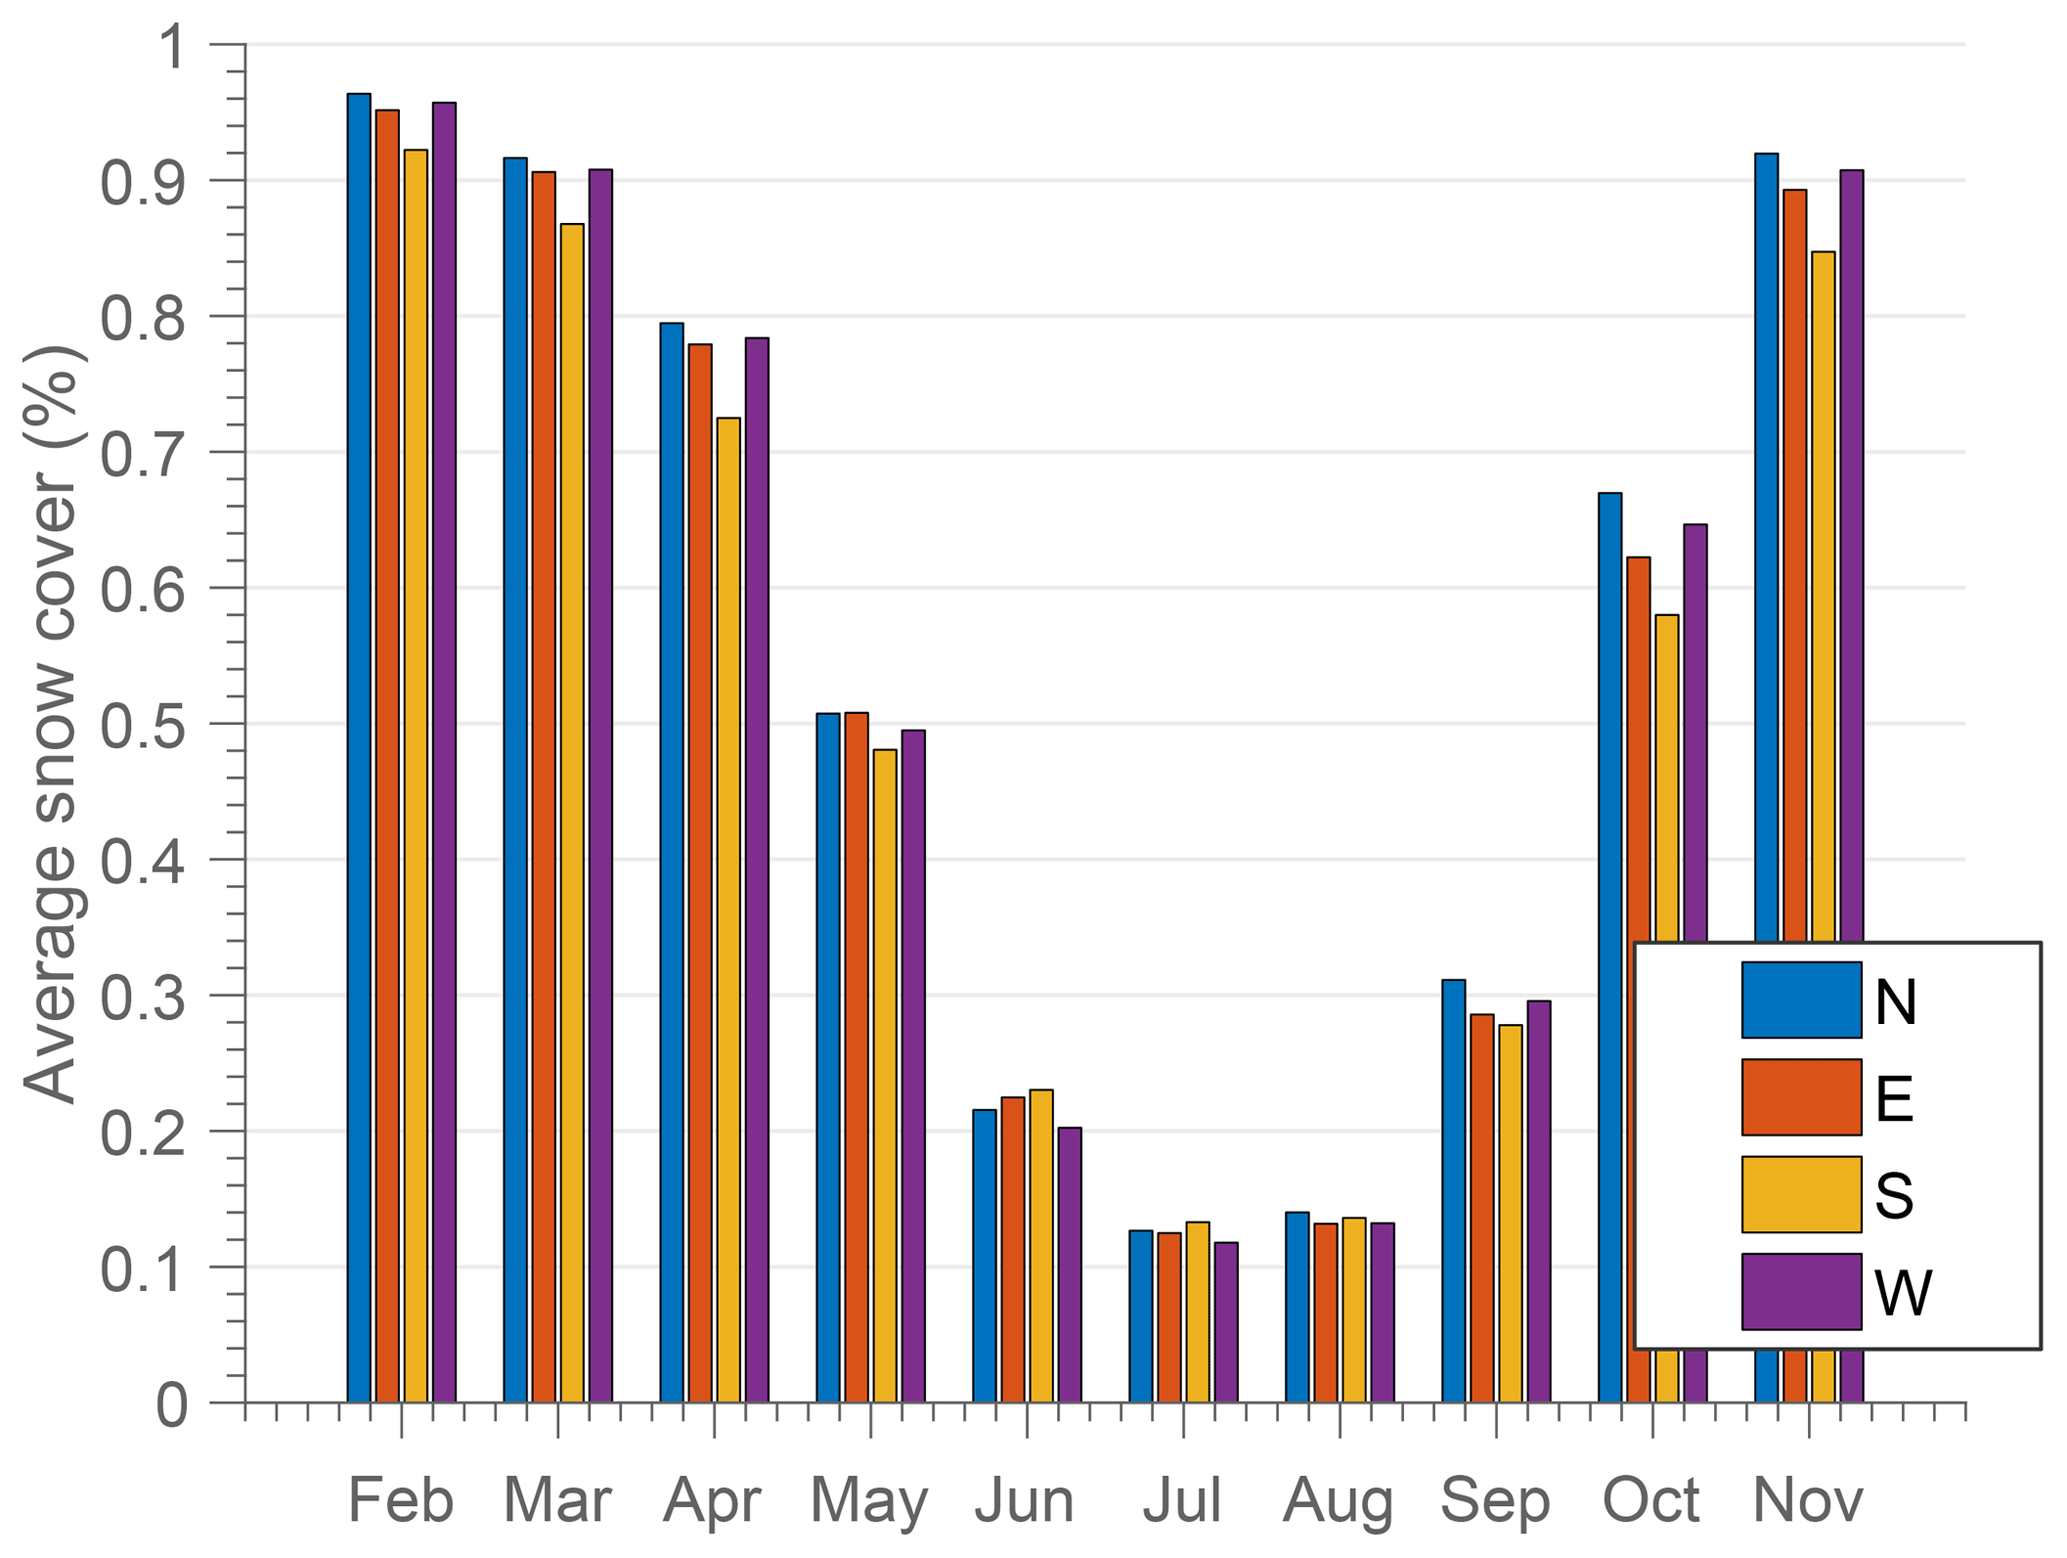
Figure 14Average aspect distribution of snow cover for 2000–2018. Fractions of area for each aspect are 22.8 % for 0–90∘, 23.8 % for 90–180∘, 23.4 % for 180–270∘ and 26.6 % for 270–360∘.
Figure 13 shows average snow cover extent for different elevation bands for Iceland. The influence of elevation on the average snow cover extent is a strong controlling factor where large areas over 800 m a.s.l. retain the snow cover throughout the summer. During spring (April/May) a strong increase in snow cover extent was observed between 0 and 200 m a.s.l. and for the evaluation bands above 200 m a.s.l. This is consistent with results from Björnsson et al. (2018), where the annual average 0 ∘C isotherm is defined as ranging from 200 to 300 m a.s.l. During winter, elevations over 600 m a.s.l. are mostly fully covered with snow. The snowmelt season occurs in April to July, depending on elevation. In the fall a strong increase was also observed between September and October. Figure 14 shows the distribution of snow cover within the four main aspect classes (N, E, W, S). During February, March, April, October and November it shows that the snow cover tends to persist longer on the north-, west-, and east-facing slopes. During summer (June, July, August) this effect is less dominant. This is consistent with the expected snowpack energy balance, where in general north-facing slopes receive less solar radiation for melt while east- and west-facing slopes are exposed to a similar amount of solar radiation at different times of the day (west facing in the afternoon and east facing in the morning).
In this study, a gap-filled satellite-observed snow cover was produced from daily MODIS Aqua ∕ Terra observations with duration from early 2000 until 2018 at a 500 m spatial resolution. Overall a good agreement was found between the daily combined MODIS Terra ∕ Aqua data set and the validation data sets from Landsat 7/8, Sentinel 2 and in situ observations in Iceland. The Landsat and Sentinel data showed that boundary artifacts were present in the MODIS product at cloud–land boundaries, while no seasonal patterns of agreement were found when validating alternative remotely sensed products.
Average cloud cover in Iceland is high (75 % average), providing a significant limitation to the application of MODIS data and all optical remote-sensing instruments. No significant temporal patterns were found in cloud cover, while the central highland in general has lower average cloud cover. This was addressed with temporal aggregation of data where the tradeoff from temporal aggregation (7 d) could have implications for hydrological applications of the data set where onset of melt and melt events could be retained or smoothed out of the product. This was also a limitation for identifying rain on snow events during winter.
Availability of MODIS data during polar darkness was also a temporal limitation for the data set. From late November to mid January no data were available, which limits the application of the data set to identify rain on snow events that can cause flooding and deplete areas of snowpack. Due to the dynamics of Icelandic snow during winter, especially at lower elevations, this is challenging to solve without combining other data sources such as snow models or other sources of remote sensing, for example synthetic aperture radar such as the ESA's Sentinel 1, which has a frequent overpass over Iceland.
The changes over time (trend) analyzed for the 18 years showed a slight increase in average snow cover in spring, likely driven by cold springs in 2013, 2014 and 2015 and extended liquid-phase precipitation in the fall for the same years. This aligns with observations of winter mass balance of Icelandic glaciers in recent years with a slight significant positive trend for the past 20 years (Pálsson and Gunnarsson, 2016c) as well as an observed precipitation increase (Björnsson et al., 2018). These results are consistent with previous findings that suggest that an slight increase in snow cover extent/area is observed in Iceland (Eythorsson et al., 2019; Wang et al., 2018) even though a general decreasing snow cover extent/area and shortening of the melt season in the Northern Hemisphere is reported in many other studies (Choi et al., 2010; Hori et al., 2017).
Another influencing factor for onset of melt and melt enhancement is radiative forcing by light-absorbing particles (Painter et al., 2018; Skiles et al., 2018). Due to frequent volcanic eruptions in Iceland volcanic ash and tephra can be transported great distances (Gudmundsson et al., 2012; Sólnes et al., 2013). The volcanic eruptions in Eyjafjallajökull in 2010 and Grímsvötn in 2011 took place in April and May, respectively, and are within the MODIS data period (2000–2018). Figures 9 and 12 show no clear sign of melt enhancement for spring 2010 and 2011, although albedo and summer melt of Icelandic glaciers were greatly influenced (Gascoin et al., 2017; Pálsson and Gunnarsson, 2016c).
The gap-filled snow cover product provides a useful tool to monitor and analyze inter-annual variability and long-term trends in snow cover in Iceland. The methodology applied here can be applied to other satellite sensors such as Sentinel 3 or the Visible Infrared Imaging Radiometer Suite (VIIRS) to extend the temporal range of data beyond the MODIS mission.
Code used in the project to process data is available at https://github.com/andrigunn/isca (Gunnarsson, 2019). MODIS data are available from https://nsidc.org/data/ (Hall and Riggs, 2016b), Sentinel 2 data are available at https://scihub.copernicus.eu/dhus/ (European Space Agency, 2018), and Landsat 7 and 8 data are available at https://earthexplorer.usgs.gov/ (United States Geological Survey, 2018). Data set tiles, paths and version numbers are defined in Sect. 2. Geospatial data for Iceland are available from the National Land Survey of Iceland at https://atlas.lmi.is/LmiData/index.php (National Land Survey of Iceland, 2018). Observations of snow cover from manned IMO sites are available upon request to fyrirspurnir@vedur.is.
AG conceived and designed the study, performed the analyses, and prepared the manuscript. SMG and ÓGBS contributed to the study design, interpretation of the results, and writing of the manuscript.
The authors declare that they have no conflict of interest.
We would like to thank Jessica D. Lundquist, University of Washington, for discussion and valuable feedback during the design of the study. Special thanks to Helgi Jóhannesson, project manager at Landsvirkjun, for providing constructive feedback during review of the manuscript. The Valle Scholarship and Scandinavian Exchange Program at the University of Washington is also thanked for financial support during the academic year 2017–2018 at the University of Washington.
This paper was edited by Ryan Teuling and reviewed by two anonymous referees.
Adam, J. C., Hamlet, A. F., and Lettenmaier, D. P.: Implications of Global Climate Change for Snowmelt Hydrology in the Twenty-First Century, Hydrol. Process., 23, 962–972, https://doi.org/10.1002/hyp.7201, 2008. a
Barichivich, J., Briffa, K. R., Myneni, R. B., Osborn, T. J., Melvin, T. M., Ciais, P., Piao, S., and Tucker, C.: Large-scale variations in the vegetation growing season and annual cycle of atmospheric CO2 at high northern latitudes from 1950 to 2011, Global Change Biol., 19, 3167–3183, https://doi.org/10.1111/gcb.12283, 2013. a
Barnett, T. P., Adam, J. C., and Lettenmaier, D. P.: Potential Impacts of a Warming Climate on Water Availability in Snow-Dominated Regions, Nature, 438, 303–309, 2005. a
Barry, R. G.: The Role of Snow and Ice in the Global Climate System: A Review, Polar Geography, 26, 235–246, https://doi.org/10.1080/789610195, 2002. a
Baumgartner, M. F., Seidel, K., and Martinec, J.: Toward Snowmelt Runoff Forecast Based on Multisensor Remote – Sensing Informnation, IEEE T. Geoscie. Remote, 25, 746–750, https://doi.org/10.1109/TGRS.1987.289744, 1987. a
Björnsson, H.: The Annual Cycle of Temperature in Iceland, Reykjavík, Veðurstofa Íslands, Reykjavík, 2003 October, 2003. a
Björnsson, H. and Pálsson, F.: Icelandic Glaciers, Jökull, 365–386, 2008. a
Björnsson, H. and Thorsteinsson, T.: Climate Change and Energy Systems: Impacts, Risks and Adaptation in the Nordic and Baltic Countries, TemaNord, Nordic Council of Ministers, Copenhagen, https://doi.org/10.6027/TN2011-502, 2012. a
Björnsson, H., Sigurðsson, B. D., Davíðsdóttir, B., Ólafsson, J. S., Ástþórsson, O. S., Ólafsdóttir, S., Baldursson, T., and Jónsson, J.: Loftslagsbreytingar Og Áhrif Þeirra á Íslandi: Skýrsla Vísindanefndar Um Loftslagsbreytingar 2018, Tech. Rep., Veðurstofa Íslands, Reykjavík, 238 pp., 2018. a, b, c
Choi, G., Robinson, D. A., and Kang, S.: Changing Northern Hemisphere Snow Seasons, J. Climate, 23, 5305–5310, https://doi.org/10.1175/2010JCLI3644.1, 2010. a, b, c
Crochet, P., Jóhannesson, T., Jónsson, T., Sigurðsson, O., Björnsson, H., Pálsson, F., and Barstad, I.: Estimating the Spatial Distribution of Precipitation in Iceland Using a Linear Model of Orographic Precipitation, J. Hydrometeorol., 8, 1285–1306, https://doi.org/10.1175/2007JHM795.1, 2007. a
Delwart, S.: ESA Standard Document, Tech. Rep., European Space Agency, 64 pp., 2015. a
Déry, S. J., Salomonson, V. V., Stieglitz, M., Hall, D. K., and Appel, I.: An Approach to Using Snow Areal Depletion Curves Inferred from MODIS and Its Application to Land Surface Modelling in Alaska, Hydrol. Process., 19, 2755–2774, https://doi.org/10.1002/hyp.5784, 2005. a
DeWalle, D. R. and Rango, A.: Principles of Snow Hydrology, Cambridge University Press, Cambridge, https://doi.org/10.1017/CBO9780511535673, 2008. a
Dewey, K. F.: Satellite-Derived Maps of Snow Cover Frequency for the Northern Hemisphere, J. Clim. Appl. Meteorol., 26, 1210–1229, 1987. a
Dietz, A. J., Wohner, C., and Kuenzer, C.: European Snow Cover Characteristics between 2000 and 2011 Derived from Improved MODIS Daily Snow Cover Products, Remote Sens., 4, 2432–2454, https://doi.org/10.3390/rs4082432, 2012. a, b
Dozier, J. and Marks, D.: Snow Mapping and Classification from Landsat Thematic Mapper Data, Ann. Glaciol., 9, 97–103, https://doi.org/10.3189/S026030550000046X, 1987. a
Einarsson, E., Jóhannesson, H., Sigurðsson, O., Eldjárn, O., Sigurðsson, O., and Hansen, H. H.: Íslandsatlas, Reykjavík, Edda, 2005, Reykjavík, 2005. a
Einarsson, M. A.: Climates of the Oceans, Vol. 15 of World Survey of Climatology, edited by: Van Loon, H., J. Climatol., 5, 673–697, https://doi.org/10.1002/joc.3370050110, 1984. a, b
European Space Agency: Copernicus Open Access Hub, available at: https://scihub.copernicus.eu/dhus/, last acces: 1 September 2018. a
Eythorsson, D., Gardarsson, S. M., Ahmad, S. K., Hossain, F., and Nijssen, B.: Arctic climate and snow cover trends – Comparing Global Circulation Models with remote sensing observations, Int. J. Appl. Earth Obs., 80, 71–81, https://doi.org/10.1016/j.jag.2019.04.003, 2019. a, b
Fernandes, R., Zhao, H. X., Wang, X. J., Key, J., Qu, X., and Hall, A.: Controls on Northern Hemisphere Snow Albedo Feedback Quantified Using Satellite Earth Observations, Geophys. Res. Lett., 36, L21702, https://doi.org/10.1029/2009gl040057, 2009. a
Fischer, A., Olefs, M., and Abermann, J.: Glaciers, Snow and Ski Tourism in Austria's Changing Climate, Ann. Glaciol., 52, 89–96, https://doi.org/10.3189/172756411797252338, 2011. a
Fontrodona Bach, A., van der Schrier, G., Melsen, L. A., Klein Tank, A. M. G., and Teuling, A. J.: Widespread and Accelerated Decrease of Observed Mean and Extreme Snow Depth Over Europe, Geophys. Res. Lett., 45, 12312–12319, https://doi.org/10.1029/2018GL079799, 2018. a
Gao, Y., Xie, H., Yao, T., and Xue, C.: Integrated Assessment on Multi-Temporal and Multi-Sensor Combinations for Reducing Cloud Obscuration of MODIS Snow Cover Products of the Pacific Northwest USA, Remote Sens. Environ., 114, 1662–1675, https://doi.org/10.1016/j.rse.2010.02.017, 2010. a
Gascoin, S., Hagolle, O., Huc, M., Jarlan, L., Dejoux, J.-F., Szczypta, C., Marti, R., and Sánchez, R.: A snow cover climatology for the Pyrenees from MODIS snow products, Hydrol. Earth Syst. Sci., 19, 2337–2351, https://doi.org/10.5194/hess-19-2337-2015, 2015. a, b, c, d, e
Gascoin, S., Guðmundsson, S., Aðalgeirsdóttir, G., Pálsson, F., Schmidt, L., Berthier, E., and Björnsson, H.: Evaluation of MODIS Albedo Product over Ice Caps in Iceland and Impact of Volcanic Eruptions on Their Albedo, Remote Sens., 9, 399, https://doi.org/10.3390/rs9050399, 2017. a
GDAL/OGR contributors: GDAL/OGR Geospatial Data Abstraction software Library, Open Source Geospatial Foundation, availabe at: https://gdal.org (last access: 1 May 2018), 2019. a
Gómez-Landesa, E., Rango, A., and Bleiweiss, M.: An Algorithm to Address the MODIS Bowtie Effect, Can. J. Remote Sens., 30, 644–650, https://doi.org/10.5589/m04-028, 2004. a
Gray, D. and Male, D.: Handbook of Snow: Principles, Processes, Management & Use, Blackburn Press, 776 pp., 2004.
Gudmundsson, M. T., Thordarson, T., Höskuldsson, Á., Larsen, G., Björnsson, H., Prata, F. J., Oddsson, B., Magnússon, E., Högnadóttir, T., Petersen, G. N., Hayward, C. L., Stevenson, J. A., and Jónsdóttir, I.: Ash generation and distribution from the April–May 2010 eruption of Eyjafjallajökull, Iceland, Sci. Rep., 2, 572, https://doi.org/10.1038/srep00572, 2012. a
Gunnarsson, A.: Code Repository for ISCA, available at: https://github.com/andrigunn/isca, last access: 15 January 2019. a
Hall, D. K. and Riggs, G. A.: Accuracy Assessment of the MODIS Snow Products, Hydrol. Process., 21, 1534–1547, https://doi.org/10.1002/hyp.6715, 2007. a
Hall, D. K. and Riggs, G. A.: MODIS/Aqua Snow Cover Daily L3 Global 500 m Grid, Version 6, Tech. Rep., NASA National Snow and Ice Data Center Distributed Active Archive Center, Boulder, Colorado USA, 2016a. a
Hall, D. K. and Riggs, G. A.: MODIS/Terra Snow Cover Daily L3 Global 500 m Grid, Version 6, Tech. Rep., NASA National Snow and Ice Data Center Distributed Active Archive Center, available at: https://nsidc.org/data/, https://doi.org/10.5067/MODIS/MOD10A1.006, Boulder, Colorado USA, 2016b. a, b
Hall, D. K., Riggs, G. A., Salomonson, V. V., DiGirolamo, N. E., and Bayr, K. J.: MODIS Snow-Cover Products, Remote Sens. Environ., 83, 181–194, https://doi.org/10.1016/S0034-4257(02)00095-0, 2002. a
Helsel, D. and Hirsch, R.: Statistical Methods in Water Resources Techniques of Water Resources Investigations, Tech. Rep., Book 4, Chapter A3, U.S. Geological Survey, 2002. a
Henriksen, S.: Report on the Approximation of the Annual Cycle of Temperature in Iceland, Reykjavík, Veðurstofa Íslands, February 2003, Reykjavík, 2003. a
Hjaltason, S., Guðmundsdóttir, M., Haukdal, J. A., and Guðmundsson, J. R.: Energy statistics in Iceland 2017, Energy Statistics in Iceland, Orkustofnun, 2 pp., 2018. a
Hori, M., Sugiura, K., Kobayashi, K., Aoki, T., Tanikawa, T., Kuchiki, K., Niwano, M., and Enomoto, H.: A 38-year (1978–2015) Northern Hemisphere daily snow cover extent product derived using consistent objective criteria from satellite-borne optical sensors, Remote Sens. Environ., 191, 402–418, https://doi.org/10.1016/j.rse.2017.01.023, 2017. a, b, c
Huang, X., Liang, T., Zhang, X., and Guo, Z.: Validation of MODIS Snow Cover Products Using Landsat and Ground Measurements during the 2001–2005 Snow Seasons over Northern Xinjiang, China, Int. J. Remote Sens., 32, 133–152, https://doi.org/10.1080/01431160903439924, 2011. a, b
IPCC: Climate Change 2013: The Physical Science Basis, Contribution of Working Group I to the Fifth Assessment Report of the Intergovernmental Panel on Climate Change, Cambridge University Press, Cambridge, United Kingdom and New York, NY, USA, https://doi.org/10.1017/CBO9781107415324, 2013. a
Jóhannesson, T. and Sigurðsson, O.: Samantekt Um Snjómælingar á Hálendi Íslands, Reykjavík, Veðurstofa Íslands, 2014, Reykjavík, 2014. a
Jóhannesson, T., Aðalgeirsdóttir, G., Björnsson, H., Crochet, P., Elíasson, E. B., Guðmundsson, S., Jónsdóttir, J. F., Ólafsson, H., Pálsson, F., Rögnvaldsson, Ó, Sigurðsson, O., Snorrason, Á., Blöndal Sveinsson, O. G., and Þorsteinn, Þ.: Effect of Climate Change on Hydrology and Hydro-Resources in Iceland, Reykjavík, Orkustofnun, 2007, Reykjavík, 2007. a, b
Sólnes, J., Sigmundsson, F., and Bessason, B.: Náttúruvá á Íslandi, eldgos og jarðskjálftar, Reykjavík, Viðlagatrygging Íslands, Háskólaútgáfan, 2013. a
Keller, F., Goyette, S., and Beniston, M.: Sensitivity Analysis of Snow Cover to Climate Change Scenarios and Their Impact on Plant Habitats in Alpine Terrain, Clim. Change, 72, 299–319, https://doi.org/10.1007/s10584-005-5360-2, 2005. a
Kiparsky, M., Joyce, B., Purkey, D., and Young, C.: Potential Impacts of Climate Warming on Water Supply Reliability in the Tuolumne and Merced River Basins, California, PLOS ONE, 9, e84946, https://doi.org/10.1371/journal.pone.0084946, 2014. a
Klein, A. G. and Barnett, A. C.: Validation of Daily MODIS Snow Cover Maps of the Upper Rio Grande River Basin for the 2000–2001 Snow Year, Remote Sens. Environ., 86, 162–176, https://doi.org/10.1016/S0034-4257(03)00097-X, 2003. a
Kundzewicz, Z.: Changes in Flood Risk in Europe, https://doi.org/10.1201/b12348, 2012. a
Lindsay, C., Zhu, J., Miller, E. A., Kirchner, P., and Wilson, L. T.: Deriving Snow Cover Metrics for Alaska from MODIS, Remote Sens., 7, https://doi.org/10.3390/rs71012961, 12961–12985, 2015. a
Liston, G. E. and Hiemstra, C. A.: The Changing Cryosphere: Pan-Arctic Snow Trends (1979-–2009), J. Climate, 24, 5691–5712, https://doi.org/10.1175/JCLI-D-11-00081.1, 2011. a
Louis, J., Debaecker, V., Pflug, B., Main-Knorn, M., Bieniarz, J., Mueller-Wilm, U., Cadau, E., and Gascon, F.: SENTINEL-2 SEN2COR: L2A processor for users, in: Living Planet Symposium, p. 8, 2016. a
Mann, H. B.: Nonparametric Tests Against Trend, Econometrica, 13, 245–259, https://doi.org/10.2307/1907187, 1945. a
Matlab: R2017a, The Mathworks Inc., Natick, Massachusetts, 2017. a
Matson, M.: NOAA Satellite Snow Cover Data, Operational satellites: Sentinels for the monitoring of climate and global change, Global Planet. Change, 4, 213–218, https://doi.org/10.1016/0921-8181(91)90095-E, 1991. a
Müller-Wilm, U.: S2 MPC. Sen2Cor – Configuration and User Manual, Tech. Rep., S2-PDGS-MPC-L2A-SUM-V2.5.5, 2018. a
Müller-Wilm, U., Louis, J., Richter, R., Gascon, F., and Niezette, M.: Sentinel-2 Level-2A Prototype Processor: Architecture, Algorithms and First Results, in: ESA Living Planet Symposium, Edinburgh, UK, 2013. a
National Land Survey of Iceland: IS 50V 24/12 2015 – Elevation data, available at: https://atlas.lmi.is/LmiData/index.php, last access: 1 January 2018. a
Ólafsson, H., Furger, M., and Brümmer, B.: The Weather and Climate of Iceland, Vol. 16, Meteorol. Z., https://doi.org/10.1127/0941-2948/2007/0185, 2007. a
Painter, T. H., Skiles, S. M., Deems, J. S., Brandt, W. T., and Dozier, J.: Variation in Rising Limb of Colorado River Snowmelt Runoff Hydrograph Controlled by Dust Radiative Forcing in Snow, Geophys. Res. Lett., 45, 797–808, https://doi.org/10.1002/2017GL075826, 2018. a
Pálsson, F. and Gunnarsson, A.: Langjökull, Afkomu- Og Hraðamælingar á Langjökli Jökulárið 2015–2016, Tech. Rep., Reykjavík, 2016a. a
Pálsson, F. and Gunnarsson, A.: Vatnajökull, Mass Balance, Meltwater Drainage and Surface Velocity of the Glacial Year 2014–2015, Tech. Rep., Reykjavík, 2016b. a
Pálsson, F. and Gunnarsson, A.: Vatnajökull, Mass Balance, Meltwater Drainage and Surface Velocity of the Glacial Year 2015–2016., Tech. Rep., Reykjavík, 2016c. a, b
Parajka, J. and Blöschl, G.: Validation of MODIS snow cover images over Austria, Hydrol. Earth Syst. Sci., 10, 679–689, https://doi.org/10.5194/hess-10-679-2006, 2006. a
Parajka, J. and Blöschl, G.: Spatio-Temporal Combination of MODIS Images – Potential for Snow Cover Mapping: Spatio-temporal combination of modis images, Water Resour. Res., 44, https://doi.org/10.1029/2007WR006204, 2008. a
Qu, X. and Hall, A.: What Controls the Strength of Snow-Albedo Feedback?, J. Climate, 20, 3971–3981, https://doi.org/10.1175/JCLI4186.1, 2007. a
Raleigh, M. S., Rittger, K., Moore, C. E., Henn, B., Lutz, J. A., and Lundquist, J. D.: Ground-Based Testing of MODIS Fractional Snow Cover in Subalpine Meadows and Forests of the Sierra Nevada, Remote Sens. Environ., 128, 44–57, https://doi.org/10.1016/j.rse.2012.09.016, 2013. a
Rist, S.: Vatns Er Þörf, Reykjavík, Menningarsjóður, 248 pp., 1990. a
Rittger, K., Painter, T., and Dozier, J.: Assessment of Methods for Mapping Snow Cover from MODIS, Adv. Water Res., 51 https://doi.org/10.1016/j.advwatres.2012.03.002, 367–380, 2012. a
Robinson, D. A., Dewey, K. F., and Heim, R. R.: Global Snow Cover Monitoring – An Update, B. Am. Meteorol. Soc., 74, 1689–1696, 1993. a
Salomonson, V. and Appel, I.: Estimating Fractional Snow Cover from MODIS Using the Normalized Difference Snow Index, Remote Sens. Environ., 89, 351–360, https://doi.org/10.1016/j.rse.2003.10.016, 2004. a
Salomonson, V. V. and Appel, I.: Development of the Aqua MODIS NDSI Fractional Snow Cover Algorithm and Validation Results, IEEE T. Geoscie. Remote, 44, 1747–1756, https://doi.org/10.1109/TGRS.2006.876029, 2006. a
Skiles, S. M., Flanner, M., Cook, J. M., Dumont, M., and Painter, T. H.: Radiative forcing by light-absorbing particles in snow, Nat. Clim. Change, 8, 964–971, https://doi.org/10.1038/s41558-018-0296-5, 2018. a
Sturm, M., Holmgren, J., and Liston, G. E.: A Seasonal Snow Cover Classification System for Local to Global Applications, J. Climate, 8, 1261–1283, https://doi.org/10.1175/1520-0442(1995)008<1261:ASSCCS>2.0.CO;2, 1995. a
Sturm, M., Taras, B., Liston, G. E., Derksen, C., Jonas, T., and Lea, J.: Estimating Snow Water Equivalent Using Snow Depth Data and Climate Classes, J. Hydrometeorol., 11, 1380–1394, https://doi.org/10.1175/2010JHM1202.1, 2010. a
Sveinsson, O.: Energy in Iceland: Adaptation to Climate Change, UNU-FLORES Policy Briefs, United Nations University Institute for Integrated Management of Material Fluxes and of Resources (UNU-FLORES), Dresden, 4 pp., 2016. a
Þorsteinsson, Þ., Jóhannesson, T., Sigurðsson, O., and Einarsson, B.: Afkomumælingar á Hofsjökli 1988–2017, Reykjavik, Veðurstofa Íslands, 2017. a
Traustason, B. and Snorrason, A.: Spatial Distribution of Forests and Woodlands in Iceland in Accordance with the CORINE Land Cover Classification, Iceland Agriculutre Science, 21, 39–47, 2008. a
United States Geological Survey: Landsat Earth Explorer, available at: https://earthexplorer.usgs.gov/, last access: 1 September 2018. a
USGS: Landsat 7 (L7) Data Users Handbook, Tech. Rep., LSDS-1927, USGS, Sioux Falls, South Dakota, 2018. a
USGS: Product guide – Landsat 8 surface reflectance code (LASRC) product, Version 4.3, Tech. Rep., Department of the Interior U.S. Geological Survey, 2019. a
Vaughan, D., Comiso, J., Allison, I., Carrasco, J., Kaser, G., Kwok, R., Mote, P., Murray, T., Paul, F., Ren, J., Rignot, E., Solomina, O., Steffen, K., and Zhang, T.: Observations: Cryosphere, in: Climate Change 2013: The Physical Science Basis. Contribution of Working Group I to the Fifth Assessment Report of the Intergovernmental Panel on Climate Change, edited by: Stocker, T., Qin, D., Plattner, G.-K., Tignor, M., Allen, S., Boschung, J., Nauels, A., Xia, Y., Bex, V., and Midgley, P., Cambridge University Press, Cambridge, United Kingdom and New York, NY, USA, 317–382, https://doi.org/10.1017/CBO9781107415324.012, 2013. a
Veðurstofa Íslands: Reglur Um Veðurathuganir, Skýrslufærslur Og Skeytasendingar á Skeytastöðvum, Tech. Rep., VÍ-ES01, Veðurstofa Íslands, Reykjavík, 2008. a
Veðurstofa Íslands: Verkbeiðnakerfi Veðurstofunnar – Útgáfu Númer (ID) 49996, Dataset ID 49996, Veðurstofa Íslands, Reykjavík, 2017. a
Wagner, T., Themeßl, M., Schüppel, A., Gobiet, A., Stigler, H., and Birk, S.: Impacts of Climate Change on Stream Flow and Hydro Power Generation in the Alpine Region, Environ. Earth Sci., 76, 4, https://doi.org/10.1007/s12665-016-6318-6, 2016. a
Wang, Y., Huang, X., Liang, H., Sun, Y., Feng, Q., and Liang, T.: Tracking Snow Variations in the Northern Hemisphere Using Multi-Source Remote Sensing Data (2000–2015), Remote Sens., 10, https://doi.org/10.3390/rs10010136, 2018. a, b
Warren, S. G.: Optical Properties of Snow, Rev. Geophys., 20, 67–89, https://doi.org/10.1029/RG020i001p00067, 1982. a