the Creative Commons Attribution 4.0 License.
the Creative Commons Attribution 4.0 License.
 | 28 May 2019
Reconstructed natural runoff helps to quantify the relationship between upstream water use and downstream water scarcity in China's river basins
Xinyao Zhou
Yonghui Yang
Zhuping Sheng
Yongqiang Zhang
The increasing conflicts for water resources between upstream and downstream regions appeal to chronological insight across the world. While the negative consequence of downstream water scarcity has been widely analyzed, the quantification of influence of upstream water use on downstream water scarcity has received little attention. Here non-anthropologically intervened runoff (natural runoff) was first reconstructed in upstream, middle stream and downstream regions in China's 12 large basins in the 1970s to 2000s time period using the Fu–Budyko framework, and then compared to the observed data to obtain the developmental trajectories of water scarcity, including the ratio of water use to availability (WTA) and the per capita water availability (FI; Falkenmark Index) on a decadal scale. Furthermore, a contribution analysis was used to investigate the main drivers of water scarcity trajectories in those basins. The results show that China as a whole has experienced a rapid increase of WTA stress with surface water use rapidly increasing from 161 billion cubic meters (12 % of natural runoff) in the 1970s to 256 billion cubic meters (18 %) in the 2000s, with approximately 65 % increase occurring in northern China. In the 2000s, the increase of upstream WTA stress and the decrease of downstream WTA stress occurred simultaneously for semi-arid and arid basins, which was caused by the increasing upstream water use and the consequent decreasing surface water use in downstream regions. The influence of upstream surface water use on downstream water scarcity was less than 10 % in both WTA and FI for humid and semi-humid basins during the study period, but with an average of 26 % in WTA and 32 % in FI for semi-arid and arid basins. The ratio increased from 10 % in the 1970s to 37 % in the 2000s for WTA and from 22 % in the 1980s to 37 % in the 2000s for FI. The contribution analysis shows that the WTA contribution greatly increases in the 2000s mainly in humid and semi-humid basins, while it decreases mainly in semi-arid and arid basins. The trajectories of China's water scarcity are closely related to socioeconomic development and water policy changes, which provide valuable lessons and experiences for global water resources management.
- Article
(2941 KB) - Full-text XML
- BibTeX
- EndNote


Water scarcity is one of the major challenges which hampers the United Nations sustainable development goals. This is particularly important for downstream areas where upstream water inflow is needed to satisfy downstream water demand exceeding local-generated water resources. It was estimated that up to 1 billion people would have water scarcity problems if upstream water was not provided for downstream areas (Oki et al., 2001). Upstream drought and excessive water use would exacerbate downstream water scarcity, causing consequent cooperative or conflictive events (Munia et al., 2016). These facts make it critical to understand the influence of upstream water use on downstream water scarcity under a changing climate and with intensified human activities.
Many studies have been conducted to analyze the negative impacts of upstream water use on the downstream environment (Poff et al., 2007; Arfanuzzaman and Syed, 2018), on biology (Brown and King, 2006; Petes et al., 2012), on water quality (Dodds and Oakes, 2008), and on socioeconomic issues (Jack, 2009; Nordblom et al., 2012; Al-Faraj and Tigkas, 2016). Despite the widespread recognition of the negative impacts, only limited quantitative research studies have been performed to unravel the upstream–downstream interactions on water resources and water scarcity. Munia et al. (2016) simulated water use and water availability using the PCR-GLOBWB (PCRaster GLOBal Water Balance) model in global transboundary river basins in 2010 and found that 288 out of 298 middle stream and downstream sub-basin areas experienced some change in stress levels after accounting for upstream water use, affecting 0.29–1.13 billion people in transboundary river basins. Veldkamp et al. (2017) used a global multi-model assessment to examine the impact of different human interventions (HI) on monthly water scarcity over the period 1971–2010. Their results showed that HI was the main driver of water scarcity, aggravating water scarcity for 8.8 % of the global population but alleviating it for another 8.3 %. Positive impacts of HI mostly occur upstream, whereas HI aggravates water scarcity downstream. Duan et al. (2018) investigated the water availability and water stress over the conterminous US (CONUS) from 1981 to 2010 using statistical water use data and simulated water supply using the WaSSI (Water Supply Stress Index) model. They found that 12 % of the CONUS land relied on upstream incoming flow for adequate water supply, while local water alone was sufficient to meet the demand in another 74 % of the area. Munia et al. (2018) developed a framework to quantify the dependency of downstream water stress on upstream water supply and applied the framework to global transboundary river basins. Surprisingly, they found that the majority (1.15 billion) of those people (1.18 billion) currently suffer from water stress only because they excessively use water within each basin and the water use from upstream does not have significant impact on the downstream stress status. These studies, however, either focused on transboundary river basins or dependency analysis, and indirectly indicate the importance of upstream water inflow to downstream water scarcity. There is a great need for direct quantification of influence of upstream water use on downstream water scarcity in river basins as a whole.
As one of three countries with the greatest water-risk hotspots, China is facing serious water stress, especially in its northeastern regions (OECD, 2017). Meanwhile, the downstream environment has been severely deteriorated in some arid basins (Li et al., 2013; Lu et al., 2015; Zhao et al., 2016). Therefore, this study selected China in order to quantify the impact of upstream water use on downstream water scarcity. Understanding the past trajectories of China's water scarcity in upstream and downstream catchments, and quantifying the relationships between upstream water use and downstream water scarcity, can help to better define pathways to future sustainability, to avoid further irreversible environmental degradation, and to address future challenges of climate change and human interventions.
Water scarcity can be divided into two aspects: water availability and water use (Kummu et al., 2016). Water-availability-induced scarcity is a “demographic-driven scarcity” when a large population compete for limited water resources, leading to disputes. Water-use-caused scarcity refers to a “demand-driven scarcity” when excessive water is consumed due to socioeconomic development but irrelevant to the population (Falkenmark, 1997; Kummu et al., 2010). The combined use of the two aspects can therefore provide a complete picture to describe water scarcity.
It is difficult to get long-term water use and the related water scarcity data in China due to data inaccessibility. As a substitution, the gap between observed runoff and modeled non-anthropologically intervened runoff (hereafter called natural runoff) can be treated as surface water use. There are numerous studies on natural runoff driven by process-based models such as VIC (Variable Infiltration Capacity) (Wang et al., 2010; Chang et al., 2015), WBM (water balance model) (Guo et al., 2017), ORCHIDEE (Organizing Carbon and Hydrology in Dynamics Ecosystems) (Piao et al., 2007), and SWAT (Soil and Water Assessment Tool) (Luo et al., 2016). However, difficulties in calibrating complex parameters limit model application to one or a few basins (Zhang et al., 2007; Jiang et al., 2015; Zhai and Tao, 2017). In comparison, Budyko framework is widely used at an annual to decadal scale and in a large spatial scale (Zhang et al., 2001, 2009; Zheng et al., 2009). Six Budyko framework models were tested here and eventually the one-parameter Fu–Budyko model was used to reconstruct natural runoff in the catchments because of its optimal performance (Fu, 1981). The Fu–Budyko model has also been successfully validated across the globe (Teng et al., 2012; Zhou et al., 2012; Li et al., 2013; Du et al., 2016). As such, this study used this model to reconstruct decadal natural runoff for the period of 1961–2010 in upstream and downstream regions within 12 large basins in China which cover over 50 % of mainland China.
Table 1Sources of hydrological data and locations of runoff gauges.
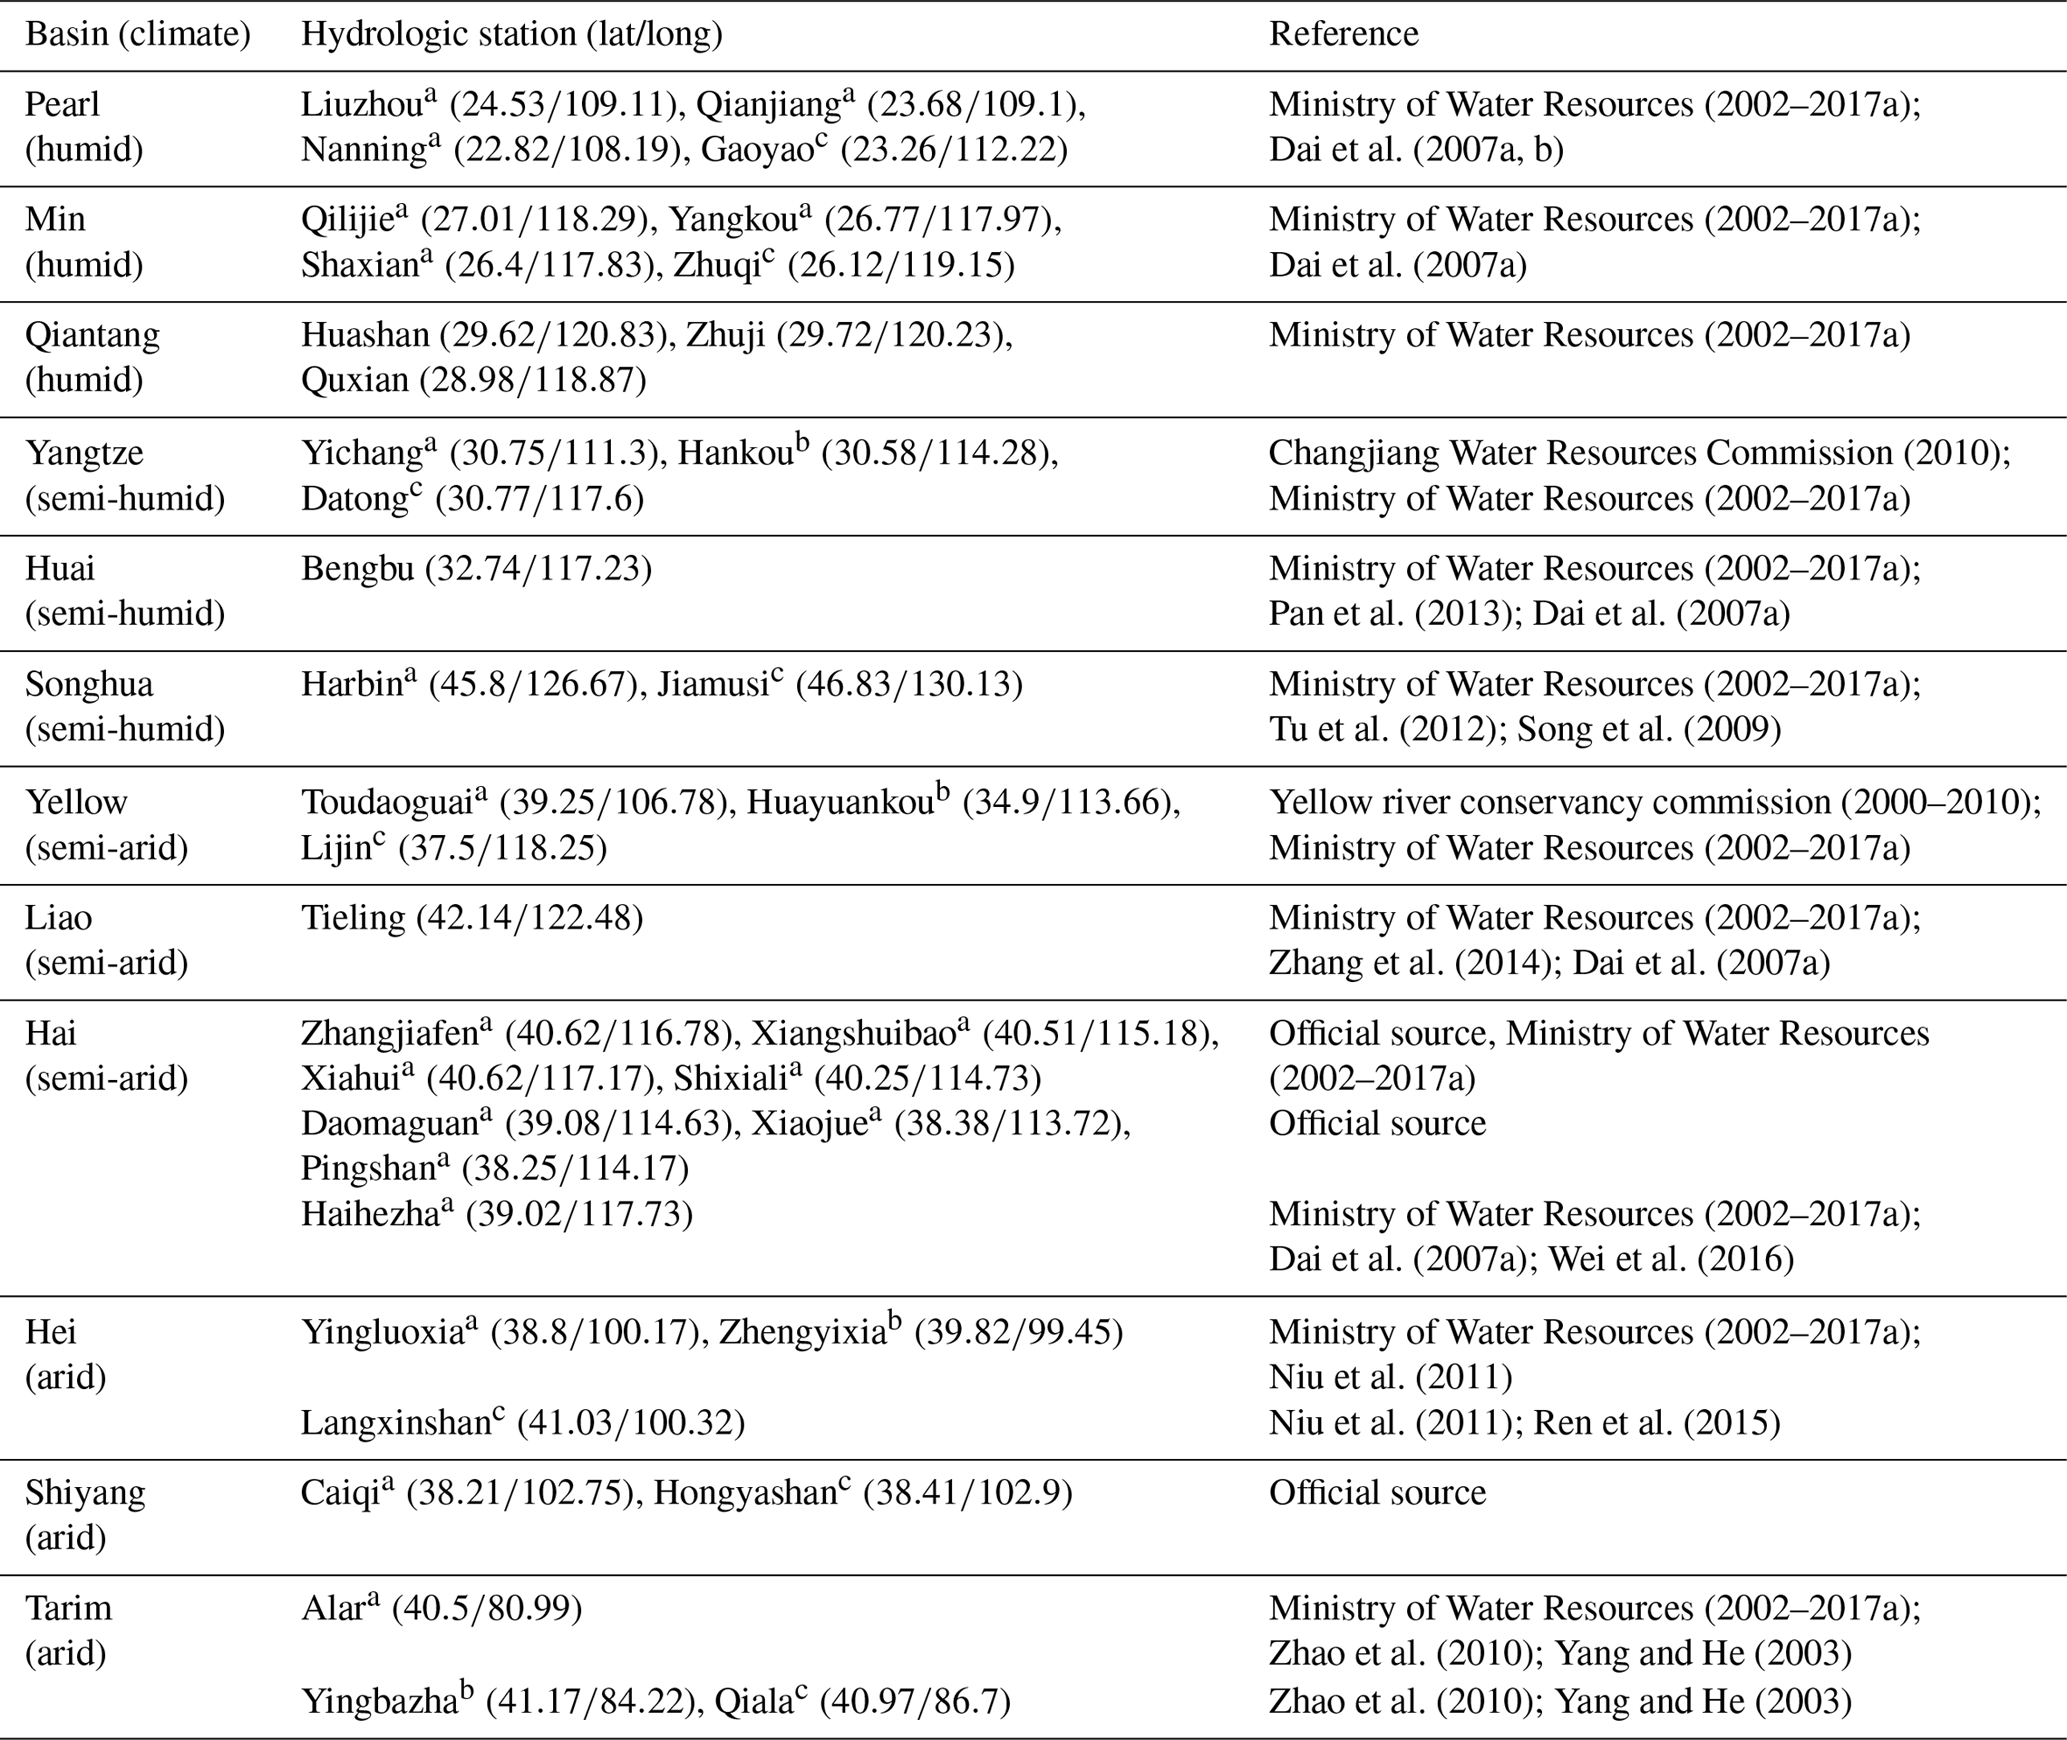
a represents upstream gauges. b represents middle stream gauges. c represents downstream gauges.
In this study, we aim to answer the following three questions and provide experiences and lessons for global water resources management.
- i.
How has surface water scarcity developed in upstream and downstream regions of the selected basins in China during the past decades?
- ii.
How can the influence of upstream water use on downstream water scarcity be quantified?
- iii.
What is the main factor that has driven China's water scarcity change?
2.1 Materials
2.1.1 Hydrological data
Since digital runoff data are limited in China, we obtained runoff data from the following two sources: official sources in Hai and Shiyang River basins, and published literature (Table 1). The reliability of the published annual runoff data were verified based on the following two criteria. First, for a specific gauge station, at least two related published data sources of overlapping study periods were prepared. Then the annual runoff data was extracted and a cross validation conducted to limit errors below 5 %. Second, the published annual runoff data were further verified by comparing the trends in the processed data and in other data published, such as published work for Dongting lake by Yang et al. (2015), for Huangpu river by Shi and Wang (2015) and so on.
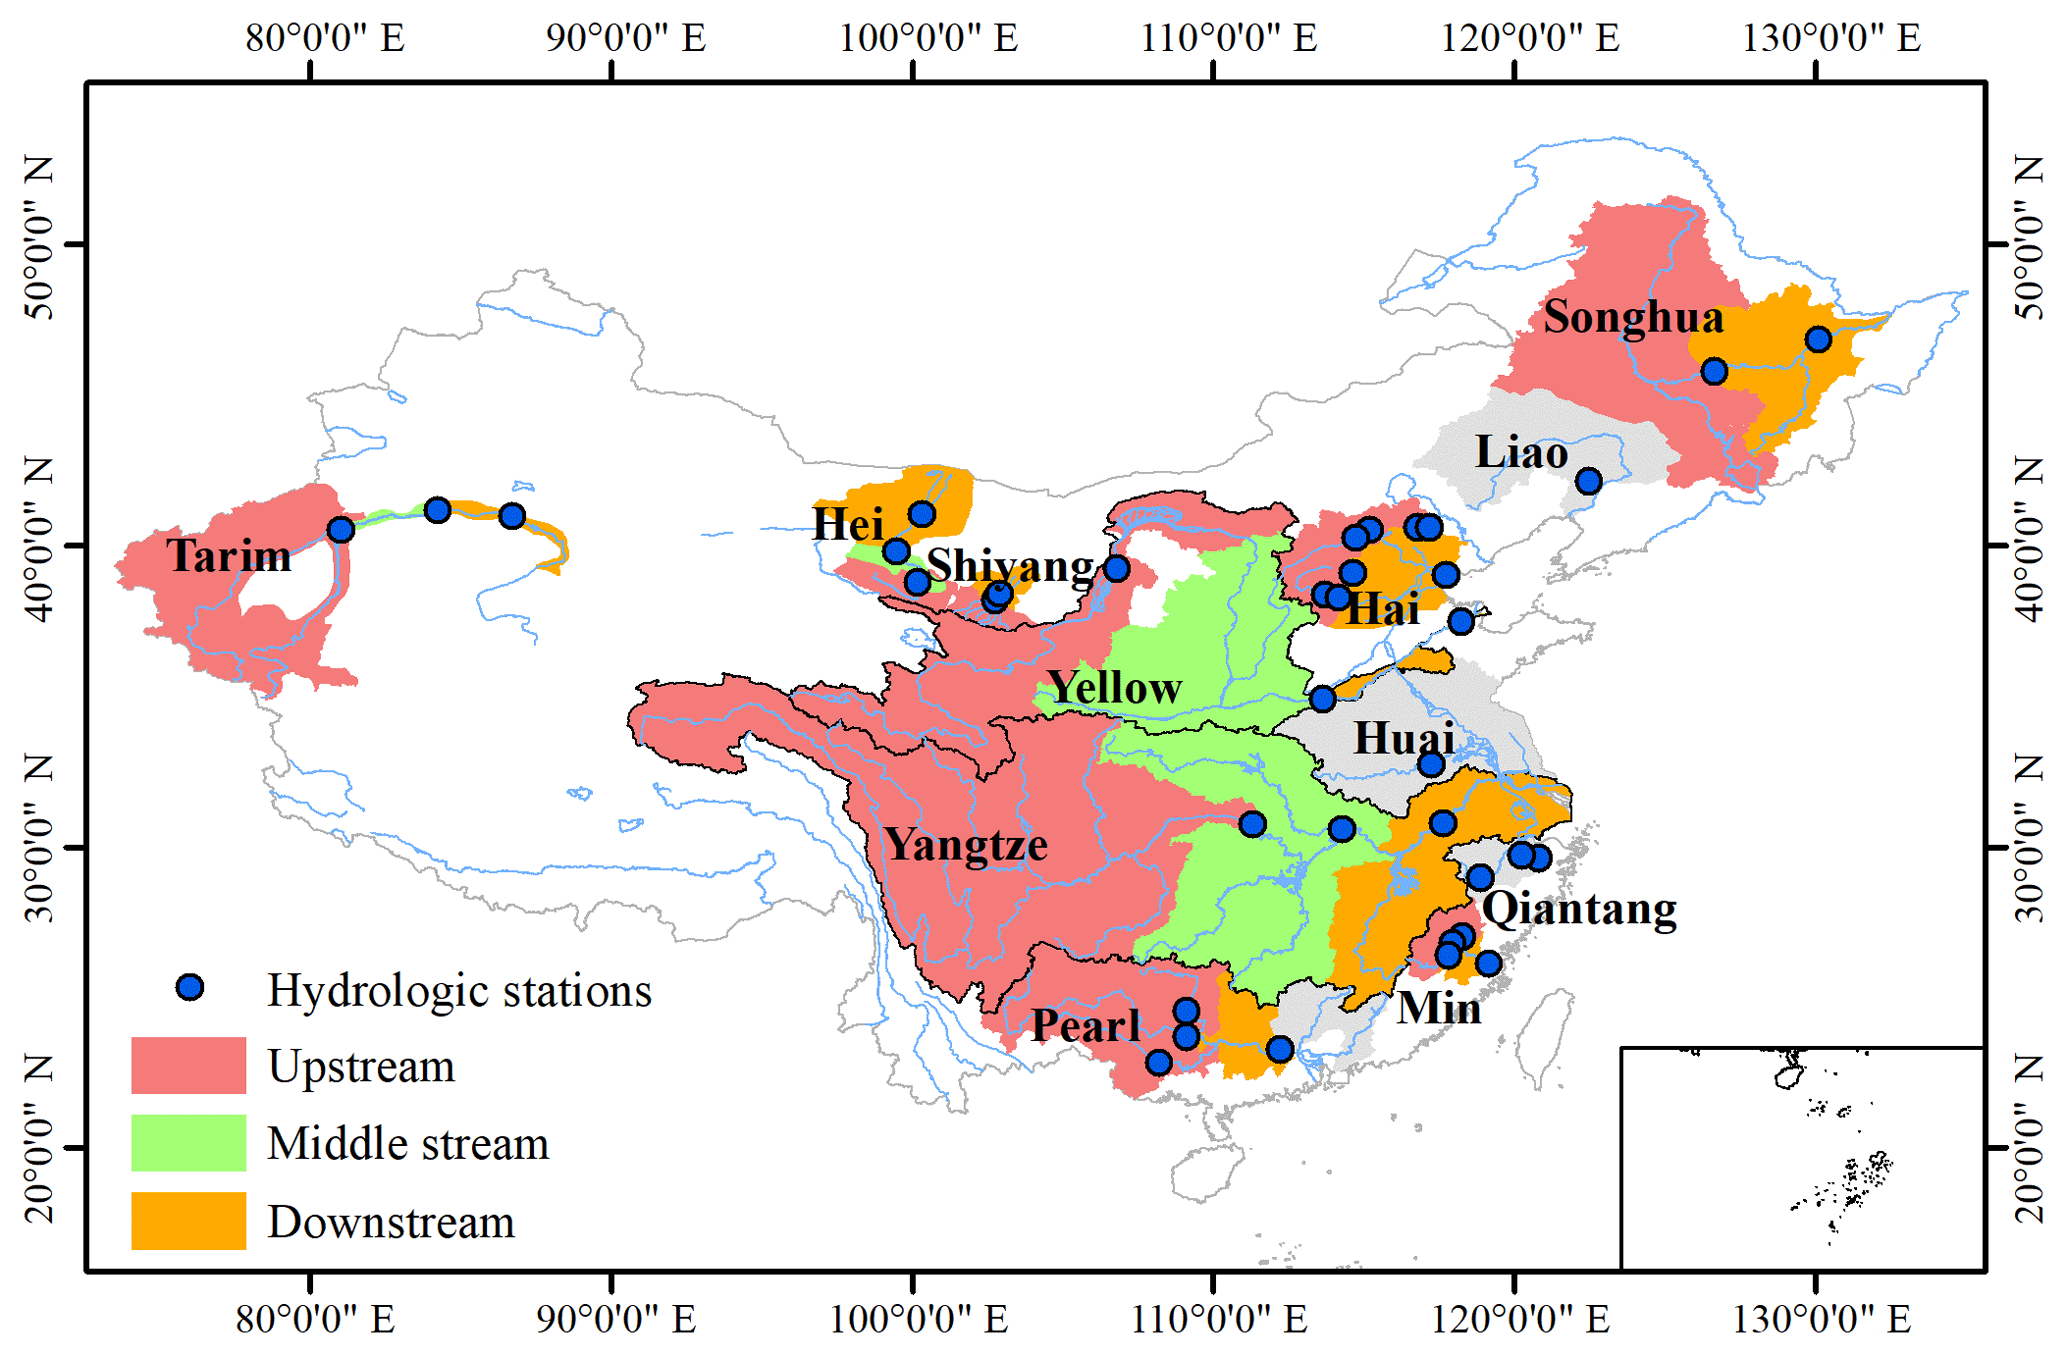
Figure 1The locations of the 12 basins and 37 hydrologic stations. Upstream, middle stream, and downstream were identified by red, green, and yellow colors, respectively.
The annual runoff measured in a total of 132 gauge stations was verified. Based on the record period and spatial distribution of the data, 37 gauge stations that are representative for upper, middle, and lower reaches were used in this analysis. While the recording period of the data from 29 out of 37 basins spanned over the entire period of 1961–2010, data from other eight basins spanned over 40 years. The basin boundaries were based on the delineations in “Data Sharing Infrastructure of Earth System Science” (http://www.geodata.cn/, last access: 13 May 2019) and sub-basin boundaries were delineated in the ArcHydro tool (Fig. 1).
2.1.2 Climatic factors
Gridded monthly precipitation and temperatures (maximum, minimum and mean temperatures) for 1961–2010 were downloaded from “China Meteorological Data Sharing Service System” (http://data.cma.cn/, last access: 13 May 2019). The spatial resolution of the gridded dataset is 0.5∘ × 0.5∘. The gridded datasets were produced by merging resampled GTOPO30 dataset and interpolated climate data from 2472 stations using the TPS (thin plate spline) method. Also daily climate data at point scale (maximum and minimum temperature, wind speed, relative humidity, and sunshine hours) from 563 national weather stations for the period 1961–2010 were downloaded from the same website.
2.1.3 Population data
The population data from Gridded Population of the World (GPW) (http://sedac.ciesin.columbia.edu/data/collection/gpw-v4, last access: 13 May 2019) were used to estimate the basin-scale population. Given the limitation of the data recording lengths, the GPW data for 1990, 2000, and 2010 were respectively used to get the population for the 1980s, 1990s, and 2000s. The resolution was ∼5 km for the 1990 and 2000 datasets and ∼1 km for 2010 dataset.
2.2 Methods
2.2.1 Fu–Budyko framework
The Fu–Budyko framework is expressed as follows:
where F(φ) is evaporation ratio, φ is the aridity index (AI), calculated from ratio of potential evapotranspiration (ET0) to precipitation (P) on annual scale, the θ parameter is related to catchment characteristics with the range of 1∼∞. In this study, AI of each catchment was calculated at mean annual scale for the period of 1961–2010 and the catchments were classified into humid, semi-humid, semi-arid, and arid for AI ranging from 0.375–0.75, 0.75–2, 2–5, and 5–12, respectively (Ponce et al., 2000; Arora, 2002). Annual natural runoff was calculated in the unit of millimeters per year as , and then changed into discharge in units of billions of cubic meters per year by multiplying the catchment area.
Studies have shown that anthropologic interventions have intensified across China since the 1980s, driven by the economic reform and the open-door policy (Yang and Tian, 2009; He et al., 2013; Jiang et al., 2015). We therefore assumed that the observed runoff for 1961–1970 was natural and not (or less) disturbed by human activities. Using the observed ET0, P and the observed discharge, the parameter θ was calculated using the least-squares data-fitting method for the period 1961–1970, then the fitted parameter was used to reconstruct the decadal natural runoff for the period 1971–2010.
2.2.2 Estimation of ET0 and P
Two equations – Hargreaves (HG) and Penman–Monteith (PM) – were used to estimate ET0 (Allen et al., 1998). The HG-ET0 was based on a gridded dataset at monthly scale while PM-ET0 was based on a pointed dataset at daily scale. The PM equation ranked as the best equation for estimating ET0 but the sparse distribution of climate stations limited its application in western China. The continuous spatial coverage of the gridded dataset can provide full estimation of HG-ET0 in western China. However, large discrepancies between HG-ET0 and PM-ET0 were found in previous studies in different regions over the world (Temesgen et al., 2005; Gavilan et al., 2006; Trajkovic, 2007; Bautista et al., 2009; Sivaprakasam et al., 2011; Berti et al., 2014). Thus, a more accurate ET0 can be obtained by combining the two estimations.
The Hargreaves equation is described as follows (Allen et al., 1998):
where Tmean is the ith month mean temperature; Tmax is the ith-month mean maximal temperature; Tmin is the ith-month mean minimal temperature; and Ra is the extraterrestrial radiation for the middle day of the ith-month. The standard values of the empirical parameters are 0.0023, 17.8 and 0.5. The unit for both ET0 and Ra is millimeters per day and then ET0 was multiplied by the number of days in the ith-month to get monthly ET0. The extraterrestrial radiation Ra is calculated with the FAO56 method (Allen et al., 1998).
The FAO56 Penman–Monteith equation is described as below (Allen et al., 1998):
where Rn is the net radiation at the crop surface (MJ m−2 d−1), G is the soil heat flux density (MJ m−2 d−1), T is the mean daily air temperature at 2 m height in degree Celsius, u2 is the wind speed at 2 m height in meters per second, es is the saturated vapor pressure (kPa), ea is the actual vapor pressure (kPa), es−ea is the vapor pressure deficit in kilopascal, Δ is the slope of vapor pressure–temperature curve (kPa ∘C−1), and γ is the psychrometric constant (kPa ∘C−1).
The monthly gridded HG-ET0 and daily-pointed PM-ET0 were scaled up to an annual value. At the annual scale, HG-ET0was adjusted by multiplying the gridded coefficient (interpolated by the inverse distance weighting method; IDW ) as the ratio of the PM-ET0 to HG-ET0.
The gridded-annual precipitation was aggregated from the gridded-monthly precipitation data and then adjusted by the point-scale data as mentioned above. The basin-scale annual P and ET0 were obtained by weighting the average of the grid data within each basin.
2.2.3 Water stress and availability
Two indicators – WTA (Water use to availability) and FI (Falkenmark Index, referring to per capita water availability) – were used for the developmental analysis in surface water scarcity. WTA indicates moderate or high water use stress when over 0.2 or 0.4, respectively (Vörösmarty et al., 2000). FI indicates moderate, high, and extreme water availability stresses when it drops below 1700, 1000, and 500 m3 cap−1 yr−1, respectively (Falkenmark, 1997). The calculation of WTA was conducted on a decadal scale for the 1970s, 1980s, 1990s, and 2000s, respectively, while FI was calculated on a decadal scale for the 1980s, 1990s, and 2000s due to the limited access of population data.
WU and WA indicates surface water use and water availability in each decade from the 1970s to 2000s; Qnat and Qobs are natural and observed discharge in the same decade; Qin is the incoming observed discharge from the upper reaches; WUlocal and WUformer are the surface water use in middle or downstream regions and its former regions.
For Hai, Shiyang, Hei, and Tarim River basins, natural discharge at the middle and lower reaches was assumed to be the same as the upper reaches or as the aggregate discharge from upstream tributaries. This is because most of the water was subsequently consumed, and therefore little runoff was generated in the downstream regions (Zhang et al., 2015, 2016).
It is noted that only nine large basins were selected to analyze past changes in surface water scarcity in all three reaches (upper, middle, and lower) because runoff data were not available in the downstream regions of Liao, Huai, and Qiantang River basins. For example, hydrological data at the outlet station in Liao River basin are available from 1984 to 2010; there were no hydrological data at the outlet station in Huai River basin; streamflow data were only available in tributary stations in Qiantang River basin. For the above-mentioned three basins, we only used the available data from upper stream or tributaries for estimating WTA and FI.
2.2.4 Quantitative analysis
To quantify the influence of upstream water use on downstream water scarcity, an experiment was designed involving two scenarios: one with upstream water use (S1) and another without upstream water use (S2). In the first scenario (S1), the downstream water availability was the sum of local natural discharge and incoming observed flow; in the second scenario (S2), the downstream water availability was the aggregation of local natural discharge and natural discharge from the upper reaches.
2.2.5 WTA contribution in water scarcity change
The contribution rate of WTA change in water scarcity change is estimated as follows:
where ΔWTA and ΔFI indicate the absolute difference between two periods i and j in WTA and FI standardized (z score) by subtracting the mean then dividing by the standard deviation. Every decade is compared with its previous decade to get the stress change, for example; the 2000s vs. 1990s, the 1990s vs. 1980s, and the 1980s are set to 0.
3.1 Reliability of Fu–Budyko framework
The reliability of the Fu–Budyko framework in reconstructing annual natural discharge is summarized in Fig. 2. The model captures well the fluctuations of observed discharge in both time and space during the calibration period of 1961–1970 in all catchments, with biases ( %) of 4.8 %, 1.2 %, 10 %, −0.2 %, −1.3 %, 0.3 %, 2.5 %, −0.5 %, 0.8 %, 0.9 %, −2.2 %, and 8.2 % for Yangtze, Xi, Min, Qiantang, Huai, Songhua, Yellow, Liao, Hai, Hei, Shiyang, and Tarim River basins, respectively. The calculation of biases was carried out for most stations using the downstream observed runoff while the upstream observed runoff was used for Hai, Hei, Shiyang, and Tarim. Increasing gaps between the observed and natural discharge, however, are observed in semi-arid and arid basins, especially the Hai, Hei, Shiyang, and Tarim River basins. These gaps are regarded as water use from anthropological activities.
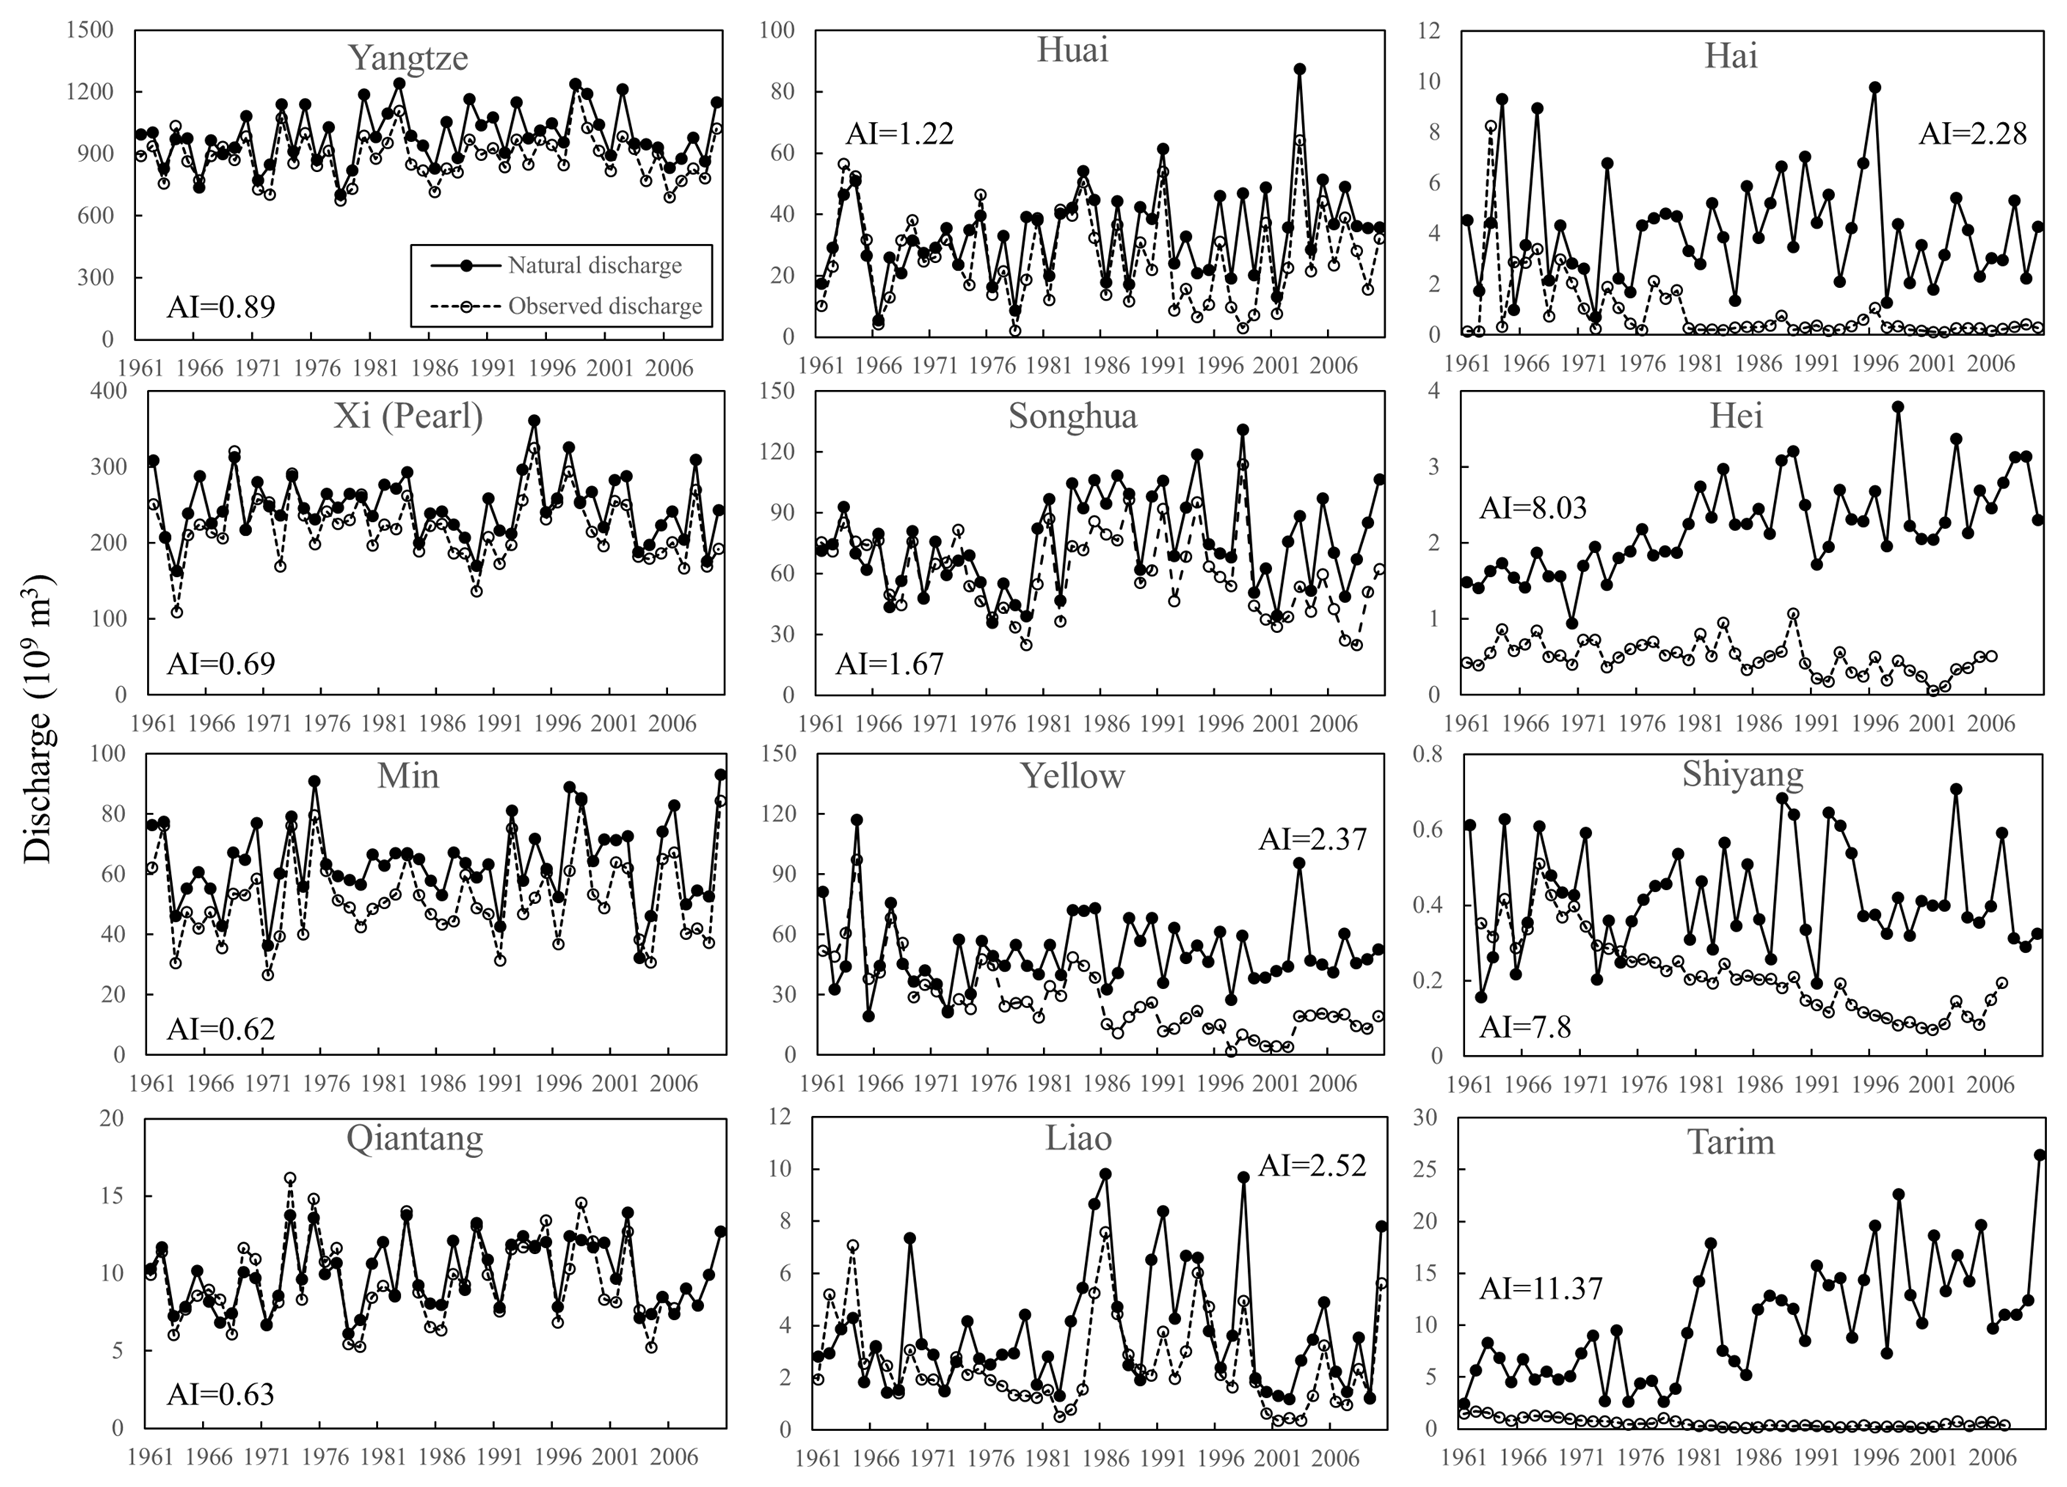
Figure 2The comparison of observed and natural annual discharge at the outlet stations in 12 basins. Natural discharge in most of the basins refers to the simulated runoff at the outlet stations. But in the four basins (Hai, Shiyang, Hei, and Tarim), the natural discharge is equal to the simulated runoff aggregated from upstream tributaries. This is because the Fu–Budyko framework is only applied in upstream regions in the four basins.
The magnitude of gaps between observed and natural discharge varies in different reaches and different periods as shown in Fig. 3. For humid regions with large discharge, the natural discharge is quite consistent with the observed one, leading to small gaps during all study periods in both upstream and downstream regions. However, situations are different for arid basins with small discharge, where the gap between observed and natural discharge in upstream and middle stream regions is relatively small from the beginning of the study period and increases as time goes by. While the gap in downstream regions is always large from the beginning and becomes larger due to more and more water use in downstream oasis.
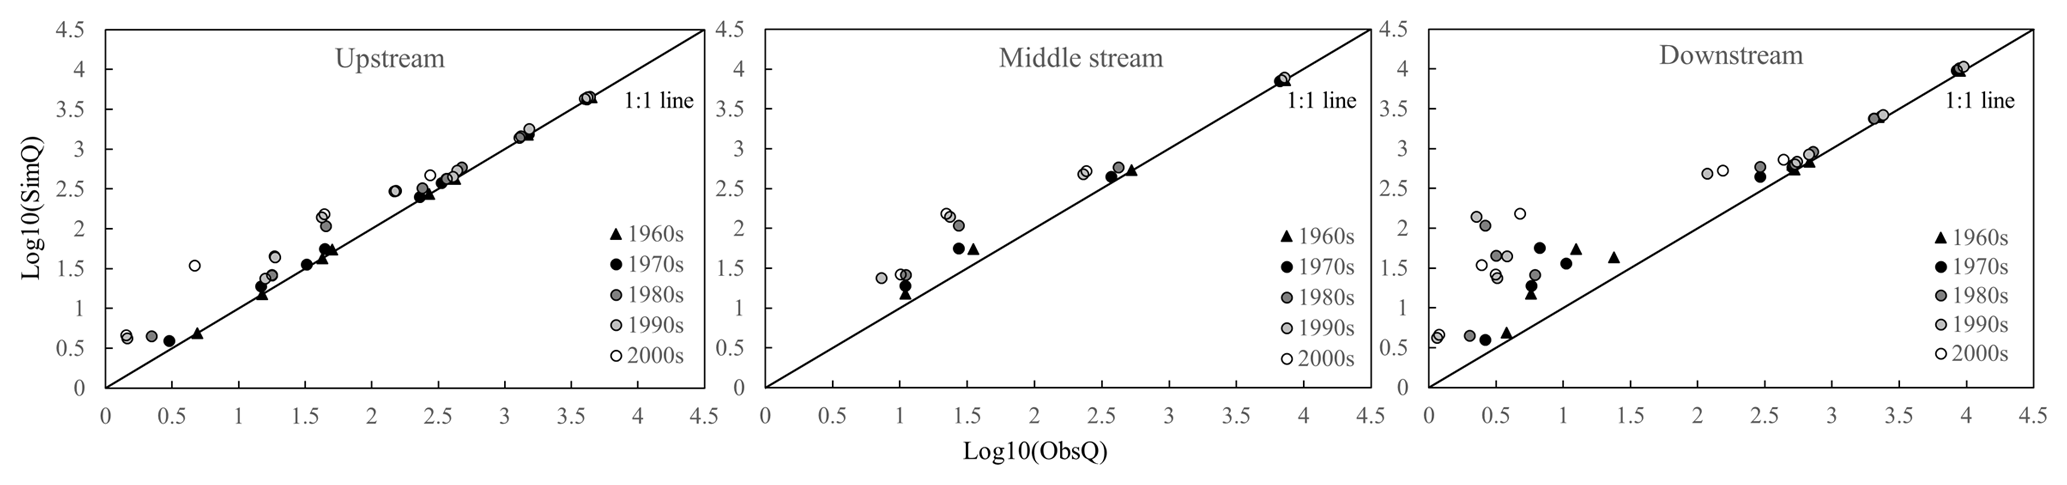
Figure 3The comparison of observed and natural annual discharge (log 10 transformed) in upper, middle, and lower reaches. Black triangles indicate the 1960s, black dots indicate the 1970s, dark gray dots indicate the 1980s, light gray dots indicate the 1990s, and white dots indicate 2000s.
3.2 Water scarcity trajectories
3.2.1 National range overview
Generally, the surface water became scarcer from the 1970s to the 2000s in China, with national WTA increasing from 0.12 to 0.18 and surface water use increasing from 161 billion cubic meters in the 1970s to 256 billion cubic meters in the 2000s (Fig. 4). The 65 % increase of surface water use occurs in northern basins, including Songhua, Huai, Yellow, Liao, Hai, Hei, Shiyang, and Tarim River basins. For humid (Xi, Min, and Qiantang River basins), semi-humid (Yangtze, Songhua, and Huai River basins), semi-arid (Yellow, Liao, and Hai River basins), and arid basins (Hei, Shiyang, and Tarim River basins), WTAs have increased from 0.1, 0.1, 0.36, and 0.81 in the 1970s to 0.14, 0.15, 0.7, and 0.95 in 2000s, respectively. Meanwhile, the national FI decreased from 1534 to 1265 m3. Regarding to different climate zones, FI has decreased from 1943 in the 1980s to 1680 in the 2000s for humid basins, and from 239 to 226 m3 for semi-arid basins, but it has increased from 1740 in the 1980s to 1772 m3 in the 2000s for semi-humid basins, and from 866 to 1255 m3 for arid basins.
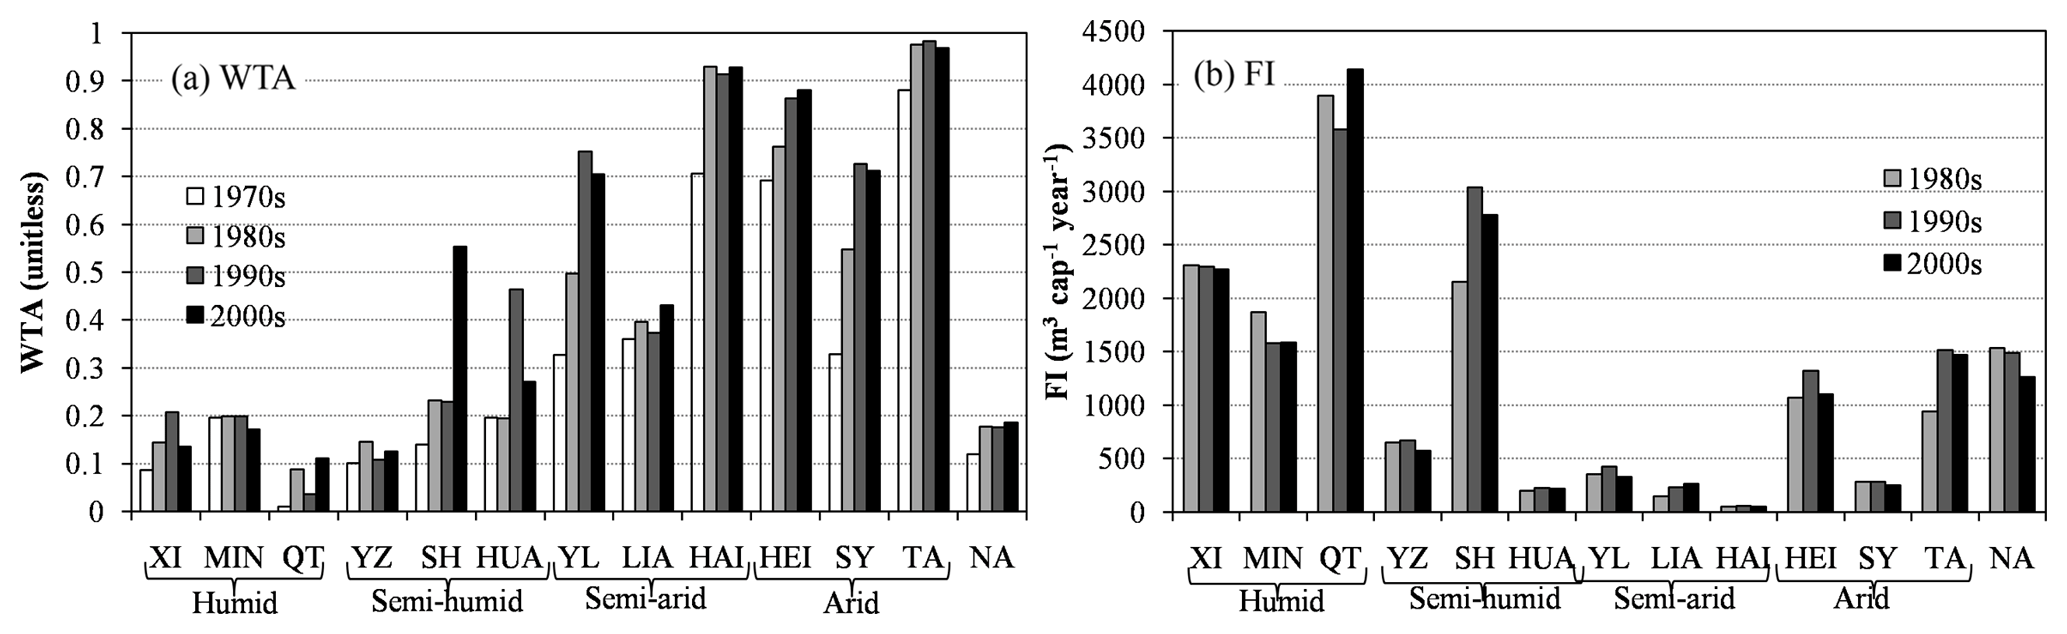
Figure 4Changes of WTA and FI in 12 basins and China from the 1970s and 1980s to the 2000s. YZ, XI, MIN, QT, SH, HUA, YL, LIA, HAI, HEI, SY, TA, and NA represent Yangtze, Xi (Pearl), Min, Qiantang, Songhua, Huai, Yellow, Liao, Hai, Hei, Shiyang, Tarim River basins, and the national range, respectively.

Figure 5Trajectories of WTA and FI in upstream, middle stream, and downstream regions for nine large basins from the 1970s and 1980s to the 2000s.
According to FI, the Xi River basin changed from no stress (1782 m3 cap−1 yr−1) to moderate stress (1583 m3 cap−1 yr−1) and Tarim River basin changed from high stress (942 m3 cap−1 yr−1) to moderate stress (1467 m3 cap−1 yr−1) from the 1980s to 2000s, while the stress levels remained almost unchanged for all the other basins. According to WTA alone, the stress levels changed from low stress (0.14) to high stress (0.55) for Songhua River basin, from low stress (0.19) to moderate stress (0.27) for Huai River basin, from moderate stress to high stress for Yellow (0.33–0.7), Liao (0.36–0.43), and Shiyang (0.33–0.71) River basins from the 1970s to 2000s, while the rest remained at their original stress levels.
For most basins, the 1980s is a turning point with rocketing WTA. The magnitude of WTA increase is 40 % for Yangtze River basin, 56 % for Xi River basin, 64 % for Songhua River basin, 52 % for Yellow River basin, 31 % for Hai River basin, 67 % for Shiyang River basin, and 50 % in national ranges. Meanwhile, FI changed little in the same period. The changes were probably linked to the water use increase because of China's economic reform and the open-door policy at the end of the 1970s.
3.2.2 Upstream and downstream relationship
Meanwhile, different basins experience different developmental trajectories in water scarcity for upstream, middle stream, and downstream regions (Fig. 5). From the WTA perspective, most humid and semi-humid basins, for example the Min, Pearl, and Yangtze River basins, show the non-stress status and the fluctuations in WTA for both upstream and downstream regions during the study periods. The Songhua River basin shows continuous increase in WTA for both upstream and downstream regions, which has led the upstream regions into stressed status in the 2000s. For semi-arid and arid basins, the elevated water use has led the upstream regions from no or low stressed status to high stress and the increasing WTA in downstream regions. It is noteworthy that WTA begins to decrease in downstream regions in the 2000s (Hei River basin shows the decrease in middle stream) while its upstream counterpart still increases. The decrease in WTA for downstream regions is caused by the reduced incoming discharge from upstream regions, which forces the downstream water users to exploit groundwater as a supplemental source for water supply (Water resources bulletin of Hai River basin, 2015).
From the FI perspective, the decreasing trend is dominant in both upstream and downstream regions. The Yangtze, Min, Songhua, Hei, and Tarim River basins and the upstream region of the Pearl River basin have no FI stress. FI has largely decreased in downstream regions compared to its upstream counterparts for eastern basins; however, the reverse is observed in western basins. This is driven by the migration during the study period. Since the end of the 1990s, the rapid urbanization has formed some metropolis in downstream regions in eastern China, such as Beijing in the downstream region of Hai River basin, Shanghai in the downstream of Yangtze River basin, and Guangzhou in the downstream of Pearl River basin, leading to population concentration and FI decrease in those regions (Yang and Chen, 2014). However, for northwestern inland basins, big cities are usually located in the middle reach oasis such as Zhangye in middle stream regions of Hei River basin or Aksu in middle stream regions of Tarim River basin. Meanwhile, the exacerbated degradation of the downstream ecological environment has caused downstream inhabitants to migrate to the middle stream. Thus FI generally decreases in middle stream regions while it increases in downstream regions in northwestern river basins.
3.3 Quantifying influence of upstream water use on downstream water scarcity
Scenario analysis shows the quantitative influence of upstream water use on downstream water scarcity (Fig. 6). For humid and semi-humid river basins (Xi, Min, Yangtze, and Songhua River basins) the influence of upstream water use on downstream water scarcity is negligible during the study period, with less than 10 % difference in both WTA and FI between the two scenarios. The influence of upstream water use on downstream water scarcity rapidly increased in the 2000s for Songhua River basin, with the WTA difference between two scenarios increasing from 12 % in the 1990s to 27 % in the 2000s and the FI's impact doubled from around 700 m3 cap−1 yr−1 in the 1990s to 1400 m3 cap−1 yr−1 in the 2000s.
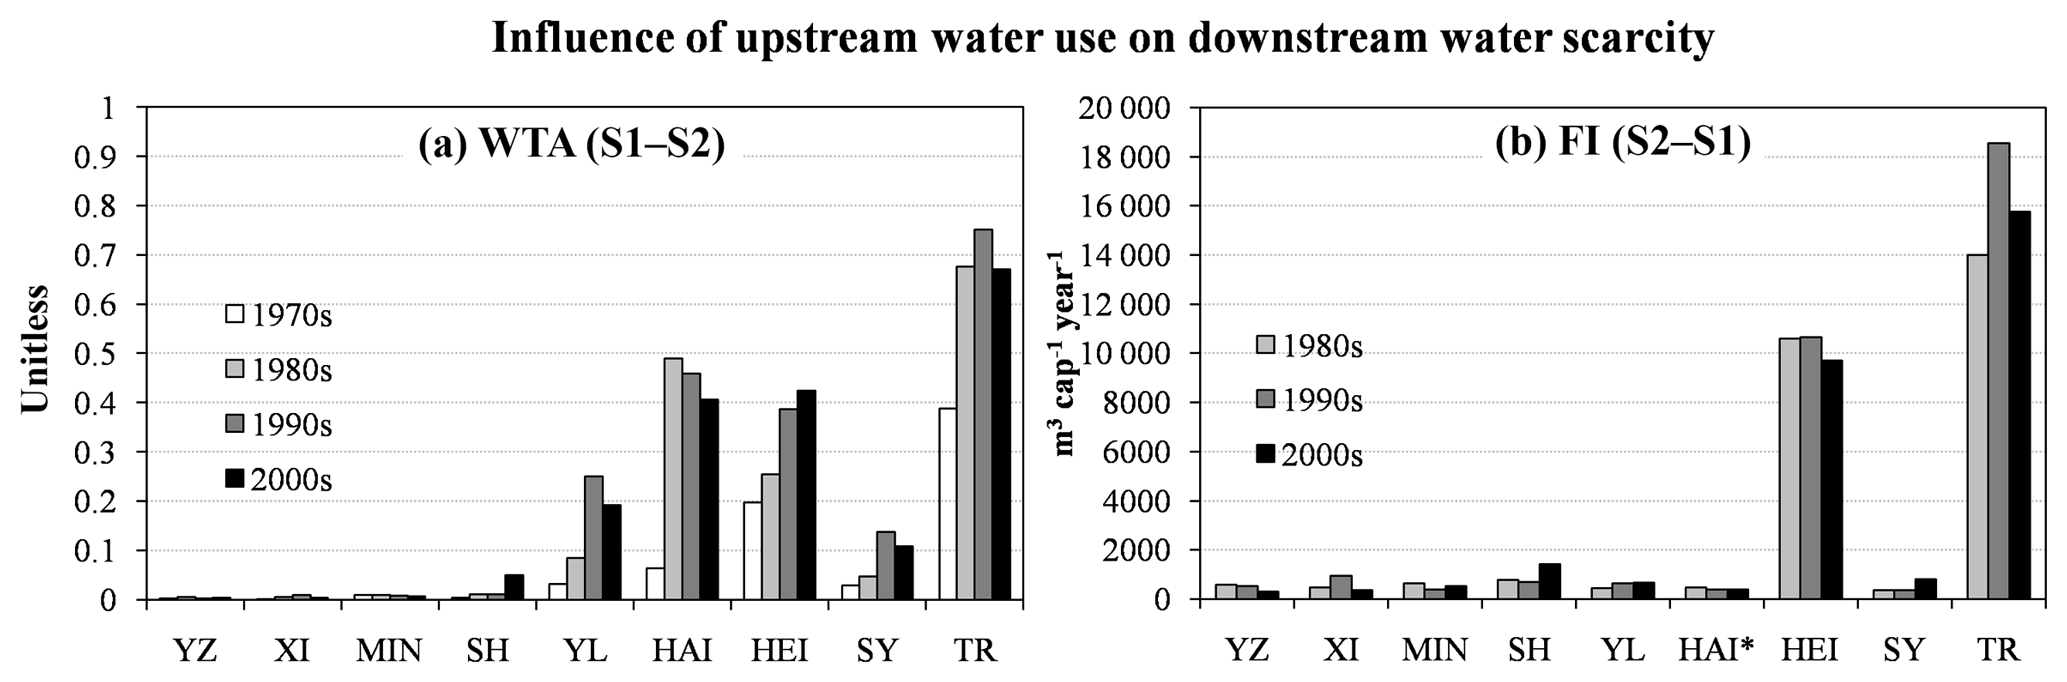
Figure 6Quantitative impact of upstream water use on downstream WTA (a) and FI (b). S1 is a scenario in which downstream WTA (FI) is contributed to by upstream water use while S2 is a scenario in which downstream WTA (FI) is not contributed to by upstream water use. S1–S2 (S2–S1) indicates the difference in stress between the two scenarios. YZ represents Yangtze River basin, XI represents Pearl River basin, MIN represents Min River basin, SH represents Songhua River basin, YL represents Yellow River basin, HAI represents Hai River basin, SY represents Shiyang River basin, HEI represents Hei River basin, and TR represents Tarim River basin. The asterisk symbol indicates that the values are enlarged by 10 times for Hai River basin to make them visible for comparison purposes.
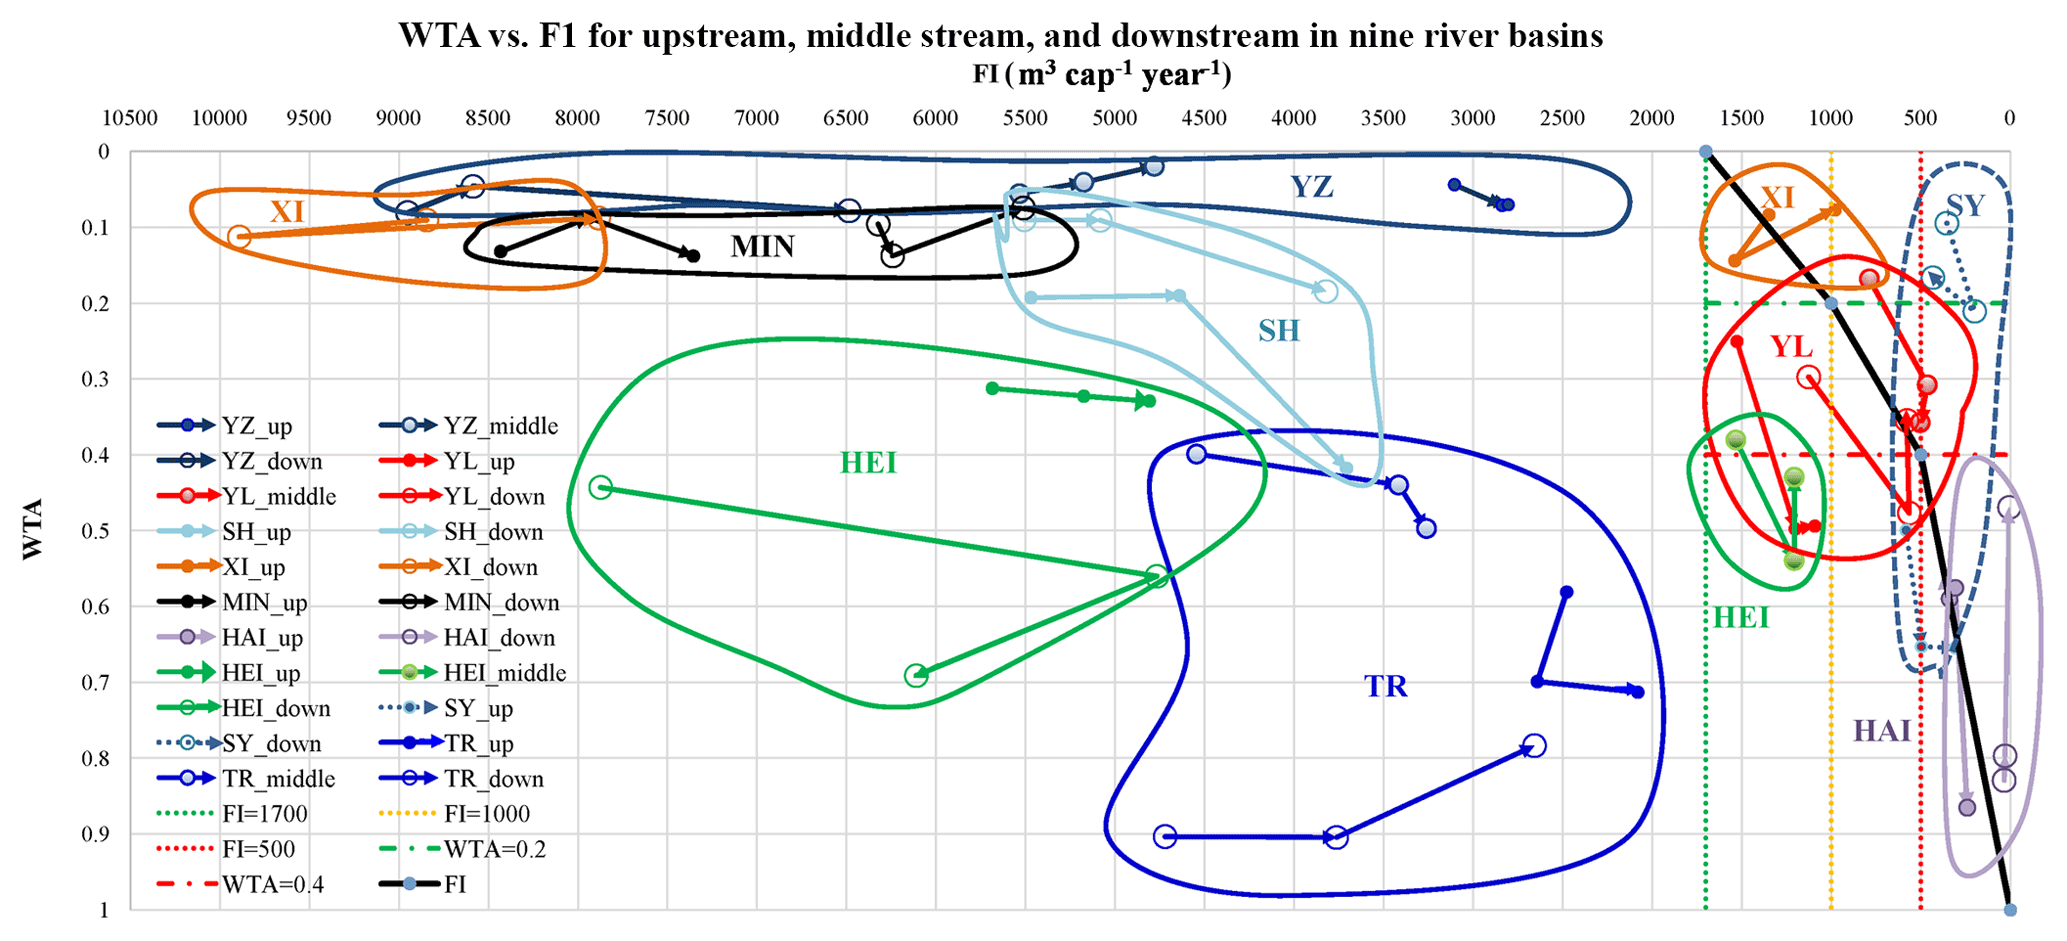
Figure 7The combined analysis of WTA and FI showing the water scarcity trajectories in nine river basins in the period of the 1980s–2000s. YZ represents Yangtze River basin, XI represents Pearl River basin, MIN represents Min River basin, SH represents Songhua River basin, YL represents Yellow River basin, HAI represents Hai River basin, SY represents Shiyang River basin, HEI represents Hei River basin, and TR represents Tarim River basin.
In contrast, upstream water use largely exacerbates downstream water scarcity in semi-arid and arid basins, and the influence of upstream water use on downstream water scarcity continued to increase from the 1970s to 2000s. On average, the WTA impact extent for all the five semi-arid and arid basins increased from 10 % in the 1970s to 37 % in the 2000s and the FI impact extent increased from 22 % in the 1980s to 37 % in the 2000s. Among the five basins, Tarim River basin is the largest human-intervened basin with the WTA increasing from 51 % in the 1970s to 86 % in the 2000s and FI increasing from 75 % in the 1980s to 86 % in the 2000s. Hai River basin is the fastest scarcity-exacerbated basin with WTA increasing from 7 % in the 1970s to 87 % in the 2000s and FI increasing from 59 % in the 1980s to 87 % in the 2000s.
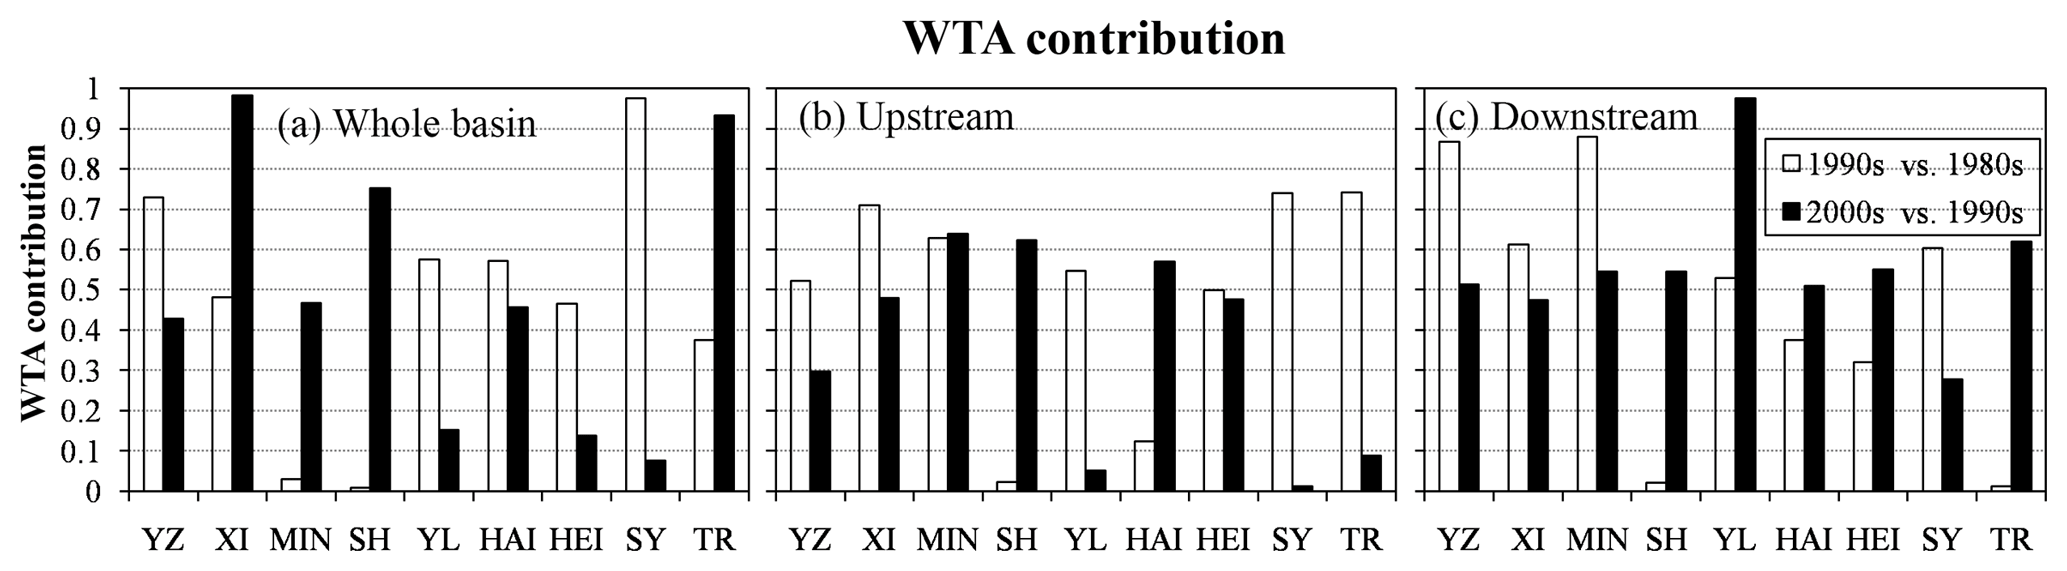
Figure 8The WTA contribution in water scarcity trajectories for whole basin, upstream regions, and downstream regions between different periods.
3.4 Driven factors of water scarcity trajectories
The combined analysis of WTA and FI (Fig. 7) shows that the Hai, Yellow and Shiyang River basins, and the middle stream of Hei River basin are in both WTA and FI stress simultaneously. While the upstream region of Pearl River basin is experiencing FI stress, and the whole Tarim River basin, the downstream region of Hei River basin and the upstream of Songhua River basin are in WTA stress driven by the agricultural sector (Nian et al., 2014; Feike et al., 2015). The water scarcity trajectories show that the WTA stress is still increasing in the downstream regions of the Hei and Hai river basins, and in the middle stream regions of the Tarim and Yellow River basins, while decreasing in downstream regions of Tarim and Yellow River basins and the upstream regions of Songhua and Hei River basins. Statistical data in the period of 2003–2017 showed that most basins have the decreasing water use in agricultural sector except Songhua (69 %–84 %), Huai (65 %–67 %), and northwest inland (91 %–91 %) river basins (Ministry of Water Resources, 2000–2017b). However, agriculture is still the largest water-consuming sector in 2017 with 84 %, 67 %, 61 %, 69 %, 67 %, 48 %, 59 %, 45 %, and 91 % percent in Songhua, Liao, Hai, Yellow, Huai, Yangtze, Pearl, southeast (Min and Qiantang), and northwest inland (Shiyang, Hei and Tarim) river basins, respectively.
The contribution analysis shows that as a whole the WTA's influence increases in the 2000s in most humid and semi-humid basins (XI, MIN) while decreases in most semi-arid and arid basins (YL, HAI, HEI, and SY) (Fig. 8a). For upstream regions in most basins, the WTA's influence becomes less in the 2000s (Fig. 8b). On the contrary, in downstream regions, WTA's influence decreases in most humid and semi-humid basins while increases in most semi-arid and arid basins in the 2000s (Fig. 8c). This indicates that there are more intensive human interventions in downstream regions, especially those semi-arid and arid basins over China.
4.1 Suitability of Fu–Budyko framework
The fitted parameter θ was greatly influenced by topography. Taking three basins with different climates – humid Yangtze River basin, semi-arid Yellow River basin, and arid Hei River basin – for example, the values of θ are 1.6, 1.9, and 1.3 respectively for upstream regions, while those are 1.8, 2.3, and 1.8 respectively for downstream regions. Given the fact that steeper terrains in upstream regions and flatter terrains in downstream regions, the values of θ are probably related to topography. The result is consistent with that from Sun et al. (2007), who found that three factors – infiltration rate, water storage capacity, and average slope – had impact on the θ in Fu–Budyko framework. Other influential factors were also indicated in other studies, such as vegetation cover (Li et al., 2013), aridity index (Du et al., 2016), and soil characteristics (Gerrits et al., 2009).
Note that the Fu–Budyko framework was suitable for annual or mean annual studies while the application at a finer temporal scale was restrained. This has been proved by Zhang et al. (2008), who has tested the Budyko model over 265 Australian catchments at different timescales, including mean annual, annual, monthly, and daily. They found at the annual scale, the model works well for most of the catchments with 90 % of them having values of the coefficient of efficiency greater than 0.5 and less than 3 % of the catchments have bias values greater than 10 %.
What is more, previous studies proved that the Budyko framework performed badly in extremely arid environments where water systems are typically unclosed with intense human interference and irrigation, for example northwest China. Here we found that Du et al. (2016) successfully applied a Budyko framework in Hei River basin by dividing the basin into six sub-basins. They calibrated the model separately in different sub-basins and found the model performed quite well in the upper mountainous regions with little human intervention while the model was almost impossible to validate in downstream sub-basins. Thus, we also divided the arid basins (including Hai, Shiyang, Hei, and Tarim River basins) into upstream minimally disturbed sub-basins and downstream intensively interfered sub-basins. The Fu–Budyko framework was only applied in the mountainous sub-basins.
4.2 The link between China's water policies and water use changes
After the end of the 1970s when China's economic reform and open-door policy started, economic development was set as the primary goal, leading to rapid economic advancement in the 1980s, with the GDP increasing fourfold from CNY 364.5 billion in 1978 to CNY 1699.2 billion in 1989 (National Bureau of Statistics of China, 2017). Our study showed that with rapid economic increase, surface water use also rocketed from 79 billion cubic meters in the 1970s to 138 billion cubic meters in the 1980s for the 12 basins, with the increase in surface water use of 25.4 billion cubic meters (63 %) for humid basins, 18.6 billion cubic meters (120 %) for semi-arid basins, 9.8 billion cubic meters (59 %) for semi-humid basins, and 5.1 billion cubic meters (90 %) for arid basins. Meanwhile, the increase of surface water use simultaneously occurred in both upstream and downstream regions in this period, and the increase in magnitude of surface water use was higher in upstream regions from humid to arid basins. In some cases, the expansion of arable land was the main driver for the increase in surface water use (Yang and Tian, 2009). While in another case, due to the lower priority in water allocation the share of agricultural water use decreased from 64 % to 35 % from 1985 to 2001, leading to the industrial sector being the major contributor in water use increase (Lohmar et al., 2003). In summary, the water resources management was fragmented and sector-oriented due to overlapping responsibilities and lack of effective coordination, leading to rapid increase in surface water use, and conflicts between upstream and downstream regions, and between different sectors.
Aiming to address conflicts and shortfalls of the deficient and fragmented system that arose during the 1970s and early 1980s, the 1988 Water Law was implemented as the first fundamental legislation regulating water activities (Shen, 2014). By encouraging utilization of water resources rather than water saving, the law facilitated the booming of thousands of engineering projects but failed to effectively address water shortages and environmental degradation in China's water resources during the period of the 1990s (Jiang, 2017). Our study showed that total surface water use continuously increased from 138 billion cubic meters in the 1980s to 178 billion cubic meters in the 1990s, with 23.8 billion cubic meters increase (36 %) from humid basins, 7.4 billion cubic meters increase (28 %) from semi-humid basins, 6.2 billion cubic meters increase (18 %) from semi-arid basins, and 2.6 billion cubic meters increase (25 %) from arid basins. Meanwhile, the surface water use in upstream regions also increased, while downstream regions were divergent with an upward trend in humid and semi-humid basins and a downward trend in semi-arid and arid basins due to decrease in water availability. Consequently, the 1990s were known as a period with the frequent outbreaks of water-related crises, such as the disappearance of the inland Juyanhai Lake of Hei River basin in 1992 (Jiang, 2017), the annual average of 107 dry days of the main channel of Yellow river in the 1990s (CPSP, 2005), the rapid drop of groundwater table in North China Plain (Jia, 2011), and the severe pollution in surface water and groundwater in major rivers (Wu et al., 1999). To summarize, the 20-year rapid development and the neglect of environmental issues caused an extremely tense water–human relationship and threatened human well-being and regional sustainable development in the 1990s.
When entering into the 2000s, in view of the failure of the traditional principle of water use, managing water resources in a sustainable and efficient manner was of increasing significance (Shen, 2014; Jiang, 2017). Reflecting a significant transition in water governance from construction and utilization (project oriented) to conservation and protection (resource oriented), the Chinese Government has initiated an ambitious water reform “Building a water-saving society”, which aims to achieve “harmonious coexistence between man and nature” (Wang, 2006). Our study showed that surface water use slightly decreased from 178 billion cubic meters in the 1990s to 177.6 billion cubic meters in the 2000s, with 10.7 billion cubic meters decrease in humid basins, 9.2 billion cubic meters increase in semi-humid basins, 270 million cubic meters increase in semi-arid basins, and 870 million cubic meters increase in arid basins. Noteworthy, the decrease in surface water use mainly occurred in downstream regions in most basins expect Songhua and Yangtze River basins, while surface water use continuously increased in upstream regions at a slower rate. The theory of water rights and water markets was viewed as a fundamental policy regime in the water reform. For example, the water deal between Dongyang and Yiwu counties in Zhejiang Province in 2000, the water rights trading in Zhangye city in 2002, and water allocation in Yellow River basin in the 2000s (Jiang, 2017). However, the statistical data starting in 2000 still suggested an increase of total water use and water stress between 2000 and 2010 across China (Wang et al., 2017; Ministry of Water Resources, 2000–2017b).
The story in the post-2000s looks encouraging. A strict water resources management strategy – three redlines – was implemented in 2012 and statistical data showed that it began to show a slight decrease in total water use over China and each basin (Ministry of Water Resources, 2000–2017b)). Our future study will keep tracing the changes of water use and water availability and their links with water policy.
4.3 The lessons and experiences from China's water governance
Section 4.2 explained the fact that water governance lags behind water crisis. Hence we would like to raise a question: what is the most suitable water governance for each region?
There are two different policies adopted to relieve water scarcity across the vast water-scarce northern China: water allocation based on water rights and transboundary water transfer. The former policy is currently being applied in northwestern catchments including Shiyang, Hei, and Tarim River basins. Meanwhile, the latter policy is mainly being applied in Hai River basin, which is the destination of famous “South–North Water Transfer” project. The two policies are being combined in Yellow River basin to relieve its water scarcity.
This study suggested that appropriate and optimized water allocation should be adopted in regions with high WTA and FI, while physical water transfer should be applied in regions with high WTA and low FI. For the situation of high WTA and FI, the main problem is that the imbalanced increase of water use in upper and middle reaches leads to the consequent terminal lake vanishing, vegetation death, and desertification in downstream regions. Moreover, considering that the upstream complex terrains would increase the difficulties of construction of water projects, it is appropriate to adopt water allocation accompanied with water rights and water price for solving environmental problems in lower reaches.
For the situation of high WTA and low FI, water allocation is not feasible here because water scarcity happens everywhere. If more surface water is forced to be released to downstream region, the upstream regions will face more severe water resource shortages and consequent environmental deterioration. For example, Shanxi province, which is the upstream of Hebei province, Beijing and Tianjin municipality, has not had enough surface water to satisfy their own demand since the 1970s (Sun et al., 2016). Consequently in 2004, the development of Shanxi province heavily relied on groundwater at amount of 3.6 billion cubic meters, or 64 % of total water use (National Bureau of Statistics of China, 2004). The excessive exploitation of groundwater has resulted in a series of environmental and geological problems, such as land subsidence, earth fissures, and a great reduction of river water flow downstream (Sun et al., 2016). Moreover, considering the higher economic value per unit water in downstream regions, for instance 15.6 and 58.4 m3∕104 GDP in 2016 in Beijing and Shanxi, respectively (National Bureau of Statistics of China, 2016), the increase of alternative water supply is a more feasible policy, including water recycling, transbasin water transfer, and sea water desalinization.
Overall, the formulation of water governance policies is challenging. The quantitative analysis of past trajectories of water scarcity in upstream, middle stream, and downstream regions provides a sound basis for developing and implementing water governance in China.
The unconstrained water use in the upstream region of a river basin has led to negative impacts on economy, society, and ecosystems in downstream regions. However, the quantified relationship of upstream water use and downstream water scarcity still remains unclear in China due to lack of long-term water-use data. By comparing observed runoff (1970s to 2000s) and reconstructed theoretical runoff, we analyze the trajectories of surface water use and per capita surface water availability in upstream, middle stream, and downstream of China's major river basins. The scenario analysis further quantifies the impact of upstream water use on downstream water scarcity. Finally, contribution analysis is used to identify the main drivers of water scarcity changes. Our results show that some river basins in China have experienced a dramatic increase in WTA stress from the 1970s to the 2000s due to the rapid increase of water use, which mainly occurs in northern basins. In the 2000s, the increase in upstream WTA stress and the decrease in downstream WTA stress occurs simultaneously, which is probably caused by the increasing upstream water use and the consequent decrease of downstream water availability outpaced by the decrease of downstream surface water use. The influence of upstream water use on downstream water scarcity is less than 10 % for humid and semi-humid basins, while it is quite large for semi-arid and arid basins with WTA-impact increase from 10 % in the 1970s to 37 % in the 2000s and FI-impact increase from 22 % in 1980s to 37 % in 2000s. Contribution analysis shows that the WTA contribution greatly increases in the 2000s mainly in humid and semi-humid basins, while it decreases mainly in semi-arid and arid basins. The trajectories of China's water scarcity are closely related to the socioeconomic development and water policy, which thus provides valuable lessons and experiences for global water management.
The datasets used in this article can be obtained by contacting Xinyao Zhou (zhouxy@sjziam.ac.cn) and Yonghui Yang (yonghui.yang@sjziam.ac.cn).
XZ gathered and analyzed the data, and wrote the paper. ZS was involved in data interpretation and figure drawing. YZ was involved in calibrating parameters and running of the model. YY designed the paper.
The authors declare that they have no conflict of interest.
We sincerely thank Keith Richards from Cambridge University for the constructive feedback given on the study. We appreciate the efforts of the two anonymous reviewers whose valuable comments helped us improve the quality of this paper. Yongqiang Zhang acknowledges the support by CAS Pioneer Hundred Talents Program.
This research has been supported by the National Natural Science Foundation of China (grant no. 41671021).
This paper was edited by Xing Yuan and reviewed by two anonymous referees.
Al-Faraj, F. A. M. and Tigkas, D.: Impacts of multi-year droughts and upstream human-induced activities on the development of a semi-arid transboundary basin, Water Resour. Manage., 30, 5131–5143, 2016.
Allen, R. G., Pereira, L. S., Raes, D., and Smith, M.: Crop evapotranspiration – Guidelines for computing crop water requirements, FAO Irrigation and drainage paper 56, Food and Agriculture Organization of the United Nations, Rome, 1998.
Arfanuzzaman, M. and Syed, M.: Water demand and ecosystem nexus in the transboundary river basin: a zero-sum game, Environ. Dev. Sustain., 20, 963–974, 2018.
Arora, V. K.: The use of the aridity index to assess climate change effect on annual runoff, J. Hydrol., 265, 164–177, 2002.
Bautista, F., Bautista, D., and Delgado-Carranza, C.: Calibration of the equations of Hargreaves and Thornthwaite to estimate the potential evapotranspiration in semi-arid and subhumid tropical climates for regional applications, Atmósfera, 22, 331–348, 2009.
Berti, A., Tardivo, G., Chiaudani, A., Rech, F., and Borin, M.: Assessing reference evapotranspiration by the Hargreaves method in north-eastern Italy, Agr. Water Manage., 140, 20–25, 2014.
Brown, C. A. and King, J. M.: Implications of upstream water uses on downstream ecosystems and livelihoods, Int. J. Ecol. Environ. Sci., 32, 1–10, 2006.
Chang, J., Wang, Y., Istanbulluoglu, E., Bai, T., Huang, Q., Yang, D., and Huang, S.: Impact of climate change and human activities on runoff in the Weihe River Basin, China, Quater. Int., 380–381, 169–179, 2015.
Changjiang Water Resources Commission: Changjiang Sediment Bulletin, Wuhan, Changjiang River Publishing Group, available at: http://www.cjw.gov.cn/zwzc/bmgb/ (last access: 20 July 2018), 2010.
Dai, S., Yang, S., Gao, A., Liu, Z., Li, P., and Li, M.: Trend of sediment flux of main rivers in China in the past 50 years, J. Sediment Res., 2, 49–58, 2007a.
Dai, S., Yang, S., and Cai, A.: Variation of sediment discharge of the Pearl River Basin from 1955 to 2005, Acta Geogr. Sin., 62, 545–554, 2007b.
Dodds, W. K. and Oakes, R. M.: Headwater influences on downstream water quality, Environ. Manage., 41, 367–377, 2008.
Du, C., Sun, F., Yu, J., Liu, X., and Chen, Y.: New interpretation of the role of water balance in an extended Budyko hypothesis in arid regions, Hydrol. Earth Syst. Sci., 20, 393–409, https://doi.org/10.5194/hess-20-393-2016, 2016.
Duan, K., Sun, G., Caldwell, P. V., McNulty, S. G., and Zhang, Y.: Implications of upstream flow availability for watershed surface water supply across the conterminous United States, J. Am. Water Resour. Assoc., 54, 694–707, 2018.
Falkenmark, M.: Meeting water requirements of an expanding world population, Philos. T. Roy. Soc. B, 352, 929–936, 1997.
Feike, T., Mamitimin, Y., Li, L., and Doluschitz, R.: Development of agricultural land and water use and its driving forces along the Aksu and Tarim River, P. R. China, Environ. Earth Sci., 73, 517–531, 2015.
Fu, B. P.: On the Calculation of the Evaporation from Land Surface, Scient. Atmos. Sin., 5, 23–31, 1981.
Gavilan, P., Lorite, I. J., Tornero, S., and Berengena, J.: Regional calibration of Hargreaves equation for estimating reference ET in a semiarid environment, Agr. Water Manage., 81, 257–281, 2006.
Gerrits, A. M. J., Savenije, H. H. G., Veling, E. J. M., and Pfister, L.: Analytical derivation of the Budyko curve based on rainfall characteristics and a simple evaporation model, Water Resour. Res., 45, W04403, https://doi.org/10.1029/2008WR007308, 2009.
Guo, Q., Su, N., Yang, Y., Li, J., and Wang, X.: Using hydrological simulation to identify contribution of coal mining to runoff change in the Kuye River Basin, China, Water Resources, 44, 586–594, 2017.
He, Y., Lin, K., and Chen, X.: Effect of land use and climate change on runoff in the Dongjiang Basin of South China, Math. Probl. Eng., 2013, 471429, 14–26, 2013.
Haihe River Water Conservancy Commission MWR: Haihe River Water Resources Bulletin, available at: http://www.hwcc.gov.cn/hwcc/wwgj/xxgb/ (last access: 20 July 2018), 2015.
ICID, Water policy issues of China: study outcomes and suggested policy interventions, Country Policy Support Programme, New Delhi, available at: http://www.icid.org/cpsp_report6_web.pdf (last access: 14 May 2019), 2005.
Jack, B. K.: Upstream-downstream transactions and water shed externalities: Experimental evidence from Kenya, Ecol. Econ., 68, 1813–1824, 2009.
Jia, Y.: Groundwater issues and management in the North China Plain, in: chap. 4, Findikakis, CRC Press, Boca Raton, 13–24, 2011.
Jiang, C., Zhang, L., Li, D., and Li, F.: Water discharge and sediment load changes in China: Change patterns, causes, and implications, Water, 7, 5849–5875, 2015.
Jiang, M.: Towards tradable water rights – water law and policy reform in China, in: Global Issues in Water Policy 18, Springer International Publishing, New York, 2017.
Kummu, M., Ward, P.J., de Moel, H., and Varis, O.: Is physical water scarcity a new phenomenon? Global assessment of water shortage over the last two millennia, Environ. Res. Lett., 5, 034066, https://doi.org/10.1088/1748-9326/5/3/034006, 2010.
Kummu, M., Guillaume, J. H. A., de Moel, H., Eisner, S., Flörke, M., Porkka, M., Siebert, S., Veldkamp, T. I. E., and Ward, P. J.: The world's road to water scarcity: shortage and stress in the 20th century and pathways towards sustainability, Scient. Rep., 6, 38495, https://doi.org/10.1038/srep38495, 2016.
Li, D., Pan, M., Cong, Z., Zhang, L., and Wood, E.: Vegetation control on water and energy balance within the Budyko framework, Water Resour. Res., 49, 969–976, https://doi.org/10.1002/wrcr.20107, 2013.
Li, F., Zhu, G., and Guo, C.: Shiyang River ecosystem problems and countermeasures, Agricult. Sci., 4, 72–78, 2013.
Lohmar, B., Wang, J., Rozelle, S., Huang, J., and Dawe, D.: China's agricultural water policy reform: increasing investment, resolving conflicts, and revising incentives, Market and Trade Economics Division, Economic Research Service, Agriculture Information Bulletin Number 782, US Department of Agriculture, Washington, 2003.
Lu, Z., Wei, Y., Xiao, H., Zou, S., Ren, J., and Lyle, C.: Trade-offs between midstream agricultural production and downstream ecological sustainability in the Heihe River basin in the past half century, Agr. Water Manage., 152, 233–242, 2015.
Luo, K., Tao, F., Moiwo, J. P., and Xiao, D.: Attribution of hydrological change in Heihe River Basin to climate and land use change in the past three decades, Scient. Rep., 6, 33704, https://doi.org/10.1038/srep33704, 2016.
Ministry of Water Resources: China Water Resources Bulletin, available at: http://www.mwr.gov.cn/sj/tjgb/szygb (last access: 20 July 2018), 2000–2016.
Ministry of Water Resources: Gazette of river sediment in China, China Water Power Press, Beijing, available at: http://www.mwr.gov.cn/sj/tjgb/zghlnsgb/ (last access: 20 July 2018), 2002–2017a.
Ministry of Water Resources: China Water Resources Bulletin, available at: http://www.mwr.gov.cn/sj/tjgb/szygb (last access: 20 July 2018), 2000–2017b.
Munia, H., Guillaume, J. H. A., Mirumachi, N., Porkka, M., Wada, Y., and Kummu, M.: Water stress in global transboundary river basins: significance of upstream water use on downstream stress, Environ. Res. Lett., 11, 014002, https://doi.org/10.1088/1748-9326/11/1/014002, 2016.
Munia, H., Guillaume, J. H. A., Mirumachi, N., Wada, Y., and Kummu, M.: How downstream sub-basins depend on upstream inflows to avoid scarcity: typology and global analysis of transboundary rivers, Hydrol. Earth Syst. Sci., 22, 2795–2809, https://doi.org/10.5194/hess-2017-537, 2018.
National Bureau of Statistics of China: China Statistical Yearbook: 2004, China Statistics Press, Beijing, China, available at: http://www.stats.gov.cn/tjsj/ndsj/ (last access: 20 July 2018), 2004.
National Bureau of Statistics of China: China Statistical Yearbook: 2016, China Statistics Press, Beijing, China, available at: http://www.stats.gov.cn/tjsj/ndsj/ (last access: 20 July 2018), 2016.
National Bureau of Statistics of China: China Statistical Yearbook: 2017, China Statistics Press, Beijing, China, available at: http://www.stats.gov.cn/tjsj/ndsj/ (last access: 20 July 2018), 2017.
Nian, Y., Li, x., Zhou, J., and Hu, X.: Impact of land use change on water resources allocation in the middle reaches of the Heihe River Basin in northwestern China, J. Arid Land, 6, 273–286, 2014.
Niu, Z., Zhao, W., Huang, W., and Chen, X.: Impact of ecological water diversion on temporal and spatial change of water resources in Heihe Downstream, J. China Hydrol., 31, 52–56, 2011.
Nordblom, T. L., Finlayson, J. D., and Hume, I. H.: Upstream demand for water use by new tree plantations imposes externalities on downstream irrigated agriculture and wetlands, Aust. Agr. Resour. Econ. Soc., 56, 455–474, 2012.
OECD: Water risk hotspots for agriculture, OECD Studies on Water, OECD Publishing, Paris, https://doi.org/10.1787/9789264279551-en, 2017.
Oki, T., Agata, Y., Kanae, S., Kanae, S., Saruhashi, T., Yang, D., and Musiake, K.: Global assessment of current water resources using total runoff integrating pathways, Hydrolog. Sci. J., 46, 983–995, 2001.
Pan, Z., Ruan, X., Zhu, Y., and Li, R.: Analysis of variation in runoff of the main stream of Huaihe River in the past 50 years, J. Soil Water Conserv., 27, 51–59, 2013.
Petes, L. E., Brown, A. J., and Knight, C. R.: Impacts of upstream drought and water withdrawals on the health and survival of downstream estuarine oyster populations, Ecol. Evol., 2, 1712–1724, 2012.
Piao, S., Friedlingstein, P., Ciais, P., de Noblet-Ducoudré, N., Labat, D., and Zaehle, S.: Changes in climate and land use have a larger direct impact than rising CO2 on global river runoff trends, P. Natl. Acad. Sci. USA, 104, 15242–15247, 2007.
Poff, N. L., Olden, J. D., Merritt, D. M., and Pepin, D. M.: Homogenization of regional river dynamics by dams and global biodiversity implications, P. Natl. Acad. Sci. USA, 104, 5732–5737, 2007.
Ponce, V. M., Pandey, R. P., and Ercan, S.: Characterization of drought across the climate spectrum, J. Hydrol. Eng., 5, 222–224, 2000.
Ren, L., Lu, X., and Fan, Z.: Changes in hydrologic process and its enlightenment to ecological water conveyance in the Lower Heihe River, Yellow River, 37, 53–57, 2015.
Shen, D.: Post-1980 water policy in China, Int. J. Water Resour. Dev., 30, 714–727, 2014.
Shi, H. and Wang, G.: Impacts of climate change and hydraulic structures on runoff and sediment discharge in the middle Yellow River, Hydrol. Process., 29, 3236–3246, 2015.
Sivaprakasam, S., Murugappan, A., and Mohan, S.: Modified Hargreaves equation for estimation of ET0 in a hot and humid location in Tamilnadu State, India, Int. J. Eng. Sci. Technol., 3, 592–600, 2011.
Song, X., Mu, X., Gao, P., Wang, S., and Wang, F.: Trends of runoff variation from 1900 to 2005 at Harbin station of Songhua River, J. Nat. Resour., 24, 1803–1809, 2009.
Sun, F., Yang, D., Liu, Z., and Cong, Z.: Study on coupled water-energy balance in Yellow River basin based on Budyko Hypothesis, J. Hydraul. Eng., 38, 409–416, 2007.
Sun, X., Peng, J., Cui, X., and Jiang, Z.: Relationship between ground fissures, groundwater exploration and land subsidence in Taiyuan basin, Chinese J. Geol. Hazard Control, 27, 91–98, 2016.
Temesgen, B., Eching, S., Davidoff, B., and Frame, K.: Comparison of some reference evapotranspiration equations for California, J. Irrig. Drain. Eng., 131, 73–84, 2005.
Teng, J., Chiew, F. H. S., Vaze, J., Marvanek, S., and Kirono, D. G. C.: Estimation of Climate change impact on mean annual runoff across continental Australia using Budyko and Fu equations and hydrological models, J. Hydrometeorol., 13, 1094–1106, 2012.
Trajkovic, S.: Hargreaves versus Penman-Monteith under humid conditions, J. Irrig. Drain. Eng., 133, 38–42, 2007.
Tu, G., Li, S., Sun, L., and Yao, Y.: Temporal variation of observed runoff in Songhua River and Liaohe River Basins and its relationship with precipitation, Progressus Inquisitiones De Mutatione Climatis, 8, 456–461, 2012.
Veldkamp, T. I. E., Wada, Y., Aerts, J. C. J. H., Döll, P., Gosling, S. N., Liu, J., Masaki, Y., Oki, T., Ostberg, S., Pokhrel, Y., Satoh, Y., Kim, H., and Ward, P. J.: Water scarcity hotspots travel downstream due to human interventions in the 20th and 21st century, Nat. Commun., 8, 15697, https://doi.org/10.1038/ncomms15697, 2017.
Vörösmarty, C. J., Green, P., Salisbury, J., and Lammers, R. B.: Global water resources: Vulnerability from climate change and population growth, Science, 289, 284–288, 2000.
Wang, J., Hong, Y., Gourley, J., Adhikari, P., Li, L., and Su, F.: Quantitative assessment of climate change and human impacts on long-term hydrologic response: a case study in a sub-basin of the Yellow River, China, Int. J. Climatol., 30, 2130–2137, 2010.
Wang, J., Zhong, L., and Iceland, C.: China's water stress is on the rise, World Resources Institute, available at: https://www.wri.org/blog/2017/01/chinas-water-stress-rise (last access: 17 November 2018), 2017.
Wang, S.: Resource-oriented water management: Towards harmonious coexistence between man and nature, 2nd Edn., World Scientific Publishing, Singapore Water Power Press, Beijing, 2006.
Wei, Q., Sun, C., Wu, G., and Pan, L.: Haihe River discharge to Bohai Bay, North China: Trends, climate, and human activities, Hydrol. Res., 48, 1–13, 2016.
Wu, C., Maurer, C., Wang, Y., Xue, S., and Davis, D. L.: Water pollution and human health in China, Environ. Health Perspect., 107, 251–256, 1999.
Yang, Q. and He. Q.: Interrelationship of climate change, runoff and human activities in Tarim River Basin, J. Appl. Meteorol. Sci., 14, 309–321, 2003.
Yang, S. L., Xu, K. H., Milliman, J. D., Yang, H. F., and Wu, C. S.: Decline of Yangtze River water and sediment discharge: Impact from natural and anthropogenic changes, Scient. Rep., 5, 12581, https://doi.org/10.1038/srep12581, 2015.
Yang, Y. and Tian, F.: Abrupt change of runoff and its major driving factors in Haihe River Catchment, China, J. Hydrol., 374, 373–383, 2009.
Yang, Z. and Chen, J.: Housing Reform and the Housing Market in Urban China, in: chap. 2, Housing Affordability and Housing Policy in Urban China, XI, p. 134, ISBN: 978-3-642-54043-1, 2014.
Yellow river conservancy commission of MWR: Yellow River sediment Bulletin, available at: http://www.yellowriver.gov.cn/nishagonggao/ (last access: 20 July 2018), 2000–2010.
Zhai, R. and Tao, F.: Contributions of climate change and human activities to runoff change in seven typical catchments across China, Sci. Total Environ., 605–606, 219–229, 2017.
Zhang, A., Zheng, C., Wang, S., and Yao, Y.: Analysis of streamflow variations in the Heihe River Basin, northwest China: Trends, abrupt changes, driving factors and ecological influences, J. Hydrol.: Reg. Stud., 3, 106–124, 2015.
Zhang, J., Zhang, S., Wang, J., and Li, Y.: Study on runoff trends of the six larger basins in China over the past 50 years, Adv. Water Sci., 18, 230–234, 2007.
Zhang, L., Dawes, W., and Walker, G.: Response of mean annual evapotranspiration to vegetation changes at catchment scale, Water Resour. Res., 37, 701–708, 2001.
Zhang, L., Potter, N., Hickel, K., Zhang, Y., and Shao, Q.: Water balance modelling over variable time scales based on the Budyko framework – Model development and testing, J. Hydrol., 360, 117–131, 2008.
Zhang, L., Nan, Z., Xu, Y., and Li, S.: Hydrological impacts of land use change and climate variability in the headwater region of the Heihe River Basin, Northwest China, PLoS ONE, 11, e0158394, https://doi.org/10.1371/journal.pone.0158394, 2016.
Zhang, Y., Chiew, F. H. S., Zhang, L., Leuning, R., and Cleugh, H.: Estimating catchment evaporation and runoff using MODIS leaf area index and the Penman–Monteith equation, Water Resour. Res., 44, W10420, https://doi.org/10.1029/2007WR006563, 2009.
Zhang, Y., Hu, C., and Wang, Y.: Analysis on variation characteristics and influential factors of runoff and sediment of Liaohe River Basin, Yangtze River, 45, 32–35, 2014.
Zhao, R., Chen, Y., Li, W., Chen, Z., and Hao, X.: Trends in runoff variations of the mainstream of the Tarim River during the last 50 years, Resour. Sci., 32, 1196–1203, 2010.
Zhao, Y., Wei, Y., Li, S., and Wu, B.: Downstream ecosystem responses to middle reach regulation of river discharge in the Heihe River Basin, China, Hydrol. Earth Syst. Sci., 20, 4469–4481, https://doi.org/10.5194/hess-20-4469-2016, 2016.
Zheng, H., Zhang, L., Zhu, R., Liu, C., Sato, Y., and Fukushima, Y.: Responses of streamflow to climate and land surface change in the headwaters of the Yellow River Basin, Water Resour. Res., 45, W00A19, https://doi.org/10.1029/2007WR006665, 2009.
Zhou, X., Zhang, Y., Wang, Y., Zhang, H., Vaze, J., Zhang, L., Yang, Y., and Zhou, Y.: Benchmarking global land surface models against the observed mean annual runoff from 150 large basins, J. Hydrol., 470–471, 269–279, 2012.