the Creative Commons Attribution 4.0 License.
the Creative Commons Attribution 4.0 License.
 | 24 Apr 2019
Controls on spatial and temporal variability in streamflow and hydrochemistry in a glacierized catchment
Daniele Penna
Giacomo Bertoldi
Gianluca Vignoli
Werner Tirler
Francesco Comiti
Understanding the hydrological and hydrochemical functioning of glacierized catchments requires the knowledge of the different controlling factors and their mutual interplay. For this purpose, the present study was carried out in two sub-catchments of the glacierized Sulden River catchment (130 km2; eastern Italian Alps) in 2014 and 2015, characterized by a similarly sized but contrasting geological setting. Samples were taken at different space and timescales for analysis of stable isotopes in water, electrical conductivity, and major, minor and trace elements.
At the monthly sampling scale, complex spatial and temporal dynamics for different spatial scales (0.05–130 km2) were found, such as contrasting electrical conductivity gradients in both sub-catchments. For the entire Sulden catchment, the relationship between discharge and electrical conductivity showed a monthly hysteretic pattern. Hydrometric and geochemical dynamics were controlled by interplay of meteorological conditions, topography and geological heterogeneity. A principal component analysis revealed that the largest variance (36.3 %) was explained by heavy metal concentrations (such as Al, V, Cr, Ni, Zn, Cd and Pb) during the melting period, while the remaining variance (16.3 %) resulted from the bedrock type in the upper Sulden sub-catchment (inferred from electrical conductivity, Ca, K, As and Sr concentrations). Thus, high concentrations of As and Sr in rock glacier outflow may more likely result from bedrock weathering. Furthermore, nivo-meteorological indicators such as daily maximum air temperature and daily maximum global solar radiation represented important meteorological controls, with a significant snowmelt contribution when exceeding 5 ∘C or 1000 W m−2, respectively. These insights may help in better understanding and predicting hydrochemical catchment responses linked to meteorological and geological controls and in guiding future classifications of glacierized catchments according to their hydrochemical characteristics.
- Article
(7261 KB) - Full-text XML
-
Supplement
(275 KB) - BibTeX
- EndNote


Runoff from glacierized catchments is an important fresh water resource to downstream areas (Kaser et al., 2010; Viviroli et al., 2011). High-elevation environments face rapid and extensive changes through retreating glaciers, reduced snow cover and permafrost thawing (Harris et al., 2001; Dye, 2002; Beniston, 2003; Galos et al., 2015). This will have impacts on runoff seasonality, water quantity and water quality (Beniston, 2006; Ragettli et al., 2016; Gruber et al., 2017; Kumar et al., 2019). Therefore, better understanding the behavior of high-elevation catchments and their hydrological and hydrochemical responses at different spatial and temporal scales is of uttermost importance in view of water management, water quality, hydropower and ecosystem services under the current phase of climate change (Beniston, 2003; Viviroli et al., 2011; Beniston and Stoffel, 2014).
In general, the hydrological response of catchments (i.e., runoff dynamics) is controlled by heterogeneous catchment properties (Kirchner, 2009), which become more diverse in catchments with large complexity in various landscape features like, in the case of mountainous, high-elevation glacierized catchments (Cook and Swift, 2012). In fact, those catchments are deemed to be highly dynamic geomorphological, hydrological and biogeochemical environments (Rutter et al., 2011). The advances in tracer and isotope hydrology made during the last decades can substantially contribute to gain more insight into the variability in different runoff components of high-elevation catchments (Vaughn and Fountain, 2005; Maurya et al., 2011; Xing et al., 2015; Penna et al., 2017b), catchment conceptualization (Baraer et al., 2015; Penna et al., 2017a) and sensitivity to climate change (Kong and Pang, 2012).
The main controls on hydrological and hydrochemical catchment responses are represented by climate, bedrock geology, surficial geology, soil, vegetation, topography, drainage network (Devito et al., 2005; Williams et al., 2015) and catchment shape (Sivapalan, 2003). These catchment properties may affect the partitioning of incoming water and energy fluxes (Carrillo et al., 2011).
First, a major role is attributed to the global and regional climate, having strong impacts on mountain glaciers and permafrost, streamflow amount and timing, water quality, water temperature, and suspended sediment yield (Milner et al., 2009; Moore et al., 2009; IPCC, 2013). The impact of climate is difficult to assess because it requires long time windows (e.g., decades), whereas meteorological drivers interact at a smaller temporal scales and thus are easier to quantify. Among different meteorological drivers, radiation fluxes at the daily timescale were identified as the main energy source driving melting processes in glacierized catchments in different climates (Sicart et al., 2008). Beside radiation, air temperature variations generally correlate well with streamflow under the presence of snow cover (Swift et al., 2005) and may affect the daily streamflow range (Penna et al., 2016; Zuecco et al., 2018) and streamflow seasonality (Hock et al., 1999; Cortés et al., 2011) only after an air temperature threshold has been reached.
Geology sets the initial conditions for catchment properties (Carrillo et al., 2011). The geological setting strongly controls catchment connectivity, drainage, groundwater discharge (Farvolden, 1963), runoff response (Onda et al., 2001), residence time (Katsuyama et al., 2010), hydrochemistry during baseflow conditions (Soulsby et al., 2006a) and melting periods (Hindshaw et al., 2011), and subglacial weathering (Brown and Fuge, 1998). Also geomorphological features such as talus fields may affect streamflow and water quality, resulting from different flow sources and flow pathways (Liu et al., 2004). Catchment storage, as determined by both geology and topography, was found to impact the stream hydrochemistry as well (Rinaldo et al., 2015).
The catchment hydrological conditions, commonly referring to the antecedent soil moisture, are also a relevant driver of the hydrological response (Uhlenbrook and Hoeg, 2003; von Freyberg et al., 2017). Specifically in high-elevation and high-latitude catchments, permafrost thawing also affects the hydrological connectivity (Rogger et al., 2017), leading to a strong control on catchment functioning as it drives the partitioning, storage and release of water (Tetzlaff et al., 2014). In more detail, retreating permafrost may also result in distinct geochemical signatures (Clark et al., 2001; Lamhonwah et al., 2017) and the release of heavy metals being previously stored in the ice (Thies et al., 2007; Krainer et al., 2015). As those contaminants do not only affect the water quality but also the aquatic biota such as macroinvertebrate communities in high-elevation and high-latitude environments (Milner et al., 2009), the hydrochemical characterization of permafrost thawing (i.e., from rock glaciers as a specific form of permafrost) and its impact on stream hydrology deserves further investigation (e.g., Williams et al., 2006; Carturan et al., 2016; Nickus et al., 2015; Colombo et al., 2017).
Although the effect of catchment characteristics and environmental conditions on stream hydrochemistry at different spatial and temporal scales has been studied well in lowland and midland catchments (e.g., Wolock et al., 1997; McGuire et al., 2005; Tetzlaff et al., 2009), only few studies have focused on this aspect in glacierized or permafrost-dominated catchments (Wolfe and English, 1995; Hodgkins, 2001; Carey and Quinton, 2005; Lewis et al., 2012; Kumar et al., 2018). In fact, investigating the geological, meteorological and topographic controls on catchment response and stream water hydrochemistry in high-elevation catchments is essential when analyzing the origin of hydrochemical responses in larger catchments (Chiogna et al., 2016; Natali et al., 2016), calibrating hydrological models (Weiler et al., 2017) and analyzing catchment storages (Staudinger et al., 2017).
In this paper, we aim to fill this knowledge gap by analyzing hydrochemical data from a 2-year monitoring campaign in two nearby glacierized catchments in the eastern Italian Alps, characterized by a similar size and climate but contrasting geological setting. We hypothesize that the markedly different geological properties affect the geochemistry and the hydrological response of both catchments. We test this hypothesis by sampling different water sources (precipitation, stream water, groundwater, snowmelt and glacier melt) for the electrical conductivity (EC), turbidity, and major, minor and trace element analysis.
Within the present study, we specifically aim to answer the following research questions:
-
Does the temporal pattern of the hydrochemical stream signature in the two catchments reflect the dominant rock substratum?
-
Do nivo-meteorological indicators (precipitation, air temperature, solar radiation and snow depth) impact the stream hydrochemical response during the melting period?
-
What is the temporal relationship of discharge and tracer characteristics in the stream?
2.1 The Sulden River catchment
The study was carried out in the Sulden (Solda) River catchment, located in the upper Vinschgau (Venosta) Valley (eastern Italian Alps; Fig. 1). The size of the study area is about 130 km2, defined by the stream gauge station of the Sulden River at Stilfserbrücke (Ponte Stelvio; 1110 m a.s.l.), with a mean elevation of 2507 m a.s.l. The highest elevation is represented by the Ortler (Ortles) peak (3905 m a.s.l.) within the Ortles-Cevedale group. A major tributary is the Trafoi River, joining the Sulden River close to the village Trafoi-Gomagoi. At this location, two sub-catchments, namely the Sulden and Trafoi sub-catchments (75 and 51 km2, respectively), meet.
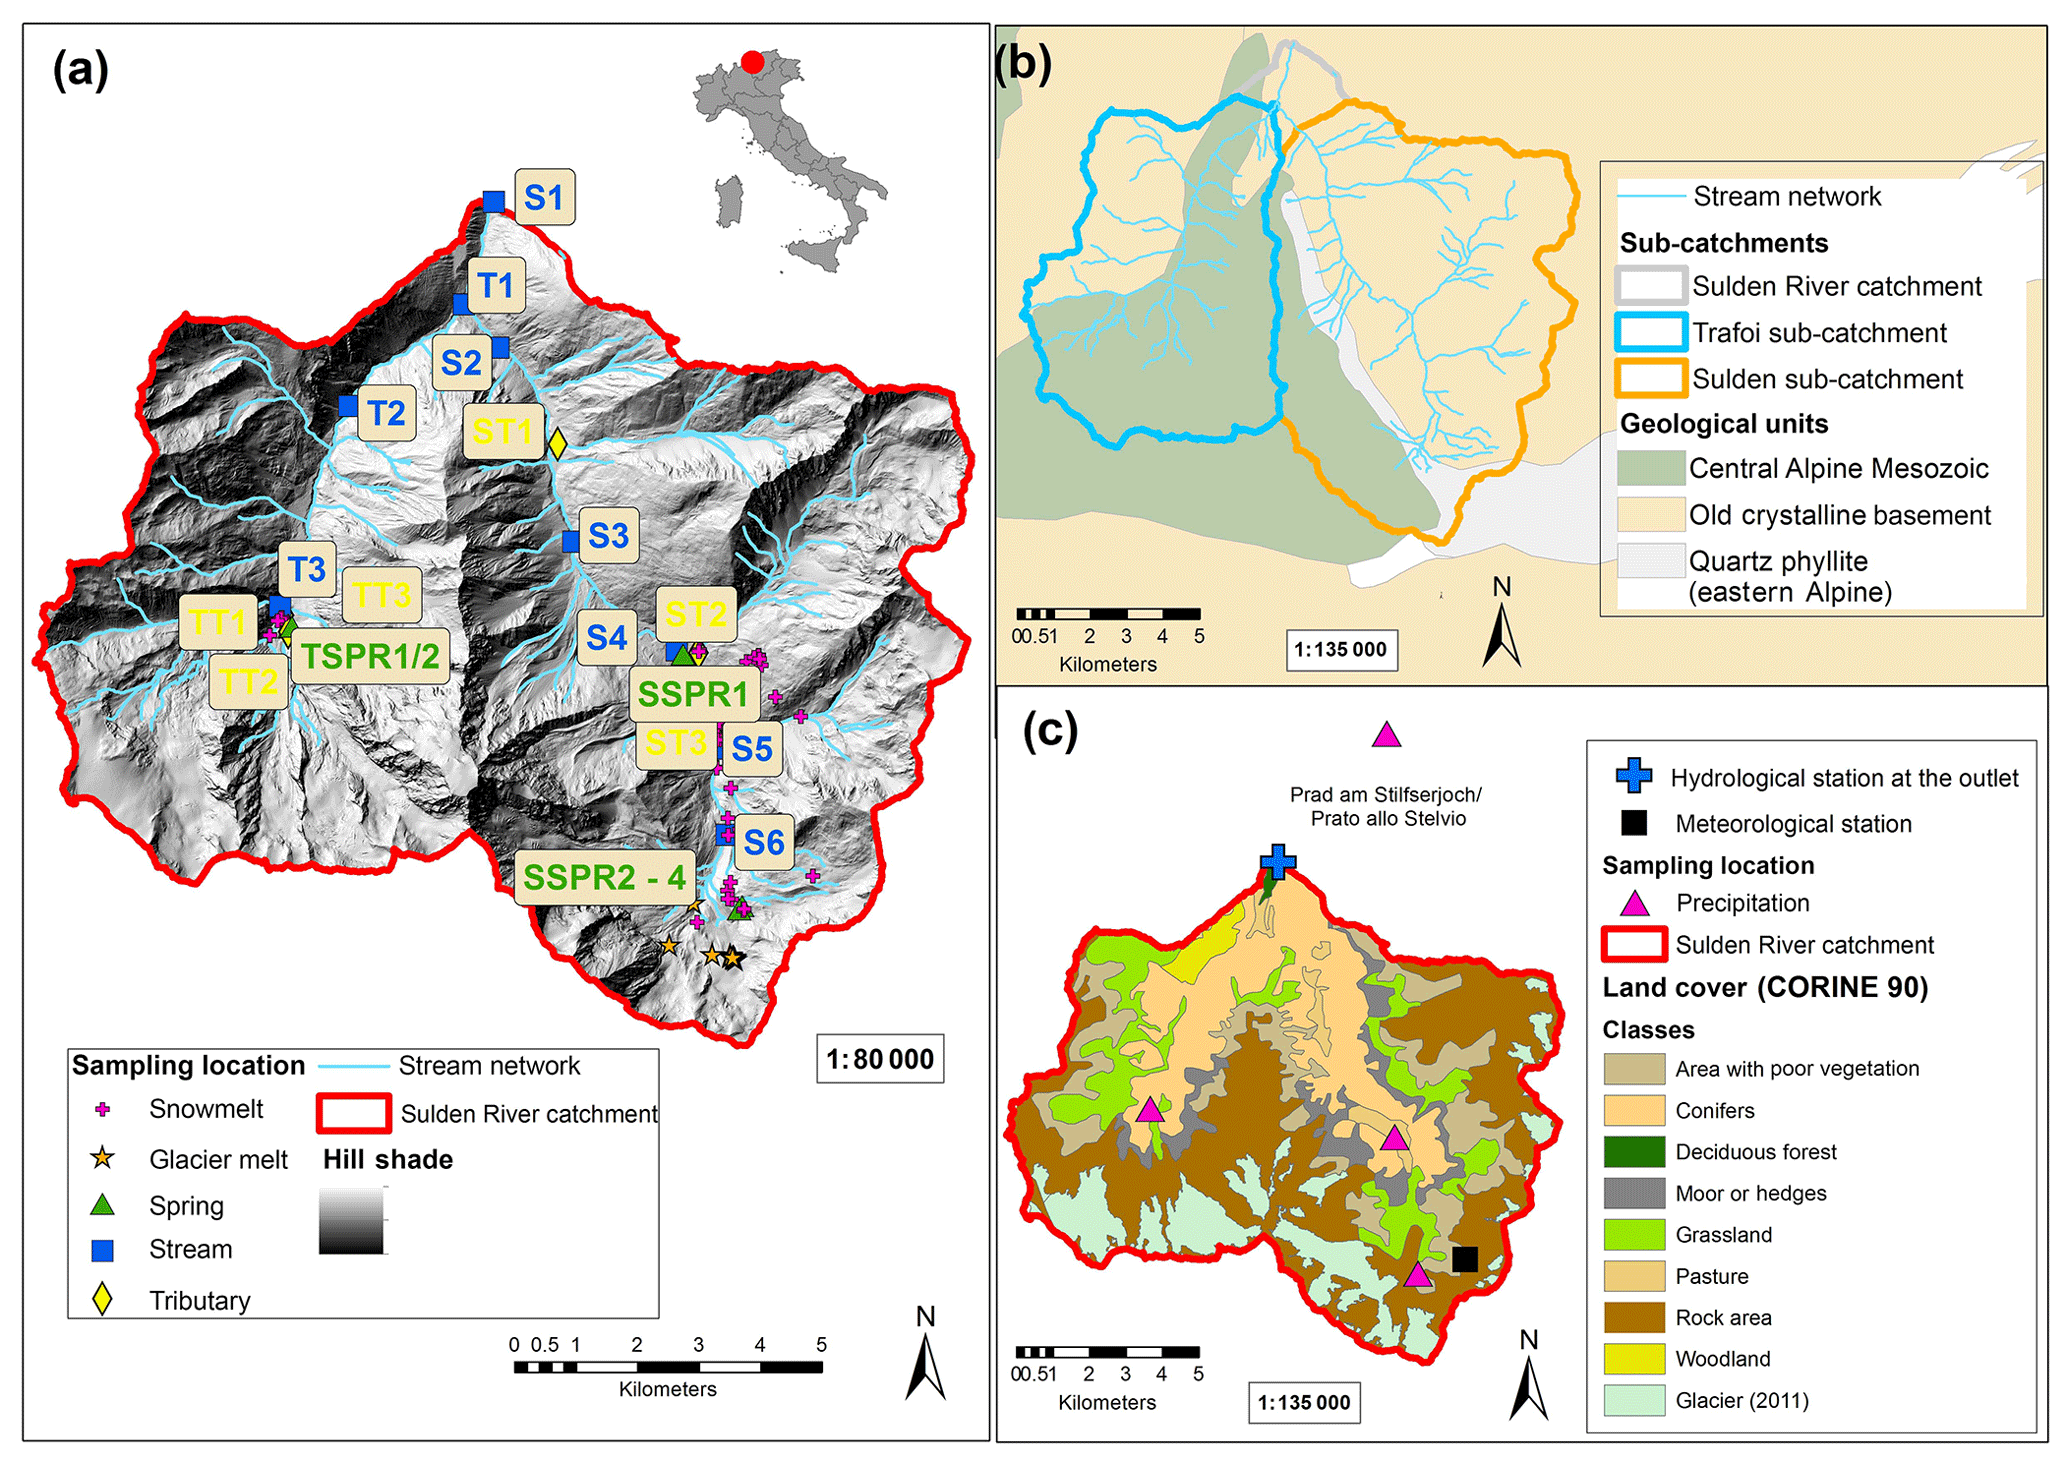
Figure 1Overview of the Sulden catchment with (a) sampling points, (b) geology and (c) land cover with instrumentation. The meteorological station shown is the Madritsch (Madriccio) AWS of the Hydrographic Office (Autonomous Province of Bozen-Bolzano). The glacier extent of 2011 is based on Smiraglia (2015).
The study area had a glacier extent of about 16.9 km2 (13 % of the study area) in 2011, which is slightly higher in the Trafoi than in the Sulden sub-catchment (16.5 % and 11.1 %, respectively). Main glacier tongues in the study area are represented by the Madatsch glacier (Trafoi sub-catchment) and Sulden glacier (Sulden sub-catchment). Geologically, the study area belongs to the Ortler-Campo-Cristalin (Mair et al., 2007). While Permo–Triassic sedimentary rocks dominate the Trafoi sub-catchment, quartz phyllite, orthogneiss and amphibolite are present in the Sulden sub-catchment. However, both catchments share the presence of orthogneiss, paragneiss and mica schist from the lower reaches to the outlet. Permafrost is discontinuously located between 2400 and 2600 m a.s.l. and continuously above 2600 m a.s.l. (Boeckli et al., 2012). Available climatological data show a mean annual air temperature of about -1.6 ∘C and a mean annual precipitation of about 1008 mm (2009 - 2016) at 2825 m a.s.l. (Hydrographic Office, Autonomous Province of Bozen-Bolzano). Due to the location of the study area in the inner dry Alpine zone, these precipitation amounts are relatively low compared to the amounts at similar elevation in the Alps (Schwarb, 2000). Further climatic data regarding the sampling period of this study are shown in Table 1. The study area lies within the National Park Stelvio (Stilfserjoch), but it also includes ski slopes and infrastructure as well as hydropower weirs.
Table 1Meteorological characteristics of the weather station Madritsch (Madriccio) at 2.825 m a.s.l. in 2014 and 2015.

* Precipitation data are not wind-corrected. Rain vs. snow separation was performed following Auer Jr. (1974).
2.2 Meteorological, hydrometric and topographical data
Precipitation, air temperature, humidity and snow depth are measured by an ultrasonic sensor at a 10 min measuring interval at the automatic weather station (AWS) Madritsch (Madriccio) at 2825 m a.s.l., run by the Hydrographic Office, Autonomous Province of Bozen-Bolzano (Fig. 1). We take data from this station to be representative for the glacier in the catchment at a similar elevation. At the catchment outlet at Stilfserbrücke (Ponte Stelvio), water stages are continuously measured by an ultrasonic sensor (Hach Lange GmbH, Germany) at the 10 min measuring interval and converted to discharge via a flow rating curve using salt dilution or photometric measurements (measurement range: 1.2–23.2 m3 s−1; n=22). Turbidity is measured by a SC200 turbidity sensor (Hach Lange GmbH, Germany) at the 5 min measuring interval, which was resampled to 10 min time steps. All data used in this study are recorded and presented in solar time.
Topographical data (such as catchment area and 50 m elevation bands) were derived from a 2.5 m digital elevation model.
2.3 Hydrochemical sampling and analysis
Stream water sampling at the outlet was performed by an automatic sampling approach using an Isco 6712 system (Teledyne Technologies, USA). Daily water sampling took place from mid-May to mid-October 2014 and 2015 (on 331 d, mainly during meltwater conditions) at 23:00 (all times reported in this study refer to solar time) to ensure consistent water sampling close to the discharge peak. In addition, grab samples were taken from different stream locations, tributaries and springs in the Sulden and Trafoi sub-catchments and the outlet, following the sampling scheme of Penna et al. (2014) to account for spatial variability in the hydrochemistry at the catchment scale. Sampling took place monthly from February 2014 to November 2015 (Table 2). Samples were collected approximately at the same time (within less than an hour of difference) on all occasions. In winter, however, a different sampling time had to be chosen for logistical constraints (up to 4 h of difference between both sampling times). However, this did not produce a bias in the results due to the very limited variability in the hydrochemical signature of water sources (related to nearly constant discharge) during winter baseflow conditions (Immerzeel et al., 2012). Three outflows from two active rock glaciers were selected to represent meltwater from permafrost because rock glaciers are considered to be long-term creeping ice-rock mixtures under permafrost conditions (Humlum, 2000). Located on quartz phyllite bedrock in the upper Sulden sub-catchment, three springs at the base of the steep rock glacier front at about 2600 m a.s.l. were sampled monthly from July to September 2014 and July to October 2015. Snowmelt water was collected as dripping water from snow patches from April to September 2014 and March to October 2015 (n=48 samples), mainly located on the western to north-facing slopes of the Sulden sub-catchment and at the head of the valley in the Trafoi sub-catchment. Glacier meltwater was taken from rivulets only at the eastern tongue of the Sulden glacier from July to October 2014 and 2015 (n=11 samples) for its safe accessibility. EC was measured in the field by a portable conductivity meter WTW 3410 (WTW GmbH, Germany) with a precision of ±0.1 µS cm−1 (nonlinearly corrected by temperature compensation at 25 ∘C).
Table 2Topographical characteristics of sub-catchments defined by sampling points.
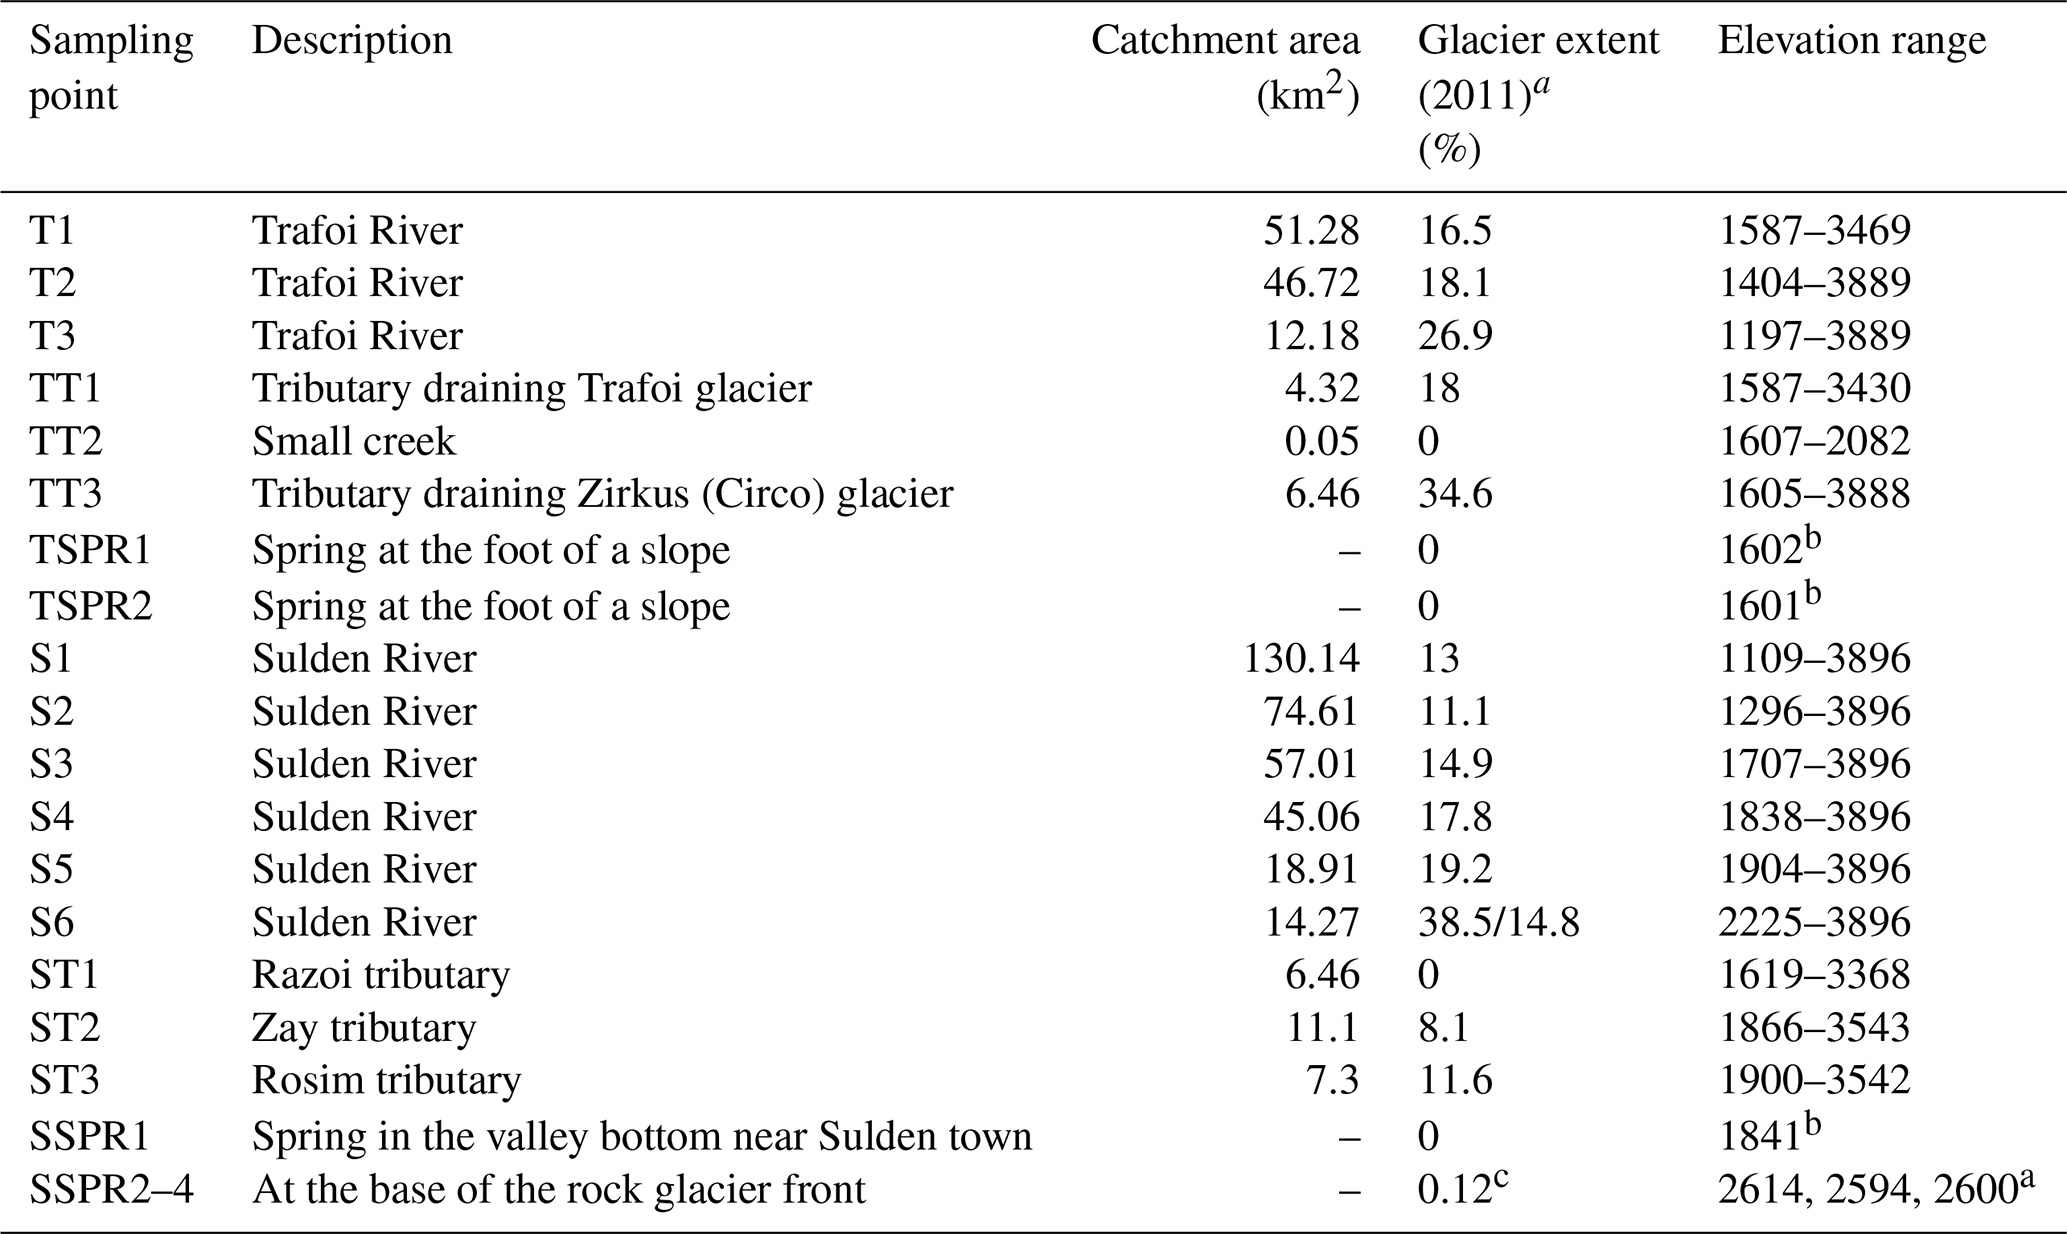
a The glacier extent refers to Smiraglia (2015). b For spring locations, the elevation of the sampling point is given. cFor rock glacier spring locations, the glacier cover refers to the extent of both rock glaciers.
All samples were stored in 50 ml PVC bottles with a double cap and no headspace. The samples were kept in the dark at 4 ∘C in the fridge before analysis. δ2H and δ18O isotopic composition of all water samples (except the Isco stream water samples at the outlet) were analyzed at the Laboratory of Isotope and Forest Hydrology of the University of Padua (Italy), Department of Land, Environment, Agriculture and Forestry, by an off-axis integrated cavity output spectroscope (model DLT-100 908-0008, Los Gatos Research Inc., USA). The analysis protocol and the description of reducing the carry-over effect are reported in Penna et al. (2010, 2012). The instrumental precision (as an average standard deviation of 2094 samples) is 0.5 ‰ for δ2H and 0.08 ‰ for δ18O.
The δ18O isotopic composition of the Isco stream water samples was analyzed by an isotopic ratio mass spectrometer (GasBench Delta V, Thermo Fisher) at the Free University of Bozen-Bolzano. Following the gas equilibration method (Epstein and Mayeda, 1953), 200 µL subsamples were equilibrated with He-CO2 gas at 23 ∘C for 18 h and then injected into the analyzer. The isotopic composition of each sample was calculated from two repetitions, and the standard deviation was computed. The instrumental precision for δ18O was ±0.2 ‰. We applied a correction factor, described in Engel et al. (2016), to adjust the isotopic compositions of δ18O measured by the mass spectrometer to the ones measured by the laser spectroscope.
The analysis of major, minor and trace elements (Li, B, Na, Mg, Al, K, Ca, V, Cr, Mn, Fe, Co, Ni, Cu, Zn, Rb, Sr, Mo, Ba, Pb and U) was carried out by inductively coupled plasma mass spectroscopy (ICP-MS iCAP Q, Thermo Fischer) at the laboratory of Eco-Research S.r.l (Bolzano).
2.4 Data analysis
In order to better understand the effect of meteorological controls at different timescales, different nivo-meteorological indicators derived from precipitation, air temperature, solar radiation and snow depth data from AWS Madritsch were calculated (Table 3).
Table 3Nivo-meteorological indicators derived from the weather station Madritsch (Madriccio) at 2825 m a.s.l.
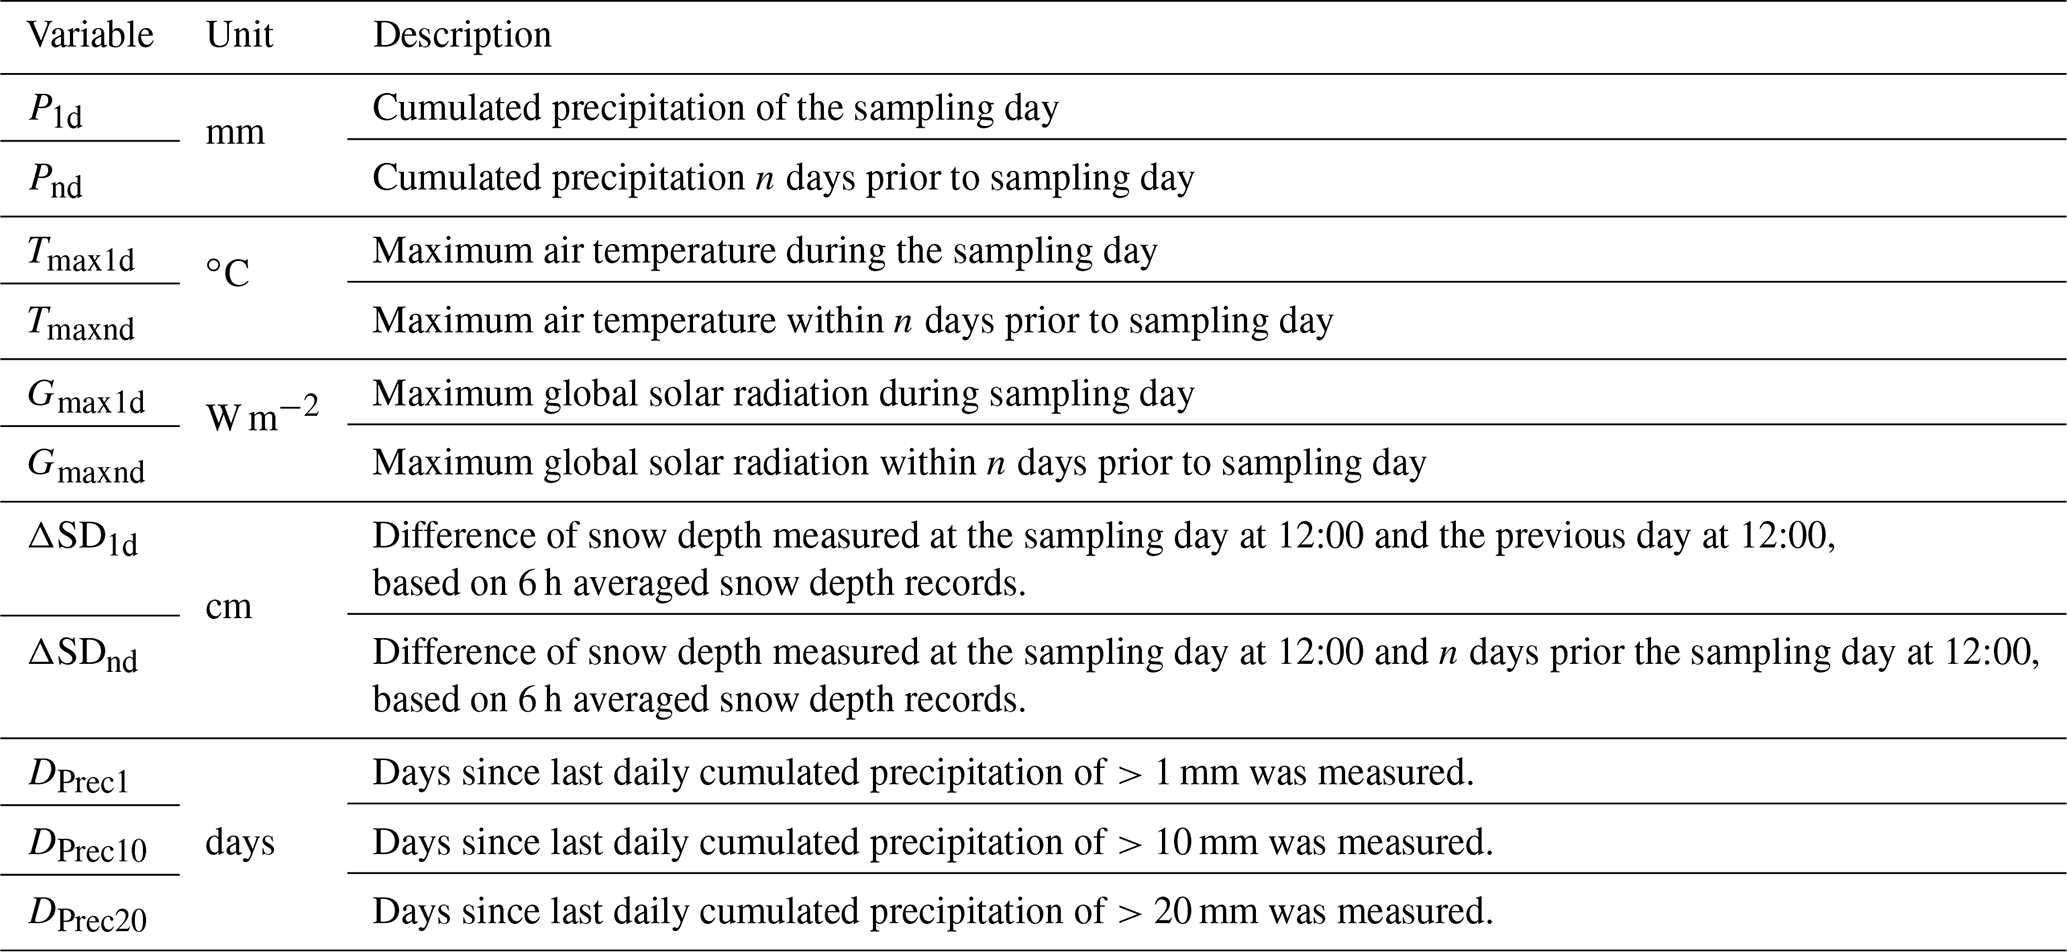
We performed a temporal sensitivity analysis to better understand at which temporal scale these nivo-meteorological indicators affect the hydrometric and hydrochemical stream response at the outlet. For that purpose, we calculated the indicators for each day of stream water sampling and included in the calculations a period of time of up to 30 d prior to the sampling day by using a 1 d incremental time step. As precipitation indicators, we considered the cumulated precipitation P in a period between 1 and 30 d prior to the sampling day and the period of time Dprec in days starting from 1, 10 or 20 mm of cumulated precipitation that occurred prior to the sampling day. We selected the daily maximum air temperature Tmax and daily maximum global solar radiation Gmax in a period between 1 and 30 d prior the sampling day as snow and ice melt indicators. Moreover, we calculated the difference of snow depth, ΔSD, and used it as a proxy for snowmelt. We derived this indicator from measurements on the sampling day and the previous days, varying from 1 to 30 d. Then, we excluded snow depth losses up to 5 cm to remove noisy data. We also derived the snow presence from these data when snow depth exceeded 5 cm.
The temporal sensitivities of agreement between nivo-meteorological indicators and hydrochemical signatures were expressed as Spearman's rank correlation coefficients (p<0.05) and represented a measure for obtaining the most relevant nivo-meteorological indicators to be considered for further analysis in this study.
In order to understand the link among water sources and their hydrochemical composition, a principle component analysis (PCA), using data centered to zero and scaled to variance 1 (R core team, 2016), was performed. Data below detection limit were excluded from the analysis.
To assess the dampening effect of meltwater on stream water chemistry during baseflow conditions and the melting period, the variability coefficient (VC) was calculated following Sprenger et al. (2016; Eq. 1):
where SDbaseflow is the standard deviation of stream EC sampled during baseflow conditions in winter at a given location, and SDmelting is the standard deviation of stream EC at the same locations during the melting period in summer.
We applied a two-component mixing model based on EC and δ2H data to separate the runoff contributions originating from the Sulden and Trafoi sub-catchment at each sampling moment during monthly sampling (Sklash et al., 1976), following Eqs. (2) and (3):
where Q is the discharge, P is the runoff proportion, and C is the EC or isotopic composition in δ2H measured at the locations S1 (outlet), S2 (sampling location in the Sulden sub-catchment upstream the confluence with Trafoi River) and T1 (sampling location in the Trafoi sub-catchment upstream the confluence with Sulden River; see Fig. 1). The uncertainty in this calculation was expressed as Gaussian error propagation using the instrumental precision of the conductivity meter (0.1 µS cm−1) and sample standard deviation from the laser spectroscope, following Genereux (1998). Furthermore, statistical analysis was performed to test the variance of hydrochemical data by means of a t test (if data followed normal distribution) or a nonparametric Mann–Whitney rank sum test (in the case of data that is not distributed normally).
3.1 Origin of water sources
Element concentrations of stream and rock glacier spring water are presented in Table S1 and S2 in the Supplement. It is worth highlighting that heavy metal concentrations (such as Al, V, Cr, Ni, Zn, Cd and Pb) showed the highest concentrations during intense melting in July 2015 at all six locations (partly exceeding concentration thresholds for drinking water – see European Union (Drinking Water) Regulations, 2014). Element concentrations were clearly higher at the most upstream sampling locations. Relatively low variability coefficients (VC <0.3) for these elements confirmed that larger variations in concentrations occurred during the melting period and not during baseflow conditions. Interestingly, the highest heavy metal concentrations (such as Mn, Fe, Cu and Pb) of rock glacier springs SSPR2–4 delayed the heavy metal concentration peak in the stream by about 2 months.
In contrast, other element concentrations (such as As, Sr, K and Sb) generally revealed higher concentrations during baseflow conditions and lower concentrations during the melting period. This observation was corroborated by relatively high variability coefficients for As (VC: 2–2.9) and Sb (VC: 2–2.2) at S1, S2 and T1. For example, while the highest Sr concentrations were measured at S6, As was highest at the downstream locations T1, S2 and S1. Regarding the rock glacier springs, their hydrochemistry showed a gradual decrease in As and Sr concentration from July to September 2015. The observed geochemical patterns are confirmed by PCA results (Fig. 2) and the correlation matrix (Fig. 3), revealing that geochemical dynamics are driven by temporal (PC1) and spatial controls (PC2) and a typical clustering of elements, respectively. PC1 showed high loadings for heavy metal concentrations (such as Al, V, Cr, Ni, Zn, Cd and Pb), supporting the clear temporal dependency for the entire catchment (baseflow conditions vs. melting period; Fig. 2a). PC2 was instead mostly characterized by high loadings of δ2H and δ18O in the Trafoi sub-catchment (i.e., T1 and TT2) and geochemical characteristics (EC, Ca, K, As and Sr) from the upstream region of the Sulden River and rock glacier spring water (i.e., S6 and SSPR2–4, respectively). Overall, temporal and spatial controls explained a variance of about 53 %.
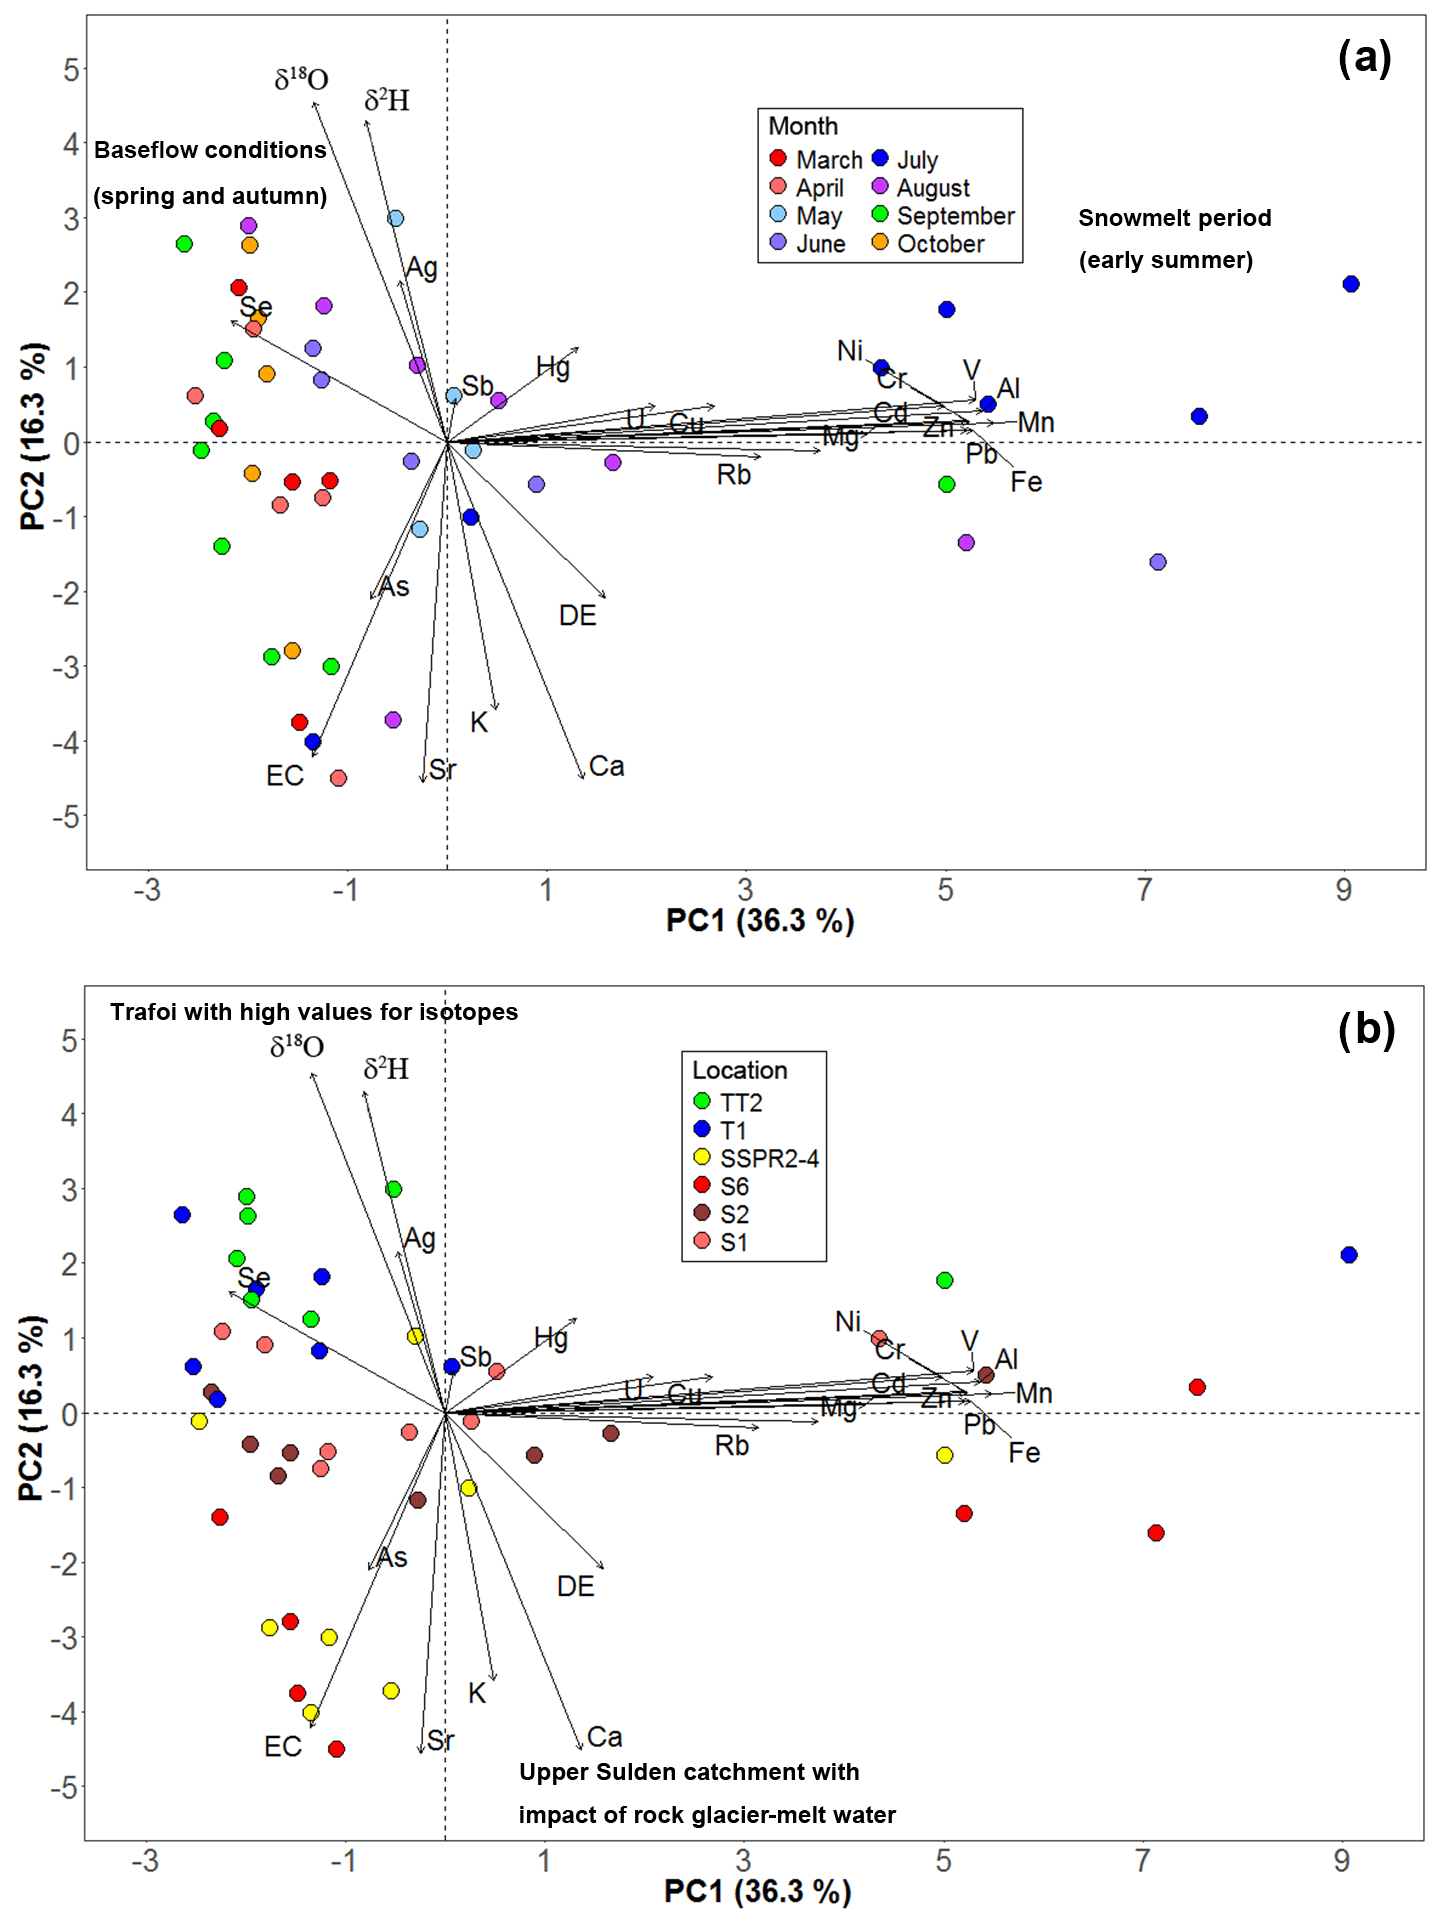
Figure 2Principle component analysis of element concentrations of stream water and springs draining a rock glacier sampled in the Sulden and Trafoi sub-catchments from March to October 2015. Data based on n=47 samples are shown in groups according to (a) the sampling locations and (b) the sampling month.

Figure 3Spearman's rank correlation matrix of hydrochemical variables. Values are shown for a level of significance p<0.05, and are otherwise crossed out.
3.2 Temporal and spatial tracer variability in the sub-catchments
The temporal and spatial variability in EC in the Sulden and Trafoi River along the different sections, their tributaries and springs is illustrated in Fig. 4. During baseflow conditions, from late autumn to early spring prior to the onset of the melting period in May–June, water enriched with solutes had an important impact on stream hydrochemistry, as stream and tributary locations showed the most increased conductivity, ranging from 132.5 to 927 µS cm−1 in January to March 2015. During the same period, isotopic composition was slightly more enriched (δ2H: −96.7 ‰ to 102.5 ‰) and spatially more homogeneous among the stream (δ2H: −96.7 ‰ to 102.5 ‰), tributaries (δ2H: −96.5 ‰ to 109.8 ‰) and springs (δ2H: −96.5 ‰ to 104 ‰) than in the summer months. In contrast, during the melting period, water from all sites in both sub-catchments became diluted due to different inputs of meltwater (Fig. 4a and b), while water was most depleted during snowmelt-dominated periods (e.g., mid-June 2014 and end of June 2015) and less depleted during periods dominated by glacier melt (e.g., mid to end of July 2014 and 2015; Fig. 4c and d). Rainfall became a dominant runoff component during intense storm events. For instance, on 24 September 2015, a storm of 35 mm d−1 resulted in the strongest isotopic enrichment of this study, which is visible in Fig. 4c at T3 and TT2 (δ2H: −86.9 ‰; δ18O: −12.4 ‰).
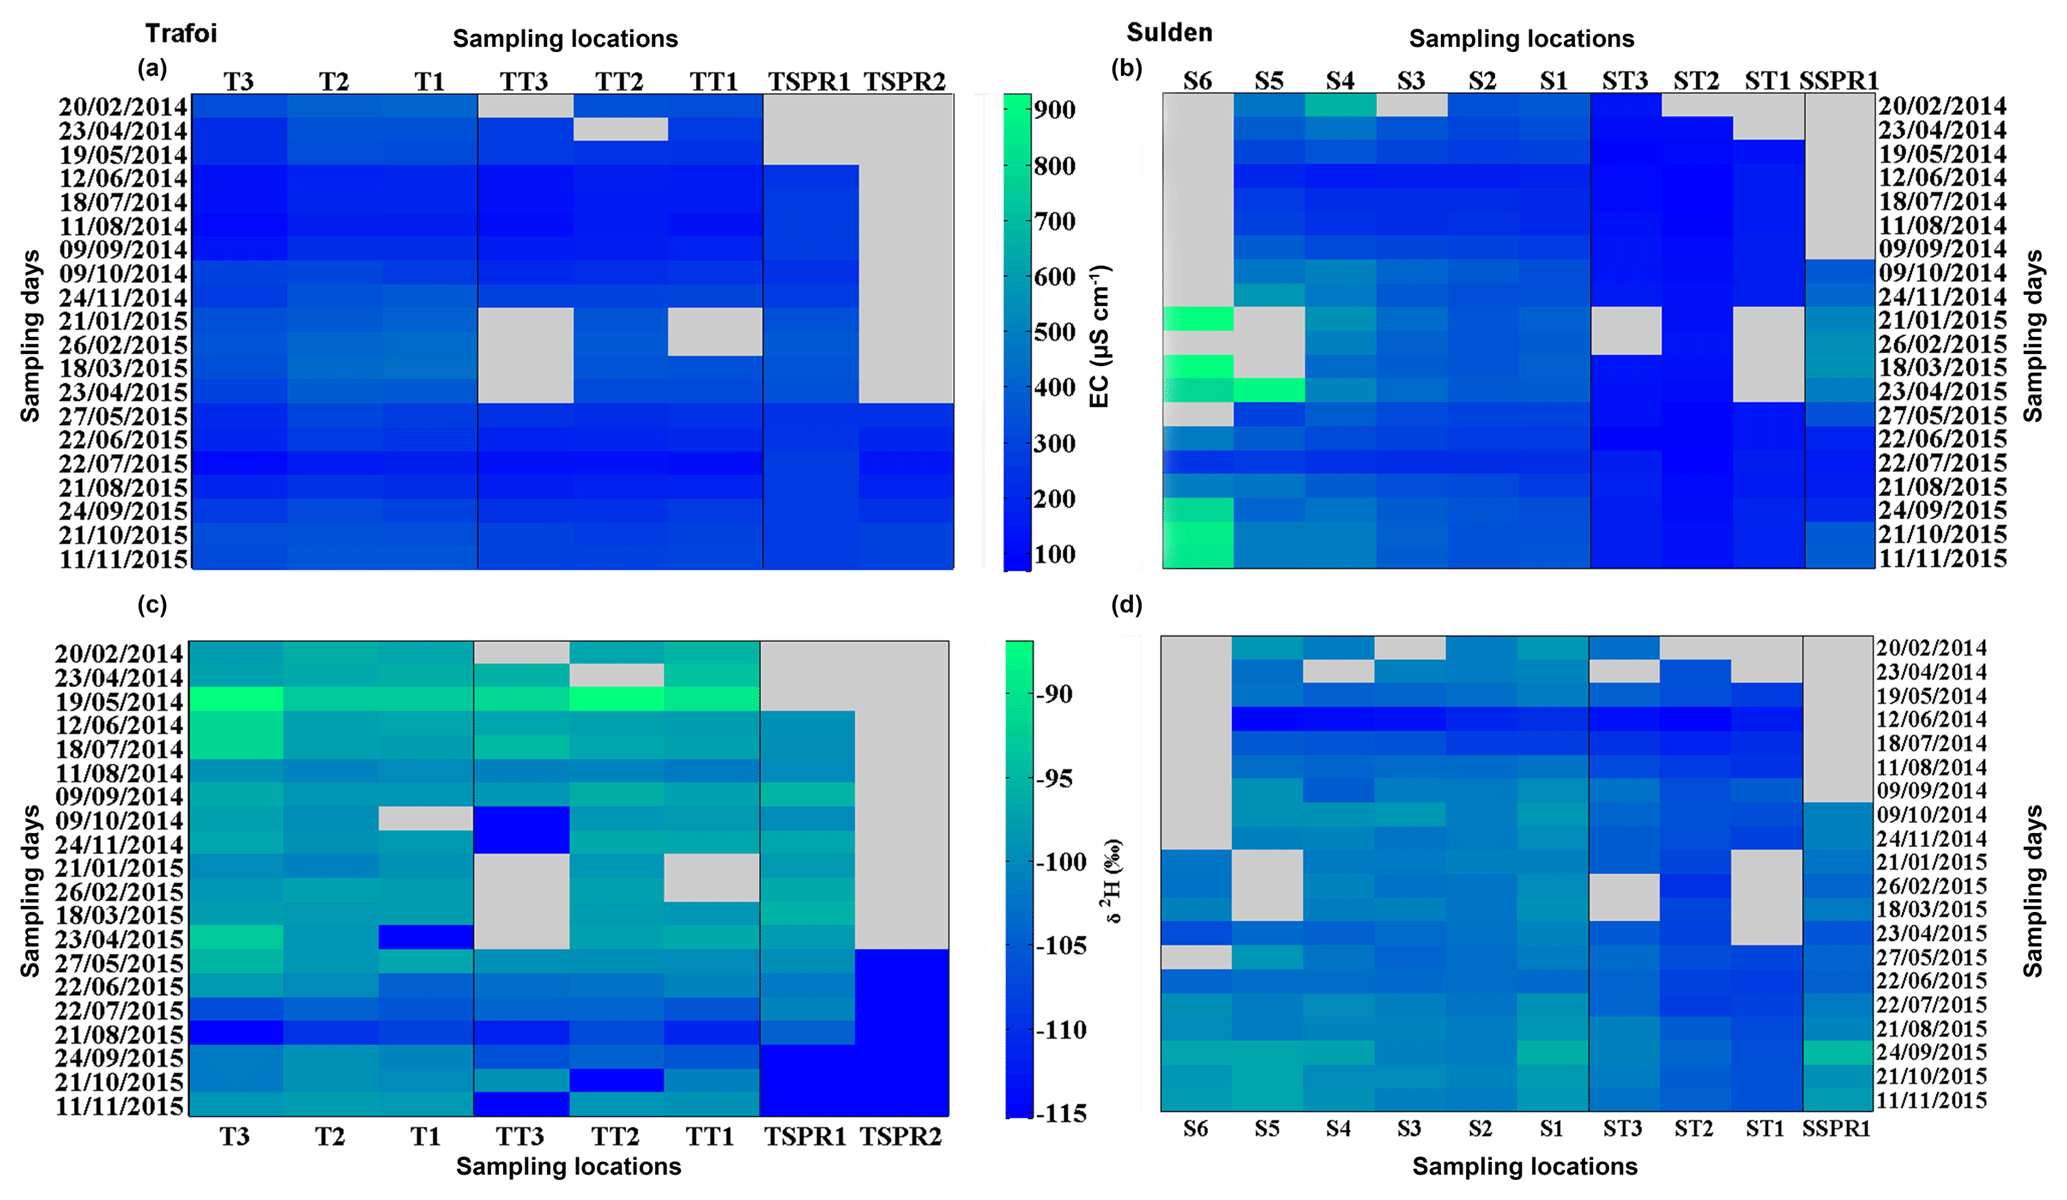
Figure 4Spatial and temporal variability in EC (µS cm−1) and δ2H (‰) at different stream sections, tributaries and springs within the Trafoi sub-catchment (a, c) and the Sulden sub-catchment (b, d) in 2014 and 2015. The heat maps are grouped into locations at streams, tributaries and springs. Grey areas refer to missing sample values due to frozen or dried-out streams or tributaries or because the sampling location was included later in the sampling scheme.
Hereinafter, the hydrochemistry of the Sulden and Trafoi sub-catchment is analyzed in terms of hydrochemical patterns of the main stream, tributaries, springs and runoff contributions at the most downstream sampling location above the confluence. At T1 and S2, hydrochemistry was statistically different in its isotopic composition (Mann–Whitney rank sum test: p<0.001) but not in EC (Mann–Whitney rank sum test: p=0.835). Runoff originating from Trafoi and derived from the two-component HS contributed to the outlet by about 36 % (±0.004) to 58 % (±0.003) when using EC and ranged from 29 % (±0.09) to 83 % (±0.15) when using δ2H. These streamflow contributions expressed as specific discharge from Trafoi sub-catchment (and Sulden sub-catchment) were 20.6 (37.1) and 16.2 (12) L s−1 km−2 for EC and 50.4 (121.9) and 12.2 (2.6) L s−1 km−2 for δ2H, respectively. Therefore, with respect to the temporal variability in the sub-catchment contributions, runoff at the outlet was sustained more strongly by the Trafoi River during non-melting periods, while the runoff from the Sulden sub-catchment dominated during the melting period.
By the aid of both tracers, catchment-specific hydrochemical characteristics such as contrasting EC gradients along the stream were revealed (Figs. 4 and 5). EC in the Trafoi River showed a linear increase with increasing catchment area (from T3 to T1) during baseflow and melting periods (EC enrichment gradient).
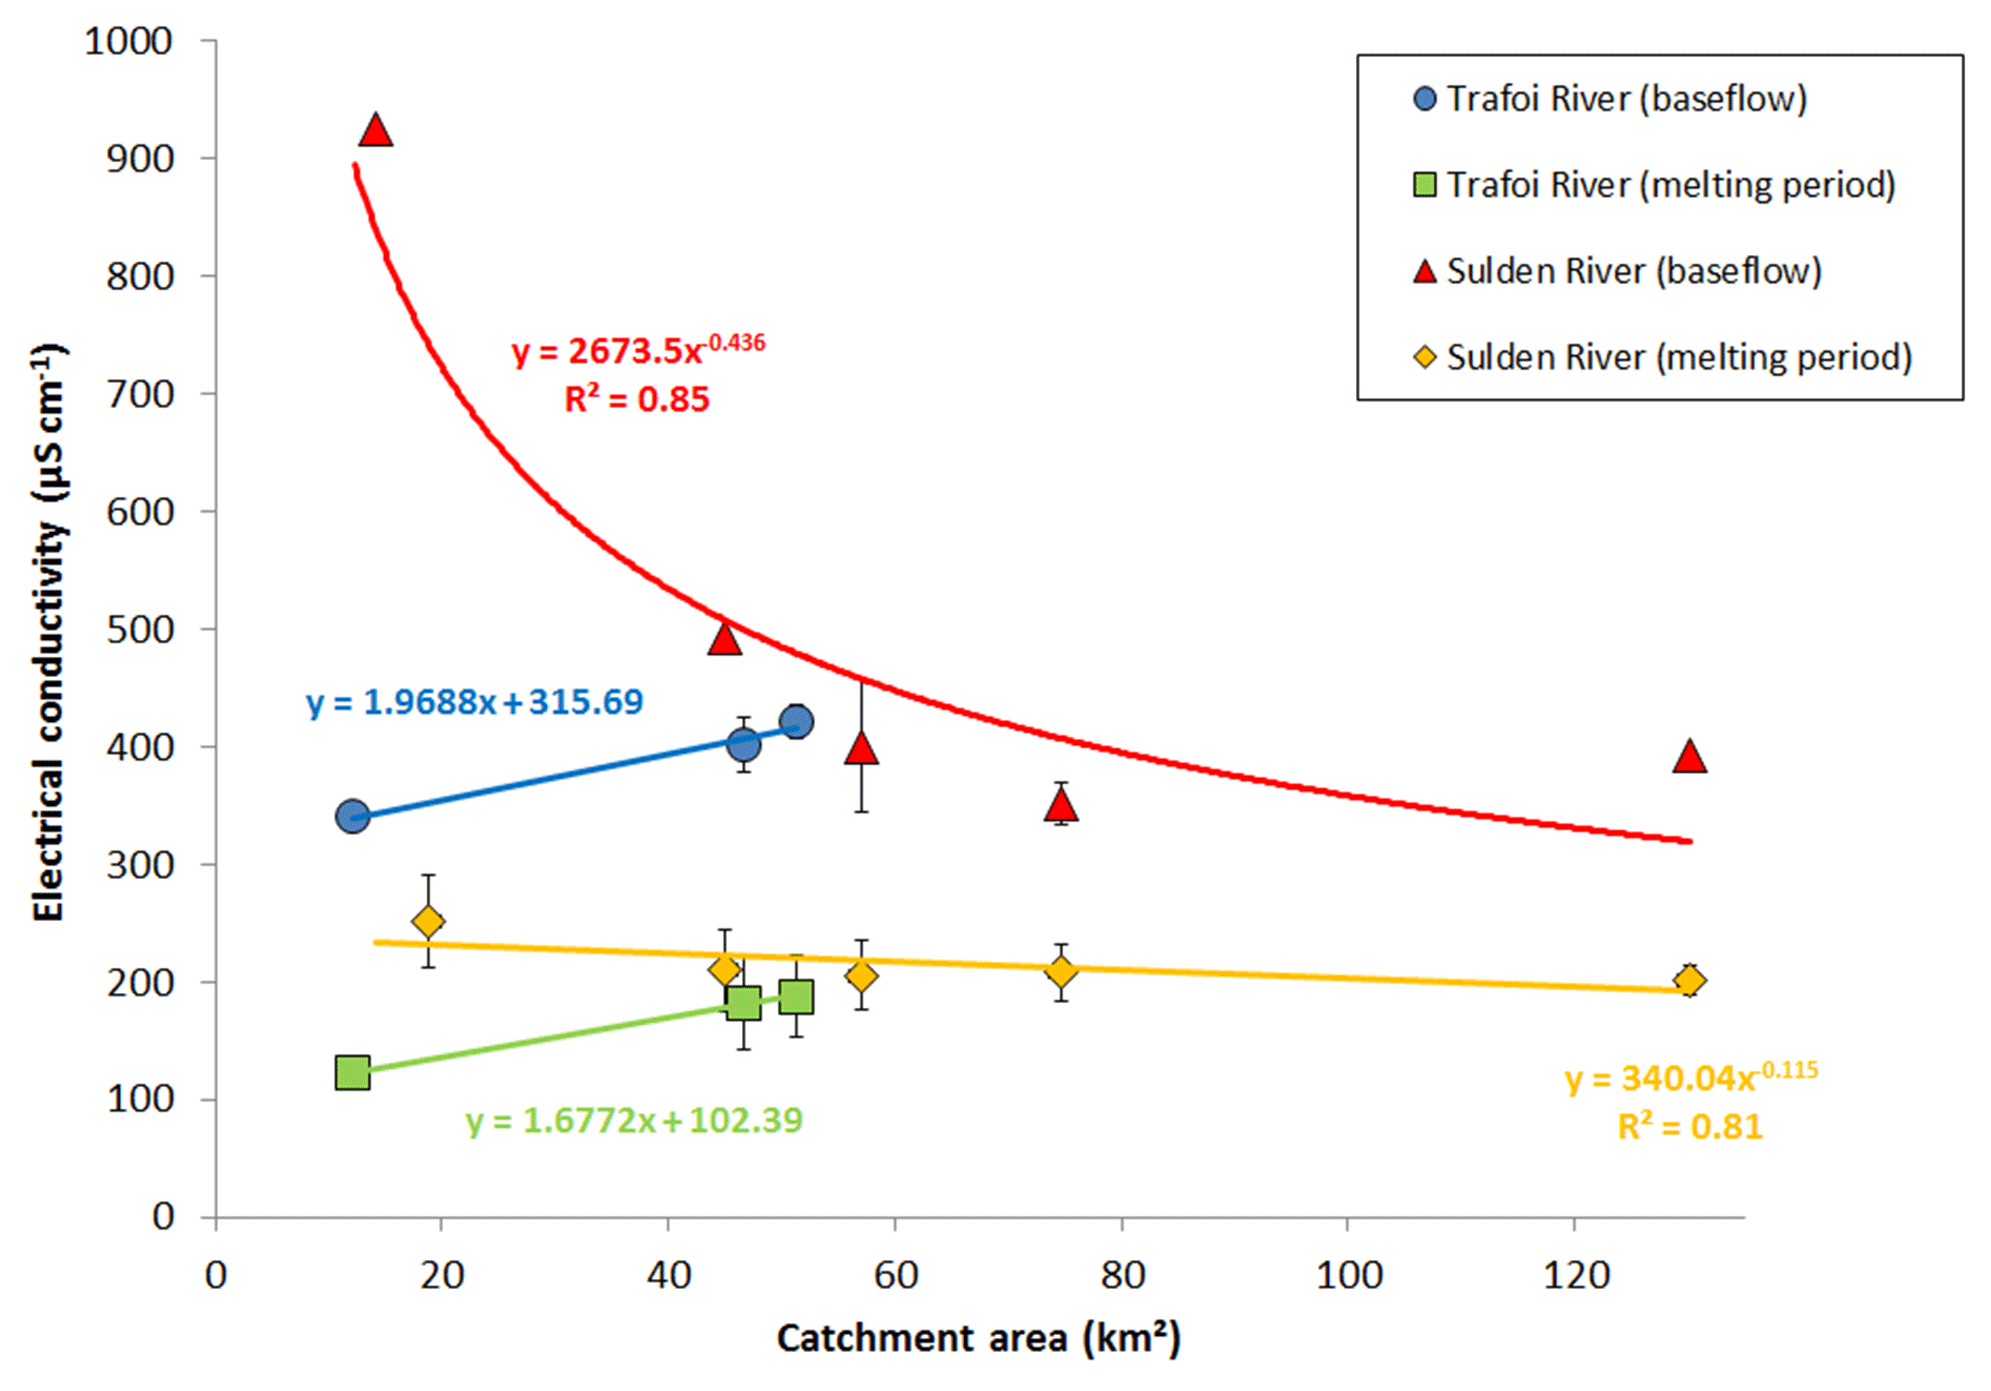
Figure 5Spatial variability in electrical conductivity along the Trafoi and Sulden River against catchment area. Electrical conductivity is averaged for sampling days during baseflow conditions (21 January, 26 February and 18 March 2015) and melting period (12 June, 18 July, 11 August and 9 September 2014).
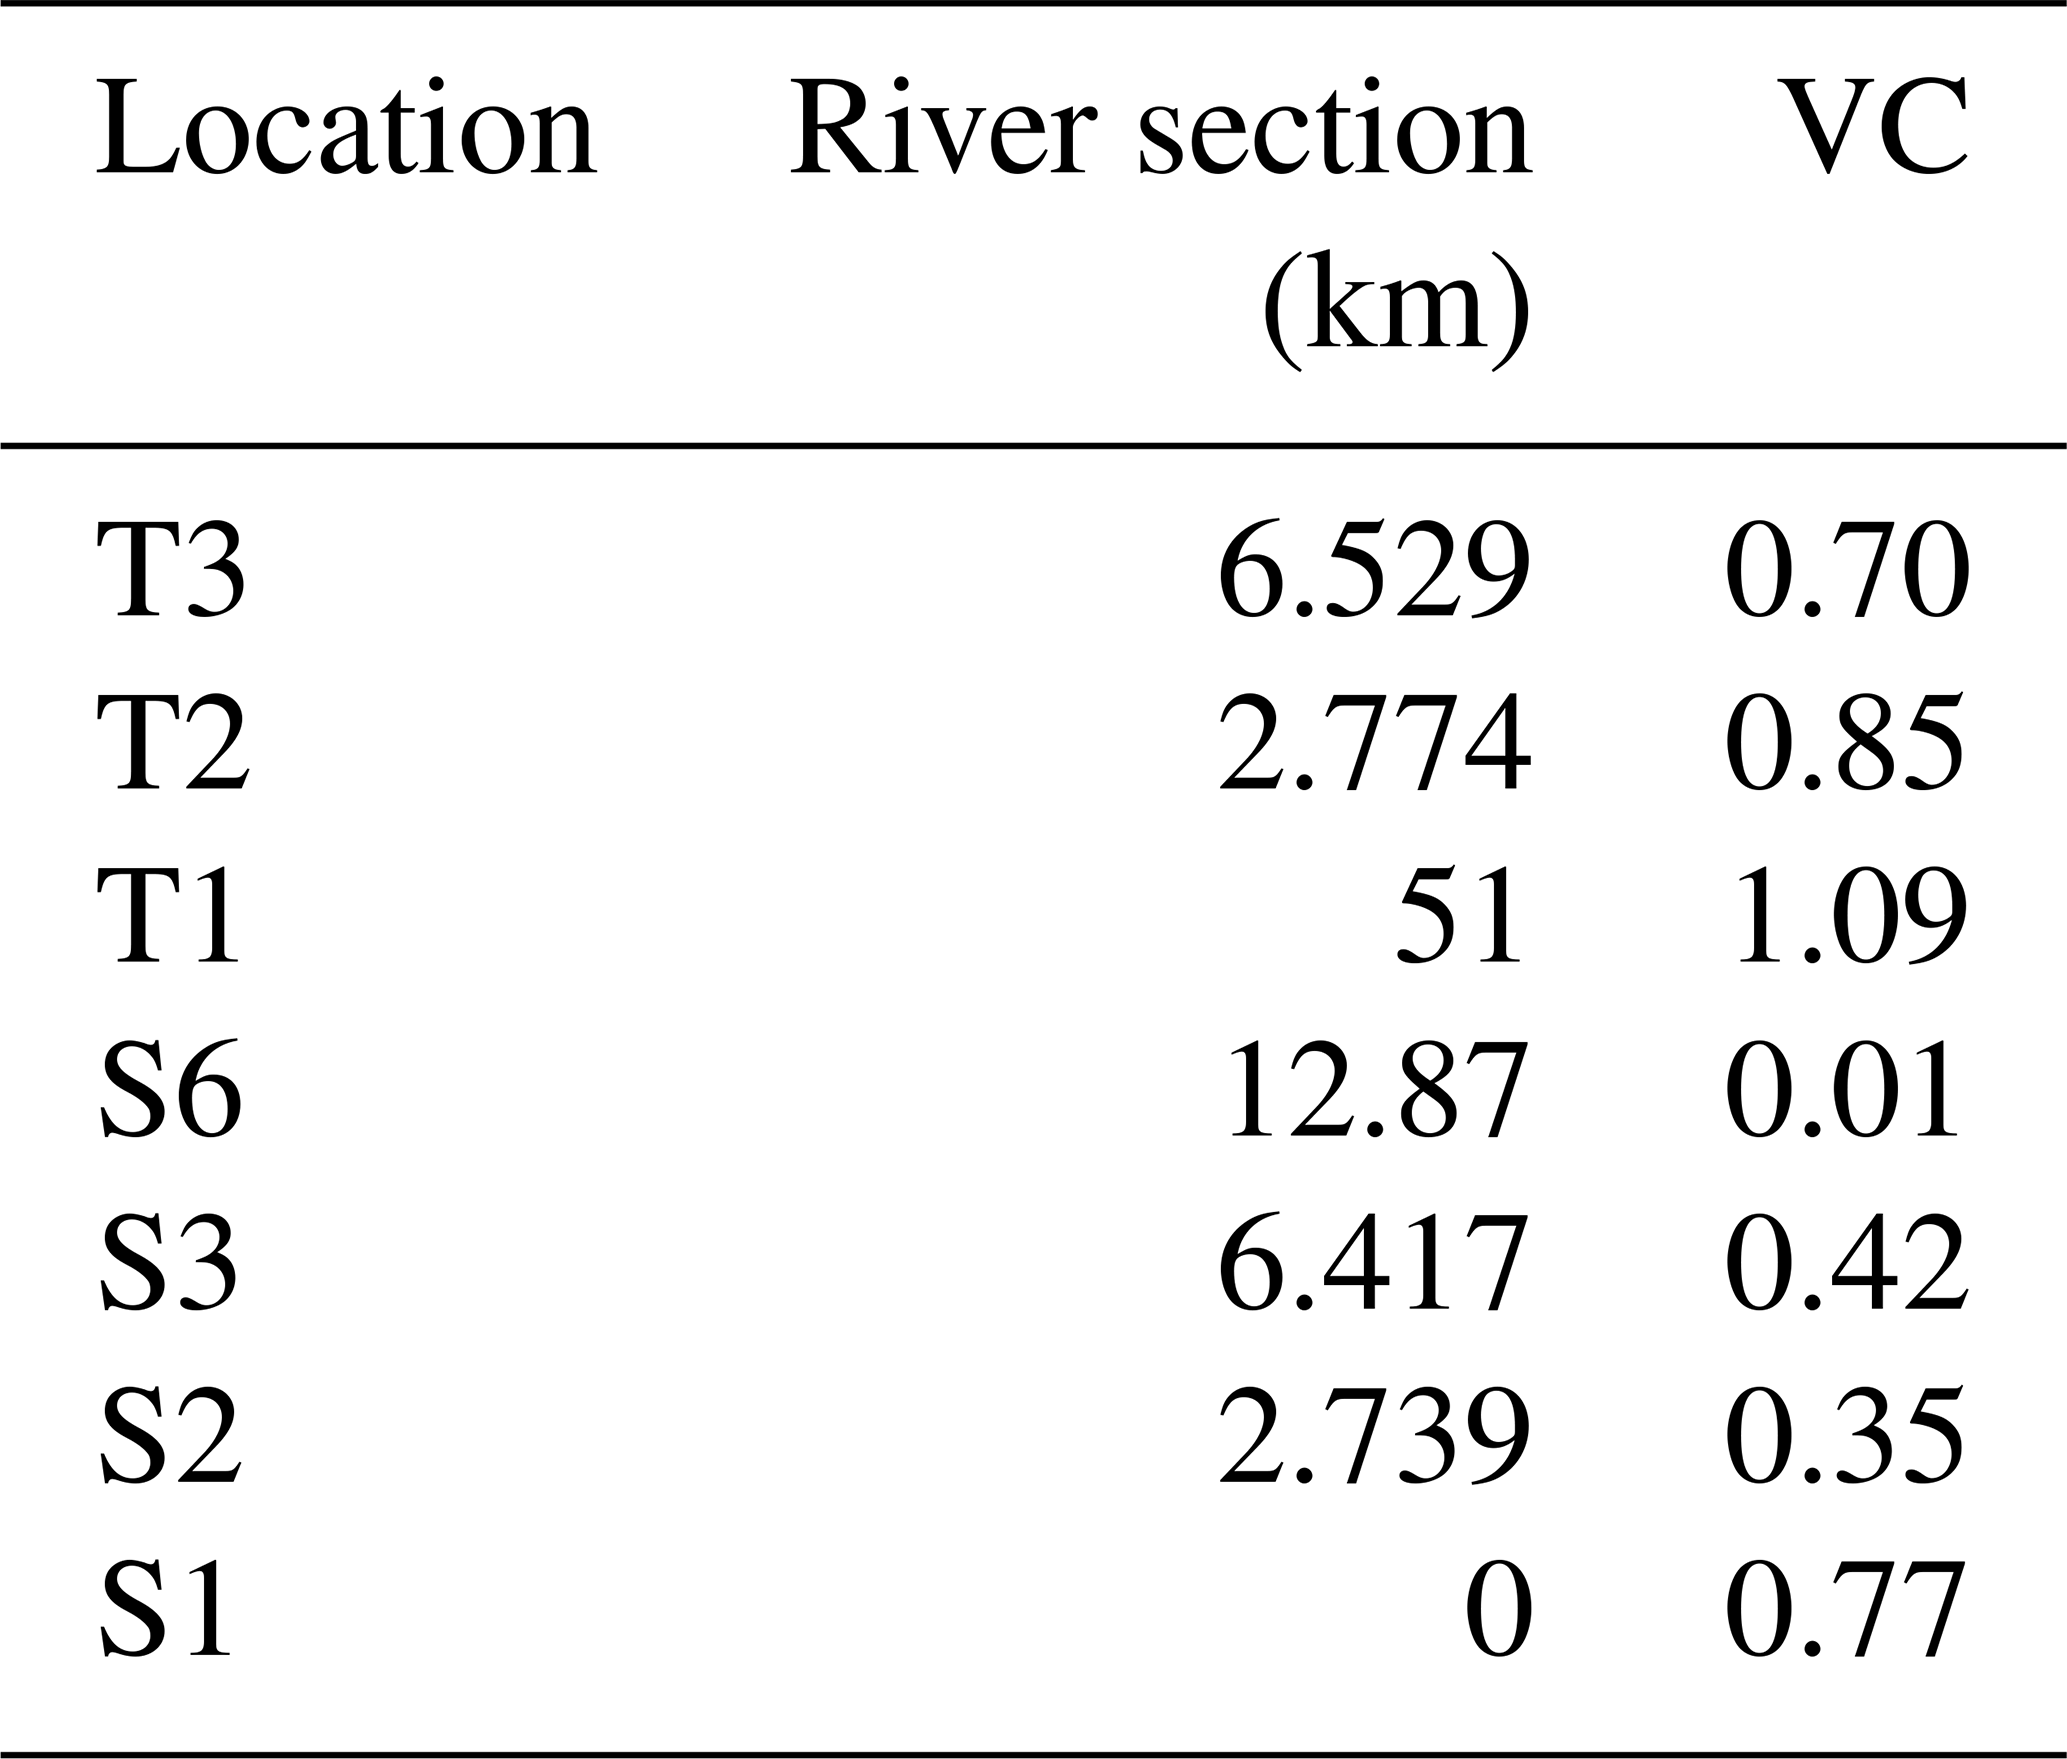
In contrast, the Sulden River revealed relatively high EC (926 µS cm−1) at the highest upstream location (S6) and relatively low EC (393 µS cm−1) upstream the confluence with the Trafoi River (S2) during baseflow conditions in January to March 2015. The exponential decrease in EC (EC dilution gradient) during this period of time was strongly linked to the catchment area (R2=0.85). Surprisingly, the EC dilution along the Sulden River was still persistent during melting periods but reduced highly. In this context, it is also interesting to compare the EC variability (expressed as VC) along the Trafoi and Sulden River during baseflow conditions and melting periods (Table 4). For both streams, VC increased with decreasing distance to the confluence (Trafoi River) and the outlet (Sulden River), thus representing an increase in catchment size. The highest EC variability among all stream sampling locations is given by the lowest VC, which was calculated for S6. This location represents the closest one to the glacier terminus and showed a pronounced contrast of EC during baseflow conditions and melting periods (see Figs. 4 and 5).
Table 4Variability coefficient (VC) for selected locations along the Sulden and Trafoi River in 2014 and 2015.
Regarding the hydrochemical characterization of the tributaries in both sub-catchments (Fig. 4), Sulden tributaries were characterized by a relatively low EC variability (68.2–192.3 µS cm−1) and more negative isotopic values (δ2H: −100.8 ‰ to 114.5 ‰) compared to the higher variability in hydrochemistry of the Sulden River. In contrast, the tracer patterns of Trafoi tributaries were generally consistent with the ones from the stream. Generally, spring water at TSPR1, TSPR2 and SSPR1 also followed these patterns during baseflow and melting periods in a less pronounced way, possibly highlighting the impact of infiltrating snowmelt into the ground. Comparing both springs sampled in the Trafoi sub-catchment indicated that spring waters were statistically different only when using EC (Mann–Whitney rank sum test: p=0.039). While TSPR1 hydrochemistry was slightly more constant, that of TSPR2 was more variable from June to August 2015 (Fig. 4).
3.3 Meteorological controls on hydrometric and hydrochemical stream responses
To identify the effect of meteorological controls at high elevations on the hydrometric and hydrochemical stream response at the outlet, we first present the relationship between meteorological parameters against snow depth differences (Fig. 6). Then, we show snow depth differences compared with discharge, EC and isotopic data (Fig. 7).

Figure 6Box plots of environmental variables (a) daily maximum air temperature and (b) daily maximum global radiation on snowmelt expressed as snow depth differences at AWS Madritsch. Snow depth differences smaller than 5 cm are discarded from analysis. dd refers to the days considered for analysis.

Figure 7Box plots of snowmelt expressed as snow depth differences at AWS Madritsch on the variability in (a) discharge, (b) EC and (c) δ18O at the outlet Stilfserbrücke in 2014 and 2015. dd refers to the days considered for analysis.
Among the nivo-meteorological indicators listed in Table 3, daily maximum air temperature Tmax and daily maximum global solar radiation Gmax were the most important drivers to control snowmelt (expressed as snow depth differences) at high elevations (Fig. 6). While moderate snow depth losses by up to 30 cm occurred during days with Tmax between 0 and 5 ∘C, higher snow depth losses (up to 80 cm) were associated with warmer days, when Tmax ranged between 5 and 12.5 ∘C at AWS Madritsch.
With respect to Gmax, only small snow depth losses of up to 10 cm and small variability were present when Gmax ranged from 600 to 1000 W m−2. As soon as the daily maximum of 1000 W m−2 was exceeded, snow depth losses could reach a maximum of up to 80 cm. When exceeding these Tmax and Gmax thresholds, the variability in snow depth losses remarkably increased and increased with the timescale of the observation period.
As a consequence, high-elevation snowmelt played an important role in explaining both the hydrometric and hydrochemical response at the outlet Stilfserbrücke (Fig. 7). During the snowmelt period, discharge at the outlet clearly increased with increasing snowmelt due to snow depth losses at high elevation. For example, median discharges of 6.25 and 7.5 m3 s−1 resulted from snow depth losses of 50 and 75 cm, while discharges higher than 20 m3 s−1 occurred when snow depth losses were higher than 100 cm during the previous days.
Moreover, the increasing amount of snowmelt resulted in decreasing EC and lower δ18O. While median EC of about 250 µS cm−1 was still relatively high after snow depth losses between 50 and 75 cm occurred, the highest losses induced a drop in EC of about 50 µS cm−1. With respect to the same snow depth losses, median stream water δ18O reached −13.8 ‰ and ranged between −14.1‰ and −14.3 ‰. However, due to higher variability in δ18O, the effect of snowmelt on the isotopic composition was less clear than the dilution effect on EC.
3.4 Temporal variability at the catchment outlet
The temporal variability in the hydrochemical variables observed at the catchment outlet and of the meteorological drivers is illustrated in Fig. 8. Controlled by increasing radiation inputs and air temperatures above about 5 ∘C in early summer (Figs. 6, 7, and 8a and b), first snowmelt-induced runoff peaks in the Sulden River were characterized by EC of about 200 µS cm−1 and a depleted isotopic signature of about −14.6 ‰ in δ18O. These runoff peaks reached about 20 m3 s−1, starting from a winter baseflow of about 1.8 m3 s−1 (Fig. 8c and e). In comparison, the average snowmelt EC was 28 µS cm−1 and −14.84 ‰ in δ18O. Later in the summer, runoff peaks induced by glacier melt reached about 13–18 m3 s−1, characterized by relatively low EC (about 235 µS cm−1) and isotopically more enriched stream water (δ18O: about −13.3 ‰). In fact, glacier melt showed an average EC of 36.1 µS cm−1 and average of 13.51 ‰ in δ18O. The highest discharge measured during the analyzed period (81 m3 s−1 on 13 August 2014) was caused by a storm event, characterized by about 31 mm of precipitation falling over 3 h at AWS Madritsch. Unfortunately, isotopic data for this event were not available due to a technical problem with the automatic sampler.
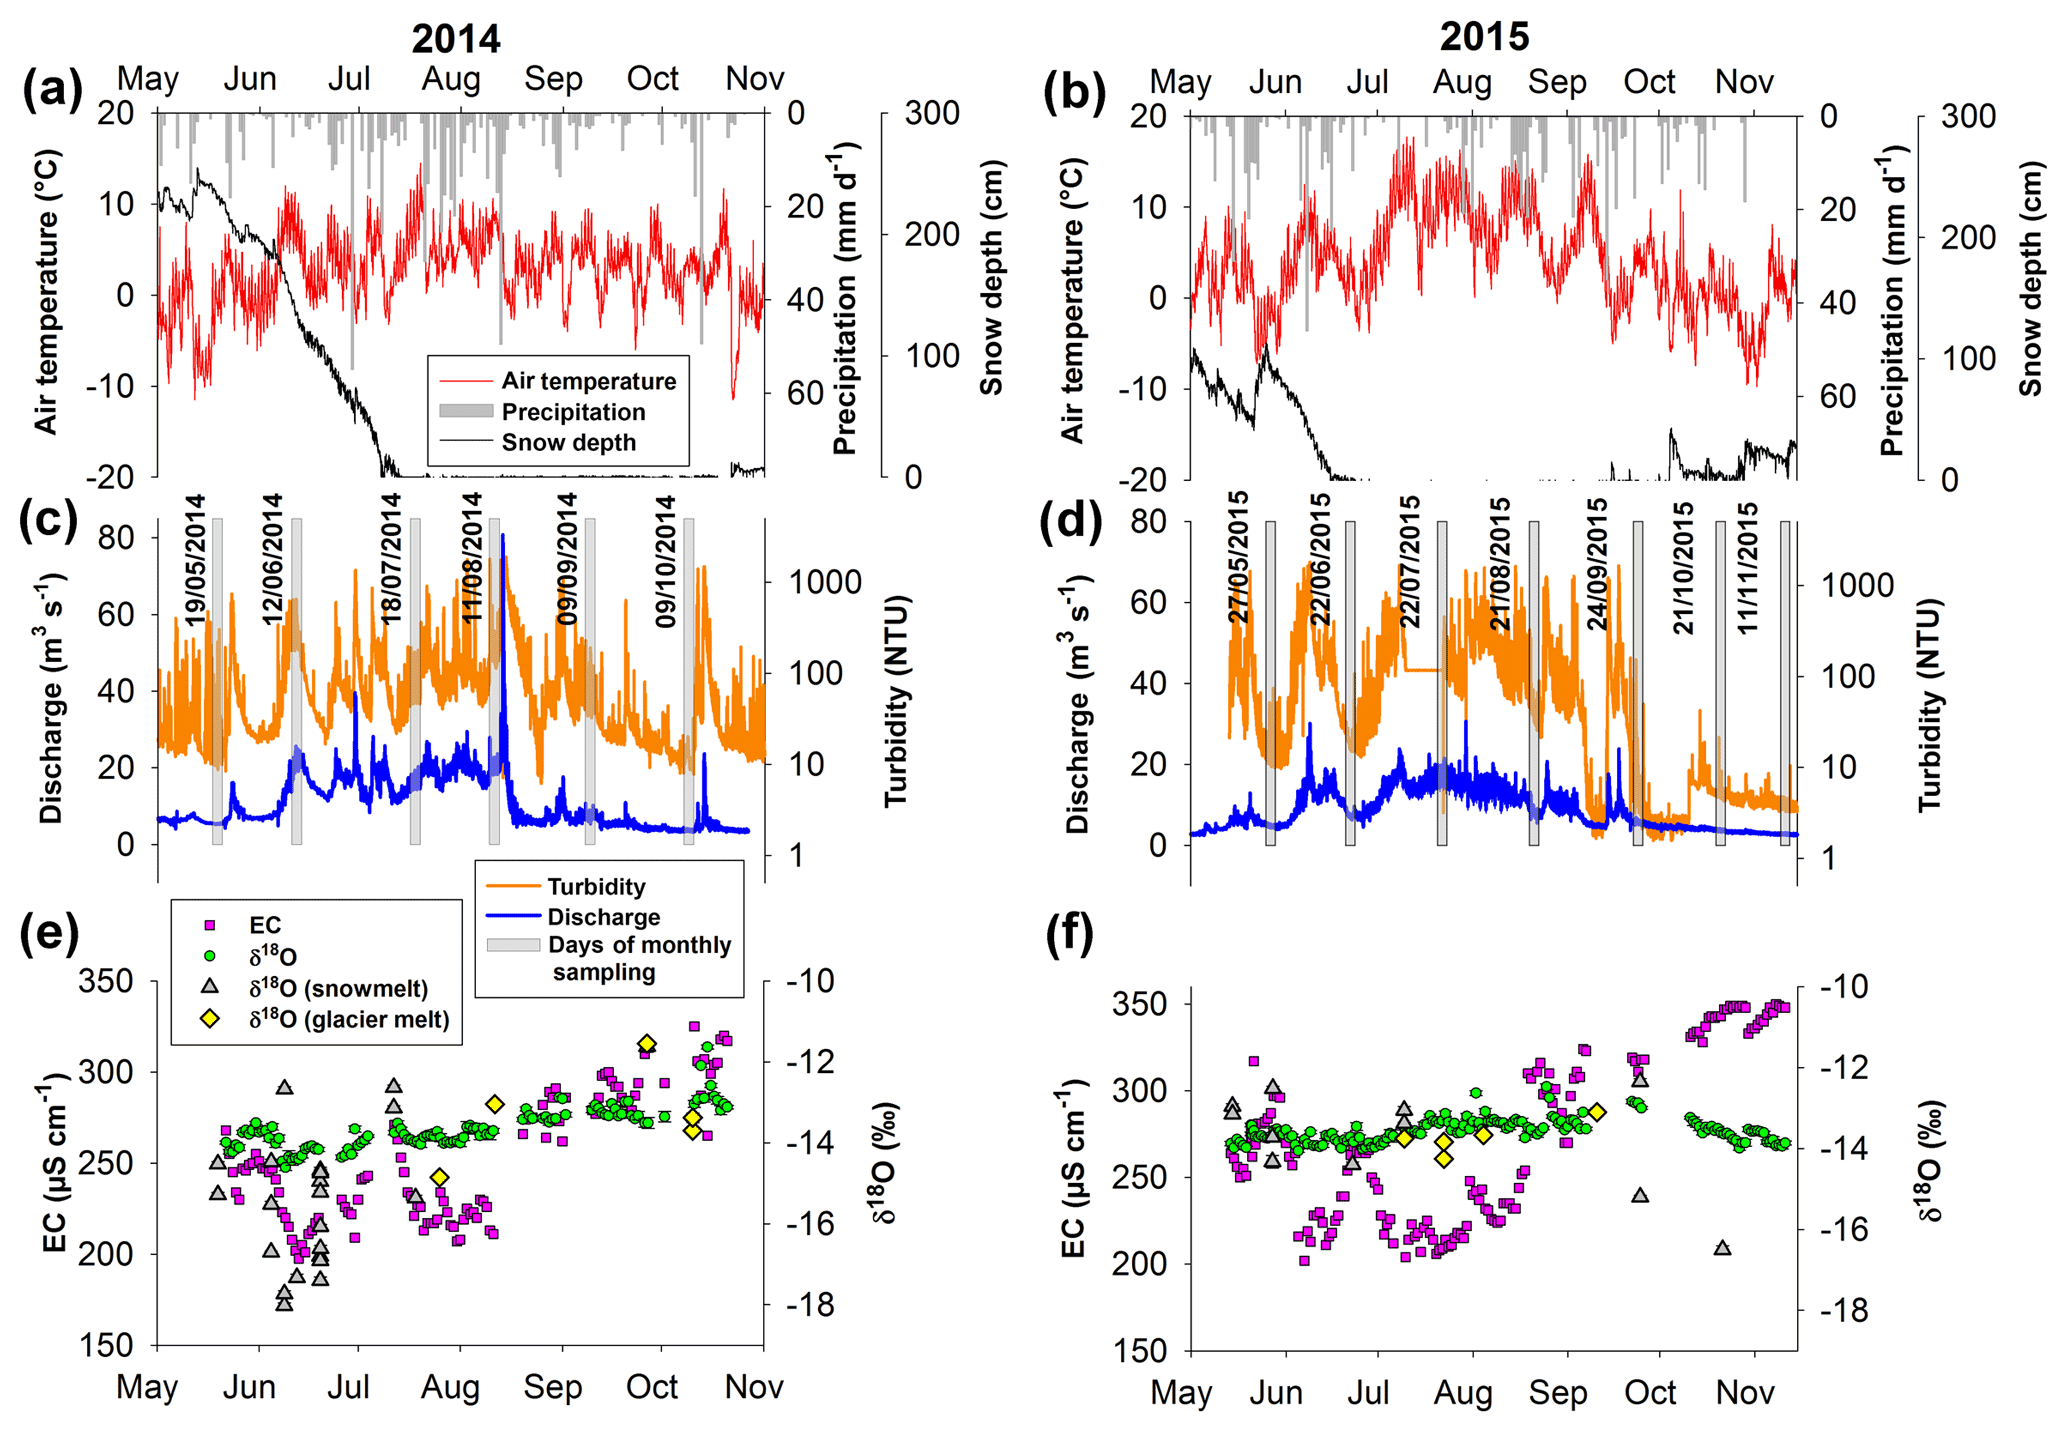
Figure 8Time series from 2014 and 2015 of (a, b) precipitation, hourly air temperature and snow depth at the AWS Madritsch; (c, d) streamflow and turbidity; and (e, f) electrical conductivity and δ18O of the stream at the outlet Stilfserbrücke and of snowmelt and glacier meltwater. Grey shaded bars indicate the date of monthly sampling carried out in the entire catchment.
Water turbidity was highly variable at the outlet and mirrored the discharge fluctuations induced by meltwater or storm events. Winter low flows were characterized by very low turbidity (<10 NTU, corresponding to less than 6 mg L−1). In summer, turbidity ranged between 20 and up to 1200 NTU during cold spells and melt events combined with storms, respectively. However, the maximum value recorded was 1904 NTU and was reached after several storm events of different precipitation amounts (17, 50 and 9 mm) on 12, 13 and 14 August 2014, respectively. Unfortunately, the turbidimeter did not work properly after the August 2014 flood peak, in mid-July 2015 and at the beginning of October 2015.
Furthermore, the interannual variability in meteorological conditions with respect to the occurrence of days exceeding the 6.5 or 15 ∘C threshold of daily maximum air temperature, storm events and snow cover characterized the contrasting years 2014 and 2015. (Fig. 8 and Table 1). While about 250 cm of maximal snowpack depth in 2014 lasted until mid-July, only about 100 cm were measured 1 year afterwards, with complete disappearance of snow 1 month earlier. In 2015, several periods of remarkable warm days occurred, reaching more than 15 ∘C at 2825 m a.s.l. and leading to a catchment entirely under melting conditions (freezing level above 5000 m a.s.l., assuming the mean atmospheric lapse rate of 6.5 ∘C km−1; Kaser et al., 2010). In contrast, days with a daily maximum air temperature higher than 6.5 ∘C (freezing level at the highest peak in the study area) and 15 ∘C (about 8.1 ∘C at the highest peak) in 2014 were fewer than days with similar conditions in 2015 or did not occur at all, respectively. Intense storms of up to 50 mm d−1 were registered three times in 2014 and only once in 2015. Despite a relatively similar hydrograph with same discharge magnitudes during melt-induced runoff events in both years, EC and δ18O clearly characterized snowmelt and runoff events induced by glacier melt in 2014. However, a characteristic period of a depleted or enriched isotopic signature was lacking in 2015, so snowmelt and runoff events induced by glacier melt were graphically more difficult to distinguish.
The daily variations in air temperature, discharge, turbidity and EC showed marked differences in the peak timing. Daily maximum air temperature generally occurred between 12:00 and 15:00, resulting in discharge peaks at about 22:00 to 01:00 in early summer and at about 16:00 to 19:00 during late summer. Turbidity peaks were measured at 22:00 to 23:00 in May to June and distinctively earlier at 16:00 to 19:00 in July and August. In contrast, the EC maximum occurred shortly after the discharge peak between 00:00 to 01:00 in early summer and at 11:00 to 15:00, clearly anticipating the discharge peaks.
It is interesting to highlight complex hydrochemical dynamics during the baseflow period in November 2015, which were interrupted only by a precipitation event on 28 and 29 October 2015. This event was characterized by more liquid (12.9 mm) than solid precipitation (6.6 mm) falling on a snowpack of about 10 cm (at 2825 m a.s.l.). While stream discharge showed a typical receding hydrograph confirmed by EC being close to the background value of about 350 µS cm−1, δ18O indicated a gradual isotopic depletion, indicating the occurrence of isotopically depleted water (e.g., snowmelt) in the stream. Also turbidity slightly increased from 4.1 to 8.3 NTU during both days.
To better characterize the temporal dynamics of hydrochemical variables, Fig. 9 shows the different relationships of discharge, EC, δ18O and turbidity grouped for different months. In general, high turbidity was linearly correlated with discharge and showed a monthly trend (Fig. 9a). This behavior can be explained by generally higher discharges during melting periods (June, July and August) and lower ones during baseflow conditions. Discharge and EC exhibited a relationship characterized by a hysteretic pattern at the monthly scale (Fig. 9b), which was associated with the monthly increasing contribution of meltwater with lower EC during melting periods contrasting with dominant groundwater contributions and higher EC during baseflow conditions.
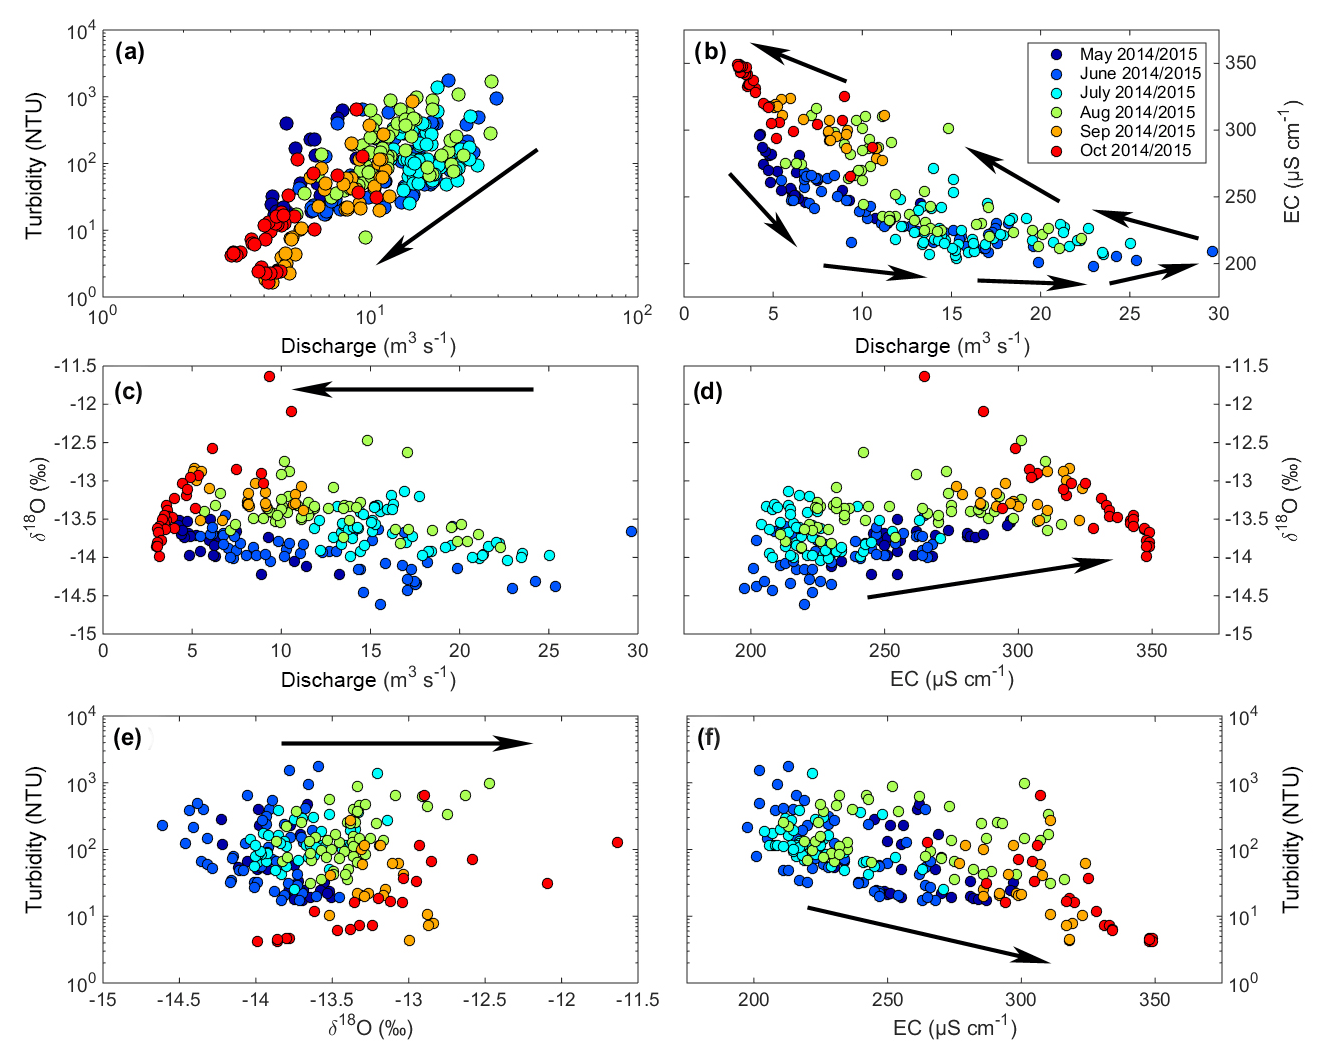
Figure 9Monthly relationships between (a–e) discharge, turbidity and tracers such as EC and δ18O at the outlet Stilfserbrücke in 2014 and 2015. The dataset consists of n=309 samples. Arrows underline the monthly pattern.
During these periods, the δ18O of stream water was mainly controlled by the dominant runoff components (i.e., snowmelt and glacier melt in early summer and mid-summer to late summer, respectively) rather than the amount of discharge (Fig. 9c). Similarly, the relationship between δ18O and EC was driven by the discharge variability resulting in a specific range of EC values for each month and by the meltwater component generally dominant during that period (Fig. 9d). As δ18O was dependent more on the dominant runoff components and less on the amount of discharge, turbidity showed no clear relationship with the isotopic composition (Fig. 9e). In contrast, EC and turbidity were controlled by monthly discharge variations so that both variables followed the monthly trend, revealing a linear relationship (Fig. 9f).
Finally, we evaluated the hysteretic pattern of discharge and EC in more detail by comparing it against Tmax, Gmax and the snow presence (Fig. 10). While Tmax at high elevation ranged between 0 and 5 ∘C and Gmax already exceeded 1000 W m−2 during early summer, increasing discharge with decreasing EC was observed at the outlet. This pattern progressed further as more snowmelt was available due to Tmax increasing from 5 to 10 ∘C and having a high Gmax value. Interestingly, the highest discharges with the lowest EC occurred during days with Gmax>1300 W m−2 but not during the warmest days, when snow cover at high elevation was scattered. Thus, runoff events during this period of time were clearly induced by snowmelt and glacier melt, also because only one storm event of P1d=12.2 mm was measured. In late summer and autumn, discharges started to fall while EC increased during snow-free days with decreasing Tmax but Gmax that is still high. As soon as Tmax was below 5 ∘C, discharges dropped below 10 m3 s−1 and EC rose above 250 µS cm−1, characterizing the initial phase of baseflow conditions in the Sulden River.
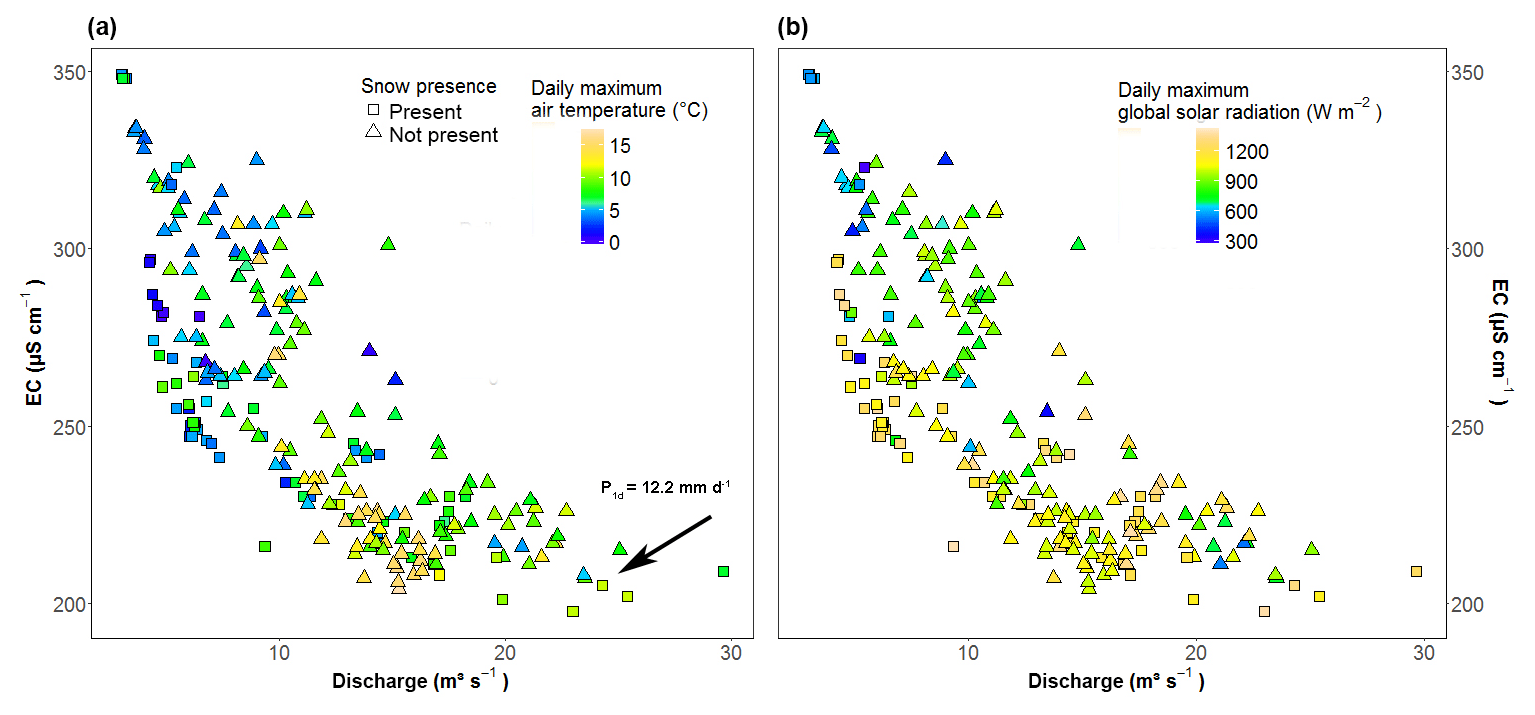
Figure 10Monthly relationships between discharge and electrical conductivity (EC) at the outlet Stilfserbrücke with respect to (a) daily maximum air temperature (1 d) and (b) daily maximum global solar radiation (1 d) compared to the snow presence measured at the AWS Madritsch in 2014 and 2015. Different symbols indicate the snow presence. Different symbols indicate the snow presence. Different symbols indicate the snow presence. The arrow indicates a storm event.
4.1 Geological controls on the stream hydrochemistry
Hydrochemical dynamics were driven by a pronounced release of heavy metals (such as Al, V, Cr, Ni, Zn, Cd and Pb) shown for the entire catchment and, in contrast, by a specific release of As and Sr in the upper and lower Sulden sub-catchment (Fig. 2). Yet, as the explained variance was only at about 53 %, further controls may be present. In this context, PC3 explained 11.8 % of additional variance and may characterize the hydrochemistry of surface and subsurface flows resulting from different residence times within the different soils and rocks.
With respect to PC1, several sources of heavy metals could be addressed: these elements may be released by rock weathering on freshly exposed mineral surfaces and sulfide oxidation, typically produced in metamorphic environments (Nordstrom, 2011). Proglacial stream hydrochemistry may also strongly depend on the seasonal evolution of the subglacial drainage system that contributes to the release of specific elements (Brown and Fuge, 1998). In this context, rock glacier thawing may play an important role for the release of Ni (Thies et al., 2007; Mair et al., 2011; Krainer et al., 2015) and Al and Mn (Thies et al., 2013). However, high Ni concentrations were not observed in this study. Moreover, high heavy metal concentrations were measured during the melting period in mid-summer, which would be generally too early to derive from permafrost thawing (Williams et al., 2006; Krainer et al., 2015). Also bedrock weathering as major origin probably needs to be excluded because low concentrations of heavy metals occurred in winter when the hydrological connectivity at higher elevations was still present (according to running stream water at the most upstream locations).
It is therefore more likely that heavy metals derive from meltwater itself, as the spatial and temporal dynamics indicated. The element release is strongly coupled with melting and infiltration processes, when hydrological connectivity within the catchment is expected to be highest during the snowmelt period. To support this explanation, supplementary element analysis of selected snowmelt (n=2) and glacier melt (n=2) samples of this study were conducted. Although these samples did not contain high concentrations of Cd, Ni and Pb (average concentration: 24.5, 10.2 and 9.6 µS cm−1, respectively), snowmelt in contact with the soil surface was more enriched in such elements (150, 191 and 15 µS cm−1, respectively) than dripping snowmelt. Moreover, in a previous study in the neighboring Matsch (Mazia) Valley in 2015, snowmelt and ice melt samples were strongly controlled by high Al, Co, Cd, Ni, Pb and Zn concentrations (Engel et al., 2017). As shown for 21 sites in the eastern Italian Alps (Veneto and Trentino–South Tyrol region), hydrochemistry of the snowpack can be largely affected by heavy metals originating from atmospheric deposition from traffic and industry (such as V, Sb, Zn, Cd, Mo and Pb; Gabrielli et al., 2006). Likely, orographically induced winds and turbulence arising in the Alpine valleys may often lead to transport and mixing of trace elements during winter. Studies from other regions, such as the western Siberian lowland and the Tibetan Plateau, agree on the anthropogenic origin of these metals (Shevchenko et al., 2016, and Guo et al., 2017, respectively).
In contrast, a clear geological source can be attributed to the origin of As and Sr, indicating bedrock-specific geochemical signatures. In the lower Sulden catchment (at locations S1, S2 and T1), As could mainly originate from As-containing bedrock. As-rich lenses are present in the cataclastic carbonatic rocks (realgar-bearing) and in the mineralized, arsenopyrite-bearing bands of quartz phyllites, mica schists and paragneisses of the crystalline basement. Different outcrops and several historical mining sites are known and described in the literature (Mair, 1996, Mair et al., 2002, 2009; Stingl and Mair, 2005). In the upper Sulden catchment, the presence of As is supported by the hydrochemistry of rock glacier outflows in the Zay sub-catchment (corresponding to the drainage area of ST2; Engel et al., 2018) but was not reported in other studies (Thies et al., 2007; Mair et al., 2011; Krainer et al., 2015; Thies et al., 2013). Also high-elevation spring waters in the Matsch Valley corroborated that As and Sr concentrations may originate from paragneisses and mica schists (Engel et al., 2017). However, the gradual decrease in As and Sr concentrations from rock glacier springs clearly disagrees with the observations from other studies that rock glacier thawing in late summer leads to increasing element releases (Williams et al., 2006; Thies et al., 2007; Krainer et al., 2015; Nickus et al., 2015). We suggest a controlling mechanism as follows: As and Sr originate from the quartz phyllite rocks, which form the bedrock of the rock glaciers (see Andreatta, 1952; Montrasio et al., 2012). Weathering and former subglacial abrasion facilitate this release (Brown, 2002). As- and Sr-rich waters may form during winter when few quantities of water percolate in bedrock faults and then are released due to meltwater infiltration during summer (Volkmar Mair, personal communication, 2018). As a clear delayed response of heavy metal concentrations in rock glacier outflow is revealed, the infiltration and outflow processes along flow paths in the bedrock near the rock glaciers may take up to 2 months to hydrochemically respond to snowmelt contamination (Hood and Hayashi, 2015).
As a consequence, a clear hydrochemical signature of permafrost thawing is difficult to find, and results may lack the transferability to other catchments, as not all rock glaciers contain specific elements to trace (Colombo et al., 2017). In this context, as precipitation and snowmelt affect the water budget of rock glaciers (Krainer and Mostler, 2002; Krainer et al., 2007), potential impacts of atmospheric inputs on rock glacier hydrochemistry can be assumed and deserve more attention in future (Colombo et al., 2017).
Furthermore, export of elements in fluvial systems is complex and may strongly be affected by the pH (Nickus et al., 2015) or interaction with solids in suspension (Brown et al., 1996), which could not be addressed in this study. Further insight on catchment processes might be gained, considering also element analysis of the solid fraction, to investigate whether water and suspended sediment share the same provenance.
4.2 The role of nivo-meteorological conditions
Superimposing the impact of the geological origin, melting processes were controlled by meteorological conditions, affecting stream hydrochemistry during summer, as shown by isotope dynamics (Figs. 4 and 8) and hydrochemical relationships (Fig. 9). It is well known that snowmelt is mainly driven by radiation and temperature. Generally, radiation is the main energy source driving melt processes in glacierized catchments of different climates (Sicart et al., 2008; Vincent and Six, 2013) and may integrate the effect of cloud coverage (Anslow et al., 2008). Moreover, a high correlation between snow or glacier melt and maximum air temperature exists (U.S. Army Corps of Engineers, 1956; Braithwaite, 1981), thus controlling daily meltwater contributions to streamflow (Mutzner et al., 2015; Engel et al., 2016). Tmax is widely used for characterizing snow transformation processes such as the decay of the snow albedo and snow metamorphism (e.g., Ragettli and Pellicciotti, 2012).
In this study, we show that a Tmax of about 5 ∘C and a Gmax of about 1000 W m−2 may represent important meteorological thresholds to trigger pronounced snow depth losses and thus snowmelt in the study area and other high-elevation catchments. In agreement with our findings, Ragettli and Pellicciotti (2012) used the same 5 ∘C threshold temperature for melt onset (as shown in Figs. 6a and 8).
Of course, further nivo-meteorological indicators such as the extent of snow cover (Singh et al., 2005), vapor pressure, net radiation and wind (Zuzel and Cox, 1975), or turbulent heat fluxes and longwave radiation (Sicart et al., 2006) may exist but were not included in the present study due to the lack of observations.
Moreover, with respect to spatial representativeness, Tmax and Gmax represent point-scale data from the only high-elevation AWS of this catchment, providing the nivo-meteorological indicators needed for this study. However, not only elevation controls snowmelt but also spatial variability in other factors such as aspect, slope and microtopography (e.g., Anderton et al., 2002; Grünewald et al., 2010; López-Moreno et al., 2013), which could not be addressed here. These site characteristics usually lead to different melt rates and thus affect the isotopic snowmelt signature (Taylor et al., 2001; Dietermann and Weiler, 2013) and the hydrometric response in the main channel such as the timing of the discharge peak (Lundquist and Dettinger, 2005).
The temporal sensitivity analysis and the relatively large variability related to snow depth losses (Figs. 6 and 7) are generally difficult to compare due to the lack of suitable studies. Moreover, we considered a ΔSD value of up to 5 cm as noisy data, but we did not discard data when strong winds occurred, likely resulting in pronounced blowing snow. In addition, decreasing snow depth may be the result of undergoing snow compaction, not related to the release of meltwater from the snowpack. Therefore, the use of snow depth losses as proxy for snowmelt has to be considered with care.
The contrasting variabilities of discharge, EC and δ18O, with respect to the observed timescale (Fig. 7), may also result from different flow paths and storage in the catchment, such as the snowpack itself as short-term storage for meltwater ranging from a few hours to a few days (Coléou and Lesaffre, 1998). Slower and quicker flow paths within glacial till, talus, moraines and shallow vs. deeper groundwater compartments could indicate intermediate and longer (14 d) meltwater response (Brown et al., 2006; Roy and Hayashi, 2009; McClymont et al., 2010; Fischer et al., 2015; Weiler et al., 2017).
4.3 Implications for streamflow and hydrochemistry dynamics
Tracer dynamics of EC and stable isotopes associated with monthly discharge variations generally followed the conceptual model of the seasonal evolution of streamflow contributions (for example, isotopic depletion and low EC during snowmelt period in June, less isotopic depletion and low EC during glacier melt period), as described for catchments with a glacierized area of 17 % (Penna et al., 2017a) and 30 % (Schmieder et al., 2017). However, isotopic dynamics were less pronounced compared to these studies, likely resulting from the impact of the relative meltwater contribution related to different catchment sizes, the proportion of the glacierized area (Baraer et al., 2015) or the sampling year.
In addition, the hydrometric and geochemical dynamics analyzed in this study were controlled by interplay of meteorological conditions, the heterogeneity of geology and topography. Such interplay is highlighted by EC dynamics further controlled by the contributing catchment area (i.e., EC gradients along the Sulden and Trafoi River; Wolock et al., 1997; Peralta-Tapia et al., 2015; Wu, 2018). As EC was highly correlated to Ca concentration (Spearman's rank correlation: 0.6, p<0.05; see Fig. 3), EC dynamics were determined by the spatial distribution of different geology. For example, as dolomitic rocks are present almost within the entire Trafoi sub-catchment, meltwater following the hydraulic gradient can likely become more enriched in solutes with longer flow pathways and increasing storage capability related to the catchment size (Fig. 5). As a consequence, the EC enrichment gradient could persist during both the melting period and baseflow conditions in the presence of homogenous geology. Therefore, topography may become a more important control on spatial stream water variability than the geological substratum. In the Sulden sub-catchment, however, dolomitic rocks are only present in the upper part of the catchment, while metamorphic rocks mostly prevail. This leads to a pronounced dilution during baseflow conditions of Ca-rich waters with increasing catchment area or, in other words, increasing distance from the source area (Fig. 5). This implies that meltwater contributions to the stream homogenize the effect of the geographic origin on different water sources, having the highest impact in the vicinity of the meltwater source (see Table 4).
The additional effect of topographical characteristics is underlined by the findings that the Sulden River hydrochemistry at S2 was significantly more depleted in δ2H and δ18O than T1 hydrochemistry. Compared with the Sulden sub-catchment, the Trafoi sub-catchment has a slightly higher proportion of glacier extent but, more importantly, has a clearly smaller catchment area within the elevation bands of 1800 to 3200 m a.s.l. (i.e., 40.2 km2 for the Trafoi and 66.5 km2 for the Sulden sub-catchment). In this elevation range, the sub-catchments of major tributaries ST1, ST2 and ST3 are situated, which deliver large snowmelt contributions to the Sulden River (Figs. 4 and 5).
Meteorological conditions, geology and topography explain specific hydrometric and hydrochemical relationships at the catchment outlet. For example, the hysteretic relationship between discharge and EC (Fig. 8b) corresponds well with the hysteresis observed in the nearby Saldur and Alta Val de la Mare catchment (Engel et al., 2016; Zuecco et al., 2016), although these studies focused on the runoff event scale. The initial phase of this hysteresis in early summer was clearly snowmelt-induced, with snowmelt likely originating from lower elevations as Tmax at high elevation was still relatively low (0–5 ∘C). The further development of the hysteresis is then linked to the progressing snowmelt contribution towards higher elevations. In contrast, the phase of hysteresis in late summer to early autumn is determined by glacier melt, and its decreasing contributions when there is low Tmax and Gmax indicate the lack of available energy for melting.
Moreover, this relationship helps to identify the conditions with maximum discharge and EC; during baseflow conditions, the Sulden River showed the highest EC of about 350 µS cm−1, seemingly bound to only about 3 m3 s−1, whereas the maximum dilution effect occurred during a storm on 29 June 2014 (55 mm of precipitation at AWS Madritsch) with 29.3 m3 s−1 of discharge, resulting in only 209 µS cm−1. However, these observations are based on daily data sampled at 23:00, likely not capturing the entire hydrochemical variability inherent in the Sulden catchment. As shown in Figs. 5 and 7, much higher discharges and thus even lower EC could be reached along the Sulden River and inversely, which was potentially limited by the specific geological setting of the study area.
As more extreme weather conditions (such as heat waves and less solid winter precipitation) are expected in future (Beniston, 2003; Viviroli et al., 2011; Beniston and Stoffel 2014), glacierized catchments may exhibit more pronounced hydrochemical responses such as shifted or broader ranges of hydrochemical relationships (Kumar et al., 2019) and increased heavy metal concentrations both during melting periods and baseflow conditions. However, identifying these relationships with changing meteorological conditions would deserve more attention and is strongly limited by our current understanding of underlying hydrological processes (Schaefli et al., 2007). In a changing cryosphere, more complex processes such as non-stationarity processes may emerge under changing climate, which was found to be a major cause of non-stationarity (Milly et al., 2008). In this context, explaining apparently ambiguous processes like the one we observed during the baseflow period in November 2015 (Fig. 8) will deserve further attention.
Finally, our results underline that long-term controls such as geology and topography govern hydrochemical spatial responses (such as bedrock-specific geochemical signatures, EC gradients and relative snowmelt contribution). In contrast, short-term controls such as daily maximum solar radiation, air temperature and snow depth differences drive short-term responses (such as discharge variability and EC dilution). Both statements are in general agreement with the findings of Heidbüchel et al. (2013). However, as the catchment response strongly depended on the melting period vs. baseflow conditions, controls at longer temporal scales interact as well. Thus, our findings suggest that glacierized catchments react in a much more complex way compared to non-glacierized catchments and that catchment responses cannot be attributed to one specific scale, justified by either short-term or long-term controls alone.
In this context, the present study provides novel insights into geological, meteorological and topographic controls of stream water hydrochemistry rarely addressed for glacierized catchments so far. Moreover, this study strongly capitalizes on an important dataset that combines nivo-meteorological indicators and different tracers (stable isotopes of water, EC, and major, minor and trace elements). This aspect finally underlines the need for conducting multi-tracer studies in glacierized catchments with different geological complexity in order to evaluate whether our findings (obtained in sedimentary and metamorphic substratum) are transferable to different geological settings.
4.4 Methodological limitation
The sampling approach combined a monthly spatial sampling with daily sampling at the outlet, which is in good agreement methodologically with other sampling approaches, accounting for increasing distance of sampling points to the glacier (Zhou et al., 2014; Baraer et al., 2015), intense spatial and temporal sampling (Penna et al., 2014; Fischer et al., 2015), synoptic sampling (Carey et al., 2013; Gordon et al., 2015), and different catchment structures such as nested catchments (Soulsby et al., 2006b). Sampling covered a variety of days with typical snowmelt, glacier melt and baseflow conditions during 2014 and 2015, confirming the representativeness of tracer dynamics within 2 years with contrasting meteorological characteristics (Table 1). However, short-term catchment responses (such as storm-induced peak flows and related changes in hydrochemistry) were difficult to capture by this sampling approach and would require a higher temporal sampling resolution. In this context, the representativeness of the outlet sampling time with respect to the peak discharge time at that location may also play an important role. In fact, the peak of hydrochemical response may not be synchronized with the hydrometric one and therefore may lead to stronger or weaker relationships.
Furthermore, 2 years of field data are probably not sufficient for capturing all hydrological dynamics, the hydrological catchment status and catchment responses to specific meteorological conditions. In this regard, long-term studies may have better chances of capturing the temporal variability in hydrochemical responses (Thies et al., 2007). Although time-,energy- and money-consuming, more complex and long sampling approaches should be developed to further unravel process understanding of glacierized catchments.
Our results highlight the complex hydrochemical responses of mountain glacierized catchments at different temporal and spatial scales controlled by meteorological conditions, topography and geological heterogeneity. To our knowledge, only few studies investigated the impact of controlling factors on stream water hydrochemistry by using nivo-meteorological indicators and multi-tracer data, which we recommend establishing as a prerequisite for studies in other glacierized catchments.
The main results of this study can be summarized as follows:
-
Hydrometric and geochemical dynamics were controlled by interplay of meteorological conditions and the geological heterogeneity. The majority of the variance (PC1: 36.3 %) was explained by heavy metal concentrations (such as Al, V, Cr, Ni, Zn, Cd and Pb), associated with atmospheric deposition on the snowpack and release through snowmelt. Remaining variance (PC2: 16.3 %) resulted both from the presence of a bedrock-specific geochemical signature (As and Sr concentrations) and the role of snowmelt contribution.
-
The isotopic composition of rock glacier outflow was relatively similar to the composition of glacier melt, whereas high concentrations of As and Sr may more likely result from bedrock weathering. Therefore, as the underlying geology may prevails over a thawing permafrost characteristics, a specific hydrochemical signature of rock glacier springs was difficult to obtain.
-
At the monthly scale, for different sub-catchments (spatial scale: 0.05–130 km2), both δ18O and EC revealed complex spatial and temporal dynamics such as contrasting EC gradients during baseflow conditions and melting periods.
-
For the entire study area (spatial scale: 130 km2), we observed strong relationships of hydrochemical variables, with mainly discharge and EC exhibiting a strong monthly relationship. This was characterized by a hysteretic-like pattern, determined by the highest EC and lowest discharge during baseflow conditions and maximum EC dilution due to highest discharge during a summer storm.
-
Daily maximum air temperature Tmax and daily maximum global solar radiation Gmax were the most important drivers of controlling snowmelt at high elevation (referring to 2825 m a.s.l. in this study). Tmax of about 5 ∘C and Gmax of about 1000 W m−2 may represent meteorological thresholds to trigger pronounced snow depth losses and thus snowmelt in the study area. However, the use of snow depth losses as proxy for snowmelt has to be considered with care due to uncertainties related to blowing snow or snow compaction without meltwater outflow.
Finally, this study may support future classifications of glacierized catchments according to their hydrochemical response under different catchment conditions or the prediction of appropriate end-member signatures for tracer-based hydrograph separation being valid at longer timescales.
Hydrometeorological data are available upon request at the Hydrographic Office of the Autonomous Province of Bozen-Bolzano. Tracer data used in this study are freely available by contacting the authors.
The supplement related to this article is available online at: https://doi.org/10.5194/hess-23-2041-2019-supplement.
ME, DP, GB and FC carried out water sampling; WT supported element analysis; GV measured and maintained instrumentation; ME and DP analyzed the data; and ME, DP, GB and FC wrote the paper.
The authors declare that they have no conflict of interest.
This research is part of the GLACIALRUN project and funded by the foundation of the Free University of Bozen-Bolzano and supported by the project “Parco Tecnologico – Tecnologie ambientali”.
The authors thank Andrea Rücker, Ana Lucia, Alex Boninsegna, Raffaele Foffa and Michiel Blok for their field assistance. Giulia Zuecco and Luisa Pianezzola are thanked for the isotopic analysis at TESAF at the University of Padua, and Christian Ceccon is thanked for the isotopic analysis in the laboratory of the Free University of Bozen-Bolzano. We also thank Giulio Voto at Eco-Research S.r.l. (Bolzano) for the element analysis. We appreciate the helpful support for the geological interpretation by Volkmar Mair. We acknowledge the project AQUASED, whose instrumentation infrastructure we could use. Furthermore, we thank the Hydrographic Office and the Department of Hydraulic Engineering of the Autonomous Province of Bozen-Bolzano for providing meteorological and hydrometric data. We acknowledge the Forestry Commission Office Prat, the National Park Stilfserjoch (Passo Stelvio), and the cable car Sulden GmbH for their logistical support and helpful advice. This work was supported by the Open Access Publishing Fund provided by the Free University of Bozen-Bolzano.
This paper was edited by Carlo De Michele and reviewed by three anonymous referees.
Anderton, S., White, S., and Alvera, B.: Micro-scale spatial variability and the timing of snow melt runoff in a high mountain catchment, J. Hydrol., 268, 158–176, https://doi.org/10.1016/S0022-1694(02)00179-8, 2002.
Andreatta, C.: Polymetamorphose und Tektonik in der Ortlergruppe, Neues Jb. Miner. Monat., 1, 13–28, 1952.
Anslow, F. S., Hostetler, S., Bidlake, W. R., and Clark, P. U.: Distributed energy balance modeling of South Cascade Glacier, Washington and assessment of model uncertainty, J. Geophys. Res., 113, F02019, https://doi.org/10.1029/2007JF000850, 2008.
Auer Jr., A. H.: The rain versus snow threshold temperatures, Weatherwise, 27, p. 67, 1974.
Baraer, M., McKenzie, J., Mark, B. G., Gordon, R., Bury, J., Condom, T., Gomez, J., Knox, S., and Fortner, S. K.: Contribution of groundwater to the outflow from ungauged glacierized catchments: a multi-site study in the tropical Cordillera Blanca, Peru, Hydrol. Process., 29, 2561–2581, https://doi.org/10.1002/hyp.10386, 2015.
Beniston, M.: Climatic change in mountain regions: a review of possible impacts, Clim. Change, 59, 5–31, https://doi.org/10.1023/A:1024458411589, 2003.
Beniston, M.: Mountain weather and climate: A general overview and a focus on climatic change in the Alps, Hydrobiologia, 562, 3–16, https://doi.org/10.1007/s10750-005-1802-0, 2006.
Beniston, M. and Stoffel, M.: Assessing the impacts of climatic change on mountain water resources, Sci. Total Environ., 493, 1129–1137, https://doi.org/10.1016/j.scitotenv.2013.11.122, 2014.
Boeckli, L., Brenning, A., Gruber, S., and Noetzli, J.: A statistical approach to modelling permafrost distribution in the European Alps or similar mountain ranges, The Cryosphere, 6, 125–140, https://doi.org/10.5194/tc-6-125-2012, 2012.
Braithwaite, R. J.: On glacier energy balance, ablation, and air temperature, J. Glaciol., 27, 381–391, 1981.
Brown, G. H.: Glacier meltwater hydrochemistry, Appl. Geochem., 17, 855–883, https://doi.org/10.1016/S0883-2927(01)00123-8, 2002.
Brown, G. H. and Fuge, R.: Trace element chemistry of glacial meltwaters in an Alpine headwater catchment, Hydrology, Water Resources and Ecology in Headwaters, Proceedings of the HeadWater'98 Conference held at Meran/Merano, Italy, April 1998, IAHS Publ. no. 248, 435–442, 1998.
Brown, G. H., Sharp, M., and Tranter, M.: Subglacial chemical erosion: seasonal variations in solute provenance, Haut Glacier d'Arolla, Switzerland, Ann. Glaciol., 22, 25–31, 1996.
Brown, L. E., Hannah, D. M., Milner, A. M., Soulsby, C., Hodson, A. J., and Brewer, M. J.: Water source dynamics in a glacierized alpine river basin (Taillon-Gabiétous, French Pyrénées), Water Resour. Res., 42, W08404, https://doi.org/10.1029/2005WR004268, 2006.
Carey, S. K., Boucher, J. L., and Duarte, C. M.: Inferring groundwater contributions and pathways to streamflow during snowmelt over multiple years in a discontinuous permafrost subarctic environment (Yukon, Canada), Hydrogeol. J., 21, 67–77, https://doi.org/10.1007/s10040-012-0920-9, 2013.
Carey, S. K. and Quinton, W. L.: Evaluating runoff generation during summer using hydrometric, stable isotope and hydrochemical methods in a discontinuous permafrost alpine catchment, Hydrol. Process., 19, 95–114, https://doi.org/10.1002/hyp.5764, 2005.
Carrillo, G., Troch, P. A., Sivapalan, M., Wagener, T., Harman, C., and Sawicz, K.: Catchment classification: hydrological analysis of catchment behavior through process-based modeling along a climate gradient, Hydrol. Earth Syst. Sci., 15, 3411–3430, https://doi.org/10.5194/hess-15-3411-2011, 2011.
Carturan, L., Zuecco, G., Seppi, R., Zanoner, T., Borga, M., Carton, A., and Dalla Fontana, G.: Catchment-Scale Permafrost Mapping using Spring Water Characteristics, Permafrost. Periglac., 27, 253–270, https://doi.org/10.1002/ppp.1875, 2016.
Chiogna, G., Majone, B., Cano Paoli, K., Diamantini, E., Stella, E., Mallucci, S., Lencioni, V., Zandonai, F., and Bellin, A.: A review of hydrological and chemical stressors in the adige catchment and its ecological status, Sci. Total Environ. 540, 429–443, https://doi.org/10.1016/j.scitotenv.2015.06.149, 2016.
Clark, I. D., Lauriol, B., Harwood, L., and Marschner, M.: Groundwater contributions to discharge in a permafrost setting, Big Fish River, N.W.T., Canada, Arct. Antarct. Alp. Res., 33, 62–69, 2001.
Coléou, C. and Lesaffre, B.: Irreducible water saturation in snow: experimental results in a cold laboratory, Ann. Glaciol., 26, 64–68, 1998.
Colombo, N., Salerno, F., Gruber, S., Freppaz, M., Williams, M., Fratianni, S., and Giardino, M.: Review: Impacts of permafrost degradation on inorganic chemistry of surface fresh water, Global Planet. Change, 162, 69–83, https://doi.org/10.1016/j.gloplacha.2017.11.017, 2017.
Cook, S. J. and Swift, D. A.: Subglacial basins: Their origin and importance in glacial systems and landscapes, Earth-Sci. Rev., 115, 332–372, https://doi.org/10.1016/j.earscirev.2012.09.009, 2012.
Cortés, G., Vargas, X., and McPhee, J.: Climatic sensitivity of streamflow timing in the extratropical western Andes Cordillera, J. Hydrol., 405, 93–109, https://doi.org/10.1016/j.jhydrol.2011.05.013, 2011.
Devito, K., Creed, I., Gan, T., Mendoza, C., Petrone, R., Silins, U., and Smerdon, B.: A framework for broad-scale classification of hydrologic response units on the Boreal Plain: Is topography the last thing to consider?, Hydrol. Process., 19, 1705–1714, https://doi.org/10.1002/hyp.5881, 2005.
Dietermann, N. and Weiler, M.: Spatial distribution of stable water isotopes in alpine snow cover, Hydrol. Earth Syst. Sci., 17, 2657–2668, https://doi.org/10.5194/hess-17-2657-2013, 2013.
Dye, D. G.: Variability and trends in the annual snow-cover cycle in Northern Hemisphere land areas, 1972–2000, Hydrol. Process., 16, 3065–3077, https://doi.org/10.1002/hyp.1089, 2002.
Engel, M., Penna, D., Bertoldi, G., Dell'Agnese, A., Soulsby, C., and Comiti, F.: Identifying run-off contributions during melt-induced runoff events in a glacierized Alpine catchment, Hydrol. Process., 30, 343–364, https://doi.org/10.1002/hyp.10577, 2016.
Engel, M., Penna, D., Tirler, W., and Comiti F.: Multi-Parameter-Analyse zur Charakterisierung von Landschaftsmerkmalen innerhalb eines experimentellen Messnetzes im Hochgebirge, in: Den Wandel Messen – Proceedings Tag der Hydrologie 2017, edited by: Casper, M., Gronz, O., Ley, R., and Schütz, T., Forum für Hydrologie und Wasserbewirtschaftung, 38, 293–299, 2017.
Engel, M., Brighenti S., Bruno, M. C., Tolotti, M., and Comiti, F.: Multi-tracer approach for characterizing rock glacier outflow, 5th European Conference on Permafrost, Chamonix-Mont Blanc, 23 June–1 July 2018.
Epstein, S. and Mayeda, T.: Variation of δ18O content in waters from natural sources, Geochim. Cosmochim. Ac., 4, 213–224, 1953.
European Union (Drinking Water) Regulations 2014 (S.I. 122 of 2014).
Farvolden, R. N., Geological controls on ground-water storage and base flow, J. Hydrol., 1, 219–249, 1963.
Fischer, B. M. C., Rinderer, M., Schneider, P., Ewen, T., and Seibert, J.: Contributing sources to baseflow in pre-alpine headwaters using spatial snapshot sampling, Hydrol. Process., 29, 5321–5336, https://doi.org/10.1002/hyp.10529, 2015.
Gabrielli, P., Cozzi, G., Torcini, S., Cescon, P., and Barbante, C.: Source and origin of atmospheric trace elements entrapped in winter snow of the Italian Eastern Alps, Atmos. Chem. Phys. Discuss., 6, 8781–8815, https://doi.org/10.5194/acpd-6-8781-2006, 2006
Galos, S. P., Klug, C., Prinz, R., Rieg, L., Sailer, R., Dinale, R., and Kaser, G.: Recent glacier changes and related contribution potential to river discharge in the Vinschgau/Val Venosta, Italian Alps, Geogr. Fis. Din. Quat., 38, 143–154, https://doi.org/10.4461/GFDQ.2015.38.13, 2015.
Genereux, D.: Quantifying uncertainty in tracer-based hydrograph separations, Water Resour. Res., 34, 915–919, 1998.
Gordon, R. P., Lautz, L. K., McKenzie, J. M., Mark, B. G., Chavez, D., and Baraer, M.: Sources and pathways of stream generation in tropical proglacial valleys of the Cordillera Blanca, Peru, J. Hydrol., 522, 628–644, https://doi.org/10.1016/j.jhydrol.2015.01.013, 2015.
Gruber, S., Fleiner, R., Guegan, E., Panday, P., Schmid, M.-O., Stumm, D., Wester, P., Zhang, Y., and Zhao, L.: Review article: Inferring permafrost and permafrost thaw in the mountains of the Hindu Kush Himalaya region, The Cryosphere, 11, 81–99, https://doi.org/10.5194/tc-11-81-2017, 2017.
Grünewald, T., Schirmer, M., Mott, R., and Lehning, M.: Spatial and temporal variability of snow depth and ablation rates in a small mountain catchment, The Cryosphere, 4, 215–225, https://doi.org/10.5194/tc-4-215-2010, 2010.
Guo, B., Liu, Y., Zhang, F., Hou, J., and Zhang, H.: Heavy metals in the surface sediments of lakes on the Tibetan Plateau, China, Environ. Sci. Pollut. R., 25, 3695–3707, https://doi.org/10.1007/s11356-017-0680-0, 2017.
Harris, C., Haeberli, W., Vonder Mühll, D., and King, L.: Permafrost monitoring in the high mountains of Europe: the PACE project in its global context, Permafrost Periglac., 12, 3–11, https://doi.org/10.1002/ppp.377, 2001.
Heidbüchel, I., Troch, P. A., and Lyon, S. W.: Separating physical and meteorological controls of variable transit times in zero-order catchments, Water Resour. Res., 49, 7644–7657, https://doi.org/10.1002/2012WR013149, 2013.
Hindshaw, R. S., Tipper, E. T., Reynolds, B. C., Lemarchand, E., Wiederhold, J. G., Magnusson, J., Bernasconi, S. M., Kretzschmar, R., and Bourdon, B.: Hydrological control of stream water chemistry in a glacial catchment (Damma Glacier, Switzerland), Chem. Geol., 285, 215–230, https://doi.org/10.1016/j.chemgeo.2011.04.012, 2011.
Hock, R.: A distributed temperature-index ice- and snowmelt model including potential direct solar radiation, J. Glaciol., 45, 101–11, 1999.
Hodgkins, R.: Seasonal evolution of meltwater generation, storage and discharge at a non-temperate glacier in Svalbard, Hydrol. Process., 15, 441–460, https://doi.org/10.1002/hyp.160, 2001.
Hood, J. L. and Hayashi, M.:. Characterization of snowmelt flux and groundwater storage in an alpine headwater basin, J. Hydrol., 521, 482–497, https://doi.org/10.1016/j.jhydrol.2014.12.041, 2015.
Humlum, O.: The geomorphic significance of rock glaciers: estimates of rock glacier debris volumes and headwall recession rates in West Greenland, Geomorphology, 35, 41–67, 2000.
Immerzeel, W. W., van Beek, L. P. H., Konz, M., Shrestha, A. B., and Bierkens, M. F. P.: Hydrological response to climate change in a glacierized catchment in the Himalayas, Clim. Change, 110, 721–736, 2012.
IPCC: Climate Change 2013: The Physical Science Basis. Contribution of Working Group I to the Fifth Assessment Report of the Intergovern-mental Panel on Climate Change, edited by: Stocker, T. F., Qin, D., Plattner, G.-K., Tignor, M., Allen, S.K., Boschung, J., Nauels, A., Xia, Y., Bex, V., and Midgley, P. M., Cambridge University Press, Cambridge, United Kingdom and New York, NY, USA, 1535 pp., 2013.
Kaser, G., Großhauser, M., and Marzeion, B.: Contribution potential of glaciers to water availability in different climate regimes, P. Natl. Acad. Sci. USA, 107, 20223–20227, https://doi.org/10.1073/pnas.1008162107, 2010.
Katsuyama, M., Tani, M., and Nishimoto S.: Connection between streamwater mean residence time and bedrock groundwater recharge/discharge dynamics in weathered granite catchments, Hydrol. Process., 24, 2287–2299, https://doi.org/10.1002/hyp.7741, 2010.
Kirchner, J. W.: Catchments as simple dynamical systems: Catchment characterization, rainfall-runoff modeling, and doing hydrology backward, Water Resour. Res., 45, W02429, https://doi.org/10.1029/2008WR006912, 2009.
Kong, Y. and Pang, Z.: Evaluating the sensitivity of glacier rivers to climate change based on hydrograph separation of discharge, J. Hydrol., 434–435, 121–129, https://doi.org/10.1016/j.jhydrol.2012.02.029, 2012.
Krainer, K. and Mostler, W.: Hydrology of active rock glaciers: examples from the Austrian Alps, Arct. Antarct. Alp. Res., 34, 142–149, 2002.
Krainer, K., Mostler, W., and Spötl, C.: Discharge from active rock glaciers, Austrian Alps: a stable isotope approach, Austrian J. Earth Sc., 100, 102–112, 2007.
Krainer, K., Bressan, D., Dietre, B., Haas, J. N., Hajdas, I., Lang, K., Mair, V., Nickus, U., Reidl, D., Thies, H., and Tonidandel, D.: A 10,300-year-old permafrost core from the active rock glacier Lazaun, southern Ötztal Alps (South Tyrol, northern Italy), Quaternary Res., 83, 324–335, https://doi.org/10.1016/j.yqres.2014.12.005, 2015.
Kumar, N., Ramanathan, A. L., Tranter, M., Sharma, P., Pandey, M., Ranjan, P., and Raju, N. J.: Switch in chemical weathering caused by the mass balance variability in a Himalayan glacierized basin: a case of Chhota Shigri Glacier, Hydrolog. Sci. J., 64, 179–189, 2019.
Lamhonwah, D., Lafrenière, M. J., Lamoureux, S. F., and Wolfe, B. B.: Evaluating the hydrological and hydrochemical responses of a High Arctic catchment during an exceptionally warm summer, Hydrol. Process., 31, 2296–2313, https://doi.org/10.1002/hyp.11191, 2017.
Lewis, T., Lafrenière, M. J., and Lamoureux, S. F.: Hydrochemical and sedimentary responses of paired High Arctic watersheds to unusual climate and permafrost disturbance, Cape Bounty, Melville Island, Canada, Hydrol. Process., 26, 2003–2018, https://doi.org/10.1002/hyp.8335, 2012.
Liu, F., Williams, M. W., and Caine, N.: Source waters and flow paths in an alpine catchment, Colorado Front Range, United States, Water Resour. Res., 40, W09401, https://doi.org/10.1029/2004WR003076, 2004.
López-Moreno, J. I., Fassnacht, S. R., Heath, J. T., Musselman, K. N., Revuelto, J., Latron, J., Morán-Tejeda, E., and Jonas, T.: Small scale spatial variability of snow density and depth over complex alpine terrain: Implications for estimating snow water equivalent, Adv. Water Resour., 55, 40–52, https://doi.org/10.1016/j.advwatres.2012.08.010, 2013.
Lundquist, J. D. and Dettinger, M. D.: How snowpack heterogeneity affects diurnal streamflow timing, Water Resour. Res., 41, W05007, https://doi.org/10.1029/2004WR003649, 2005.
Mair, V.: Die Kupferbergbaue von Stilfs, Eyrs und Klausen, Stoansucher, 10, 38–44, 1996.
Mair, V., Lorenz, D., and Eschgfäller, M.: Mineralienwelt Südtirol, Verlag Tappeiner, Lana, BZ, 215 pp., 2009.
Mair, V., Müller, J. P., and Reisigl, H.: Leben an der Grenze. Konsortium Nationalpark Stilfserjoch – Gemeinde Stilfs, Glurns, BZ, 120 pp., 2002.
Mair, V., Nocker, C., and Tropper, P.: Das Ortler-Campo Kristallin in Südtirol, Mitt. Österr. Mineral. Ges., 153, 219–240, 2007.
Mair, V., Zischg, A., Lang, K., Tonidandel, D., Krainer, K., Kellerer-Pirklbauer, A., Deline, P., Schoeneich, P., Cremonese, E., Pogliotti, P., Gruber, S., and Böckli, L.: PermaNET – Permafrost Long-term Monitoring Network. Synthesis report, INTERPRAEVENT Journal series 1, Report 3, Klagenfurt, Austria, 2011.
Maurya, A. S., Shah, M., Deshpande, R. D., Bhardwaj, R. M., Prasad, A., and Gupta, S. K.: Hydrograph separation and precipitation source identification using stable water isotopes and conductivity: River Ganga at Himalayan foothills, Hydrol. Process., 25, 1521–1530, https://doi.org/10.1002/hyp.7912, 2011.
McClymont, A. F., Hayashi, M., Bentley, L. R., Muir, D., and Ernst, E.: Groundwater flow and storage within an alpine meadow-talus complex, Hydrol. Earth Syst. Sci., 14, 859–872, https://doi.org/10.5194/hess-14-859-2010, 2010.
McGuire, K. J., McDonnell, J. J., Weiler, M., Kendall, C., McGlynn, B. L., Welker, J. M., and Seibert, J.: The role of topography on catchment-scale water residence time, Water Resour. Res., 41, W05002, https://doi.org/10.1029/2004WR003657, 2005.
Milly, P. C. D., Betancourt, J., Falkenmark, M., Hirsch, R. M., Kundzewicz, Z. W., Lettenmaier, D. P., and Stouffer, R. J.: Stationarity is dead: whither water management?, Science, 319, 573–574, https://doi.org/10.1126/science.1151915, 2008.
Milner, A., Brown, L. E., and Hannah, D. M.: Hydroecological response of river systems to shrinking glaciers, Hydrol. Process., 23, 62–77, https://doi.org/10.1002/hyp.7197, 2009.
Montrasio, A. Berra, F., Cariboni, M., Ceriani, M., Deichmann, N., Ferliga, C., Gregnanin, A., Guerra, S., Guglielmin, M., Jadoul, F., Lonhghin, M., Mair, V., Mazzoccola, D., Sciesa, E., and Zappone, A.: Note illustrative della Carta geologica d'Italia alla scala 1 : 50.000, Foglio 024 Bormio, ISPRA, Servizio Geologico D'Italia; System Cart, Roma, 150 pp., 2012.
Moore, R. D., Fleming, S. W., Menounos, B., Wheate, R., Fountain, A., Stahl, K., Holm, K., and Jakob, M.: Glacier change in western North America: influences on hydrology, geomorphic hazards and water quality, Hydrol. Process., 23, 42–61, https://doi.org/10.1002/hyp.7162, 2009.
Mutzner, R., Weijs, S. V., Tarolli, P., Calaf, M., Oldroyd, J., and Parlange, M. B.: Controls on the diurnal streamflow cycles in two subbasins of an alpine headwater catchment, Water Resour. Res., 51, 3403–3418, https://doi.org/10.1002/2014WR016581, 2015.
Natali, C., Bianchini, G., Marchina, C., and Knöller, K.: Geochemistry of the Adige River water from the Eastern Alps to the Adriatic sea (Italy): Evidences for distinct hydrological components and water-rock interactions, Environ. Sci. Pollut. R., 23, 11677–11694, https://doi.org/10.1007/s11356-016-6356-3, 2016.
Nickus, U., Krainer, K., Thies, H., and Tolotti, M.: Blockgletscherabflüsse am Äußeren Hochebenkar – Hydrologie, Wasserchemie und Kieselalgen, in: Forschung am Blockgletscher, Methoden und Ergebnisse, edited by: Schallart, N. and Erschbamer, B, Alpine Forschungstelle Obergurgl, Innsbruck University Press, Innsbruck, Austria, Band 4, 117–134, ISBN 978-3-902936-58-5, 2015.
Nordstrom, D. K.: Hydrogeochemical processes governing the origin, transport and fate of major and trace elements from mine wastes and mineralized rock to surface waters, Appl. Geochem., 26, 1777–1791, 2011.
Onda, Y., Komatsu, Y., Tsujimura, M., and Fujihara, J. I.: The role of subsurface runoff through bedrock on storm flow generation, Hydrol. Processes, 15, 1693–1706, https://doi.org/10.1002/hyp.234, 2001.
Penna, D., Stenni, B., Šanda, M., Wrede, S., Bogaard, T. A., Gobbi, A., Borga, M., Fischer, B. M. C., Bonazza, M., and Chárová, Z.: On the reproducibility and repeatability of laser absorption spectroscopy measurements for δ2H and δ18O isotopic analysis, Hydrol. Earth Syst. Sci., 14, 1551–1566, https://doi.org/10.5194/hess-14-1551-2010, 2010.
Penna, D., Stenni, B., Šanda, M., Wrede, S., Bogaard, T. A., Michelini, M., Fischer, B. M. C., Gobbi, A., Mantese, N., Zuecco, G., Borga, M., Bonazza, M., Sobotková, M., Čejková, B., and Wassenaar, L. I.: Technical Note: Evaluation of between-sample memory effects in the analysis of δ2H and δ18O of water samples measured by laser spectroscopes, Hydrol. Earth Syst. Sci., 16, 3925–3933, https://doi.org/10.5194/hess-16-3925-2012, 2012.
Penna, D., Engel, M., Mao, L., Dell'Agnese, A., Bertoldi, G., and Comiti, F.: Tracer-based analysis of spatial and temporal variations of water sources in a glacierized catchment, Hydrol. Earth Syst. Sci., 18, 5271–5288, https://doi.org/10.5194/hess-18-5271-2014, 2014.
Penna, D., van Meerveld, H. J., Zuecco, G., Dalla Fontana, G., and Borga, M.: Hydrological response of an Alpine catchment to rainfall and snowmelt events, J. Hydrol., 537, 382–397, https://doi.org/10.1016/j.jhydrol.2016.03.040, 2016.
Penna, D., Engel, M., Bertoldi, G., and Comiti, F.: Towards a tracer-based conceptualization of meltwater dynamics and streamflow response in a glacierized catchment, Hydrol. Earth Syst. Sci., 21, 23–41, https://doi.org/10.5194/hess-21-23-2017, 2017a.
Penna, D., Zuecco, G., Crema, S., Trevisani, S., Cavalli, M., Pianezzola, L., Marchi, L., and Borga, M.: Response time and water origin in a steep nested catchment in the Italian Dolomites: Response time and water origin in a nested catchment, Hydrol. Process., 31, 768–782, https://doi.org/10.1002/hyp.11050, 2017b.
Peralta-Tapia, A., Sponseller, R. A., Ågren, A., Tetzlaff, D., Soulsby, C., and Laudon, H.: Scale-dependent groundwater contributions influence patterns of winter baseflow stream chemistry in boreal catchments, J. Geophys. Res.-Biogeo., 120, 847–858, https://doi.org/10.1002/2014JG002878, 2015.
Ragettli, S. and Pellicciotti, F.: Calibration of a physically based, spatially distributed hydrological model in a glacierized basin: On the use of knowledge from glaciometeorological processes to constrain model parameters, Water Resour. Res., 48, W03509, https://doi.org/10.1029/2011WR010559, 2012.
Ragettli, S., Immerzeel, W. W., and Pellicciotti, F.: Contrasting climate change impact on river flows from high-altitude catchments in the Himalayan and Andes Mountains, P. Natl. Acad. Sci. USA, 113, 9222–9227, https://doi.org/10.1073/pnas.1606526113, 2016.
R Core Team: R: A Language and Environment for Statistical Computing, R Foundation for Statistical Computing, Vienna, Austria, 2016.
Rinaldo, A., Benettin, P., Harman, C. J., Hrachowitz, M., Mcguire, K. J., van der Velde, Y., Bertuzzo, E., and Botter, G.: Storage selection functions: A coherent framework for quantifying how catchments store and release water and solutes, Water Resour. Res., 51, 4840–4847, https://doi.org/10.1002/2015WR017273, 2015.
Rogger, M., Chirico, G. B., Hausmann, H., Krainer, K., Brückl, E., Stadler, P., and Blöschl, G.: Impact of mountain permafrost on flow path and runoff response in a high alpine catchment, Water Resour. Res., 53, 1288–1308, 2017.
Roy, J. W. and Hayashi, M.: Multiple, distinct groundwater flow systems of a single moraine–talus feature in an alpine watershed, J. Hydrol., 373, 139–150, https://doi.org/10.1016/j.jhydrol.2009.04.018, 2009.
Rutter, N., Hodson, A., Irvine-Fynn, T., and Solås, M. K.: Hydrology and hydrochemistry of a deglaciating high-Arctic catchment, Svalbard, J. Hydrol., 410, 39–50, https://doi.org/10.1016/j.jhydrol.2011.09.001, 2011.
Schaefli, B., Maraun, D., and Holschneider, M.: What drives high flow events in the Swiss Alps? Recent developments in wavelet spectral analysis and their application to hydrology, Adv. Water Resour., 30, 2511–2525, https://doi.org/10.1016/j.advwatres.2007.06.004, 2007.
Schmieder, J., Marke, T., and Strasser, U.: Tracerhydrologische Untersuchungen im Rofental (Ötztaler Alpen/Österreich), Innsbrucker Jahresbericht, Institut für Geographie der Universität Innsbruck, Innsbruck, 109–120, 2017.
Schwarb, M.: The Alpine Precipitation Climate, Swiss Federal Institut of Technology, Zurich, 2000.
Shevchenko, V. P., Pokrovsky, O. S., Vorobyev, S. N., Krickov, I. V., Manasypov, R. M., Politova, N. V., Kopysov, S. G., Dara, O. M., Auda, Y., Shirokova, L. S., Kolesnichenko, L. G., Zemtsov, V. A., and Kirpotin, S. N.: Impact of snow deposition on major and trace element concentrations and elementary fluxes in surface waters of the Western Siberian Lowland across a 1700 km latitudinal gradient, Hydrol. Earth Syst. Sci., 21, 5725–5746, https://doi.org/10.5194/hess-21-5725-2017, 2017.
Sicart, J. E., Pomeroy, J. W., Essery, R. L. H., and Bewley, D.: Incoming longwave radiation to melting snow: Observations, sensitivity and estimation in northern environments, Hydrol. Process., 20, 3697–3708, https://doi.org/10.1002/hyp.6383, 2006.
Sicart, J. E., Hock, R., and Six, D.: Glacier melt, air temperature, and energy balance in different climates: The Bolivian Tropics, the French Alps, and northern Sweden, J. Geophys. Res., 113, D24113, https://doi.org/10.1029/2008JD010406, 2008.
Singh, P., Haritashya, U. K., Ramasastri, K. S., and Kumar, N.: Diurnal variations in discharge and suspended sediment concentration, including runoff-delaying characteristics, of the Gangotri Glacier in the Garhwal Himalayas, Hydrol. Process., 19, 1445–1457, https://doi.org/10.1002/hyp.5583, 2005.
Sivapalan, M.: Prediction in ungauged basins: a grand challenge for theoretical hydrology, Hydrol. Process. 17, 3163–3170, https://doi.org/10.1002/hyp.5155, 2003
Sklash, M. G., Farvolden, R. N., and Fritz, P.: A conceptual model of watershed response to rainfall, developed through the use of oxygen-18 as a natural tracer, Can. J. Earth Sci., 13, 271–283, 1976.
Smiraglia, C.: GLIMS Glacier Database, National Snow and Ice Data Center, Boulder, CO, https://doi.org/10.7265/N5V98602, 2015.
Soulsby, C., Tetzlaff, D., Dunn, S. M., and Waldron, S.: Scaling up and out in runoff process understanding: Insights from nested experimental catchment studies, Hydrol. Process., 20, 2461–2465, https://doi.org/10.1002/hyp.6338, 2006a.
Soulsby, C., Tetzlaff, D., Rodgers, P., Dunn, S., and Waldron, S.: Runoff processes, stream water residence times and controlling landscape characteristics in a mesoscale catchment: An initial evaluation, J. Hydrol., 325, 197–221, https://doi.org/10.1016/j.jhydrol.2005.10.024, 2006b.
Sprenger, M., Leistert, H., Gimbel, K., and Weiler, M.: Illuminating hydrological processes at the soil-vegetation-atmosphere interface with water stable isotopes, Rev. Geophys., 54, 674–704, https://doi.org/10.1002/2015RG000515, 2016.
Staudinger, M., Stoelzle, M., Seeger, S., Seibert, J., Weiler, M., and Stahl K.: Catchment water storage variation with elevation, Hydrol. Process., 31, 2000–2015, https://doi.org/10.1002/hyp.11158, 2017.
Stingl, V. and Mair, V.: An introduction to the geology of South Tirol, Autonome Provinz Bozen, Amt für Geologie und Baustoffprüfung, Kardaun, BZ, 80 pp., 2005.
Swift, D. A., Nienow, P. W., Hoey, T. B., and Mair, D. W. F.: Seasonal evolution of runoff from Haut Glacier d'Arolla, Switzerland and implications for glacial geomorphic processes, J. Hydrol., 309, 133–148, https://doi.org/10.1016/j.jhydrol.2004.11.016, 2005.
Taylor, S., Feng, X., Kirchner, J. W., Osterhuber, R., Klaue, B., and Renshaw, C.E.: Isotopic evolution of a seasonal snowpack and its melt, Water Resour. Res., 37, 759–769, https://doi.org/10.1029/2000WR900341, 2001.
Tetzlaff, D., Seibert, J., McGuire, K. J., Laudon, H., Burns, D. A., Dunn, S. M., and Soulsby, C.: How does landscape structure influence catchment transit time across different geomorphic provinces, Hydrol. Process., 23, 945–953, 2009.
Tetzlaff, D., Buttle, J., Carey, S. K., McGuire, K., Laudon, H., and Soulsby, C.: Tracer-based assessment of flow paths, storage and runoff generation in northern catchments: a review, Hydrol. Process., 29, 3475–3490, https://doi.org/10.1002/hyp.10412, 2014.
Thies, H., Nickus, U., Mair, V., Tessadri, R., Tait, D., Thaler, B., and Psenner, R.: Unexpected response of high Alpine Lake waters to climate warming, Environ. Sci. Technol., 41, 7424–7429, 2007.
Thies, H., Nickus, U., Tolotti, M., Tessadri, R., and Krainer, K.: Evidence of rock glacier melt impacts on water chemistry and diatoms in high mountain streams, Cold Reg. Sci. Technol., 96, 77–85, https://doi.org/10.1016/j.coldregions.2013.06.006, 2013.
Uhlenbrook, S. and Hoeg, S.: Quantifying uncertainties in tracer-based hydrograph separations?: a case study for two- , three- and five-component hydrograph separations in a mountainous catchment, Hydrol. Process., 17, 431–453, https://doi.org/10.1002/hyp.1134, 2003.
U.S. Army Corps of Engineers: Summary Report of the Snow Investigations, Snow Hydrology, North Pacific Division, Portland, Oregon, 1956.
Vaughn, B. H. and Fountain, A. G.: Stable isotopes and electrical conductivity as keys to understanding water pathways and storage in South Cascade Glacier, Washington, USA, Ann. Glaciol., 40, 107–112, https://doi.org/10.3189/172756405781813834, 2005.
Vincent, C. and Six, D.: Relative contribution of solar radiation and temperature in enhanced temperature-index melt models from a case study at Glacier de Saint-Sorlin, France, Ann. Glaciol., 54, 11–17, https://doi.org/10.3189/2013AoG63A301, 2013.
Viviroli, D., Archer, D. R., Buytaert, W., Fowler, H. J., Greenwood, G. B., Hamlet, A. F., Huang, Y., Koboltschnig, G., Litaor, M. I., López-Moreno, J. I., Lorentz, S., Schädler, B., Schreier, H., Schwaiger, K., Vuille, M., and Woods, R.: Climate change and mountain water resources: overview and recommendations for research, management and policy, Hydrol. Earth Syst. Sci., 15, 471–504, https://doi.org/10.5194/hess-15-471-2011, 2011.
von Freyberg, J., Studer, B., and Kirchner, J. W.: A lab in the field: high-frequency analysis of water quality and stable isotopes in stream water and precipitation, Hydrol. Earth Syst. Sci., 21, 1721–1739, https://doi.org/10.5194/hess-21-1721-2017, 2017.
Weiler, M., Seibert, J., and Stahl, K.: Magic components – why quantifying rain, snow- and icemelt in river discharge is not easy, Hydrol. Process., 32, 160–166, https://doi.org/10.1002/hyp.11361, 2017.
Williams, M. W., Knauf, M., Caine, N., Liu, F., and Verplanck, P. L.: Geochemistry and source waters of rock glacier outflow, Colorado Front Range, Permafrost Periglac., 17, 13–33, https://doi.org/10.1002/ppp.535, 2006.
Williams, M. W., Hood, E., Molotch, N. P., Caine, N., Cowie, R., and Liu, F.: The `teflon basin' myth: hydrology and hydrochemistry of a seasonally snow-covered catchment, Plant Ecol. Divers., 8, 639–661, https://doi.org/10.1080/17550874.2015.1123318, 2015.
Wolfe, P. M. and English, M. C.: Hydrometeorological relationships in a glacierized catchment in the Canadian high Arctic, Hydrol. Process., 9, 911–921, https://doi.org/10.1002/hyp.3360090807, 1995.
Wolock, D. M., Fan, J., and Lawrence, G. B.: Effects of basin size on low-flow stream chemistry and subsurface contact time in the Neversink River watershed, New York, Hydrol. Process., 11, 1273–1286, 1997.
Wu, X.: Diurnal and seasonal variation of glacier meltwater hydrochemistry in Qiyi glacierized catchment in Qilian mountains, northwest china: Implication for chemical weathering, J. Mt. Sci., 15, 1035-1045, https://doi.org/10.1007/s11629-017-4695-2, 2018.
Xing, B., Liu, Z., Liu, G., and Zhang, J.: Determination of runoff components using path analysis and isotopic measurements in a glacier-covered alpine catchment (upper Hailuogou Valley) in southwest China, Hydrol. Process., 29, 3065–3073, https://doi.org/10.1002/hyp.10418, 2015.
Zhou, S., Wang, Z., and Joswiak, D. R.: From precipitation to runoff: stable isotopic fractionation effect of glacier melting on a catchment scale, Hydrol. Process., 28, 3341–3349, https://doi.org/10.1002/hyp.9911, 2014.
Zuecco, G., Penna, D., Borga, M., and van Meerveld, H. J.: A versatile index to characterize hysteresis between hydrological variables at the runoff event timescale, Hydrol. Process, 30, 1449–1466, https://doi.org/10.1002/hyp.10681, 2016.
Zuecco, G., Carturan, L., De Blasi, F., Seppi, R., Zanoner, T., Penna, D., Borga, M., Carton, A., and Della Fontana, G.: Understanding hydrological processes in glacierized catchments: Evidence and implications of highly variable isotopic and electrical conductivity data, Hydrol. Process., 33, 816–832, https://doi.org/10.1002/hyp.13366, 2018.
Zuzel, J. F. and Cox, L. M.: Relative importance of meteorological variables in snowmelt, Water Resour. Res., 11, 174–176, 1975.