the Creative Commons Attribution 4.0 License.
the Creative Commons Attribution 4.0 License.
Application of an improved global-scale groundwater model for water table estimation across New Zealand
Rogier Westerhoff
Paul White
Gonzalo Miguez-Macho
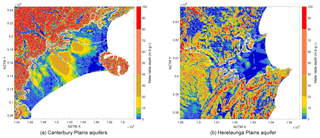
Many studies underline the importance of groundwater assessment at the larger, i.e. global, scale. The groundwater models used for these assessments are dedicated to the global scale and therefore not often applied for studies in smaller areas, e.g. catchments, because of their simplifying assumptions.
In New Zealand, advanced numerical groundwater flow models have been applied in several catchments. However, that application is piecemeal: only for a limited amount of aquifers and through a variety of groundwater model suites, formats, and developers. Additionally, there are large areas where groundwater models and data are sparse. Hence, an inter-catchment, inter-regional, or nationwide overview of important groundwater information, such as the water table, does not exist. The investment needed to adequately cover New Zealand with high-resolution groundwater models in a consistent approach would be significant and is therefore not considered possible at this stage.
This study proposes a solution that obtains a nationwide overview of groundwater that bridges the gap between the (too-)expensive advanced local models and the (too-)simple global-scale models. We apply an existing, global-scale, groundwater flow model and improve it by feeding in national input data of New Zealand terrain, geology, and recharge, and by slight adjustment of model parametrisation and model testing. The resulting nationwide maps of hydraulic head and water table depths show that the model points out the main alluvial aquifers with fine spatial detail (200 m grid resolution). The national input data and finer spatial detail result in better and more realistic variations of water table depth than the original, global-scale, model outputs. In two regional case studies in New Zealand, the hydraulic head shows excellent correlation with the available groundwater level data. Sensitivity and other analyses of our nationwide water tables show that the model is mostly driven by recharge, model resolution, and elevation (gravity), and impeded by the geology (permeability).
The use of this first dedicated New Zealand-wide model can aid in provision of water table estimates in data-sparse regions. The national model can also be used to solve inconsistency of models in areas of trans-boundary aquifers, i.e. aquifers that cover more than one region in New Zealand.
Comparison of the models, i.e. the national application (National Water Table model: NWT) with the global model (Equilibrium Water Table model: EWT), shows that most improvement is achieved by feeding in better and higher-resolution input data. The NWT model still has a bias towards shallow water tables (but less than the EWT model because of the finer model resolution), which could only be solved by feeding in a very high resolution terrain model that incorporates drainage features. Although this is a model shortcoming, it can also be viewed as a valuable indicator of the pre-human water table, i.e. before 90 % of wetlands were drained for agriculture since European settlement in New Zealand.
Calibration to ground-observed water level improves model results but can of course only work where there are such data available. Future research should therefore focus on both model improvements and more data-driven, improved estimation of hydraulic conductivity, recharge, and the digital elevation model. We further surmise that the findings of this study, i.e. successful application of a global-scale model at smaller scales, will lead to subsequent improvement of the global-scale model equations.
- Article
(15687 KB) - Full-text XML
-
Supplement
(3091 KB) - BibTeX
- EndNote
Groundwater is a key water resource to many countries in the world, providing water for irrigation, domestic consumption, and industry. Groundwater also provides baseflow to streams and rivers, which, in drier times, helps sustain ecology when rainfall runoff is low. Existing studies underline the importance of global-scale assessment of groundwater (Wada et al., 2012, 2014), its role in a changing climate (Green et al., 2011; Taylor et al., 2012), and its current depletion (Gleeson et al., 2012; Richey et al., 2015).
Groundwater models used for global-scale assessments are simplified. Because these models have to cover the entire globe, they generally use coarse input data or embed a simplified model algorithm. For example, Fan et al. (2013a) apply a global model of water table estimates with grid cells of approximately 1 km, using simplified subsurface parametrisation and flow equations that calculate an equilibrium water table (explained in more detail in Sect. 2). De Graaf et al. (2015) apply a model with approximately 10 km resolution and global-scale input data and also look for the equilibrium water table, albeit using a MODFLOW environment, with subsequent improvement to a two-layer MODFLOW application to better include confining layers (de Graaf et al., 2017).
Advanced numerical advanced groundwater flow studies are mostly at the catchment scale (Gusyev et al., 2013; Oude Essink et al., 2010; Wang et al., 2008), where hydrology is traditionally best constrained. Water policy also typically fits the catchment scale, and, in most countries, decision-making is based on hydrological studies of this scale. In New Zealand, that is not much different: water resources and allocation are managed by regional councils, and regions mostly have the same boundaries as the catchments. Advanced numerical groundwater flow models at the catchment scale in New Zealand have been developed by, e.g., White (2018), Toews et al. (2016), and Wöhling et al. (2018).
National-scale groundwater information in New Zealand is also important. Guidelines on groundwater allocation are defined by the national government (Ministry for the Environment, 2008, 2013), thus requiring a nationwide overview. Furthermore, national-scale hydrology models in New Zealand (Bandaragoda et al., 2004) require groundwater information to calculate the interaction of groundwater with surface water, such as baseflow or flow loss from rivers. However, many challenges still need to be overcome in order to obtain a national overview of New Zealand's groundwater resources. Substantial parts of New Zealand are not covered by advanced numerical groundwater flow models, and the regions that do have this coverage do not have agreed-upon and consistent modelling approaches, data formats, and data availability (Westerhoff et al., 2018), causing “trans-boundary” issues, such as drinking water source protection and catchment boundary definition. Where some regions are relatively data-rich, others do not have enough information to obtain a detailed groundwater flow model. Development of individual advanced groundwater flow models for each region, compatible across regions, is recommended but would take many years to complete in the current policy framework, with significant efforts required in aligning regional and national policymakers. Also, the combined model runtime of those advanced, and therefore computationally demanding, models would be a large computational burden.
This study proposes a solution to obtain a nationwide overview of groundwater that bridges the gap between (too-)expensive advanced local models and (too-)simple global-scale models. It describes the development of a groundwater model at the national scale of New Zealand. Our model is inspired by the global-scale Equilibrium Water Table (EWT) model (Fan et al., 2013a), with improved input data (i.e. national input datasets of elevation, geology, and recharge) and adjusted resolution and computational efficiency. It is therefore called the National Water Table (NWT) model. A review of the EWT model is first given, after which the improved NWT model method is explained. Results simulated at the national scale are presented, where sensitivity to the input parameters of recharge, and hydraulic conductivity is also assessed. The NWT is furthermore evaluated at the catchment scale by comparing simulated groundwater depths to observations in two regional case studies, where the role of a simplified calibration is assessed. In addition, this paper discusses the relevance of the NWT model to solving inconsistency between regional models, and the strength and weakness of the simplifying assumptions in the model. We also discuss the importance of model input components (e.g. terrain model and hydraulic conductivity).
The Equilibrium Water Table (EWT) model is a steady-state groundwater model that calculates water table depth (in metres below ground level: m b.g.l.) and water table elevation (in metres above sea level: m a.s.l.) at the global scale using a variety of ground-based, satellite-observed, and modelled data (Fan and Miguez-Macho, 2010b; Fan et al., 2007, 2013a; Miguez-Macho et al., 2007, 2008). The water table (Heath, 1995) represents a long-term average at a broad scale without human-induced effects, e.g. pumping, draining, and irrigation. The model calculates a single water table, and therefore it generally cannot represent smaller-scale water tables and piezometric surfaces in perched or multi-layered aquifers.
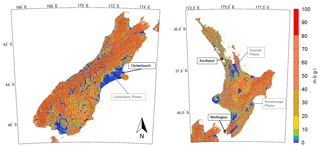
Figure 1EWT water table depth in New Zealand, after Fan et al. (2013a). Main cities (black text boxes) as well as main alluvial aquifer are pointed out (grey text boxes).
To calculate the water table, the long-term balance between the groundwater recharge and horizontal groundwater flow is calculated using a simple groundwater flow equation, based on a mass balance and Darcy's law (Dingman, 2002; Freeze and Cherry, 1979; Hendriks, 2010). The long-term balance is sought by a flux-based approach, i.e. by adding recharge and calculating groundwater flow, hydraulic head, and groundwater discharge to the surface for each time step unit (e.g. daily) until the model converges, i.e. until the water table no longer changes. The groundwater flow is constrained by the sea level, assuming that the hydrology is in equilibrium with the climate and sea level (Marshall and Clarke, 1999). Model input data include a global topography model, a long-term time series of global groundwater recharge, and a global soil model. Ground-observed groundwater level data have been used for calibration of hydraulic conductivity on a continental scale (Fan et al., 2013b). However, no New Zealand data were used in that calibration. As the EWT method is well described in other studies, we will not provide more detail in the main text of our study. However, the methods are described in Fan et al. (2013b) and summarised in Appendix A.
Westerhoff and White (2013) evaluated water table depths from the EWT model in New Zealand. Generally, they found that the model correctly estimated shallow water tables in New Zealand's alluvial aquifer systems, such as the Hauraki Plains, Heretaunga Plains, and the Canterbury Plains (Fig. 1). Overall, water tables have a tendency to be too shallow, and Westerhoff and White (2013) concluded that was mostly because the model does not incorporate pumping or other human draining features, e.g. tile drainage. However, they also found several issues in the Canterbury Plains, which included a bias towards calculation of shallow water table depth – i.e. EWT depths were too shallow compared to ground observations at many locations – that was possibly driven by wrong model input data (e.g. hydraulic conductivity or recharge). They also described the importance of better terrain models, as the uncertainty of the global-scale datasets is generally 10 m or more (Gesch et al., 1999; Harding et al., 1999; Rodríguez et al., 2006). Therefore, Westerhoff and White (2013) recommended improvement in the method and its input data, which included better model convergence criteria; representation of terrain; estimation of hydraulic conductivity, i.e. a better representation of the underlying geology; and rainfall recharge data that are relevant to the New Zealand climate.
The NWT model is based on the EWT model but uses adjustments as proposed by other global-scale groundwater studies (Gleeson et al., 2011; de Graaf et al., 2015) and uses national-scale New Zealand input data. Our model improvements include a national terrain model; national recharge estimates; hydraulic conductivity estimates based on the geological map of New Zealand; and model resolution, initial conditions, and convergence criteria.
3.1 National terrain model
The Geographx New Zealand DEM 2.1 (Geographx, 2012) is a national digital elevation model with an 8 m grid resolution which combines New Zealand-based topographic data and satellite data from the Shuttle Radar Topography Mission (USGS, 2006). More accurate elevation data are available in New Zealand, but only piecemeal at the local scale of catchments.
3.2 National rainfall recharge
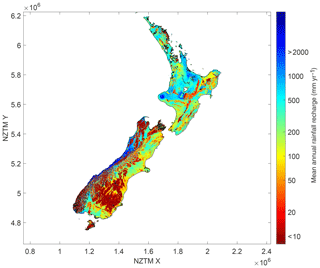
Rainfall recharge to groundwater was taken from a recently developed national New Zealand rainfall recharge dataset (Westerhoff et al., 2018). This dataset contains monthly estimates of recharge from January 2000 to December 2014, including an uncertainty estimate. For the purpose of feeding recharge into the NWT model with daily time steps, mean daily recharge was calculated for each NWT model cell (Fig. 2).
3.3 Hydraulic conductivity
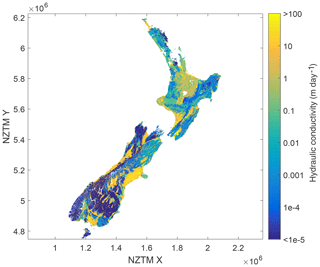
The NWT model uses data from the national geological map of New Zealand. The steps to derive saturated hydraulic conductivity K values suitable for NWT model input are estimation of near-surface K (Fig. 3), (optional) local calibration of near-surface K, and estimation of K over depth. These steps are described below.
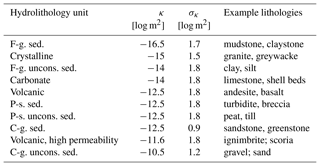
Table 1New Zealand hydrolithologies and their intrinsic permeability κ, including standard deviation σκ, after Gleeson et al. (2011) and Tschritter et al. (2016). F-g. stands for fine-grained, p-s. for poorly sorted, c-g. for coarse-grained, uncons. for unconsolidated, and sed. for sediment.
3.3.1 Estimation of near-surface K
The NWT method applies geology data, i.e. the deeper subsurface underlying the soil, from the national 1:250 000 Geological Map of New Zealand (GNS Science, 2012) to calculate near-surface K. The QMAP is a GIS-based digital map that shows “surface geology”, i.e. the geology of the subsurface up to approximately 10 m depth. The polygon attributes of main rock type, secondary rock type, and age were used to estimate K (Westerhoff et al., 2018) and were partly based on a classification method described by Gleeson et al. (2011), who estimated hydraulic permeability κ (m2) and its standard deviation for a range of hydrolithological classes. This method was put in the New Zealand context by Tschritter et al. (2016), who defined 10 hydrolithological classes and their associated κ (Table 1). All QMAP rock type attributes were summarised to 183 “dictionary” values, which were then assigned to permeabilities with a look-up table. Permeabilities of main rock type and secondary rock type were averaged, with main rock type weighted twice as much as secondary rock type.
Saturated hydraulic conductivity K (m day−1) was calculated following Freeze and Cherry (1979) (their Eq. 2.28):
where μ is the dynamic viscosity of freshwater at 13 ∘C (1.2155×10³ kg m−1 s−1), ρ is the density of fresh water (1000 kg m−3), and g is the gravitational constant (9.8 m2 s−1).
3.3.2 Local calibration of near-surface K
For local testing purposes, a simple calibration procedure was built in. Values of the original K (Eq. 1) were adjusted (to Kadj) in iterative calibration steps in areas where water table depth and elevation were deemed to be sufficiently known from local measurements:
The calibration damping factor ζ was chosen by trial and error to be 0.66 day−1. The maximum adjustment allowed per calibration time step was 100 m day−1. This calibration was run nine times, at intervals of 10 % of the standard model runtime (see Sect. 3.4). This procedure was only used in the case where ample ground-observed water level data were available for this study (Canterbury and Waipa; see Sects. 4.2 and 4.3, respectively). Before calibration, the ground-observed water level point data were gridded to an interpolated surface within the area containing ground observations.
3.3.3 Estimation of K over depth
Near-surface K was assumed to be represented by the QMAP-derived near-surface K (Fig. 3). Deeper than 10 m, an exponential decrease of hydraulic conductivity over depth was assumed, similar to Eq. (A1). As cell resolution of the NWT model is 200 m, the calibration constants used in this exponential decrease (a, b, and fmin; see Appendix, Eq. A2) were set equal to an earlier-developed 200 m resolution and locally calibrated EWT model in the Amazon Basin (Fan and Miguez-Macho, 2010a).
3.4 Model resolution, initial conditions, and convergence criteria
The model grid cell size was chosen as 200 m, in the New Zealand Transverse Mercator (NZTM) coordinate system. All input data were gridded at this cell size, either by averaging (if the cell size of the original input data was smaller than the model grid cell size) or by its nearest value (if cell size of the original input data was larger than the model grid cell size). Locally, the model was run at different spatial resolutions for the sake of more in-depth research on model behaviour (see Sect. 4.3).
Initial estimates of water table depth depth and elevation for the NWT model were set equal to the EWT water table depth and elevation, i.e. the results of the EWT model.
The model was run with a standard model runtime of 36 525 iterations, i.e. the equivalent of 100 years in daily time steps. The EWT method had a convergence criterion, where the iterative calculation stops when the water table reaches an equilibrium, i.e. when lateral groundwater flow equals recharge for every model cell. This criterion has been changed in the NWT method; the model currently runs for no longer than 36 525 iterations. Appendix B explains that convergence tests showed that running for longer improves model convergence but does not necessarily lead to better results, because most of the changes with increased runtime occur in shallow-water features, which in reality are mostly drained through artificial drainage, i.e. by humans. Additionally, feeding in recharge that contains uncertainty causes the equilibrium to probably never be reached.
All model runs in this study were performed on one core of an Intel Core i7-6700 CPU @ 3.40 GHz with memory (RAM) of 32.0 GB.
4.1 National water table maps
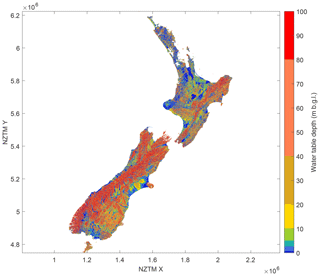
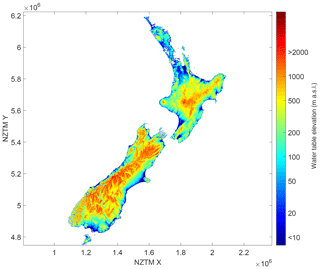
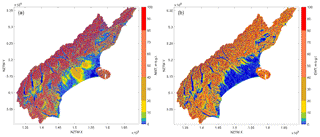
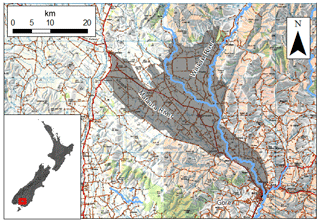
National maps of NWT water table depth (Fig. 4) and water table elevation (Fig. 5) show that water table depth is relatively deep in higher mountainous regions, but water table elevation clearly follows the terrain elevation. The NWT water table depths show the locations of the main alluvial aquifers, similar to the EWT model. The NWT water table depth clearly follows the aquifer delineations of White (2001), e.g. in the Canterbury Plains and Heretaunga Plains (Fig. 6), and is detailed enough to possibly improve this delineation in some areas. The finer detail in the NWT model results in a more realistic local variation of water table, compared to the EWT model results (Fig. 1). Many very small shallow-water-table features are found in between areas where water tables are deeper. These features resemble stream valleys, as the more detailed terrain model allows the model to discharge more water to the surface in these valleys. The finer spatial detail is best appreciated when zooming in to smaller regions. Therefore, evaluation analyses are described for two regional case studies (Canterbury region, Sect. 4.2; Waipa River catchment, Sect. 4.3).
4.2 Evaluation of NWT water table in the Canterbury region
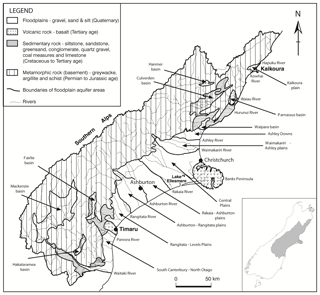
The Canterbury Plains is New Zealand's largest alluvial aquifer system. Nationwide, regional groundwater allocation is largest in the Canterbury region (Rajanayaka et al., 2010), with the majority of groundwater use in the plains. Surface geology in the Canterbury region is dominated by metamorphic rock and floodplains (Fig. 7). Metamorphic rock includes a large area of greywacke that forms much of the Southern Alps. Aquifers in the higher plains are mostly unconfined; in the lower plains they are typically confined and supply groundwater to extensive networks of spring-fed streams around Lake Ellesmere and the city of Christchurch. These confining conditions are due, in part, to the occurrence of marine sediments deposited near the current coast during interglacial periods. However, the pattern of groundwater flow is not influenced by any extensive, low-permeability layers of sediment within the upper 100 to 150 m below the water table (Hanson and Abraham, 2009). Therefore, application of the NWT (and EWT) methods, which assume unconfined aquifers, is justified in the Canterbury Plains.
Groundwater level observations from 3286 wells in Canterbury, acquired from 1894 to 2013 (Kelly Palmer, personal communication, 2013), have been used in this research. Most of these wells are located in the Canterbury Plains. It is assumed that these observations represent the water table and can thus be compared to NWT water table depth and water table elevation. All groundwater level observations were carefully quality-checked (Westerhoff and White, 2013). NWT water table depth and elevation covering the locations of these wells were sampled from both the NWT and EWT datasets. Median observed groundwater level for all wells was calculated. From here on, these will be referred to as “ground-observed water level”. The national Geographx elevation model was used for conversion of groundwater depth to groundwater elevation.
Table 2Absolute differences between ground-observed and modelled water table depths (Δ) and their percentage of occurrence in the Canterbury region for the NWT and EWT model.
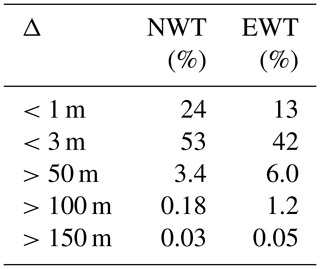
NWT water table depths are similar to ground-observed water depth: for example, 24 % and 53 % of NWT water table depths are within 1 and 3 m from ground-observed water depth, respectively (Table 2). This is an improvement to the EWT water table depths, where this was 13 % and 42 %, respectively. Also, the NWT model shows significantly fewer large discrepancies than the EWT model. For example, 3.4 %, 0.18 %, and 0.03 % of the NWT water table depths differed by more than 50, 100, and 150 m, respectively, from the ground-observed water depth. For the EWT water table depths, these statistics were 6 %, 1.2 %, and 0.05 %.
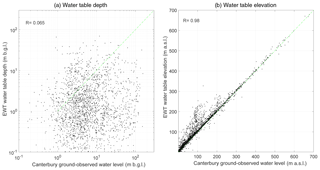
Correlation of NWT water table elevation with ground-observed water level (m a.s.l.) is high (R=0.99, Fig. 8, right) but does show local differences, which are shown more clearly in the crossplot of water table depth (Fig. 8, left). Westerhoff and White (2013) showed that evaluation of the EWT model revealed higher discrepancies in the same area (i.e. the area between the Ashburton and Rakaia rivers, Figs. 9 and 10). Although the discrepancies are smaller for the NWT model than for the EWT model in these areas, they occur at the same locations. Possible explanations for these discrepancies are considered in Sect. 5.
4.3 Evaluation of NWT water table in the Waipa River catchment
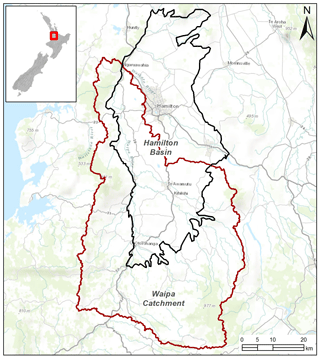
The Waipa River is a tributary of the Waikato River, in the Waikato region of New Zealand (Fig. 11), with a catchment size of approximately 300 000 ha. Increasing agricultural land use and deforestation, mainly in the low-lying Hamilton Basin, could potentially result in the deterioration of water quality in the Waipa River catchment, according to Rawlinson (2014), who performed a review on existing information in the catchment. They calculated a map of water table elevation using observed groundwater elevation from 758 wells located in the catchment. However, these observations are sparse because, temporally, data mostly consist of few measurements and, spatially, data are concentrated more in some areas than others; i.e. most wells are located in the Hamilton Basin. The NWT model can thus provide a better spatial insight into the water table in the catchment, provided that they correlate well enough with the ground observations.
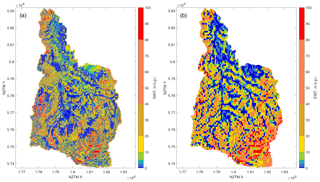
NWT water table depths clearly demonstrate the location of shallow water tables in the low-lying basin area (Fig. 13, left). The spatial pattern of NWT water table elevation is a good visual match to the interpolated ground-observed water table elevation (Fig. 12). In addition, the NWT map shows more detail than the interpolated ground-observed surface and calculates water table depth at many places where there are no ground observations. Because of its higher resolution, the NWT also shows more detail than the much coarser EWT water table (Fig. 13).
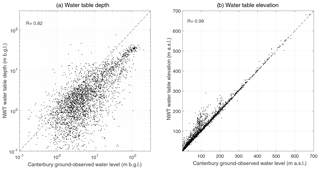
Figure 8Correlation of NWT water table depth and water table elevation with ground observations in the Canterbury region. The dashed line is the 1:1 relation.
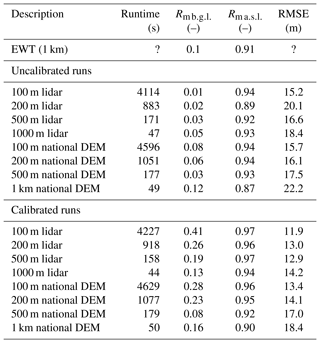
Because of the availability of a lidar terrain model for this study, statistics were collected for a multitude of model runs using different terrain models with different resolutions (100 m, 200 m, 500 m, 1 km). The effect of calibration towards the ground observations was also taken into account. Table 3 shows that correlation with ground observations improves with higher model resolution. Calibration towards hydraulic conductivity, albeit a simple implementation, improves the correlation of the modelled water table with ground-observed water level model output. Inclusion of the lidar DEM does not significantly improve the results of the uncalibrated run, but it does improve calibrated model runs. For the best model run (lidar DEM, 100 m resolution, calibrated), correlation of model results to ground-observed data was R=0.41 and R=0.97 for water table depth and water table elevation, respectively (Fig. 14).
Correlation of both runs is much higher than that of the EWT model (R=0.1 and R=0.91, Fig. 15). Water table depth shows significantly lower correlation than water table elevation, as was also the case in the evaluation in the Canterbury region. The Discussion section describes possible causes for these differences.
4.4 Sensitivity of the water table depth to recharge and hydraulic conductivity
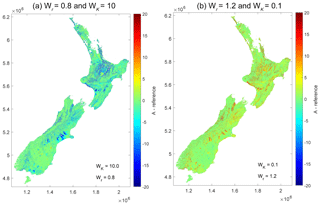
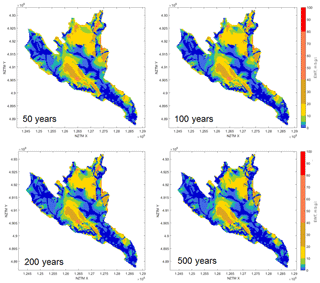
A total of 35 (uncalibrated) model runs for the NWT model at the national scale were performed, where the value of recharge and K model input were weighted. Weighting values for recharge (Wr) were in between 0.8 and 1.2 (because the nominal uncertainty of recharge of New Zealand's aquifers is less than 20 %; Westerhoff et al., 2018). Weighting values for K (WK) were chosen to follow a logarithmic distribution, i.e. in between 0.1 (10 %) and 10 (1000 %). Results are shown in Fig. 16. The average water table is sensitive both to recharge (an increase in recharge results in an increase in average water table depth) and to K (a decrease in K results in a increase in average water table depth). Spatial plots of two runs (Fig. 17, all 35 model results shown in the Supplement) show that most changes are taking place in the the foothills of aquifer areas.
The NWT model estimates water table depth and water table elevation with 200 m grid resolution at the national scale. Model equations are based on the global-scale EWT model, with adjusted model parametrisation and national input datasets. Because of these improvements, NWT-derived water table depths show the areas of alluvial aquifers, including their variations, with higher spatial resolution than the EWT model. The NWT water table elevation shows significantly better correlation with ground-observed water level data than EWT model results. The NWT model is currently the only dedicated high-resolution nationwide groundwater model for New Zealand, and it is able to estimate the water table at places where there are no ground observations. In addition, it shows more detail than most other interpolated water table surfaces and the EWT model results.
The NWT model includes all catchments of the mainland of New Zealand. Because water is primarily regulated at the regional level, regional models can show different results (e.g. groundwater catchment delineation) at regional boundaries. These inconsistencies can lead to trans-boundary issues, such as catchment boundary definition and source protection. A fundamental role of groundwater science is to identify and characterise groundwater catchments of water supplies. Better delineation of groundwater catchments is therefore essential for source protection. Source protection is clearly an important issue associated with the prevention of waterborne diseases, and a national environmental standard for source protection, including groundwater, has been proposed for New Zealand (Ministry for the Environment, 2009, 2016). Where two regional groundwater models show different results, the NWT model can be used as a “third” model to help solve those inconsistencies. This makes the NWT model relevant to solving trans-boundary issues and to assisting in provision of nationally consistent groundwater data.
The advantage of the NWT model, compared to catchment-scale groundwater flow models, is that its simple algorithm makes computation of the water table across all catchments relatively fast. The NWT model can therefore provide useful preliminary water table information for catchment-scale numerical groundwater flow models, in both data-sparse and data-rich regions. Furthermore, the NWT model inputs can provide other initial estimates that are useful to other models. For example, data of hydraulic conductivity and recharge are also nationwide.
The disadvantage of simplifying assumptions in the NWT model is that more complex groundwater features are not handled well. Currently, the model does not include confining layers reliably, nor does it incorporate fractures and groundwater age. This is mostly due to the simplifying assumption of K over depth. The assumption of a decrease of K with depth is based on unconfined water movement. Water table depth therefore does not necessarily equal groundwater level in confined aquifers, as the confining layer holds the water under higher pressure at greater depths than the modelled water table depth. The model calculates one water level in this case, i.e. the unconfined groundwater level. In the case of artesian water (i.e. a water table elevation higher than the ground surface) the NWT discharges all water above the ground surface. NWT water table elevation can thus not show artesian water table elevation as the water table is set at the ground surface. Finally, the calibration module of K (see Sect. 3.3.2) was shown to yield better groundwater table elevations in the case studies of Canterbury and Waipa. It was chosen not to further refine this coarse calibration (e.g. by testing K calibration in the log domain or by calibrating more often than only once per 10 years). That is mainly because, in such cases, more advanced local groundwater flow models, including better calibration options, might be preferable. These models could then still be constrained with initial estimates of NWT water tables, hydraulic conductivities, and recharge in data-sparse areas.
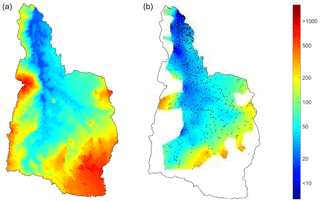
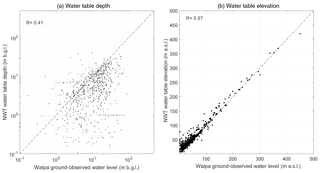
Figure 14Correlation of NWT water table depth (100 m lidar DEM, calibrated to ground observations) and water table elevation with ground observations in the Waipa River catchment. The dashed line is the 1:1 relation.
As with all groundwater models, the NWT and EWT models are sensitive to input parameters of terrain, recharge and hydraulic conductivity. We have shown that model correlation with ground-observed information improves with model resolution (because rivers are better resolved; see earlier in the Discussion section). Additionally, we have shown that a better-quality terrain model improves results, but only if the model is calibrated. Finally, sensitivity analyses in this study have quantified the sensitivity of the water table to recharge and K (i.e. the water table increases with increasing recharge and with decreasing K), where sensitivity is highest in the foothills and more elevated aquifer areas. Further study is recommended on using the results of our model tests to further develop a NWT model calibration which includes these findings and is better suited to multiple model input parameters. However, in doing that, we should be careful to avoid too many time-consuming (e.g. Monte Carlo and calibration) runs. After all, we are after a model that remains relatively simple, i.e. bridges the gap between global-scale and local-scale models. Furthermore, calibration and validation studies with a model that is sensitive in the foothills might not necessarily show improved validation, because validation data in the foothills are scarce. More in-depth calibration and validation studies are therefore recommended that use the findings of this study; these might then also best be done by more advanced local numerical flow models.
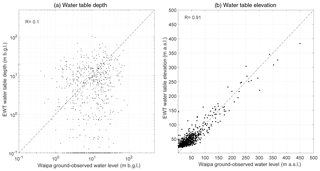
Figure 15Correlation of EWT water table depth and water table elevation with ground observations in the Waipa River catchment. The dashed line is the 1:1 relation.
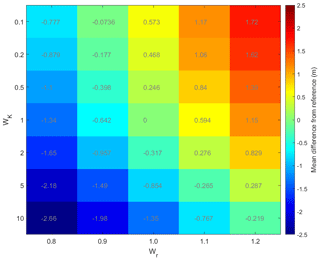
Figure 16Mean water table difference plot for 35 model runs, with varying weights for recharge (Wr) and K (WK). Difference is compared to the reference run of Wr=1 and WK=1.
Both the NWT and the EWT have a simplified representation of gaining and losing reaches. First, we address the simplifying assumptions about gaining reaches. The EWT and NWT models have a hydraulic-gradient-dependent interaction: if the water reaches the surface, it flows out of the system. That pattern follows the elevation, and thus it follows the rivers. Hence, through the model one will easily spot the rivers when looking at this outflow, showing the groundwater table equal to the surface elevation. The underlying assumption in the model is that rivers are resolved in the grid used for integration. This also explains why calculations done at high resolution lead to better results and have better correlation with ground-observations. The NWT model thus is an improvement of the EWT model, since its resolution is higher than the original global 30 arcsec grid. However, at about 200 m resolution rivers are still not resolved well enough, and we recommend running the model with even higher resolution. However, before doing that, we need an optimised set of model conditions, such as the balance between required (smaller) model time steps and computational effort. Bearing in mind the strength of fast and simplistic models, we should then also consider that this might better be done by more advanced local numerical models. Second, we address the simplifying assumptions about losing reaches. Losing rivers are only simulated by the model assuming that this is recharge; i.e. additional recharge from river runoff is not taken into account. If data were available on where rivers are losing, this could be implemented. However, New Zealand has no comprehensive nationwide datasets of losing (or gaining) reaches. Many advanced numerical groundwater models also still have difficulty in implementing gaining and losing river reaches, because of the numerical complexity and computational effort required to do so and the lack of information on losing and gaining reaches.
Water table depths showed lower correlation with ground observations than water table elevation in the Canterbury and Waipa examples. That is mainly because small inaccuracies of water table depth are much more significant than water table elevations at shallow water tables. For example, in an area that lies 100 m a.s.l., the water table depth error could be highly significant (e.g. 2±1 m b.g.l.), where the difference in water table elevation is much less significant (e.g. 98±1 m a.s.l.). The most likely candidate for the cause of such inaccuracies is the uncertainty of the terrain model. For example, Rodríguez et al. (2006) concluded that the SRTM data, on which the national terrain model is partly based, can have average absolute height errors of more than 10 m. Comparison of the lidar terrain model in the Waipa evaluation with the national terrain model showed a median absolute difference of 9 m (for areas below 20 m a.s.l., the difference was 4 m). Correlation of water table elevation data is less dependent on the inaccuracy of the terrain models used. However, correlation plots of water table depth proved useful in this study, as they monitored the improvements of model runs by fine-tuning input parametrisation. For example, in the Waipa River catchment correlation of water table depth with ground observations significantly improved when the lidar terrain model was used (Table 3). In both the Canterbury region and Waipa River catchment we used water table depth correlation with test improvement of the calibration for K.
The abovementioned lower correlation with water table depth is amplified by the fact that the model still does not incorporate human pumping or draining; i.e. it still has a bias towards shallow water tables (although less than the EWT due to improvement in model resolution and K). With very high resolution input data of terrain, which would include these small but important drainage features, this issue would be better resolved, as groundwater discharge would be better resolved. However, this bias of the shallow water table is also a correct indicator of the fact that many of these shallow-water-table areas used to be wetlands: approximately 90 % of wetlands have been lost since European settlement in New Zealand (StatsNZ and Ministry for the Environment, 2018), mostly due to drainage for agriculture.
Table 3Statistics on different model runs in the Waipa River catchment. RMSE stands for root mean square error.
This research confirms that high-quality model input data, such as hydraulic properties and accurate terrain models, are shown to be important to the improvement of groundwater models. More accurate input data than used in the NWT model exist in New Zealand. For example, high-resolution mapping of near-surface geology has been achieved at the regional scale (Westerhoff et al., 2014) through Airborne Electromagnetic (AEM) geophysics, and some regional terrain models are based on lidar data (Waikato Regional Council, 2016). However, data acquisition and management of those geophysical and terrain models are at the regional scale. There is no comprehensive national-scale AEM- and lidar-based information as of yet. This study therefore recommends continuing efforts of characterisation of these model input data at the national scale.
Improvements of the NWT model can lead to improved insights of the global-scale model approach. For example, the EWT model crucially requires geology data to infer better water table estimates. The approach in this study, i.e. using hydraulic permeability based on a method of Gleeson et al. (2011), was also used by de Graaf et al. (2015) for the global scale. We recommend that the EWT model approach also embed these improved input data and merge other national-scale geological data from other countries. Furthermore, we recommend that the findings of our sensitivity analyses and our calibration of hydraulic conductivity at locations where water tables are well known be used to further improve the global-scale EWT model.
The NWT model is a revised version of the global-scale EWT model that has been improved for application in New Zealand. The NWT model gives an estimate of water table depth and water table elevation with a 200 m grid resolution. The NWT model uses slightly adjusted model parametrisation, but mostly improved input datasets, amongst which are a national terrain model, a national digital geological dataset, and a nationwide recharge dataset.
Because of the improvements, NWT water table depths show the areas of alluvial aquifers, including their spatial variation of water table depths, better and with higher spatial resolution than the EWT model. The NWT water table elevation shows excellent correlation with ground-observed water level data in the Canterbury region and Waipa River catchment. The NWT model estimates the water table at places where there are no ground observations and therefore shows more detail than other existing interpolated water table surfaces. In terms of correlation and spatial resolution, the NWT model outperforms the EWT model.
Because of its simplified character, the NWT model has the advantage of fast calculation at the national scale. In fact, it is currently the only nationwide groundwater model dedicated to New Zealand application. The NWT water table, as well as its nationwide data components (e.g. recharge and hydraulic conductivity), can be used as an initial estimate for more advanced catchment-scale numerical groundwater flow models where data are sparse. In addition, the NWT model might also be used to solve inconsistency of different regional models at regional boundaries.
Sensitivity analyses at the national scale show that the NWT and EWT models are most sensitive to recharge and hydraulic conductivity in the foothills of aquifers. Calibration tests show that improved model resolution leads to better results (i.e. higher correlation with ground observations) and that a better-quality terrain model (i.e. lidar used in the Waipa local case study) improves model results, but only if the model is calibrated.
Use of the NWT model parametrisation improvements could lead to the improvement of the global-scale EWT model, for example in a better estimation method of hydraulic conductivity. Also, the findings of our model tests and sensitivity analyses might be extrapolated to the global EWT application. We therefore recommend the findings of this study to be used for improvement of the global-scale EWT model application.
The NWT model does not handle complex groundwater features well – i.e. confining layers, fractures, and groundwater age – because the model contains simplifying assumptions. Because we want the NWT model to remain a simplified model, i.e. the model that bridges the gap between (too-)expensive advanced local models and (too-)simple global-scale models (see Sect. 1), we recommend that state-of-the-art numerical catchment-scale groundwater flow models should be used in those circumstances if available. However, the NWT model is still useful to provide initial model estimates (i.e. water table, hydraulic conductivity, and recharge) to those more advanced models.
The NWT model still has a bias towards shallow water tables, although less than the EWT model because of the finer model resolution. This study shows that improved input data of hydraulic conductivity (or calibration towards it) further reduces this bias. However, this bias of shallow water table is also a valuable indicator that correctly shows that many of the indicated shallow-water-table areas used to be wetlands: approximately 90 % of wetlands have been drained since European settlement in New Zealand, mostly to develop agriculture.
Possible improvements of the NWT model are the use of better model input components, such as a better terrain model, and improved model calibration. Therefore, this study recommends further efforts in making available high-quality nationwide geophysical, terrain, and water level data at the national scale of New Zealand.
The resulting water table data of this study are available for the scientific community (NETCDF-CF1.6 format), through an open data licence (CC BY-NC 4.0: https://creativecommons.org/licenses/by-nc/4.0/), by contacting the corresponding author.
This section summarises the model description of the global-scale EWT model, as described in Fan et al. (2013b).
The EWT model calculates water table depth and water table elevation for a mesh of cells that each have the following properties:
-
cell size in the horizontal (x, y) directions;
-
elevation of the ground surface above sea level;
-
annual vertical groundwater recharge from rainfall;
-
transmissivity, embedded in a hydraulic conductivity–depth relation;
-
annual horizontal groundwater inflow and outflow, which are calculated by the EWT model;
-
groundwater head, which is calculated by the EWT model.
The cell size for the EWT model is 30 arcsec of decimal degrees of latitude and longitude in the WGS84 projection. Therefore, cell size in metres depends on location and varies from 0.76 km east–west and 0.93 km north–south in the north to 0.63 km east–west and 0.93 km north–south in the south.
The EWT model uses elevation data from global topography models (Buis, 2011; Smith and Sandwell, 2003), all at the 30 arcsec latitude–longitude decimal degree resolution. Rainfall recharge to groundwater is at the 0.5 arcdeg latitude–longitude decimal degree resolution (Döll and Fiedler, 2008). The cell transmissivity is the hydraulic conductivity integrated over depth. Hydraulic conductivity (K) between the ground surface and 1.5 m depth, K0, is derived from a global soil database (Reynolds et al., 2000). Below 1.5 m, K is assumed to decrease exponentially with depth, after the decrease of porosity with depth for large-scale basin studies (Beven and Kirkby, 1979). The exponential decrease of K at depth z below 1.5 m depth is defined as
where z is the depth below ground level, and f is called the “e-folding depth”:
where a, b, and fmin are calibration constants, and s is the terrain slope (Fan et al., 2013b). The inverse relationship of f with s (Eq. A2) is a function of climate, geology, and biota (Ahnert, 1970; Summerfield and Hulton, 1994). This relationship causes a large gradient in K over depth where terrain is steeper (i.e. a thin regolith) and a small gradient in K where terrain is relatively flat (i.e. a deep soil). The values of a, b, and fmin for the global 30 arcsec EWT model are set to 120, 150, and 5, respectively, based on experience of calibration of the model with ground-observed data in North America (Fan et al., 2013b). No ground-observed water level data from New Zealand have been used to validate Eq. (A2). For a case study in the Amazon, with a more detailed 200 m resolution model, Fan and Miguez-Macho (2010a) used revised values for a, b, and fmin (75, 150, and 4, respectively).
Groundwater recharge (R) estimates are provided by global-scale mean annual estimates of rainfall recharge to groundwater (Döll and Fiedler, 2008). The horizontal flow between cells (Q) is calculated by Eq. (A3), based on a mass balance and Darcy's law (Dingman, 2002; Freeze and Cherry, 1979; Hendriks, 2010):
where w is the width of the cell, T is the transmissivity of the cell, h is the groundwater head in the centre of the cell, hn is the groundwater head in the neighbouring cell, and L is the distance between the two cells.
Groundwater discharge into rivers and wetlands (Qr) is identified where the groundwater head is above the ground level (Fig. A1). Where the groundwater head rises above the land surface, it is reset to the land surface to mimic the effect of surface drainage and evaporation. Two important assumptions made in the model are that there is only one water table at any location (thus neglecting local, perched, or multi-layer aquifers) and that groundwater use (i.e. abstraction) is zero.
The EWT model is a steady-state model, where calculations are done iteratively with daily time steps where recharge is fed into the groundwater flow equation. The calculation converges until an equilibrium between recharge and groundwater flow has been reached, i.e. until the mean recharge in a cell equals the mean groundwater flow out of the cell:
Computationally, this means that Eq. (A3) is repeated until a convergence has been reached, i.e. that the difference in groundwater head between iterations is less than 1 mm in all land cells.
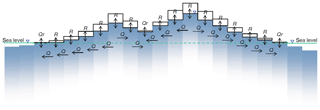
Figure A1Schematic of the EWT model to simulate the water table at the continental scale, using recharge (R), horizontal groundwater flow (Q), groundwater discharge in rivers (Qr), and sea level (boundary condition). The blue fading colours indicate the decrease of hydraulic conductivity with depth (Fan and Miguez-Macho, 2010b).
Convergence tests were run for the Mataura catchment in Southland, New Zealand (Fig. B1).
Comparisons of these tests were performed by visual comparison of water table depth, by comparison of volumes of recharge that was rejected by the NWT model due to the water table reaching the surface, and by comparison of convergence ratios (the ratio being defined as the ratio of cells that have a change in hydraulic head of more than 1 cm, sampled consecutively after each 365 time steps). The model was fed with recharge from Westerhoff et al. (2018) in four ways:
-
Mean annual recharge was fed in as mean daily recharge.
-
The mean annual recharge was distributed over the year in daily time steps using a normal distribution, i.e. a Gaussian distribution with 365 time steps (Eq. B1):
where σ is the standard deviation of a normal distribution, i.e. one-sixth of the 365 days in this case; μ is the mean, in this case 182.5; and x is the day in the year, i.e. a vector with values in between 1 and 365.
Equation (B1) mimics a seasonal distribution of rainfall recharge over the year, i.e. seasonal variation of rainfall recharge. Since the model is steady state, there should not be any difference in model output between seasonal and mean annual recharge input, but the main reason was to test if the NWT model would show a seasonal variation due to different groundwater discharge to the surface, as suggested by, e.g., Arnold et al. (2000).
-
As (1) but with incorporation of recharge uncertainty, as estimated by Westerhoff et al. (2018).
-
As (2) but with incorporation of recharge uncertainty, as estimated by Westerhoff et al. (2018).
Inclusion of uncertainty diminishes convergence; given the added noise on the convergence ratio, probably convergence will never be reached. Inclusion of seasonality does not make a difference in convergence when uncertainty is included (Fig. B2) (but convergence is slightly stronger when uncertainty is not included). None of the four tests show significant differences in water table depths (Fig. B3).
As rejected recharge increases with model runtime (Table B1) but no visual differences can be seen in the water table depth (Fig. B4), this leads to the conclusion that, while the model keeps converging, most of the changes are taking place in the areas with a shallow water table. In reality, most of these areas are drained by humans, which is not taken into account by the model. Therefore, running the model for too long of a time to improve model convergence does not significantly improve the water table depth estimates. Because of these findings, for the purpose of estimation of water table depth we chose an efficient 100-year model runtime.
Table B1Volumes of rejected recharge in the Mataura catchment, Southland, New Zealand, for different model runtimes.
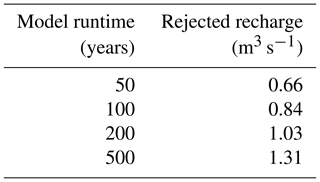
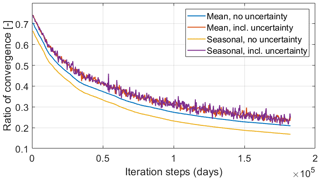
Figure B2Convergence test in the Mataura catchment, Southland, New Zealand, with inclusion of uncertainty and a Gaussian distribution over the year to include seasonality of recharge.
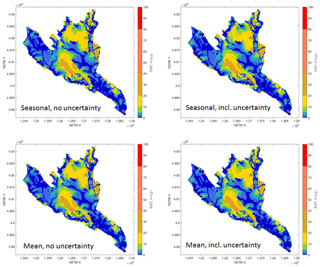
Figure B3Convergence test in the Mataura catchment, Southland, New Zealand, with inclusion of uncertainty and a Gaussian distribution over the year to include seasonality of recharge.
The supplement related to this article is available online at: https://doi.org/10.5194/hess-22-6449-2018-supplement.
RW conceived, designed, and conducted the experiments and analysed all data. RW and PW wrote the paper. PW advised in the validation experiments in Canterbrury and Waipa. GM-M wrote parts of the discussion texts where the NWT was compared to the EWT. PW and GM-M furthermore advised in comprehensively addressing all reviewer comments.
The authors declare that they have no conflict of interest.
This article is part of the special issue “Integration of Earth observations and models for global water resource assessment”. It is not associated with a conference.
This research has been part of a PhD study of the lead author at the University
of Waikato, New Zealand, supervised by Moira Steyn-Ross. It has been performed
as part of the Smart Aquifer Characterisation (SAC) Programme, funded by the
Ministry of Business, Innovation and Employment, New Zealand. This project has
received co-funding from the European Union's Seventh Framework Programme for Research
and Technological Development under grant agreement no. 603608,
eartH2Observe. We furthermore would like to thank the reviewers for their
valuable comments, Waikato Regional Council and Environment Canterbury for their
ground-observed data used in the results section, and Jeremy White (GNS Science)
for his advice on the sensitivity analyses.
Edited by: Martina Floerke
Reviewed by: two anonymous referees
Ahnert, F.: Functional relationships between denudation, relief, and uplift in large, mid-latitude drainage basins, Am. J. Sci., 268, 243–263, https://doi.org/10.2475/ajs.268.3.243, 1970. a
Arnold, J., Muttiah, R., Srinivasan, R., and Allen, P.: Regional estimation of base flow and groundwater recharge in the Upper Mississippi river basin, J. Hydrol., 227, 21–40, https://doi.org/10.1016/S0022-1694(99)00139-0, 2000. a
Bandaragoda, C., Tarboton, D. G., and Woods, R.: Application of TOPNET in the distributed model intercomparison project, J. Hydrol., 298, 178–201, https://doi.org/10.1016/j.jhydrol.2004.03.038, 2004. a
Beven, K. J. and Kirkby, M. J.: A physically based, variable contributing area model of basin hydrology/Un modéle à base physique de zone d'appel variable de l'hydrologie du bassin versant, Hydrolog. Sci. Bull., 24, 43–69, https://doi.org/10.1080/02626667909491834, 1979. a
Brown, L.: Canterbury, in: Groundwaters of New Zealand, edited by: Rosen, M. R. and White, P. A., New Zealand Hydrological Society, Wellington, New Zealand, 441–459, 2001. a
Buis, A.: NASA, Japan Release Improved Topographic Map of Earth, available at: http://www.nasa.gov/topics/earth/features/aster20111017.html (last access: July 2013), 2011. a
de Graaf, I. E. M., Sutanudjaja, E. H., van Beek, L. P. H., and Bierkens, M. F. P.: A high-resolution global-scale groundwater model, Hydrol. Earth Syst. Sci., 19, 823–837, https://doi.org/10.5194/hess-19-823-2015, 2015. a, b, c
de Graaf, I. E. M., van Beek, R. L., Gleeson, T., Moosdorf, N., Schmitz, O., Sutanudjaja, E. H., and Bierkens, M. F.: A global-scale two-layer transient groundwater model: Development and application to groundwater depletion, Adv. Water Resour., 102, 53–67, https://doi.org/10.1016/j.advwatres.2017.01.011, 2017. a
Dingman, S. L.: Physical hydrology, 2nd Edn., Prentice Hall, Upper Saddle River, NJ, 2002. a, b
Döll, P. and Fiedler, K.: Global-scale modeling of groundwater recharge, Hydrol. Earth Syst. Sci., 12, 863–885, https://doi.org/10.5194/hess-12-863-2008, 2008. a, b
Fan, Y. and Miguez-Macho, G.: Potential groundwater contribution to Amazon evapotranspiration, Hydrol. Earth Syst. Sci., 14, 2039–2056, https://doi.org/10.5194/hess-14-2039-2010, 2010a. a, b
Fan, Y. and Miguez-Macho, G.: A simple hydrologic framework for simulating wetlands in climate and earth system models, Clim. Dynam., 37, 253–278, https://doi.org/10.1007/s00382-010-0829-8, 2010b. a, b
Fan, Y., Miguez-Macho, G., Weaver, C. P., Walko, R., and Robock, A.: Incorporating water table dynamics in climate modeling: 1. Water table observations and equilibrium water table simulations, J. Geophys. Res., 112, D10125, https://doi.org/10.1029/2006JD008111, 2007. a
Fan, Y., Li, H., and Miguez-Macho, G.: Global Patterns of Groundwater Table Depth, Science, 339, 940–943, https://doi.org/10.1126/science.1229881, 2013a. a, b, c, d
Fan, Y., Li, H., and Miguez-Macho, G.: Global Patterns of Groundwater Table Depth: Supplementary Material, Science, 339, 1–59, https://doi.org/10.1126/science.1229881, 2013b. a, b, c, d, e
Freeze, R. and Cherry, J.: Groundwater, Prentice-Hall, Inc., Englewood Cliffs, NJ, 1979. a, b, c
Geographx: Geographx New Zealand DEM 2.1, available at: http://geographx.co.nz/wp/wp-content/uploads/2012/12/GX-Terrain-Metadata.pdf (last access: November 2015), 2012. a
Gesch, D. B., Verdin, K. L., and Greenlee, S. K.: New land surface digital elevation model covers the Earth, Eos Trans. Am. Geophys. Union, 80, 69, https://doi.org/10.1029/99EO00050, 1999. a
Gleeson, T., Smith, L., Moosdorf, N., Hartmann, J., Dürr, H. H., Manning, A. H., van Beek, L. P. H., and Jellinek, A. M.: Mapping permeability over the surface of the Earth, Geophys. Res. Lett., 38, l02401, https://doi.org/10.1029/2010GL045565, 2011. a, b, c, d
Gleeson, T., Wada, Y., Bierkens, M. F. P., and van Beek, L. P. H.: Water balance of global aquifers revealed by groundwater footprint, Nature, 488, 197–200, https://doi.org/10.1038/nature11295, 2012. a
GNS Science: QMAP, available at: http://www.gns.cri.nz/Home/Our-Science/Earth-Science/Regional-Geology/Geological-Maps/1-250-000-Geological-Map-of-New-Zealand-QMAP (last access: March 2014), 2012. a
Green, T. R., Taniguchi, M., Kooi, H., Gurdak, J. J., Allen, D. M., Hiscock, K. M., Treidel, H., and Aureli, A.: Beneath the surface of global change: Impacts of climate change on groundwater, J. Hydrol., 405, 532–560, https://doi.org/10.1016/j.jhydrol.2011.05.002, 2011. a
Gusyev, M. A., Toews, M., Morgenstern, U., Stewart, M., White, P., Daughney, C., and Hadfield, J.: Calibration of a transient transport model to tritium data in streams and simulation of groundwater ages in the western Lake Taupo catchment, New Zealand, Hydrol. Earth Syst. Sci., 17, 1217–1227, https://doi.org/10.5194/hess-17-1217-2013, 2013. a
Hanson, C. and Abraham, P.: Depth and spatial variation in groundwater chemistry, Central Canterbury Plains, Environment Canterbury, Environment Canterbury, Investigations and Monitoring Group, Christchurch, NZ, 2009. a
Harding, D., Gesch, D., Carabajal, C., and Luthcke, S.: Application of the Shuttle Laser Altimeter in an Accuracy Assessment of GTOPO30, A Global 1-kilometer Digital Elevation Model, in: Proceedings of the International Society for Photogrammetry and Remote Sensing, vol. XXXII-3/W14, La Jolla, USA, 81–85, 1999. a
Heath, R.: Basic Ground-Water Hydrology, United States Geological Survey Water Supply Paper 2220, USGS, Denver, Colorado, USA, 86 pp., 1995. a
Hendriks, M. R.: Introduction to physical hydrology, Oxford University Press, Oxford, UK, 2010. a, b
Marshall, S. J. and Clarke, G. K.: Modeling North American Freshwater Runoff through the Last Glacial Cycle, Quaternary Res., 52, 300–315, https://doi.org/10.1006/qres.1999.2079, 1999. a
Miguez-Macho, G., Fan, Y., Weaver, C. P., Walko, R., and Robock, A.: Incorporating water table dynamics in climate modeling: 2. Formulation, validation, and soil moisture simulation, J. Geophys. Res., 112, D13108, https://doi.org/10.1029/2006JD008112, 2007. a
Miguez-Macho, G., Li, H., and Fan, Y.: Simulated Water Table and Soil Moisture Climatology Over North America, B. Am. Meteorol. Soc., 89, 663–672, https://doi.org/10.1175/BAMS-89-5-663, 2008. a
Ministry for the Environment: A Guide to the National Policy Statement for Freshwater Management 2014, publication number ME 1202, Ministry for the Environment New Zealand, Wellington, New Zealand, 2008. a
Ministry for the Environment: Draft Users' Guide: National Environmental Standard for Sources of Human Drinking Water, ME 936, available at: http://www.mfe.govt.nz/publications/rma/nes-draft-sources-human-drinking-water (last access: November 2016), 2009. a
Ministry for the Environment: Proposed National Environmental Standard on Ecological Flows and Water Levels: Discussion Document, available at: http://www.mfe.govt.nz/publications/rma-fresh-water/proposed-national-environmental-standard-ecological-flows-and-water (last access: July 2016), 2013. a
Ministry for the Environment: Proposed National Environmental Standard for Sources of Human Drinking Water, available at: http://www.mfe.govt.nz/more/cabinet-papers-and-related-material-search/cabinet-papers/freshwater/proposed-national, last access: November 2016. a
Oude Essink, G. H. P., van Baaren, E. S., and de Louw, P. G. B.: Effects of climate change on coastal groundwater systems: A modeling study in the Netherlands, Water Resour. Res., 46, W00F04, https://doi.org/10.1029/2009WR008719, 2010. a
Rajanayaka, C., Donaggio, J., and McEwan, H.: Update of water allocation data and estimate of actual water use of consented takes 2009–2010, Aqualinc Research Report H10002/3, New Zealand Ministry for the Environment, Wellington, New Zealand, 2010. a
Rawlinson, Z.: Waipa River Catchment: requirements for conceptual groundwater model development, GNS Science consultancy report 2014/147, GNS Science, Wellington, New Zealand, p. 87, 2014. a, b, c
Reynolds, C. A., Jackson, T. J., and Rawls, W. J.: Estimating soil water-holding capacities by linking the Food and Agriculture Organization Soil map of the world with global pedon databases and continuous pedotransfer functions, Water Resour. Res., 36, 3653–3662, https://doi.org/10.1029/2000WR900130, 2000. a
Richey, A. S., Thomas, B. F., Lo, M.-H., Reager, J. T., Famiglietti, J. S., Voss, K., Swenson, S., and Rodell, M.: Quantifying renewable groundwater stress with GRACE, Water Resour. Res., 51, 5217–5238, https://doi.org/10.1002/2015WR017349, 2015. a
Rodríguez, E., Morris, C. S., and Belz, J. E.: A Global Assessment of the SRTM Performance, Photogram. Eng. Remote Sens., 72, 249–260, https://doi.org/10.14358/PERS.72.3.249, 2006. a, b
Smith, B. and Sandwell, D.: Accuracy and resolution of shuttle radar topography mission data, Geophys. Res. Lett., 30, 1467, https://doi.org/10.1029/2002GL016643, 2003. a
StatsNZ and Ministry for the Environment: Wetland Extent, available at: http://archive.stats.govt.nz/browse_for_stats/environment/environmental-reporting-series/environmental-indicators/Home/Fresh water/wetland-extent.aspx, last access: November 2018. a
Summerfield, M. A. and Hulton, N. J.: Natural controls of fluvial denudation rates in major world drainage basins, J. Geophys. Res., 99, 13871–13883, https://doi.org/10.1029/94JB00715, 1994. a
Taylor, R. G., Scanlon, B., Döll, P., Rodell, M., van Beek, R., Wada, Y., Longuevergne, L., Leblanc, M., Famiglietti, J. S., Edmunds, M., Konikow, L., Green, T. R., Chen, J., Taniguchi, M., Bierkens, M. F. P., MacDonald, A., Fan, Y., Maxwell, R. M., Yechieli, Y., Gurdak, J. J., Allen, D. M., Shamsudduha, M., Hiscock, K., Yeh, P. J.-F., Holman, I., and Treidel, H.: Ground water and climate change, Nat. Clim. Change, 3, 322–329, https://doi.org/10.1038/nclimate1744, 2012. a
Toews, M. W., Daughney, C. J., Cornaton, F. J., Morgenstern, U., Evison, R. D., Jackson, B. M., Petrus, K., and Mzila, D.: Numerical simulation of transient groundwater age distributions assisting land and water management in the Middle Wairarapa Valley, New Zealand, Water Resour. Res., 52, 9430–9451, https://doi.org/10.1002/2016WR019422, 2016. a
Tschritter, C., Rawlison, Z., Westerhoff, R., and White, P.: Aquifer classification and mapping at the national scale – Phase 1: Identification of hydrogeological units, GNS Science Report SR2016-51, GNS Science, Wellington, New Zealand, 2016. a, b
USGS: Global Land Cover Facility, Shuttle Radar Topography Mission (SRTM), unfilled finished version B, available at: http://www.landcover.org (last access: March 2014), 2006. a
Wada, Y., van Beek, L. P. H., and Bierkens, M. F. P.: Nonsustainable groundwater sustaining irrigation: A global assessment, Water Resour. Res., 48, W00L06, https://doi.org/10.1029/2011WR010562, 2012. a
Wada, Y., Wisser, D., and Bierkens, M. F. P.: Global modeling of withdrawal, allocation and consumptive use of surface water and groundwater resources, Earth Syst. Dynam., 5, 15–40, https://doi.org/10.5194/esd-5-15-2014, 2014. a
Waikato Regional Council: LIDAR – Regional Extent – GIS layer, available at: http://www.waikatoregion.govt.nz/Environment/Environmental-information/REDI/1900018/, last access: August 2016. a
Wang, S., Shao, J., Song, X., Zhang, Y., Huo, Z., and Zhou, X.: Application of MODFLOW and geographic information system to groundwater flow simulation in North China Plain, China, Environ. Geol., 55, 1449–1462, https://doi.org/10.1007/s00254-007-1095-x, 2008. a
Westerhoff, R. and White, P.: Application of equilibrium water table estimates using satellite measurements to the Canterbury Region, New Zealand, GNS Science Report 2013/43, GNS Science, Wellington, New Zealand, 2013. a, b, c, d, e
Westerhoff, R., Karaoulis, M., de Kleine, M., and Rawlinson, Z.: Evaluation of the use of helicopter electromagnetic (HEM) measurements for aquifer characterisation in the Otago Region, New Zealand, Deltares Science Report 1204708-000-BGS-0004, Deltares, Delft, the Netherlands, 2014. a
Westerhoff, R., White, P., and Rawlinson, Z.: Incorporation of Satellite Data and Uncertainty in a Nationwide Groundwater Recharge Model in New Zealand, Remote Sensing, 10, 58, https://doi.org/10.3390/rs10010058, 2018. a, b, c, d, e, f, g, h
White, J. T.: A model-independent iterative ensemble smoother for efficient history-matching and uncertainty quantification in very high dimensions, Environ. Model. Softw., 109, 191–201, https://doi.org/10.1016/j.envsoft.2018.06.009, 2018. a
White, P.: Groundwater resources in New Zealand, in: Groundwaters of New Zealand, edited by: Rosen, M. R. and White, P. A., New Zealand Hydrological Society, Wellington, New Zealand, 45–75, 2001. a, b
Wöhling, T., Gosses, M. J., Wilson, S. R., and Davidson, P.: Quantifying River-Groundwater Interactions of New Zealand's Gravel-Bed Rivers: The Wairau Plain, Groundwater, 56, 647–666, https://doi.org/10.1111/gwat.12625, 2018. a


