the Creative Commons Attribution 4.0 License.
the Creative Commons Attribution 4.0 License.
 | 25 Oct 2018
Modelling the water balance of Lake Victoria (East Africa) – Part 1: Observational analysis
Nicole P. M. van Lipzig
Wim Thiery
Lake Victoria is the largest lake in Africa and one of the two major sources of the Nile river. The water level of Lake Victoria is determined by its water balance, consisting of precipitation on the lake, evaporation from the lake, inflow from tributary rivers and lake outflow, controlled by two hydropower dams. Due to a scarcity of in situ observations, previous estimates of individual water balance terms are characterized by substantial uncertainties, which means that the water balance is often not closed independently. In this first part of a two-paper series, we present a water balance model for Lake Victoria, using state-of-the-art remote sensing observations, high-resolution reanalysis downscaling and outflow values recorded at the dam. The uncalibrated computation of the individual water balance terms yields lake level fluctuations that closely match the levels retrieved from satellite altimetry. Precipitation is the main cause of seasonal and interannual lake level fluctuations, and on average causes the lake level to rise from May to July and to fall from August to December. Finally, our results indicate that the 2004–2005 drop in lake level can be about half attributed to a drought in the Lake Victoria Basin and about half to an enhanced outflow, highlighting the sensitivity of the lake level to human operations at the outflow dam.
- Article
(2608 KB) - Full-text XML
- Companion paper
- BibTeX
- EndNote


Lake Victoria is the largest freshwater lake in Africa – and the second largest in the world – with a surface area of 68 000 km2 spanning over Kenya, Tanzania and Uganda. Lake Victoria directly sustains the 30 million people living in its basin and the 200 000 fishermen operating from its shores (Semazzi, 2011). Being one of the major sources of the Nile, Lake Victoria supports natural resources that impact the livelihoods of over 300 million people living in the Nile basin (Semazzi, 2011). Fluctuations in the water level of the lake are therefore of major importance, as a drop in lake level may have massive implications for the ability of local communities to access water, to collect food via fishing and to transport goods (Semazzi, 2011). Moreover, a decreased outflow due to declining lake levels may have major consequences downstream. The Nile river is already under immense pressure by various competitive uses and social, political and legislative conditions (Taye et al., 2011). In addition, lake level fluctuations also influence the amount of outflow released by the dam and by consequence the amount of hydropower generated and energy available in the region.
Lake level fluctuations are determined by the water balance (WB) of the lake. Precipitation on the lake and inflow from tributary rivers coming from the Lake Victoria Basin provide the input. Water is lost by evaporation from the lake surface and by lake outflow, which is controlled by the Nalubaale dam complex for hydropower located at Jinja, Uganda. Water level fluctuations of Lake Victoria are therefore controlled by both climatic conditions and human management.
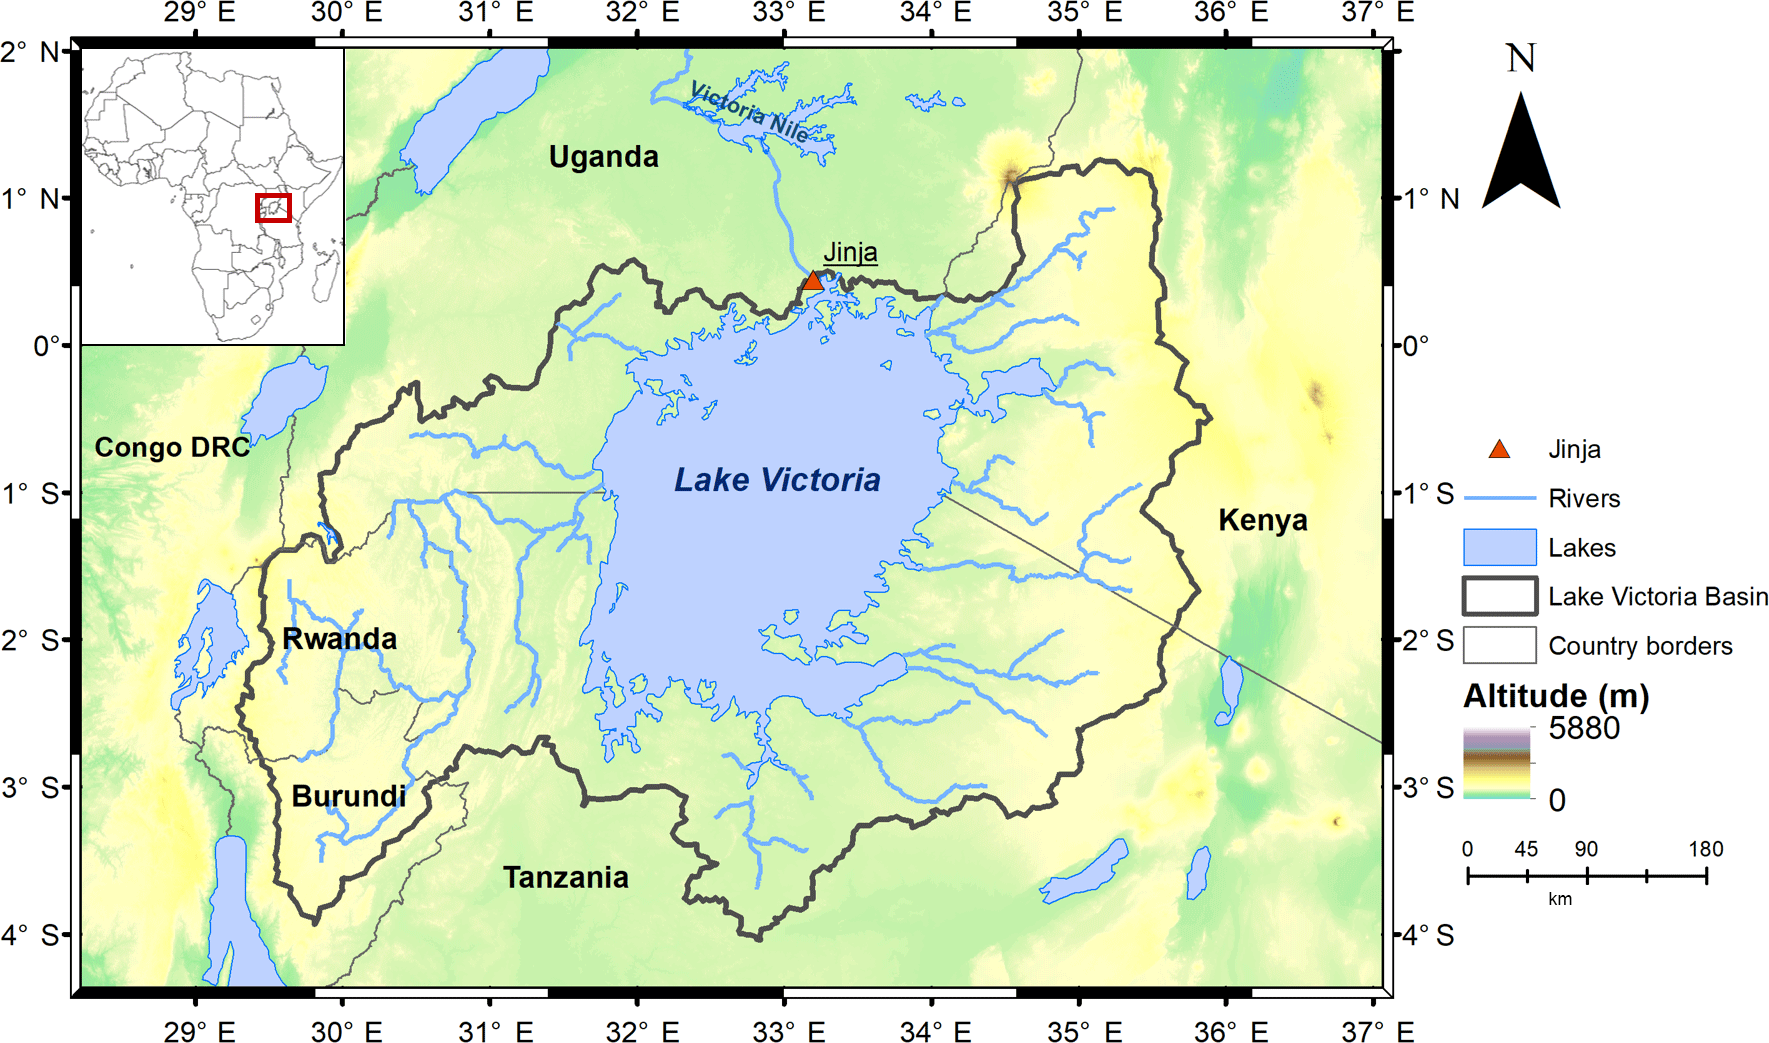
Figure 1Map of Lake Victoria and its basin with surface heights from the Shuttle Radar Topography Mission (SRTM).
Given the high societal importance, several studies have attempted to reconstruct historical variations in the water levels of Lake Victoria based on observations (Awange et al., 2007a; Hassan and Jin, 2014; Kite, 1981; Piper et al., 1986; Sene and Plinston, 1994; Swenson and Wahr, 2009; Tate et al., 2004; Yin and Nicholson, 1998). In these studies, the WB components are typically modelled using in situ observations from lake shore stations, whereas more recent studies use various remote sensing data. The most recurring aim of Lake Victoria WB models is to explain major changes in lake levels. However, these estimates are characterized by substantial uncertainties due to the lack of observations on the lake itself and the sparsity of in situ observations on land. Moreover, in most studies, one WB component is often directly or indirectly derived from the WB residual, which imposes a closure of the balance a priori. These limitations make it difficult to assess the role of the different WB terms on the one hand, and to force the WB model with other spatio-temporal data, like climate simulations, on the other hand.
In this first part of a two-paper series, we build an observational water balance model (WBM) to reconstruct the observed Lake Victoria water levels from in situ and high-quality satellite observations and a high-resolution reanalysis downscaling. For the first time, we independently calculate the individual WB components and evaluate the resulting lake level against observations obtained from satellite altimetry. Based on the observational WBM input, the role of the different terms within the WB is analysed. Next, the observational WBM is evaluated by comparing the calculated WB terms to values found in literature on the one hand and by comparing the resulting lake levels with the observed ones on the other.
Lake Victoria has a surface area of approximately 68 000 km2, spanning over two-thirds of its basin area (Awange et al., 2007a). Lake Victoria is a relatively shallow lake, with a mean depth of 40 m and a maximum depth up to 90 m. The Lake Victoria Basin spans over Uganda, Kenya, Tanzania, Rwanda and Burundi (Fig. 1). The lake levels of Lake Victoria fluctuated up to 3 m over the last 65 years (Fig. 2). The rapid rise in the years 1961–1964 could not be attributed to the construction of the dam in 1951, but is linked to unusual heavy precipitation in East Africa because a similar rise is observed in the levels of other African Great Lakes (Lake Albert, Malawi and Tanganyika) in the early 1960s (Kite, 1981). The lake level remained high after the rapid rise, which is consistent with sustained high rainfall amounts (Sene and Plinston, 1994). From 2004 to 2007, the lake level strongly dropped. This decline could be partially related to an increased outflow at the new dam complex (Kull, 2006; Sutcliffe and Petersen, 2007).
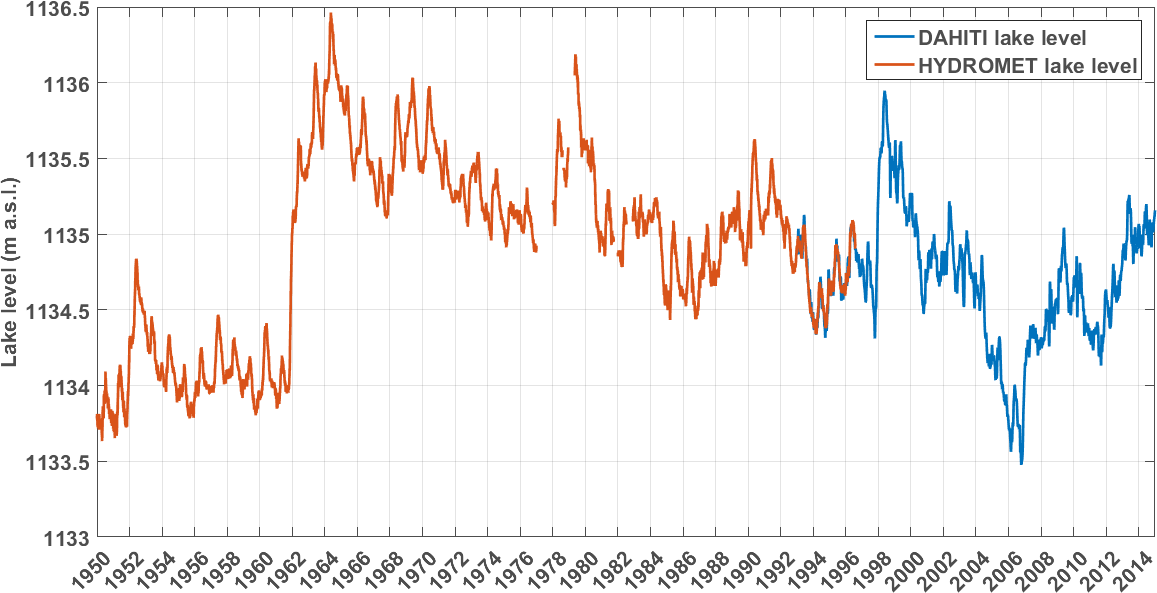
Figure 2Lake Victoria historical water levels: HYDROMET: in situ measurements from the World Meteorological Organization (WMO) hydrometeorological survey from 1950 to 1996 with data gaps in 1977, 1978, 1979, 1981 and 1982 (WMO, 1981), converted from measured lake depth at Jinja, to meters above sea level using the EIGEN-6c3stat geoid model. DAHITI satellite altimetry measurements from 1992 to 2014 (Schwatke et al., 2015).
2.1 Precipitation on the lake
Precipitation on the lake surface provides the largest part of the water input to Lake Victoria. The rainfall in the African Great Lakes region is mainly controlled by the annual migration of the Intertropical Convergence Zone (ITCZ; Nicholson, 1996). There are two main rainy seasons: the long rains during March, April and May, as a result of the northward progression of the ITCZ and the short rains during September, October and November, a result of the southward progression of the ITCZ (Williams et al., 2015; Yang et al., 2015). Next to the seasonal cycle, the lake precipitation has a remarkable diurnal cycle, as precipitation occurs mostly at night and during morning hours (Thiery et al., 2015).
All of this means that precipitation is not only the largest term in the WB but also the most variable (Yin and Nicholson, 1998). Onshore rain gauges are not capable of fully capturing the lake precipitation, as precipitation on the lake is enhanced compared to the surrounding land by the presence of the lake itself (Sene et al., 2018; Thiery et al., 2015). Previous WB studies accounted for this by rescaling onshore measured precipitation based on a relationship obtained by solving the WB for precipitation in a period when all other terms were known (Piper et al., 1986; Sene and Plinston, 1994; Tate et al., 2004), or by calculating lake precipitation from basin precipitation with a weighting factor based on a satellite analysis of cloud occurrence (Yin and Nicholson, 1998). More recent studies use satellite data for estimating precipitation on the lake, providing temporally and spatially homogeneous observations. In the Lake Victoria Basin, Awange et al. (2007b), Swenson and Wahr (2009) and Hassan and Jin (2014) used products of the Tropical Rainfall Measuring Mission (TRMM), which provides monthly precipitation rates.
2.2 Evaporation from the lake
Annual evaporation shows little change (Kite, 1981) and is often assumed to be constant in previous WBM studies (Kite, 1981; Piper et al., 1986; Sene and Plinston, 1994; Smith and Semazzi, 2014; Tate et al., 2004), as water availability is unlimited above a lake surface and near-surface air temperature in the tropics is assumed to be nearly constant. The seasonality of incoming radiation has only a little influence on the latent heat flux and resulting evaporation. Thiery et al. (2014a) showed that above Lake Kivu, located southwest of Lake Victoria, the incoming long-wave radiation and relative humidity drop in the main dry season from June to August due to a reduced cloudiness. In addition, due to the drop in relative humidity during the dry season there is a larger potential for evaporation (Thiery et al., 2014a). Monthly variations in downward short-wave radiation have only little effect on evaporation, as it is possible that the monthly variation in top-of-the-atmosphere incoming short-wave radiation is balanced out by monthly varying clouds, leading to more or less constant monthly incoming short-wave radiation at the surface (Thiery et al., 2014a). In early WB studies, it is not possible to differentiate between underestimations in precipitation and overestimations of evaporation. This makes the estimation of evaporation somewhat arbitrary. On the eastern shores of the lake, higher lake evaporation is recorded, while on the islands and western shore evaporation rates are lower (Lake Victoria Basin Commission, 2006).
Evaporation from the lake surface is typically calculated by the energy balance using bulk formulae for sensible and latent heat flux (Swenson and Wahr, 2009; Yin and Nicholson, 1998), or by Penman's equation (Piper et al., 1986; Yin and Nicholson, 1998). Both methods require multiple climatic input data, such as surface water temperature, surface vapour pressure, solar radiation, wind speed and cloudiness over the lake. Early WB calculations using the Penman method, like Piper et al. (1986), estimate these parameters based on lake shore station data and tend to make simplistic assumptions on the parameters (Yin and Nicholson, 1998). However, the calculation of evaporation is very sensitive to assumptions on the meteorological parameters. The various estimations for annual evaporation therefore range from 1350 to 1743 mm yr−1 (Piper et al., 1986; Sene and Plinston, 1994; Sutcliffe and Parks, 1999; Tate et al., 2004; Yin and Nicholson, 1998).
2.3 Lake inflow
Approximately 25 major rivers flow from the basin into Lake Victoria, contributing to the inflow in the lake. The largest tributary is the river Kagera in the southwest of the basin. The river contributes to around 30 % of the total inflow in the lake (Sutcliffe and Parks, 1999). Tributaries from the northeast, like the Nzoia, Yala, Sondu and Awach Kaboun, have a relatively fast runoff because they come from regions with a high and prolonged rainy season and steep slopes (Tate et al., 2004). The southeastern tributaries, like the Mara and the Mbalangeti, come from regions with lower rainfall and runoff, contributing to a greater variability in inflow (Tate et al., 2004). The region to the northwest contains a lot of wetlands and therefore contributes less runoff.
According to earlier WB studies, inflow from the basin accounts for 20 % of the total lake input, while direct precipitation on the lake accounts for 80 % (Awange et al., 2007a). River inflow was measured in different periods from the 1950s until the 1980s during an hydrometeorological survey initiated by the World Meteorological Organization (WMO, 1981). Based on the total runoff to the lake and the derived lake precipitation series, a relationship between runoff and lake precipitation was established. During periods when not all tributaries are measured, early studies used this relationship to estimate river inflow across the ungauged perimeter of the lake from over-lake precipitation (Kite, 1981; Piper et al., 1986; Sene and Plinston, 1994; Yin and Nicholson, 1998). Tate et al. (2004) derived inflow from lake precipitation with a parametrisation that calculates the inflow of five major tributaries from their catchment rainfall using a linear regression. The specific catchment precipitation in turn is calculated from the lake precipitation. The inflow of the five major tributaries is scaled up to represent the total inflow (Tate et al., 2004). Swenson and Wahr (2009) are the first to not only account for overland flow but also for baseflow in the WB of Lake Victoria. As direct observations of surface runoff by remote sensing techniques were not available, surface runoff is modelled proportional to the precipitation derived from satellite observations. Subsurface flow or baseflow, which can be related to groundwater storage, is calculated using data from the Gravity Recovery and Climate Experiment (GRACE) satellite mission.
2.4 Lake outflow
Lake Victoria's outlet is located at Jinja in Uganda and is since 1951 controlled by the Nalubaale dam complex. Since then, the outflow is regulated by the Agreed Curve, a rating curve relating lake level and outflow in natural conditions. This relation is quantified by Sene (2000) as
with Qout (m3 day−1) being the outflow and L (m day−1) being the lake level. This dam operating rule was closely followed until 2000, when increasing power demands in Uganda led to the construction of a second dam (called Kiira), parallel with the Nalubaale dam (Kull, 2006). The combination of the two dams facilitated a deviation from the Agreed Curve by releasing more water (Awange et al., 2007b; Kull, 2006; Sutcliffe and Petersen, 2007). Consequently, the lake outflow and lake level began to diverge, resulting in a declining lake level (Owor et al., 2011). Both Kull (2006) and Sutcliffe and Petersen (2007) pointed out that the measured fall in lake levels could be approximately 50 % attributed to over-release next to a decrease in rainfall amounts. Most WB studies calculate the outflow based on the Agreed Curve and lake levels measured at the Jinja dam (Piper et al., 1986; Sene and Plinston, 1994; Smith and Semazzi, 2014; Tate et al., 2004; Yin and Nicholson, 1998).
2.5 Uncertainty and limitations
In previous WB studies, the major source of uncertainty is attributed to different terms of the WB (Kite, 1981; Piper et al., 1986; Sene and Plinston, 1994; Smith and Semazzi, 2014; Swenson and Wahr, 2009; Tate et al., 2004; Yin and Nicholson, 1998). Here we quantify the uncertainty by computing the relative difference between the lowest and highest estimation of each WB term reported in previous studies. The uncertainty in the different WB terms ranges up to about 50 % for over-lake precipitation, 15 % for lake evaporation, 140 % for inflow and 20 % for outflow over different periods. The lack of in situ observations of lake precipitation, evaporation and inflow made it often almost impossible to close the WB independently from observed lake levels. More recent studies use satellite-derived precipitation estimates over the lake and its basin (Awange et al., 2007a; Hassan and Jin, 2014; Shamsudduha et al., 2017; Swenson and Wahr, 2009). However, major uncertainties in the quantification of the evaporation and inflow term still remain. To conclude, all these limitations mean that the WBM quality in previous studies is hard to assess, because it is often impossible to make an independent estimation from lake level observations. In this study, we therefore aim to separately compute the WB terms and evaluate the resulting lake level variations against independent observations.

Figure 3Daily outflow time series compiled from different data sources: monthly measurements for 1950 to 1997, digitized values from Lake Victoria Basin Commission (2006) for 2000 to 2004, daily measurements for 2004 to 2006, constant outflow at the 2006-value for 2006 to 2014, due to the lack of measurement data.
3.1 Precipitation data
Precipitation observations are retrieved from the Precipitation Estimation from Remotely Sensed Information using Artificial Neural Networks – Climate Data Record (PERSIANN-CDR), which provides daily precipitation for the period 1983–2015 at a 0.25∘ by 0.25∘ spatial resolution based on multi-satellite records (Ashouri et al., 2015). PERSIANN is considered the most reliable product providing precipitation estimates over the African continent (Awange et al., 2015). The precipitation over the lake and the basin is retrieved using shapefiles (Akurut et al., 2014).
3.2 Evaporation data
Yin and Nicholson (1998) and Swenson and Wahr (2009) denoted evaporation estimates as one of the largest sources of uncertainty in Lake Victoria's WB based on uncertainties related to the calculation method for evaporation due to the lack of in situ observations. However, in our uncertainty estimations using all reported values for the three WB terms, lake evaporation estimations have the smallest range. Global evaporation observation datasets like LandFlux-EVAL and the Global Land Evaporation Amsterdam Model (GLEAM) do not resolve evaporation above large water surfaces like Lake Victoria (Martens et al., 2017; Mueller et al., 2013). Therefore, evaporation is assessed by using the latent heat flux (LHF) output of the regional climate model COSMO-CLM2 (Davin and Seneviratne, 2012), of which the high-resolution downscaling (∼ 7 km) with the ERA-Interim reanalysis provides an adequate representation of the climate over and around the African Great Lakes (Delandmeter et al., 2018; Docquier et al., 2016; Jacobs et al., 2016, 2017, 2018; Thiery et al., 2015, 2016, 2017). Here, the annual evaporation climatology is estimated from daily LHF of the COSMO-CLM2 model output for 1996–2008 and applied to each year of the observational WB analysis period. In this model, the LHF is calculated using the interactive lake model FLake (Mironov, 2008) solving the mixed layer of constant temperature and underlying thermocline temperatures of the lake and providing a good representation of lake surface temperatures (Thiery et al., 2014a, b).
3.3 Outflow data
Measured outflow at the Nalubaale dam complex is a key variable for this study, but a complete time series could not be obtained. After 2000, the releases from the dam were higher than allowed according to the Agreed Curve. Because of these deviations from the political agreement between Egypt and Uganda, dam discharges are not publicly available (Kull, 2006). Therefore, a time series of outflow data is compiled from different data sources (Kull, 2006; Lake Victoria Basin Commission, 2006; Fig. 8) to use as outflow input in the WBM (Fig. 3). From 2006 on, there is no outflow data available. Therefore, outflow is kept constant at the last measured level to complete the time series. We also tested outflow values based on the Agreed Curve and constant outflow equal to the average outflow recorded over the period 1950 to 2006, but these approaches reduced the correspondence between modelled and observed lake levels during the period where no outflow values are available (2006–2014).
3.4 Inflow following the curve number method
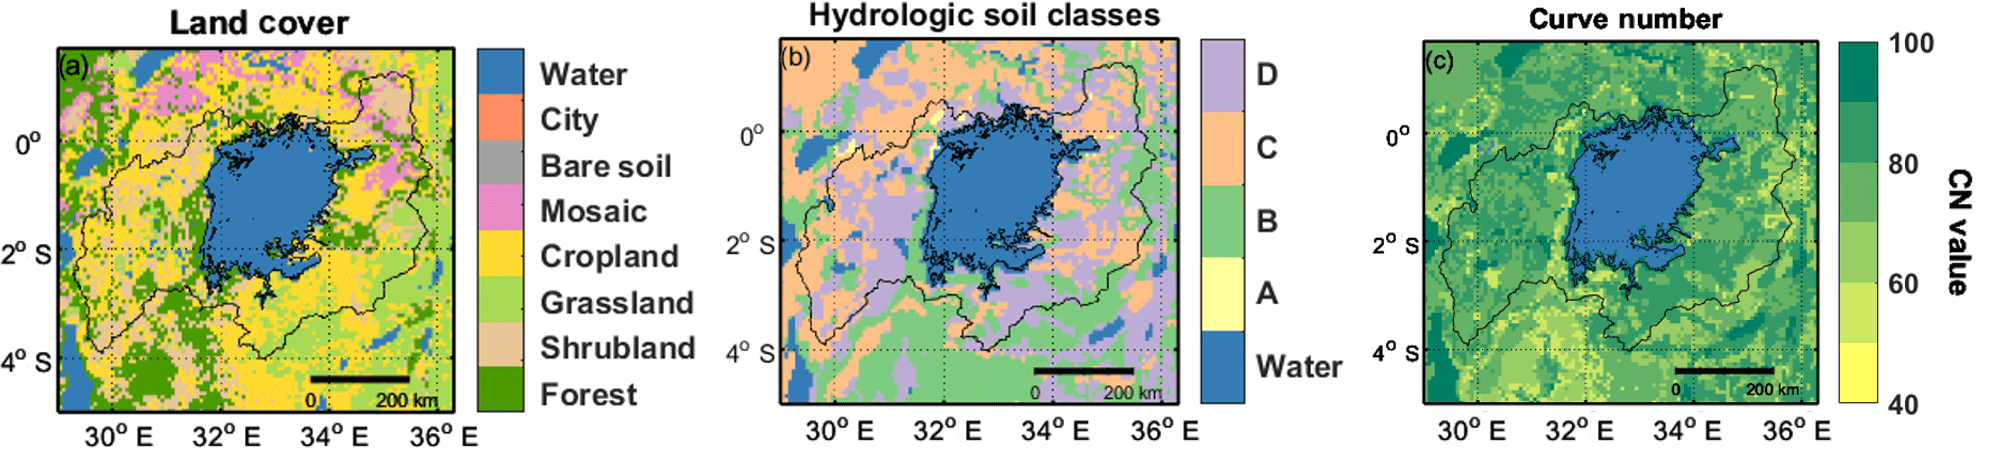
Inflow by tributary rivers is calculated using the Soil Conservation Service (also known as the Natural Resources Conservation Service) curve number method (NEH4, 2004a). This method relates daily precipitation P to daily runoff R through the CN, obtained based on an empirical model, with parameters associated with land use, hydrological soil types and antecedent hydrological conditions. It has been shown that simple runoff models like the CN method with a few input parameters can provide results that are at least as good as more complex rainfall–runoff models (Van den Putte et al., 2013). Here, the CN method is applied on a pixel level: each pixel (about 7 km by 7 km) is assigned a CN value based on the land cover and soil type of the pixel, after which the resulting pixel runoff is calculated based on the pixel precipitation. Land cover classes are derived from the Global Land Cover 2000 project (Mayaux et al., 2003; following Maetens, 2013; see Appendix for more details). For each pixel, a hydrological soil class is determined based on soil data from the Soil Atlas of Africa (Dewitte et al., 2013). Thirdly, the CN is dependent on the hydrological condition, which is taken into account by the antecedent moisture condition (AMC) based on the cumulative precipitation over the past 5 days (see Appendix). By implementing the AMC, the CN becomes time dependent. In the next step, the CN is used to calculate the maximum soil water retention parameter S (Eq. 2; NEH4, 2004b). Finally, the runoff Rd (m3 day−1) is calculated based on the daily precipitation Pd (m day−1) and maximum soil water retention parameter S (Eq. 3)
Total daily inflow is obtained by summing the calculated runoff of all basin pixels. As the pixels are large sized (about 7 km by 7 km), it can be assumed that pixel runoff leaves the pixel by flowing in water channels. This assumption means that runoff routing over the basin pixels is not necessary, as is the case with smaller pixel sizes (Moglen, 2001).
3.5 Water balance model
The most general way to represent the WB is given by
Looping over all days in the model period, each day dt the difference in lake level dL (m) is calculated based on the precipitation on the lake P (m day−1), evaporation of the lake E (m day−1) , inflow Qin (m3 day−1) and outflow Qout (m3 day−1) on that specific day. This difference in lake level is added to the lake level of the previous day. In this way, a lake level time series is modelled. The inflow and outflow are divided by the surface area of Lake Victoria (6.83 × 10¹⁰ m2) to convert their values from discharge (m3 day−1) to lake level changes (m day−1). In this WBM, the baseflow is assumed to be negligible. The daily precipitation and evaporation over the lake are calculated by taking the daily mean of the gridded precipitation and evaporation products over all lake grid cells. Next, the daily inflow is given by the total runoff in the basin, calculated with the CN method based on the precipitation in the lake basin, also derived from the precipitation data (Sect. 3.4). Finally, daily outflow is directly taken from the composed outflow series. All spatial variables are remapped to a predefined model grid, containing Lake Victoria and its basin at a resolution of 0.065∘ by 0.065∘ (about 7 by 7 km). The WBM integration is performed using observational data for the period 1993–2014, a 21-year period for which all observational products are available.
3.6 Evaluation data
The performance of the WBM is assessed by comparing the modelled water levels to observed water levels. Observed Lake Victoria water levels are retrieved from the open-access Database for Hydrological Time Series of Inland Waters (DAHITI; Schwatke et al., 2015). The water level time series are derived from multi-mission satellite altimetry and were processed using an extended outlier detection algorithm and a Kalman filter (Schwatke et al., 2015). Lake Victoria water levels are measured about 3 times per month from September 1992 until the present day in absolute heights with reference to the EIGEN-6c3stat geoid model (Schwatke et al., 2015). In addition, in situ lake level measurements from the WMO hydrometeorological survey are used (Kite, 1981; WMO, 1981). These data give the measured lake depth at Jinja, but can be converted to meters above sea level using the associated datum. The daily lake level series covers the period 1 January 1948 until 1 August 1996, with data gaps in the years 1977, 1978, 1979, 1981 and 1982. These data gaps are filled with linear interpolation. Both lake level datasets are plotted in Fig. 2 for the period 1950–2014. The lake levels overlap from September 1992 to August 1996. During this period they closely match, which justifies the use of both products together.
The WBM is forced with PERSIANN-CDR observations for lake precipitation, COSMO-CLM2 output for evaporation, measured outflow data and inflow calculated with the CN method based on basin precipitation from PERSIANN-CDR. First, the magnitude and seasonality of the different WB terms are assessed and compared to values from previous WB studies. Second, the role of the different terms in the WB and resulting lake levels is analysed. Finally, the WBM is evaluated by comparing the modelled lake levels to observed levels.
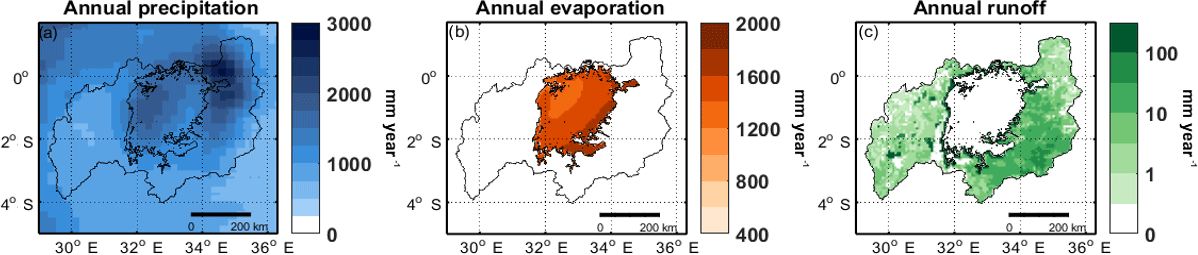
Figure 4Climatology from 1993 to 2014: annual precipitation derived from PERSIANN-CDR observations (a), evaporation from COSMO-CLM2 model output (b) and runoff calculated with the CN method based on PERSIANN-CDR precipitation observations (c).
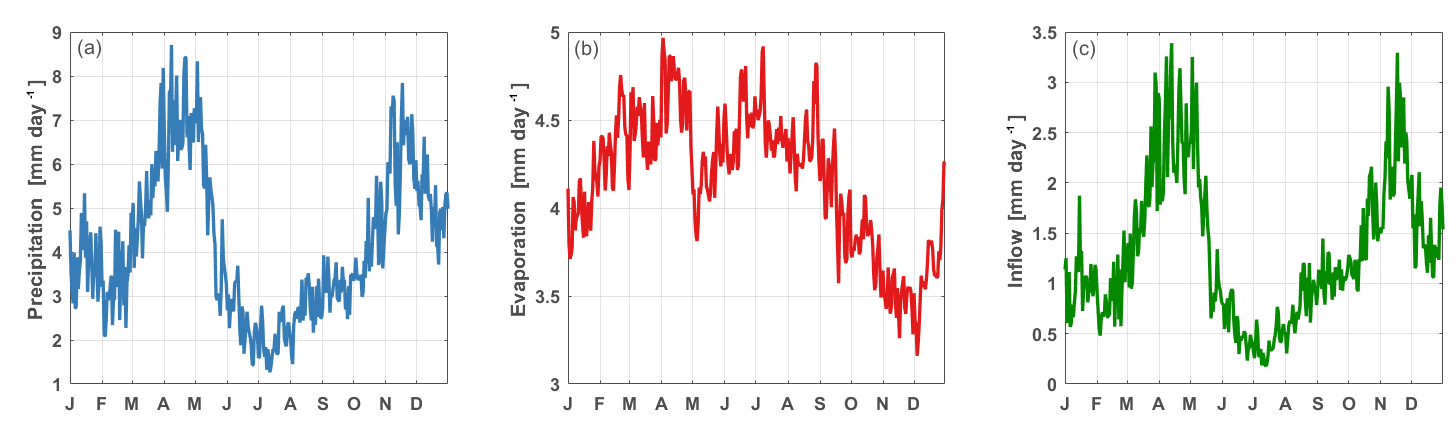
Figure 5Climatology from 1993 to 2014: annual cycle of precipitation derived from PERSIANN-CDR observations (a), evaporation from COSMO-CLM2 model output (b) and inflow calculated with the CN method based on PERSIANN-CDR precipitation observations (c).
4.1 Terms of the water balance
4.1.1 Lake precipitation
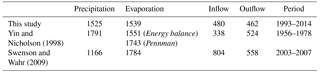
The spatial distribution of the mean annual precipitation reveals that the northeastern part of the catchment receives most precipitation, while the western part receives the least (Fig. 4a). The seasonal cycle of precipitation over the lake surface shows a bimodal distribution (Fig. 5a) with two distinct peaks during March–May and October–December corresponding to the two rainy seasons (Yang et al., 2015). The difference in precipitation between the dry and rainy seasons is high and can amount up to 8 mm day−1. Over the lake, a mean annual precipitation of 1525 mm yr−1 is recorded. This value lies in the broad range of values reported in the literature (Table 1). Yin and Nicholson (1998) calculated a value of 1791 mm yr−1 for the period 1956–1978, while Swenson and Wahr (2009) obtained a value of 1166 mm yr−1 using satellite data for the period 2003–2007. In this period, there was a drought over Lake Victoria and its basin, with falling lake levels as a consequence (Fig. 2). This can partly explain the lower precipitation value of Swenson and Wahr (2009). However, even if we calculate the mean annual precipitation over the lake from the PERSIANN-CDR data for the same period as Swenson and Wahr (2009), we still obtain a value which is substantially higher (1506 mm yr−1 from 2003 to 2007). The reason for these systematic differences could be attributed to the fact that Swenson and Wahr (2009) used TRMM observations with a monthly resolution. Compared to the daily PERSIANN-CDR dataset, TRMM may possibly underestimate precipitation.
Table 1Calculated mean annual water balance (WB) terms and values found in literature in mm yr−1 (inflow and outflow are given in mm yr−1 over the lake surface area).
4.1.2 Lake evaporation
Evaporation is not uniform over the lake, but ranges from higher values in the southeast to lower values in the northwest (Fig. 4b). This spatial pattern does not follow the pattern of observed lake temperature (Thiery et al., 2015), which is consistent with the idea that the spatial pattern of evaporation is primarily driven by the relative humidity rather than by near-surface air temperature (Thiery et al., 2014a, b). Moreover, the spatial pattern of evaporation could be explained by the advection of dry winds from the south (the Serengeti area). While blowing in a northwest direction over the lake, these winds take up more moisture. Likewise, their evaporation potential decreases.
The annual cycle of lake evaporation demonstrates a small drop in May and a minimum from October to December (Fig. 5b). Compared to the other WB terms, lake evaporation has a relatively low interannual variability. This justifies the decision to use the 10-year climatology for each year in the WB calculations. The mean annual evaporation over the lake is 1521 mm yr−1, which is consistent with the value of 1500 mm yr−1 reported in Korzoun et al. (1978) and the value of 1595 mm yr−1 calculated by Piper et al. (1986) and used in the studies of Sene and Plinston (1994) and Tate et al. (2004). Yin and Nicholson (1998) calculated evaporation values both with an energy balance approach (1551 mm yr−1) and with the Pennman method (1743 mm yr−1). By comparing the evaporation estimates with the evaporation calculated as residual from the WB, they concluded that the first estimation of 1551 mm yr−1 is the most reliable. Swenson and Wahr (2009) estimated an annual evaporation of 1784 mm yr−1 and stated that their estimate is closer to the second estimation (1743 mm year-1) of Yin and Nicholson (1998). However, the value calculated in this study (1521 mm yr−1) lies closest to the first estimation (1551 mm yr−1) of Yin and Nicholson (1998), which is in line with the previous studies (Table 1). Nevertheless, a complete comparison is not possible, as different study periods are considered and the calculation of evaporation is associated with large uncertainties. Furthermore, the spread in precipitation estimates appears to be larger (∼ 600 mm yr−1) than the spread in evaporation estimates (∼ 200 mm yr−1), which indicates that the uncertainty and temporal variability in lake precipitation estimates are higher than in lake evaporation estimates.
4.1.3 Inflow
Both the land cover map (Fig. 6a) and hydrological soil class map (Fig. 6b) are used to calculate the CN (Fig. 6c). The relatively high CNs could be attributed to an abundance of the hydrologic soil groups C and D, corresponding to a “moderately high” and “high” runoff potential in combination with a large area of cropland. Accordingly, most runoff is generated in the southwest of the Lake Victoria Basin (Fig. 4c). The spatial pattern of runoff does not correspond to the pattern of precipitation (Fig. 4a). This is due to the spatial difference in CN (Fig. 6c), which determine the amount of precipitation that results in runoff. The few runoff hot spots in the western part of the basin are water surfaces, of which it is assumed that all extra precipitation results in runoff. The shape of the annual cycle of the daily inflow is similar to the annual cycle of precipitation with the bimodal distribution representing the two rainy seasons (Fig. 5c), as the runoff is calculated based on the precipitation in the basin.
4.2 Observational water balance model
Precipitation over the lake and evaporation from the lake are the largest terms in the WB (Fig. 7). On monthly timescales, the variation in precipitation is much larger than the variation in evaporation (7.44 mm day−1 versus 1.8 mm day−1). As a consequence, monthly variations in precipitation have a much larger influence on lake levels both by lake precipitation and inflow than monthly variations in evaporation. However, the assumption of a constant annual evaporation (Piper et al., 1986; Sene and Plinston, 1994; Smith and Semazzi, 2014; Tate et al., 2004) is not completely justified, because evaporation does have a seasonal cycle. Inflow and outflow have the same mean magnitude, but a different seasonal cycle (Fig. 7). Since inflow is directly related to precipitation, it is not surprising that this term follows a similar seasonal variability as precipitation. The outflow is controlled by dam operations and is nearly constant throughout the year. The outflow, however, does change up to 266 % on interannual timescales (Fig. 3). The annual cycle of the WB residual reflects a bimodal variation of the precipitation and inflow term with positive values during the two rainy seasons (Fig. 7). The residual has a large variation on monthly timescales, similar to the variation in precipitation. On annual timescales, however, the residual is rather small, with an annual mean residual of 0.23 m yr−1.
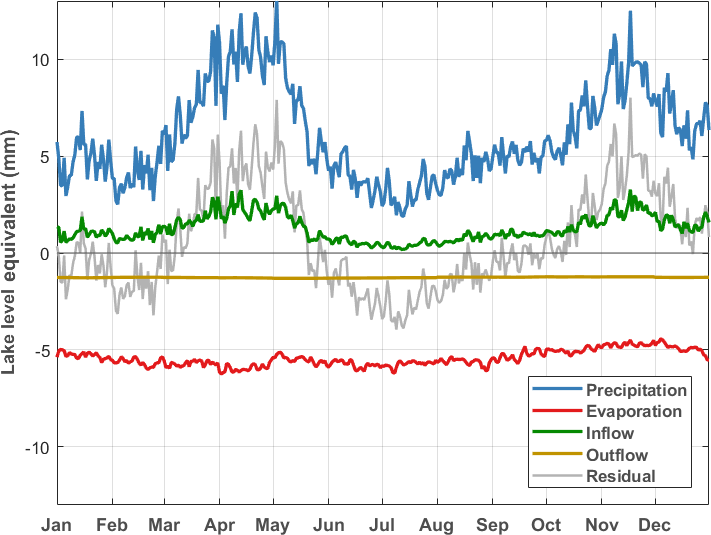
Figure 7Seasonal cycle of the water balance (WB) terms and residual for the period 1993–2014.
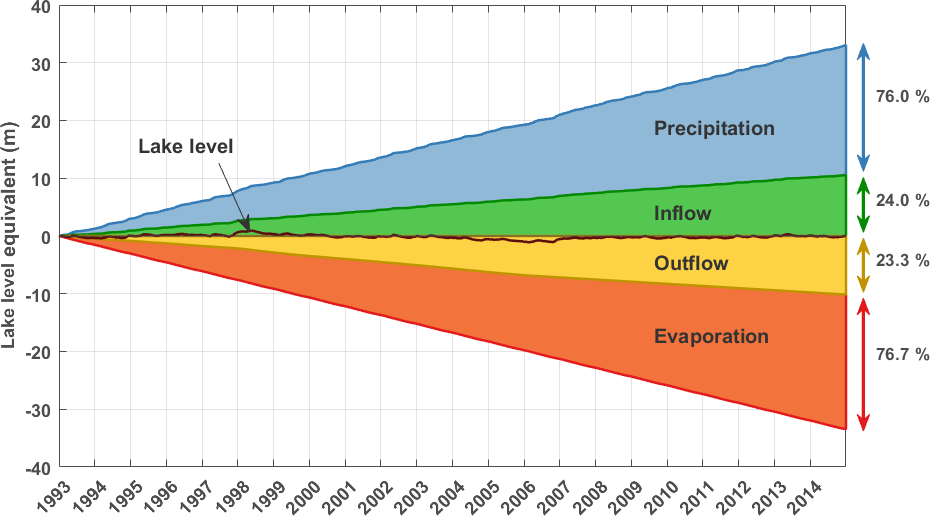
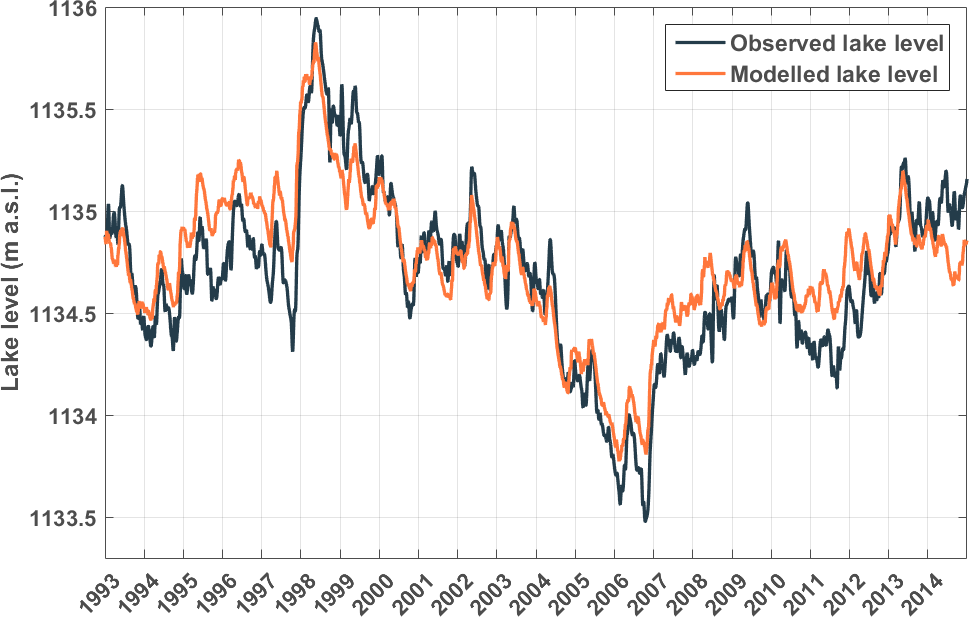

Figure 10Seasonal cycle of the modelled and observed lake levels for the period 1993 to 2014.
The annual mean values of precipitation and evaporation on the one hand and inflow and outflow on the other are similar in magnitude (Table 1). This similarity is reflected in an almost perfect symmetry when the cumulative terms are plotted for the observational period (Fig. 8). Accumulated over the 1993–2014 period, lake precipitation represents 76 % and lake inflow represents 24 % of the total input. This is more or less in line with Awange et al. (2007a) who stated that inflow accounts for 20 % of the lake refill. The total output accumulated over 1993 to 2014 consists of 77 % of lake evaporation and 23 % of lake outflow. The difference in the input and output terms results in lake level variations around the zero line. By adding the initial lake level, the variations in the absolute lake levels are reflected (Fig. 9).
The modelled lake level follows the observed lake level very well, notably representing the increase in 1998 and the severe drop in 2006–2007 (Fig. 9). From 2006, the modelled lake level slightly underestimates the lake level. This is likely due to the outflow values, which are not known from 2007 on, and which are set to the last known outflow measurement. Considering the magnitude of the net input and output terms of the WB (Fig. 8), a small bias in one of these terms could lead to large variations in the lake level. Moreover, no tuning is performed to match the WBM outcome to the observed lake levels. Taking these elements into account, the close correspondence of the observed and modelled lake levels is remarkable.
A similar correspondence is found in the seasonal cycle of the lake level (Fig. 10), with on average the highest accumulation rates observed around the end of May and the beginning of June and the highest water loss around the end of September and October. This behaviour is consistent with the seasonal cycle of the WB residual (Fig. 7): the lake level rises during the two rainy seasons (positive residual) and falls again during the dry seasons (negative residual). Likewise, as the annual variation in the WB residual is primarily driven by precipitation, its seasonality provides two seasonal recharges each year. The difference between the two accumulation peaks, the first around the end of January and the second around the end of May, can be attributed to the larger decrease during the main dry season in June, July and August than during the other dry season in February. Compared to the observed seasonal cycle, the modelled lake level change has a similar amplitude and phase, but lags the observed cycle by about half a month from mid-May until the beginning of February. This suggests that there is a certain retention period of the water in the basin during this part of the year, which is not taken into account in the WBM. Overall the amplitude of the seasonal cycle is small (less than 0.4 m) compared to the interannual variation of lake level fluctuations over the observational period (maximum difference up to 2.5 m). Interannual lake level fluctuations are mostly due to interannual differences in precipitation and outflow amounts, as evaporation is nearly constant each year of the observed period.
The severe decline in lake levels from 2004 until the end of 2005, can be attributed to a drought combined with an enhanced dam outflow. During 2004 and 2005, the annual precipitation amount decreases by 13 % compared to the mean precipitation during the whole study period. This decrease was part of a drought occurring in the entire region, leading to a decline in both lake levels as well as total water storage measured with GRACE in three of the African Great Lakes (Lake Victoria, Tanganyika and Malawi; Hassan and Jin, 2014). When the outflow follows the Agreed Curve (Eq. 1), dam releases are adjusted based on the current climatological conditions. If the Agreed Curve scenario would have been followed from 2004 until 2005, the outflow would have been 59 km3, instead of the observed 78 km3. Consequently, the lake level would have declined by only 0.35 m rather than the recorded 0.69 m. Accordingly, 52 % of the decline can be attributed to a drought over Lake Victoria and its basin. The remaining 48 % of lake level decline can be attributed to an enhanced dam outflow compared to the Agreed Curve protocol, as it is the only WB term that can be altered by human management. Kull (2006) did a similar analysis and found an average contribution of 55 % of increased dam outflow to the lake level changes in 2004 and 2005. Also, Sutcliffe and Petersen (2007) concluded that the measured lake level fall during the years 2000 to 2006 is about half due to over abstraction of lake outflow. Hence, these results support the findings in this study.
In previous studies, the CN method has been applied several times to calculate runoff depth on a pixel level (Akbari et al., 2016; Deshmukh et al., 2013; Ebrahimian et al., 2009; Kumar et al., 2016; Melesse and Shih, 2002). However, this is mostly done for smaller catchments than the Lake Victoria catchment and for pixel resolutions of around 30 m. To our knowledge, there is one study that assessed the mean annual runoff and spatial runoff depth in Tanzania (one of the countries adjacent to Lake Victoria) with the CN method with a very coarse resolution of at least 50 km by 50 km (Mdee, 2015). Apart from land cover and hydrologic soil group determined by the infiltration rate, the study used four additional parameters to calculate the CN. They performed a small evaluation of the used method by comparing the resulting runoff map with a secondary runoff map obtained by a probability distribution model based on annual rainfall data and concluded that the model efficiency varies strongly over the area. However, a thorough evaluation analysis of the CN method on the coarse pixel level was lacking. To fully justify the use of the CN method in this study, the skill of the CN method could be assessed by evaluating the resulting runoff using spatial runoff data from another source, like observation-based gridded runoff estimates with global coverage, which may become available in the future (Gudmundsson and Seneviratne, 2016).
Despite the high skill of the observational WBM, the way of constructing input terms has still several limitations. First, the use of the COSMO-CLM2 model data means that the WBM is not entirely based on observations, but also uses model data as input. As evaporation observations over the lake surface are lacking, COSMO-CLM2 currently represents the best option for obtaining reliable evaporation estimates. By using the interactive lake model FLake and a boundary-layer scheme based on Monin–Obukhov similarity theory, COSMO-CLM2 provides a calculation of the LHF over the lake which is more advanced than the methods used to calculate evaporation until now. Second, by using a static land cover map for the year 2000 to calculate the CN, potential effects of land cover changes are not included in the inflow calculation. Land cover changes can have a significant impact on the CNs and associated inflow (Deshmukh et al., 2013; Melesse and Shih, 2002). Finally, the WBM does not account for baseflow contributing to the inflow. By relating baseflow to groundwater storage based on data from GRACE, Swenson and Wahr (2009) concluded that subsurface flow may be as important as surface runoff, contributing even slightly more to the inflow during their study period (2003–2007). They calculated a larger annual value for evaporation, which lies more closely to the second estimate of Yin and Nicholson (1998) (Table 1), and recorded a lower precipitation compared to the estimates of this study and Yin and Nicholson (1998), which means that their WB is also approximately closed. Owor et al. (2011), on the other hand, estimated the groundwater flow to account for less then 1 % of the total input (lake precipitation and inflow) based on in situ hydrogeological groundwater observations. Moreover, considering that the WB is almost perfectly closed in this study, the assumption of a negligible baseflow appears to be justified. Future research could focus on the sensitivity of the observational WBM, by feeding the model with other input datasets, e.g. SOILGRIDS (Hengl et al., 2014, 2017) to determine the hydrologic soil group, TRMM products (Kummerow et al., 2000) and products from the Global Precipitation Climatology Project (Huffman et al., 2001).
State-of-the-art satellite observations, a high-resolution reanalysis downscaling and outflow values recorded at the dam permitted the construction of a water balance model providing the lake level fluctuations of Lake Victoria. Lake levels are calculated on a daily basis based on over-lake precipitation from the PERSIANN-CDR remote sensing product, lake evaporation from COSMO-CLM2 reanalysis model output, inflow calculated with the curve number method based on PERSIANN-CDR basin precipitation and outflow recorded at the dam.
By quantifying the four water balance terms, we found values that lie in the broad range of values reported in literature. Our results indicate that precipitation and evaporation are the most important terms with 76 % of the input and 77 % of the output, respectively. Inflow accounts for 24 % of the input and outflow for 23 % of the output. Lake level fluctuations are mainly caused by precipitation over Lake Victoria and its basin and by dam outflow. The annual cycle of precipitation with two distinct rainy seasons is reflected in lake level variations on monthly time-scales, by causing the lake level to rise from May to July and to fall from August to December. Dam outflow, controlled by human operations, plays an important role on interannual timescales. This could be illustrated by the lake level drop in 2004 and 2005, of which 52 % is due to a drought and 48 % due to an enhanced dam outflow compared to the Agreed Curve imposed by human operations. Finally, the comparison between the modelled and remotely sensed lake levels revealed that the constructed water balance model is able to closely represent the observed lake level fluctuations and seasonal cycle of Lake Victoria.
Here, the WB of Lake Victoria is modelled based on spatio-temporal data and independently from lake level observations. A major advantage of this approach is that it is now possible to force the WBM with climate simulations for the future, which show a decrease in annual precipitation amounts over Lake Victoria (Souverijns et al., 2016). In the second part of this two-paper series, future projections of the evolution of Lake Victoria's lake level are made for the first time (Vanderkelen et al., 2018). These projections are especially relevant given the high societal importance of the future behaviour of the water levels. Changes in the water levels can have far reaching consequences for the people living in the basin, water availability downstream in the Nile Basin and for estimating the future potential for hydropower generation.
The WBM code is publicly available at https://github.com/VUB-HYDR/2018_Vanderkelen_etal_HESS_ab (Vanderkelen, 2018). PERSIANN-CDR data are freely available from NOAA (https://www.ncdc.noaa.gov/cdr/atmospheric/precipitation-persiann-cdr), the soil map from the Soil Atlas of Africa (https://ec.europa.eu/jrc/en/publication/books/soil-atlas-africa), GLC2000 data from the JRC of the European Commission (http://forobs.jrc.ec.europa.eu/products/glc2000/glc2000.php), DAHITI lake level data from the Technical University of Munich (http://dahiti.dgfi.tum.de/en/). Lake evaporation data from the COSMO-CLM2 model output and the HYDROMET lake level series are available upon request.
The CN method is calculated based on the land cover, hydrological soil class and antecedent moisture condition. This section gives the detailed methodology for determining the CN method of each pixel in the study area. The original GLC 2000 land cover classes are grouped and reclassified in more general classes (see Table A1). Each of these general classes are subsequently coupled to a corresponding land cover class with known CNs (see Table A2). This coupling is based on the classification of Maetens (2013) who reclassified similar land cover classes into CN classes. The hydrological soil groups (Table A3) are defined based on soil data from the Soil Atlas of Africa (Dewitte et al., 2013), classified according to the World Reference Base soil classification and converted to hydrological soil group based on Table A4. Using Table A5 based on the land cover and hydrological soil group, the CNs are determined for all pixels in the lake basin. Next to land cover and soil type, the CN is also dependent on the hydrological condition of a certain pixel. This is taken into account by the antecedent moisture condition (AMC), ranging from AMC I (dry) to AMC III (wet) (Ponce and Hawkins, 1996). The AMC of a certain pixel is determined based on the cumulative precipitation of the 5 past days, as defined in Table A6 (Descheemaeker et al., 2008). In case of dry or wet conditions (AMC I or III), the CN is converted using Eqs. (A1) and (A2), where CNII presents the first (default) calculated CN (Ponce and Hawkins, 1996).
Table A4Reclassification of World Reference Base (WRB) soil types to Hydrological Soil Groups (HSG).
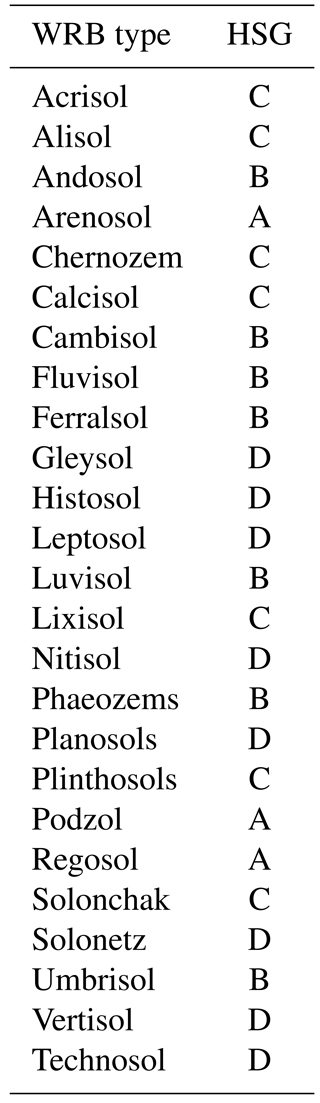
Table A5CN for CN land cover classes and Hydrologic Soil Groups.
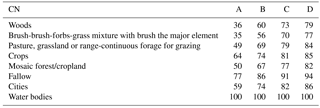
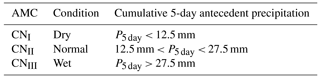
Table A6Antecedent moisture condition (AMC; based on Descheemaeker et al., 2008).
IV, NPMvL and WT designed the study. IV performed the analysis and wrote the manuscript. All authors commented on the manuscript.
The authors declare that they have no conflict of interest.
This article is part of the special issue “Modelling lakes in the climate system (GMD/HESS inter-journal SI)”. It is a result of the 5th workshop on “Parameterization of Lakes in Numerical Weather Prediction and Climate Modelling”, Berlin, Germany, 16–19 October 2017.
We thank Daniel Kull for providing the daily outflow measurements of Lake
Victoria and John Sutcliffe for his contributions. We also thank Willy Bauwens
for sharing the HYDROMET lake level measurements and Seppe Deckers for the help
with the classification of the hydrologic soil groups. Furthermore, we acknowledge
the CLM community (clm-community.eu) for developing COSMO CLM2 and making
the model code available. Computational resources and services used for the
COSMO-CLM2 simulations were provided by the VSC (Flemish Supercomputer
Center), funded by the Hercules Foundation and the Flemish Government department EWI.
Wim Thiery was supported by an ETH Zurich postdoctoral fellowship (Fel-45 15-1).
The Uniscientia Foundation and the ETH Zurich Foundation are thanked for their
support to this research.
Edited by: Miguel Potes
Reviewed by: two anonymous referees
Akbari, A., Samah, A. A., and Daryabor, F.: Raster-based derivation of a flood runoff susceptibility map using the revised runoff curve number (CN) for the Kuantan watershed, Malaysia, Environ. Earth Sci., 75, 1379, https://doi.org/10.1007/s12665-016-6186-0, 2016. a
Akurut, M., Willems, P., and Niwagaba, C.: Potential Impacts of Climate Change on Precipitation over Lake Victoria, East Africa, in the 21st Century, Water, 6, 2634–2659, https://doi.org/10.3390/w6092634, 2014. a
Ashouri, H., Hsu, K. L., Sorooshian, S., Braithwaite, D. K., Knapp, K. R., Cecil, L. D., Nelson, B. R., and Prat, O. P.: PERSIANN-CDR: Daily precipitation climate data record from multisatellite observations for hydrological and climate studies, B. Am. Meteorol. Soc., 96, 69–83, https://doi.org/10.1175/BAMS-D-13-00068.1, 2015. a
Awange, J. L., Ogalo, L., Bae, K. H., Were, P., Omondi, P., Omute, P., and Omullo, M.: Falling Lake Victoria water levels: Is climate a contributing factor?, Climatic Change, 89, 281–297, https://doi.org/10.1007/s10584-008-9409-x, 2007a. a, b, c, d, e
Awange, J. L., Sharifi, M. A., Ogonda, G., Wickert, J., Grafarend, E. W., and Omulo, M. A.: The falling lake Victoria water level: GRACE, TRIMM and CHAMP satellite analysis of the lake basin, Water Resour. Manage., 22, 775–796, https://doi.org/10.1007/s11269-007-9191-y, 2007b. a, b
Awange, J. L., Ferreira, V. G., Forootan, E., Khandu, Andam-Akorful, S. A., Agutu, N. O., and He, X. F.: Uncertainties in remotely sensed precipitation data over Africa, Int. J. Climatol., 36, 303–323, https://doi.org/10.1002/joc.4346, 2015. a
Database for Hydrological Time Series of Inland Waters (DAHITI): available at: https://dahiti.dgfi.tum.de/en/, last access: 8 May 2018.
Davin, E. L. and Seneviratne, S. I.: Role of land surface processes and diffuse/direct radiation partitioning in simulating the European climate, Biogeosciences, 9, 1695–1707, https://doi.org/10.5194/bg-9-1695-2012, 2012. a
Delandmeter, P., Lambrechts, J., Legat, V., Vallaeys, V., Naithani, J., Thiery, W., Remacle, J.-F., and Deleersnijder, E.: A fully consistent and conservative vertically adaptive coordinate system for SLIM 3D v0.4 with an application to the thermocline oscillations of Lake Tanganyika, Geosci. Model Dev., 11, 1161–1179, https://doi.org/10.5194/gmd-11-1161-2018, 2018. a
Descheemaeker, K., Poesen, J., Borselli, L., Nyssen, J., Raes, D., Haile, M., Muys, B., and Deckers, J.: Runoff curve numbers for steep hillslopes with natural vegetation in semi-arid tropical highlands, northern Ethiopia, Hydrol. Process., 22, 2267–2274, https://doi.org/10.1002/hyp.7011, 2008. a, b
Deshmukh, D. S., Chaube, U. C., Ekube Hailu, A., Aberra Gudeta, D., and Tegene Kassa, M.: Estimation and comparision of curve numbers based on dynamic land use land cover change, observed rainfall–runoff data and land slope, J. Hydrol., 492, 89–101, https://doi.org/10.1016/j.jhydrol.2013.04.001, 2013. a, b
Dewitte, O., Jones, A., Spaargaren, O., Breuning-Madsen, H., Brossard, M., Dampha, A., Deckers, J., Gallali, T., Hallett, S., Jones, R., Kilasara, M., Le Roux, P., Michéli, E., Montanarella, L., Thiombiano, L., Van Ranst, E., Yemefack, M., and Zougmore, R.: Harmonisation of the soil map of Africa at the continental scale, Geoderma, 211–212, 138–153, https://doi.org/10.1016/j.geoderma.2013.07.007, 2013. a, b
Docquier, D., Thiery, W., Lhermitte, S., and van Lipzig, N.: Multi-year wind dynamics around Lake Tanganyika, Clim. Dynam., 47, 3191–3202, https://doi.org/10.1007/s00382-016-3020-z, 2016. a
Ebrahimian, M., See, L., Malek, I. A., and Ismail, M. H.: Application of Natural Resources Conservation Service-curve number method for runoff estimation with GIS in the Kardeh watershed, Iran, Eur. J. Scient. Res., 34, 575–590, 2009. a
GitHub WBM code: available at: https://github.com/VUB-HYDR/2018_Vanderkelen_etal_HESS_ab, last access: 8 May 2018.
Global Land Cover 2000: available at: http://forobs.jrc.ec.europa.eu/products/glc2000/glc2000.php, last access: 8 May 2018.
Gudmundsson, L. and Seneviratne, S. I.: Observation-based gridded runoff estimates for Europe (E-RUN version 1.1), Earth Syst. Sci. Data, 8, 279–295, https://doi.org/10.5194/essd-8-279-2016, 2016. a
Hassan, A. A. and Jin, S.: Lake level change and total water discharge in East Africa Rift Valley from satellite-based observations, Global Planet. Change, 117, 79–90, https://doi.org/10.1016/j.gloplacha.2014.03.005, 2014. a, b, c, d
Hengl, T., de Jesus, J. M., MacMillan, R. A., Batjes, N. H., Heuvelink, G. B. M., Ribeiro, E., Samuel-Rosa, A., Kempen, B., Leenaars, J. G. B., Walsh, M. G., and Gonzalez, M. R.: SoilGrids1km – Global Soil Information Based on Automated Mapping, PLoS ONE, 9, e105992, https://doi.org/10.1371/journal.pone.0105992, 2014. a
Hengl, T., Mendes de Jesus, J., Heuvelink, G. B. M., Ruiperez Gonzalez, M., Kilibarda, M., Blagotić, A., Shangguan, W., Wright, M. N., Geng, X., Bauer-Marschallinger, B., Guevara, M. A., Vargas, R., MacMillan, R. A., Batjes, N. H., Leenaars, J. G. B., Ribeiro, E., Wheeler, I., Mantel, S., and Kempen, B.: SoilGrids250m: Global gridded soil information based on machine learning, PLOS ONE, 12, e0169748, https://doi.org/10.1371/journal.pone.0169748, 2017. a
Huffman, G. J., Adler, R. F., Morrissey, M. M., Bolvin, D. T., Curtis, S., Joyce, R., McGavock, B., and Susskind, J.: Global Precipitation at One-Degree Daily Resolution from Multisatellite Observations, J. Hydrometeorol., 2, 36–50, https://doi.org/10.1175/1525-7541(2001)002<0036:GPAODD>2.0.CO;2, 2001. a
Jacobs, L., Maes, J., Mertens, K., Sekajugo, J., Thiery, W., van Lipzig, N., Poesen, J., Kervyn, M., and Dewitte, O.: Reconstruction of a flash flood event through a multi-hazard approach: focus on the Rwenzori Mountains, Uganda, Nat. Hazards, 84, 851–876, https://doi.org/10.1007/s11069-016-2458-y, 2016. a
Jacobs, L., Dewitte, O., Poesen, J., Maes, J., Mertens, K., Sekajugo, J., and Kervyn, M.: Landslide characteristics and spatial distribution in the Rwenzori Mountains, Uganda, J. Afr. Earth Sci., 134, 917–930, https://doi.org/10.1016/j.jafrearsci.2016.05.013, 2017. a
Jacobs, L., Dewitte, O., Poesen, J., Sekajugo, J., Nobile, A., Rossi, M., Thiery, W., and Kervyn, M.: Field-based landslide susceptibility assessment in a data-scarce environment: The populated areas of the Rwenzori Mountains, Nat. Hazards Earth Syst. Sci., 18, 105–124, https://doi.org/10.5194/nhess-18-105-2018, 2018. a
Kite, G. W.: Recent changes in level of lake victoria, Hydrolog. Sci. Bull., 26, 233–243, https://doi.org/10.1080/02626668109490883, 1981. a, b, c, d, e, f, g
Korzoun, V. I., Sokolov, A. A., Budyko, M. I., and Voskresensky, K. P.: World Water Balance and Water Resources of the Earth: Atlas, Unesco Press, Paris, 1978. a
Kull, D.: Connections Between Recent Water Level Drops in Lake Victoria, Dam Operations and Drought, Daniel Kull, Nairobi, available at: https://www.internationalrivers.org/sites/default/files/attached-files/full_report_pdf.pdf, 2006. a, b, c, d, e, f, g
Kumar, P. S., Praveen, T. V., and Prasad, M. A.: Rainfall–Runoff Modelling using Modified NRCS-CN, RS and GIS – A Case Study, Journal of Engineering Research and Applications, 6, 54–58, 2016. a
Kummerow, C., Simpson, J., Thiele, O., Barnes, W., Chang, A. T. C., Stocker, E., Adler, R. F., Hou, A., Kakar, R., Wentz, F., Ashcroft, P., Kozu, T., Hong, Y., Okamoto, K., Iguchi, T., Kuroiwa, H., Im, E., Haddad, Z., Huffman, G., Ferrier, B., Olson, W. S., Zipser, E., Smith, E. A., Wilheit, T. T., North, G., Krishnamurti, T., and Nakamura, K.: The Status of the Tropical Rainfall Measuring Mission (TRMM) after Two Years in Orbit, J. Climate, 39, 1965–1982, 2000. a
Lake Victoria Basin Commission: Special Report on the Declining of Water Levels of Lake Victoria, East African Community Secretariat, Arusha, available at: https://www.oieau.org/eaudoc/system/files/documents/41/208894/208894_doc.pdf, 1–15, 2006. a, b, c
Maetens, W.: Effectiveness of land use and soil conservation techniques in reducing runoff and soil loss in Europe and the Mediterranean, Ph.D. thesis, KU Leuven, Groep Wetenschap & Technologie, Arenberg Doctoraatsschool, Leuven, 298 pp., March 2013. a, b, c
Martens, B., Miralles, D. G., Lievens, H., Van Der Schalie, R., De Jeu, R. A., Fernández-Prieto, D., Beck, H. E., Dorigo, W. A., and Verhoest, N. E.: GLEAM v3: Satellite-based land evaporation and root-zone soil moisture, Geosci. Model Dev., 10, 1903–1925, https://doi.org/10.5194/gmd-10-1903-2017, 2017. a
Mayaux, P., Massart, M., Cutsem, C. V., Cabral, A., Nonguierma, A., Diallo, O., Pretorius, C., Thompson, M., Cherlet, M., Defourny, P., Vasconcelos, M., Gregorio, A. D., Grandi, G. D., and Belward, A.: A land cover map of Africa. Carte de l'occupation du sol de l'Afrique, Office for Official Publications of the European Communities, Luxembourg, 2003. a
Mdee, O. J.: Spatial distribution of runoff in ungauged catchments in Tanzania, Water Util. J., 9, 61–70, 2015. a
Melesse, A. M. and Shih, S. F.: Spatially distributed storm runoff depth estimation using Landsat images and GIS, Comput. Electron. Agr., 37, 173–183, https://doi.org/10.1016/S0168-1699(02)00111-4, 2002. a, b
Mironov, D. V.: Parameterization of Lakes in Numerical Weather Prediction. Description of a Lake Model, COSMO Technical Report 11, Offenbach am Main, 47 pp., 2008. a
Moglen, G. E.: Effect of orientation of spatially distributed curve numbers in runoff calculations, J. Am. Water Resour. Assoc., 36, 1391–1400, 2001. a
Mueller, B., Hirschi, M., Jimenez, C., Ciais, P., Dirmeyer, P. A., Dolman, A. J., Fisher, J. B., Jung, M., Ludwig, F., Maignan, F., Miralles, D. G., McCabe, M. F., Reichstein, M., Sheffield, J., Wang, K., Wood, E. F., Zhang, Y., and Seneviratne, S. I.: Benchmark products for land evapotranspiration: LandFlux-EVAL multi-data set synthesis, Hydrol. Earth Syst. Sci., 17, 3707–3720, https://doi.org/10.5194/hess-17-3707-2013, 2013. a
NEH4: Hydrologic Soil-Cover Complexes, in: National Engineering Handbook Part 630 Hydrology, chap. 9, United States Department of Agriculture (USDA) – Natural Resources Conservation Service (NRCS), Washington DC, p. 14, 2004a. a
NEH4: Estimation of Direct Runoff from Storm Rainfall, in: National Engineering Handbook Part 630 Hydrology, chap. 10, United States Department of Agriculture (USDA) – Natural Resources Conservation Service (NRCS), Washington DC, p. 50, 2004b. a
Nicholson, S.: A review of climate dynamics and climate variability in Eastern Africa, Springer, Dordrecht, 1996. a
Owor, M., Taylor, R., Mukwaya, C., and Tindimugaya, C.: Groundwater/surface–water interactions on deeply weathered surfaces of low relief: Evidence from Lakes Victoria and Kyoga, Uganda, Hydrogeol. J., 19, 1403–1420, https://doi.org/10.1007/s10040-011-0779-1, 2011. a, b
Piper, B. S., Plinston, D. T., and Sutcliffe, J. V.: The water balance of lake victoria, Hydrolog. Sci. J., 31, 25–37, https://doi.org/10.1080/02626668609491025, 1986. a, b, c, d, e, f, g, h, i, j, k
Precipitation-PERSIANN-CDR: available at: https://www.ncdc.noaa.gov/cdr/atmospheric/precipitation-persiann-cdr, last access: 8 May 2018.
Ponce, V. M. and Hawkins, R. H.: Runoff Curve Number: Has It Reached Maturity?, J. Hydrol. Eng., 1, 11–19, https://doi.org/10.1061/(ASCE)1084-0699(1996)1:1(11), 1996. a, b
Schwatke, C., Dettmering, D., Bosch, W., and Seitz, F.: DAHITI – An innovative approach for estimating water level time series over inland waters using multi-mission satellite altimetry, Hydrol. Earth Syst. Sci., 19, 4345–4364, https://doi.org/10.5194/hess-19-4345-2015, 2015. a, b, c, d
Semazzi, F. H. M.: Enhancing Safety of Navigation and Efficient Exploitation of Natural Resources over Lake Victoria and Its Basin by Strengthening Meteorological Services on the Lake, North Carolina State University Climate Modeling Laboratory Tech. Rep., available at: http://climlab02. meas.ncsu.edu/HYVIC/Final_Report_LVBC.pdf, p. 104, 2011. a, b, c
Sene, K., Tych, W., and Beven, K.: Exploratory studies into seasonal flow forecasting potential for large lakes, Hydrol. Earth Syst. Sci., 22, 127–141, https://doi.org/10.5194/hess-22-127-2018, 2018. a
Sene, K. J.: Theoretical estimates for the influence of Lake Victoria on flows in the upper White Nile, Hydrolog. Sci. J., 45, 125–145, https://doi.org/10.1080/02626660009492310, 2000. a
Sene, K. J. and Plinston, D. T.: A review and update of the hydrology of lake victoria in east africa, Hydrolog. Sci. J., 39, 47–63, https://doi.org/10.1080/02626669409492719, 1994. a, b, c, d, e, f, g, h, i, j
Shamsudduha, M., Taylor, R. G., Jones, D., Longuevergne, L., Owor, M., and Tindimugaya, C.: Recent changes in terrestrial water storage in the Upper Nile Basin: An evaluation of commonly used gridded GRACE products, Hydrol. Earth Syst. Sci., 21, 4533–4549, https://doi.org/10.5194/hess-21-4533-2017, 2017. a
Smith, K. A. and Semazzi, F. H. M.: The Role of the Dominant Modes of Precipitation Variability over Eastern Africa in Modulating the Hydrology of Lake Victoria, Adv. Meteorol., 1–11, https://doi.org/10.1155/2014/516762, 2014. a, b, c, d
Soil Atlas of Africa: available at: https://ec.europa.eu/jrc/en/publication/books/soil-atlas-africa, last access: 8 May 2018.
Souverijns, N., Thiery, W., Demuzere, M., and van Lipzig, N. P. M.: Drivers of future changes in East African precipitation Drivers of future changes in East African precipitation, Environ. Res. Lett., 11, 114011, https://doi.org/10.1088/1748-9326/11/11/114011, 2016. a
Sutcliffe, J. V. and Parks, Y.: The Hydrology of the Nile, IAHS Spec. Publ., 5, 192, 1999. a, b
Sutcliffe, J. V. and Petersen, G.: Lake Victoria: derivation of a corrected natural water level series, Hydrolog. Sci. J., 52, 1316–1321, https://doi.org/10.1623/hysj.52.6.1316, 2007. a, b, c, d
Swenson, S. and Wahr, J.: Monitoring the water balance of Lake Victoria, East Africa, from space, J. Hydrol., 370, 163–176, https://doi.org/10.1016/j.jhydrol.2009.03.008, 2009. a, b, c, d, e, f, g, h, i, j, k, l, m
Tate, E., Sutcliffe, J., Conway, D., and Farquharson, F.: Water balance of Lake Victoria: update to 2000 and climate change modelling to 2100, Hydrolog. Sci. J., 49, 563–574, https://doi.org/10.1623/hysj.49.4.563.54422, 2004. a, b, c, d, e, f, g, h, i, j, k, l
Taye, M. T., Ntegeka, V., Ogiramoi, N. P., and Willems, P.: Assessment of climate change impact on hydrological extremes in two source regions of the Nile River Basin, Hydrol. Earth Syst. Sci., 15, 209–222, https://doi.org/10.5194/hess-15-209-2011, 2011. a
Thiery, W., Martynov, A., Darchambeau, F., Descy, J.-P., Plisnier, P.-D., Sushama, L., and Van Lipzig, N. P. M.: Understanding the performance of the FLake model over two African Great Lakes, Geosci. Model Dev, 7, 317–337, https://doi.org/10.5194/gmd-7-317-2014, 2014a. a, b, c, d, e
Thiery, W., Stepanenko, V. M., Fang, X., Jöhnk, K. D., Li, Z., Martynov, A., Perroud, M., Subin, Z. M., Darchambeau, F., Mironov, D., and Van Lipzig, N. P. M.: LakeMIP Kivu: evaluating the representation of a large, deep tropical lake by a set of one-dimensional lake models, Tellus A, 66, 21390, https://doi.org/10.3402/tellusa.v66.21390, 2014b. a, b
Thiery, W., Davin, E. L., Panitz, H.-J., Demuzere, M., Lhermitte, S., and van Lipzig, N.: The Impact of the African Great Lakes on the Regional Climate, J. Climate, 28, 4061–4085, https://doi.org/10.1175/JCLI-D-14-00565.1, 2015. a, b, c, d
Thiery, W., Davin, E. L., Seneviratne, S. I., Bedka, K., Lhermitte, S., and Van Lipzig, N. P.: Hazardous thunderstorm intensification over Lake Victoria, Nat. Commun., 7, 12786, https://doi.org/10.1038/ncomms12786, 2016. a
Thiery, W., Gudmundsson, L., Bedka, K., Semazzi, F. H., Lhermitte, S., Willems, P., Van Lipzig, N. P., and Seneviratne, S. I.: Early warnings of hazardous thunderstorms over Lake Victoria, Environ. Res. Lett., 12, 2–5, https://doi.org/10.1088/1748-9326/aa7521, 2017. a
Van den Putte, A., Govers, G., Leys, A., Langhans, C., Clymans, W., and Diels, J.: Estimating the parameters of the Green-Ampt infiltration equation from rainfall simulation data: Why simpler is better, J. Hydrol., 476, 332–344, https://doi.org/10.1016/j.jhydrol.2012.10.051, 2013. a
Vanderkelen, I.: Water Balance Model for Lake Victoria, https://doi.org/10.5281/zenodo.1464820, 2018. a
Vanderkelen, I., Van Lipzig, N. P. M., and Thiery, W.: Modelling the water balance of Lake Victoria (East Africa) – Part 2: Future projections, Hydrol. Earth Syst. Sci., 22, 5527–5549, https://doi.org/10.5194/hess-22-5527-2018, 2018. a
Williams, K., Chamberlain, J., Buontempo, C., and Bain, C.: Regional climate model performance in the Lake Victoria basin, Clim. Dynam., 44, 1699–1713, https://doi.org/10.1007/s00382-014-2201-x, 2015. a
WMO: Hydrometeorological survey of the catchments of lakes Victoria, Kyoga and Mobutu Sese Seko, Tech. rep., Geneva, 1981. a, b, c
Yang, W., Seager, R., Cane, M. A., Lyon, B., Yang, W., Seager, R., Cane, M. A., and Lyon, B.: The Annual Cycle of East African Precipitation, J. Climate, 28, 2385–2404, https://doi.org/10.1175/JCLI-D-14-00484.1, 2015. a, b
Yin, X. and Nicholson, S.: The water balance of Lake Victoria, Hydrolog. Sci. J., 43, 789–811, https://doi.org/10.1080/02626669909492277, 1998. a, b, c, d, e, f, g, h, i, j, k, l, m, n, o, p, q