the Creative Commons Attribution 4.0 License.
the Creative Commons Attribution 4.0 License.
 | 18 Sep 2018
Speculations on the application of foliar 13C discrimination to reveal groundwater dependency of vegetation and provide estimates of root depth and rates of groundwater use
Rizwana Rumman
James Cleverly
Rachael H. Nolan
Tonantzin Tarin
Groundwater-dependent vegetation is globally distributed, having important ecological, social, and economic value. Along with the groundwater resources upon which it depends, this vegetation is under increasing threat through excessive rates of groundwater extraction.
In this study we examined one shallow-rooted and two deep-rooted tree species at multiple sites along a naturally occurring gradient in depth-to-groundwater. We measured (i) stable isotope ratios of leaves (δ13C), xylem, and groundwater (δ2H and δ18O); and (ii) leaf-vein density. We established that foliar discrimination of 13C (Δ13C) is a reliable indicator of groundwater use by vegetation and can also be used to estimate rooting depth. Through comparison with a continental-scale assessment of foliar Δ13C, we also estimated the upper limits to annual rates of groundwater use. We conclude that maximum rooting depth for both deep-rooted species ranged between 9.4 and 11.2 m and that annual rates of groundwater use ranged from ca. 1400 to 1700 mm for Eucalyptus camaldulensis and from 600 to 900 mm for Corymbia opaca. Several predictions about hydraulic and leaf traits arising from the conclusion that these two species made extensive use of groundwater were supported by additional independent studies of these species in central Australia.
- Article
(2677 KB) - Full-text XML
-
Supplement
(1218 KB) - BibTeX
- EndNote


Drylands cover 41 % of the earth's total land area (Reynolds et al., 2007) and are sub-categorized as hyper-arid, arid, semi-arid, and dry sub-humid areas. Hyper-arid, arid, and semi-arid regions are characterized by chronic water shortage with unpredictable rainfall (Clarke, 1991). Approximately 40 % of the world's population reside in drylands and groundwater represents a major water resource not only for human consumptive use, but also for groundwater-dependent ecosystems (GDEs, Eamus et al., 2006). Sustainable management of both groundwater and GDEs requires identification of the location of GDEs, rooting depth of vegetation, and rates of groundwater use, but attaining such information presents significant technical and cost challenges (Eamus et al., 2015).
Approximately 70 % of Australia is classified as semi-arid or arid (Eamus et al., 2006; O'Grady et al., 2011). Furthermore, annual potential evaporation exceeds annual rainfall across most of the continent; thus, most Australian biomes are water-limited according to the Budyko (1974) framework (Donohue et al., 2009). On average, central Australia receives less than 350 mm year−1 of rainfall, making water a primary limiting resource (Eamus et al., 2006). Because surface water bodies in this region are mostly ephemeral (NRETAS, 2009, although see Box et al., 2008, regarding the small number of permanent water bodies), groundwater plays an important role in maintaining ecosystem structure and function of terrestrial (especially riparian) vegetation (Eamus et al., 2006). Owing to the remoteness of much of Australia's interior, few studies have investigated groundwater use by vegetation communities in these semi-arid regions.
Stomatal conductance is regulated to maximize carbon gain whilst simultaneously minimizing transpiration (Cowan and Farquhar, 1977; Medlyn et al., 2011) and is sensitive to both soil and atmospheric water content (Prior et al., 1997; Thomas and Eamus, 1999). Intrinsic water-use efficiency (WUEi), defined by the ratio of carbon gain to stomatal conductance, provides valuable insights into how vegetation responds to variation in water availability (Beer et al., 2009). Declining water supply results in increased WUEi as stomatal conductance declines (Eamus et al., 2013). Discrimination against the 13C isotope (Δ13C) is commonly used to calculate WUEi. Δ13C provides a time-integrated measure of WUEi (Cernusak et al., 2011); in this study we examined spatial and seasonal patterns in Δ13C across three tree species in the Ti Tree basin.
The present study was undertaken in the Ti Tree basin, which is the location of an important groundwater resource in central Australia (Cook et al., 2008a). Rainfall occurs mostly in large events during the austral summer (December–March); thus, there is minimal rainfall available for vegetation use over prolonged periods. The dry season in this region is characterized by declining soil water availability and high vapour pressure deficits (Eamus et al., 2013). Previous studies have documented several surprising attributes for a number of tree species in Ti Tree. O'Grady et al. (2009) observed that, despite living in an extremely water-limited environment, the specific leaf area (SLA) of Corymbia opaca and Eucalytptus camaldulensis was similar more to those from highly mesic environments than to species from arid environments. Similarly, Santini et al. (2016) observed that xylem wall thickness and vessel implosion resistance were significantly smaller in E. camaldulensis and C. opaca than in shallow-rooted Acacia aneura. Finally, differences in rates of water use and changes in midday water potential between the end of the wet season and the end of the dry season were minimal for E. camaldulensis and C. opaca, but were very large for Acacia aptaneura (which was previously classified as Acacia aneura; Maslin and Reid, 2012; Nolan et al., 2017). A. aneura and A. aptaneura often intermix with other members of the large Mulga complex of closely related Acacia species (Wright et al., 2016); thus, we will refer to Acacia spp. in the Mulga complex by the primary type, A. aneura. A. aneura is shallow-rooted and associated with shallow hard pans in this catchment (ca. 1 m below ground surface; Cleverly et al., 2016a, b), which prevents access to the groundwater below. E. camaldulensis is a riparian species, confined to narrow corridors along the ephemeral streams in Ti Tree (the Woodforde River and Allungra Creek) where groundwater depth is shallow (<3 m); C. opaca is deep-rooted and may access groundwater to depths of 8 m or more (O'Grady et al., 2009). These observations lead to the first hypothesis tested in the present study: that WUEi of A. aneura would be significantly larger than that of E. camaldulensis and C. opaca because reliance on shallow stores of water by Acacia spp. imposes severe restrictions on water use, thus resulting in a large WUEi.
Vertical (i.e. elevation) and horizontal distance from rivers receiving groundwater inflows in arid zones influences the degree to which trees access groundwater (O'Grady et al., 2006a; Thorburn et al., 1994). Trees closest to the river (i.e. elevationally and horizontally) have xylem water deuterium and 18O isotope ratios (δ2H and 18O, respectively) that are close to the ratios of river and groundwater; trees further from the river have xylem water ratios increasingly different from those of groundwater and the river (O'Grady et al., 2006a). In endorheic basins like Ti Tree, evaporation of near-surface soil water imposes additional fractionation of δ2H and 18O (Craig, 1961) relative to groundwater; thus, δ2H and δ18O in xylem provide information on plant water source and climate (Cullen and Grierson, 2007). Variation in plant water sources with distance from the river can affect stomatal conductance and WUEi. In this study we tested the hypothesis that WUEi would increase with distance from the creek.
Differential access to water among co-occurring species within a biome results in variation of several morphological traits, including SLA (Warren et al., 2005), Huber value (Eamus et al., 2000; Sperry, 2000), and wood density (Bucci et al., 2004; Hacke et al., 2000). Leaf-vein density (LVD) is a trait that influences whole-plant performance. From a resource investment perspective, leaves are composed primarily of two components: mesophyll that undertakes photosynthesis and a leaf-vein network which delivers water and nutrients to the leaf. Investment in leaf veins is underpinned by resource allocation strategies (Niinemets et al., 2006, 2007; Niklas et al., 2007). Leaf-vein density is responsive to several environmental variables, but especially aridity (Uhl and Mosbrugger, 1999). Furthermore, LVD is positively correlated with leaf hydraulic conductance (Kleaf), maximum photosynthetic rate, and leaf-level gas-exchange rates (Brodribb et al., 2007; Sack et al., 2003; Sack and Frole, 2006; Sack and Holbrook, 2006). Consequently we investigate whether investment in LVD of three dominant overstorey tree species was affected by increasing depth-to-groundwater (DTGW).
The propensity for leaves to lose water matches the capacity of xylem to deliver the same volume of water (Brodribb and Holbrook, 2007; Meinzer and Grantz, 1990; Sperry, 2000), and positive correlations consequently occur between leaf-hydraulic conductance (Kleaf) and LVD (Brodribb et al., 2007; Sack and Holbrook, 2006). LVD provides a direct estimate of Kleaf because it correlates with the distance water must traverse from termini of the xylem network to sites of evaporation (Brodribb et al., 2010). Since transpiration is directly linked to availability of water to roots, we hypothesized that LVD will be correlated with depth-to-groundwater in plants for which groundwater is accessible; this correlation should be absent in species with shallow roots which cannot access groundwater. Whilst a number of studies have demonstrated increased LVD with increasing aridity along rainfall gradients (Brodribb et al., 2010; Brodribb and Holbrook, 2003; Sack and Holbrook, 2006), this relationship has not, to our knowledge, been examined in relation to DTGW. Finally, because LVD is strongly correlated with Kleaf and rates of leaf-scale gas exchange (Brodribb et al., 2007; Sack et al., 2003; Sack and Frole, 2006), we hypothesize that LVD will be significantly correlated with Δ13C (and hence WUEi).
To summarize, we address the following questions.
-
Does access to groundwater by E. camaldulensis and C. opaca result in significantly smaller WUEi compared to A. aneura?
-
Does LVD correlate with DTGW in the three species examined?
-
Is there a correlation between LVD and Δ13C (and hence WUEi) for the three species examined?
-
Does horizontal and vertical (i.e. elevational) distance from a known river flood-out zone influence foliar Δ13C and WUEi of co-occurring species?
-
Can foliar Δ13C be used as an indicator of utilization of groundwater by vegetation of arid regions?
-
Can foliar Δ13C be used to estimate rooting depth and upper and lower bounds of rates of groundwater use?
2.1 Site description
The study was conducted in the Ti Tree basin, a 5500 km2 basin located approximately 200 km north of Alice Springs (NT) and 180 km north of the Tropic of Capricorn (22.28∘ S, 1933.25∘ E, 549 m a.s.l.). Climate is characterized as tropical and arid with hot summers and warm winters. The nearest Bureau of Meteorology station (Territory Grape Farm; Met Station 015643; within 25 km of all study sites) recorded mean and median annual precipitation of 319.9 and 29 mm, respectively (1987–May 2016; http://www.bom.gov.au/, last access: April 2018). Of the annual median rainfall, 72 % falls during the summer months (December–February) and 86 % falls during the monsoon season (November–April). Mean minimum and maximum monthly temperatures range from 5 and 22.6 ∘C in July to 22 and 37.5 ∘C in January.
The soil is a “red kandosol” (74 : 11 : 15, sand : silt : clay; Eamus et al., 2013), typical of large portions of semi-arid Australia, and has a high potential for drainage (Morton et al., 2011; Schmidt et al., 2010). Patches of hard siliceous soil are often observed and are likely surface expressions of the underlying hardpan (Cleverly et al., 2013), a common formation in the top 1–1.5 m in this type of soil (Cleverly et al., 2013, 2016a, b; Morton et al., 2011). The major potable source of water for this region is a large underground reservoir, recharged mainly by seepage from creek/river channels and their flood-out zones, “mountain” front recharge, and occasional very heavy rainfall events (NRETAS, 2009; Calf et al., 1991). The Ti Tree basin has a natural gradient in DTGW. The depth of the water table below ground level is shallow (<2 m) in the northern part and groundwater is lost through evapotranspiration (Shanafield et al., 2015), whereas DTGW reaches 60 m in the southern and western parts of the basin and 20–40 m in the eastern region (NRETA, 2007).
All study sites were characterized as being in one of three distinct vegetation types (Nolan et al., 2017; Cleverly et al., 2016a): (1) riparian, predominantly consisting of Eucalyptus camaldulensis var. obtusa, which line the banks of the ephemeral streams in the Ti Tree basin (Woodforde River and Allungra Creek); (2) low mixed woodland (A. aneura F. Muell. ex Benth., A. aptaneura Maslin & J. E. Reid, A. kempeana F. Muell.) with an understorey of shrubs, herbs, and C3 and C4 grasses; (3) tall, open Corymbia savanna with extensive Spinifex grass (Triodia spp.), sparse Corymbia opaca (D. J. Carr & S. G. M.Carr) K. D. Hill & L. A. S. Johnson trees, and occasional Acacia spp. trees. The Woodforde River and Allungra Creek are ephemeral streams that flow only after large extensive rainfall events. Nonetheless, perched aquifers beneath their riparian corridors are recharged by large storms (Villeneuve et al., 2015), providing long-term access to groundwater near ephemeral streams. Allungra Creek and its flood-out zone represent zones of local recharge (NRETAS, 2009). Overbank flooding and sheet flow occur in flood-outs where the Woodforde River and Allungra Creek enter the basin and split into a network of smaller channels (NRETA, 2007), resulting in an estimated 1.8 ML (megaliters) of groundwater recharge per year (NRETAS, 2009).
Table 1A summary of plots, transects, and spot measurements undertaken in the present study.
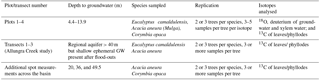
Four sampling plots (see the map in the Supplement) were established for determination of foliar Δ13C and of δ18O and δ2H values for xylem water and groundwater from a nearby bore. DTGW in each of the four plots was 4.4, 8.3, 8.8, and 13.9 m, respectively. One of the four plots was located on the banks of the Woodforde River (plot 1, DTGW = 4.4 m). E. camaldulensis is the dominant tree species in plot 1, and C. opaca is also present. In the second plot, A. aneura is the dominant species (plot 2, DTGW = 8.3 m). C. opaca is the dominant tree species in the two remaining plots (plot 3, DTGW = 8.8 m; plot 4, 13.9 m).
Δ13C of E. camaldulensis, C. opaca, and A. aneura were examined along three additional transects to investigate the influence of topography and of distance from a creek on WUEi. The three transects were established perpendicularly to the banks of Allungra Creek, which is in an area of known groundwater recharge at the base of the hills that bound the southern extent of the basin (NRETAS, 2009). One of the three transects was located near a permanent water hole near the flood-out and the bottom of Allungra Creek. Transects two and three were 1–2 km upstream of the water hole. Transects extended from the creek bank within 1 m of the creek up to a maximum of 1800 m from the creek (vertical, that is, elevational, distance from the creek bed ranged from 0 to 4 m), across which vegetation graded from riparian forest to Corymbia open savanna, with occasional Acacia spp. trees interspersed throughout.
In addition to the four plots and three transects, “spot sampling” for foliar Δ13C alone was performed at three sites to extend the examination of variation in WUEi to 20, 36, and 49.5 m DTGW for A. aneura or 20 and 36 m for C. opaca. Finally, continental sampling of foliar Δ13C of multiple dominant tree species was undertaken at seven sites distributed across Australia (Table S1 in the Supplement; Karan et al., 2016; Rumman et al., 2017) in order to allow comparison of foliar Δ13C of our three Ti Tree species with a continental-scale regression of Δ13C with rainfall. A summary of the isotopes analysed for each species and for each groundwater sampling undertaken, for each site, is given in Table 1.
2.2 Leaf sampling protocols and meteorology
Sampling was undertaken in April 2014 (end of the wet season) and September 2013 (end of the dry season). Three mature, healthy leaves on each of three branches from two or three replicate trees were sampled for Δ13C in all plots, transects, and spot sampling sites. In addition, terminal branches of the trees in the four plots were collected for deuterium and δ18O analyses of xylem water. Bore water samples were also collected in the four plots and the three spot sampling sites using groundwater samples were also collected from the bores located at each site using a HydraSleeve no-purge groundwater sampler (Cordry, 2003). Sampling along the three transects occurred at three or four points along each transect. The three trees of each of the dominant species at each location were located within 50 m of the bore. Leaves for leaf-vein analysis (see below) were collected during September 2013.
Climate conditions preceding and during the sampling periods were obtained from two eddy-covariance towers (Fluxnet sites AU-ASM and AU-TTE; Cleverly et al., 2016a; Cleverly, 2011, 2013). AU-ASM is located to the west of the Ti Tree at the spot sampling site where DTGW is 49.5 m. AU-TTE is located near the eastern edge of the Ti Tree in plot 3 where DTGW is 8.8 m.
2.3 Stable isotope analyses: deuterium, δ18O and foliar Delta13C
Branch xylem water was extracted by cryogenic vacuum distillation (whereby samples are subject to a vacuum and water vapour is frozen using liquid nitrogen, as described in Ingraham and Shadel, 1992; West et al., 2006). Water from each branch sample was extracted for a minimum of 60–75 min (West et al., 2006). δ2H and δ18O analyses of branch water and groundwater were performed using a Picarro L2120-i Analyser for Isotopic H2O. Five laboratory standards were calibrated against IAEA VSMOW2 – SLAP2 scale (Vienna Standard Mean Ocean Water 2, VSMOW2: δ18O =0 ‰ and δ2H =0 ‰; Standard Light Antarctic Precipitation 2, SLAP2: δ18O ‰ and δ2H ‰) and Greenland Ice Sheet Precipitation (GISP, δ18O ‰ and δ2H ,‰) as quality control references (IAEA, 2009). The standard deviation of the residuals between the VSMOW2 – SLAP2 value of the internal standards and the calculated values based on best linear fits was ca. 0.2 ‰ for δ18O and ca. 1.0 ‰ for δ2H.
2.4 Carbon isotope ratios of leaves
Leaf samples stored in paper bags were completely dried in an oven at 60 ∘C for 5 days. After drying, each leaf sample was finely ground to powder with a Retsch MM300 bead grinding mill (Verder Group, Netherlands) until homogeneous. Between 1 and 2 mg of ground material was sub-sampled in 3.5 mm × 5 mm tin capsules for analysis of the stable carbon isotope ratio (δ13C), generating three representative independent values per tree. All δ13C analyses were performed in a Picarro G2121-i Analyser (Picarro, Santa Clara, CA, USA) for isotopic CO2. Atropine and acetanilide were used as laboratory standard references. Results were normalized with the international standards sucrose (IAEA-CH-6, δ13C ‰), cellulose (IAEA-CH-3, δ13C ‰) and graphite (USGS24, δ13C ‰). The standard deviation of the residuals between IAEA standards and calculated values of δ13C based on best linear fit was ca. 0.5 ‰.
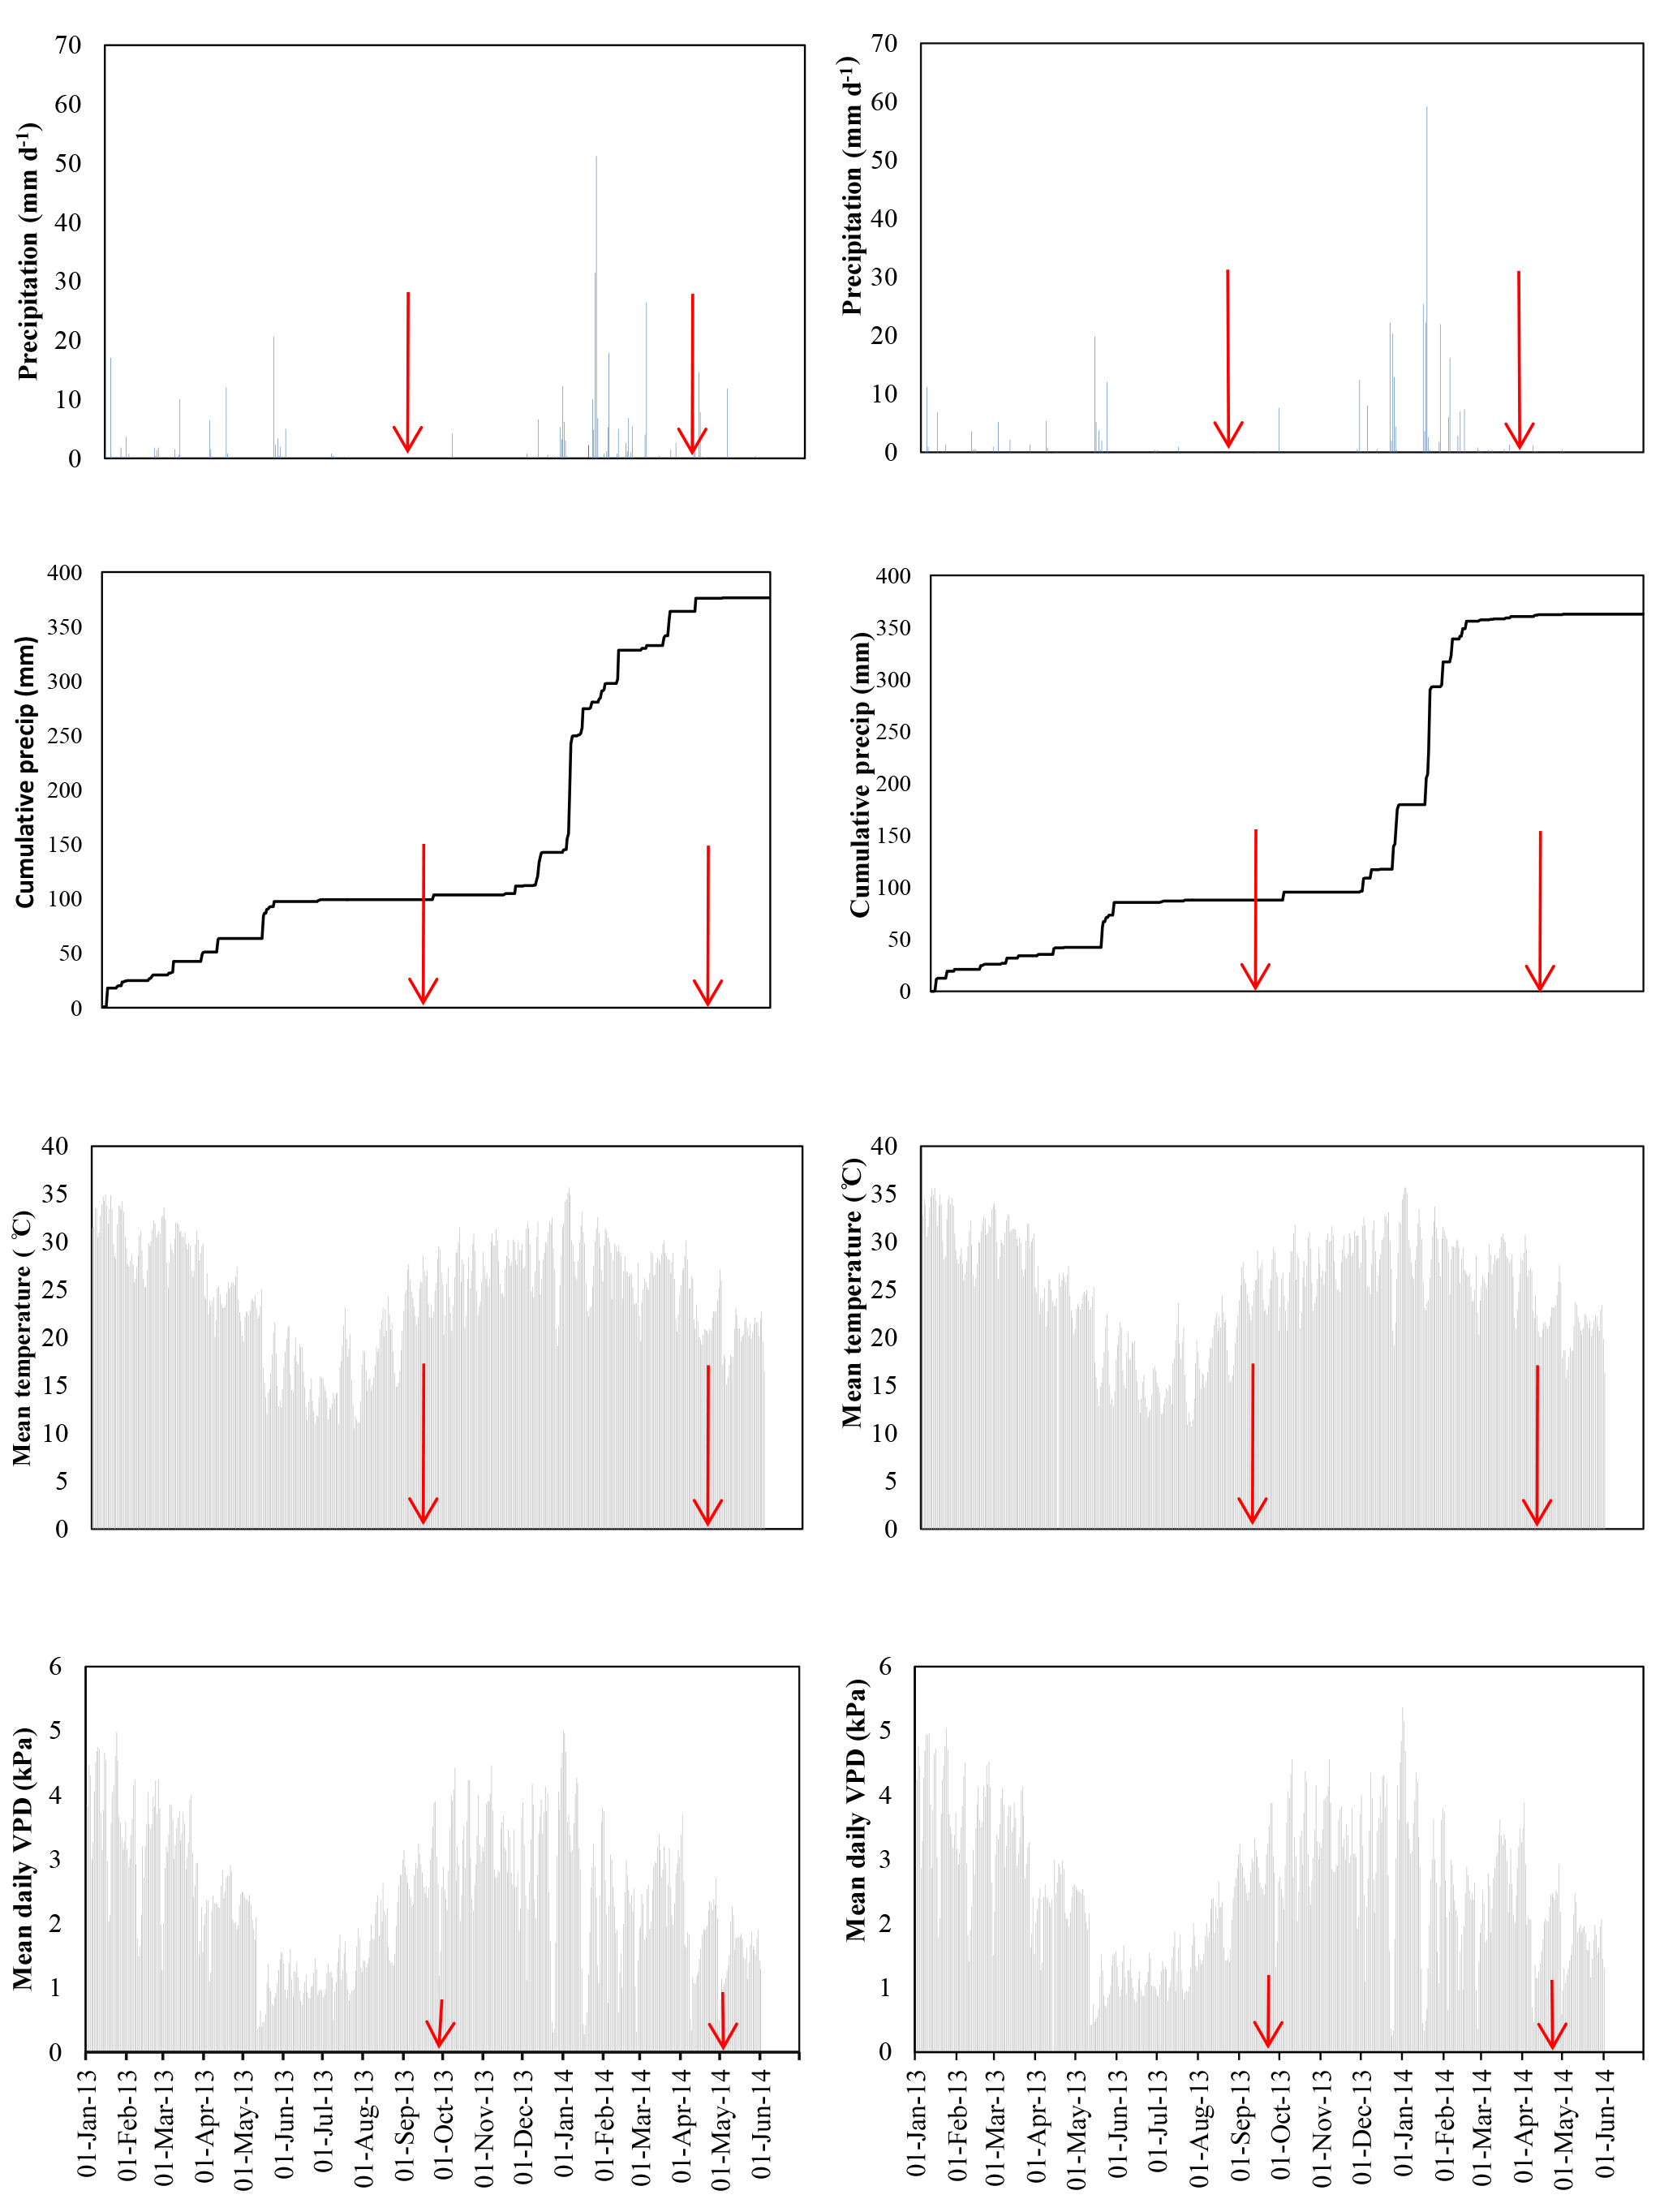
Figure 1Mean daily meteorological conditions of daily precipitation, cumulative precipitation, mean air temperature, and vapour pressure deficit in January 2013–June 2014. Red lines show sampling periods in September 2013 (late dry season) and April 2014 (late wet season). On the left are data from the western EC tower (DTGW 49.4 m), and the other side shows data for the eastern EC tower (DTGW 8.8 m).
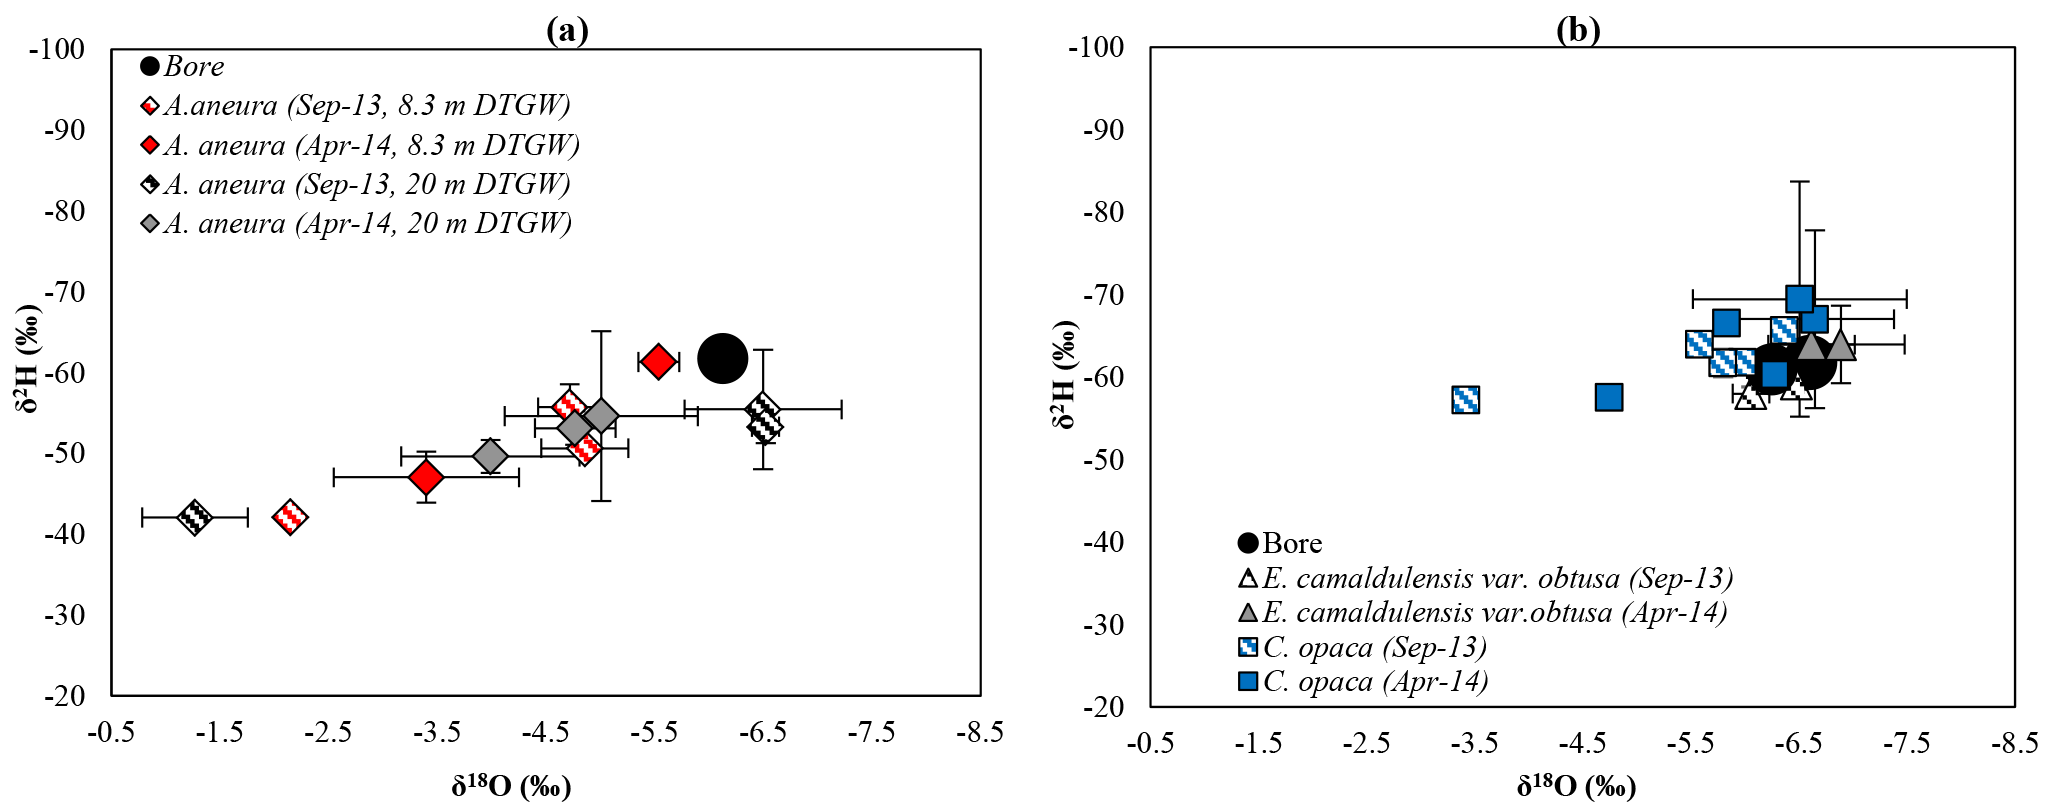
Figure 2Comparison of xylem and bore water δ2H–δ18O plots for Acacia aneura sampled from 8.3 and 20 m DTGW (a) and Eucalyptus camaldulensis and Corymbia opaca sampled from 4.4, 8.8, and 13.9 m DTGW (b). Error bars represent ± 1 standard error.
2.5 Calculation of WUEi from δ13C and hence Δ13C
WUEi was determined from 13C discrimination (Δ13C), which is calculated from the bulk-leaf carbon isotope ratio (δ13C), using the following equations (Werner et al., 2012):
2.6 Leaf-vein density
A small sub-section (approximately 1 cm2) of all leaves sampled for 13C were used for LVD analysis, providing three leaf sub-sections per tree (nine samples per species). Due to the small size of A. aneura phyllodes, several phyllodes were combined and ground for 13C analysis and one whole phyllode was used for LVD analysis. Each leaf section was cleared and stained following the approach described in Gardner (1975). A 5 % (w∕v) NaOH solution was used as the principal clearing agent. Leaf sections were immersed in the NaOH solution and placed in an oven at 40 ∘C overnight (Gardner, 1975). Phyllodes of Acacia proved difficult to clear effectively and were kept in the oven longer than overnight to aid clearing. Once cleared, the partially translucent leaf sections were stained with a 1 % (w∕v) safranin solution. Most leaf sections were stained for up to 3 min and then soaked with a 95 % (w∕v) ethanol solution until the vein network was sufficiently stained and the majority of colour was removed from the lamina. After staining, the cuticle was removed to aid in identifying the vein network. Following cuticle removal, leaf sub-sections were photographed using a Nikon microscope (model: SMZ800) at 40× magnification. Finally, minor veins were traced by hand and LVD was calculated as total vein length per unit area (mm mm−2) using ImageJ version 1.48 (National Institutes of Health, USA).
2.7 Data and statistical analysis
Species-mean values (n=9) for the dominant overstorey species at each location were calculated for δ2H, δ18O, δ13C, and LVD. Relationships between Δ13C and WUEi with DTGW were tested using regression analysis after testing for non-normality (Shapiro–Wilk test, α=0.05) and homogeneity of variances (Bartlett test). A Tukey post hoc test for multiple comparisons across sites was used to test for significance of variation as a function of DTGW. Breakpoints in functions with DTGW were determined using segmented regression analyses whereby the best fitting function is obtained by maximizing the statistical coefficient of explanation. The least squares method was applied to each of the two segments while minimizing the sum of squares of the differences between observed and calculated values of the dependent variables. Next, one-way ANOVA was applied to determine significance of regressions and breakpoint estimates within a given season. We fully acknowledge that the number of plots with shallow DTGW was sub-optimal, but constraints arising from species distribution across the Ti Tree precluded additional sampling.

Figure 3Carbon isotope discrimination in leaf dry matter (Δ13C) plotted as a function of depth-to-groundwater (DTGW) in the Ti Tree basin. Panels (a) and (b) are data for A. aneura only; in panels (c) and (d) C. opaca (black symbols) and E. camaldulensis (red symbols) are presented. Left and right panels show September 2013 and April 2014 sampling, respectively. Lines in panels (c) and (d) are from segmented regression of the combined data. Error bars represent ± 1 standard error.
3.1 Meteorological conditions during the study period
Mean daily temperature and mean daily vapour pressure deficit (VPD) were largest in summer (December–February) and smallest in winter (June–August) (Fig. 1). Daily sums of rainfall showed that the DTW 8.8 and 49.4 m sites received 265 and 228 mm rainfall, respectively, between the September 2013 and April 2014 sampling dates, representing more than 73 % and 60 % of the total respective rainfall received from January 2013 to June 2014 at these sites.
3.2 Variation in source-water uptake
Xylem water isotope ratios for A. aneura were widely divergent from the bore water stable isotope ratios (Fig. 2a) in both wet and dry seasons, indicative of a lack of access to groundwater. In contrast, δ2H and δ18O of xylem water in E. camaldulensis and C. opaca were predominantly (with two exceptions) tightly clustered around δ2H and δ18O of groundwater in the bores located within 50 m of the trees (Fig. 2b). There was little variation in xylem water composition between the end of the dry season and end of the wet season for either species, reflecting the consistent use of groundwater by these two species.
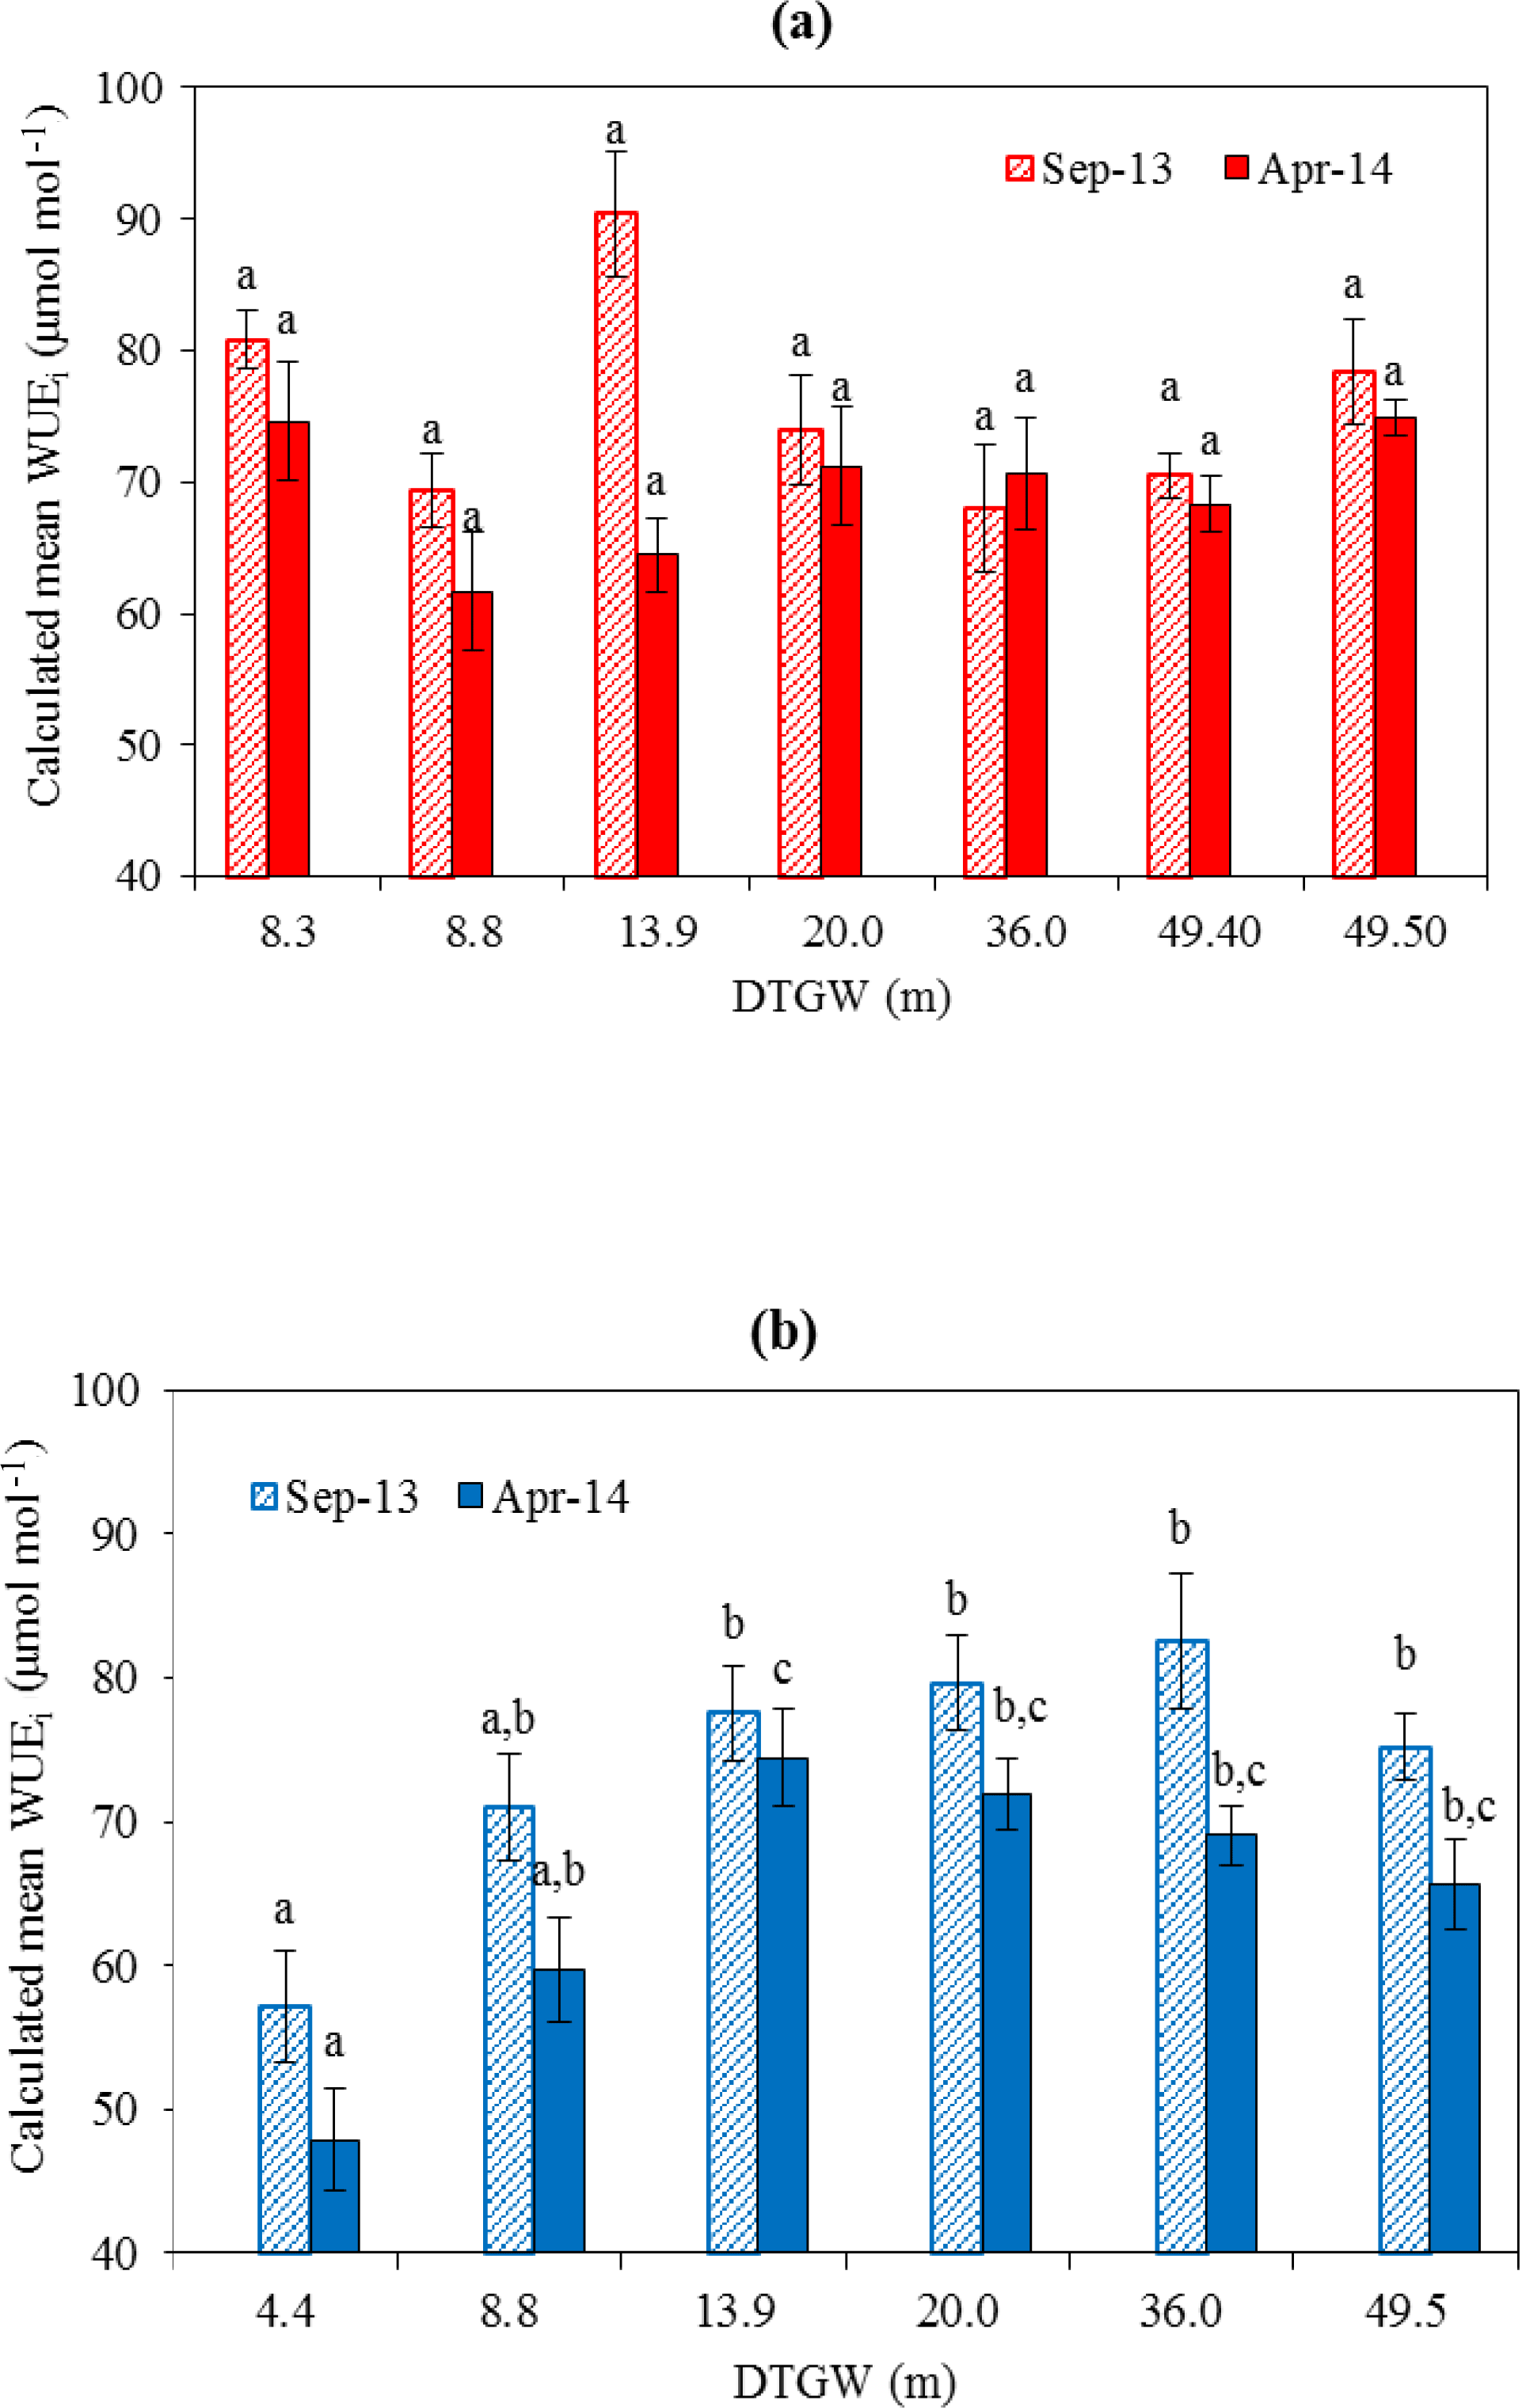
Figure 4Leaf intrinsic water-use efficiency (WUEi) calculated from Δ13C in shallow-rooted A. aneura (a) and deep-rooted E. camaldulensis and C. opaca (b) across study sites for September 2013 (patterned column) and April 2014 (filled column). Bars within a season with the same letter are not significantly different across the depth-to-groundwater gradient (Tukey HSD, p<0.05). Error bars represent ± 1 standard error.
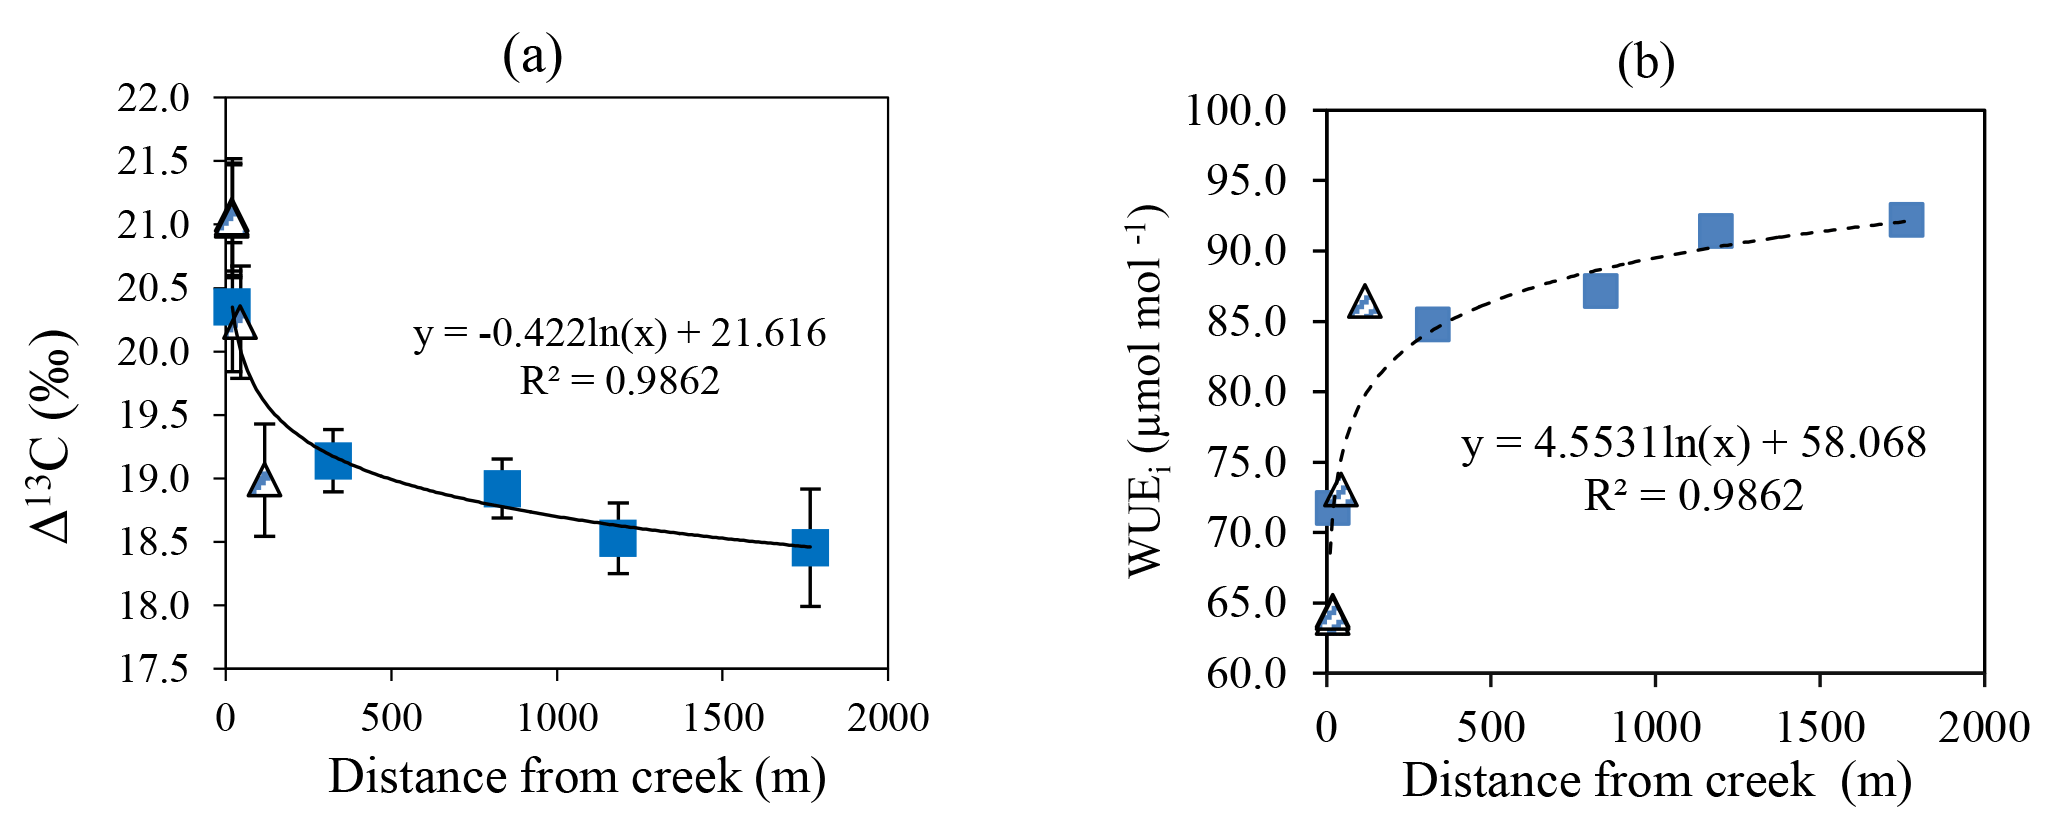
Figure 5Δ13C (a) and WUEi (b) of deep-rooted species sampled across the Ti Tree basin plotted as functions of distance from Allungra Creek bed. Striped triangles represent E. camaldulensis and blue squares represent C. opaca. Error bars represent ± 1 standard error. The regression is fitted only to the E. camuldulensis data. Note that the largest value of Δ13C and the lowest value of WUE for C. opaca are three overlapping samples.

Figure 6Leaf-vein density (LVD) of A. aneura (a) or E. camaldulensis (red symbols) and C. opaca (blue symbols) (b) as a function of depth-to-groundwater. Each symbol represents mean LVD calculated from three individual leaves. Error bars represent ± 1 standard error. A statistically significant correlation derived from segmented linear regression of leaf-vein density, for E. camaldulensis and C. opaca data combined, with depth-to-groundwater (DTGW) is shown in panel (b). The r2 and standard deviation slope of the regression below the breakpoint in (b) are 0.976 and 0.0031, respectively.
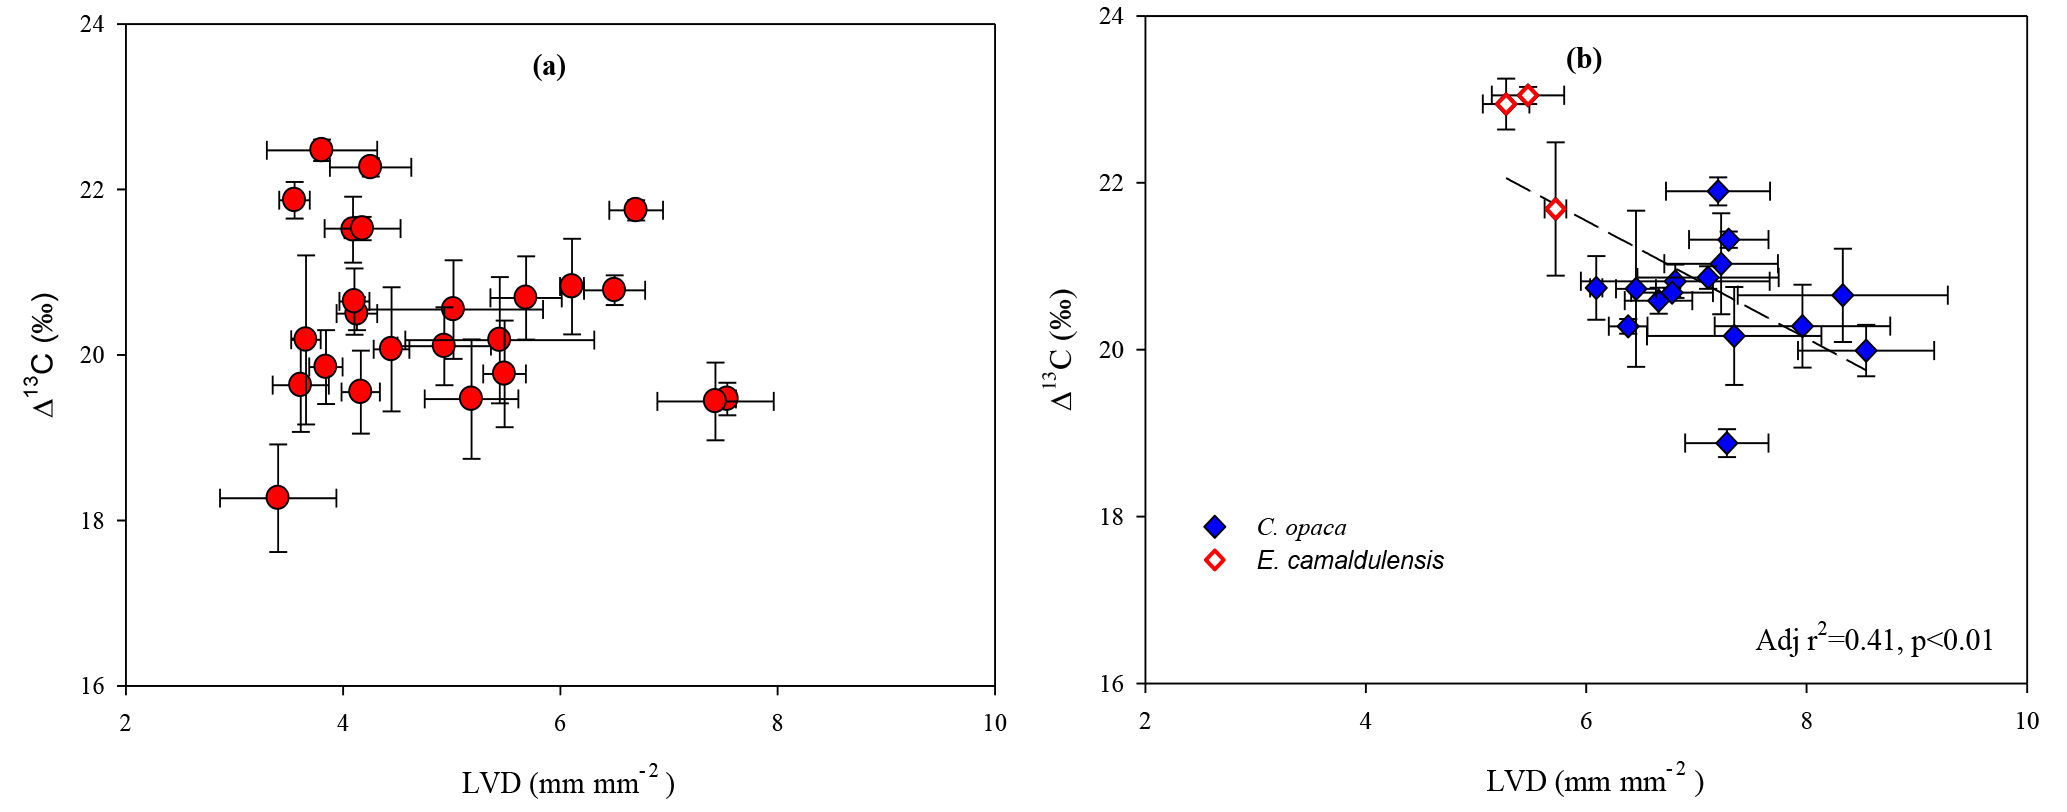
Figure 7Relationships of leaf-vein density of (a) A. aneura and (b) E. camaldulensis (red symbols) and C. opaca (blue symbols) with bulk-leaf Δ13C. Each symbol represents mean LVD and Δ13C, with both variables measured on the same leaf. Error bars represent ± 1 standard error. A statistically significant correlation of LVD and Δ13C of E. camaldulensis and C. opaca is plotted with a dashed line.
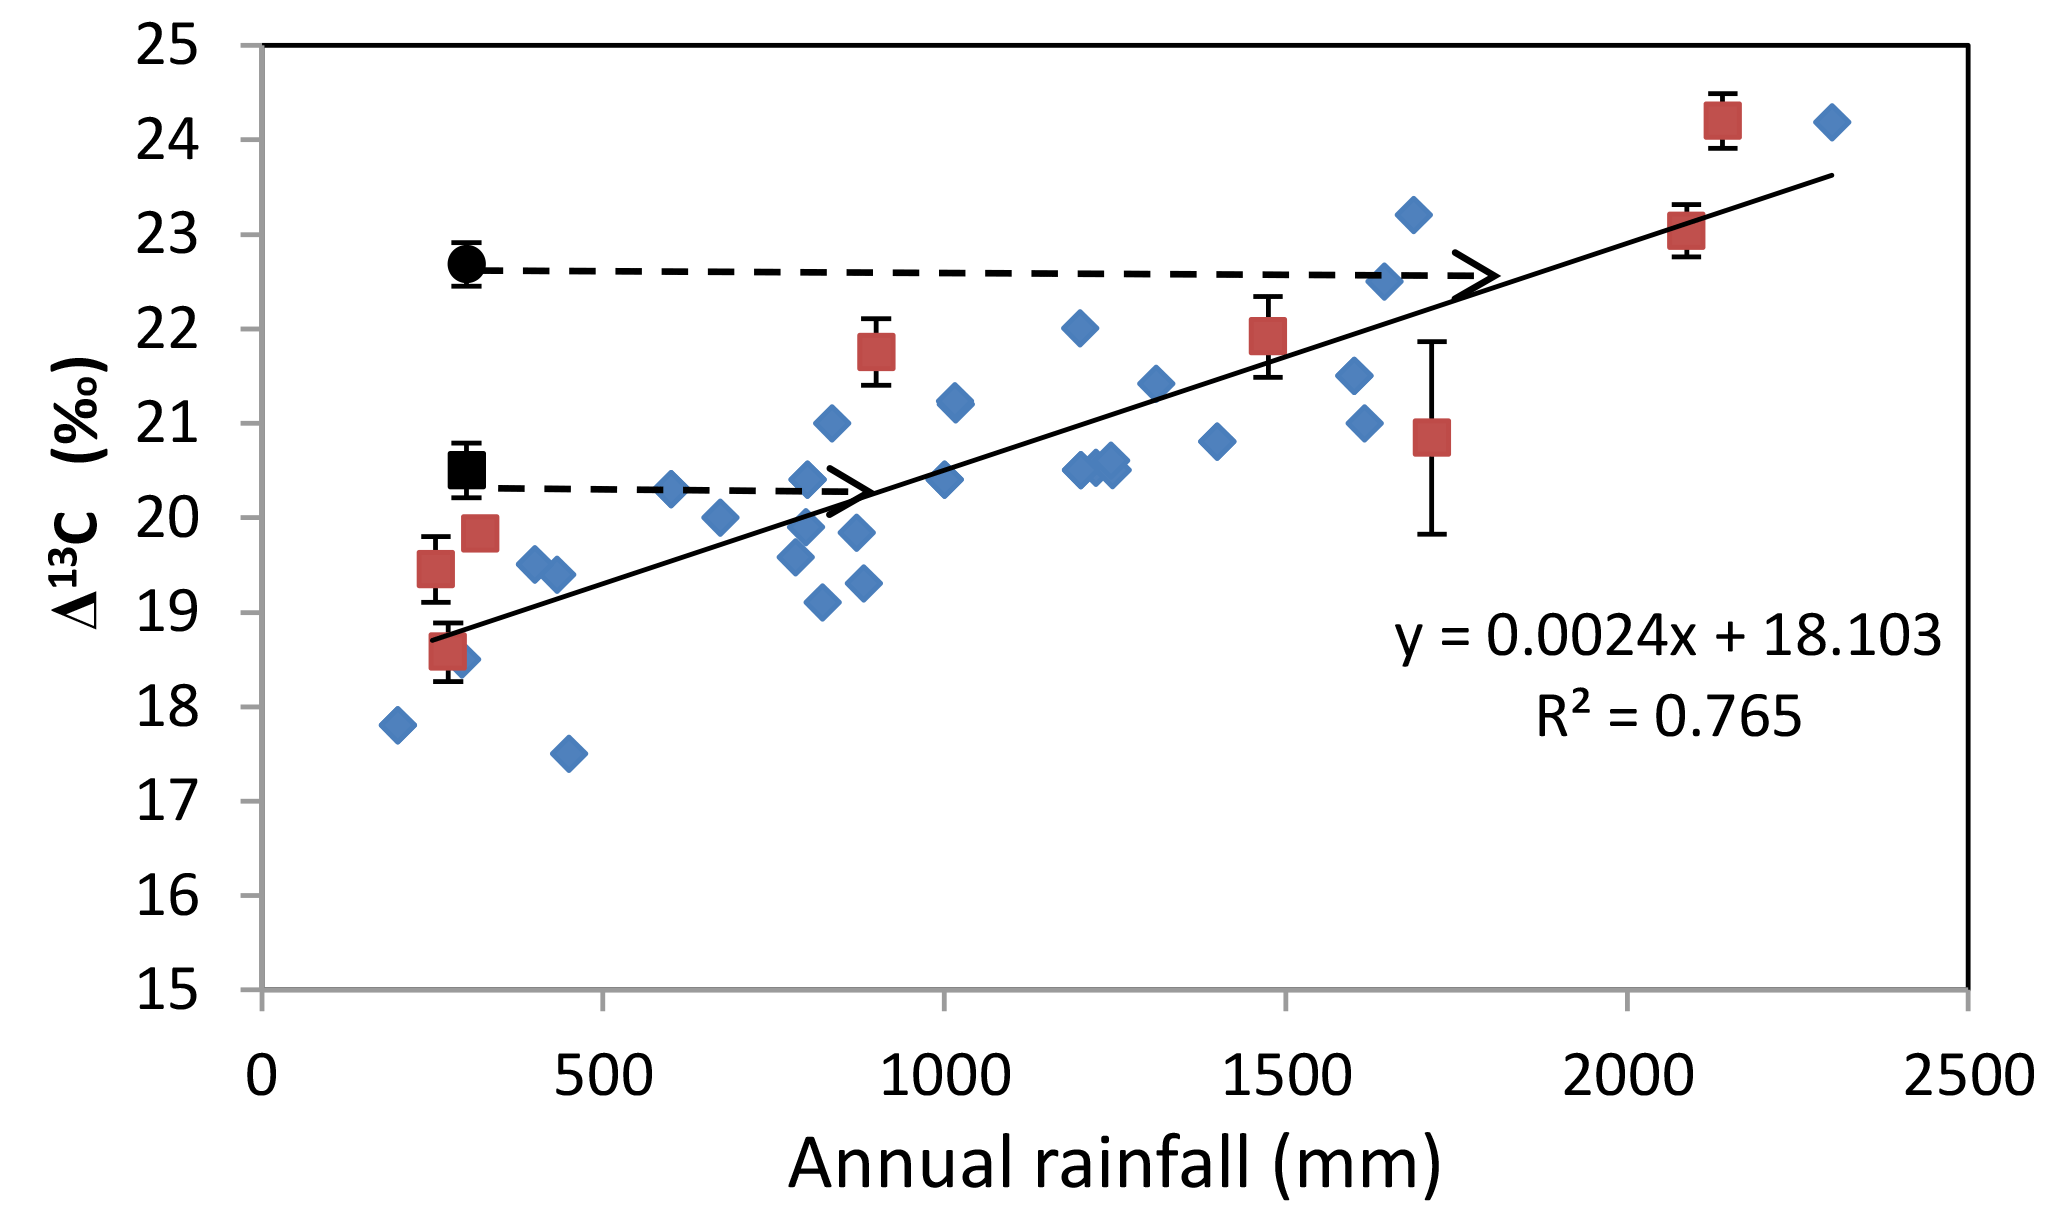
Figure 8Relationships of discrimination against carbon-13 (Δ13C) with annual rainfall observed in different studies across Australia. The diamonds represent observations made in eastern Australia (Stewart et al., 1995), northern Australia (Miller et al., 2001), and sites in New South Wales (Taylor, 2008). The red squares are data from a continental-scale assessment of foliar Δ13C (Rumman et al., 2017). The black circle is the mean Δ13C of E. camaldulensis and the black square is the mean Δ13C C. opaca, both of which were measured in the current study. The 95 % CI for the mean Δ13C is ±0.403 and the s.e. of the slope is 0.000231. The black dashed arrows indicate the rainfall that would be required to account for the Δ13C for E. camaldulensis and C. opaca if these two species relied only upon rainfall.
Δ13C of A. aneura, sampled in the Corymbia savanna and Acacia spp. plots, was not significantly correlated with DTGW, in either season or across all values of DTGW (ANOVA F = 1.78; p>0.05; Fig. 3a, b). As a consequence of these patterns in Δ13C, WUEi did not vary significantly for A. aneura across sites differing in DTGW (Fig. 4a) despite the large variability in WUEi (ranging from 62 to 92 µmol mol−1) across sites and seasons. By contrast, foliar Δ13C of E. camaldulensis and C. opaca declined significantly with increasing DTGW in both seasons at the sites where DTGW was relatively shallow (DTGW < ca. 12 m). Segmented regression analysis shown in Fig. 3c and d yielded breakpoints at 11.17±0.54 m in September (ANOVA F = 11.548; df = 2, 38; P<0.01) and 9.81±0.4 m in April (ANOVA F = 14.67; df = 2, 47; P<0.01), which represent the seasonal maximum depths from which groundwater can be extracted by these species. Thus, WUEi of E. camaldulensis and C. opaca was significantly smaller at the shallowest site than at sites with DTGW > 13.9 m (Fig. 4b), but did not differ significantly across the deeper DTGW range (13.9–49.5 m; Fig. 4b).
As distance from Allungra Creek increased, foliar Δ13C for both E. camaldulensis and C. opaca declined significantly (Fig. 5a), with concomitant increases in WUEi (Fig. 5b). There was no significant relationship for Δ13C or WUEi with distance from the creek for A. aneura (data not shown).
3.3 Leaf-vein density
LVD did not vary significantly with increasing DTGW for A. aneura (Fig. 6a), but a significant increase in LVD with increasing DTGW was observed for DTGW < ca. 10 m in the two deep-rooted species (Fig. 6b). The breakpoint for E. camaldulensis and C. opaca (Fig. 6b; 9.36 m ± 0.6 m; ANOVA F = 6.38; P<0.05) agreed well with the two previous estimates (cf. Figs. 3 and 6), although again, constraints imposed by species distributions severely limited the number of samplings available at shallow DTGW sites. As with LVD and DTGW, no relationship was observed between LVD and Δ13C for A. aneura (Fig. 7a), but a significant linear decline in Δ13C with increasing LVD was observed for E. camaldulensis and C. opaca (Fig. 7b).
Analyses of stable isotopes of bore water (i.e. groundwater) and xylem water across a DTGW gradient established that A. aneura adopted an “opportunistic” strategy of water use and was dependent on rainfall stored within the soil profile. This is consistent with previous studies, where Acacia spp. was shown to be very responsive to changes in upper soil moisture content, as expected given their shallow rooting depth and the presence of a shallow (< 1.5 m) hardpan below stands of Acacia spp. (Eamus et al., 2013; Pressland, 1975). Furthermore, very low predawn leaf-water potentials ( MPa; Eamus et al., 2016) and very high sapwood density (0.95 g cm−3; Eamus et al., 2016) in A. aneura of Ti Tree, and which are strongly correlated with aridity, confirm that they rely on soil water without access to groundwater, consistent with the findings of Cleverly et al. (2016b). By contrast, analyses of stable isotopes in groundwater and xylem water of E. camaldulensis and C. opaca established their access to groundwater, as has been inferred previously because of their large rates of transpiration in the dry season and consistently high (close to zero) predawn water potentials (Howe et al., 2007; O'Grady et al., 2006a, b). Importantly, we observed no significant change in xylem isotope composition for these two deep-rooted species (E. camaldulensis and C. opaca) between the end of the wet season and the end of the dry season, further evidence of year-round access to groundwater at the shallowest DTGW sites.
One specific aim of the present study was to determine whether discrimination against 13C (Δ13C) and resultant intrinsic water-use efficiency (WUEi) could be used to identify access to groundwater. An increase in foliar Δ13C represents decreased access to water and increasing WUEi (Leffler and Evans, 1999; Zolfaghar et al., 2014, 2017). The shallow-rooted A. aneura did not show any significant relationship of Δ13C with DTGW during either season. Consequently mean WUEi showed no significant trend with increasing DTGW, consistent with the conclusion that A. aneura only accessed soil water during either season. In contrast, a breakpoint in the relationship between Δ13C and DTGW was apparent between 9.4 m (derived from LVD results) and 11.2 m (derived from Δ13C analyses) when data for the two species were combined. Where DTGW was larger than a threshold (DTGW > ca. 12 m), Δ13C became independent of DTGW. Consequently, WUEi increased significantly as DTGW increased to these thresholds (p<0.001), but did not vary with further increases in DTGW. We therefore suggest that foliar Δ13C (or WUEi) can be used as an indicator of groundwater access by vegetation. Δ13C is less expensive and easier to measure than stable isotope ratios of water (δ2H and δ18O) in groundwater, soil water, and xylem water. Furthermore, canopies are generally more accessible than groundwater. Globally, identification of groundwater-dependent ecosystems has been hindered by the lack of a relatively cheap and easy methodology (Eamus et al., 2015); thus, Δ13C shows great promise for identifying groundwater-dependent vegetation and ecosystems.
Whilst acknowledging the sub-optimal distribution of samples across the shallow DTGW range (<10 m) from which breakpoints in regressions were calculated (Figs. 3 and 6), which arose because of the natural distribution of trees across the basin, we can ask the question: are the speculated depths beyond which groundwater appears to become inaccessible supported by other independent studies of Australian trees? Several analyses support our suggestion of a lower limit of approximately 12 m beyond which groundwater is inaccessible to vegetation in this basin. Eamus et al. (2015) present the results of a seven-site (seven sites across the range 2.4–37.5 m DTGW), 18-trait, five-species study and identify a breakpoint between 7 and 9 m. Similarly, two recent reviews identify lower limits to root extraction of groundwater of 7.5 m (Benyon et al., 2006) and 8–10 m (O'Grady et al., 2010), while Cook et al. (1998b) established a limit of 8–9 m for a Eucalypt savanna. We therefore conclude that our estimates of the limits to groundwater accessibility appear reasonable.
Figure 8 shows combined Δ13C from four Australian studies (Miller et al., 2001; Stewart et al., 1995; Taylor, 2008; Rumman et al., 2017), including one continental-scale study of foliar Δ13C (Rumman et al., 2017). A single regression describes the data of all four independent studies. Thus, when rainfall is the sole source of water for vegetation, Δ13C is strongly correlated with annual rainfall. In contrast, the mean Δ13C for E. camaldulensis and C. opaca do not conform to the regression (Fig. 8). It appears that E. camaldulensis in Ti Tree “behaves” as though it were receiving approximately 1700 mm of rainfall, despite growing at a semi-arid site (ca. 320 mm average annual rainfall). This represents the upper limit to groundwater use by this species, assuming a zero contribution from rainfall (which is clearly very unlikely). The upper limit to annual groundwater use for C. opaca was similarly estimated to be 837 mm (Fig. 8). If all of the water from rainfall is used by these two species (which is also very unlikely), then the lower limit to groundwater use is the difference between rainfall and the estimates derived from Fig. 8, about 1380 mm for E. camaldulensis and 517 mm for C. opaca.
There are several independent estimates of annual tree water use for these two species which provide a valuable comparison to the estimates made above. O'Grady et al. (2009) showed that annual water use by riparian E. camaldulensis in Ti Tree was approximately 1642.5 m3 m−2 sapwood year−1. Assuming an average tree radius of 20 cm, a sapwood depth of 2 cm, and an average canopy ground cover of 25 m2 per tree yields an annual water use of 1568 mm year−1, encouragingly close to the estimate (1700 mm) derived from Fig. 8. The estimate for annual water use by C. opaca from O'Grady et al. (2009) is 837 mm, in reasonable agreement with the estimate from the average Δ13C of C. opaca and the regression in Fig. 8 (ca. 900 mm). Because depth-to-groundwater for C. opaca is significantly larger (ca. 8–10 m) than that for E. camaldulensis (ca. 2–4 m), the resistance to water flow imposed by the xylem's path length is larger for C. opaca than E. camaldulensis and therefore water use may be expected to be smaller in the former than the latter, as observed.
Using an entirely different methodology from that used here, O'Grady et al. (2006c) estimated annual groundwater use by riparian vegetation on the Daly River in northern Australia to be between 694 and 876 mm, while O'Grady and Holland (2010) showed annual groundwater use to range from 2 to >700 mm in their continental-scale review of Australian vegetation. Therefore our estimates based on Δ13C appear reasonable. We conclude that (a) E. camaldulensis and C. opaca are accessing groundwater (because annual water use greatly exceeded annual rainfall); (b) Δ13C can be used as an indicator of groundwater use by vegetation; and (c) Δ13C can provide estimates of upper and lower bounds for the rate of groundwater use by vegetation.
4.1 Patterns of carbon isotope discrimination and intrinsic water-use efficiency along Allungra Creek transects
For the two deep-rooted species (E. camaldulensis and C. opaca), a significant decline in Δ13C (and hence an increase in WUEi) was observed with increasing distance from the creek (Fig. 5a, b). In contrast to the results of O'Grady et al. (2006c) for a steeply rising topography in the Daly River, this is unlikely to be attributable to increased elevation since the change in elevation was minimal across each entire transect (<3 m), and even smaller near Allungra Creek where most of the change in Δ13C was recorded. Therefore the cause of the change in Δ13C with distance from the creek was most likely to be a function of the frequency with which trees receive flood water and hence the amount of recharge into the soil profile (Ehleringer and Cooper, 1988; Thorburn et al., 1994; Villeneuve et al., 2015; Singer et al., 2014). We therefore further conclude that foliar Δ13C can be used as an indicator of access to additional water to that of rainfall, regardless of the source of that additional water (e.g. groundwater, flood recharged soil water storage, irrigation).
4.2 Leaf-vein density across the depth-to-groundwater gradient
In our study, LVD was independent of DTGW for A. aneura, but a breakpoint (9.4 m) was apparent across the combined data of the two deep-rooted species. Increased DTGW reflects a declining availability of water resources (Zolfaghar et al., 2015), especially in arid zones. Uhl and Mosbrugger (1999) concluded that water availability is the most important factor determining LVD. Sack and Scoffoni (2013) also showed LVD to be negatively correlated with mean annual precipitation in a 796-species meta-analysis. Therefore increasing LVD with increasing DTGW is consistent with an increased LVD with a declining water supply, despite similar amounts of rainfall being received along the DTGW gradient.
Both A. aneura and C. opaca in the present study showed LVDs close to the higher end of the global spectrum (Sack and Scoffoni, 2013), consistent with larger LVDs observed in “semi-desert” species. Higher LVDs allow for a more even spatial distribution of water across the phyllode or lamina during water stress, which contributes to a greater consistency of mesophyll hydration in species of arid and semi-arid regions (Sommerville et al., 2012). In turn, this allows continued photosynthetic carbon assimilation during water stress (Sommerville et al., 2010). Presumably, a large LVD also decreases the resistance to water flow from minor veins to mesophyll cells, which is likely to be beneficial for leaf hydration as water availability declines while also facilitating rapid rehydration following rain in these arid-zone species. Large LVDs for A. aneura of semi-arid regions in Australia have been associated with rapid up-regulation of phyllode function with the return of precipitation following drought (Sommerville et al., 2010), and such rapid up-regulation is crucial for vegetation in regions with unpredictable and pulsed rainfall like Ti Tree (Byrne et al., 2008; Grigg et al., 2010).
LVD was negatively correlated with bulk-leaf Δ13C (and thus positively correlated with WUEi) in C. opaca and the data for E. camaldulensis appeared to conform to the regression for C. opaca (Fig. 7b). What mechanism can explain the significant relationship observed between a structural leaf trait (LVD) and a functional trait (WUEi)? The stomatal optimization model (Medlyn et al., 2011) is based on the fact that transpiration (E) and CO2 assimilation (A) are linked via stomatal function. In order to gain carbon most economically while minimizing water loss (i.e. optimization of the ratio A ∕ E), stomata should function such that the marginal water cost of carbon assimilation remains constant (Cowan and Farquhar, 1977; Farquhar and Sharkey, 1982). This aspect of stomatal control couples the structural traits involved with water flow with traits associated with primary production (Brodribb and Holbrook, 2007) and explains observed correlations between Kleaf and Amax in a number of studies (Brodribb et al., 2007, 2010, 2005; Brodribb and Jordan, 2008; Sack and Holbrook, 2006; Sack and Scoffoni, 2013). The length of the hydraulic pathway is directly proportional to Kleaf (Brodribb et al., 2007) and the A∕gs ratio determines foliar Δ13C (and WUEi) signatures in leaves. Thus, the constraint on Kleaf by LVD affects the coordination between the processes of A and E and thereby might explain significant relationships between structural (LVD) and functional (WUEi) traits. For the two deep-rooted species, having access to groundwater resulted in convergence to a common solution for optimizing water supply through veins with respect to E (Brodribb and Holbrook, 2007).
Several robust and testable predictions arise from the conclusion that E. camaldulensis and C. opaca are functioning at a semi-arid site as though they have access to ca. 1700 or 900 mm rainfall, respectively. Species growing in high-rainfall zones possess a suite of traits, including low-density sapwood, large-diameter xylem vessels, small resistance to vessel implosion, large SLA, and a large maximum stomatal conductance, compared to species growing in arid regions (O'Grady et al., 2006b, 2009; Wright et al., 2004). Therefore, these attributes should be present in E. camaldulensis and C. opaca if they are functioning as though they are growing in a mesic environment. We have previously established (Eamus et al., 2016; Santini et al., 2016) that these predictions are confirmed by field data and therefore conclude that analyses of foliar Δ13C have global application to the preservation and understanding of GDEs.
We posed five questions regarding depth-to-groundwater (DTGW), foliar discrimination against 13C (Δ13C), and leaf-vein density (LVD) as underpinning the rationale for this study. We confirmed that access to shallow groundwater by E. camaldulensis and C. opaca (DTGW ca. 0–11 m) resulted in smaller WUEi than A. aneura. We also demonstrated that LVD correlated with DTGW for the shallower depths (<10 m) in E. camaldulensis and C. opaca, but not in A. aneura. We further demonstrated that there was correlation between LVD and Δ13C (and hence WUEi) for E. camaldulensis and C. opaca, but not in A. aneura. Similarly, as distance increased from a creek near a flood-out associated with aquifer recharge, foliar Δ13C decreased and WUEi increased for E. camaldulensis and C. opaca, but not for A. aneura. Finally, we conclude that foliar Δ13C can be used as an indicator of utilization of groundwater or stored soil water by vegetation in arid regions, providing an inexpensive and rapid alternative to the stable isotopes of water that have been used in many previous studies. The observation that the Δ13C of the two groundwater-using species was distant from the continental regression of Δ13C against rainfall (Fig. 8) is strong evidence of the value of Δ13C as an indicator of utilization of water that is additional to rainfall, and this supplemental water can be derived from either groundwater or soil recharge arising in flood-out zones of creeks.
The underlying research data are all available on the following permanent link: http://hdl.handle.net/10453/102763 (UTS library, 2018).
The supplement related to this article is available online at: https://doi.org/10.5194/hess-22-4875-2018-supplement.
All the authors contributed to field data sampling. RR undertook all the isotope analyses and statistical analyses and wrote the thesis that formed the basis of this paper. DE oversaw the design and implementation of the entire project. All the authors contributed to writing this paper and interpreting the data.
The authors declare that they have no conflict of interest.
The authors would like to acknowledge the financial support of the Australian
Research Council for a Discovery grant awarded to Derek Eamus.
Edited by: Theresa Blume
Reviewed by: two anonymous referees
Beer, C., Ciais, P., Reichstein, M., Baldocchi, D., Law, B. E., Papale, D., Soussana, J. F., Ammann, C., Buchmann, N., Frank, D., Gianelle, D., Janssens, I. A., Knohl, A., Kostner, B., Moors, E., Roupsard, O., Verbeeck, H., Vesala, T., Williams, C. A., and Wohlfahrt, G.: Temporal and among-site variability of inherent water use efficiency at the ecosystem level, Global Biogeochem. Cy., 23, GB2018, https://doi.org/10.1029/2008GB003233, 2009.
Benyon, R. G., Theiveyanathan, S., and Doody, T. M.: Impacts of tree plantations on groundwater in south-eastern Australia, Aust. J. Bot., 54, 181–192, https://doi.org/10.1071/bt05046, 2006.
Box, J. B., Duguid, A., Read, R. E., Kimber, R. G., Knapton, A., Davis, J., and Bowland, A. E.: Central Australian waterbodies: The importance of permanence in a desert landscape, J. Arid Environ., 72, 1395–1413, https://doi.org/10.1016/j.jaridenv.2008.02.022, 2008.
Brodribb, T. J., Feild, T. S. and Jordan, G. J.: Leaf maximum photosynthetic rate and venation are linked by hydraulics, Plant Phys., 144, 1890–1898, 2007.
Brodribb, T. J., Feild, T. S., and Sack, L.: Viewing leaf structure and evolution from a hydraulic perspective, Funct. Plant Biol., 37, 488-498, 2010.
Brodribb, T. J. and Holbrook, N. M.: Changes in leaf hydraulic conductance during leaf shedding in seasonally dry tropical forest, New Phytol., 158, 295–303, 2003.
Brodribb, T. J. and Holbrook, N. M.: Forced depression of leaf hydraulic conductance in situ: effects on the leaf gas exchange of forest trees, Func. Ecol., 21, 705–712, 2007.
Brodribb, T. J., Holbrook, N. M., Zwieniecki, M. A., and Palma, B.: Leaf hydraulic capacity in ferns, conifers and angiosperms: impacts on photosynthetic maxima, New Phytol., 165, 839–846, 2005.
Brodribb, T. J. and Jordan, G. J.: Internal coordination between hydraulics and stomatal control in leaves, Plant Cell Environ., 31, 1557–1564, 2008.
Bucci, S., Goldstein, G., Meinzer, F., Scholz, F., Franco, A., and Bustamante, M.: Functional convergence in hydraulic architecture and water relations of tropical savanna trees: from leaf to whole plant, Tree Physiol., 24, 891–899, 2004.
Budyko, M. I.: Climate and Life, Academic Press, New York, 508 pp., 1974.
Byrne, M., Yeates, D. K., Joseph, L., Kearney, M., Bowler, J., Williams, M. A. J., Cooper, S., Donnellan, S. C., Keogh, J. S., and Leys, R.: Birth of a biome: insights into the assembly and maintenance of the Australian arid zone biota, Molec. Ecol., 17, 4398–4417, 2008.
Calf, G. E., McDonald, P. S., and Jacobson, G.: Recharge mechanism and groundwater age in the Ti-Tree basin, Northern Territory, Aust. J. Earth Sci., 38, 299–306, https://doi.org/10.1080/08120099108727974, 1991.
Cernusak, L. A., Hutley, L. B., Beringer, J., Holtum, J. A., and Turner, B. L.: Photosynthetic physiology of eucalypts along a sub-continental rainfall gradient in northern Australia, Agr. Forest Meteorol., 151, 1462–1470, 2011.
Clarke, R.: Water: the international crisis, Earthscan, London, UK, 1991.
Cleverly, J.: Alice Springs Mulga OzFlux site, TERN OzFlux: Australian and New Zealand Flux Research and Monitoring Network, hdl:102.100.100/14217, 2011.
Cleverly, J.: Ti Tree East OzFlux Site, TERN OzFlux: Australian and New Zealand Flux Research and Monitoring Network, hdl:102.100.100/11135, 2013.
Cleverly, J., Boulain, N., Villalobos-Vega, R., Grant, N., Faux, R., Wood, C., Cook, P. G., Yu, Q., Leigh, A., and Eamus, D.: Dynamics of component carbon fluxes in a semi-arid Acacia woodland, central Australia, J. Geophys. Res.-Biogeosci., 118, 1168–1185, 2013.
Cleverly, J., Eamus, D., Van Gorsel, E., Chen, C., Rumman, R., Luo, Q., Coupe, N. R., Li, L., Kljun, N., and Faux, R.: Productivity and evapotranspiration of two contrasting semiarid ecosystems following the 2011 global carbon land sink anomaly, Agr. Forest Meteorol., 220, 151–159, 2016a.
Cleverly, J., Eamus, D., Restrepo Coupe, N., Chen, C., Maes, W., Li, L., Faux, R., Santini, N. S., Rumman, R., Yu, Q., and Huete, A.: Soil moisture controls on phenology and productivity in a semi-arid critical zone, Sci. Total Environ., 568, 1227–1237, https://doi.org/10.1016/j.scitotenv.2016.05.142, 2016b.
Cook, P. G., O'Grady, A. P., Wischusen, J. D. H., Duguid, A., Fass, T., Eamus, D., and Palmerston, N. T.: Ecohydrology of sandplain woodlands in central Australia, Department of Natural Resources, Environment and The Arts, Northern Territory Government, Darwin, 2008a.
Cook, P. G., Hatton, T. J., Pidsley, D., Herczeg, A. L., Held, A., O'Grady, A., and Eamus, D.: Water balance of a tropical woodland ecosystem, northern Australia: a combination of micro-meteorological, soil physical and groundwater chemical approaches, J. Hydrol. 210, 161–177, https://doi.org/10.1016/S0022-1694(98)00181-4, 2008b.
Cordry, K.: HydraSleeve: A new no-purge groundwater sampler for all contaminants, Interstate Technology and Regulatory Council Fall Conference, Monterey, California, USA, 2003.
Cowan, I. R. and Farquhar, G. D.: Stomatal function in relation to leaf metabolism and environment: Stomatal function in the regulation of gas exchange, Symposia of the Society for Experimental Biology, 31, 471–505, 1997.
Craig, H.: Isotopic variations in meteoric waters, Science, 133, 1702–1703, 1961.
Cullen, L. E. and Grierson, P. F.: A stable oxygen, but not carbon, isotope chronology of Callitris columellaris reflects recent climate change in north-western Australia, Clim. Change, 85, 213–229, https://doi.org/10.1007/s10584-006-9206-3, 2007.
Donohue, R. J., McVicar, T., and Roderick, M. L.: Climate-related trends in Australian vegetation cover as inferred from satellite observations, 1981–2006, Glob. Change Biol., 15, 1025–1039, 2009.
Eamus, D., O'Grady, A. P., and Hutley, L.: Dry season conditions determine wet season water use in the wet–tropical savannas of northern Australia, Tree Physiol., 20, 1219–1226, 2000.
Eamus, D., Hatton, T., Cook, P., and Colvin, C.: Ecohydrology: vegetation function, water and resource management, CSIRO Publishing, Melbourne, 348 pp., 2006.
Eamus, D., Cleverly, J., Boulain, N., Grant, N., Faux, R., and Villalobos-Vega, R.: Carbon and water fluxes in an arid-zone Acacia savanna woodland: An analyses of seasonal patterns and responses to rainfall events, Agr. Forest Meteorol., 182, 225–238, 2013.
Eamus, D., Zolfaghar, S., Villalobos-Vega, R., Cleverly, J., and Huete, A.: Groundwater-dependent ecosystems: recent insights from satellite and field-based studies, Hydrol. Earth Syst. Sci., 19, 4229–4256, https://doi.org/10.5194/hess-19-4229-2015, 2015.
Eamus, D., Huete, A., Cleverly, J., Nolan, R. H., Ma, X., Tarin, T., and Santini, N. S.: Mulga, a major tropical dry open forest of Australia: recent insights to carbon and water fluxes, Environ. Res. Lett., 11, 125011, https://doi.org/10.1088/1748-9326/11/12/125011, 2016.
Ehleringer, J. R. and Cooper, T. A.: Correlation between carbon isotope ratio and microhabitat in desert plants, Oecologia, 76, 562–566, 1988.
Farquhar, G. D. and Sharkey, T. D.: Stomatal conductance and photosynthesis, Ann. Rev. Plant Physio., 33, 317–345, 1982.
Gardner, R. O.: An overview of botanical clearing technique, Stain Tech., 50, 99–105, 1975.
Grigg, A. M., Lambers, H., and Veneklaas, E. J.: Changes in water relations for Acacia ancistrocarpa on natural and mine-rehabilitation sites in response to an experimental wetting pulse in the Great Sandy Desert, Plant Soil, 326, 75–96, 2010.
Hacke, U. G., Sperry, J. S., Ewers, B. E., Ellsworth, D. S., Schäfer, K. V. R., and Oren, R.: Influence of soil porosity on water use in Pinus taeda, Oecologia, 124, 495–505, 2000.
Howe, P., O'Grady, A. P., Cook, P. G., and Fas, T.: Project REM1 – A Framework for Assessing Environmental Water Requirements for Groundwater Dependent Ecosystems Report-2 Field Studies, Land and Water Australia, 2007.
IAEA: Reference Sheet for VSMOW2 and SLAP2 international measurement standards, International Atomic Energy Agency, Vienna, available at: http://nucleus.iaea.org/rpst/document/vsmow2_slap2.pdf (last access: April 2018), 2009.
Ingraham, N. L. and Shadel, C.: A comparison of the toluene distillation and vacuum/heat methods for extracting soil water for stable isotopic analysis, J. Hydrol., 140, 371–387, 1992.
Karan, M., Liddell, M., Prober, S., Arndt, S., Beringer, J., Boer, M., Cleverly, J., Eamus, D., Grace, P., van Gorsel, E., Hero, J.-M., Hutley, L., Macfarlane, C., Metcalfe, D., Meyer, W., Pendall, E., Sebastian, A., and Wardlaw, T.: The Australian SuperSite Network: a continental, long-term terrestrial ecosystem observatory, Sci. Total Environ., 568, 1263–1274, https://doi.org/10.1016/j.scitotenv.2016.05.170, 2016.
Leffler, A. J. and Evans, A. S.: Variation in carbon isotope composition among years in the riparian tree Populus fremontii, Oecologia, 119, 311–319, 1999.
Maslin, B. R. and Reid, J. E.: A taxonomic revision of Mulga (Acacia aneura and its close relatives: Fabaceae) in Western Australia, Nuytsia, 22, 129–167, 2012.
Medlyn, B. E., Duursma, R. A., Eamus, D., Ellsworth, D. S., Prentice, I. C., Barton, C. V. M., Crous, K. Y., De Angelis, P., Freeman, M., and Wingate, L.: Reconciling the optical and empirical approaches to modelling stomatal conductance, Glob. Change Biol., 17, 2134–2144, 2011.
Meinzer, F. C. and Grantz, D. A.: Stomatal and hydraulic conductance in growing sugarcane: stomatal adjustment to water transport capacity, Plant Cell Environ., 13, 383–388, 1990.
Miller, J. M., Williams, R. J., and Farquhar, G. D.: Carbon isotope discrimination by a sequence of Eucalyptus species along a subcontinental rainfall gradient in Australia, Func. Ecol., 15, 222–232, 2001.
Morton, S., Smith, D. S., Dickman, C. R., Dunkerley, D., Friedel, M., McAllister, R., Reid, J., Roshier, D., Smith, M., and Walsh, F.: A fresh framework for the ecology of arid Australia, J. Arid Environ., 75, 313–329, 2011.
Niinemets, Ü., Portsmuth, A., and Tobias, M.: Leaf size modifies support biomass distribution among stems, petioles and mid-ribs in temperate plants, New Phytol., 171, 91–104, 2006.
Niinemets, Ü., Portsmuth, A., Tena, D., Tobias, M., Matesanz, S., and Valladares, F.: Do we underestimate the importance of leaf size in plant economics? Disproportional scaling of support costs within the spectrum of leaf physiognomy, Ann. Bot., 100, 283–303, 2007.
Niklas, K. J., Cobb, E. D., Niinemets, Ü., Reich, P. B., Sellin, A., Shipley, B., and Wright, I. J.: “Diminishing returns” in the scaling of functional leaf traits across and within species groups, P. Natl. Acad. Sci., 104, 8891–8896, 2007.
Nolan, R. H., Fairweather, K. A., Tarin, T., Santini, N. S., Cleverly, J., Faux, R., and Eamus, D.: Divergence in plant water-use strategies in semiarid woody species, Funct. Plant Biol., 44, 1134–1146, https://doi.org/10.1071/FP17079, 2017.
NRETA: The Ti Tree Basin Aquifer. Department of Natural Resources, Environment and the Arts, Water Resources Branch, Land and Water Division, available at: https://supersites.tern.org.au/images/resource/TiTree_Basin_Groundwater.pdf (last access: April 2018), 2007.
NRETAS: Ti Tree Basin Water Resource Report, Department of Natural Resources, Environment, the Arts and Sport, Natural Resource Management Division, Water Management Branch Document No. 04/2009A, ISBN:978-1-921519-21-5, 2009.
O'Grady, A. P. and Holland, K.: Review of Australian groundwater discharge studies of terrestrial systems, CSIRO National Water Commission, Report, 60 pp., https://doi.org/10.4225/08/5852dc73abbe4, 2010.
O'Grady, A. P., Cook, P. G., Howe, P., and Werren, G.: Groundwater use by dominant tree species in tropical remnant vegetation communities, Aust. J. Bot., 54, 155–171, 2006a.
O'Grady, A. P., Eamus, D., Cook, P. G., and Lamontagne, S.: Comparative water use by the riparian trees Melaleuca argentea and Corymbia bella in the wet–dry tropics of northern Australia, Tree Phys., 26, 219–228, 2006b.
O'Grady, A. P., Eamus, D., Cook, P. G., and Lamontagne, S.: Groundwater use by riparian vegetation in the wet–dry tropics of northern Australia, Aust. J. Bot., 54, 145–154, 2006c.
O'Grady, A. P., Cook, P. G., Eamus, D., Duguid, A., Wischusen, J. D. H., Fass, T., and Worldege, D.: Convergence of tree water use within an arid-zone woodland, Oecologia, 160, 643–655, 2009.
O'Grady, A. P., Carter, J. L., and Bruce, J.: Can we predict groundwater discharge from terrestrial ecosystems using existing eco-hydrological concepts?, Hydrol. Earth Syst. Sci., 15, 3731–3739, https://doi.org/10.5194/hess-15-3731-2011, 2011.
Pressland, A. J.: Productivity and management of mulga in south-western Queensland in relation to tree structure and density, Aust. J. Bot., 23, 965–976, 1975.
Prior, L. D., Eamus, D., and Duff, G. A.: Seasonal and diurnal patterns of carbon assimilation, stomatal conductance and leaf water potential in Eucalyptus tetrodonta saplings in a wet–dry savanna in northern Australia, Aust. J. Bot., 45, 241–258, 1997.
Reynolds, J. F., Smith, D. M. S., Lambin, E. F., Turner, B., Mortimore, M., Batterbury, S. P., Downing, T. E., Dowlatabadi, H., Fernández, R. J., and Herrick, J. E.: Global desertification: building a science for dryland development, Science, 316, 847–851, 2007.
Rumman, R., Atkin, O. K., Bloomfield, K. J., and Eamus, D.: Variation in bulk-leaf 13C discrimination, leaf traits and water use efficiency – trait relationships along a continental-scale climate gradient in Australia, Glob. Change Biol., 24, 1186–1200, 2017.
Sack, L. and Frole, K.: Leaf structural diversity is related to hydraulic capacity in tropical rain forest trees, Ecology, 87, 483–491, 2006.
Sack, L. and Holbrook, N. M.: Leaf hydraulics, Ann. Rev. Plant Biol., 57, 361–381, 2006.
Sack, L. and Scoffoni, C.: Leaf venation: structure, function, development, evolution, ecology and applications in the past, present and future, New Phytol., 198, 983–1000, 2013.
Sack, L., Cowan, P., Jaikumar, N., and Holbrook, N.: The “hydrology” of leaves: co-ordination of structure and function in temperate woody species, Plant Cell Environ., 26, 1343–1356, 2003.
Santini, N. S., Cleverly, J., Faux, R., Lestrange, C., Rumman, R., and Eamus, D.: Xylem traits and water-use efficiency of woody species co-occurring in the Ti Tree Basin arid zone, Trees, 30, 295–303, 2016.
Schmidt, S., Lamble, R. E., Fensham, R. J., and Siddique, I.: Effect of woody vegetation clearing on nutrient and carbon relations of semi-arid dystrophic savanna, Plant Soil, 331, 79–90, 2010.
Shanafield, M., Cook, P. G., Gutiérrez-Jurado, H. A., Faux, R., Cleverly, J., and Eamus, D.: Field comparison of methods for estimating groundwater discharge by evaporation and evapotranspiration in an arid-zone playa, J. Hydrol., 527, 1073–1083, https://doi.org/10.1016/j.jhydrol.2015.06.003, 2015.
Singer, M. B., Sargean, C. I., Piegay, H., Riquier, J., Wilson, R. J. S., and Evans, C. N.: Floodplain ecohydrology: Climatic, anthropogenic, and local physical controls on partitioning of water sources to riparian trees, Water Resour. Res., 50, 4490–4513, 2014.
Sommerville, K. E., Gimeno, T. E., and Ball, M. C.: Primary nerve (vein) density influences spatial heterogeneity of photosynthetic response to drought in two Acacia species, Funct. Plant Biol., 37, 840–848, 2010.
Sommerville, K. E., Sack, L., and Ball, M. C.: Hydraulic conductance of Acacia phyllodes (foliage) is driven by primary nerve (vein) conductance and density, Plant Cell Environ., 35, 158–168, 2012.
Sperry, J. S.: Hydraulic constraints on plant gas exchange, Agr. Forest Meteorol., 104, 13–23, 2000.
Stewart, G. R., Turnbull, M., Schmidt, S., and Erskine, P.: 13C natural abundance in plant communities along a rainfall gradient: a biological integrator of water availability, Funct. Plant Biol., 22, 51–55, 1995.
Taylor, D.: Tree, leaf and branch trait coordination along an aridity gradient, PhD Thesis, University of Technology, Sydney, 2008.
Thomas, D. S. and Eamus, D.: The influence of predawn leaf water potential on stomatal responses to atmospheric water content at constant Ci and on stem hydraulic conductance and foliar ABA concentrations, J. Exp. Bot., 50, 243–251, 1999.
Thorburn, P. J., Mensforth, L. J., and Walker, G. R.: Reliance of creek-side river red gums on creek water, Mar. Freshwater Res., 45, 1439–1443, 1994.
Uhl, D. and Mosbrugger, V.: Leaf venation density as a climate and environmental proxy: a critical review and new data, Palaeogeogr. Palaeocl., 149, 15–26, 1999.
UTS library: Application of stable isotope analyses to examine patterns of water uptake, water use strategies and water use efficiency on contrasting ecosystems in Australia, available at: http://hdl.handle.net/10453/102763, last access: August 2018
Villeneuve, S., Cook, P. G., Shanafield, M., Wood, C., and White, N.: Groundwater recharge via infiltration through an ephemeral riverbed, central Australia, J. Arid Environ., 117, 47–58, https://doi.org/10.1016/j.jaridenv.2015.02.009, 2015.
Warren, C. R., Tausz, M., and Adams, M. A.: Does rainfall explain variation in leaf morphology and physiology among populations of red ironbark (Eucalyptus sideroxylon subsp. tricarpa) grown in a common garden?, Tree Physiol., 25, 1369–1378, 2005.
Werner, C., Schnyder, H., Cuntz, M., Keitel, C., Zeeman, M. J., Dawson, T. E., Badeck, F.-W., Brugnoli, E., Ghashghaie, J., Grams, T. E. E., Kayler, Z. E., Lakatos, M., Lee, X., Máguas, C., Ogée, J., Rascher, K. G., Siegwolf, R. T. W., Unger, S., Welker, J., Wingate, L., and Gessler, A.: Progress and challenges in using stable isotopes to trace plant carbon and water relations across scales, Biogeosciences, 9, 3083–3111, https://doi.org/10.5194/bg-9-3083-2012, 2012.
West, A. G., Patrickson, S. J., and Ehleringer, J. R.: Water extraction times for plant and soil materials used in stable isotope analysis, Rapid Comm. Mass Spec., 20, 1317–1321, 2006.
Wright, I. J., Groom, P. K., Lamont, B. B., Poot, P., Prior, L. D., Reich, P. B., Schulze, E. D., Veneklaas, E. J., and Westoby, M.: Leaf trait relationships in Australian plant species, Funct. Plant Biol., 31, 551–558, https://doi.org/10.1071/fp03212, 2004.
Wright, B. R., Latz, P. K., and Zuur, A. F.: Fire severity mediates seedling recruitment patterns in slender mulga (Acacia aptaneura), a fire-sensitive Australian desert shrub with heat-stimulated germination, Plant Ecol., 217, 789–800, https://doi.org/10.1007/s11258-015-0550-0, 2016.
Zolfaghar, S., Villalobos-Vega, R., Cleverly, J., Zeppel, M., Rumman, R., and Eamus, D.: The influence of depth-to-groundwater on structure and productivity of Eucalyptus woodlands, Aust. J. Bot., 62, 428–437, 2014.
Zolfaghar, S., Villalobos-Vega, R., Cleverly, J., and Eamus, D.: Co-ordination among leaf water relations and xylem vulnerability to embolism of Eucalyptus trees growing along a depth-to-groundwater gradient, Tree Physiol., 35, 732–743, https://doi.org/10.1093/treephys/tpv039, 2015.
Zolfaghar, S., Villalobos-Vega, R., Zeppel, M., Cleverly, J., Rumman, R., Hingee, M., Boulain, N., Li, Z., Eamus, D., and Tognetti, R.: Transpiration of Eucalyptus woodlands across a natural gradient of depth-to-groundwater, Tree Physiol., 37, 961–975, https://doi.org/10.1093/treephys/tpx024, 2017.