the Creative Commons Attribution 4.0 License.
the Creative Commons Attribution 4.0 License.
 | 20 Jul 2018
Water ages in the critical zone of long-term experimental sites in northern latitudes
Matthias Sprenger
Doerthe Tetzlaff
Jim Buttle
Hjalmar Laudon
Chris Soulsby
As northern environments undergo intense changes due to a warming climate and altered land use practices, there is an urgent need for improved understanding of the impact of atmospheric forcing and vegetation on water storage and flux dynamics in the critical zone. We therefore assess the age dynamics of water stored in the upper 50 cm of soil, and in evaporation, transpiration, or recharge fluxes at four soil–vegetation units of podzolic soils in the northern latitudes with either heather or tree vegetation (Bruntland Burn in Scotland, Dorset in Canada, and Krycklan in Sweden). We derived the age dynamics with the physically based SWIS (Soil Water Isotope Simulator) model, which has been successfully used to simulate the hydrometric and isotopic dynamics in the upper 50 cm of soils at the study sites. The modelled subsurface was divided into interacting fast and slow flow domains. We tracked each day's infiltrated water through the critical zone and derived forward median travel times (which show how long the water takes to leave the soil via evaporation, transpiration, or recharge), and median water ages (to estimate the median age of water in soil storage or the evaporation, transpiration, and recharge fluxes). Resulting median travel times were time-variant, mainly governed by major recharge events during snowmelt in Dorset and Krycklan or during the wetter winter conditions in Bruntland Burn. Transpiration travel times were driven by the vegetation growth period with the longest travel times (200 days) for waters infiltrated in early dormancy and the shortest travel times during the vegetation period. However, long tails of the travel time distributions in evaporation and transpiration revealed that these fluxes comprised waters older than 100 days. At each study site, water ages of soil storage, evaporation, transpiration, and recharge were all inversely related to the storage volume of the critical zone: water ages generally decreased exponentially with increasing soil water storage. During wet periods, young soil waters were more likely to be evapotranspired and recharged than during drier periods. While the water in the slow flow domain showed long-term seasonal dynamics and generally old water ages, the water ages of the fast flow domain were generally younger and much flashier. Our results provide new insights into the mixing and transport processes of soil water in the upper layer of the critical zone, which is relevant for hydrological modelling at the plot to catchment scales as the common assumption of a well-mixed system in the subsurface holds for neither the evaporation, transpiration, or recharge.
- Article
(5850 KB) - Full-text XML
-
Supplement
(2443 KB) - BibTeX
- EndNote


Water ages are useful metrics to assess hydrological processes as they reveal interactions between storage and fluxes of water in a hydrological system (Hrachowitz et al., 2013; Tetzlaff et al., 2014; Pfister et al., 2017). Temporal variability of the water ages of streams results from the dynamics of hydro-meteorological conditions and wetness state of the catchment (Botter et al., 2010; van der Velde et al., 2012; Heidbüchel et al., 2013; Birkel et al., 2015; Hrachowitz et al., 2016). Thus, understanding the interplay between the climatic drivers and the state of the hydrological system is increasingly relevant in the light of climate and land use changes.
Northern environments have been shown to undergo particularly pronounced changes with an increase in land surface temperature (Hartmann et al., 2013) and tree cover (Forkel et al., 2016). Such altered climatic conditions and/or changes in vegetation cover are likely to modify the partitioning of water in the critical zone into evaporation, transpiration, and recharge fluxes (Tetzlaff et al., 2013; Wang et al., 2018). As it has been shown that dynamics of evapotranspiration (ET) fluxes affect the water ages of catchment runoff (van der Velde et al., 2012; Birkel et al., 2012; Ali et al., 2014) and groundwater recharge (Sprenger et al., 2016), a better understanding of the ET dynamics and their effect on water ages and storage dynamics is needed. Water ages in ET fluxes also deserve increasing attention (Botter et al., 2010, 2011; Harman, 2015; Soulsby et al., 2016; van Huijgevoort et al., 2016) as the interlinkages between water stored in a hydrological system and the vegetation cover using that water are crucial to address challenges of water supply (Sterling et al., 2013; Wei et al., 2018).
Here, we address recent findings from water age theory, defined as an “inverse storage effect” (Harman, 2015), where the storage in a hydrological system is related to the ages of the water fluxes leaving the system. At the catchment scale, several modelling studies have shown younger water ages during wet periods with high storage volumes (van der Velde et al., 2012; Benettin et al., 2013; Heidbüchel et al., 2013; Soulsby et al., 2015; Benettin et al., 2017). Detailed experimental work on a sloping lysimeter with pulse irrigation provided insights into the flow path changes that can explain the inverse relationship between storage volume and runoff age (Pangle et al., 2017). However, despite general acknowledgement that the conceptualization of the unsaturated zone in models affects runoff age estimates (McMillan et al., 2012; Heidbüchel et al., 2013; van der Velde et al., 2015), it is unclear whether/how soils contribute to an inverse storage effect. Given that soil storage as a percentage of total catchment storage was estimated to range from 20 % in the Scottish Highlands (Tetzlaff et al., 2014) to up to 80 % of the total catchment storage in rainfall-dominated alpine catchments (Staudinger et al., 2017), the role of soil water storage in water age dynamics needs to be more clearly identified. Further, an assessment of the variability of water ages within different pore spaces (e.g. mobile versus more tightly bound water – Brooks et al., 2010; Good et al., 2015; Sprenger et al., 2018b; Smith et al., 2018) and with soil depth is still needed; this would also provide a test of the common assumption of a well-mixed system in tracer-aided modelling (van der Velde et al., 2015). Also, it has not yet been established how the ages of soil water storage and evaporation and transpiration fluxes are related to the variability of soil storage volumes.
To address these shortcomings, we examine the following questions in this paper. (1) How long does it take for precipitation to leave the soil profile via evaporation, transpiration, or recharge (travel times)? (2) How old is the water in these fluxes and the soil storage (water ages)? (3) What are the controls on the dynamics of travel times and water ages in fluxes from, and storage within, the critical zone?
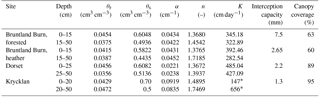
The study sites were located in three long-term experimental catchments in the northern latitudes (map provided in Fig. S1): Bruntland Burn in the Scottish Highlands, UK (57∘2′ N, 3∘7′ W), Dorset in southern–central Ontario, Canada (45∘12′ N, 78∘49′ W), and Krycklan in northern Sweden (64∘14′ N, 19∘46′ E). Climatic conditions range from temperate fully humid with cool summers at Bruntland Burn to cold fully humid with either warm summers in Dorset or cold summers in Krycklan. At all sites, there is a pronounced seasonality in air temperature and the long-term annual means are 6.6 ∘C at Bruntland Burn, 4.8 ∘C at Dorset, and 1.8 ∘C at Krycklan. Precipitation is generally relatively evenly distributed over the year at all sites, but snow accumulates at Dorset and Krycklan during the winter, leading to a pronounced soil infiltration pulse during snowmelt in early spring. At Bruntland Burn, snowfall usually plays a minor role in the water balance (Ala-aho et al., 2017a), but rainfall occurs commonly at low intensities throughout the year (1000 mm yr−1). Average annual precipitation is 1020 mm yr−1 at Dorset and 622 mm yr−1 at Krycklan. A detailed comparison of the hydro-meteorological conditions at the three catchments was presented by Tetzlaff et al. (2015). Soils of the four sites were characterized as freely draining podzols of generally coarse texture ranging from loamy or silty sands to sand with an overlying organic layer of about 10–20 cm thickness. One site at Bruntland Burn was covered with Scots pine (Pinus sylvestris) and the other site was vegetated by Ericacae shrubs (Calluna vulgaris). Vegetation cover at Dorset was white pine (Pinus strobus), while at Krycklan, the soil was covered by Scots pine (Pinus sylvestris). Rooting depths were observed in the field to be ∼ 50 cm for the trees and 15 cm for the heather shrubs. Canopy coverage was about 60 % at the Bruntland Burn sites and about 89 and 95 % at Dorset and Krycklan, respectively. All four locations were on hillslopes of low gradients (< 9∘). Detailed descriptions of the soil and vegetation characteristics at the investigated sites were presented by Sprenger et al. (2018b), where the sites were called “NF”, “NH”, “Pw”, and “S22”, respectively.
3.1 Data
Meteorological data including air temperature (∘C), relative humidity (%), rainfall or snowmelt amount (mm day−1) (Sprenger et al., 2018b), and potential evapotranspiration (mm day−1) estimated using the Penman–Monteith equation (Allen et al., 1998) were available on a daily basis at each catchment.
Soil hydraulic characteristics, as shown in the Supplement (Fig. S2), were derived for Bruntland Burn and Dorset from the pedotransfer functions provided by Schaap et al. (2001) using site-specific soil textural and bulk density information (Sprenger et al., 2018b). For Krycklan, the hydraulic parameters were estimated based on laboratory measurements (Nyberg et al., 2001).
Table 1Model parameters: depths of the soil horizons, Mualem–van Genuchten parameters (θr: residual water content, θs: saturated water content, α: air entry value, n: shape parameter), saturated hydraulic conductivity K, interception capacity, and canopy coverage (Sprenger et al., 2018b).
3.2 Soil water flow and transport modelling
The simulations of travel times and water ages are based on tracking, in a 1-D soil hydraulic model, the infiltrated water (rainfall and snowmelt) with a virtual tracer in soil storage and fluxes leaving the soil. We applied the SWIS model as described in detail by Sprenger et al. (2018b). The SWIS model solves the Richards equation for water flow and simulates tracer transport with the advection–dispersion equation. The SWIS model can partition the subsurface into two flow domains (Fig. S3): a fast flow domain representing the soil pores that hold the water at pressure heads < 600 hPa and a slow flow domain covering the pores with a water retention > 600 hPa. A threshold of 600 hPa was chosen to divide the two pore domains, as this is approximately the pressure head applied by suction lysimeters to extract water. This definition allowed us to use stable isotope data (2H and 18O) of the mobile flow domain (sampled with suction lysimeters) and the bulk soil water (slow plus fast flow domain) sampled with the direct equilibration method (Wassenaar et al., 2008) for benchmarking the model performance at the individual study sites as presented by Sprenger et al. (2018b). Ingraham and Criss (1993) found that two water pools approach as a function of water volumes, surface area, and saturated vapour pressure (temperature) a weighted average isotopic composition of the two pools. Our previous study showed that a conceptualization of the subsurface with two pore domains that exchange water in accordance with Ingraham and Criss (1993) via the soil gas phase improved the simulation of the soil water stable isotopic composition at 10 and 20 cm depths at the investigated sites compared to an assumption of uniform flow. Therefore, we apply the same model set-up of SWIS as presented in detail by Sprenger et al. (2018b) with the parameters given in Table 1. In accordance with Vanderborght and Vereecken (2007), we set the dispersivity parameter to 10 cm at all sites. The soil physical parameters were the same for the two pore domains and the exchange was solely conceptualized as vapour exchange rather than via hydraulic dispersion. The implemented tracer exchange between the slow and fast flow domains results in a slow approach of the virtual tracer concentrations in the two pore domains. Thus, the exchange leads towards a homogenization of water ages between the two flow domains. Consistent with soil physics principles, the slow flow domain is filled first and remains saturated until the fast flow domain is emptied (Hutson and Wagenet, 1995). Water flow and tracer transport occur in both domains and recharge is generated accordingly. However, only the combined recharge flux rate (R) and weighted average tracer concentrations from both domains are provided. The model domain covered the soil profile down to 50 cm depth in 5 cm intervals. Root water uptake was limited according to rooting depth observations to the upper 15 cm at the heather site in Bruntland Burn and to the entire 50 cm soil profile at the forested sites. Soil evaporation (E) was limited to the upper 10 cm based on experiments by Or et al. (2013). ET was partitioned into potential E and potential transpiration (T) according to the canopy coverage (Table 1) according to Ritchie (1972). Since sap flow was measured at the forest site in Bruntland Burn (Wang et al., 2017a) and E estimates based on the maximum entropy theory were available for the heather site in Bruntland Burn (Wang et al., 2017b), we used this information to adjust the partitioning of ET at these sites. E and T both decreased linearly with depth and occurred from both the fast and slow flow domains (T limited to the permanent wilting point assumed to be at 15 000 hPa, Fig. S2). Contrary to the application of the SWIS model for stable isotope modelling, E did not alter the virtual tracer concentration (similar to T), but reduced the soil moisture at the depths of E losses and root water uptake, respectively. Precipitation was divided into interception and throughfall according to the canopy coverage (Table 1), and when the interception capacity (Table 1) was reached, the surplus infiltrated into the soil. Soil frost does usually not occur at Bruntland Burn and is rare at the Dorset site due to the insulating effect of the snow cover. At Krycklan, soil frost was shown to not induce surface runoff, but soils at the forested site remained permeable (Stähli et al., 2001; Laudon et al., 2007).
3.3 Estimation of travel times and water ages
We defined the start of travel times and zero water age of waters as the day of infiltration into the soil profile. To derive the travel times and water ages, we ran the SWIS model for each day of rainfall or snowmelt from 06/2011 for Bruntland Burn and Dorset and from 01/2010 for Krycklan to 09/2016 and tracked the fate of a virtual tracer in soil storage (fast flow domain, slow flow domain, and total storage) and water fluxes (E, T, and R) as suggested by Sprenger et al. (2016). The number of days with rainfall or snowmelt of all days of simulation were 1381/1943 for the Bruntland Burn sites, 684/1984 for Dorset, and 801/2465 for the Krycklan site. The model was run at daily resolution and the applied parameters are listed in Table 1.
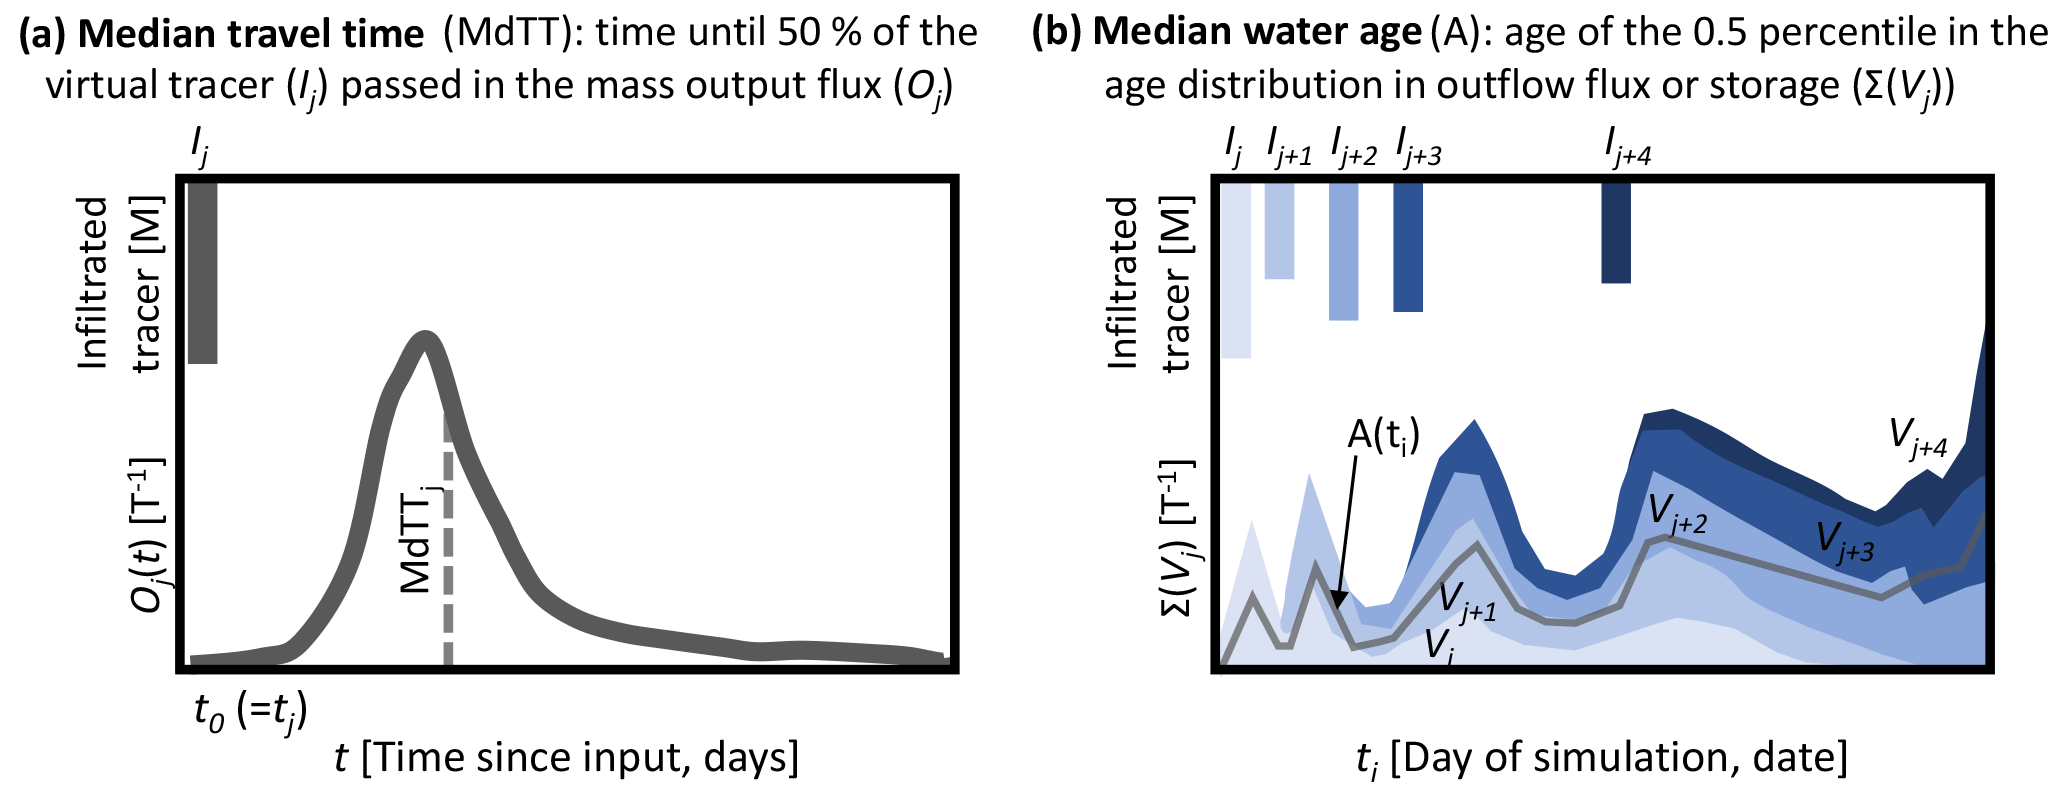
Figure 1Conceptual visualization of the procedure used to derive median travel times (MdTT) of output fluxes (i.e. evaporation, transpiration, recharge) (a) and median water ages (A) in the output fluxes or the soil storage (total storage, storage in fast and slow flow domains, respectively) (b). For MdTT, the breakthrough of an infiltrated virtual tracer mass (Ij) introduced for each individual day of rainfall/snowmelt was tracked in each tracer mass output flux (Oj(t)). The median of the normalized outflow mass flux describes the time until half of the total tracer mass leaving the soil via the output flux was reached. The median water ages in fluxes and storage (visualized as the grey line) were derived from the age of the 50th percentile of the cumulative age distribution of individual tracer inputs (e.g. Ij to Ij+4) contributing varying volumes (Vj to Vj+4) to the considered flux or storage, visualized with different blue tones.
Consistent with the definitions by Benettin et al. (2015), we consider two different metrics as conceptualized in Fig. 1. The first was the median travel time (MdTT) as a forward approach that estimates how long it takes the infiltrated water to leave the soil as E, T, or R flux (also called life expectancy in Benettin et al., 2015). The second was the median water age (A) as a backward approach estimating the age of water in the output fluxes and the soil storage since it infiltrated into the soil (also called residence time in Benettin et al., 2015).
To derive the MdTT, we extracted the breakthrough curves of the normalized mass fluxes Oj(t) in the output fluxes (E, T, and R) generated from each virtual tracer mass introduced during individual infiltration events (Ij) on day j (Fig. 1, left). Normalized mass fluxes Oj(t) (T−1) resulted from the tracer concentration (introduced with Ij) in the flux Cj(t) (M⋅ L−3) times flux rate Q(t) (L) divided by the introduced tracer mass Ij (M):
We then computed the median of the individual breakthrough curves as half of the maximum cumulative Oj(t), which then described the time it took until 50 % of the infiltrated water ended up in the considered output flux from the soil (Sprenger et al., 2016). This leads to a time series showing the median travel times (MdTT in days) required to leave the system via either evaporation (MdTTE), transpiration (MdTTT), or recharge (MdTTR). Since MdTT would be underestimated if not all of the virtual tracer had left entirely the soil storage, we limited the MdTT analysis to the period from 2012 to 2015. We decided to present median values, rather than mean travel times, as the latter can be biased due to uncertainties in the long tails of the transit time distributions (Seeger and Weiler, 2014). We further used the individual breakthrough curves in the E, T, and R fluxes to derive master travel time distributions (MTTD) as introduced by Heidbüchel et al. (2012). In line with Heidbüchel et al. (2012), we superimposed all individual breakthrough curves, weighted them by the event size, and normalized them by the total introduced virtual tracer mass. Such a weighted average travel time distribution was derived for evaporation (MTTDE), transpiration (MTTDT), and recharge (MTTDR) fluxes at each study site. The time after which 50 % of the average tracer mass has left via the considered flux was defined as the median of the MTTD.
We calculated water ages A(ti) by first multiplying Oj(t) (T−1) by the precipitation amount Pj(t= 0) (L3) that introduced the virtual tracer Ij(t= 0) and divided it by the flux volume Q(ti) on the day that we estimated the water ages for, to get the relative share of each precipitation event introduced on day tj in the considered fluxes Vj(t) (T−1).
Multiplication of Vj by the days since tj provides the relative volume of the water of age ti−tj for each considered day (Fig. 1, right). The 50th percentile of the cumulative sum of Vj then defined the median water age. To prevent bias due to water of unknown age in the soil storage (i.e. initial water in the soil at start of simulation), we limited the water age analysis to the period from 2013 to 2016. Here, we report the median water ages in the fast flow domain (ASf), the slow flow domain (ASs), and total soil storage (ASt), and of the evaporation (AE), transpiration (AT), and recharge fluxes (AR).
Distributions of the time-variant median travel times and median water ages in fluxes and storages were derived using cosine kernel density estimations (Venables and Ripley, 2011). Differences in MdTT and water ages between the four sites were analysed using the non-parametric Kruskal–Wallis test with a post hoc Dunn test (significance level of 0.05), since the data were not normally distributed according to the Shapiro–Wilk test. Since running the model for the considered 5 years took between 1 and 3 h and our analysis required running the model between 684 and 1381 times (for each day of precipitation), we were not able to do a formal uncertainty analysis due to the long computation times (up to > 100 days for one set of MdTT and water ages per site). We therefore limit the presented water age analysis to one realization using a parameter set that was previously shown to reflect the water flow and transport dynamics well using stable isotope data (Sprenger et al., 2018b).
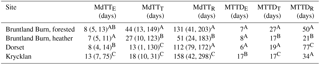
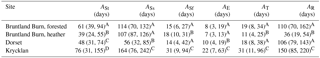
Table 2Summary of median travel time (MdTT, shown in Fig. 2) and master travel time distribution (MTTD) characteristics of the four study sites: median of MdTT (25th percentile, 75th percentile) in the evaporation flux (MdTTE), transpiration flux (MdTTT), recharge flux (MTTR), median of the MTTD of the evaporation flux (MTTDE), transpiration flux (MTTDT), recharge flux (MTTDR). Letters as superscript indicate significant differences in each column. Sites with the same letter are not significantly different regarding the MdTT or MTTD of the considered flux.
4.1 Travel times (How long does it take for infiltrated water to leave the soil again?)
4.1.1 Travel times for evaporation flux
The median estimated travel time for infiltrated water until it was evaporated (MdTTE) varied usually between 4 and 13 days, but was occasionally older than 60 days during late autumn and winter at the Krycklan site (Fig. 2a). In these cases, the fast flow domain emptied and relatively old water from the slow flow domain evaporated. MdTTE tended to be greater when water infiltrated during periods of limited E and infiltration. MdTTE values were similar across the sites (see distribution plots in Fig. 2a), and there were no significant differences between the sites in Bruntland Burn as well as between the forested site in Bruntland Burn and Dorset. However, at Krycklan, where travel times of > 100 days occurred when the fast flow domain emptied, the MdTTE was significantly different to the other sites (Table 2).
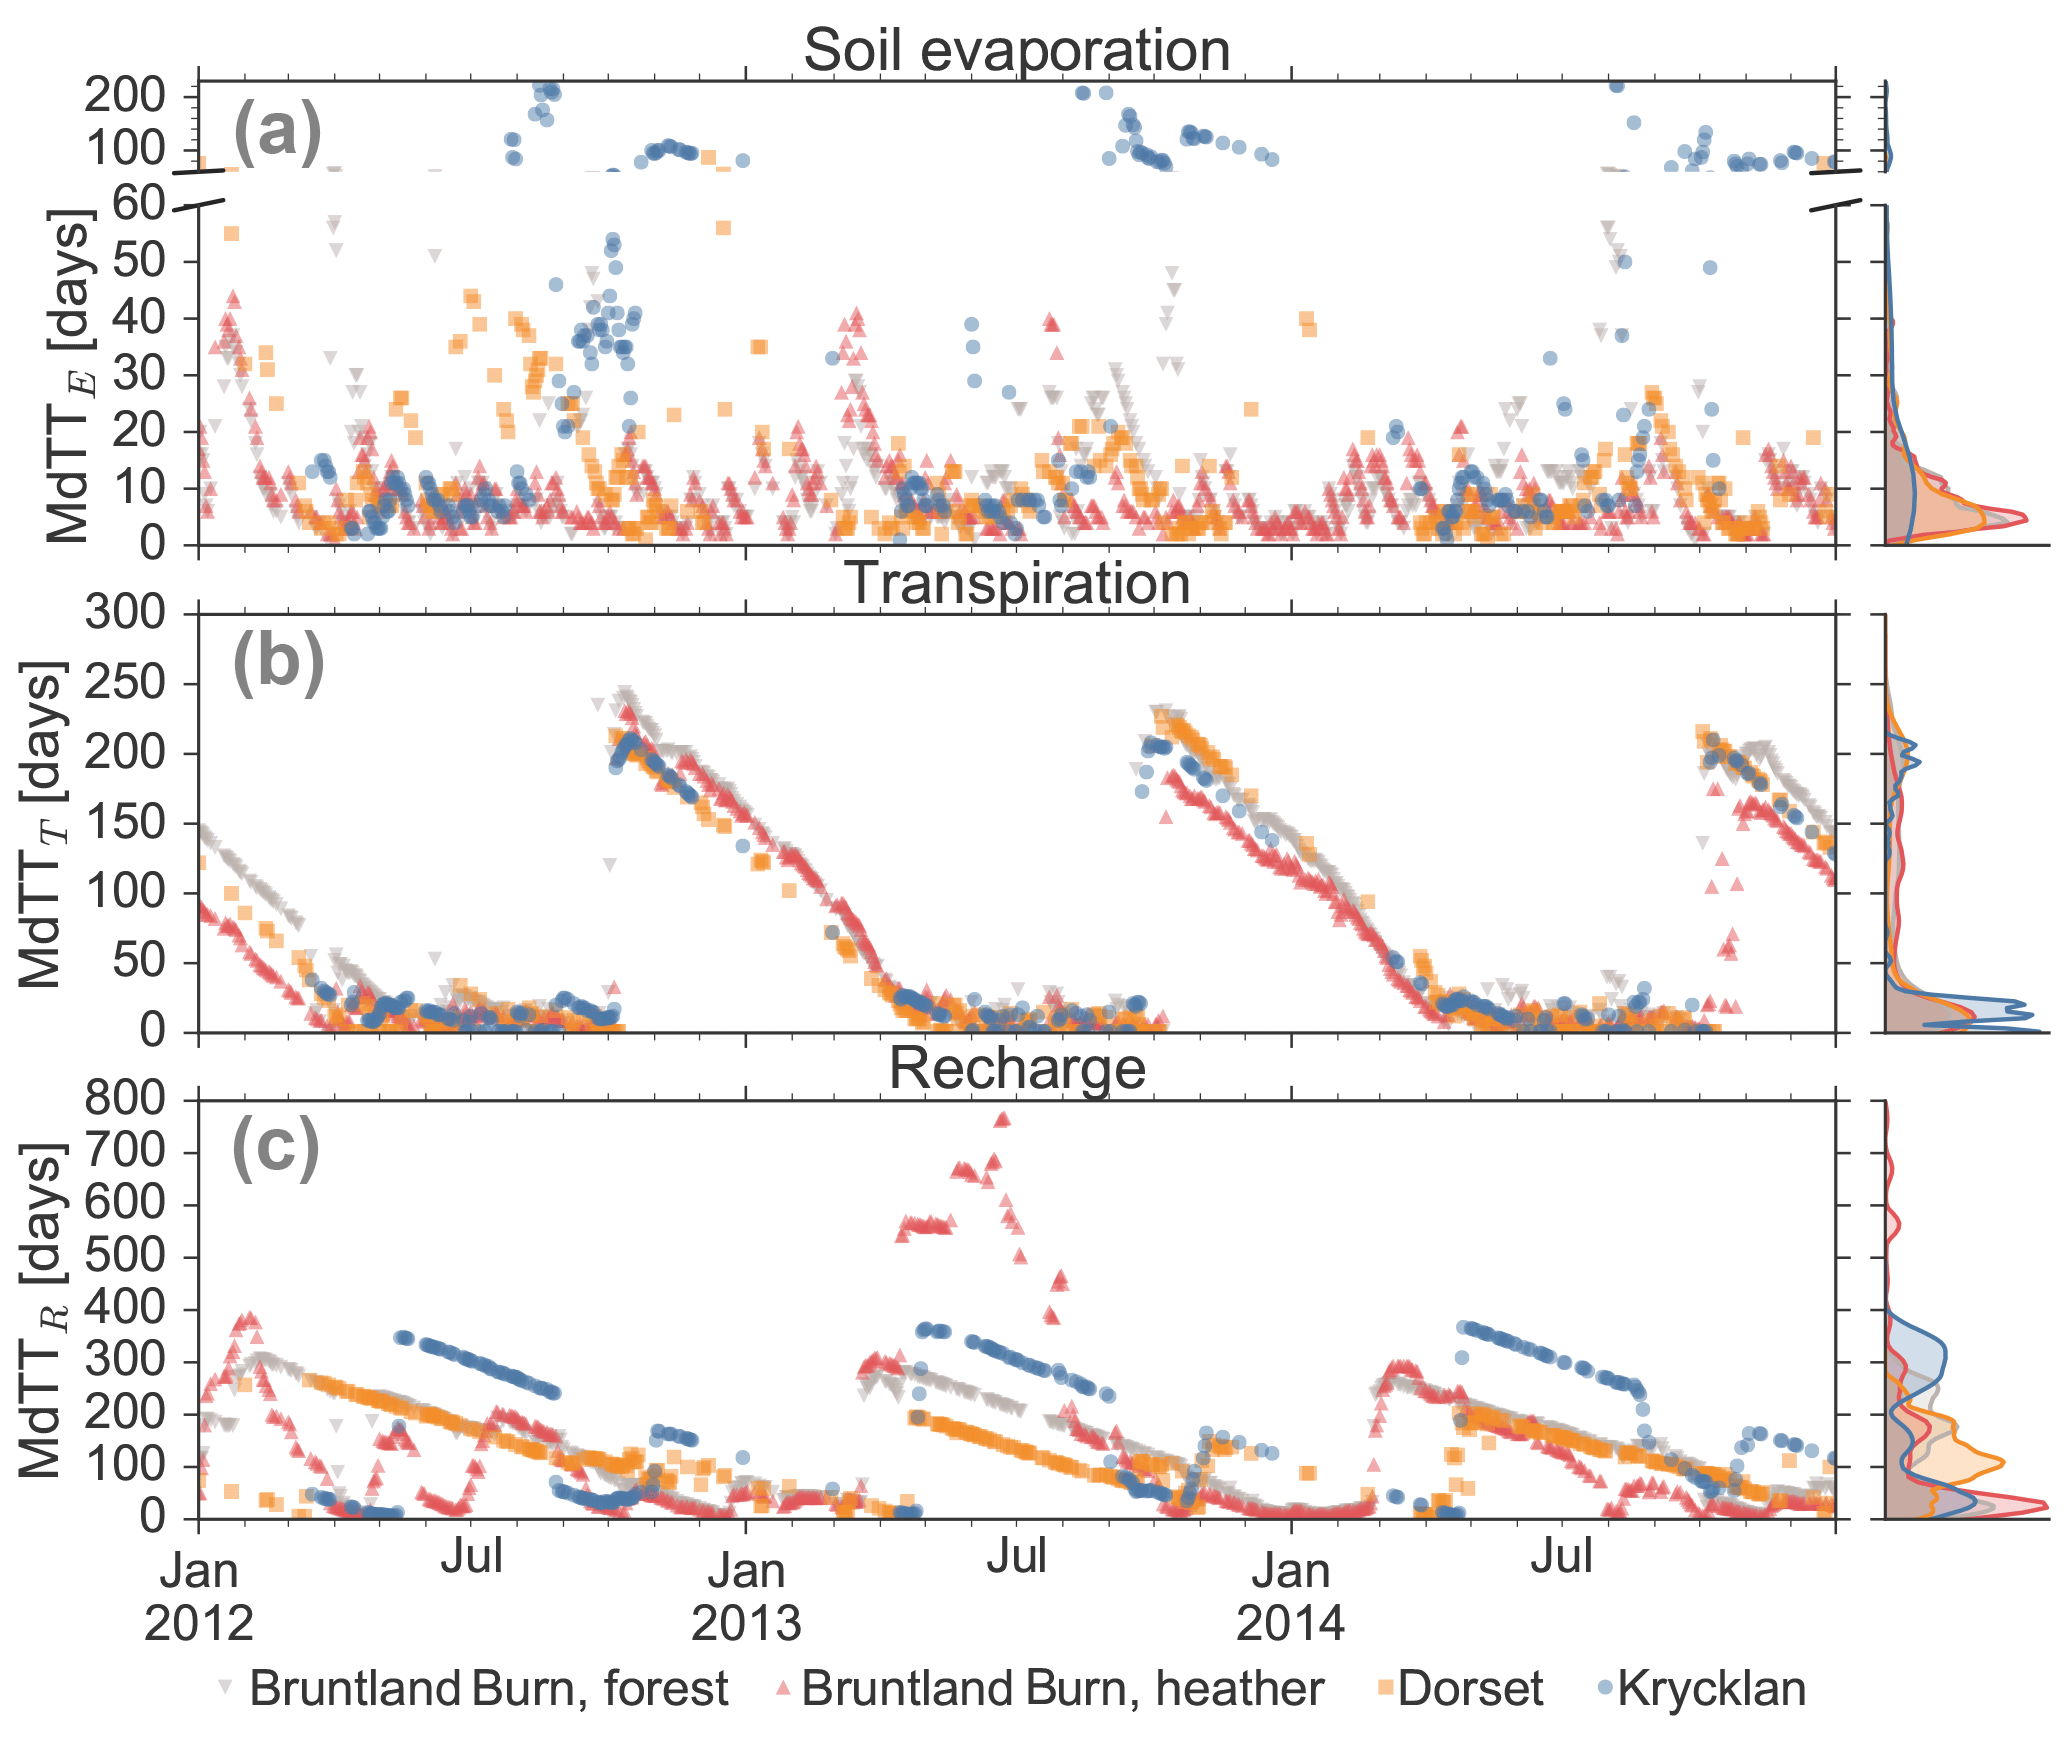
Figure 2Median travel times (MdTT) of water infiltrating into the soil on a specific day (given on the x-axis) until leaving the soil (a) via soil evaporation (MdTTE), (b) transpiration (MdTTT), or (c) recharge (MdTTR) flux. Colour code according to the four studied sites. Note that for days without precipitation or snowmelt, no travel times could be calculated. In subplot (a), the y-axis has different scales for MdTTE < 60 days and > 60 days. Density distributions of the travel times are shown for each site on the right-hand side.
4.1.2 Travel times for transpiration flux
The median travel time of infiltrated water before it was taken up by the roots (MdTTT) was estimated to vary between a few days for waters infiltrated during the growing season and up to 250 days when the water infiltrated just after the growing season (Fig. 2b). Thus, water introduced when the vegetation was active was quickly taken up by the plants, leading to low MdTTT. However, when water infiltrated during the dormant season, this water aged in the rooting zone until it was transpired in the following spring. This resulted in a generally decreasing trend of MdTTT towards the onset of the growing season. MdTTT dynamics were similar across the four sites, due to similar seasonal climatic conditions and growing season length. However, shallower rooting depths for the heather site limited the water uptake to waters of relatively shorter travel times as the shrubs did not have access to water in deeper soils with longer travel times (red triangles in Fig. 2b). Therefore, MdTTT of the heather site in Bruntland Burn was significantly shorter than for the forested site there, which experienced the same climate forcing but had a rooting depth of 50 cm (Table 2). MdTTT and MdTTE were not correlated but had different dynamics, because the seasonal T flux was much larger than E during the growing season, while the E flux generally remained relatively small throughout the year (Fig. S4).
4.1.3 Travel times for recharge flux
Median travel times for water to pass the 50 cm soil depth (MdTTR) showed a clear seasonal pattern with longest travel times (200 to 600 days) for water that infiltrated at the end of spring. In contrast, shortest MdTTR (< 50 days) prevailed during spring (Dorset and Krycklan) and winter (Bruntland Burn) (Fig. 2c). Thus, water that infiltrated during periods of relatively low wetness in the snow-dominated sites in Dorset and Krycklan or rainfall that fell during the growing season when T rates were highest in Bruntland Burn had the longest R travel times (Fig. S5). While MdTTR was not related to the R flux on the day of the traced infiltration event, MdTTR was mainly governed by the time until major flushing of the soil water storage occurred (Fig. 3): the longer it took to for intense R fluxes (defined as > 1.5 mm day−1) to occur following the traced water infiltrating into the soil, the longer it took for the water to become recharge. While the MdTTR values were similar for the forested site in Bruntland Burn and Dorset, MdTTR at the heather site in Brunland Burn was significantly shorter and at Krycklan significantly longer than at the forested Bruntland Burn and Dorset sites (Table 2).
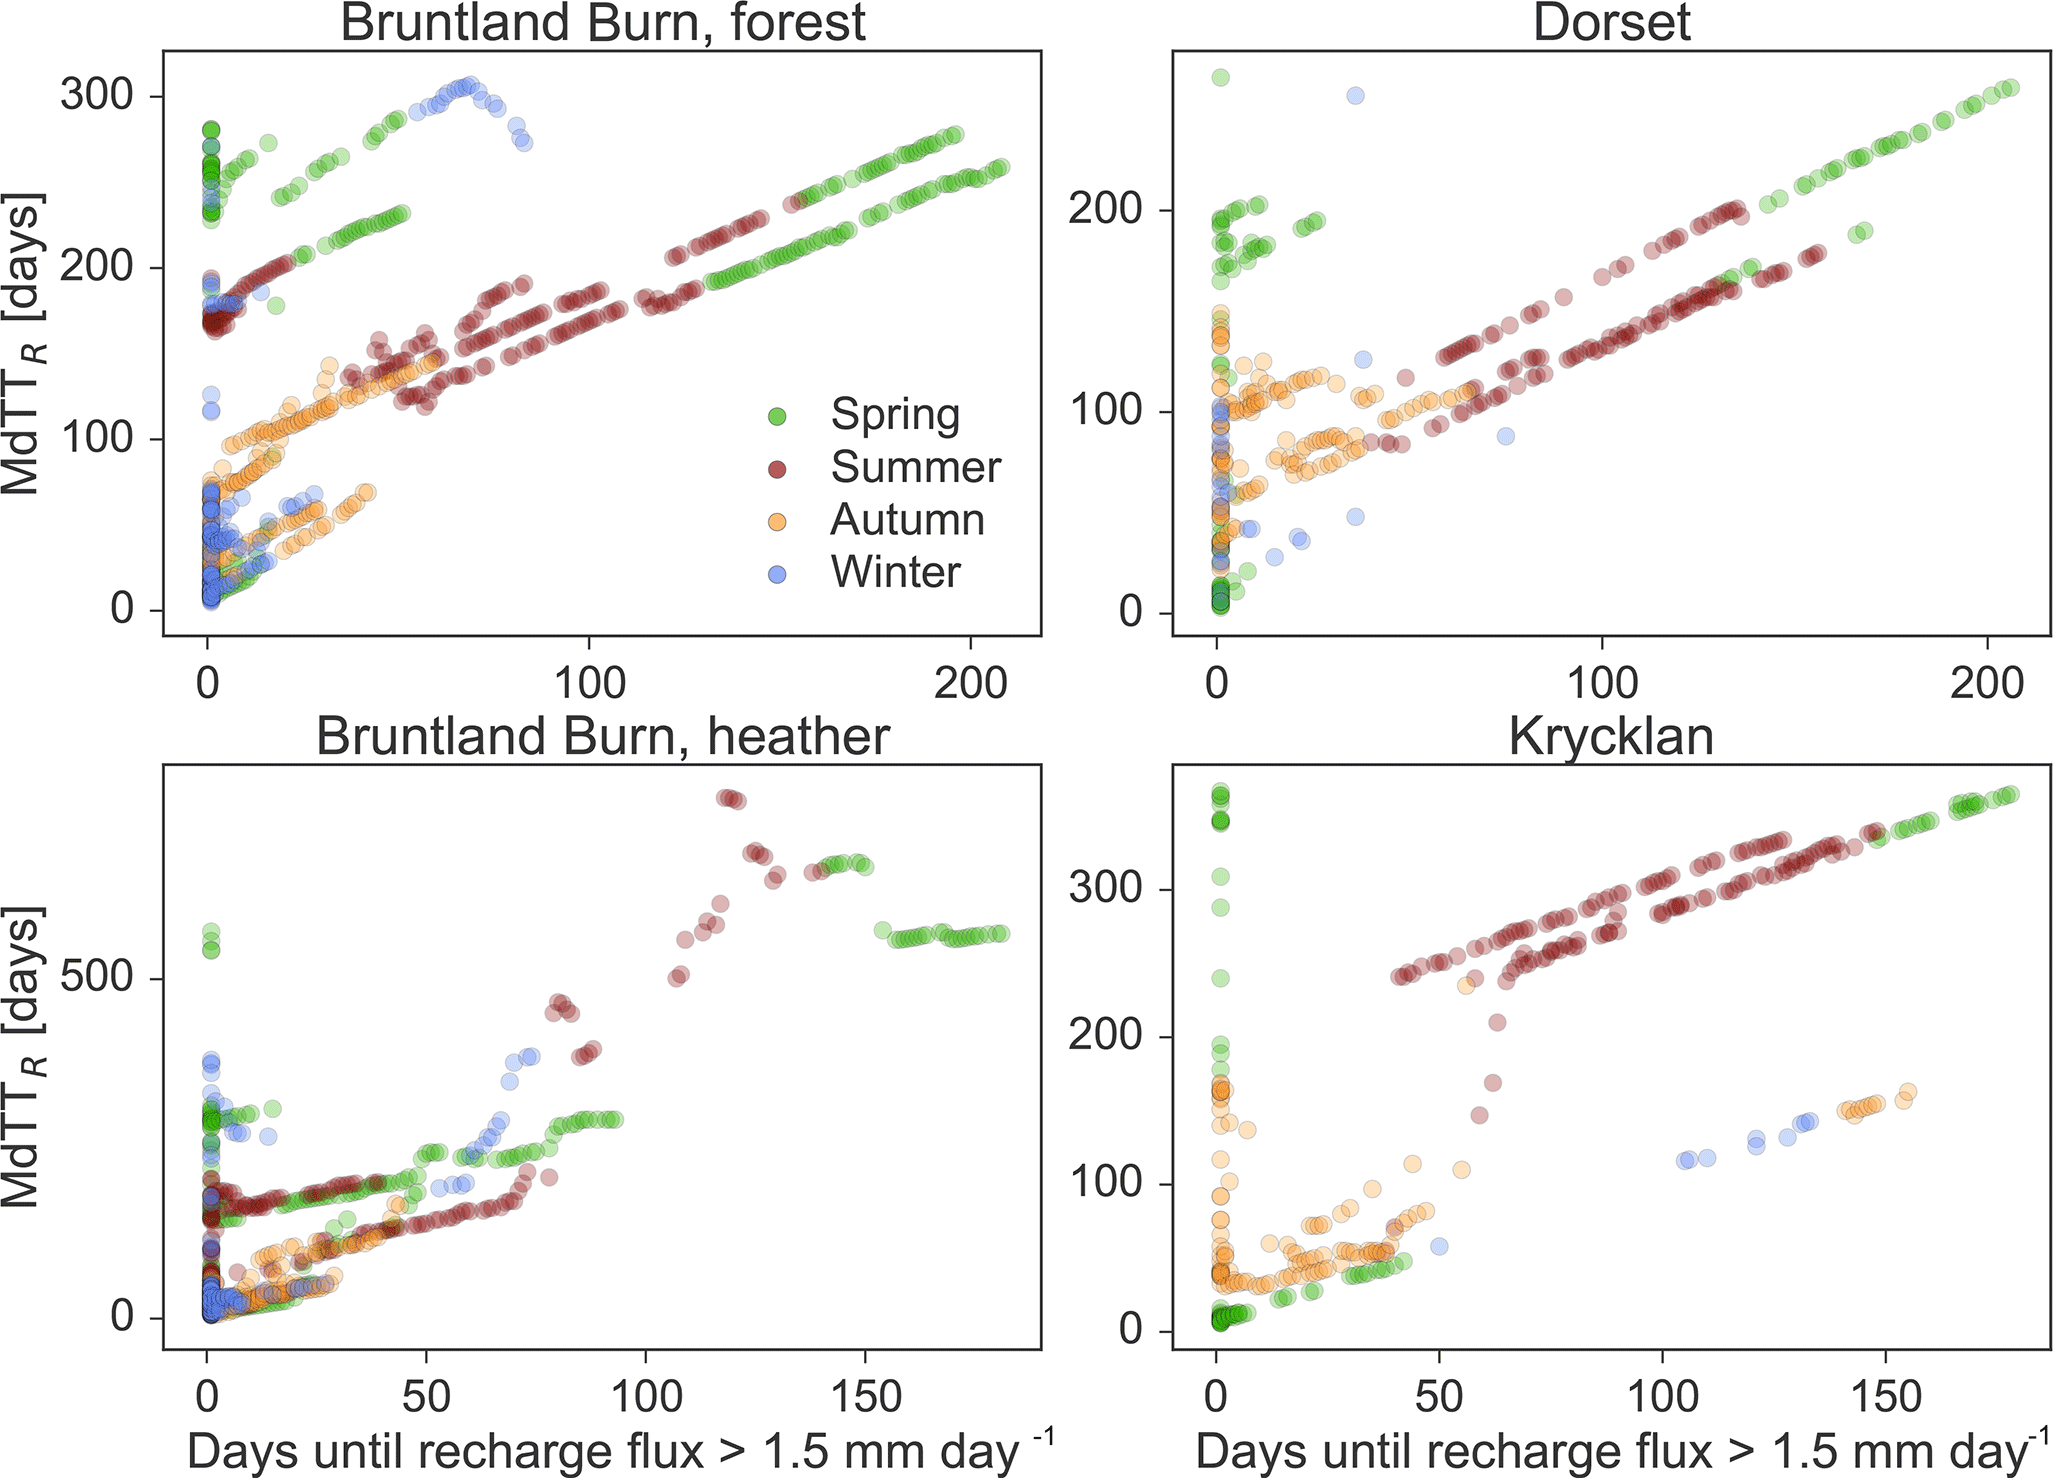
Figure 3Median travel times in recharge flux (MdTTR) for each study site as a function of days required to produce intense recharge fluxes (here defined as > 1.5 mm day−1) following infiltration of the traced water into the soil. The dots show the MdTTR for each day of rain and the colour code represents the season when the traced water infiltrated the soil.
4.1.4 Master travel time distributions
The weighted average description of the travel time, as the master travel time distribution (MTTD), showed the general differences between water transport via E, T and R (Fig. 4). Fastest transport of infiltrated water was generally for the E flux with MTTDE showing response within one day and relatively short tails of the distribution (dashed lines in Fig. 4). MTTDT also showed relatively quick response, but the decrease in tracer mass over time was lower than for MTTDE. The time until the virtual tracer was observed in the R flux (MTTDR) was generally longer compared to the fluxes to the atmosphere and the distributions were characterized by long tails. MTTDE at Krycklan was significantly different from the other sites with a median of 17 days compared to 6–8 days at Bruntland Burn and Dorset (Table 1). MTTDT were statistically similar for the forested site in Bruntland Burn and Dorset, but significantly different to the MTTDT at the heather site in Bruntland Burn and Krycklan site. MTTDR at the heather site was also significantly different and its median of 21 days was the shortest compared to the other sites. At Dorset, median MTTDR were longest (77 days) and their distribution significantly different from the other sites, while MTTDR for the forested Bruntland Burn and Krycklan sites were statistically similar with median values of 50 and 34 days, respectively (Table 1).
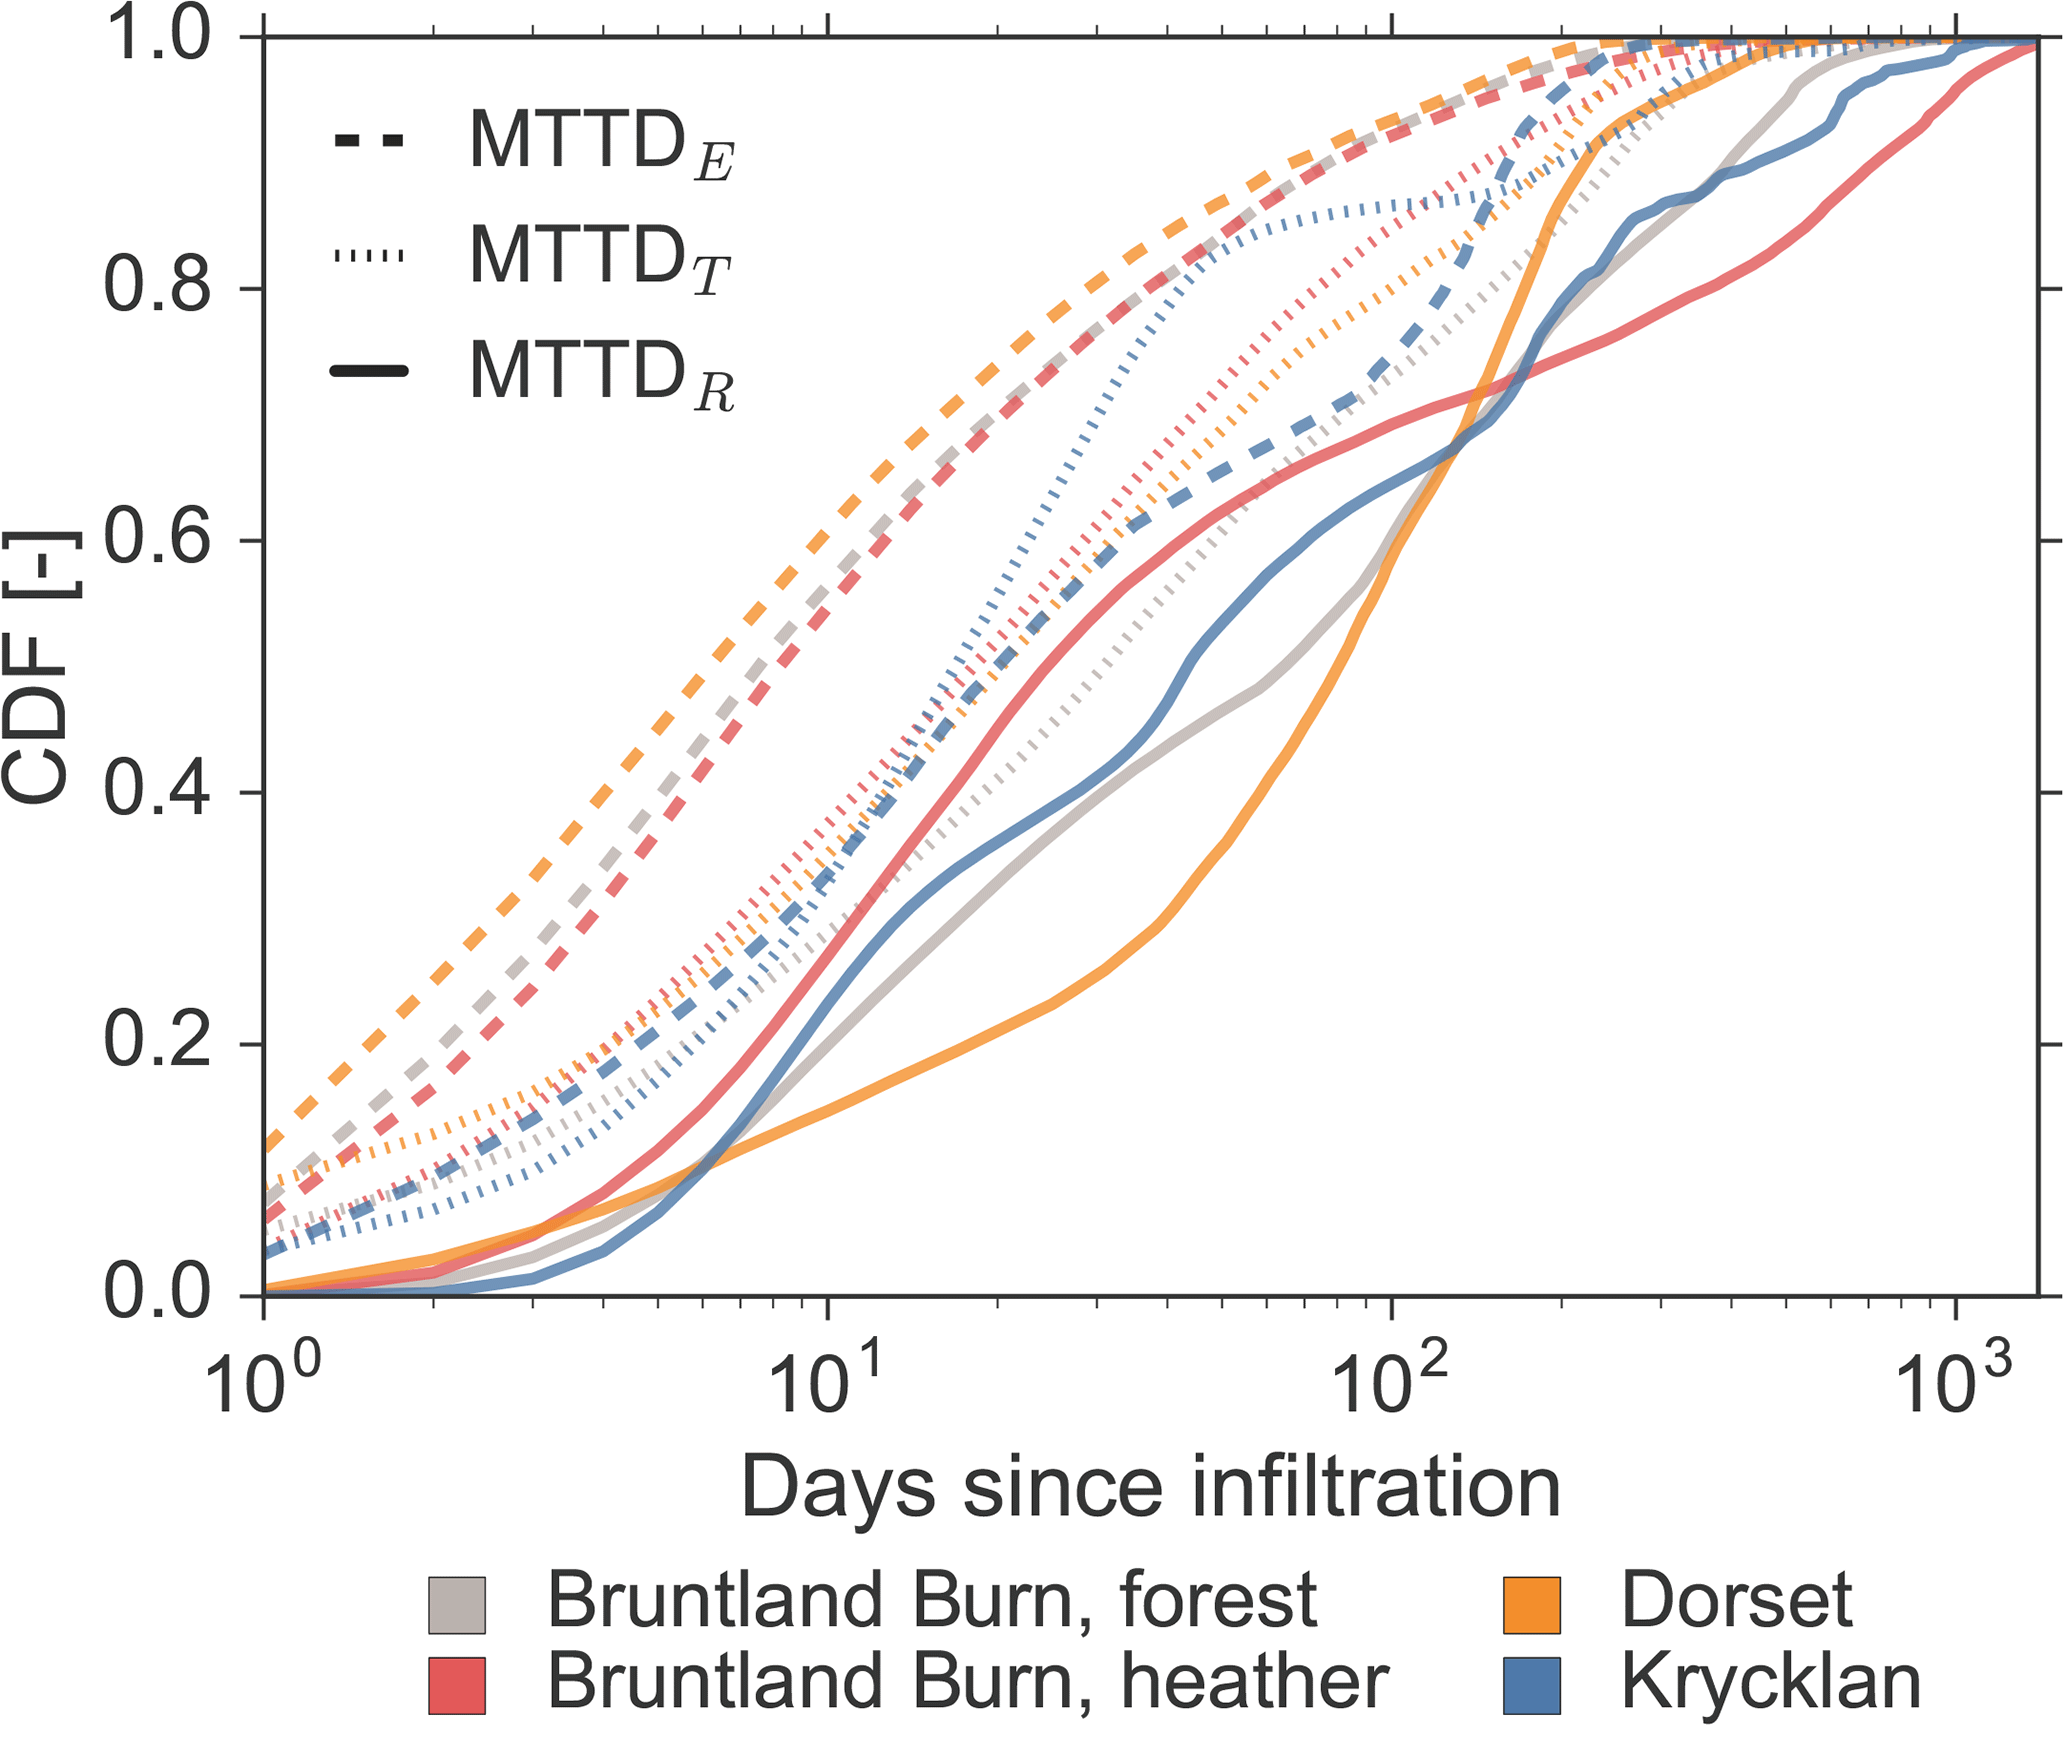
Figure 4Cumulative density function of the master transit time distributions (MTTD) of the evaporation flux (dashed lines, MTTDE), transpiration flux (dotted lines, MTTDT), and recharge flux (unbroken lines, MTTDR) for the four study sites (colour code).
4.2 Water ages (What are the ages of the storage in the soil and in the fluxes leaving the soil?)
4.2.1 Water ages of soil storage
The median age of the total water stored in the simulated 50 cm soil profile (ASt) ranged from a few days to 300 days (Fig. 5a). Short-term dynamics of ASt were driven by the infiltration patterns with generally smaller ASt after high infiltration rates (Fig. S6). ASt generally increased during periods of low infiltration such as dry summers at Bruntland Burn and Krycklan or throughout snow cover at Dorset and Krycklan. ASt was usually larger for lower storage volumes and decreased exponentially with increase in soil storage. This inverse storage relationship was most pronounced for the water ages in the fast flow domain (ASf in Fig. 6). Exceptions of small ASf during low storage occurred when the fast flow domain dried out and was then refilled by young waters during infiltration events (see several red and orange data points in the first row in Fig. 6). ASf was generally smaller than ASs (Fig. 5c and d). Dynamics of ASf were generally highly responsive to infiltration, but the response of ASs was usually less and often delayed compared to ASf. More intense short-term dynamics in ASs – and consequently also in ASt – were limited to sites and periods when the fast flow domain was empty (e.g. July 2013 and 2014 at the forested site in Bruntland Burn and summers at Dorset, Fig. 5). ASs was generally larger and more damped than ASt (Fig. 5).
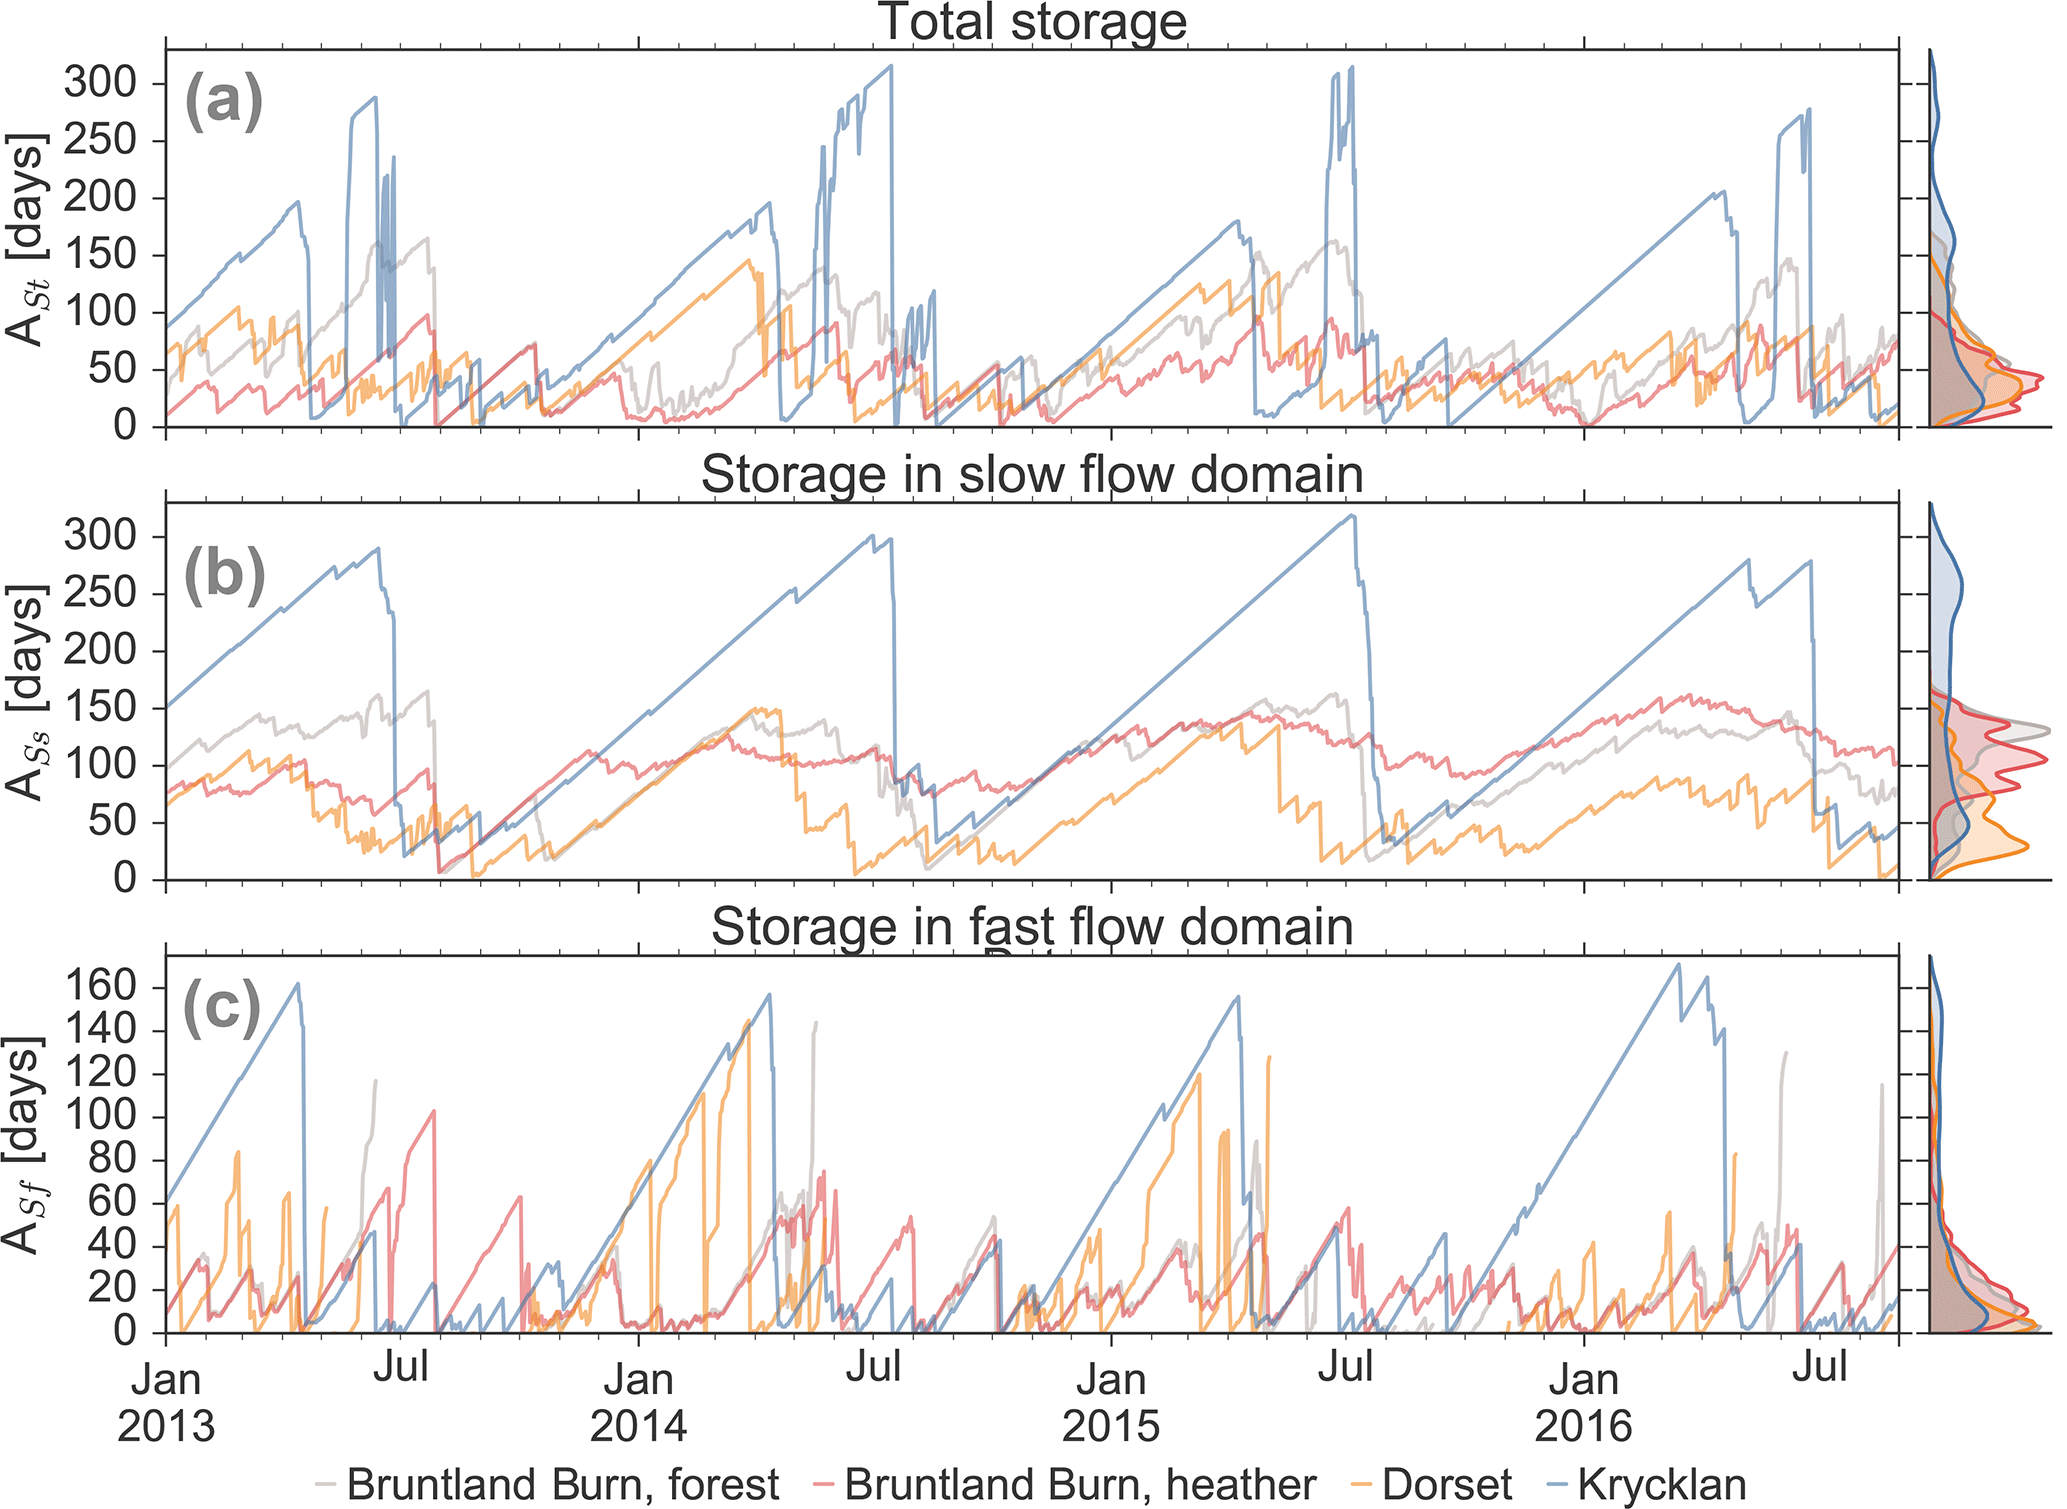
Figure 5Water ages of (a) total soil water storage (ASt), (b) storage in the slow flow domain (ASs), and (c) storage in the fast flow domain (ASf). Note that when storage in the fast flow domain is zero, there is no water age for the storage. For site NH, the spin-up period of 1.5 years was not sufficient to replace the water in the slow flow domain, resulting in continuously increasing water ages for ASt and ASs, which inhibits their analysis (dashed lines). The colour code is according to the four study sites. Density distributions of the water ages are shown for each site on the right-hand side.

Figure 6Median water age of fast flow domain (ASf, a), evaporation (AE, b), transpiration (AT, c), and recharge flux (AR, d) as a function of the water stored in the entire soil, in the upper 10 cm, in the root zone and in the entire soil profile, respectively. Each column represents one of the four studied sites. The dots show the relationship between water ages and storage for each day and the colour code represents the season of the corresponding days.
Table 3Summary of water age characteristics of the four study sites: median (25th percentile, 75th percentile) of the median water ages in the total storage (ASt), storage in the slow flow domain (ASs), storage in the fast flow domain (ASf), evaporation flux (AE), transpiration flux (AT), and recharge flux (AR). Letters as superscript indicate significant differences in each column. Sites with the same letter are not significantly different regarding the water ages of the considered storage or flux.
ASt was significantly different between all sites (Table 3). For ASs, the Bruntland Burn sites did not differ significantly, probably due to the same climatic forcing and similar shape of the water retention curve for the slow flow domain in the upper horizon (Fig. S2). For ASf, the forested sites in Bruntland Burn and in Dorset were not significantly different, as their water retention for the fast flow domain was similar, with drying out of the fast flow domain during summer. This decrease in the water storage of the fast flow domain led to large ASf just before being emptied due to interaction with older water in the slow flow domain.
ASt was usually < 120 days in the upper 5 cm and generally increased linearly with depth over the rooting zone (Fig. 7). The greatest variability in ASt was at the forested sites at depths < 25 cm, where site-specific ASt maxima occurred during the growing season while ASt < 60 days happened during periods of high recharge in the dormant season and during snowmelt when soil waters were well connected throughout the profile. At the heather site in Bruntland Burn maximum ASt was found just below the rooting zone (15 cm) and not at the bottom of the soil profile (Fig. 7). Thus, soil water storage volumes, altered by the root water uptake, affected the water transport and mixing processes such that younger water in the fast flow domain bypassed the older water stored in the slow flow domain.
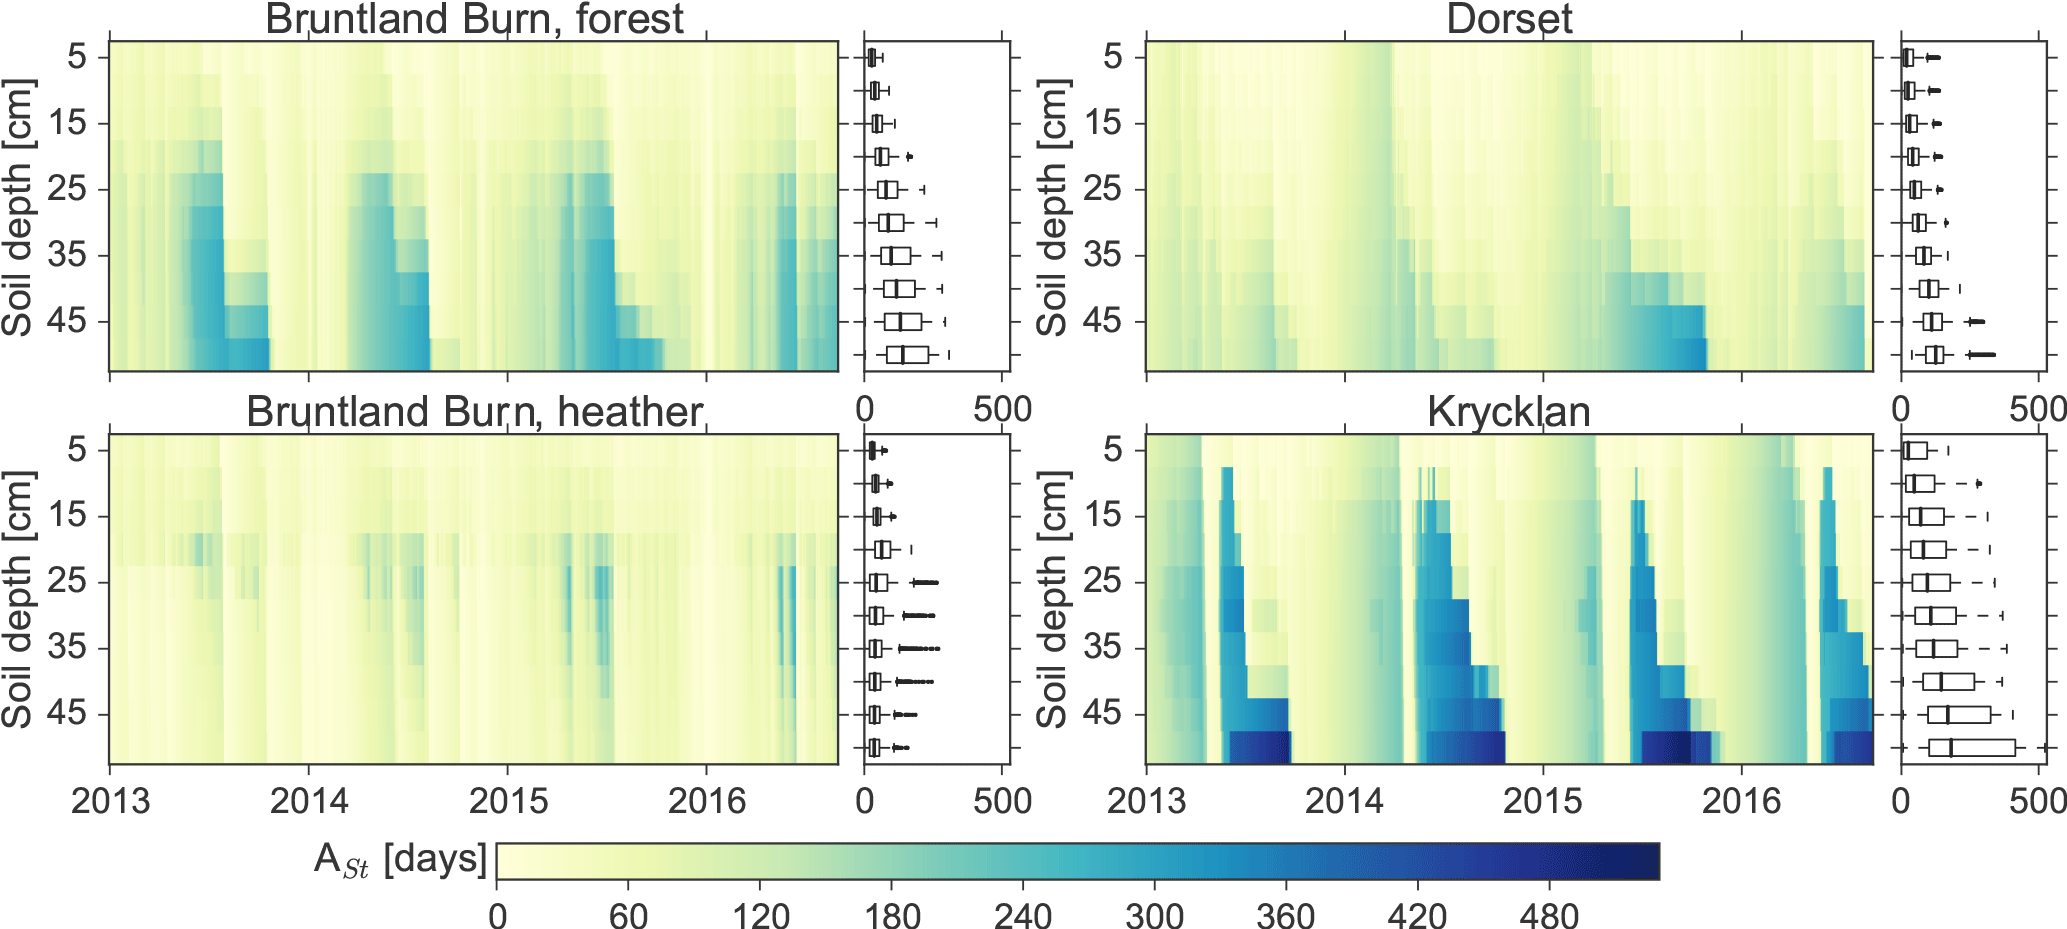
Figure 7Median water age of the total soil water (ASt) at 5 cm intervals over the simulation period for each of the study sites.
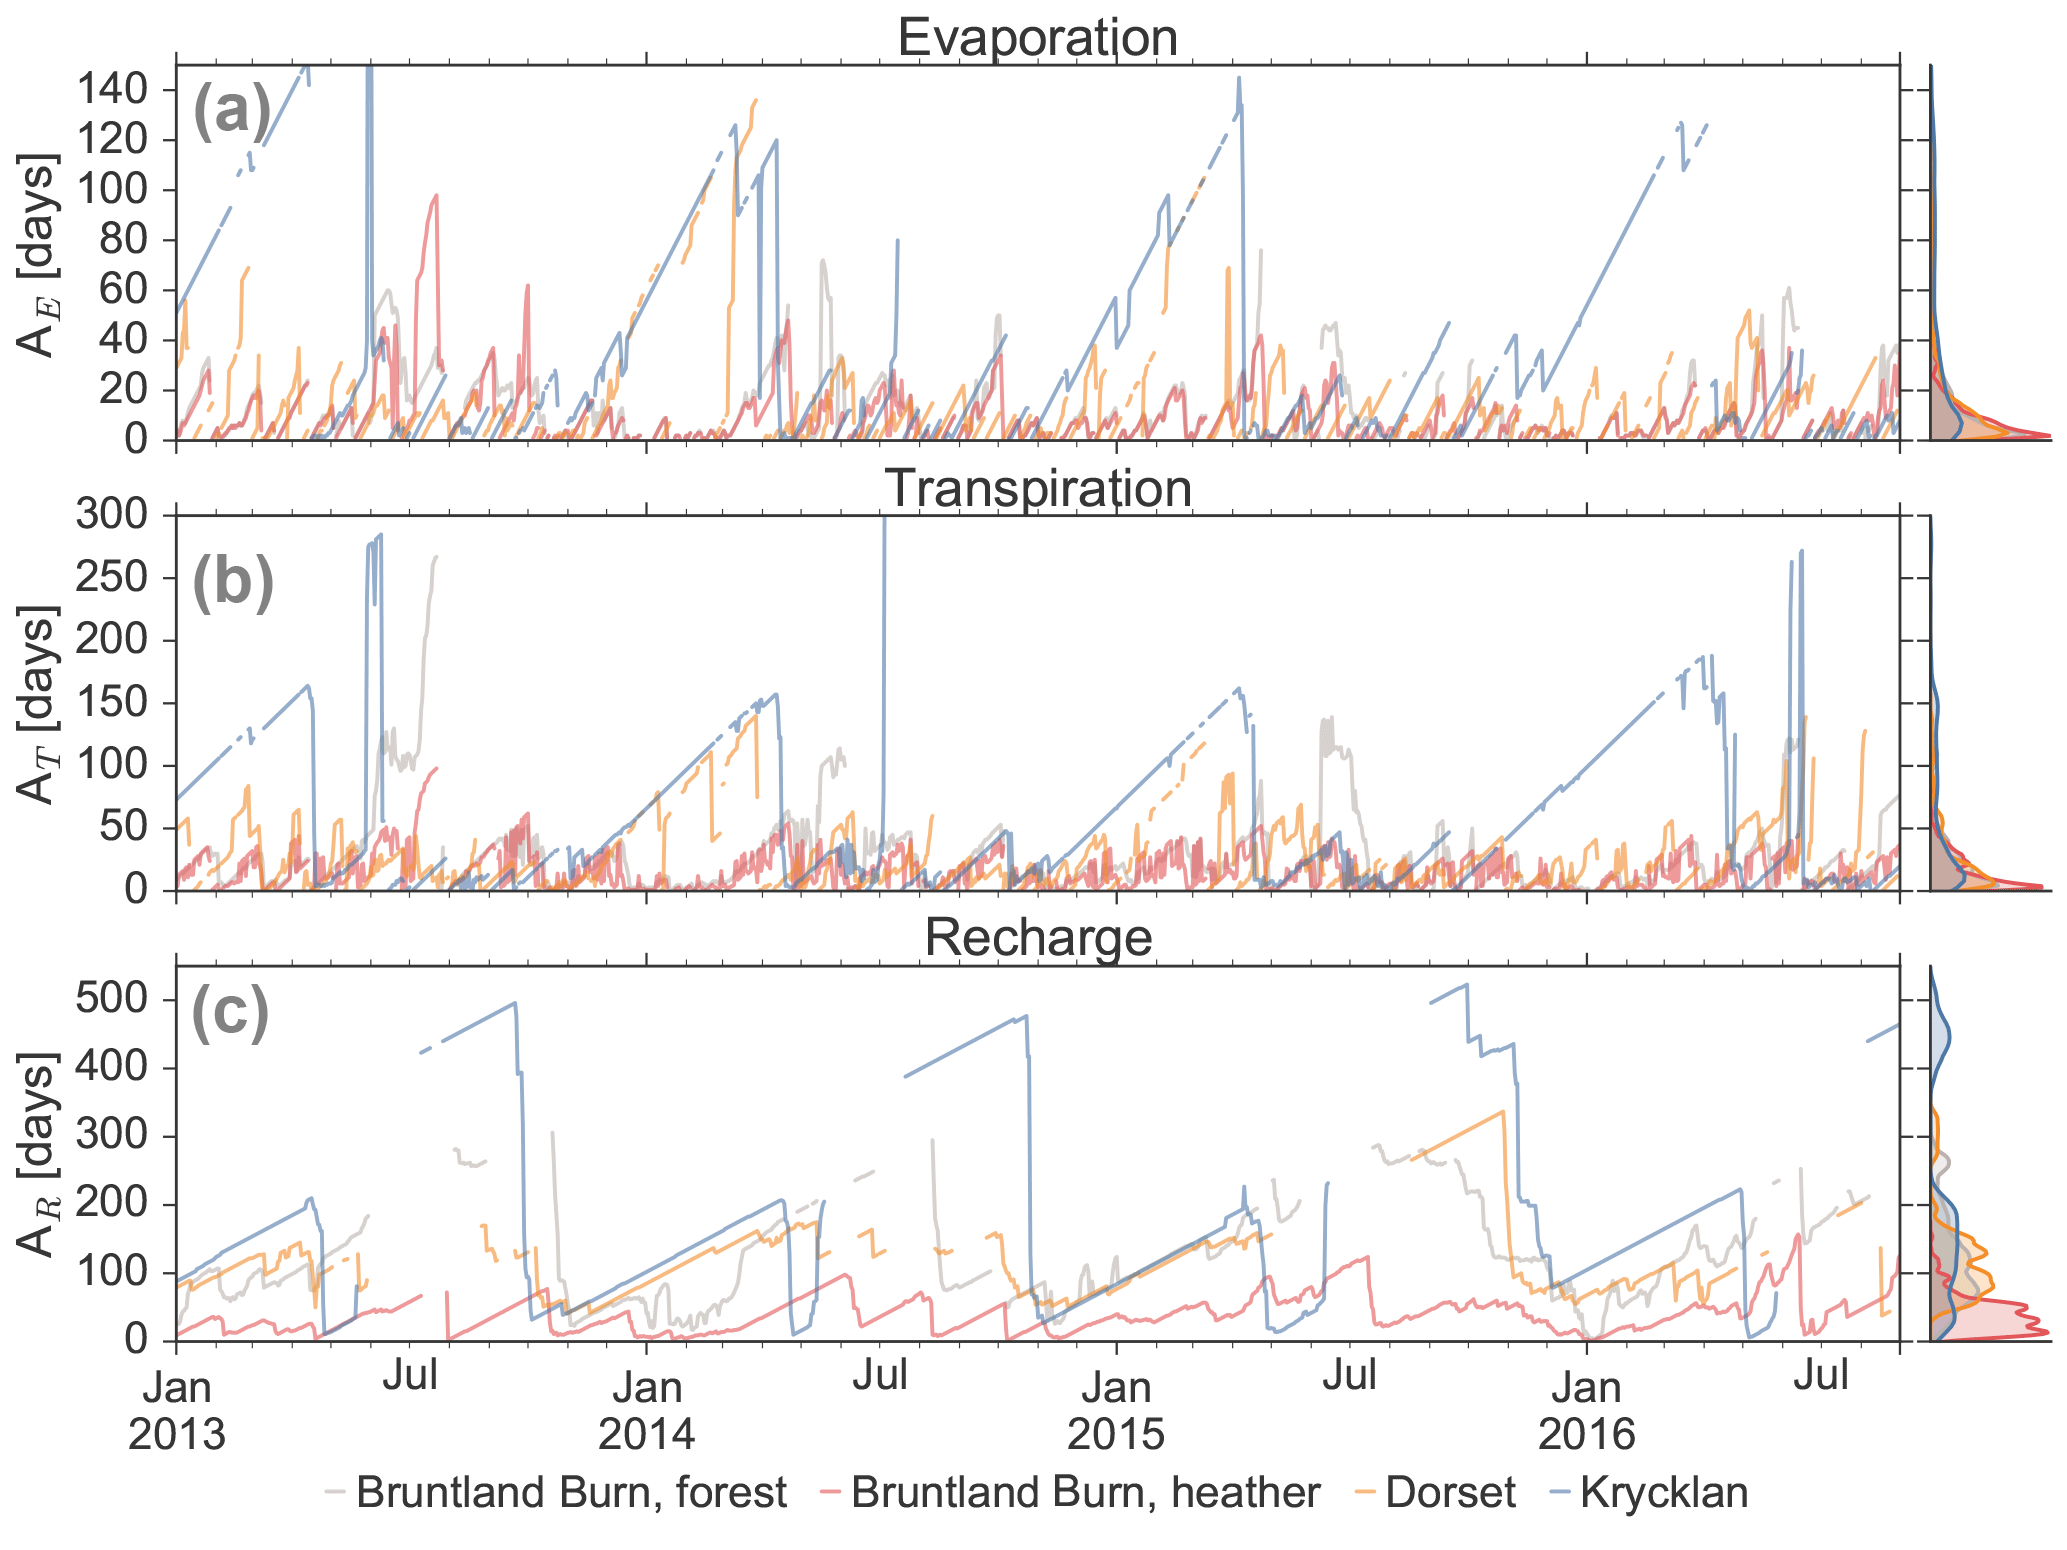
Figure 8Median water ages of (a) evaporation (AE), (b) transpiration (AT), and (c) recharge flux (AR). Note that when flux is zero, there is no water age for the flux. The colour code is according to the four study sites. Density distributions of the water ages are shown for each site on the right-hand side.
4.2.2 Water ages of evaporation flux
The median age of the water in the E flux (AE) ranged from 0 to 140 days, with the largest values during periods of snow cover at Dorset and Krycklan (Fig. 8a). AE was exponentially related to storage in the upper 10 cm from which E occurred (Fig. 6). For Krycklan and Dorset, this exponential relationship was most pronounced for periods of decreasing storage during snow accumulation in winter, when the oldest E fluxes were observed. AE was largest for periods of minimal infiltration and decreased exponentially with increasing infiltration rates (Fig. S7). Due to the same climatic conditions at the heather and forested sites in Bruntland Burn, AE values were not significantly different and on average lower than at the Dorset and Krycklan sites (Table 3).
4.2.3 Water ages of transpiration flux
Water ages in T (AT) ranged from 0 to up to 300 days and showed similar dynamics to those of AE for most periods (Fig. 8b). However, AT was usually older than AE, since the root water uptake included deeper soil layers than E did. AT decreased with increasing storage volume (Fig. 6); AT declined after precipitation events added young water to the rooting zone during summer and early autumn when storage was generally low. The exponential relationship between root zone storage and AT was most pronounced at Bruntland Burn, where infiltration regularly occurred throughout the year. Under these conditions, the largest AT occurred when the soil dried out and root water uptake of deeper soil layers became more relevant, leading to an increased relative contribution of older waters to modelled T. For Dorset and Krycklan, the oldest AT values were not only related to low root zone storage, but also to the aging of water in the root zone during snow cover in winter when infiltration rates were low and transpired water thus increasingly became older with time. AT had a linear relationship with ASf during wet periods, but approached ASs during dry periods, due to a shift in root water uptake from the fast flow domain to uptake largely from the slow flow domain. AT was significantly smaller at the heather site in Bruntland Burn, where root water uptake was limited to the upper 15 cm, compared to the forested sites with rooting depths down to 50 cm (Table 3). AT did not differ significantly between the forested site in Bruntland Burn and Dorset, but was significantly larger at Krycklan, where the oldest water was stored in the soil.
4.2.4 Water ages of recharge flux
Median water age of the R flux through the 50 cm depth plane (AR) generally exceeded, but was usually linearly related to, the total soil storage water age (ASt) (cf. Fig. 8 and Fig. 4). However, this linear relationship did not hold for periods of low R flux, and AR became > > ASt (e.g. summer for Krycklan in Fig. 8c). AR had a strong relationship with R flux and total water storage: the oldest water was recharged during low R fluxes and low storage volumes, respectively (Fig. 6). As AR was generally strongly related to the age dynamics of the fast flow domain, the differences in AR among the sites were similar to the differences in ASf, with AR being significantly lower at the heather site in Bruntland Burn and significantly higher at Krycklan compared to the forested site in Bruntland Burn and Dorset (Table 3).
Our simulations emphasize the time-variant character of water ages and travel times in hydrological systems, as observed at the catchment scale in various recent studies (van der Velde et al., 2012; Benettin et al., 2013; Heidbüchel et al., 2013; Soulsby et al., 2015; Benettin et al., 2017). Further, the age dynamics in the soil waters were driven by the variability in water stored in the soils, supporting an “inverse storage effect” as discussed by Harman (2015). Numerical modelling using SWIS provided us with new insights into how different pore spaces, respectively representing fast and slow flow domains, differ from each other in terms of water ages. We further showed how the age variability between the soil pores affects the water ages of the associated fluxes. Since all travel times and water ages depend on the water stored in the soil, we will first discuss this and then include E, T, and R travel times and water ages.
5.1 What controls soil water storage and water ages?
As the age of the total soil water as well that of the fast and slow flow domains (ASt, ASf, and ASs, respectively) generally decreased with increasing storage volume, the antecedent hydro-meteorological conditions controlled the soil water age dynamics. For periods with high ET fluxes that led to low storage volumes, water ages in the soil pores generally increased over time (Bruntland Burn sites in Fig. 6), because the youngest water left the soil column preferentially via ET. Thus, E rates and vegetation uptake directly impacted water age dynamics in the critical zone. Additionally, snowmelt led to a sharp decrease in soil water ages after a continuous aging of the water that resided in soil over the snow accumulation period (Fig. 5). Both the ET-driven and snowmelt-driven cases result in an inverse storage effect, where water in the soil became younger for higher soil water volumes. In addition to the general positive relationship between wetness and soil hydraulic conductivity (van Genuchten, 1980), the conceptualization with two pore domains in the SWIS model allowed young water in the fast flow domain to bypass older water stored in the slow flow domain. Since the smaller pores of the slow flow domain will be filled first or stay filled while the larger pores of the fast flow domain are not empty, the bypass will be enhanced during periods of high wetness. As a result, young median water ages prevailed across the entire 50 cm soil profile during periods of high storage (Fig. 7). Note that this conceptualization would not hold when soil dryness induces preferential flow due to water repellency (hydrophobicity) (Ritsema et al., 1993; Weiler and Naef, 2003).
According to our simulations, water ages are not simply controlled by the hydraulic conductivity of the soil, but the storage dynamics in the slow and fast domain also impacted the water age dynamics. Water flow was much slower when the fast flow domain emptied. Consequently, while the hydraulic conductivities at the Bruntland Burn and Dorset sites were similar (Table 1), the water ages at the two forested sites, where the fast flow domain dried out during summer (Fig. S4), were greater than at the heather site at Bruntland Burn, where water prevailed in the fast flow domain throughout the year. The impact of increased water mobility (i.e. flushing) on soil water ages during greater soil wetness is supported by stable isotope data (2H and 18O). For the Bruntland Burn sites, Sprenger et al. (2017) showed that the isotopic variability in bulk soil water was greatest after intense infiltration events, revealing that event water mixed effectively with pre-event water in the upper 20 cm. Also, isotope data from mobile soil water (Peralta-Tapia et al., 2015) and bulk soil water (Sprenger et al., 2018a) at the Krycklan site had a strong relationship with the isotopic compositions of previously infiltrated water, which shows that a high proportion of the soil (pre-event) water is replaced by or mixes with recent event water. Such isotope studies provide a snapshot view of water transport in the field, but modelling approaches benchmarked against or calibrated on such observations, like our study, allow insights into short-term dynamics.
ASs (and the storage volume in the slow flow domain) generally does not change as rapidly as ASf, which is influenced by highly variable storage volumes in the fast flow domain. However, since the ratio between water stored in the fast and slow flow domain changes as a function of soil wetness (Sprenger et al., 2018b), the impact of the two domains on total soil water age ASt also varies over time. During summer, when storage in the fast flow domain decreased or was even fully depleted (at forested Bruntland Burn and Dorset sites), ASt approached or equalled ASs. Due to exchange between fast and slow flow domain, ASf approached ASs just before the fast flow domain dried out (see forested Bruntland Burn and Dorset in Fig. 5c). Our age analyses therefore support the hypothesis by Sprenger et al. (2017) that old water in smaller soil pores can lead to a “memory effect” in the bulk soil water isotope compositions. Such a “memory effect” was further shown to lead to a lagged response of the soil water stable isotope compositions to hydro-meteorological forcing at five long-term experimental catchments in northern environments (Sprenger et al., 2018a). Further, observed differences in the isotopic compositions of mobile and bulk soil water in the field were often related to the potential age differences of waters sampled at different mobilities (Landon et al., 1999; Brooks et al., 2010; Geris et al., 2015; Sprenger et al., 2015a; Oerter and Bowen, 2017). Our results and recent simulations by Smith et al. (2018) support such interpretations, as the water in the slow flow domain was generally older than the water in the fast flow domain (ASs > ASf). However, since the differences between ASs and ASf were variable in time and were often maximized in early spring, such anomalies in water ages are likely to be reflected in the isotopic compositions of the water, with the older water in small pores being less depleted in heavy isotopes (originating partly from autumn precipitation) than the young water in larger soil pores draining recently infiltrated isotopically depleted snowmelt or winter precipitation. Such isotopic differences resulting from different water ages affect our interpretation of soil water stable isotopes sampled either with suction lysimeter (mobile water in the fast flow domain) or cryogenic vacuum extraction (bulk soil water in fast and slow flow domain). For example, Brooks et al. (2010) reported different isotopic compositions for mobile and bulk soil water samples, which led to the formulation of the two water world hypothesis (TWW) (McDonnell, 2014). In a TWW scenario, tightly bound soil water is not displaced via translatory flow, does not mix with or displace mobile water, and does not enter the stream. However, experimental work recently showed that there is interaction between mobile and less mobile soil waters (Vargas et al., 2017), as conceptualized in the applied SWIS model. Our simulations further question if water in the slow flow domain – as defined in SWIS – will not eventually recharge the groundwater and streams. The virtually introduced tracer eventually disappears from the soil water storage of the slow flow domain, due to loss of the tracer to the atmosphere (ET flux), interaction with the fast flow domain and recharge within the slow flow domain. Nevertheless, while definition of the slow flow domain using a higher threshold pressure head (e.g. field capacity as suggested by Brantley et al. (2017) rather than the currently assumed 600 hPa) would result in its water becoming more tightly bound, interaction with more mobile waters would likely still persist (Vargas et al., 2017).
5.2 What controls travel times and water ages in evapotranspiration?
Since water loss from soil storage as E flux was limited to the upper 10 cm in our simulations, travel times and water ages are directly related to the water age dynamics in the top soil. In contrast, the rooting zone covered the entire soil profile for the forested sites and down to 15 cm soil depth for the heather site, which affected the resulting travel times and water ages of T accordingly.
Investigation of water ages in the ET flux is relatively new (Botter et al., 2011) and age dynamics have usually been assessed for the bulk ET flux (Harman, 2015; Soulsby et al., 2015; van der Velde et al., 2015; van Huijgevoort et al., 2016; Soulsby et al., 2016). While it was shown that tracer-aided modelling using stable isotopes of water benefits from partitioning ET into a fractionating E flux and a non-fractionating T flux (Knighton et al., 2017), separate water age analyses for E and T have been considered only recently (Smith et al., 2018). However, our analyses showed that the two different fluxes can have markedly different travel time dynamics (Fig. 2), average travel time distributions (Fig. 4), and water age dynamics (Fig. 8). Thus, our process understanding of how vegetation affects water ages in hydrological systems would particularly benefit from further assessments of the differences between E and T water ages. Such investigations are of special interest in light of ongoing research regarding the consequences of a potential TWW hypothesis on water age estimations based on tracer-aided modelling (Hrachowitz et al., 2016). In particular, our simulations underline that neither is ET flux withdrawal well mixed in its age composition nor is the pool of plant water uptake well mixed, which is increasingly acknowledged in water age studies (Harman, 2015; Smith et al., 2018).
Similar to findings by Smith et al. (2018) for the heather site in Bruntland Burn, our estimates for AE at that site were highest during periods of limited infiltration (e.g. 10-year return period drought in summer 2013 at Bruntland Burn in Fig. 8a). However, E water ages reported by Smith et al. (2018) were higher than our estimates, which is probably due to their conceptualization of the subsurface into one domain with and one without downward flux, which resulted in generally higher water ages in the shallow soils compared to our estimates. Water age estimates by Queloz et al. (2015) for the ET flux from a lysimeter were less variable, but within about 10 to 20 days of the magnitude of our AE and AT estimates. The forward travel time distributions for water leaving the soil via ET presented by Queloz et al. (2015) also showed shapes similar to our reported MTTDE and MTTDT with peaks in the first few days and tails of the distribution that can reach up to 200 days (Fig. 4). We attribute the long tails of the MTTDE and MTTDT to both the ET flux from the slow flow domain and root water uptake from deeper soil layers.
With regard to AT, our soil physical model showed a similar inverse storage effect as the approach using storage selection functions (Smith et al., 2018): water taken up by plants was generally younger during higher soil storage. While Smith et al. (2018) had a dynamic root water uptake depth, T loss in the SWIS model decreases linearly with depth as long as the pressure head does not reach the permanent wilting point, which is usually not reached at the investigated sites (Sprenger et al., 2018b). Thus, it is likely that the differences between the dynamic root water uptake depths in the storage selection functions and the defined uptake profile in SWIS will be more pronounced when vegetation responds to intense drought by shifting the root water uptake to deeper soil layers (Volkmann et al., 2016).
A relationship between MdTTT and T dynamics, with the onset and cessation of T at the beginning and the end of the growing season, has been shown previously (Sprenger et al., 2016); nevertheless, our experimental set-up with two different vegetation types (differing in T rates, rooting depth, canopy cover, and interception storage) on similar soil types under the same climatic forcing in the Bruntland Burn reveals the impact of rooting depth on the travel time dynamics. Median and maximum MdTTT were shorter for the heather site than for the forested site in Bruntland Burn and the MTTDT had substantially different shapes at both sites with a lower median for the heather T travel times compared to the forest (Table 1).
5.3 What controls recharge travel times and water ages?
Water age and travel time dynamics of the recharge flux are the result of the interplay between the aforementioned linkages between soil water storage age and ET age dynamics. Since the estimated MdTTR are a function of the subsequent recharge flux intensities (Fig. 3), the probability of an introduced water parcel leaving the soil profile via recharge is higher during high flows. Such a relationship between forward travel times and the recharge flux dynamics was also found in modelling studies on a controlled lysimeter (Queloz et al., 2015) and 35 field sites in Luxembourg (Sprenger et al., 2016). While catchment-scale travel time studies based on conceptual lumped models also showed that the subsequent precipitation patterns affect the travel time dynamics of runoff (Heidbüchel et al., 2013; Hrachowitz et al., 2013; Harman and Kim, 2014; Peters et al., 2014; Peralta-Tapia et al., 2016), our application of a 1-D soil physical model provided insights into the processes in the upper critical zone leading to such behaviour at the plot scale. The simulations with SWIS highlight the effect of ET fluxes on recharge travel times, as both storage and recharge are influenced by ET rates. Consequently, one can see the exceptionally high MdTTR for the few infiltration events during a 10-year return period dry episode in summer 2013 for the heather site at Bruntland Burn. Further, the seasonal decrease in MdTTR due the preferential recharge during the dormant season (Bruntland Burn) or snowmelt (Dorset and Krycklan) emphasizes the impact of ET on vadose zone travel times. Such an influence of vegetation on travel times as suggested from the plot-scale simulations is commonly not seen for the catchment runoff as the stream integrates water moving via different pathways and thus obscures any ET signal (Tetzlaff et al., 2014; Kirchner, 2016).
The conceptualization of fast and slow flow domains resulted in MTTDR that indicated a maximum probability of infiltrating water recharging from the soil within 3 to 10 days after infiltration, although the tails of the MTTDR revealed that replacement of all water (turnover time) can take up to 1000 days (Fig. 4). Thus, our modelling approach of a two-pore domain enabled the representation of the short-term responses and the long-term memory of the recharge composition in a soil column. As a result, water ages (ASt) did not always increase with depth, but instead became almost uniform throughout the soil column during intense infiltration periods. Occasionally ASt was smaller at the bottom of the profile relative to just below the rooting zone, mainly due to root water uptake dynamics at the heather site in Bruntland Burn (Fig. 7). While AR was generally higher than ASt, consistent with Queloz et al. (2015), our soil physical modelling approach revealed how the water ages develop with depth and lead to the resulting AR dynamics.
The pronounced longer water ages of the slow compared to the fast flow domain are of great relevance for the interpretation of studies on travel times in vadose zone water fluxes. These investigations are often based on models calibrated with isotope data from samples taken with zero-tension lysimeters (e.g. Asano et al., 2002), wick samplers (e.g. Timbe et al., 2014), suction lysimeters (e.g. Muñoz-Villers and McDonnell, 2012; Tetzlaff et al., 2014; Hu et al., 2015), or from the outflow of lysimeters (e.g. Stumpp et al., 2009, 2012). Such methods limit isotope sampling to the most mobile water in the soil (Sprenger et al., 2015a), which is represented as the fast flow domain in the current application of the SWIS model. According to our simulations, travel time studies based on the most mobile waters in the soil are likely to underestimate travel times and water ages in the recharge fluxes. Consequently, the turnover time of the soil pores will be underestimated in such studies, which can then lead to the assumption that nutrients or contaminants located in the vadose zone will be flushed out more rapidly than they actually are.
The R water ages at 50 cm depth in this study are obviously younger than catchment-scale runoff water ages (Soulsby et al., 2015; Ala-aho et al., 2017b; Benettin et al., 2017; Kuppel et al., 2018; Piovano et al., 2018). Nevertheless, the dynamics from the plot-scale R water ages are similar to the catchment runoff water ages due to hydro-meteorological controls leading to generally increasing values throughout spring towards summer (decreasing storage) and the lowest water ages during winter (highest storage).
The long tails of the MTTDR found in our results indicate that soil storage can probably add to the commonly observed long tails of catchment-scale travel time distributions (e.g. Godsey et al., 2010; Hrachowitz et al., 2010). Generally, the plot-scale soil hydraulic simulations can help to better understand the processes taking place within the catchment and to constrain or benchmark spatially distributed hydrological models (van Huijgevoort et al., 2016; Ala-aho et al., 2017b; Kuppel et al., 2018). Such catchment models cannot account for the soil physical processes in a similar detail to a 1-D model due to computational limitations. However, our results imply that it might be worth adding a dual-porosity representation, similar to the conceptualization in SWIS, to the recently published EcH2O-iso (Kuppel et al., 2018).
5.4 Limitations and outlook
While we cannot provide uncertainty estimates for the presented travel times and water ages due to restrictions imposed by computation time, comparison with soil moisture and stable isotope data at each site (Sprenger et al., 2018b) indicates that the SWIS model captures the water flow and transport processes well. However, model calibration using soil moisture and stable isotope data, as suggested by Sprenger et al. (2015b), would supply the basis of an assessment of how different parameter sets impact the model performance and water age estimates. Such an approach would provide site-specific characterization of the soil physical properties and would likely improve simulations compared to the currently applied pedotransfer functions and measurements on soil cores.
The applied model approach cannot account for preferential flow, but the conceptualization of two pore domains with different water flow and transport dynamics enabled the simulation of bypass flow. This conceptualization was shown to be superior to a conceptualization of a uniform flow (Sprenger et al., 2018b). Additional inclusion of preferential flow in the model domain would come at the cost of model complexity and pose problems of parameter identifiability.
Since the investigated northern environments seldom experience severe drought, plant growth is usually not water limited, as for example was shown by Wang et al. (2017a) for Bruntland Burn. Thus, the assumption of a linear decrease in root water uptake with depth appears to be reasonable for the current study sites. An exponential distribution would not change the water uptake patterns significantly, as the linear assumption already results in 96 % of the water being taken up in the upper 15 cm. However, several isotope studies have shown that the root water uptake profile does not coincide with the root distribution if plants experience water stress (e.g. Kulmatiski and Beard, 2013; Ellsworth and Sternberg, 2015; Volkmann et al., 2016). Hydraulic lift can further increase the complexity of soil–plant interaction, as experimentally observed and implemented in a soil hydraulic model by Meunier et al. (2018). Thus, an improved representation of such dynamics in the water uptake depths would be beneficial for modelling studies in arid environments. For the northern environments considered here, variability in the depths from where the plants take up their water appears to be limited (Smith et al., 2018).
The presented simulations are further limited by the discretization of the soil profile into 5 cm intervals, as this might be too coarse for an adequate representation of the interactions between atmospheric demand, T losses, and mixing down the profile. However, computational limitations did not allow a smaller discretization and our study aimed to test the assumption that soil storage is a well-mixed water source of ET fluxes.
Lastly, while the investigated sites are not located on steep slopes, the 1-D simulation cannot account for lateral flows in the vadose zone that may potentially occur during extreme rain events (Soulsby et al., 2017). We further have to assume that all R flux leaving the soil profile will end up in groundwater, but spatially distributed catchment models (Ala-aho et al., 2017b; Kuppel et al., 2018) might reveal that such water could end up in the ET flux from saturated areas in the valley bottom when the groundwater feeds the riparian zone.
We have provided unique insights into the water ages of the upper critical zone using the SWIS soil physical model by tracking water through the soil profile and its associated fluxes from the soil at four investigated sites. Based on these 1-D simulations, we revealed that the recently described inverse storage effect for catchment and hillslope runoff not only holds for recharge from the soil, but is also present for the transpiration and evaporation fluxes: water leaving the soil via evaporation, transpiration, or recharge was generally younger the greater the soil water storage. The conceptualization of the vadose zone into slow and fast flow domains and its discretization over depth allowed us to investigate how the water ages in the hydrologic fluxes develop over time and space based on the soil water volume and its age. The temporal age dynamics are mainly related to soil water storage dynamics. Thus, the seasonality of evaporation and vegetation activity according to the growing season affected the water ages in the soil. Future climate warming or vegetation cover change in northern latitudes will thus directly affect critical zone water age dynamics. Contrary to the common approach of employing bulk ET in water age analysis, we demonstrated that evaporation and transpiration have different water ages and travel times. Thus, an improved partitioning of the two fluxes appears to be essential to understanding the differential impact of evaporation (usually of relatively young waters from the top of the unsaturated zone) and transpiration (which can access older water from deeper soil layers) on water age dynamics. Furthermore, rooting depth was found to affect the transpiration water ages and travel times, with younger water ages and shorter travel times for the shallow roots of heather relative to deeper-rooting trees. While both evaporation and transpiration generally have relatively young water ages and short travel times, the travel time distributions revealed that the ET flux also contains considerably older (> 100 days) waters. We relate these old waters to the conceptualization of the subsurface into two pore domains. Water in the fast flow domain was usually about half as old as in the slow flow domain, which was fully exchanged within 1000 days and thus was not immobile. Nevertheless, the differences between the slow and fast flow domains are crucial for the interpretation of previous travel time studies that have based their calibration on tracer data from the fast flow domain (e.g. suction lysimeter samples), since such studies will have underestimated travel times and water ages. Recharge travel times were mainly governed by the subsequent recharge flux dynamics in our study, and decreased during periods of intense flushing of the soil water during winter in Bruntland Burn and snowmelt in Krycklan and Dorset. Transpiration travel times were controlled by vegetation phenology and the associated annual climatic cycle, with the longest travel times for waters infiltrated at the beginning of dormancy and short travel times throughout the growing season.
Our simulations generally extended insights into the water flow and transport processes obtained from snap shot isotope sampling to new insights into both the seasonal and short-term dynamics of water ages in the critical zone. The soil physical simulations showed that the inverse storage effect holds for the vadose zone, and that temporarily saturated conditions (as found for the hillslope scale) or groundwater influence (as found for the catchment scale) were not required to generate younger water in recharge during periods of greater soil water storage.
The presented simulations underline that the common assumption in hydrological modelling of a well-mixed system in the subsurface does not hold for water withdrawal from the soil via evaporation, transpiration, or recharge. In contrast, we saw variable water ages across the two soil pore domains and down the soil profile. Fluxes were more likely to withdraw younger water during periods of enhanced wetness and older water when the system becomes drier. The transpiration ages shown here also indicate that waters in the plant xylem have relatively old ages (and long travel times) depending on the time of the year, which is relevant for ecohydrological studies inferring root water uptake depths using stable isotopes.
The underlaying research data are not publicly available in a repository, as they contain 70 GB. However, they can be requested from the authors.
The supplement related to this article is available online at: https://doi.org/10.5194/hess-22-3965-2018-supplement.
MS conducted the simulations, made the graphs, and wrote the initial manuscript; MS, DT, and CS designed the study and JB and HL provided data and site-specific knowledge for the Dorset and Krycklan sites, respectively. All authors contributed to the writing process.
The authors declare that they have no conflict of interest.
We thank Pernilla Löfvenius (SLU) for providing PET data for Krycklan
(via SITES) and Carl Mitchell for snowmelt data in Dorset. We thank Pertti
Ala-aho, Paolo Benettin, Sylvain Kuppel, Aaron A. Smith, and Hailong Wang for
constructive discussions on the topic. The authors would like to acknowledge
the support of the Maxwell computing cluster funded by the University of
Aberdeen. The Krycklan component of the study was funded by the KAW
Branch-Point project. We thank the European Research Council
(ERC, project GA 335910 VeWa) for funding. We acknowledge support by the
German Research Foundation (DFG) and the Open Access Publication Fund of
Humboldt-Universität zu Berlin. We thank Todd Walter and two anonymous
referees for their critical comments to improve the
manuscript.
Edited by: Nunzio
Romano
Reviewed by: Todd Walter and two anonymous referees
Ala-aho, P., Tetzlaff, D., McNamara, J. P., Laudon, H., Kormos, P., and Soulsby, C.: Modeling the isotopic evolution of snowpack and snowmelt: testing a spatially distributed parsimonious approach, Water Resour. Res., 53, 5813–5830, https://doi.org/10.1002/2017WR020650, 2017a.
Ala-aho, P., Tetzlaff, D., McNamara, J. P., Laudon, H., and Soulsby, C.: Using isotopes to constrain water flux and age estimates in snow-influenced catchments using the STARR (Spatially distributed Tracer-Aided Rainfall–Runoff) model, Hydrol. Earth Syst. Sci., 21, 5089–5110, https://doi.org/10.5194/hess-21-5089-2017, 2017b.
Ali, M., Fiori, A., and Russo, D.: A comparison of travel-time based catchment transport models, with application to numerical experiments, J. Hydrol., 511, 605–618, https://doi.org/10.1016/j.jhydrol.2014.02.010, 2014.
Allen, R. G., Pereira, L. S., Raes, D., and Smith, M.: Crop evapotranspiration-Guidelines for computing crop water requirements-FAO Irrigation and drainage paper 56, FAO, Rome, 300, D05109, 1998.
Asano, Y., Uchida, T., and Ohte, N.: Residence times and flow paths of water in steep unchannelled catchments, Tanakami, Japan, J. Hydrol., 261, 173–192, https://doi.org/10.1016/S0022-1694(02)00005-7, 2002.
Benettin, P., van der Velde, Y., van der Zee, S. E. A. T. M., Rinaldo, A., and Botter, G.: Chloride circulation in a lowland catchment and the formulation of transport by travel time distributions, Water Resour. Res., 49, 4619–4632, https://doi.org/10.1002/wrcr.20309, 2013.
Benettin, P., Rinaldo, A., and Botter, G.: Tracking residence times in hydrological systems: forward and backward formulations, Hydrol. Process., 29, 5203–5213, https://doi.org/10.1002/hyp.10513, 2015.
Benettin, P., Soulsby, C., Birkel, C., Tetzlaff, D., Botter, G., and Rinaldo, A.: Using SAS functions and high-resolution isotope data to unravel travel time distributions in headwater catchments, Water Resour. Res., 53, 1864–1878, https://doi.org/10.1002/2016WR020117, 2017.
Birkel, C., Soulsby, C., Tetzlaff, D., Dunn, S., and Spezia, L.: High-frequency storm event isotope sampling reveals time-variant transit time distributions and influence of diurnal cycles, Hydrol. Process., 26, 308–316, https://doi.org/10.1002/hyp.8210, 2012.
Birkel, C., Soulsby, C., and Tetzlaff, D.: Conceptual modelling to assess how the interplay of hydrological connectivity, catchment storage and tracer dynamics controls nonstationary water age estimates, Hydrol. Process., 29, 2956–2969, https://doi.org/10.1002/hyp.10414, 2015.
Botter, G., Bertuzzo, E., and Rinaldo, A.: Transport in the hydrologic response: Travel time distributions, soil moisture dynamics, and the old water paradox, Water Resour. Res., 46, W03514, https://doi.org/10.1029/2009wr008371, 2010.
Botter, G., Bertuzzo, E., and Rinaldo, A.: Catchment residence and travel time distributions: The master equation, Geophys. Res. Lett., 38, L11403, https://doi.org/10.1029/2011gl047666, 2011.
Brantley, S. L., Eissenstat, D. M., Marshall, J. A., Godsey, S. E., Balogh-Brunstad, Z., Karwan, D. L., Papuga, S. A., Roering, J., Dawson, T. E., Evaristo, J., Chadwick, O., McDonnell, J. J., and Weathers, K. C.: Reviews and syntheses: on the roles trees play in building and plumbing the critical zone, Biogeosciences, 14, 5115–5142, https://doi.org/10.5194/bg-14-5115-2017, 2017.
Brooks, J. R., Barnard, H. R., Coulombe, R., and McDonnell, J. J.: Ecohydrologic separation of water between trees and streams in a Mediterranean climate, Nat. Geosci., 3, 100–104, https://doi.org/10.1038/NGEO722, 2010.
Ellsworth, P. Z. and Sternberg, L. S. L.: Seasonal water use by deciduous and evergreen woody species in a scrub community is based on water availability and root distribution, Ecohydrol., 8, 538–551, https://doi.org/10.1002/eco.1523, 2015.
Forkel, M., Carvalhais, N., Rödenbeck, C., Keeling, R., Heimann, M., Thonicke, K., Zaehle, S., and Reichstein, M.: Enhanced seasonal CO2 exchange caused by amplified plant productivity in northern ecosystems, Science (New York, N.Y.), 351, 696–699, https://doi.org/10.1126/science.aac4971, 2016.
Geris, J., Tetzlaff, D., McDonnell, J., Anderson, J., Paton, G., and Soulsby, C.: Ecohydrological separation in wet, low energy northern environments?: A preliminary assessment using different soil water extraction techniques, Hydrol. Process., 29, 5139–5152, https://doi.org/10.1002/hyp.10603, 2015.
Godsey, S. E., Aas, W., Clair, T. A., Wit, H. A. de, Fernandez, I. J., Kahl, J. S., Malcolm, I. A., Neal, C., Neal, M., Nelson, S. J., Norton, S. A., Palucis, M. C., Skjelkvale, B. L., Soulsby, C., Tetzlaff, D., and Kirchner, J. W.: Generality of fractal 1/f scaling in catchment tracer time series, and its implications for catchment travel time distributions, Hydrol. Process., 24, 1660–1671, https://doi.org/10.1002/Hyp.7677, 2010.
Good, S. P., Noone, D., and Bowen, G.: Hydrologic connectivity constrains partitioning of global terrestrial water fluxes, Science, 349, 175–177, https://doi.org/10.1126/science.aaa5931, 2015.
Harman, C. J.: Time-variable transit time distributions and transport: Theory and application to storage-dependent transport of chloride in a watershed, Water Resour. Res., 51, 1–30, https://doi.org/10.1002/2014WR015707, 2015.
Harman, C. J. and Kim, M.: An efficient tracer test for time-variable transit time distributions in periodic hydrodynamic systems, Geophys. Res. Lett., 41, 1567–1575, https://doi.org/10.1002/2013GL058980, 2014.
Hartmann, D. L., Klein Tank, A. M. G., Rusticucci, M., Alexander, L. V., Brönnimann, S., Charabi, Y., Dentener, F. J., Dlugokencky, E. J., Easterling, D. R., Kaplan, A., Soden, B. J., Thorne, P. W., Wild, A., and Zhai, P. M.: Observations: Atmosphere and Surface, in: Climate Change 2013: The Physical Science Basis.: Contribution of Working Group I to the Fifth Assessment Report of the Intergovernmental Panel on Climate Change, edited by: Stocker, T. F., Qin, D., Plattner, G.-K., Tignor, M., Allen, S. K., Boschung, J., Nauels, A., Xia, Y., Bex, V., and Midgley, P. M., Cambridge University Press, Cambridge, United Kingdom and New York, NY, USA, 2013.
Heidbüchel, I., Troch, P. A., Lyon, S. W., and Weiler, M.: The master transit time distribution of variable flow systems, Water Resour. Res., 48, W06520, https://doi.org/10.1029/2011WR011293, 2012.
Heidbüchel, I., Troch, P. A., and Lyon, S. W.: Separating physical and meteorological controls of variable transit times in zero-order catchments, Water Resour. Res., 49, 7644–7657, https://doi.org/10.1002/2012WR013149, 2013.
Hrachowitz, M., Soulsby, C., Tetzlaff, D., Malcolm, I. A., and Schoups, G.: Gamma distribution models for transit time estimation in catchments: Physical interpretation of parameters and implications for time-variant transit time assessment, Water Resour. Res., 46, W10536, https://doi.org/10.1029/2010WR009148, 2010.
Hrachowitz, M., Savenije, H., Bogaard, T. A., Tetzlaff, D., and Soulsby, C.: What can flux tracking teach us about water age distribution patterns and their temporal dynamics?, Hydrol. Earth Syst. Sci., 17, 533–564, https://doi.org/10.5194/hess-17-533-2013, 2013.
Hrachowitz, M., Benettin, P., van Breukelen, B. M., Fovet, O., Howden, N. J. K., Ruiz, L., van der Velde, Y., and Wade, A. J.: Transit times – the link between hydrology and water quality at the catchment scale, WIREs Water, 3, 629–657, https://doi.org/10.1002/wat2.1155, 2016.
Hu, K., Chen, H., Nie, Y., and Wang, K.: Seasonal recharge and mean residence times of soil and epikarst water in a small karst catchment of southwest China, Sci. Rep., 5, 10215, https://doi.org/10.1038/srep10215, 2015.
Hutson, J. L. and Wagenet, R. J.: A Multiregion Model Describing Water Flow and Solute Transport in Heterogeneous Soils, Soil Sci. Soc. Am. J., 59, 743, https://doi.org/10.2136/sssaj1995.03615995005900030016x, 1995.
Ingraham, N. L. and Criss, R. E.: Effects of surface area and volume on the rate of isotopic exchange between water and water vapor, J. Geophys. Res., 98, 20547–20553, https://doi.org/10.1029/93JD01735, 1993.
Kirchner, J. W.: Aggregation in environmental systems – Part 1: Seasonal tracer cycles quantify young water fractions, but not mean transit times, in spatially heterogeneous catchments, Hydrol. Earth Syst. Sci., 20, 279–297, https://doi.org/10.5194/hess-20-279-2016, 2016.
Knighton, J., Saia, S. M., Morris, C. K., Archiblad, J. A., and Walter, M. T.: Ecohydrologic Considerations for Modeling of Stable Water Isotopes in a Small Intermittent Watershed, Hydrol. Process., 31, 2438–2452, https://doi.org/10.1002/hyp.11194, 2017.
Kulmatiski, A. and Beard, K. H.: Root niche partitioning among grasses, saplings, and trees measured using a tracer technique, Oecologia, 171, 25–37, https://doi.org/10.1007/s00442-012-2390-0, 2013.
Kuppel, S., Tetzlaff, D., Maneta, M. P., and Soulsby, C.: EcH2O-iso 1.0: Water isotopes and age tracking in a process-based, distributed ecohydrological model, Geosci. Model Dev. Discuss., https://doi.org/10.5194/gmd-2018-25, in review, 2018.
Landon, M. K., Delin, G. N., Komor, S. C., and Regan, C. P.: Comparison of the stable-isotopic composition of soil water collected from suction lysimeters, wick samplers, and cores in a sandy unsaturated zone, J. Hydrol., 224, 45–54, https://doi.org/10.1016/S0022-1694(99)00120-1, 1999.
Laudon, H., Sjöblom, V., Buffam, I., Seibert, J., and Mörth, M.: The role of catchment scale and landscape characteristics for runoff generation of boreal streams, J. Hydrol., 344, 198–209, https://doi.org/10.1016/j.jhydrol.2007.07.010, 2007.
McDonnell, J. J.: The two water worlds hypothesis: ecohydrological separation of water between streams and trees?, WIREs Water, 1, 323–329, https://doi.org/10.1002/wat2.1027, 2014.
McMillan, H., Tetzlaff, D., Clark, M., and Soulsby, C.: Do time-variable tracers aid the evaluation of hydrological model structure? A multimodel approach, Water Resour. Res., 48, W05501, https://doi.org/10.1029/2011WR011688, 2012.
Meunier, F., Rothfuss, Y., Bariac, T., Biron, P., Richard, P., Durand, J.-L., Couvreur, V., Vanderborght, J., and Javaux, M.: Measuring and Modeling Hydraulic Lift of Using Stable Water Isotopes, Vadose Zone J., 17, 160134, https://doi.org/10.2136/vzj2016.12.0134, 2018.
Muñoz-Villers, L. E. and McDonnell, J. J.: Runoff generation in a steep, tropical montane cloud forest catchment on permeable volcanic substrate, Water Resour. Res., 48, W09528, https://doi.org/10.1029/2011WR011316, 2012.
Nyberg, L., Stähli, M., Mellander, P.-E., and Bishop, K. H.: Soil frost effects on soil water and runoff dynamics along a boreal forest transect: 1. Field investigations, Hydrol. Process., 15, 909–926, https://doi.org/10.1002/hyp.256, 2001.
Oerter, E. and Bowen, G.: In situ monitoring of H and O stable isotopes in soil water reveals ecohydrologic dynamics in managed soil systems, Ecohydrol., 10, e1841, https://doi.org/10.1002/eco.1841, 2017.
Or, D., Lehmann, P., Shahraeeni, E., and Shokri, N.: Advances in Soil Evaporation Physics – A Review, Vadose Zone J., 12, vzj2012.0163, https://doi.org/10.2136/vzj2012.0163, 2013.
Pangle, L. A., Kim, M., Cardoso, C., Lora, M., Meira Neto, A. A., Volkmann, T. H. M., Wang, Y., Troch, P. A., and Harman, C. J.: The mechanistic basis for storage-dependent age distributions of water discharged from an experimental hillslope, Water Resour. Res., 53, 2733–2754, https://doi.org/10.1002/2016WR019901, 2017.
Peralta-Tapia, A., Sponseller, R. A., Tetzlaff, D., Soulsby, C., and Laudon, H.: Connecting precipitation inputs and soil flow pathways to stream water in contrasting boreal catchments, Hydrol. Process., 29, 3546–3555, https://doi.org/10.1002/hyp.10300, 2015.
Peralta-Tapia, A., Soulsby, C., Tetzlaff, D., Sponseller, R., Bishop, K., and Laudon, H.: Hydroclimatic influences on non-stationary transit time distributions in a boreal headwater catchment, J. Hydrol., 543, 7–16, https://doi.org/10.1016/j.jhydrol.2016.01.079, 2016.
Peters, N. E., Burns, D. A., and Aulenbach, B. T.: Evaluation of High-Frequency Mean Streamwater Transit-Time Estimates Using Groundwater Age and Dissolved Silica Concentrations in a Small Forested Watershed, Aquat. Geochem., 20, 183–202, https://doi.org/10.1007/s10498-013-9207-6, 2014.
Pfister, L., Martínez-Carreras, N., Hissler, C., Klaus, J., Carrer, G. E., Stewart, M. K., and McDonnell, J. J.: Bedrock geology controls on catchment storage, mixing and release: A comparative analysis of 16 nested catchments, Hydrol. Process., 31, 1828–1845, https://doi.org/10.1002/hyp.11134, 2017.
Piovano, T., Tetzlaff, D., Ala-aho, P., Buttle, J., Mitchell, C. P. J., and Soulsby, C.: Testing a spatially distributed tracer-aided runoff model in a snow-influenced catchment: effects of multi-criteria calibration on streamwater ages, Hydrol. Process., in review, 2018.
Queloz, P., Carraro, L., Benettin, P., Botter, G., Rinaldo, A., and Bertuzzo, E.: Transport of fluorobenzoate tracers in a vegetated hydrologic control volume: 2. Theoretical inferences and modeling, Water Resour. Res., 51, 2793–2806, https://doi.org/10.1002/2014WR016508, 2015.
Ritchie, J. T.: Model for predicting evaporation from a row crop with incomplete cover, Water Resour. Res., 8, 1204–1213, https://doi.org/10.1029/WR008i005p01204, 1972.
Ritsema, C. J., Dekker, L. W., Hendrickx, J. M. H., and Hamminga, W.: Preferential flow mechanism in a water repellent sandy soil, Water Resour. Res., 29, 2183–2193, https://doi.org/10.1029/93WR00394, 1993.
Schaap, M. G., Leij, F. J., and van Genuchten, M. T.: ROSETTA: a computer program for estimating soil hydraulic parameters with hierarchical pedotransfer functions, J. Hydrol., 251, 163–176, https://doi.org/10.1016/S0022-1694(01)00466-8, 2001.
Seeger, S. and Weiler, M.: Reevaluation of transit time distributions, mean transit times and their relation to catchment topography, Hydrol. Earth Syst. Sci., 18, 4751–4771, https://doi.org/10.5194/hess-18-4751-2014, 2014.
Smith, A. A., Tetzlaff, D., and Soulsby, C.: Using StorAge Selection functions to quantify ecohydrological controls on the time-variant age of evapotranspiration, soil water, and recharge, Hydrol. Earth Syst. Sci. Discuss., https://doi.org/10.5194/hess-2018-57, in review, 2018.
Soulsby, C., Birkel, C., Geris, J., Dick, J., Tunaley, C., and Tetzlaff, D.: Stream water age distributions controlled by storage dynamics and nonlinear hydrologic connectivity: Modeling with high-resolution isotope data, Water Resour. Res., 51, 7759–7776, https://doi.org/10.1002/2015WR017888, 2015.
Soulsby, C., Birkel, C., and Tetzlaff, D.: Characterizing the age distribution of catchment evaporative losses, Hydrol. Process., 30, 1308–1312, https://doi.org/10.1002/hyp.10751, 2016.
Soulsby, C., Dick, J., Scheliga, B., and Tetzlaff, D.: Taming the Flood – how far can we go with trees?, Hydrol. Process., 31, 3122–3126, https://doi.org/10.1002/hyp.11226, 2017.
Sprenger, M., Herbstritt, B., and Weiler, M.: Established methods and new opportunities for pore water stable isotope analysis, Hydrol. Process., 29, 5174–5192, https://doi.org/10.1002/hyp.10643, 2015a.
Sprenger, M., Volkmann, T. H. M., Blume, T., and Weiler, M.: Estimating flow and transport parameters in the unsaturated zone with pore water stable isotopes, Hydrol. Earth Syst. Sci., 19, 2617–2635, https://doi.org/10.5194/hess-19-2617-2015, 2015b.
Sprenger, M., Seeger, S., Blume, T., and Weiler, M.: Travel times in the vadose zone: variability in space and time, Water Resour. Res., 52, 5727–5754, https://doi.org/10.1002/2015WR018077, 2016.
Sprenger, M., Tetzlaff, D., and Soulsby, C.: Soil water stable isotopes reveal evaporation dynamics at the soil–plant–atmosphere interface of the critical zone, Hydrol. Earth Syst. Sci., 21, 3839–3858, https://doi.org/10.5194/hess-21-3839-2017, 2017.
Sprenger, M., Tetzlaff, D., Buttle, J., Carey, S. K., McNamara, J. P., Laudon, H., Shatilla, N. J., and Soulsby, C.: Storage, mixing and fluxes of water in the critical zone across northern environments inferred by stable isotopes of soil water, Hydrol. Process., 32, 1720–1737, https://doi.org/10.1002/hyp.13135, 2018a.
Sprenger, M., Tetzlaff, D., Buttle, J. M., Laudon, H., Leistert, H., Mitchell, C. P. J., Snelgrove, J., Weiler, M., and Soulsby, C.: Measuring and modelling stable isotopes of mobile and bulk soil water, Vadose Zone J., 17, 170149, https://doi.org/10.2136/VZJ2017.08.0149, 2018b.
Stähli, M., Nyberg, L., Mellander, P.-E., Jansson, P.-E., and Bishop, K. H.: Soil frost effects on soil water and runoff dynamics along a boreal transect: 2. Simulations, Hydrol. Process., 15, 927–941, https://doi.org/10.1002/hyp.232, 2001.
Staudinger, M., Stoelzle, M., Seeger, S., Seibert, J., Weiler, M., and Stahl, K.: Catchment water storage variation with elevation, Hydrol. Process., 31, 2000–2015, https://doi.org/10.1002/hyp.11158, 2017.
Sterling, S. M., Ducharne, A., and Polcher, J.: The impact of global land-cover change on the terrestrial water cycle, Nat. Clim. Change, 3, 385–390, https://doi.org/10.1038/nclimate1690, 2013.
Stumpp, C., Nützmann, G., Maciejewski, S., and Maloszewski, P.: A comparative modeling study of a dual tracer experiment in a large lysimeter under atmospheric conditions, J. Hydrol., 375, 566–577, https://doi.org/10.1016/j.jhydrol.2009.07.010, 2009.
Stumpp, C., Stichler, W., Kandolf, M., and Šimůnek, J.: Effects of Land Cover and Fertilization Method on Water Flow and Solute Transport in Five Lysimeters: A Long-Term Study Using Stable Water Isotopes, Vadose Zone J., 11, vzj2011.0075, https://doi.org/10.2136/vzj2011.0075, 2012.
Tetzlaff, D., Carey, S., Soulsby, C., Tetzlaff, D., Soulsby, C., Buttle, J., Capell, R., Carey, S. K., Laudon, H., McDonnell, J., McGuire, K., Seibert, J., and Shanley, J.: Catchments on the cusp? Structural and functional change in northern ecohydrology, Hydrol. Process., 27, 766–774, https://doi.org/10.1002/hyp.9700, 2013.
Tetzlaff, D., Birkel, C., Dick, J., Geris, J., and Soulsby, C.: Storage dynamics in hydropedological units control hillslope connectivity, runoff generation and the evolution of catchment transit time distributions, Water Resour. Res., 50, 969–985, https://doi.org/10.1002/2013WR014147, 2014.
Tetzlaff, D., Buttle, J., Carey, S. K., van Huijgevoort, M. H. J., Laudon, H., McNamara, J., Mitchell, C. P. J., Spence, C., Gabor, R. S., and Soulsby, C.: A preliminary assessment of water partitioning and ecohydrological coupling in northern headwaters using stable isotopes and conceptual runoff models, Hydrol. Process., 29, 5153–5173, https://doi.org/10.1002/hyp.10515, 2015.
Timbe, E., Windhorst, D., Crespo, P., Frede, H.-G., Feyen, J., and Breuer, L.: Understanding uncertainties when inferring mean transit times of water trough tracer-based lumped-parameter models in Andean tropical montane cloud forest catchments, Hydrol. Earth Syst. Sci., 18, 1503–1523, https://doi.org/10.5194/hess-18-1503-2014, 2014.
Vanderborght, J. and Vereecken, H.: Review of Dispersivities for Transport Modeling in Soils, Vadose Zone J., 6, 29–52, https://doi.org/10.2136/vzj2006.0096, 2007.
van der Velde, Y., Torfs, P. J. J. F., van der Zee, S. E. A. T. M., and Uijlenhoet, R.: Quantifying catchment-scale mixing and its effect on time-varying travel time distributions, Water Resour. Res., 48, W06536, https://doi.org/10.1029/2011WR011310, 2012.
van der Velde, Y., Heidbüchel, I., Lyon, S. W., Nyberg, L., Rodhe, A., Bishop, K., and Troch, P. A.: Consequences of mixing assumptions for time-variable travel time distributions, Hydrol. Process., 29, 3460–3474, https://doi.org/10.1002/hyp.10372, 2015.
van Genuchten, M. T.: A closed-form equation for predicting the hydraulic conductivity of unsaturated soils, Soil Sci. Soc. Am. J., 44, 892–898, 1980.
van Huijgevoort, M. H. J., Tetzlaff, D., Sutanudjaja, E. H., and Soulsby, C.: Using high resolution tracer data to constrain water storage, flux and age estimates in a spatially distributed rainfall-runoff model, Hydrol. Process., 30, 4761–4778, https://doi.org/10.1002/hyp.10902, 2016.
Vargas, A. I., Schaffer, B., Yuhong, L., and Sternberg, L. d. S. L.: Testing plant use of mobile vs immobile soil water sources using stable isotope experiments, New Phytologist, 215, 582–594, https://doi.org/10.1111/nph.14616, 2017.
Venables, W. N. and Ripley, B. D.: Modern applied statistics with S, 4th ed., Statistics and computing, Springer, New York, Berlin, Heidelberg, 495 pp., 2011.
Volkmann, T. H. M., Haberer, K., Gessler, A., and Weiler, M.: High-resolution isotope measurements resolve rapid ecohydrological dynamics at the soil-plant interface, New Phytol., 210, 839–849, https://doi.org/10.1111/nph.13868, 2016.
Wang, H., Tetzlaff, D., and Soulsby, C.: Assessing the environmental controls on Scots pine transpiration and the implications for water partitioning in a boreal headwater catchment, Agr. Forest Meteorol., 240–241, 58–66, https://doi.org/10.1016/j.agrformet.2017.04.002, 2017a.
Wang, H., Tetzlaff, D., and Soulsby, C.: Testing the Maximum Entropy Production approach for estimating evapotranspiration from closed canopy shrubland in a low-energy humid environment, Hydrol. Process., 31, 4613–4621, https://doi.org/10.1002/hyp.11363, 2017b.
Wang, H., Tetzlaff, D., and Soulsby, C.: Modelling the effects of land cover and climate change on soil water partitioning in a boreal headwater catchment, J. Hydrol., 558, 520–531, https://doi.org/10.1016/j.jhydrol.2018.02.002, 2018.
Wassenaar, L. I., Hendry, M. J., Chostner, V. L., and Lis, G. P.: High Resolution Pore Water δ2H and δ18O Measurements by H2O (liquid) -H2O (vapor) Equilibration Laser Spectroscopy, Environ. Sci. Technol., 42, 9262–9267, https://doi.org/10.1021/es802065s, 2008.
Wei, X., Li, Q., Zhang, M., Giles-Hansen, K., Liu, W., Fan, H., Wang, Y., Zhou, G., Piao, S., and Liu, S.: Vegetation cover-another dominant factor in determining global water resources in forested regions, Glob. Change Biol., 24, 786–795, https://doi.org/10.1111/gcb.13983, 2018.
Weiler, M. and Naef, F.: An experimental tracer study of the role of macropores in infiltration in grassland soils, Hydrol. Process., 17, 477–493, https://doi.org/10.1002/Hyp.1136, 2003.