the Creative Commons Attribution 3.0 License.
the Creative Commons Attribution 3.0 License.
Future extreme precipitation intensities based on a historic event
Iris Manola
Bart van den Hurk
Hans De Moel
Jeroen C. J. H. Aerts
In a warmer climate, it is expected that precipitation intensities will increase, and form a considerable risk of high-impact precipitation extremes. This study applies three methods to transform a historic extreme precipitation event in the Netherlands to a similar event in a future warmer climate, thus compiling a “future weather” scenario. The first method uses an observation-based non-linear relation between the hourly-observed summer precipitation and the antecedent dew-point temperature (the Pi–Td relation). The second method simulates the same event by using the convective-permitting numerical weather model (NWP) model HARMONIE, for both present-day and future warmer conditions. The third method is similar to the first method, but applies a simple linear delta transformation to the historic data by using indicators from The Royal Netherlands Meteorological Institute (KNMI)'14 climate scenarios. A comparison of the three methods shows comparable intensity changes, ranging from below the Clausius–Clapeyron (CC) scaling to a 3 times CC increase per degree of warming. In the NWP model, the position of the events is somewhat different; due to small wind and convection changes, the intensity changes somewhat differ with time, but the total spatial area covered by heavy precipitation does not change with the temperature increase. The Pi–Td method is simple and time efficient compared to numerical models. The outcome can be used directly for hydrological and climatological studies and for impact analysis, such as flood-risk assessments.
- Article
(2105 KB) - Full-text XML
- BibTeX
- EndNote


It is expected that climate change will increase the frequency and intensity of extreme precipitation events (e.g., Stocker et al., 2014; Pachauri et al., 2014). Different types of flooding may result from extreme precipitation, while the antecedent soil conditions also play a role on stream discharge levels (Ivancic and Shaw, 2015; Wasko and Sharma, 2017). In urban environments, extreme precipitation may lead to local-scale inundations, causing damage to houses and infrastructure within a time frame of several hours. On a larger river-basin scale, extreme rainfall over a period of days to several weeks may lead to river or flash floods, which may cause fatalities and can be catastrophic for the economy (e.g., Koks et al., 2015) and ecosystems (e.g., Knapp et al., 2008).
For the management of these risks, it is important to understand how the risk of extreme precipitation will change under future weather conditions. Current knowledge of climate change and possible future climate scenarios are developed within the Intergovernmental Panel on Climate Change (IPCC; Pachauri et al., 2014). For regional and national applications, tailored climate change scenarios have been developed, such as those for the Netherlands (Van den Hurk et al., 2014, henceforth “KNMI'14”). An important element for the successful application of climate change scenarios within a local to regional context is that they are tailored towards the needs of policy makers who use them in order to assess the effectiveness of adaptation strategies in reducing the risk of adverse effects, such as from flooding. Therefore, users of regional climate scenarios are increasingly involved in tailoring climate change information, in order to ensure that climate-scenario information is comprehensible and applicable to policy making (Van den Hurk et al., 2014).
In flood-risk management there is a need for climate scenarios that provide information on how extreme weather events may look like in the future (Aerts et al., 2014; Ward et al., 2014). The preferable way to obtain such information is to perform numerical (climate) model simulations that are sufficiently long to resolve the climate change trend (e.g., > 30 years) and which have a sufficiently high resolution to adequately resolve important dynamical and thermodynamic interactions, such as convective processes. Currently, such long and precise model simulations are lacking (Bürger et al., 2014) due to computational and data-storage constraints. Therefore, (a combination of) climate modeling and statistical corrections are usually employed, using shorter time series and providing projections of future climate, such as the official climate change scenarios for the Netherlands (KNMI'14; Van den Hurk et al., 2014). For example, a common approach to dealing with climate change in flood-risk studies can be described as a “delta-change” technique. In such a statistical approach, results usually from regional and global climate models are used to derive the (seasonal) change in precipitation characteristics, such as the wet-day frequency and the median or extreme precipitation. This change factor is subsequently applied to an observed time series or individual event in order to generate (extreme) rainfall under a changed climate (Lenderink et al., 2007; Fowler et al., 2007; Van Pelt et al., 2012; Räty et al., 2014). Another approach that is used to study precipitation extremes is to improve the low spatial and temporal resolution of long model simulations by means of statistical and dynamical downscaling techniques (Maraun et al., 2010). Such simulated time series can also be improved by using bias-correction methods that are derived from present-day simulations (Teutschbein et al., 2012; Bakker et al., 2014). Nevertheless, bias continues to exist and the uncertainties remain quite high.
Recently, a novel “future weather” concept has been proposed in order to provide high-resolution information on relevant characteristics of specific future extreme events, such as the duration and intensity of heavy rainfall (Hazeleger et al., 2015). According to this concept, historically observed events are used as a reference and modified with the use of numerical weather-prediction models, so that the outcome shows how the same event would occur in a future warmer climate. By applying a future situation to past events that are known to flood-risk managers, it is much easier for them to interpret the impact of such hypothetical future conditions. Hazeleger et al., (2015) used a high-resolution global-atmospheric model to simulate a future extreme weather event, by imposing future boundary conditions on historic numerical weather prediction (NWP) simulations. Lenderink and Attema (2015) developed future scenarios of local precipitation events by perturbing the temperature and humidity boundary conditions of simulations in the regional models RACMO2 and HARMONIE, in order to mimic a 2 ∘C warmer world. A similar method is the “pseudo-global-warming” method, which involves the simulation of observed events modifying the meteorological forcing by a climate change difference (Schär et al., 1996; Michaelis et al., 2017). For example, Trapp and Hoogewind (2016) applied climate change differences from CMIP5 (Coupled Model Intercomparison Project Phase 5) simulations on the high-resolution Weather Research and Forecasting (WRF) model to reveal how typically observed extreme tornadoes might be realized under conditions of the late 21st century.
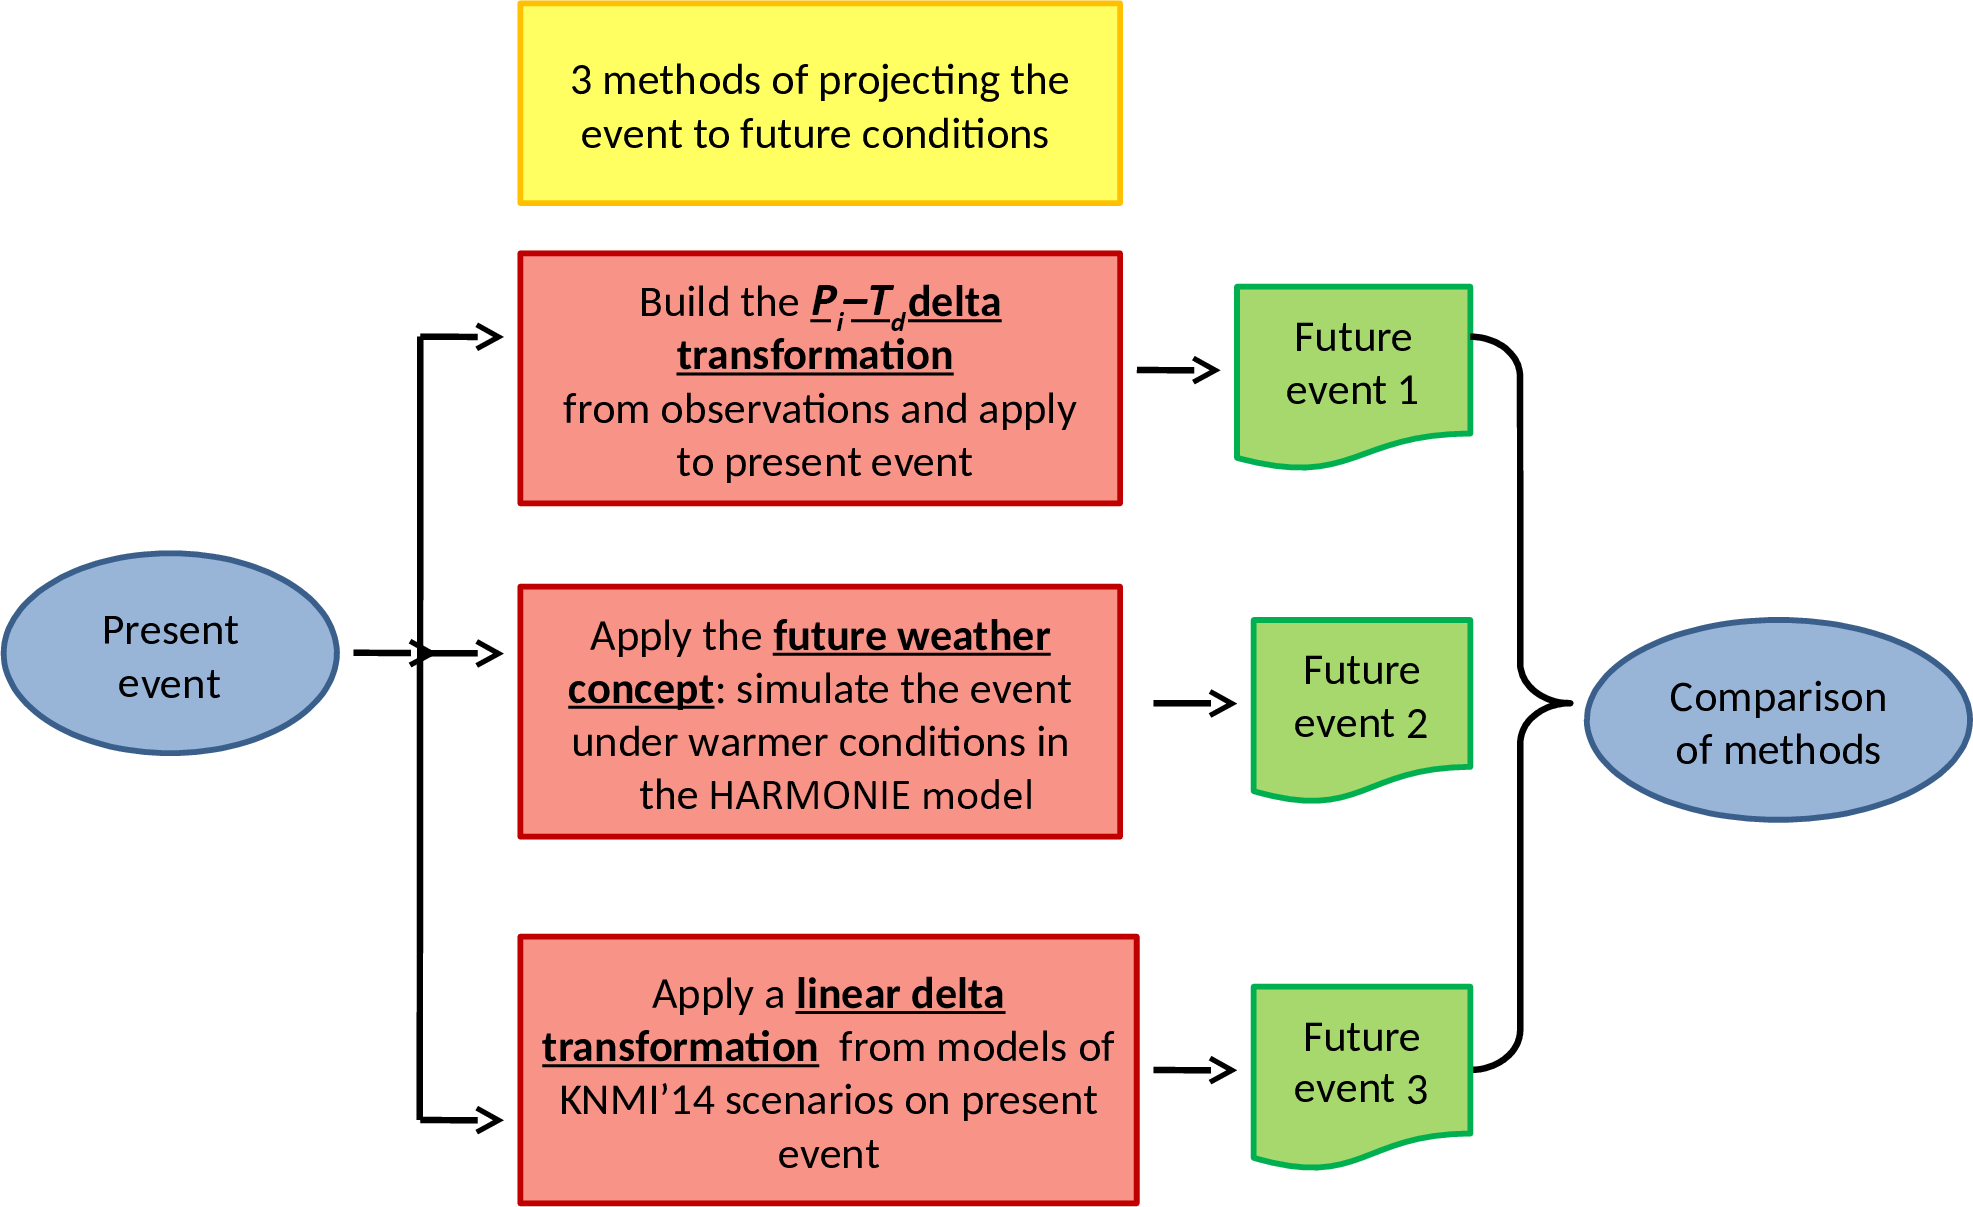
Figure 1In order to produce a future precipitation event, three methodologies were followed, each departing from the same historic event. Future event 1: using observed precipitation intensity–dew-point temperature relations in order to create change factors. Future event 2: using the weather model HARMONIE with perturbed initial conditions from ECMWF's ENS. Future event 3: using delta-change factors retrieved from climate model simulations.
Among the four methods described above (delta change, downscaling techniques, bias correction, and future weather), the delta change and the future weather are employed in this paper. The main aim is to compare a “future weather” simulation with two alternative “delta-change” scaling methods, of which one is developed in this study. All three methods are applied to the same case study of extreme precipitation that took place in the Netherlands on 28 July 2014. The future weather method uses the outcome of the high-resolution numerical weather prediction model HARMONIE (Seity et al., 2011). This model was forced with boundary conditions representing both the historic event and future conditions, in order to obtain information on how the event would behave in the future. The first scaling method follows a non-linear delta transformation (Lenderink and Van Meijgaard, 2008; Lenderink and Attema, 2015), based on the observational behavior of precipitation intensity (Pi) as a function of the dew-point temperature (Td) (henceforth “Pi–Td relation”). The transformation was superimposed directly on the historical data assuming a future warmer world. The second scaling-method is a simplistic linear delta-change technique, which takes results from the KNMI'14 scenarios (Van den Hurk et al., 2014) in order to develop the future event.
This paper is organized as follows: Sect. 2 begins with a flowchart summary of the steps that are followed, and subsequently illustrates and discusses the three methods for projecting the future event. In Sect. 3, the observed Dutch case study is presented and then simulated in the HARMONIE model. Section 4 presents the future event for each method, firstly individually and secondly by a quantitative and qualitative comparison. The final section summarizes the research and concludes this paper.
The steps that were followed in this paper are summarized in Fig. 1. Overall, three methods were used to transform an observed event (28 July 2014, in the Netherlands) into a future event, assuming a warmer climate. The first scaling method, which is the Pi–Td non-linear delta transformation, is based on summertime hourly radar precipitation data and hourly-observed dew-point temperature for the years 2008–2015. In order to create the future precipitation event, the Pi–Td transformation was applied to the precipitation data assuming a 2 ∘C warmer Td. In the future weather method, the historic event was simulated using an ensemble of seven runs from the weather model HARMONIE, using both the historic boundary and the initial conditions from the Ensemble Prediction System (ENS) of ECMWF (Molteni et al., 1996; Leutbecher et al., 2008) for that particular day. Subsequently, the relevant future ensemble was simulated by perturbing the initial and boundary conditions to represent a unified increase of 2 ∘C, while maintaining the relative humidity (RH) constant. This assumption is based on long-term projections for the Netherlands, where the RH shows either no change or a small decrease (Lenderink et al., 2011 and KNMI'14). In the linear delta-change method (or delta transformation method) a factor was used to perturb the event, again assuming a warming of 2 ∘C.
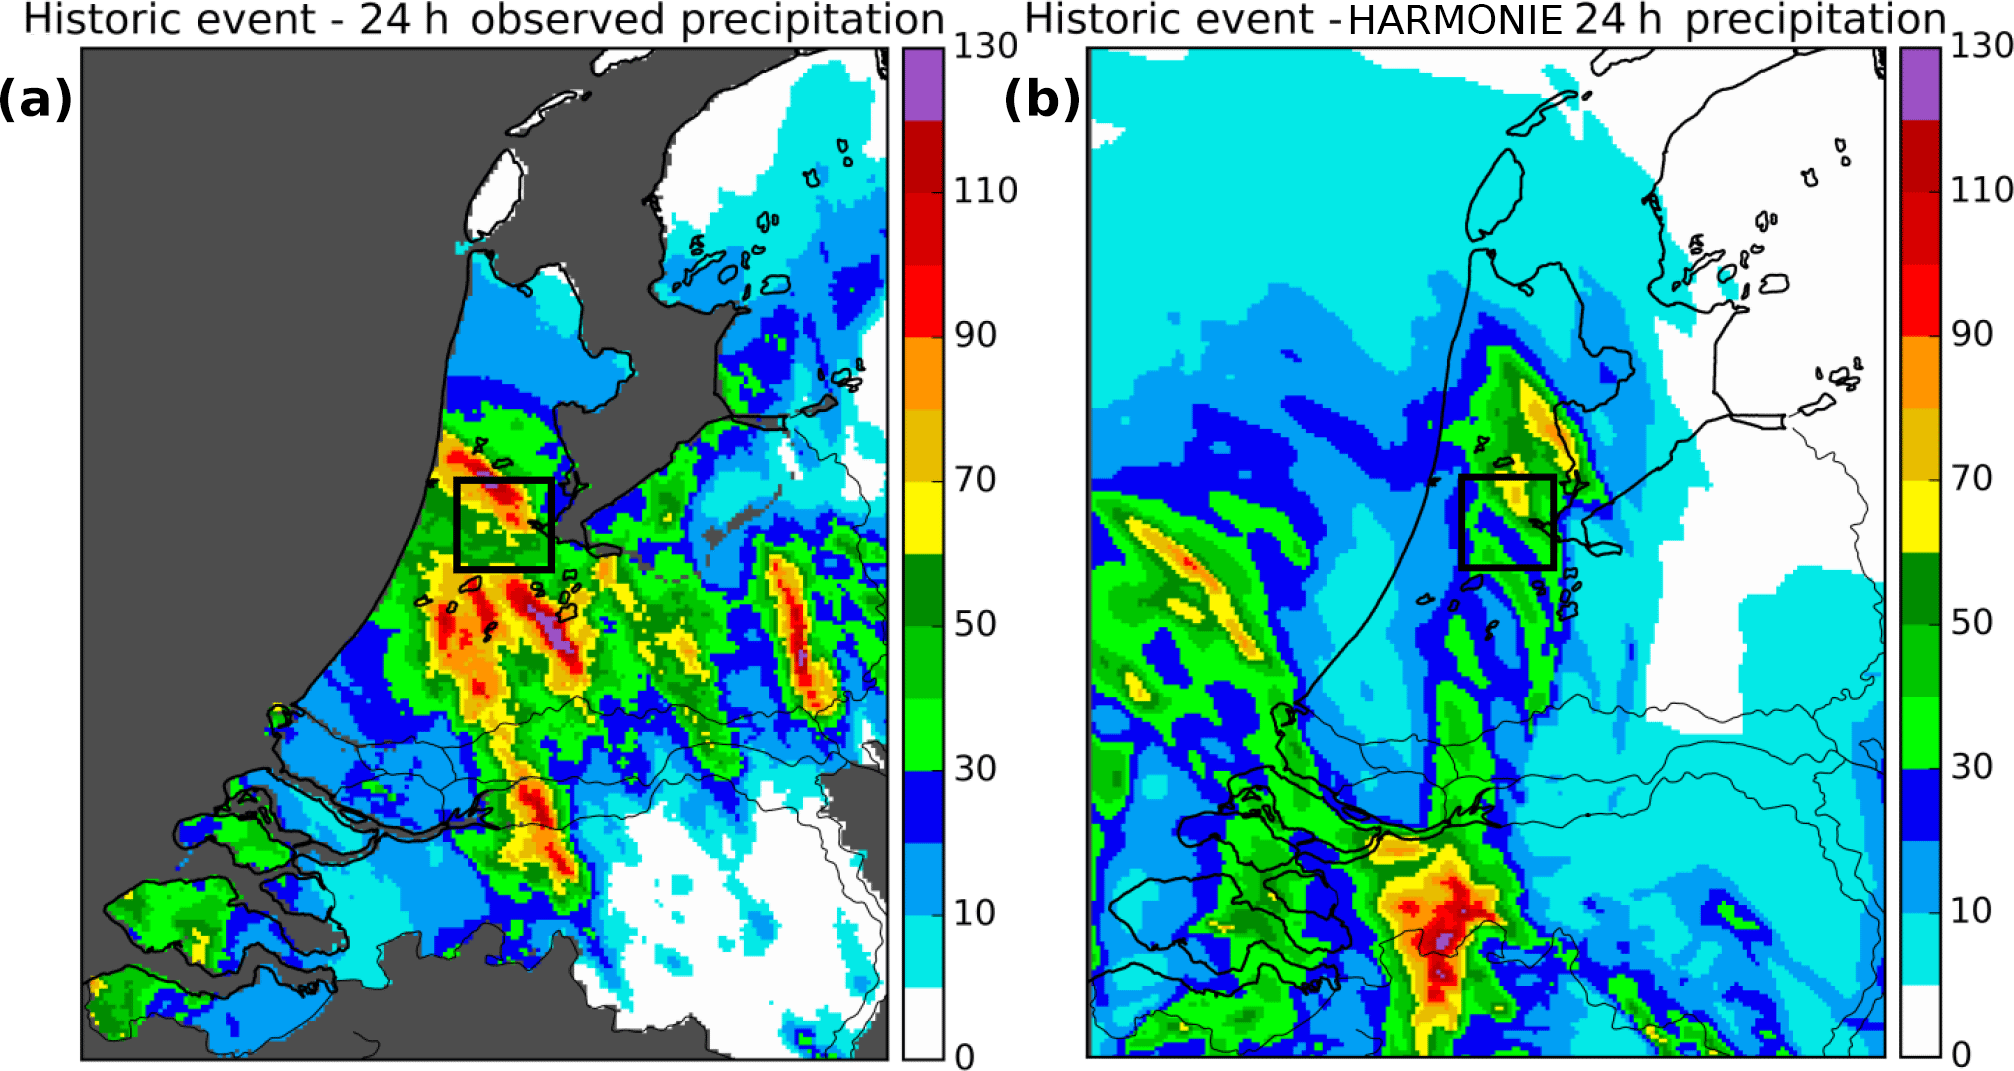
Figure 2The daily accumulated precipitation in mm d−1 over the Netherlands for 28 July 2014. (a) From radar observations (only with available data from the Netherlands' inland regions) and (b) As simulated by a representative member from the HARMONIE ensemble run. The black box shows the area of the city of Amsterdam.
The three methodologies were statistically compared and evaluated. As the HARMONIE model has shown to sufficiently simulate observed events (Attema et al., 2014; Koutroulis et al., 2015) and as it is the method that involves the highest level of physical sophistication, its outcome is used here as a benchmark for the evaluation of the Pi–Td method and the linear-delta method. The comparison between the Pi–Td method and the future simulation provides information on how the explicitly modeled interactions affect the results, compared to the statistical methods. Comparing the Pi–Td method and the linear-transformation points, reveals the added value of enhancing the sophistication of the statistical scaling approach.
2.1 The Dutch case study
The Netherlands is a low-lying country that is shaped by the river deltas of the Meuse and Rhine rivers. It is vulnerable to flooding from storms surging from the North Sea, as well as river flooding. In addition, extreme precipitation events inundate urban areas and agricultural fields, frequently leading to considerable damage. Observations show that the temperature in the Netherlands rose by 1.8 ∘C since the beginning of the 20th century, clearly exceeding the global average (KNMI'14 scenarios; Van den Hurk et al., 2014). This has led to an increase in atmospheric moisture, a 25 % increase in the annual mean precipitation, and an increase of 12 % ∘C−1 in the hourly intensity of the most extreme showers of the 20th century. In the KNMI'14 scenarios, the temperature is projected to rise another 1–2.3 degrees until 2050, leading to more frequent and intense extreme precipitation events.
The extreme precipitation event that is analyzed here took place on the 28 July 2014 and resulted in blocked highways, the disruption of air transportation, and flooded buildings and public facilities. An analysis of the 325 Dutch rain-monitoring stations shows that an event of such intensity has a 5- to 15-year return period (Van Oldenborgh and Lenderink, 2014). It consisted of scattered, strong convective cells that started in the early morning in the west and southwest of the country, and reached the central-eastern region in the afternoon. The daily accumulated-precipitation intensity reached 140 mm locally (Fig. 2a). The small scale of the convective events underlines the need for high-resolution convection-permitting modeling. As the most severe damages are usually reported over urban areas (Ward et al., 2013), this analysis mainly focuses on the period between 08:00 and 09:00 LT (local time), the time of day in which the most precipitation fell over the city of Amsterdam.
2.2 The historic event in the HARMONIE model
In order to simulate the historic and future events, two ensemble simulations were carried out with the high-resolution weather forecasting model HARMONIE (Seity et al., 2011, cycle 40): one ensemble under present climate conditions and one under future climate conditions (2 ∘C warmer). HARMONIE uses non-hydrostatic convection-permitting dynamics and AROME physics with a horizontal resolution of 1 km × 1 km, 60 levels in the vertical direction, and a time step of 1 min. The output is given every hour. The initial and boundary conditions are taken from the ECMWF's ENS ensemble runs, are updated every hour, and have a 0.28∘ × 0.28∘ grid size (∼ 32 km × 20 km). The ENS is built to predict the probability distribution of forecast states, taking into account the random analysis error and model uncertainties. In order to select the best-fitted initial and boundary conditions for the simulation of the present event in HARMONIE, the ENS ensemble of 51 members was run for the day of the event. From the outcome, seven runs that performed closest to the radar observations were selected. These runs initiated the HARMONIE ensemble at 12:00 LT on 27 July 2014 and ran for 36 h, rendering an hourly output of the simulated historic event. This starting time was selected as the precipitable pattern was closer to that of the radar observations, compared to the runs initiated at 00:00 LT on 28 July.
The outcome of the present ensemble simulation under the initial conditions for 28 July shows that the HARMONIE captures sufficiently well the convective nature, the approximate size of the cells, and the maximum intensity of precipitation, as well as the duration and the approximate time evolution of the event in all of its seven members. However, the location of the reported events was not very accurate (Fig. 2b). Clear discrepancies can be found in the position and number of convective cells between the simulation and the observations, and between the individual ensemble members (not shown here). The relatively low predictability of the exact position of the cells is due to the unstable, chaotic character of the specific event and to the imperfection of the model's initial and boundary conditions.
2.3 Scaling method 1: the Pi–Td from observations
In this section, the methodology for expressing the precipitation intensity as a function of the dew-point temperature is discussed and compared to CC (Clausius–Clapeyron) scaling. The method was applied to the historic event using a perturbed input temperature in order to depict the expected intensity changes for a warmer climate.
2.3.1 The Pi–Td relation
An important thermodynamic expression for the formation of precipitation in the atmosphere is the CC relation, according to which the maximum holding capacity of water vapor in an air mass increases by approximately 7 % ∘C−1 of warming (Trenberth et al., 2003). When the intensity of heavy precipitation is limited by the local availability of atmospheric moisture and is not sensitive to the atmospheric dynamic advection processes, it can be expected that the precipitation intensity increases at the same rate. However, both observations and model simulations show deviations from the CC scaling (Haerter and Berg, 2009; Bürger et al., 2014), as the dynamics and feedbacks between atmospheric processes also play an important role in the formation of precipitation.
For example, the relation between extreme precipitation intensity and temperature has been found to reach 2 times that of the CC scaling, i.e., up to 14 % ∘C−1 of warming (Lenderink and Van Meijgaard, 2008; Sugiyama et al., 2010; Panthou et al., 2014; Attema et al., 2014; Allan, 2011; Berg et al., 2013). This scaling relation shows some large spatial inhomogeneity (Wasko et al., 2016), with the strong scaling found mainly in the mid- and high latitudes, while in the tropics extreme precipitation intensities are even found to exhibit a decrease with increasing dew-point temperatures (Utsumi et al., 2011). The exceedance of the CC scaling for extreme precipitation is suggested to be related to the large- and small-scale dynamics of the atmosphere, and to the vertical stability (Loriaux et al., 2013; Lenderink and Attema 2015). Other studies indicate that statistical factors account for temperature-related changes in precipitation types, with an increasing contribution of convective warmer rain as temperature rises (Haerter and Berg, 2009). Other processes that potentially play a role are the increase in convective available potential energy (CAPE) with temperature and the positive feedback that is induced by the release of latent heat energy during the condensation of water vapor, thereby enhancing convection (Panthou et al., 2014). In general, the relation between precipitation intensity and temperature varies with region, season, duration, and type of precipitation, and is different for low and high temperatures, ranging from below CC to super CC. The scaling can be expressed using either absolute temperature (T) or dew-point temperature (Td) as a reference. Preference is given to Td, as this quantity contains explicit information on both temperature and the near-surface humidity (Lenderink et al., 2011).
In addition, large-scale circulation, vertical stability, cloud microphysics, moist adiabatic lapse rate, soil-water scarcity, and other factors play a role. The CC or below CC rates are mainly followed by long, synoptic, colder rain, while the super CC is mainly found in short-lived, warmer convective rain (Panthou et al., 2014; Lenderink et al., 2011; Mishra et al., 2012; Singleton and Toumi, 2013).
The precipitation data used to build the Pi–Td relation is hourly data from the gauge-adjusted Dutch Doppler weather-radar data set (Overeem et al., 2011). In this data set, the pixel area is approximately 0.9 km × 0.9 km and is available for 8 years (2008–2015). The radar operates on the C-band and measures precipitation depths based on composites of reflectivities from two Dutch radar stations: De Bilt and Den Helder. The hourly dew-point temperature was derived from 37 KNMI weather stations in the Netherlands, for the same period as the precipitation data. The sample size of the observed data for the temperature range between 7 ∘C and 21 ∘C can be considered large enough to eliminate statistical artifacts that may occur, since it contains 97 % of the 8 years of hourly summer data.
One advantage of the radar's high resolution is that small-scale convective precipitation (∼ 1 km) is resolved explicitly. Following Lenderink et al. (2011), only precipitating areas were taken into account (> 0.1 mm h−1). Rainfall intensity data were first classified into 15 non-uniform percentile classes, ranging from the 25th to the 99.9th percentile and placed in bins of 2 ∘C Td width overlapping with steps of 1 ∘C. The sensitivity to the temperature bin width was tested by comparing a 1 and 0.5 ∘C bin width, and was found to be insignificant. In order to match the precipitation data to antecedent air-mass properties that are characteristic for the formation of the precipitation events, Td was measured 4 hours prior to the precipitation time. This time shift also avoids the contamination of the temperature and RH records by the changes that the precipitation process imposes, such as temperature drops due to descending colder, dry air from convective downdrafts or to heat release from the evaporation of precipitation (Lenderink et al., 2011; Bao et al., 2017).
The Pi–Td scaling was calculated separately for low to very high percentiles and is illustrated in Fig. 3. For low to medium temperatures, there is little change in the precipitation intensity with the temperature for all percentiles, while for higher temperatures and percentiles below the medium, a monotonic increase with Td of about 5 % ∘C−1 is shown. This behavior is usually attributed to large-scale precipitation and passing synoptic systems. For warmer temperatures between about 15–20 ∘C, precipitation intensity increases rapidly with temperature. For medium percentiles the intensity increases at a rate of over 2 times CC (14 % ∘C−1 of warming) and rising up to 21 % for higher percentiles (a 3 times CC rate). This rate levels off at very high percentiles and at dew-point temperatures above 21 ∘C, possibly due to a limitation of the moisture supply to sustain the high precipitation intensities (Hardwick-Jones et al., 2010), clouds reaching the tropopause, or statistical artifacts (Wasko et al., 2015). The extreme 3 times CC rate is attributed to short-lasting, warm, convective precipitation events. To confirm this, a comparison to winter conditions was made where the larger synoptic systems are dominant. Also, values were computed from daily averaged data, to filter out the effect of short-duration convective events. The rate is almost uniformly CC during the winter, while for daily summer data the rate is below CC for small percentiles and above CC for larger percentiles (not shown). This rapid increase in Pi with Td is also visible in Fig. 1 of Loriaux et al. (2013), where a 3 times CC rate in the Pi–Td relation is illustrated at the hourly and sub-hourly precipitation, for the 90th percentile of a temperature band, similar to the one that is discussed here. For very high percentiles the rate decreases to 2 times CC.
2.3.2 The Pi–Td as delta transformation
A multi-decadal observational analysis in the Netherlands shows that the trend in extreme precipitation can be explained by changes in dew-point temperatures (Lenderink et al., 2011; Lenderink and Attema 2015). In the same study, a similar long-term trend between T and Td indicates an almost constant RH with time, which implies that changes in T scale with changes in Td. The KNMI'14 scenarios also project no change or a small decrease in the future RH, depending on the scenario.
In the Pi–Td transformation, the dynamics of the atmosphere and the RH are assumed to be unchanged. Starting from the historic event, the dew-point temperature and precipitation intensity per grid point are calculated and attributed to a point in the Pi–Td graph (Fig. 3), for the corresponding Pi percentile. The increase in the precipitation intensity, ΔPi, is found by moving the initial point along the isolines in Fig. 3 by 2 ∘C. The procedure is repeated for each grid point individually. This method only examines the possible changes in the intensity of precipitation in already precipitable areas and does not allow changes in the spatial scale of the event. The mean dew-point temperature of the event of 28 July 2014 is 17.3 ∘C with a spatial variance of 1.8 ∘C. In addition to the application to the observed records, the Pi–Td method is applied to the seven members of the simulated historic event shown in Fig. 4a below (to be discussed later).
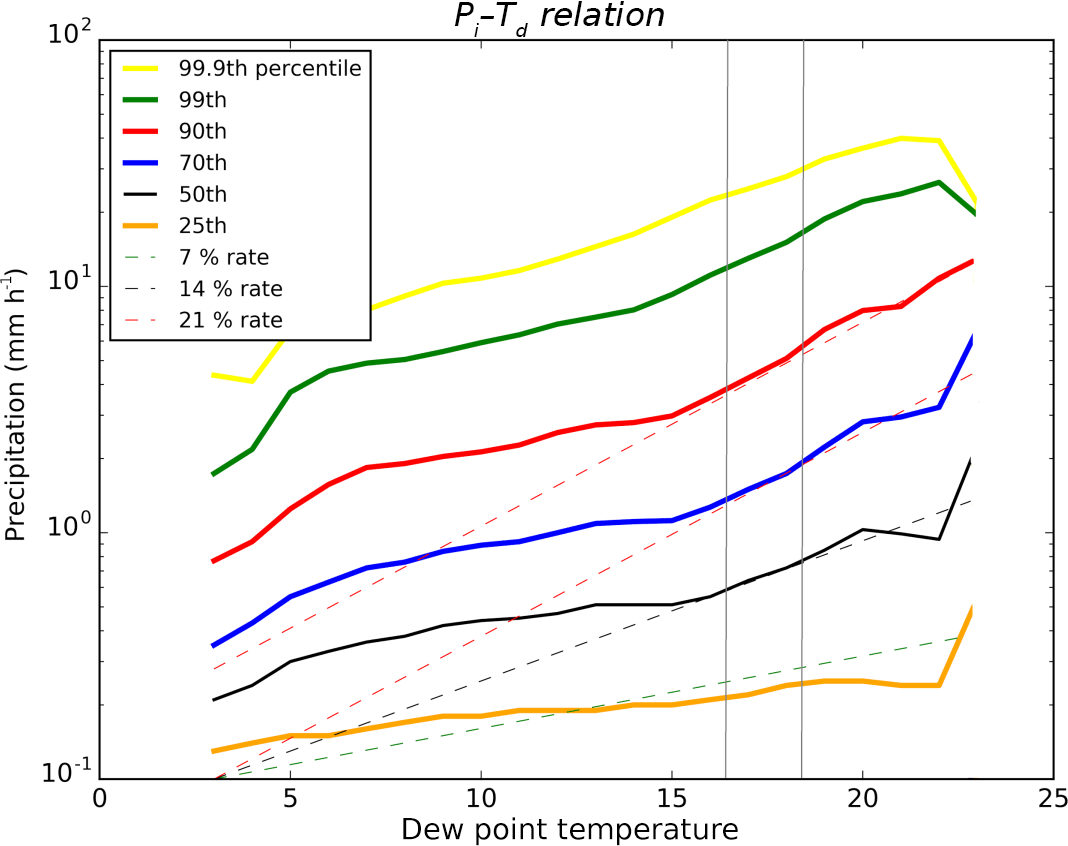
Figure 3Precipitation intensity as a function of the dew-point temperature from hourly observations for June–August 2008–2015. The solid lines indicate the different percentiles of precipitation intensity. The dotted lines indicate the 7, 14, and 21 % ∘C−1 scaling. The two grey vertical lines indicate the mean temperature on 28 July 2014 in the Netherlands and a 2 ∘C warmer future event.
2.4 Simulating the future weather
For the future event, the HARMONIE ensemble was run again, with the temperature of the initial and boundary conditions being increased by 2 ∘C at all levels and time steps. The RH was kept constant in order to ensure that the provided moisture remained adequate. Due to the constant RH, the temperature change approximately scales with the Td change, resulting in a roughly equal change of 2 ∘C in Td. Attema et al. (2014) show that the simplification of the homogeneous increase in temperature and RH do not result in significant differences compared to non-homogeneous changes to the temperature and humidity profiles that were derived from a long climate change simulation.
2.5 Scaling method 2: linear delta transformation from climate models
A common approach to account for climate change effects in hydrological assessments is known as the delta change approach (Andreasson et al., 2004). The change signal between a control (current climate) situation and a future climate condition is used to adjust an observed climate record (such as temperature and precipitation). This adjusted series is subsequently used as input for the hydrological assessment (such as flood simulation). This approach is widely used (e.g., see Hay et al., 2000; Andreasson et al., 2004; and references therein), as it is relatively easy to use and requires only a couple of change factors that can directly be retrieved from either global climate model (GCM) runs or climate scenarios (such as the KNMI'14). Such change factors can differ in terms of complexity, ranging from a single change factor for all values to separate change factors for different months, seasons, and percentiles. In some cases, specific statistical tools have been developed that adjust observed time series by using various parameters that are related to climate change (such as amount of wet days, change in mean, change in extreme; Bakker and Bessembinder, 2012), as used in Te Linde et al. (2010).
In our case, the linear delta approach is applied with the KNMI'14 scenarios (Van den Hurk et al., 2014), which are based on the global climate scenarios from the latest IPCC report (Stocker et al., 2014), but tailored to the area of the Netherlands. Four KNMI'14 climate change scenarios were developed for 2050 and 2085. We selected a scenario in which Td is expected to rise by 2 ∘C by 2050. Furthermore, the mean temperature in the selected scenario is expected to increase by 2.3 ∘C and mean summertime RH is expected to decrease by 2.5 %. According to this scenario, the maximum hourly intensity of the precipitation per year will increase by a maximum of 25 %. In order to up-scale the intensity of the historic event with this linear-delta factor, the entire range of the historic precipitation is increased by 25 % (assuming a steady increase with temperature, an increase of 11.8 % ∘C−1 of Td warming for a total rise of 2 ∘C, leads to a 1.1182=1.25 or 25 % of increase in the intensities).
Figure 4a shows the historic event as simulated by a representative ensemble member in HARMONIE at 09:00 LT. The relevant future event for the same member as simulated by the HARMONIE model is shown in Fig. 4b, as resulted by the Pi–Td method in Fig. 4c and by the linear delta transformation in Fig. 4d. It is shown that the maximum Pi is clearly increased in all three methods.
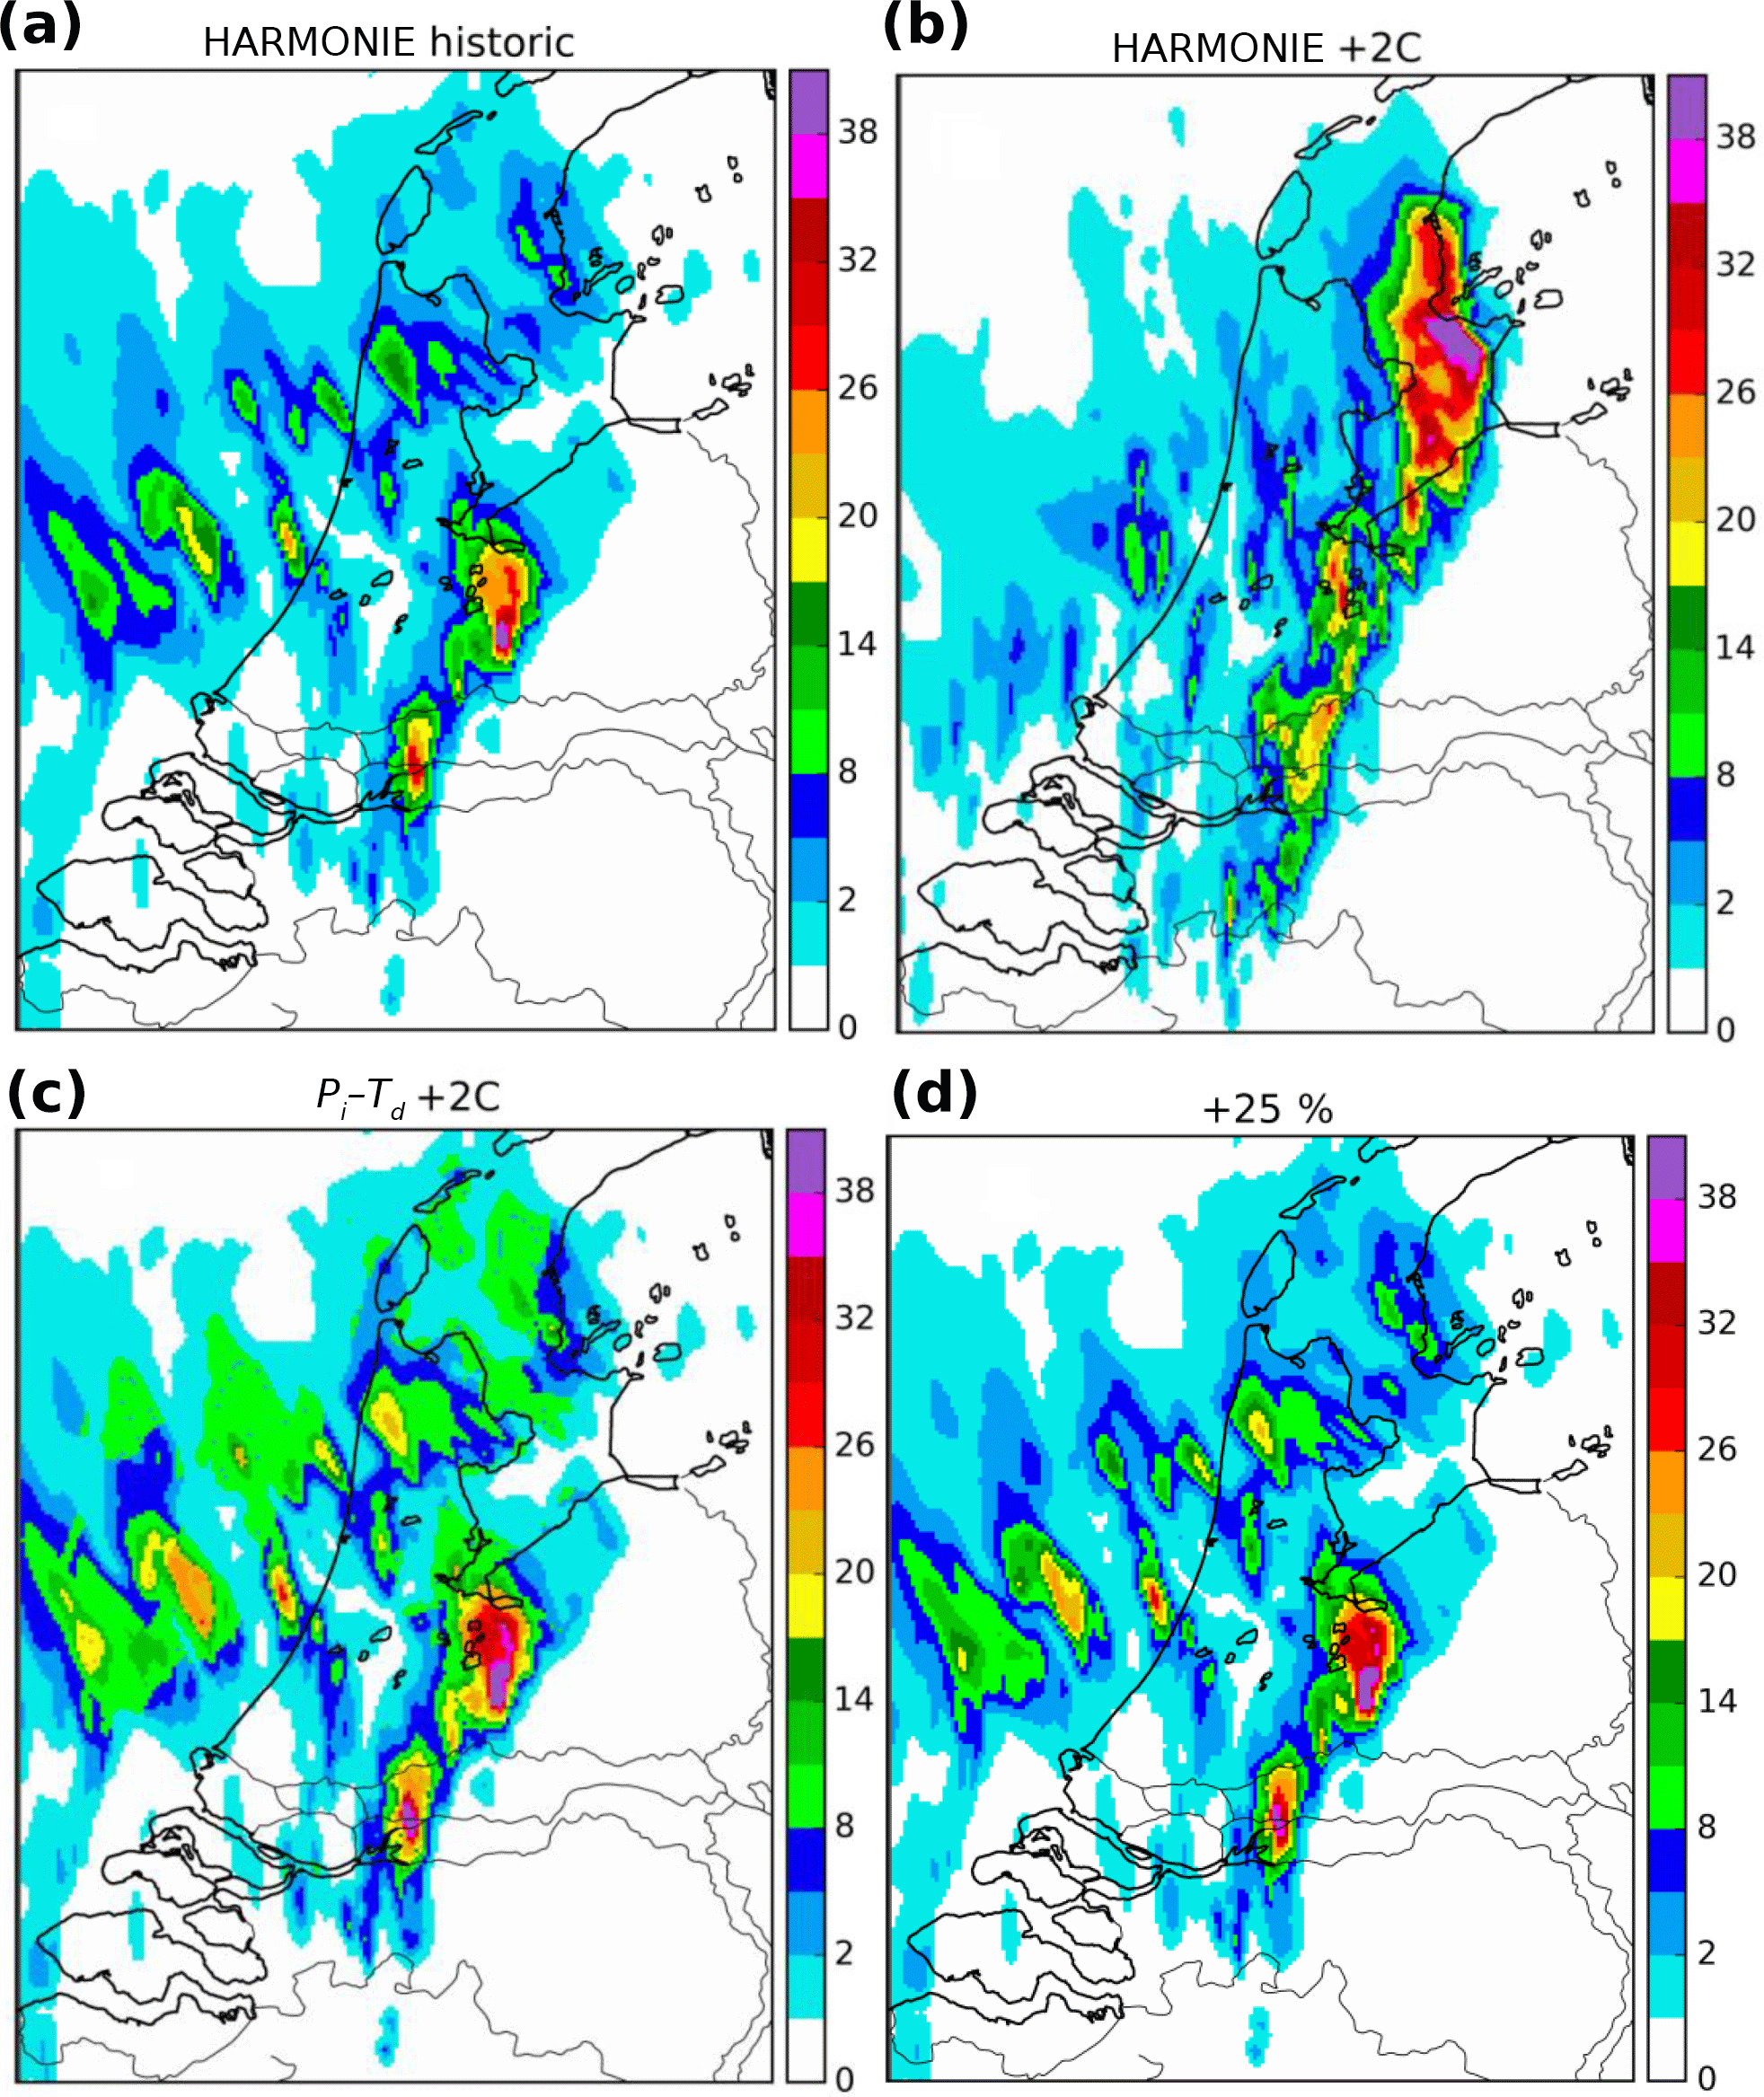
Figure 4Hourly precipitation intensities at 09:00 LT (mm h−1). (a) HARMONIE simulation under historic initial and boundary conditions and (b) simulated under future conditions. (c) Application of the Pi–Td method and in (d) the uniform scaling of +11.8 % ∘C−1.
As the Pi–Td and linear delta methods only modify precipitable areas, the future spatial pattern remains unchanged compared to the historic simulated event. Conversely, the simulated future event differs in both intensity and precipitable pattern. The main body of the precipitable area is shifted towards the northeast in this member, mainly due to changes in horizontal winds. The variability between the different members primarily results from alterations in the horizontal winds and the convection, due to changes in the surface temperatures, which may shift or change the structure of the clouds. As the event evolves in time, the dynamic heat fluxes and the rapid drying of the soil induce temperature deviations that reach ±4 ∘C locally, thereby influencing the convection and the horizontal winds.
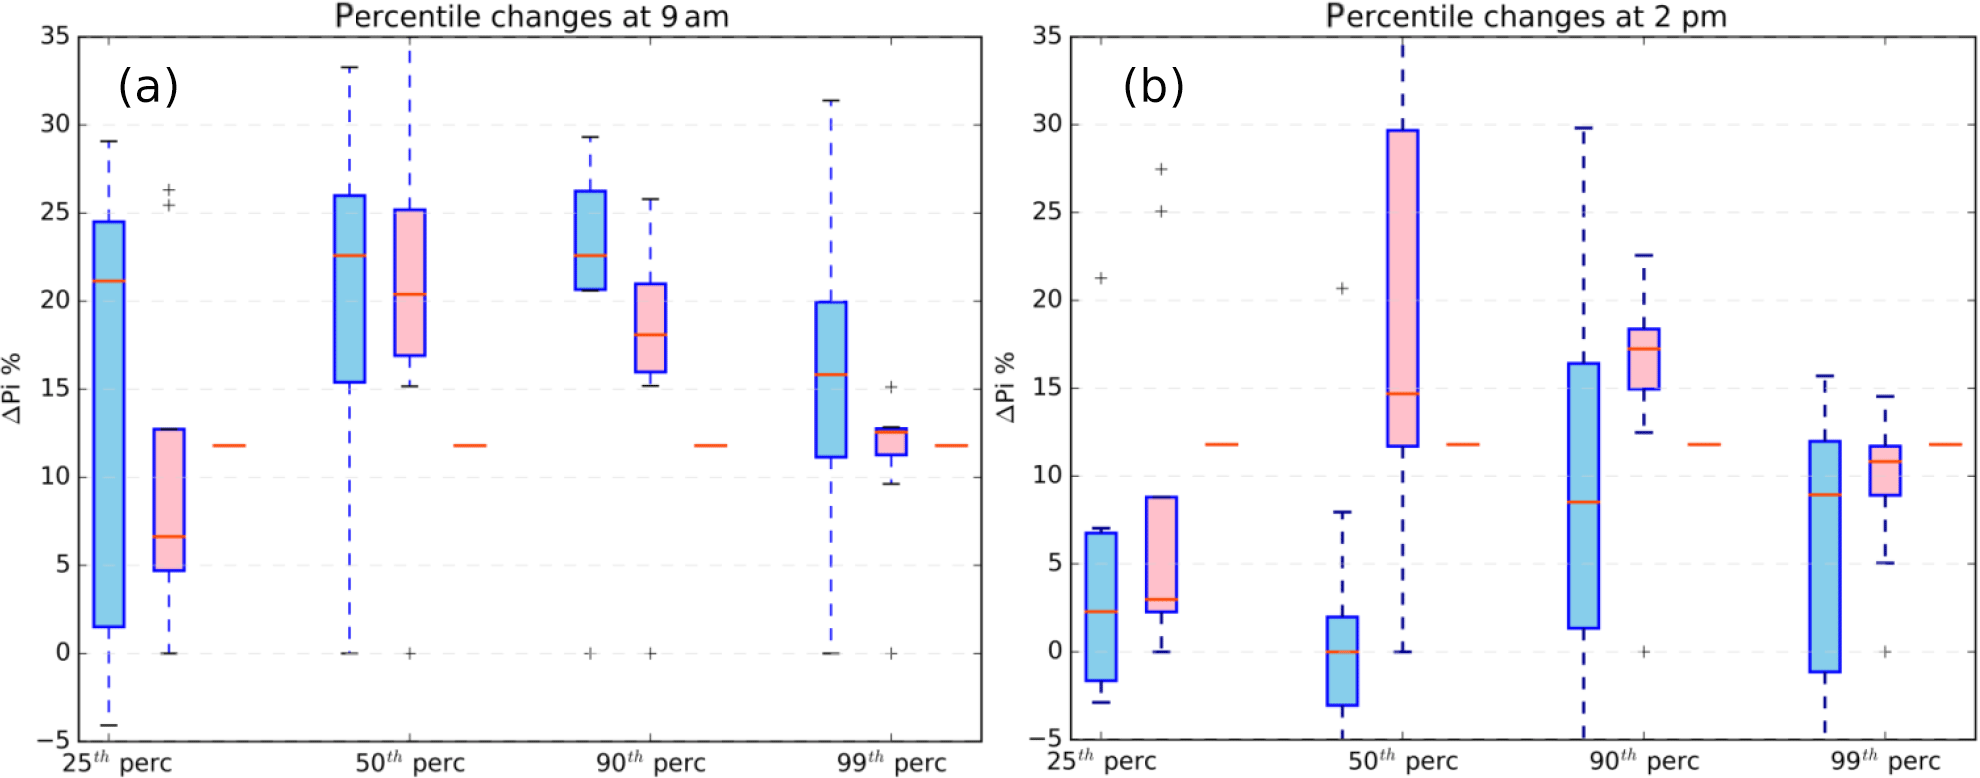
Figure 5The change in the hourly precipitation per degree of warming compared to the simulated historic ensemble for the different percentiles and for the three methods over all precipitable points at 09:00 LT (a) and 14:00 LT (b). The blue box plots represent the ensemble of the future model run and the pink box plots represent the outcome of the Pi–Td method, starting from the ensemble of the historic simulation. Each ensemble contains seven runs. The single red lines indicate the relevant linear transformation of + 11.8 % ∘C−1.
One interesting outcome in the simulated future weather method is that, despite the temperature increase and the moisture supply, the overall size of the future precipitable domain in all members remains relatively similar to the historic event. A possible explanation could be that, due to the stronger updrafts (caused by extensive warming, and resulting in increased convection and Pi), stronger downdrafts might be imposed at the outskirts of the clouds, thereby preventing them from expanding further. This may also explain the low or negative scaling that is observable in the low percentiles: as the Pi increases faster within the same domain and reaches higher maxima in the future event, there are smaller chances of finding light precipitation.
The box plots of Fig. 5 depict the intensity increase in the three methods compared to the simulated historic event for all seven members and for various precipitation percentiles at 09:00 LT and supplementary at 14:00 LT, when the event evolves towards its decaying phase. In the Pi–Td method, following the observed scaling of Fig. 3, the lower percentiles (25th) increase with a rate of ΔPi around the CC rate (7 % ∘C−1). The medium percentiles (50th) increase between 2 times CC and over 3 times CC, and the high percentiles increase from 2 times CC up to 3 times CC. The rate of increase decreases slightly for the very high percentiles, reaching a maximum rate of 2 times CC. There are no considerable differences between the intensity increase at 09:00 LT and 14:00 LT, while some variance is observable between the different members, due to slightly different initial conditions of Pi and Td across the ensemble. In the linear delta method the increase is a constant 11.8 % ∘C−1 with no variance between the members. The overall duration of the event in both Pi–Td and linear delta methods remains unchanged compared to the historic event.
On the other hand, the simulated future weather method in HARMONIE in Fig. 5 shows deviations in the response of the model in the morning and in the afternoon. The main Pi increase takes place during the first hours of the event, while the rate of increase later reduces, possibly due to the reduced moisture supply that results from the extensive precedent rain. In more detail, the very high percentiles in the morning increase at a rate that lies between 2 times CC and 3 times CC, the high percentiles even exceed 3 times CC and the medium percentiles cover the range of both the high and the very high percentiles. The ΔPi for the lower percentiles varies considerably between the different ensemble members, ranging from a negative ΔPi to a 3 times CC rate. In the afternoon, the overall rate of increase is substantially decreased, with an average intensity increase of CC or lower, while some negative values appear in all percentiles.
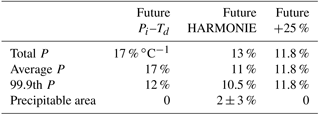
Overall, the total increase in the precipitable water for the entire event duration for a 2 ∘C of warming in the Pi–Td method is 36 %, which is about 17 % ∘C−1, the total increase in the future weather method is 27 % (or 13 % ∘C−1) and the total increase in the linear delta transformation is 25 % (or 11.8 % ∘C−1).
All three methods analyzed in this study show an overall increase in the precipitation, together with temperature. Some discrepancies occur in the changes of intensities, duration, and the percentile distribution of the future precipitation, as well as in the spatial patterns, the position, and the number and size of the precipitable cells. A summary of the main results is found in Table 1.
The fitted lognormal distributions for the frequency of occurrence of the different precipitation intensities (Fig. 6) show strong similarities between the three methods and a clear distinction between present and future. The entire spectrum of the future events is shifted towards higher intensities. The chances of moderate precipitation are reduced and there is a distinct increase in the frequency of occurrence for Pi > 15 mm h−1. For example, the probability of the occurrence of intensities higher than 20 mm h−1 is increased by over 35 %. A Kolmogorov–Smirnov test was performed to compare the goodness of fit for various distributions (the beta, gamma, Pareto, and lognormal) to conclude that the best fitting distribution for the current data is the lognormal.
Unlike in the Pi–Td and the linear method, the future model simulations show a non-uniform change in Pi with time and space. In the model, the most intense precipitation increase takes place during the first hours, while the rate of increase later drops, possibly due to a drying of the atmosphere resulting from the exceedance of the water that precipitates in the early hours. HARMONIE tends to simulate stronger increases in the very high and low precipitation intensities in the first hours of the event, while the Pi–Td method follows a structured and more constant increase that depends only on the Pi and Td of the historic event at every hour (Fig. 5). The total amount of precipitable water that falls in the future Pi–Td event is slightly larger than in the HARMONIE future event, due to the model's reduction of the Pi increase in the late hours of the event. The linear method, on the other hand, results in an overall underestimation of the total precipitable amount of water, as it underestimates the Pi increase for the moderate and high percentiles. The duration of the event in the model does not change in the future simulation, in agreement with Chan et al. (2016), in which future simulations with a convective-permitting model were made to show a clear intensification of sub-hourly rainfall, but no change in rainfall duration.
An intrinsic discrepancy between the model and the delta methods is the ability to shift or build new convective cells, due to the advection of moisture as a result of changes in wind and temperature patterns, which lead to changes in the precipitable spatial patterns. Nevertheless, in the model, the total precipitable coverage remains practically unchanged with temperature change, as is also assumed in the two statistical methods. This case study finding might contradict the recent observational study of Lochbihler et al. (2017), where Dutch radar precipitation data were used to conclude that on average the precipitable cells increase with increasing temperature and precipitation intensity, especially at higher dew point temperatures. On the other hand, Wasko et al. (2016) found evidence that precipitation intensity in Australia increases with temperature, while the storm's spatial extent decreases, as a redistribution of moisture towards the center takes place at the cost of the outer region of the precipitable area. The model study of Guinard et al. (2015) supports that the changes in precipitable structures with temperature are sensitive to the climatic region and the season.
Table 1Summary of the findings from all ensemble members and at all hours of the event. The numbers show the percentages of change in comparison to the historic ensemble for the three methods and the total precipitation that fell, as well as for the changes in the average intensity, the very extreme percentiles and the precipitable surface area. The noted percentages are per degree of warming, assuming a linear increase.
It is of interest to investigate whether the different characteristics over sea and land (specifically the more unified temperatures over sea, the possibility of additional moisture provision, and the differences in wind characteristics) could induce deviations in the behavior of the future event's individual development over sea and over land. However, this experimental setting does not allow for such an analysis, as the spatial domain is rather limited. Changes in the horizontal winds may therefore shift the clouds from over land to over sea or vice versa, thereby obfuscating the analysis.
Overall, the Pi–Td method appears to render reliable results when qualitatively compared to the model and linear-transformation methods, while it is also faster, less expensive, and less complicated. The Pi–Td relation has to be derived explicitly for different locations and different seasons, and is recommended to be used only within the range of well-documented dew-point temperatures for a specific area (e.g., Td > 7 ∘C and Td < 21 ∘C for the Netherlands in the summer).
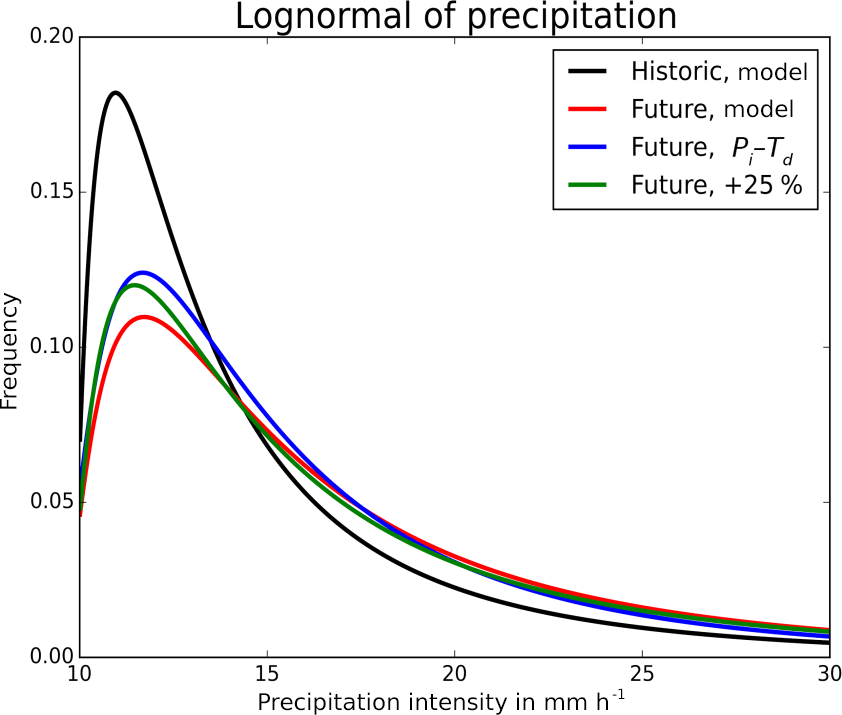
Figure 6The fitted lognormal distribution of precipitation intensities for the present and future events, for all members and methods at 09:00 LT.
New methods are emerging to project future extreme precipitation as it develops under climate change, grounded in existing events. For water managers, such future weather approaches have the advantage that they take a known extreme event as the basis and simulate its characteristics in a future warmer climate. However, such an approach requires high-resolution modeling and can be computationally demanding. In this paper, we compare two novel methods for a historic event in the Netherlands and one existing scenario method for projecting future extreme precipitation events starting from historic events, which can be used for climate research and impact studies.
The first method is a non-linear Pi–Td relation and is used here as a delta transformation in order to project how a historic extreme precipitation event would intensify under future warmer conditions. We show that the hourly summer precipitation from radar observations with the dew-point temperature (the Pi–Td relation) for moderate to warm days can increase by up to 21 % ∘C−1 of warming: a relation that is 3 times higher than the theoretical CC relation. The rate of change depends on the initial precipitation intensity, whereby low percentiles increase at a rate below CC, the medium and the very high percentiles (99.9th) at 2 times CC, and the moderately high and high percentiles at 3 times CC (90th). In the second method, the future extreme event is simulated in the HARMONIE model, alternating the historic initial conditions to represent a warmer atmosphere. Finally, the third method applies a linear delta transformation over the simulated historic event. The linear delta arises from the KNMI'14 scenarios, according to which all precipitation percentiles experience an increase of 11.8 % ∘C−1 in their intensities.
The comparison between the three future weather methods shows a comparable increase in the precipitation intensities, which range from below CC to a 3 times CC rate of change per degree of warming, depending on the initial percentiles. Some divergence is found in the distribution of the intensity changes, the time evolution of the event, and the position of the precipitable cells, due to the intrinsic discrepancies between the methods.
While the Pi–Td method focuses primarily on the contribution of the thermodynamics and statistics in order to conclude the behavior of the precipitation with temperature, the future weather method in HARMONIE explores both the atmospheric dynamics and the thermodynamics, as well as on their interactions. Each run can evolve differently with time, while resolving the complicated atmospheric dynamics may increase the noise in the outcome.
A noteworthy discrepancy is that, in the HARMONIE model, the intensity changes are not uniform with time, as the main Pi increase takes place during the first hours of the event, while the rate of increase later reduces, possibly due to an exhaustion of atmospheric moisture resulting from the extensive precedent rain. Overall, the total increase in the precipitable amount of water increased by about 13 % ∘C−1 in the model method, 17 % ∘C−1 in the Pi–Td method, and 11.8 % ∘C−1 in the linear method. Due to small wind and convection changes in the model, the clouds' position and patterns are displaced. Nevertheless, in the model, total-spatial precipitable coverage remains practically unchanged with temperature change, as is also assumed in the statistical methods.
The Pi–Td method also has limitations, as it focuses on the precipitation-intensity changes, while it does not answer questions on spatial distribution and time evolution. Different precipitation types may also show different behavior with the temperature increase. For example, observations in Molnar et al. (2015) have shown that the intensity increase with temperature in convective events is higher than that of the synoptic storms. It should also be stated that none of the three methods include information on changes in the return period of events, or changes in the synoptic state of the atmosphere. For example, it is suggested that in the future rate of precipitation, intensities with temperature may decline over the UK, due to the more frequent occurrence of anticyclonic systems (Chan et al., 2016), indicating that there is a possibility for some change in the future Pi–Td scaling, depending on the region.
The Pi–Td method projects precipitation events at different temperatures and is simple to use, requires little time, and is computationally and resource efficient, while it continues to offer rather robust results compared to a relevant non-hydrostatic model simulation. In all cases, the variance in the results with the Pi–Td method is smaller than with the model method, allowing for a more straightforward and deterministic analysis if the outcome is to be used for impact studies. This method is suggested for use within well-documented temperature ranges deriving from observations in order to avoid statistical artifacts in the Pi–Td scaling. Therefore it is not recommended to be used for very high (or very low) temperatures.
The outcome of the Pi–Td future event can be used in several applications, such as impact and risk analyses to assess the economic and environmental damages of a future extreme event over an urban (or rural, industrial) areas, supporting policy makers to evaluate adequate adaptation measures against future disasters. It can also be used in several regional hydrological or larger spatial-scale climatological studies.
The Dutch radar data used for this study are available at https://climate4impact.eu/impactportal/data/catalogbrowser.jsp?catalog=http://opendap.knmi.nl/knmi/thredds/catalog/radarprecipclim/RAD_NL25_RAC_MFBS_01H_NC/catalog.xml? (last access: 1 July 2018) The KNMI hourly weather station data are available at https://www.knmi.nl/nederland-nu/klimatologie/uurgegevens (last access: 1 July 2018). The HARMONIE-AROME source code is available at http://hirlam.org/ (last access: 1 July 2018). The scripts used are available by the authors upon request.
The authors declare that they have no conflict of interest.
This research has been funded by Amsterdam Water Science, the Amsterdam Academic Alliance
(AAA), and the
NWO Vici grant 453-13-006. We would like to thank KNMI for their support to
offer access to the HARMONIE model.
Edited by: Carlo De Michele
Reviewed by: two anonymous referees
Aerts, C. J. H. J., Botzen, W. J. W., Emanuel, K., Lin, N., de Moel, H., and Michel-Kerjan, E. O.: Evaluating flood resilience strategies for coastal megacities, Science, 344, 473–475, 2014.
Andreasson, J., Bergstrom, S., Carlsson, B., Graham, L. P., and Lindstrom, G.: Hydrological change – climate change impact simulations for Sweden, AMBIO: a journal for the human environment, 33, 228–234, https://doi.org/10.1579/0044-7447-33.4.228, 2004.
Attema, J., Loriaux, J. M., and Lenderink, G.: Extreme precipitation response to climate perturbations in an atmospheric mesoscale model, Environ. Res. Lett., 9, 014003, https://doi.org/10.1088/1748-9326/9/1/014003, 2014.
Bakker, A., Bessembinder, J., de Wit, A., Van den Hurk, B. J. J. M., and Hoek, S. B.: Exploring the efficiency of bias corrections of regional climate model output for the assessment of future crop yields in Europe, Reg. Environ. Change, 14, 865–877, 2014.
Bakker, A. M. R. and Bessembinder, J. E.: Time series transformation tool: description fo the program to generate time series consistent with the KNMI'06 climate scenarios, Royal Netherlands Meteorological Institute, Technical Report TR-326, 2012.
Bao, J., Sherwood, S. C., Alexander, L. V., and Evans, J. P.: Future increases in extreme precipitation exceed observed scaling rates, Nat. Clim. Change, 7, 128–132, https://doi.org/10.1038/nclimate3201, 2017.
Berg, P., Moseley, C. and Haerter, J. O.: Strong increase in convective precipitation in response to higher temperatures, Nat. Geosci., 6, 181–185, 2013.
Bürger, G., Heistermann, M., and Bronstert, A.: Towards Subdaily Rainfall Disaggregation via Clausius–Clapeyron, J. Hydrometeorol., 15, 1303–1311, 2014.
Chan, S. C., Kendon, E. J., Roberts, N. M., Fowler, H. J., and Blenkinsop, S.: Downturn in scaling of UK extreme rainfall with temperature for future hottest days, Nat. Geosci., 9, 24–28, 2016.
Fowler, H. J., Blenkinsop, S., and Tebaldi, C.: Linking climate change modelling to impacts studies: recent advances in downscaling techniques for hydrological modelling, Int. J. Climatol., 27, 1547–1578, https://doi.org/10.1002/joc.1556, 2007.
Guinard, K., Mailhot, A., and Caya, D.: Projected changes in characteristics of precipitation spatial structures over North America, Int. J. Climatol., 35, 596–612, https://doi.org/10.1002/joc.4006, 2015.
Haerter, J. O. and Berg, P.: Unexpected rise in extreme precipitation caused by a shift in rain type?, Nat. Geosci., 2, 372–373, 2009.
Hardwick Jones, R., Westra, S., and Sharma, A.: Observed relationships between extreme sub-daily precipitation, surface temperature, and relative humidity, Geophys. Res. Lett., 37, L22805, https://doi.org/10.1029/2010GL045081, 2010.
Hay, L. E., Wilby, R. L. and Leavesley, G. H.: A comparison of delta change and downscaled GCM scenarios for three mountainous basins in the United States, J. Am. Water Resour. As., 36, 387–397, 2000.
Hazeleger, W., Van den Hurk, B. J. J. M., Min, E., Van Oldenborgh, G. J., Petersen, A. C., Stainforth, D. A., Vasileiadou, E., and Smith, L. A.: Tales of future weather, Nat. Clim. Change, 5, 107–113, 2015.
Ivancic, T. J. and Shaw, S. B.: Examining why trends in very heavy precipitation should not be mistaken for trends in very high river discharge, Clim. Change, 133, 681–693, https://doi.org/10.1007/s10584-015-1476-1, 2015.
Knapp, A. K., Beier, C., Briske, D. D., Classen, A. T., Luo, Y., Reichstein, M., Smith, M. D., Smith, S. D., Bell, J. E., Fay, P. A., and Heisler, J. L.: Consequences of more extreme precipitation regimes for terrestrial ecosystems, Bioscience, 58, 811–821, 2008.
Koks, E. E., Bočkarjova, M., Moel, H., and Aerts,, J. C. J. H.: Integrated direct and indirect flood risk modeling: development and sensitivity analysis, Risk Anal., 35, 882–900, 2015.
Koutroulis, A. G., Grillakis, M. G., Tsanis I. K., and Jacob, D.: Exploring the ability of current climate information to facilitate local climate services for the water sector, Earth Perspec., 2, 1–19, 2015.
Lenderink, G. and Van Meijgaard, E.: Increase in hourly precipitation extremes beyond expectations from temperature changes, Nat. Geosci., 1, 511–514, 2008.
Lenderink, G. and Attema, J.: A simple scaling approach to produce climate scenarios of local precipitation extremes for the Netherlands, Environ. Res. Lett., 10, 085001, https://doi.org/10.1088/1748-9326/10/8/085001, 2015.
Lenderink, G., Buishand, A., and van Deursen, W.: Estimates of future discharges of the river Rhine using two scenario methodologies: direct versus delta approach, Hydrol. Earth Syst. Sci., 11, 1145–1159, https://doi.org/10.5194/hess-11-1145-2007, 2007.
Lenderink, G., Mok, H. Y., Lee, T. C., and van Oldenborgh, G. J.: Scaling and trends of hourly precipitation extremes in two different climate zones – Hong Kong and the Netherlands, Hydrol. Earth Syst. Sci., 15, 3033–3041, https://doi.org/10.5194/hess-15-3033-2011, 2011.
Leutbecher, M. and Palmer, T. N.: Ensemble forecasting, J. Comput. Phys., 227, 3515–3539, 2008.
Lochbihler, K., Lenderink, G., and Siebesma, A. P.: The spatial extent of rainfall events and its relation to precipitation scaling, Geophys. Res. Lett., 44, 8629–8636, https://doi.org/10.1002/2017GL074857, 2017.
Loriaux, J. M., Lenderink, G., De Roode S. R., and Siebesma, A. P.: Understanding convective extreme precipitation scaling using observations and an entraining plume model, J. Atmos. Sci., 70, 3641–3655, 2013.
Maraun, D., Wetterhall, F., Ireson, A. M., Chandler, R. E., Kendon, E. J., Widmann, M., Brienen, S., Rust, H. W., Sauter, T., Themeßl, M., and Venema, V. K. C.: Precipitation downscaling under climate change: Recent developments to bridge the gap between dynamical models and the end user, Rev. Geophys., 48, RG3003, https://doi.org/10.1029/2009RG000314, 2010.
Michaelis, A. C., Willison, J., Lackmann, G. M., and Robinson, W. A.: Changes in winter North Atlantic extratropical cyclones in high-resolution regional pseudo-global warming simulations, J. Climate, 30, 6905–6925, 2017.
Mishra, V., Wallace, J. M., and Lettenmaier, D. P.: Relationship between hourly extreme precipitation and local air temperature in the United States, Geophys. Res. Lett., 39, L16403, https://doi.org/10.1029/2012GL052790, 2012.
Molnar, P., Fatichi, S., Gaál, L., Szolgay, J., and Burlando, P.: Storm type effects on super Clausius-Clapeyron scaling of intense rainstorm properties with air temperature, Hydrol. Earth Syst. Sci., 19, 1753–1766, https://doi.org/10.5194/hess-19-1753-2015, 2015.
Molteni, F., Buizza, R., Palmer, T. N., and Petroliagis, T.: The ECMWF Ensemble Prediction System: methodology and validation, Q. J. Roy. Meteor. Soc., 122, 73–119, 1996.
Overeem A., Leijnse, H., and Uijlenhoet, R.: Measuring urban rainfall using microwave links from commercial cellular communication networks, Water Resour. Res., 47, W12505, https://doi.org/10.1029/2010WR010350, 2011.
Pachauri, R. K., Allen, M. R., Barros, V. R., Broome, J., Cramer, W., Christ, R., Church, J. A., Clarke, L., Dahe, Q., Dasgupta, P., and Dubash, N. K.: Climate Change 2014: Synthesis Report, Contribution of Working Groups I, II and III to the Fifth Assessment Report of the Intergovernmental Panel on Climate Change, p. 151, 2014.
Panthou, G., Mailhot, A., Laurence, E., and Talbot, G.: Relationship between surface temperature and extreme rainfalls: A multi-time-scale and event-based analysis, J. Hydrometeorol., 15, 1999–2011, 2014.
Räty, O., Räisänen, J., and Ylhäisi, J. S.: Evaluation of delta change and bias correction methods for future daily precipitation: intermodel cross-validation using ENSEMBLES simulations, Clim. Dynam., 42, 2287–2303, 2014.
Schär, C., Frei, C., Lüthi, D., and Davies, H. C.: Surrogate climate-change scenarios for regional climate models, Geophys. Res. Lett., 23, 669–672, 1996.
Seity, Y., Brousseau, P., Malardel, S., Hello, G., Bénard, P., Bouttier, F., Lac, C., and Masson, V.: The AROME-France convective-scale operational model, Mon. Weather Rev., 139, 976–991, 2011.
Singleton A. and Toumi, R.: Super-Clausius–Clapeyron scaling of rainfall in a model squall line, Q. J. Roy. Meteor. Soc., 139, 334–339, 2013.
Stocker, T. F., Qin, D., Plattner, G. K., Tignor, M., Allen, S. K., Boschung, J., Nauels, A., Xia, Y., Bex, B., and Midgley, B. M.: IPCC, 2013: climate change 2013: the physical science basis. Contribution of working group I to the fifth assessment report of the intergovernmental panel on climate change, Cambridge University Press, 2014.
Sugiyama, M., Shiogama, H., and Emori, S.: Precipitation extreme changes exceeding moisture content increases in MIROC and IPCC climate models, P. Natl. Acad. Sci., 107, 571–575, 2010.
Te Linde, A. H., Aerts, J. C. J. H., Bakker, A. M. R., and Kwadijk, J. C. J.: Simulating low probability peak discharges for the Rhine basin using resampled climate modeling data, Water Resour. Res., 46, W03512, https://doi.org/10.1029/2009WR007707, 2010.
Teutschbein, C. and Seibert, J.: Bias correction of regional climate model simulations for hydrological climate-change impact studies: Review and evaluation of different methods, J. Hydrol., 456, 12–29, 2012.
Trapp, R. J. and Hoogewind, K. A.: The realization of extreme tornadic storm events under future anthropogenic climate change, J. Climate, 29, 5251–5265, 2016.
Trenberth, K. E., Dai, A., Rasmussen, R. M., and Parsons, D. B.: The changing character of precipitation, B. Am. Meteorol. Soc., 84, 1205–1217, 2003.
Utsumi, N., Seto, S., Kanae, S., Maeda, E. E., and Oki, T.: Does higher surface temperature intensify extreme precipitation?, Geophys. Res. Lett., 38, L16708, https://doi.org/10.1029/2011GL048426, 2011.
Van den Hurk, B., Siegmund, P., and Tank, A. K. (Eds.): KNMI'14: Climate Change Scenarios for the 21st Century-a Netherlands Perspective, Royal Netherlands Meteorological Institute (KNMI), 2014.
Van Oldenborgh, G. J. and Lenderink, G.: Een eerste blik op de buien van maandag 28 juli 2014, Meteorologica, 3, 28–29, 2014.
van Pelt, S. C., Beersma, J. J., Buishand, T. A., van den Hurk, B. J. J. M., and Kabat, P.: Future changes in extreme precipitation in the Rhine basin based on global and regional climate model simulations, Hydrol. Earth Syst. Sci., 16, 4517–4530, https://doi.org/10.5194/hess-16-4517-2012, 2012.
Ward, P. J., van Pelt, S. C., de Keizer, O., Aerts, J. C. J. H., Beersma, J. J., Van den Hurk, B. J. J. M., and Linde, A. H.: Including climate change projections in probabilistic flood risk assessment, J. Flood Risk Manage., 7, 141–151, 2014.
Ward, P. J., Jongman, B., Weiland, F. S., Bouwman, A., van Beek, R., Bierkens, M. F. P., Ligtvoet, W., and Winsemius, H. C.: Assessing flood risk at the global scale: model setup, results, and sensitivity, Environ. Res. Lett., 8, 044019, https://doi.org/10.1088/1748-9326/8/4/044019, 2013.
Wasko, C., Sharma, A., and Johnson, F.: Does storm duration modulate the extreme precipitation-temperature scaling relationship?, Geophys. Res. Lett., 42, 8783–8790, 2015.
Wasko, C., Sharma, A., and Westra, S.: Reduced spatial extent of extreme storms at higher temperatures, Geophys. Res. Lett., 43, 4026–4032, 2016.
Wasko, C. and Sharma, A.: Global assessment of flood and storm extremes with increased temperatures, Sci. Rep., 7, 7945, https://doi.org/10.1038/s41598-017-08481-1, 2017.
future weatherscenario.