the Creative Commons Attribution 4.0 License.
the Creative Commons Attribution 4.0 License.
High-resolution ensemble projections and uncertainty assessment of regional climate change over China in CORDEX East Asia
Huanghe Gu
Chuanguo Yang
Qin Ju
Tao Yang
Dawei Zhang
An ensemble simulation of five regional climate models (RCMs) from the coordinated regional downscaling experiment in East Asia is evaluated and used to project future regional climate change in China. The influences of model uncertainty and internal variability on projections are also identified. The RCMs simulate the historical (1980–2005) climate and future (2006–2049) climate projections under the Representative Concentration Pathway (RCP) RCP4.5 scenario. The simulations for five subregions in China, including northeastern China, northern China, southern China, northwestern China, and the Tibetan Plateau, are highlighted in this study. Results show that (1) RCMs can capture the climatology, annual cycle, and interannual variability of temperature and precipitation and that a multi-model ensemble (MME) outperforms that of an individual RCM. The added values for RCMs are confirmed by comparing the performance of RCMs and global climate models (GCMs) in reproducing annual and seasonal mean precipitation and temperature during the historical period. (2) For future (2030–2049) climate, the MME indicates consistent warming trends at around 1 ∘C in the entire domain and projects pronounced warming in northern and western China. The annual precipitation is likely to increase in most of the simulation region, except for the Tibetan Plateau. (3) Generally, the future projected change in annual and seasonal mean temperature by RCMs is nearly consistent with the results from the driving GCM. However, changes in annual and seasonal mean precipitation exhibit significant inter-RCM differences and possess a larger magnitude and variability than the driving GCM. Even opposite signals for projected changes in average precipitation between the MME and the driving GCM are shown over southern China, northeastern China, and the Tibetan Plateau. (4) The uncertainty in projected mean temperature mainly arises from the internal variability over northern and southern China and the model uncertainty over the other three subregions. For the projected mean precipitation, the dominant uncertainty source is the internal variability over most regions, except for the Tibetan Plateau, where the model uncertainty reaches up to 60 %. Moreover, the model uncertainty increases with prediction lead time across all subregions.
- Article
(9761 KB) - Full-text XML
- BibTeX
- EndNote
Globally averaged surface temperature increased by 0.65–1.06 ∘C from 1880 to 2012 according to several independently produced datasets, and further increases ranging from 0.3 to 4.8 ∘C are projected for 2081–2100 relative to 1986–2005 using a set of global climate models (GCMs) driven by the Representative Concentration Pathway (RCP) scenarios RCP2.6 to RCP8.5 (IPCC, 2013). Meanwhile, other climate factors, such as precipitation amounts and variability, snow and ice cover patterns, and mean sea level, are also changing (Alfieri et al., 2015; Kerr, 2008; Patz et al., 2005). Reliable projection of regional future climate is critical in evaluating climate change impacts and vulnerability and in developing appropriate mitigation and adaptation measures, especially for developing countries, such as China, which tends to be one of the countries most vulnerable to the adverse effects of climate change (Kreft et al., 2016; Wang et al., 2017b).
The East Asian summer monsoon (EASM) is the most distinctive climate feature in China, and the monsoon area accounts for approximately 60 % of the mainland (Ding and Chan, 2005). EASM system-related precipitation starts around mid-May or even earlier in the Indo-China peninsula, which presents distinct stepwise northward and northeastward advances, with two abrupt northward jumps and three stationary periods, and it begins to withdraw southward in September (Ding, 2004; Hsu, 2005). The rainy seasons of EASM, including the pre-summer rainy season over southern China, mei-yu (in China), normally occurs during the stationary periods, which are imbedded in the northward advance of the summer monsoon. The anomaly of EASM could cause floods and droughts, which are crucial to the livelihoods of more than one billion people (Gu et al., 2015a; Webster et al., 1998; Yu et al., 2018). However, the manner in which climatological rainfall and interannual variation of EASM can be reliably reproduced remains a challenge because of the complex topography and model limitations. The Coupled Model Intercomparison Project Phase 3 (CMIP3) and CMIP5 have problems simulating precipitation in this region. Recent studies have suggested that the new generation of GCMs from the CMIP5 archive exhibits several improvements in reproducing the climatology and interannual variability of the EASM compared with the CMIP3 GCMs, although the simulated biases remained and large inter-model spread existed (Chen and Bordoni, 2014; Gu et al., 2015b; Huang et al., 2013; Yang et al., 2017). For example, the mei-yu rainfall band is missing in GCMs, even though the monsoon circulation is reproduced well.
Considering these deficiencies, high-resolution GCMs have been developed to improve the capabilities in the simulation of monsoon features, including orographic precipitation, low-level jet orientation, and variability, as well as the mei-yu onset and withdrawal (Kitoh et al., 2013; Kusunoki et al., 2006). However, these experiments remain burdensome due to the large computational cost required for multi-decadal simulations. Therefore, the regional climate models (RCMs) focusing on a region of interest are commonly used in regional studies of climate projection and climate change impacts (Gao et al., 2006; Giorgi and Mearns, 1999; Gu et al., 2012; Wang et al., 2004; Yira et al., 2017; Yu et al., 2006). The resolution of RCMs is approximately 12–50 km, and they could consider local-scale forcing, e.g., complex terrain features and land cover heterogeneities, in a physically based method. However, RCMs inherit the biases from systematic model errors because of the imperfect conceptualization, discretization, and spatial averaging within grid cells (Dong et al., 2018). Nonetheless, RCM ensembles can be used to understand and characterize uncertainties from different sources, such as future climate scenarios, the driving GCM, and regional model physics, and therefore, reduce the uncertainties and increase credibility in future projections. The ongoing Coordinated Regional Downscaling Experiment (CORDEX) aims to provide high-resolution future regional climate projections for the majority of populated land regions globally by using multi-RCMs and to present an interface for applicants of climate simulations in climate change impact, adaptation, and mitigation studies (Giorgi et al., 2009; Jones et al., 2011). The CORDEX in East Asia (CORDEX-EA) is the East Asian branch of the CORDEX experiment, and it provides ensemble regional climate simulations (http://cordex-ea.climate.go.kr/cordex/download.do, last access: 18 May 2018). A series of studies based on RCMs within CORDEX-EA has been conducted to project extreme and mean precipitation and temperature in East Asia (Jin et al., 2016; Lee et al., 2014; Niu et al., 2015; Park et al., 2016; Tang et al., 2016; Um et al., 2017), but little attention has been paid to quantify the contributions of the uncertainty in future climate projection over China.
Despite large improvements in the simulation of local processes, future climate projections are still accompanied by large uncertainties stemming from different sources, including the forcing GCMs, emission scenarios, downscaling methods (RCMs or statistical downscaling methods), and natural climate internal variability (Déqué et al., 2007; Deser et al., 2012). Numerous studies have demonstrated that GCMs are the main source of uncertainty (Seo et al., 2016). Other uncertainty sources, such as RCMs and internal variability, will become more important than GCMs after exclusion of the outliers from the GCM ensemble (Kay et al., 2009; Wilby and Harris, 2006). In a nonstationary climate, the internal variability of a given GCM–RCM chain can remain high above the trend related to a given emission scenarios forcing (Lafaysse et al., 2014; O'Brien et al., 2011). Little attention has been devoted to quantify the contributions of the uncertainty arising from RCMs and internal variability in future climate projection over China. The objective evaluation of the capability of RCMs and quantification of the uncertainty in future climate projections are necessary.
In this study, we evaluate the performance of five RCMs within CORDEX-EA to reproduce present-day climate and analyze the projected future climate change under the middle emission scenario. More importantly, biases in current climate simulations and uncertainties in future climate projections attributed to RCMs and internal variability are further analyzed. This paper is structured as follows. Data from observations, the model simulation, and the analysis method are described in the succeeding section. Section 3 presents the historical performances of RCMs for temperature and precipitation and future climate change under the RCP4.5 emission scenario in China. The uncertainties in regional future climate projection caused by inter-RCMs and natural climate internal variability are also discussed. The summary and conclusions are presented in Sect. 4.
2.1 Observations
The reference temperature data used to evaluate the model results with observation data are developed from the Climate Research Unit Timeseries 3.23 (CRU) of the University of East Anglia, with a spatial resolution of 0.5∘, derived from gauge measurements (Harris et al., 2014). Meanwhile, the reference precipitation data, namely the Asian Precipitation-Highly Resolved Observational Data Integration Toward Evaluation (APHRODITE, hereafter APHRO) dataset, with a spatial resolution of 0.25∘, were used to evaluate RCMs (Yatagai et al., 2012). To facilitate the comparison, outputs from a host of RCMs were converted to a common grid of latitude/longitude as remapped to the CRU and APHRO observations, using bilinear interpolation. The reasons why CRU and APHRO products are used as reference in this study are clarified as below.
Some studies have focused on comparing and evaluating the spatial–temporal similarities and differences of several widely used observed gridded datasets over China (Sun et al., 2014; Wu and Gao, 2013; Yin et al., 2015). Among the widely used gridded datasets, such as the Global Precipitation Climatology Centre (CPCC) product, the University of Delaware (UDEL) product, CRU data, and the National Meteorological Information Center dataset from the China Meteorological Administration, all temperature datasets exhibit similar distribution patterns for the annual average temperature in mainland China. Considering its easier access and wider usage in the evaluation of RCMs used in China and East Asia (Wang et al., 2017), the CRU product is used as the reference temperature data in this study. APHRO's daily gridded precipitation, presently the only long-term, continental-scale, high-resolution daily product, is constructed based on the data collected at 5000–12 000 stations, which represent 2.3–4.5 times the data made available through the stations used for generating global gridded data (i.e., CRU, GPCC, and UDEL) (Yatagai et al., 2012). Thus, the APHRO dataset would give more confidence in the robustness of the results in comparison with other global precipitation datasets and is therefore widely used for evaluating the performance of RCMs in East Asia (Gao et al., 2017; Lau et al., 2017; Um et al., 2017). In addition, the CRU and APHRO products are used instead of station data accessible from the China Meteorological Administration, owing to the study area including in the domain of East Asia, extending beyond the territory of China.
Table 1RCMs used in this study∗ (Park et al., 2016).
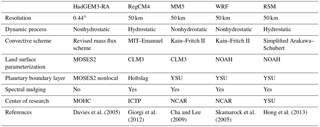
∗ MOSES: Met Office Surface Exchange Scheme, CLM: Community Land Model, NOAH: Noah Land Surface Model, YSU: Yonsei University scheme, MOHC: the Met Office Hadley Centre, ICTP: The International Centre for Theoretical Physics, NCAR: National Center for Atmospheric Research.
2.2 Models and experiments
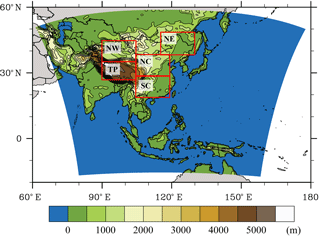
In this study, we used five RCMs, namely, HadGEM3-RA (Hadley Centre Global Environmental Model version 3 regional climate model), MM5 (Fifth-Generation Penn State/NCAR Mesoscale Model), WRF (Weather Research and Forecasting model), RegCM4 (Regional Climate Model version 4), and RSM (Regional Spectral Model), for East Asian climate experiments (Table 1). They are derived from the CORDEX East Asia experiment that is able to provide a global holistic framework for regional climate projections so as to understand their uncertainties as well as provide model evaluation. Moreover, the selected five RCMs have been demonstrated to have abilities to reproduce the regional climate over East Asia and have been used for modeling and predicting extreme climate as well as investigating physical processes of East Asia climate (Cha and Lee, 2009; Cha et al., 2011; Hong and Yhang, 2010; Park et al., 2008; Yhang and Hong, 2008). The spatial resolution of the data is 50 km (except HadGEM3-RA is 0.44∘), and the whole CORDEX-EA domain includes East Asia, India, the western Pacific Ocean, and the northern part of Australia, as shown in Fig. 1. Model configurations including physical schemes are summarized in Table 1. Please refer to the references Suh et al. (2012) and Park et al. (2016) for more details on RCMs used in this study.
In this study, two types of current climate experiments from five RCMs were performed, including the evaluation (hereafter EVAL) experiment from 1989 to 2008 and the historical (HIST) experiment from 1980 to 2005. The EVAL experiment acquires initial and boundary conditions from the National Centers for Environmental Prediction reanalysis, whereas the HIST experiment is forced by the Atmosphere–Ocean coupled Hadley Center Global Environmental Model version 2 (HadGEM2-AO) simulation. HadGEM2-AO ( horizontal resolution) has been used for climate simulations in a CMIP5 set of long-term experiments and has been demonstrated to have a reasonable ability to capture the East Asian climatology (Baek et al., 2013; The HadGEM2 Development Team, 2011; Sperber et al., 2013). The future climate simulation is driven by the HadGEM2-AO under the RCP 4.5 scenario, which is an intermediate scenario and a cost-minimizing pathway for which total radiative forcing is stabilized at 4.5 W m−2 in the year 2100 (Thomson et al., 2011). The reference period from 1980 to 1999 and the scenario period from 2030 to 2049 are analyzed for climate change research in this study.
The multi-model ensemble (MME) mean, defined as the pointwise arithmetic average over all individual model climatologies, narrows down inter-RCM uncertainties because of their differences in model structures and physics. To further evaluate the model performance on smaller spatial scales, we evaluate the performance of RCMs over five selected subregions (as shown in Fig. 1), namely, northeastern China (40–50∘ N, 115–130∘ E), northern China (30–40∘ N, 105–120∘ E), southern China (22–30∘ N, 105–120∘ E), northwestern China (35–45∘ N, 80–95∘ E), and the Tibetan Plateau (28–35∘ N, 80–95∘ E).
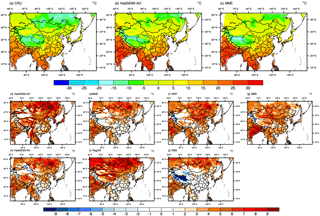
Figure 2Spatial distributions of annual average temperature (∘C) from CRU (a), the driving GCM HadGEM2-AO (b), multi-model ensemble (c), and temperature biases (∘C) of the driving GCM HadGEM2-AO (d), multi-RCM ensemble (e, f) and five RCMs (g–k) during 1980–2005.
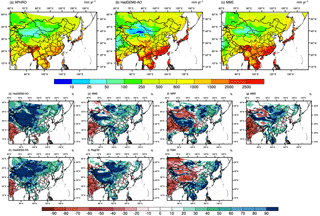
Figure 3Spatial distributions of annual average precipitation (mm/year) from APHRO (a), the driving GCM HadGEM2-AO (b), and MME (c), and precipitation biases (%) of the driving GCM HadGEM2-AO (d), MME (e), and five RCMs (f–j) during 1980–2005.
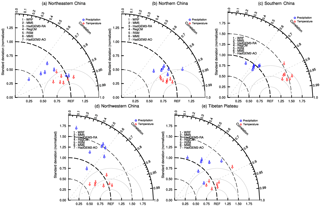
Figure 4The Taylor diagrams which evaluate the skill of the models in reproducing the annual average temperature and precipitation over the five regions of China, using the CRU (for temperature) and APHRO (for precipitation) data as the reference, are shown. The azimuthal axis shows the pattern spatial correlation. The redial distance from the origin represents the spatial variability, whereas the distance from the reference observation (REF) is the centered RMSE difference between the simulations and observations.
2.3 Analysis methods
The root-mean-square error (RMSE), bias, and Taylor diagram analysis are selected for statistical measurements of the performance for the individual RCM and the MME. The former two indexes are used for evaluating the ability of models to reproduce annual and seasonal mean of climatology. The Taylor diagram is designed to quantify the degree of correspondence between the modeled and observed behavior by plotting a 2-D graph with three statistics (correlation coefficient, SD, and RMSE). In the Taylor diagram, a small distance between the reference and compared objects indicates close agreement (Baker and Taylor, 2016; Sun et al., 2015). In general, the Taylor diagram enables statistics for different fields (with different units) to be shown in a single plot, facilitating the comparative assessment of different models (Taylor, 2001).
Uncertainty in projected climate change mainly arises from the internal variability of the climate system, the model uncertainty, and the scenario uncertainty (Niu et al., 2015; Woldemeskel et al., 2016). In this study, all RCMs are driven by the same GCM under the same scenario, and thus, the uncertainty of the climate projections is mainly caused by inter-RCM and internal variability. The method developed by Hawkins and Sutton (2009, 2011) is used to separate these two sources of uncertainty. Here we give a brief illustration.
- 1.
Firstly, a smooth fourth-order polynomial is used to fit each individual simulation over the years 1980–2049 by using an ordinary least squares method. Then the raw simulation of each model Xm,t for the model m and year t can be expressed by
where zm,t represents the simulation from the smooth fit for the model m and year t minus the reference data; the reference data are denoted by cm, and the residual (internal variability) is denoted by εm,t. Here the reference data are the mean of the simulation from the smooth fit during the years 1980–1999.
- 2.
The RCMs are weighted by their performance in simulating the current climate from the mean of 1980–1999, up to year 1999. Thus, each model is weighted according to
where zm,1999 is the model climate change in 1999 relative to 1980–1999, and zobs is an observational estimate derived from fitting a similar fourth-order polynomial to observations. The normalized quantities (Wm) of these weightings can be expressed as
- 3.
Internal variability (V, as shown in Eq. 4) is defined as the multi-model mean of the variance of the residuals from the fit for each model:
- 4.
Inter-model variability (M, as shown in Eq. 5) is estimated from the weighted variance (varw) in different RCM prediction fits (zm,t), where vart(.) and varm(.) indicate the variance across time and the model, respectively.
- 5.
It was assumed that the two sources of uncertainty can be treated independently (i.e., no interaction exists between them). Thus, the total variability VT is
- 6.
The fraction of variance of internal variability and model uncertainty are defined as V∕VT(t) and M(t)∕VT(t), respectively.
3.1 Climatology for the historical climate
3.1.1 Historical annual average climate evaluation
Figure 2 shows the annual average temperature of CRU, the driving GCM HadGEM2-AO, and the multi-model ensemble, as well as the temperature biases of five RCMs driven by HadGEM2-AO from 1980 to 2005. Obviously, both the MME and five RCMs can capture the spatial pattern of annual mean temperature in China, with a decreasing south–north gradient and a cold area in the Tibetan Plateau. Moreover, the MME presents the best results overall to reproduce the temperature spatial distribution and provides less than 1 ∘C temperature biases over most areas of China. However, all RCMs generally overestimated the mean temperature over most of the domain; in particular, warmer mean temperature is simulated by MM5 and HadGEM3-RA. The only exception is that RSM underestimated the mean temperature over the Tibetan Plateau.
The RCMs provide reasonably accurate simulations for mean temperature during the historical period, but they are less successful at reproducing precipitation. Figure 3 shows the annual average precipitation from APHRO, HadGEM2-AO, and MME, as well as the precipitation biases from five RCMs in the current period. It is found that the spatial pattern of annual mean precipitation is characterized by a decreasing southeastern–northwestern gradient over China, which can be successfully simulated by all RCMs. However, quite large precipitation biases are found in different RCMs. For instance, WRF underestimated the annual mean precipitation in northwestern China, where mean precipitation was overestimated by the other RCMs. In comparison with the simulation from each RCM, the MME is better in reproducing annual mean precipitation over most subregions in China.
The spatial variability statistics of the models in reproducing the annual mean temperature and precipitation by the Taylor plot (Taylor, 2001) are exhibited in Fig. 4. The temperature simulations of the five RCMs exhibit a good spatial pattern correlation, ranging from 0.83 to 0.96, whereas the precipitation simulation shows a relatively extensive range of spatial pattern correlations from 0.29 to 0.93. In addition, the MME is superior to most RCMs in capturing the spatial variability of these climate variables, as reflected by the higher spatial correlation coefficient and the lower RMSE. There are several reasons for this phenomenon, as also noted by other scholars in their studies on model intercomparisons (Huttunen et al., 2017; Phillips and Gleckler, 2006; Rozante et al., 2014). On the one hand, the bias of a simulated climate field is symptomatic of random errors to a certain extent, and the MME may reduce or counteract this error from the RCM. On the other hand, the pointwise variations of the climate field are smoothed out by averaging, thereby filtering regional-scale simulations, which are difficult for current climate models to capture.
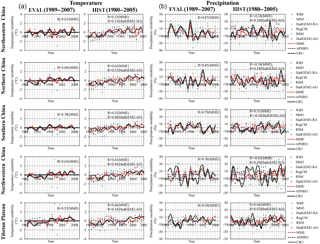
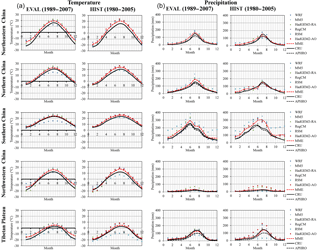
Figure 5Temporal evolution of the annual mean temperature (a) and precipitation (b) in RCM simulations and observations over the five subregions during the 1989–2008 (EVAL) and 1980–2005 (HIST) periods. The correlation coefficients between the ensemble of RCMs and the observations are shown at the top right of each panel.
3.1.2 Interannual and seasonal variability
The ability of a climate model to capture realistic interannual variability is a critical measure of its performance. The time series of the annual mean temperature and precipitation from RCMs are compared with CRU and APHRO in Fig. 5. Evidently, the interannual variation of the climatology is generally well reproduced in the MME. In the evaluation experiment for 1989–2008, the correlation coefficient of the annual climatology time series at five subregions between the observation and simulation from the MME ranges from 0.52 to 0.78 for temperature and from 0.50 to 0.87 for precipitation. The correlation coefficient is always lower in western China compared with that in eastern China, especially in the Tibetan Plateau. In the historical experiment from 1980 to 2005, the MME shows a better performance, in comparison with the RCMs, which have difficulty in reproducing the interannual variability for precipitation because of the impact of the driving GCM.
The temporal distributions of precipitation and temperature throughout the year are important for ecosystems and water resource management. To evaluate the RCM's ability to capture the seasonal variability of climatologies, the seasonal cycles of simulated temperature and precipitation averaged over five subregions in China are examined (Fig. 6). It is evident that the seasonal pattern of precipitation features one peak in June over southern China and in July over the rest of the regions, which can be successfully reproduced by all RCMs and MME. However, the inter-model difference in simulated precipitation is large. For instance, monthly precipitation is always underestimated by WRF and overestimated by MM5 and HadGEM3-RA; an especially larger bias is shown in summer. Among the five RCMs, RegCM is the one with the best ability to simulate the seasonal cycles of precipitation. The MME generally provides the most accurate simulation for the temporal distribution of precipitation, in comparison with the RCMs. As for the temperature, the RCMs can capture its temporal pattern over all subregions. Moreover, mean temperatures in different months are always overestimated by most RCMs. However, the MME reduces the bias from the RCMs and therefore generates a more accurate temporal distribution for mean temperature.
3.1.3 The added values for RCMs
The added values for high-resolution RCMs were confirmed by comparing the performance of RCMs and driving GCM HadGEM2-AO in reproducing annual mean precipitation and temperature during the historical period. According to Figs. 4–6, it is found that the added value for RCMs depends largely on the climate variable and the area of interest. The added value of the RCMs in comparison with the driving GCM was evident in terms of annual mean temperature over all five subregions, with a higher spatial and temporal correlation coefficient and less seasonal bias for all five RCMs. Compared with the driving GCM simulations, the historical precipitation over southern China, northwestern China, and the Tibetan Plateau was improved in most RCMs. The exceptions are over northeastern China and northern China, where a higher performance is shown for the driving global climate model. In reality, the added value in RCM simulations is mainly concerned with a better representation of the spatial variability of surface climate statistics, particularly in areas with small-scale land surface forcing such as orographic and coastal features. Thus, the added value in RCM simulations is commonly significant in regions with fine-scale surface forcing, whereas the performance of RCMs is less improved or even worse than that of the driving GCM over relatively flat regions. For instance, Prömmel and Geyer (Prömmel et al., 2010) also found that some RCMs show larger biases compared to their driving GCM in relatively flat regions surrounding the Alps, especially in summer. In most cases, the five RCMs perform better than the driving GCM HadGEM2-AO. It needs to be emphasized that the better model performance tends to increase confidence in the future climate projections from RCMs.
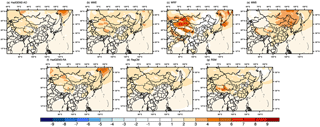
Figure 7Projected future changes (RCP4.5 − baseline) in surface air temperature by the forcing GCM HadGEM2-AO, the MME, and each of the five RCMs.
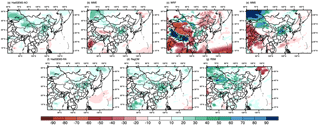
Figure 8Projected future changes ((RCP4.5 − baseline)∕baseline × 100 %) in precipitation by the forcing GCM HadGEM2-AO, the MME, and each of the five RCMs.
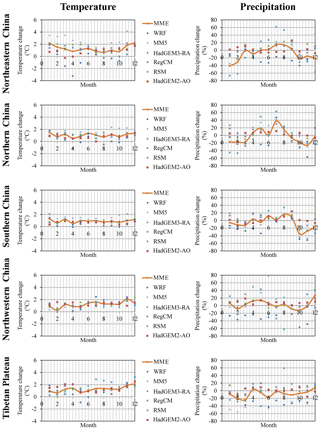
Figure 9Projected future changes in monthly mean temperature and precipitation by the forcing GCM HadGEM2-AO, the MME, and each of the five RCMs under the RCP4.5 scenario.
3.2 Multi-RCM future climate projection
3.2.1 Future change in climatology
According to Fig. 7, showing the projections for mean temperature from the driving GCM, RCMs, and the MME, similar warming trends are detected over the entire domain from 2030 to 2049 under RCP4.5 scenario. All five models project substantially significant warming while exhibiting different spatial patterns. The increases in annual temperature by the MME are 1.3, 1.0, 0.9, 1.2, and 1.3 ∘C over northeastern China, northern China, southern China, northwestern China, and the Tibetan Plateau subregions, respectively. The warming in northern and western China is more significant than that in southern China, especially in northeastern China and the Tibetan Plateau, which is similar to the results from previous studies (Sun et al., 2015; You et al., 2014; Zhou and Yu, 2006). Moreover, the magnitude for the increase in annual temperature over a given subregion varies with the RCM. For instance, the projected increase in mean temperature over the Tibetan Plateau ranges from 0.9 to 1.6 ∘C.
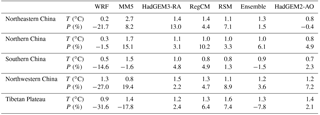
Figure 8 shows the spatial distributions of changes in annual mean precipitation (RCP4.5 − baseline). During the period 2030–2049, increased precipitation is projected by the MME and most RCMs over China. Moreover, the projected spatial pattern from the driving GCM, the MME, and RCMs is nearly consistent, with the most prominent increase in precipitation over northern and northwestern China and slightly increased precipitation over the rest of the regions. The only exception is the results from WRF, which projected a declined mean precipitation over China. In particular, a wider range for the change in projected annual precipitation is shown over the Tibetan Plateau. This is related to the fact that there is a significant difference in the projected precipitation change between WRF and the other RCMs. Therefore, the projected change in annual precipitation over the Tibetan Plateau should be treated with caution. Additionally, opposite signals for projected changes in average precipitation between the MME and the driving GCM are detected over southern China, northeastern China, and the Tibetan Plateau (Table 2). Particularly the differences in projection from the two methods above are largest at the Tibetan Plateau, up to about 10 %.
3.2.2 Change in seasonal cycle
The future changes of temperature and precipitation are characteristic of regionality and seasonality. The ensemble projection (Fig. 9) indicates that the monthly temperature change over five subregions in China ranges from 0.3 to 2.2 ∘C under the RCP4.5 scenario. A more remarkable warming in cold months from November to March is detected by all RCMs. The seasonal cycle of temperature change in MME is also similar to that of the driving GCM HadGEM2-AO. Most RCMs project positive monthly precipitation changes for summer (from June to August) over China, with the exception of the Tibetan Plateau. However, the projected monthly precipitation change by MME has a larger magnitude and variability than the driving GCM. This phenomenon concerns the significance of the model physics and processes for future climate projection. The configuration of each RCM is shown in Table 1. For each RCM, optimal schemes of the dynamical and physical processes were determined through model sensitivity analysis (Suh et al., 2012). In general, convective parameterization is one of the most important and sensitive processes in a RCM (Huang and Gao, 2017). Land surface parameterizations, as well as parameterizations over the ocean, are also very important because they control the quantity of water vapor flux entering into the atmosphere from the earth's surface (Zhao and Li, 2015). Thus, the phenomenon above could be attributed to the difference in convective parameterization and land surface parameterizations, as well as parameterizations over the ocean between GCMs and RCMs. On the other hand, the discrepancies between the RCMs and the driving GCM indicate that the RCM projections are sensitive to local and regional processes and the corresponding methods incorporated in the model (Diallo et al., 2012; Saini et al., 2015).
3.2.3 Inter-RCM variability of multi-RCM projections
The uncertainties of regional climate projection arise from the GCMs, emission scenarios, RCMs, and internal variability for natural climate. In this study, the regional future climate is projected by using five RCMs forced with the same GCM under an intermediate scenario (RCP4.5). Consequently, the contributions of inter-RCM variability and internal variability to total uncertainty in the projections are analyzed in this section.
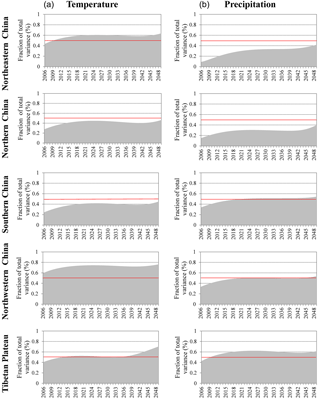
The contributions of the model uncertainty and natural climate internal variability to the total prediction uncertainty are estimated by the method proposed by Hawkins and Sutton (2009). The results for the five subregions are shown in Fig. 10. The relative importance of model uncertainty increases with prediction lead time over all subregions. For temperature, the model uncertainty is the primary source of uncertainty over northeastern China, northwestern China, and the Tibetan Plateau from 2030 to 2049, reaching up to 70 %. The model uncertainty minimally contributes (approximately 40 %) to the total uncertainty over northern and southern China before the middle of the 21st century. For the uncertainty in projected precipitation, the internal variability is the dominant uncertainty source over most regions, except for the Tibetan Plateau, where the model uncertainties reached up to 60 %. The uncertainties come from the driving GCMs, and the emission scenarios are not discussed in this study, although they have been recognized as important components for total uncertainty (Déqué et al., 2012). Further research on uncertainty quantification on the basis of different GCMs, RCMs, and emission scenarios is needed in the future.
In this research, five RCM models, which are simulated within the CORDEX-EA initiative at 50 km resolution, with boundary forcing from a CMIP5 global model, applying the RCP4.5 scenario, are employed to derive the future climate change signal for China and five smaller selected investigation areas. Meanwhile, the contributions of the model uncertainty and natural climate internal variability to the total prediction uncertainty are quantified.
The control runs of CORDEX-EA RCMs revealed an overall reasonable representation of the mean climate properties when compared with the observational gridded dataset. All RCMs generally provide warm biases, whereas the MME demonstrates the overall best performance, with less than a 1 ∘C annual average temperature bias over most areas in China. Similarly, the MME outperformed the individual RCMs in reproducing the observed spatial pattern of precipitation. Moreover, five RCMs perform better than the driving GCM HadGEM2-AO in reproducing annual and seasonal precipitation over most subregions. Therefore, it is concluded that the MME constructed based on the set of RCMs from CORDEX-EA can be used to provide useful information on climate projections over East Asia.
For 2030 to 2049, MME indicated consistent warming, ranging from 0.9 to 1.6 ∘C, in the entire domain and more pronounced warming was detected in northern and western China. Seasonal temperature changes drastically in cold months, which is similar to that of the driving GCM. In addition, the annual precipitation is likely to increase in most of the subregions. The projected spatial pattern for annual precipitation is characterized by a prominent increase over northern and northwestern China and slightly increased precipitation over the rest of the regions. Moreover, precipitation in summer months is predicted to consistently increase over the entire domain, with the exception of the Tibetan Plateau. It should be noted that the projected monthly precipitation change by MME has a larger magnitude and variability than the driving GCM.
This study identified the contributions of model uncertainty and internal variability. The uncertainty in projected temperature mainly arises from the internal variability over northern and southern China, whereas the model uncertainty is clearly dominant over the other three subregions, explaining approximately 70 % of the total uncertainty. For precipitation, the internal variability is dominant over most regions except for the Tibetan Plateau, in which model uncertainties reached up to 60 %. Model uncertainty also increases with prediction lead time over all subregions. RCM simulation results are also influenced by the internal physics and boundary conditions from GCMs, as discussed in others' studies (Mariotti et al., 2011; Syed et al., 2012). More reliable future climate information and uncertainty quantification could be provided by coupling large ensembles of GCMs and RCMs under different emission scenarios.
The CORDEX-East Asia data are available from http://cordex-ea.climate.go.kr/cordex/download.do (KMA, 2018).
The authors declare that they have no conflict of interest.
This work was supported by the National Key R&D Program of China (grant no. 2016YFC0402706, 2016YFC0402710), the National Natural
Science Foundation of China (no. 41501015, 51539003, 51421006, 51509263), and the Fundamental Research Funds for the Central Universities
(2016B00114). We acknowledge the CORDEX-East Asia databank, which is responsible for the CORDEX dataset, and we thank the National
Institute of Meteorological Research (NIMR), three universities in the Republic of Korea (Seoul National Uni., Yonsei Uni., Kongju
National Uni.), and other cooperative research institutes in East Asia region for producing and making available their model
output. We also thank two anonymous reviewers for their constructive and insightful comments that helped to improve the original
manuscript.
Edited by: Thomas Kjeldsen
Reviewed by: two anonymous referees
Alfieri, L., Burek, P., Feyen, L., and Forzieri, G.: Global warming increases the frequency of river floods in Europe, Hydrol. Earth Syst. Sci., 19, 2247–2260, https://doi.org/10.5194/hess-19-2247-2015, 2015.
Baek, H. J., Lee, J., Lee, H. S., Hyun, Y. K., Cho, C., Kwon, W. T., Marzin, C., Gan, S. Y., Kim, M. J., Choi, D. H., Lee, J., Lee, J., Boo, K. O., Kang, H. S., and Byun, Y. H: Climate change in the 21st century simulated by HadGEM2-AO under representative concentration pathways, Asia-Pacific J. Atmos. Sci., 49, 603–618, https://doi.org/10.1007/s13143-013-0053-7, 2013.
Baker, N. C. and Taylor, P. C.: A Framework for Evaluating Climate Model Performance Metrics, J. Climate, 29, 1773–1782, https://doi.org/10.1175/JCLI-D-15-0114.1, 2016.
Cha, D. H. and Lee, D. K.: Reduction of systematic errors in regional climate simulations of the summer monsoon over East Asia and the western North Pacific by applying the spectral nudging technique, J. Geophys. Res.-Atmos., 114, D14108, https://doi.org/10.1029/2008JD011176, 2009.
Cha, D. H., Jin, C. S., Lee, D. K., and Kuo, Y. H.: Impact of intermittent spectral nudging on regional climate simulation using Weather Research and Forecasting model, J. Geophys. Res., 116, D10103, https://doi.org/10.1029/2010JD015069, 2011.
Chen, J. and Bordoni, S.: Intermodel spread of East Asian summer monsoon simulations in CMIP5, Geophys. Res. Lett., 41, 1314–1321, https://doi.org/10.1002/2013GL058981, 2014.
Davies, T., Cullen, M. J. P., Malcolm, A. J., Mawson, M. H., Staniforth, A. , White, A. A., and Wood, N.: A new dynamical core for the Met Office's global and regional modelling of the atmosphere, Q. J. Roy. Meteor. Soc., 131, 1759–1782, https://doi.org/10.1256/qj.04.101, 2005.
Déqué, M., Rowell, D. P., Lüthi, D., Giorgi, F., Christensen, J. H., Rockel, B., Jacob, D., Kjellström, E., de Castro, M., and van den Hurk, B.: An intercomparison of regional climate simulations for Europe: assessing uncertainties in model projections, Climatic Change, 81, 53–70, https://doi.org/10.1007/s10584-006-9228-x, 2007.
Déqué, M., Somot, S., Sanchez-Gomez, E., Goodess, C. M., Jacob, D., Lenderink, G., and Christensen, O. B.: The spread amongst ENSEMBLES regional scenarios: regional climate models, driving general circulation models and interannual variability, Clim. Dynam., 38, 951–964, https://doi.org/10.1007/s00382-011-1053-x, 2012.
Deser, C., Phillips, A., and Bourdette, V., and Teng, H.: Uncertainty in climate change projections: the role of internal variability, Clim. Dynam., 38, 527–546, https://doi.org/10.1007/s00382-010-0977-x, 2012.
Diallo, I., Sylla, M. B., Giorgi, F., Gaye, A. T., and Camara, M.: Multimodel GCM-RCM Ensemble-Based Projections of Temperature and Precipitation over West Africa for the Early 21st Century, Int. J. Geophys., 2012, 972896, https://doi.org/10.1155/2012/972896, 2012.
Ding, Y.: Seasonal march of the East-Asian summer monsoon, in: East Asian Monsoon, edited by: Chang, C. P., Mainland Press, Singapore, 3–53, 2004.
Ding, Y. and Chan, J. C. L.: The East Asian summer monsoon: an overview, Meteorol. Atmos. Phys., 89, 117–142, https://doi.org/10.1007/s00703-005-0125-z, 2005.
Dong, N. D., Jayakumar, K. V., and Agilan, V.: Impact of Climate Change on Flood Frequency of the Trian Reservoir in Vietnam Using RCMS, J. Hydrol. Eng., 23, 05017032, https://doi.org/10.1061/(ASCE)HE.1943-5584.0001609, 2018.
Gao, J., Hou, W., Xue, Y., and Wu, S.: Validating the dynamic downscaling ability of WRF for East Asian summer climate, Theor. Appl. Climatol., 128, 241–253, https://doi.org/10.1007/s00704-015-1710-9, 2017.
Gao, X. J., Pal, J. S., and Giorgi, F.: Projected changes in mean and extreme precipitation over the Mediterranean region from a high resolution double nested RCM simulation, Geophys. Res. Lett., 33, L03706, https://doi.org/10.1029/2005GL024954, 2006.
Giorgi, F. and Mearns, L. O.: Introduction to special section: Regional climate modeling revisited, J. Geophys. Res., 104, 6335–6352, https://doi.org/10.1029/98JD02072, 1999.
Giorgi, F., Jones, C., and Asrar, G. R.: Addressing climate information needs at the regional level: the CORDEX framework, WMO Bulletin, 58, 175–183, 2009.
Giorgi, F., Coppola, E., Solmon, F., Mariotti, L., Sylla, M. B., Bi, X., Elguindi, N., Diro, G. T., Nair, V., Giuliani, G., Turuncoglu, U. U., Cozzini, S., Güttler, I., O'Brien, T. A., Tawfik, A. B., Shalaby, A., Zakey, A. S., Steiner, A. L., Stordal, F., Sloan, L. C., and Brankovic, C.: RegCM4: model description and preliminary tests over multiple CORDEX domains, Clim. Res., 52, 7–29, https://doi.org/10.3354/cr01018, 2012.
Gu, H., Wang, G., Yu, Z., and Mei, R.: Assessing future climate changes and extreme indicators in east and south Asia using the RegCM4 regional climate model, Climatic Change, 114, 301–317, https://doi.org/10.1007/s10584-012-0411-y, 2012.
Gu, H., Yu, Z., Wang, G., Wang, J., Ju, Q., Yang, C., and Fan, C.: Impact of climate change on hydrological extremes in the Yangtze River Basin, China, Stoch. Env. Res. Risk A., 29, 693–707, https://doi.org/10.1007/s00477-014-0957-5, 2015a.
Gu, H., Yu, Z., Wang, J., Wang, G., Yang, T., Ju, Q., Yang, C., Xu, F., and Fan, C.: Assessing CMIP5 general circulation model simulations of precipitation and temperature over China, Int. J. Climatol., 35, 2431–2440, https://doi.org/10.1002/joc.4152, 2015b.
Harris, I., Jones, P. D., Osborn, T. J., and Lister, D. H.: Updated high-resolution grids of monthly climatic observations – the CRU TS3.10 Dataset, Int. J. Climatol., 34, 623–642, https://doi.org/10.1002/joc.3711, 2014.
Hawkins, E. and Sutton, R.: The Potential to Narrow Uncertainty in Regional Climate Predictions, B. Am. Meteorol. Soc., 90, 1095–1107, https://doi.org/10.1175/2009BAMS2607.1, 2009.
Hawkins, E. and Sutton, R.: The potential to narrow uncertainty in projections of regional precipitation change, Clim. Dynam., 37, 407–418, https://doi.org/10.1007/s00382-010-0810-6, 2011.
Hong, S. and Yhang, Y.: Implications of a Decadal Climate Shift over East Asia in Winter: A Modeling Study, J. Climate, 23, 4989–5001, https://doi.org/10.1175/2010JCLI3637.1, 2010.
Hong, S. Y., Park, H., Cheong, H. B., Kim, J. E., Koo, M. S., Jang, J., Ham, S., Hwang, S. O., Park, B. K., Chang, E. C., and Li, H.: The Global/Regional Integrated Model system (GRIMs), Asia-Pacific J. Atmos. Sci., 49, 219–243, https://doi.org/10.1007/s13143-013-0023-0, 2013.
Hsu, H.: East Asian monsoon, in: Intraseasonal Variability in the Atmospheric Ocean Climate System, edited by: William, K. M. L. and Waliser, D. E., Springer, Berlin, Heidelberg, 63–94, 2005.
Huang, D. and Gao, S.: Impact of different cumulus convective parameterization schemes on the simulation of precipitation over China, Tellus A, 69, 1406264, https://doi.org/10.1080/16000870.2017.1406264, 2017.
Huang, D. Q, Zhu, J., Zhang, Y. C., and Huang, A. N.: Uncertainties on the simulated summer precipitation over Eastern China from the CMIP5 models, J. Geophys. Res.-Atmos., 118, 9035–9047, https://doi.org/10.1002/jgrd.50695, 2013.
Huttunen, J. M. J., Räisänen, J., Nissinen, A., Lipponen, A., and Kolehmainen, V.: Cross-validation analysis of bias models in Bayesian multi-model projections of climate, Clim. Dynam., 48, 1555–1570, https://doi.org/10.1007/s00382-016-3160-1, 2017.
IPCC: Climate Change 2013: the physical basis, Contribution of Working Group 1 to the Fifth Assessment Report of the IPCC, Cambridge University Press, New York, 2013.
Jin, C. S., Cha, D. H, Lee, D. K, Suh, M. S, Hong, S. Y, Kang, H. S., and Ho, C. H: Evaluation of climatological tropical cyclone activity over the western North Pacific in the CORDEX-East Asia multi-RCM simulations, Clim. Dynam., 47, 765–778, https://doi.org/10.1007/s00382-015-2869-6, 2016.
Jones, C., Giorgi, F., and Asrar, G.: The Coordinated Regional Downscaling Experiment: CORDEX – an international downscaling link to CMIP5, International CLIVAR Project Office Southampton, UK, 2011.
Kay, A. L., Davies, H. N., Bell, V. A., and Jones, R. G.: Comparison of uncertainty sources for climate change impacts: flood frequency in England, Climatic Change, 92, 41–63, https://doi.org/10.1007/s10584-008-9471-4, 2009.
Kerr, R.: Climate change hot spots mapped across the United States, Science, 321, 909, https://doi.org/10.1126/science.321.5891.909, 2008.
Kitoh, A., Endo, H., Krishna Kumar, K., Cavalcanti, I. F. A., Goswami, P., and Zhou, T.: Monsoons in a changing world: A regional perspective in a global context, J. Geophys. Res.-Atmos., 118, 3053–3065, https://doi.org/10.1002/jgrd.50258, 2013.
KMA (Korea Meteorological Administration): Coordinated Regional Climate Downscaling Experiment in East Asia Databank, available at: http://cordex-ea.climate.go.kr/cordex/download.do, last access: 18 May 2018.
Kreft, S., Eckstein, D., and Melchior, I.: Global Climate Risk Index 2017: Who suffers most from extreme weather events? Weather-related loss events in 2015 and 1996 to 2015, Germanwatch e.V., Bonn, Germany, 2016.
Kusunoki, S., Yoshimura, J., Yoshimimura, H., Noda, A., Oouchi, K., and Mizuta, R.: Change of Baiu Rain Band in Global Warming Projection by an Atmospheric General Circulation Model with a 20-km Grid Size, J. Meteorol. Soc. Jpn.. Ser. II, 84, 581–611, https://doi.org/10.2151/jmsj.84.581, 2006.
Lafaysse, M., Hingray, B., Mezghani, A., Gailhard, J., and Terray, L: Internal variability and model uncertainty components in future hydrometeorological projections: The Alpine Durance basin, Water Resour. Res., 50, 3317–3341, https://doi.org/10.1002/2013WR014897, 2014.
Lau, W. K. M., Kim, K., and Leung, L. R.: Changing circulation structure and precipitation characteristics in Asian monsoon regions: greenhouse warming vs. aerosol effects, Geosci. Lett., 4, 28, https://doi.org/10.1186/s40562-017-0094-3, 2017.
Lee, J. W., Hong, S. Y., Chang, E. C, Suh, M. S., and Kang, H. S: Assessment of future climate change over East Asia due to the RCP scenarios downscaled by GRIMs-RMP, Clim. Dynam., 42, 733–747, https://doi.org/10.1007/s00382-013-1841-6, 2014.
Mariotti, L., Coppola, E., Sylla, M. B., Giorgi, F., and Piani, C.: Regional climate model simulation of projected 21st century climate change over an all-Africa domain: Comparison analysis of nested and driving model results, J. Geophys. Res.-Atmos., 116, D15111, https://doi.org/10.1029/2010JD015068, 2011.
Niu, X., Wang, S., Tang, J., Lee, D., Gao, X., Wu, J., Hong, S., Gutowski, W. J., and McGregor, J.: Multimodel ensemble projection of precipitation in eastern China under A1B emission scenario, J. Geophys. Res.-Atmos., 120, 9965–9980, https://doi.org/10.1002/2015JD023853, 2015.
O'Brien, T. A., Sloan, L. C., and Snyder, M. A.: Can ensembles of regional climate model simulations improve results from sensitivity studies?, Clim. Dynam., 37, 1111–1118, https://doi.org/10.1007/s00382-010-0900-5, 2011.
Park, C., Min, S. K., Lee, D., Cha, D. H., Suh, M. S., Kang, H. S., Hong, S. Y, Lee, D. K., Baek, H. J., Boo, K. O., and Kwon, W. T.: Evaluation of multiple regional climate models for summer climate extremes over East Asia, Clim. Dynam., 46, 2469–2486, https://doi.org/10.1007/s00382-015-2713-z, 2016.
Park, E. H., Hong, S. Y., and Kang, H. S.: Characteristics of an East-Asian summer monsoon climatology simulated by the RegCM3, Meteorol. Atmos. Phys., 100, 139–158, https://doi.org/10.1007/s00703-008-0300-0, 2008.
Patz, J. A., Campbell-Lendrum, D., Holloway, T., and Foley, J. A.: Impact of regional climate change on human health, Nature, 438, 310–317, https://doi.org/10.1038/nature04188, 2005.
Phillips, T. J. and Gleckler, P. J.: Evaluation of continental precipitation in 20th century climate simulations: The utility of multimodel statistics, Water Resour. Res., 42, W03202, https://doi.org/10.1029/2005WR004313, 2006.
Prömmel, K., Geyer, B., Jones, J. M., and Widmann, M.: Evaluation of the skill and added value of a reanalysis-driven regional simulation for Alpine temperature, Int. J. Climatol., 30, 760–773, https://doi.org/10.1002/joc.1916, 2010
Rozante, J. R., Moreira, D. S., Godoy, R. C. M., and Fernandes, A. A.: Multi-model ensemble: technique and validation, Geosci. Model Dev., 7, 2333–2343, https://doi.org/10.5194/gmd-7-2333-2014, 2014.
Saini, R., Wang, G., Yu, M., and Kim, J.: Comparison of RCM and GCM projections of boreal summer precipitation over Africa, J. Geophys. Res.-Atmos., 120, 3679–3699, https://doi.org/10.1002/2014JD022599, 2015.
Seo, S. B., Sinha, T., Mahinthakumar, G., Sankarasubramanian, A., and Kumar, M.: Identification of dominant source of errors in developing streamflow and groundwater projections under near-term climate change, J. Geophys. Res.-Atmos., 121, 7652–7672, https://doi.org/10.1002/2016JD025138, 2016.
Skamarock, W. C., Klemp, J. B., Dudhia, J., Gill, D. O., Barker, D. M., Wang, W., and Powers, J. G.: A Description of the Advanced Research WRF Version 2, National Center for Atmospheric Research, Boulder, 2005.
Sperber, K. R., Annamalai, H., Kang, I. S., Kitoh, A., Moise, A., Turner, A., Wang, B., and Zhou, T.: The Asian summer monsoon: an intercomparison of CMIP5 vs. CMIP3 simulations of the late 20th century, Clim. Dynam., 41, 2711–2744, https://doi.org/10.1007/s00382-012-1607-6, 2013.
Suh, M. S., Oh, S. G., Lee, D. K., Cha, D. H., Choi, S. J., Jin, C. S., and Hong, S. Y.: Development of New Ensemble Methods Based on the Performance Skills of Regional Climate Models over South Korea, J. Climate, 25, 7067–7082, https://doi.org/10.1175/JCLI-D-11-00457.1, 2012.
Sun, Q., Miao, C., Duan, Q., Kong, D., Ye, A., Di, Z., and Gong, W.: Would the “real” observed dataset stand up? A critical examination of eight observed gridded climate datasets for China, Environ. Res. Lett., 9, 015001, https://doi.org/10.1088/1748-9326/9/1/015001, 2014.
Sun, Q., Miao, C., and Duan, Q.: Projected changes in temperature and precipitation in ten river basins over China in 21st century, Int. J. Climatol., 35, 1125–1141, https://doi.org/10.1002/joc.4043, 2015.
Syed, F. S., Yoo, J. H., Körnich, H., and Kucharski, F.: Extratropical influences on the inter-annual variability of South-Asian monsoon, Clim. Dynam., 38, 1661–1674, https://doi.org/10.1007/s00382-011-1059-4, 2012.
Tang, J., Li, Q., Wang, S., Lee, D. K, Hui, P., Niu, X., Gutowski, W. J., Dairaku, K., McGregor, J., Katzfey, J., Gao, X., Wu, J., Hong, S., Wang, Y., and Sasaki, H.: Building Asian climate change scenario by multi-regional climate models ensemble, Part I: surface air temperature, Int. J. Climatol., 36, 4241–4252, https://doi.org/10.1002/joc.4628, 2016.
Taylor, K. E.: Summarizing multiple aspects of model performance in a single diagram, J. Geophys. Res.-Atmos., 106, 7183–7192, https://doi.org/10.1029/2000JD900719, 2001.
The HadGEM2 Development Team: G. M. Martin, Bellouin, N., Collins, W. J., Culverwell, I. D., Halloran, P. R., Hardiman, S. C., Hinton, T. J., Jones, C. D., McDonald, R. E., McLaren, A. J., O'Connor, F. M., Roberts, M. J., Rodriguez, J. M., Woodward, S., Best, M. J., Brooks, M. E., Brown, A. R., Butchart, N., Dearden, C., Derbyshire, S. H., Dharssi, I., Doutriaux-Boucher, M., Edwards, J. M., Falloon, P. D., Gedney, N., Gray, L. J., Hewitt, H. T., Hobson, M., Huddleston, M. R., Hughes, J., Ineson, S., Ingram, W. J., James, P. M., Johns, T. C., Johnson, C. E., Jones, A., Jones, C. P., Joshi, M. M., Keen, A. B., Liddicoat, S., Lock, A. P., Maidens, A. V., Manners, J. C., Milton, S. F., Rae, J. G. L., Ridley, J. K., Sellar, A., Senior, C. A., Totterdell, I. J., Verhoef, A., Vidale, P. L., and Wiltshire, A.: The HadGEM2 family of Met Office Unified Model climate configurations, Geosci. Model Dev., 4, 723–757, https://doi.org/10.5194/gmd-4-723-2011, 2011.
Thomson, A., Calvin, K., Smith, S., Kyle, G. P., Volke, A., Patel, P., Delgado-Arias, S., Bond-Lamberty, B., Wise, M., Clarke, L., and Edmonds, J.: RCP4.5: a pathway for stabilization of radiative forcing by 2100, Climatic Change, 109, 77–94, https://doi.org/10.1007/s10584-011-0151-4, 2011.
Um, M., Kim, Y., and Kim, J.: Evaluating historical drought characteristics simulated in CORDEX East Asia against observations, Int. J. Climatol., 37, 4643–4655, https://doi.org/10.1002/joc.5112, 2017.
Wang, L., Chen, W., Huang, G., and Zeng, G.: Changes of the transitional climate zone in East Asia: past and future, Clim. Dynam., 49, 1463–1477, https://doi.org/10.1007/s00382-016-3400-4, 2017a.
Wang, X., Yang, T., Wortmann, M., Shi, P., Hattermann, F., Lobanova, A., and Aich, V.: Analysis of multi-dimensional hydrological alterations under climate change for four major river basins in different climate zones, Climatic Change, 141, 483–498, https://doi.org/10.1007/s10584-016-1843-6, 2017b.
Wang, Y., Leung, L. R., McGregor, J. L., Lee, D. K., Wang, W. C., Ding, Y. H., and Kimura, F.: Regional climate modeling: progress, challenges, and prospects, J. Meteorol. Soc. Jpn., 82, 1599–1628, https://doi.org/10.2151/jmsj.82.1599, 2004.
Webster, P. J., Magaña, V. O., Palmer, T. N., Shukla, J., Tomas, R. A., Yanai, M., and Yasunari, T.: Monsoons: Processes, predictability, and the prospects for prediction, J. Geophys. Res.-Oceans, 103, 14451–14510, https://doi.org/10.1029/97JC02719, 1998.
Wilby, R. L. and Harris, I.: A framework for assessing uncertainties in climate change impacts: Low-flow scenarios for the River Thames, UK, Water Resour. Res., 42, W02419, https://doi.org/10.1029/2005WR004065, 2006.
Woldemeskel, F. M., Sharma, A., Sivakumar, B., and Mehrotra, R.: Quantification of precipitation and temperature uncertainties simulated by CMIP3 and CMIP5 models, J. Geophys. Res.-Atmos., 121, 3–17, https://doi.org/10.1002/2015JD023719, 2016.
Wu, J. and Gao, X.: A gridded daily observation dataset over China region and comparison with the other datasets, Chinese J. Geophys., 56, 1102–1111, https://doi.org/10.6038/cjg20130406, 2013 (in Chinese).
Yang, T., Cui, T., Xu, C., Ciais, P., and Shi, P.: Development of a new IHA method for impact assessment of climate change on flow regime, Global Planet. Change, 156, 68–79, https://doi.org/10.1016/j.gloplacha.2017.07.006, 2017.
Yatagai, A., Kamiguchi, K., Arakawa, O., Hamada, A., Yasutomi, N., and Kitoh, A.: APHRODITE: Constructing a Long-Term Daily Gridded Precipitation Dataset for Asia Based on a Dense Network of Rain Gauges, B. Am. Meteorol. Soc., 93, 1401–1415, https://doi.org/10.1175/BAMS-D-11-00122.1, 2012.
Yhang, Y. and Hong, S.: Improved Physical Processes in a Regional Climate Model and Their Impact on the Simulated Summer Monsoon Circulations over East Asia, J. Climate, 21, 963–979, https://doi.org/10.1175/2007JCLI1694.1, 2008.
Yin, H., Donat, M. G., Alexander, L. V., and Sun, Y.: Multi-dataset comparison of gridded observed temperature and precipitation extremes over China, Int. J. Climatol., 35, 2809–2827, https://doi.org/10.1002/joc.4174, 2015.
Yira, Y., Diekkrüger, B., Steup, G., and Bossa, A. Y.: Impact of climate change on hydrological conditions in a tropical West African catchment using an ensemble of climate simulations, Hydrol. Earth Syst. Sci., 21, 2143–2161, https://doi.org/10.5194/hess-21-2143-2017, 2017.
You, Q., Min, J., Fraedrich, K., Zhang, W., Kang, S., Zhang, L., and Meng, X.: Projected trends in mean, maximum, and minimum surface temperature in China from simulations, Global Planet. Change, 112, 53–63, https://doi.org/10.1016/j.gloplacha.2013.11.006, 2014.
Yu, Z., Pollard, D., and Cheng, L.: On continental-scale hydrologic simulations with a coupled hydrologic model, J. Hydrol., 331, 110–124, https://doi.org/10.1016/j.jhydrol.2006.05.021, 2006.
Yu, Z., Gu, H., Wang, J., Xia, J., and Lu, B.: Effect of projected climate change on the hydrological regime of the Yangtze River Basin, China, Stoch. Env. Res. Risk A., 32, 1–16, https://doi.org/10.1007/s00477-017-1391-2, 2018.
Zhao, W. and Li, A.: A Review on Land Surface Processes Modelling over Complex Terrain, Adv. Meteorol., 2015, 607181, https://doi.org/10.1155/2015/607181, 2015.
Zhou, T. and Yu, R.: Twentieth-Century Surface Air Temperature over China and the Globe Simulated by Coupled Climate Models, J. Climate, 19, 5843–5858, https://doi.org/10.1175/JCLI3952.1, 2006.


