the Creative Commons Attribution 3.0 License.
the Creative Commons Attribution 3.0 License.
Daily GRACE gravity field solutions track major flood events in the Ganges–Brahmaputra Delta
Ben T. Gouweleeuw
Andreas Kvas
Christian Gruber
Animesh K. Gain
Thorsten Mayer-Gürr
Frank Flechtner
Andreas Güntner
Two daily gravity field solutions based on observations from the Gravity Recovery and Climate Experiment (GRACE) satellite mission are evaluated against daily river runoff data for major flood events in the Ganges–Brahmaputra Delta (GBD) in 2004 and 2007. The trends over periods of a few days of the daily GRACE data reflect temporal variations in daily river runoff during major flood events. This is especially true for the larger flood in 2007, which featured two distinct periods of critical flood level exceedance in the Brahmaputra River. This first hydrological evaluation of daily GRACE gravity field solutions based on a Kalman filter approach confirms their potential for gravity-based large-scale flood monitoring. This particularly applies to short-lived, high-volume floods, as they occur in the GBD with a 4–5-year return period. The release of daily GRACE gravity field solutions in near-real time may enable flood monitoring for large events.
- Article
(15726 KB) - Full-text XML
- BibTeX
- EndNote


Floods are dynamic events, which may only take hours to days to develop and drain. For monitoring purposes, Earth observation products need to be available sufficiently frequently to capture the progressing stages of a flood event. Flood early-warning and forecasting systems additionally require information in near-real time (NRT) to estimate probabilistic flood risk with typical lead times of a few days for larger river basins. Total water storage anomalies (TWSAs) derived from temporal variations of the Earth's gravity field as observed by the Gravity Recovery and Climate Experiment (GRACE) twin-satellite mission (Tapley et al., 2004) have been shown to be a unique descriptor of large-scale flood events (Chen et al., 2010; Steckler et al., 2010). However, partly due to its coarse temporal (weekly to monthly) and spatial (>150 000 km2) resolution, the evaluation of the integrated information from GRACE on total water storage variations (i.e., variations of all surface and subsurface water stores) for flood monitoring or forecasting has been limited.
Reager and Famiglietti (2009) proposed a regional monthly flood potential index using a GRACE-based saturation deficit approach, which was quantitatively evaluated by Molodtsova et al. (2016) for the continental United States. While the index agreed well with observed floods on regional and even local scales, an increased forecasting skill was found for large-scale, long-duration floods during summer. Reager et al. (2014) established a relationship between gauged river flow and GRACE-derived basin-wide water storage for the March–June 2011 Missouri river flood, potentially increasing forecasting lead time to several months. The same 500-year flood event was evaluated by Reager et al. (2015), who assimilated monthly GRACE-derived TWSAs into a land surface model, which enables state disaggregation of the vertically integrated TWSAs, a downscaling of GRACE's coarse spatial resolution and NRT analysis beyond the latest GRACE data release.
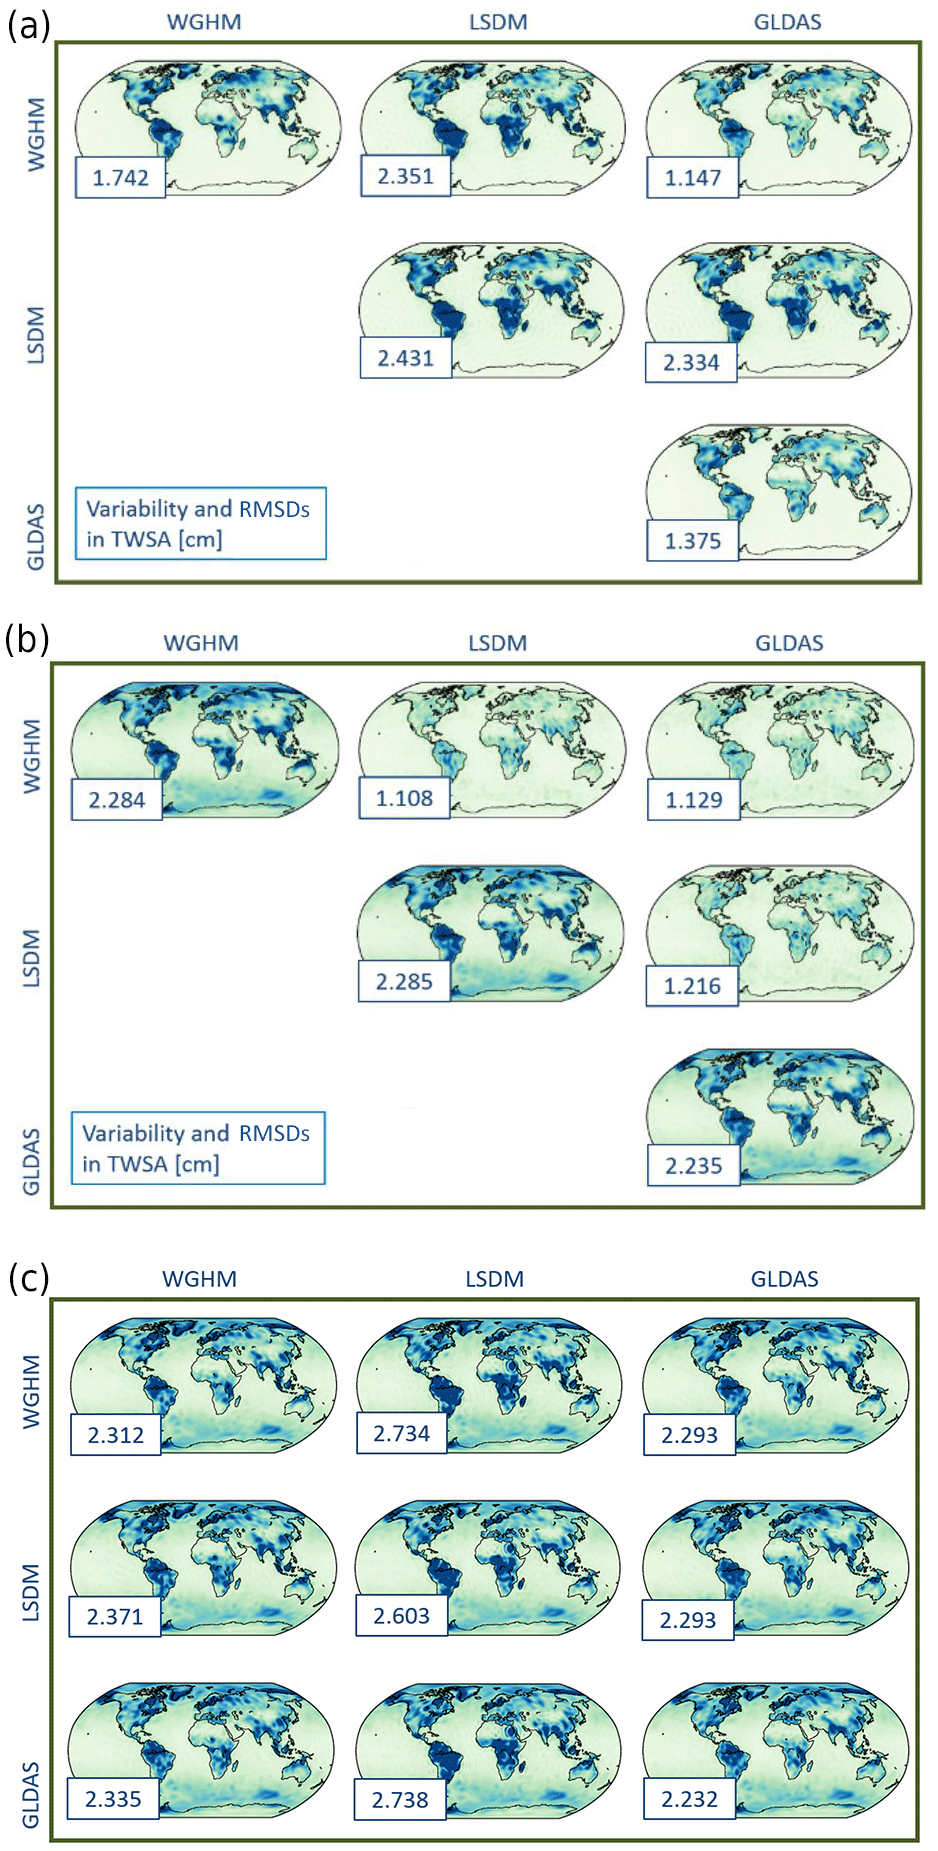
Figure 1(a) Global average daily water mass variability (main diagonal) and root mean square differences (RMSDs) (off-diagonal) between the hydrological models used, expressed as TWSAs (2003–2014, secular and annual variations removed). (b) Global average daily variability (main diagonal) and RMSDs (off-diagonal) of the derived daily ITSG-Grace2014 solutions, expressed as TWSAs (2003–2014, secular and annual variations removed). (c) Global RMSDs in cm between the daily ITSG-Grace2014 solutions (rows) and the hydrological models used (columns), expressed as TWSAs (2003–2014, secular and annual variations removed).
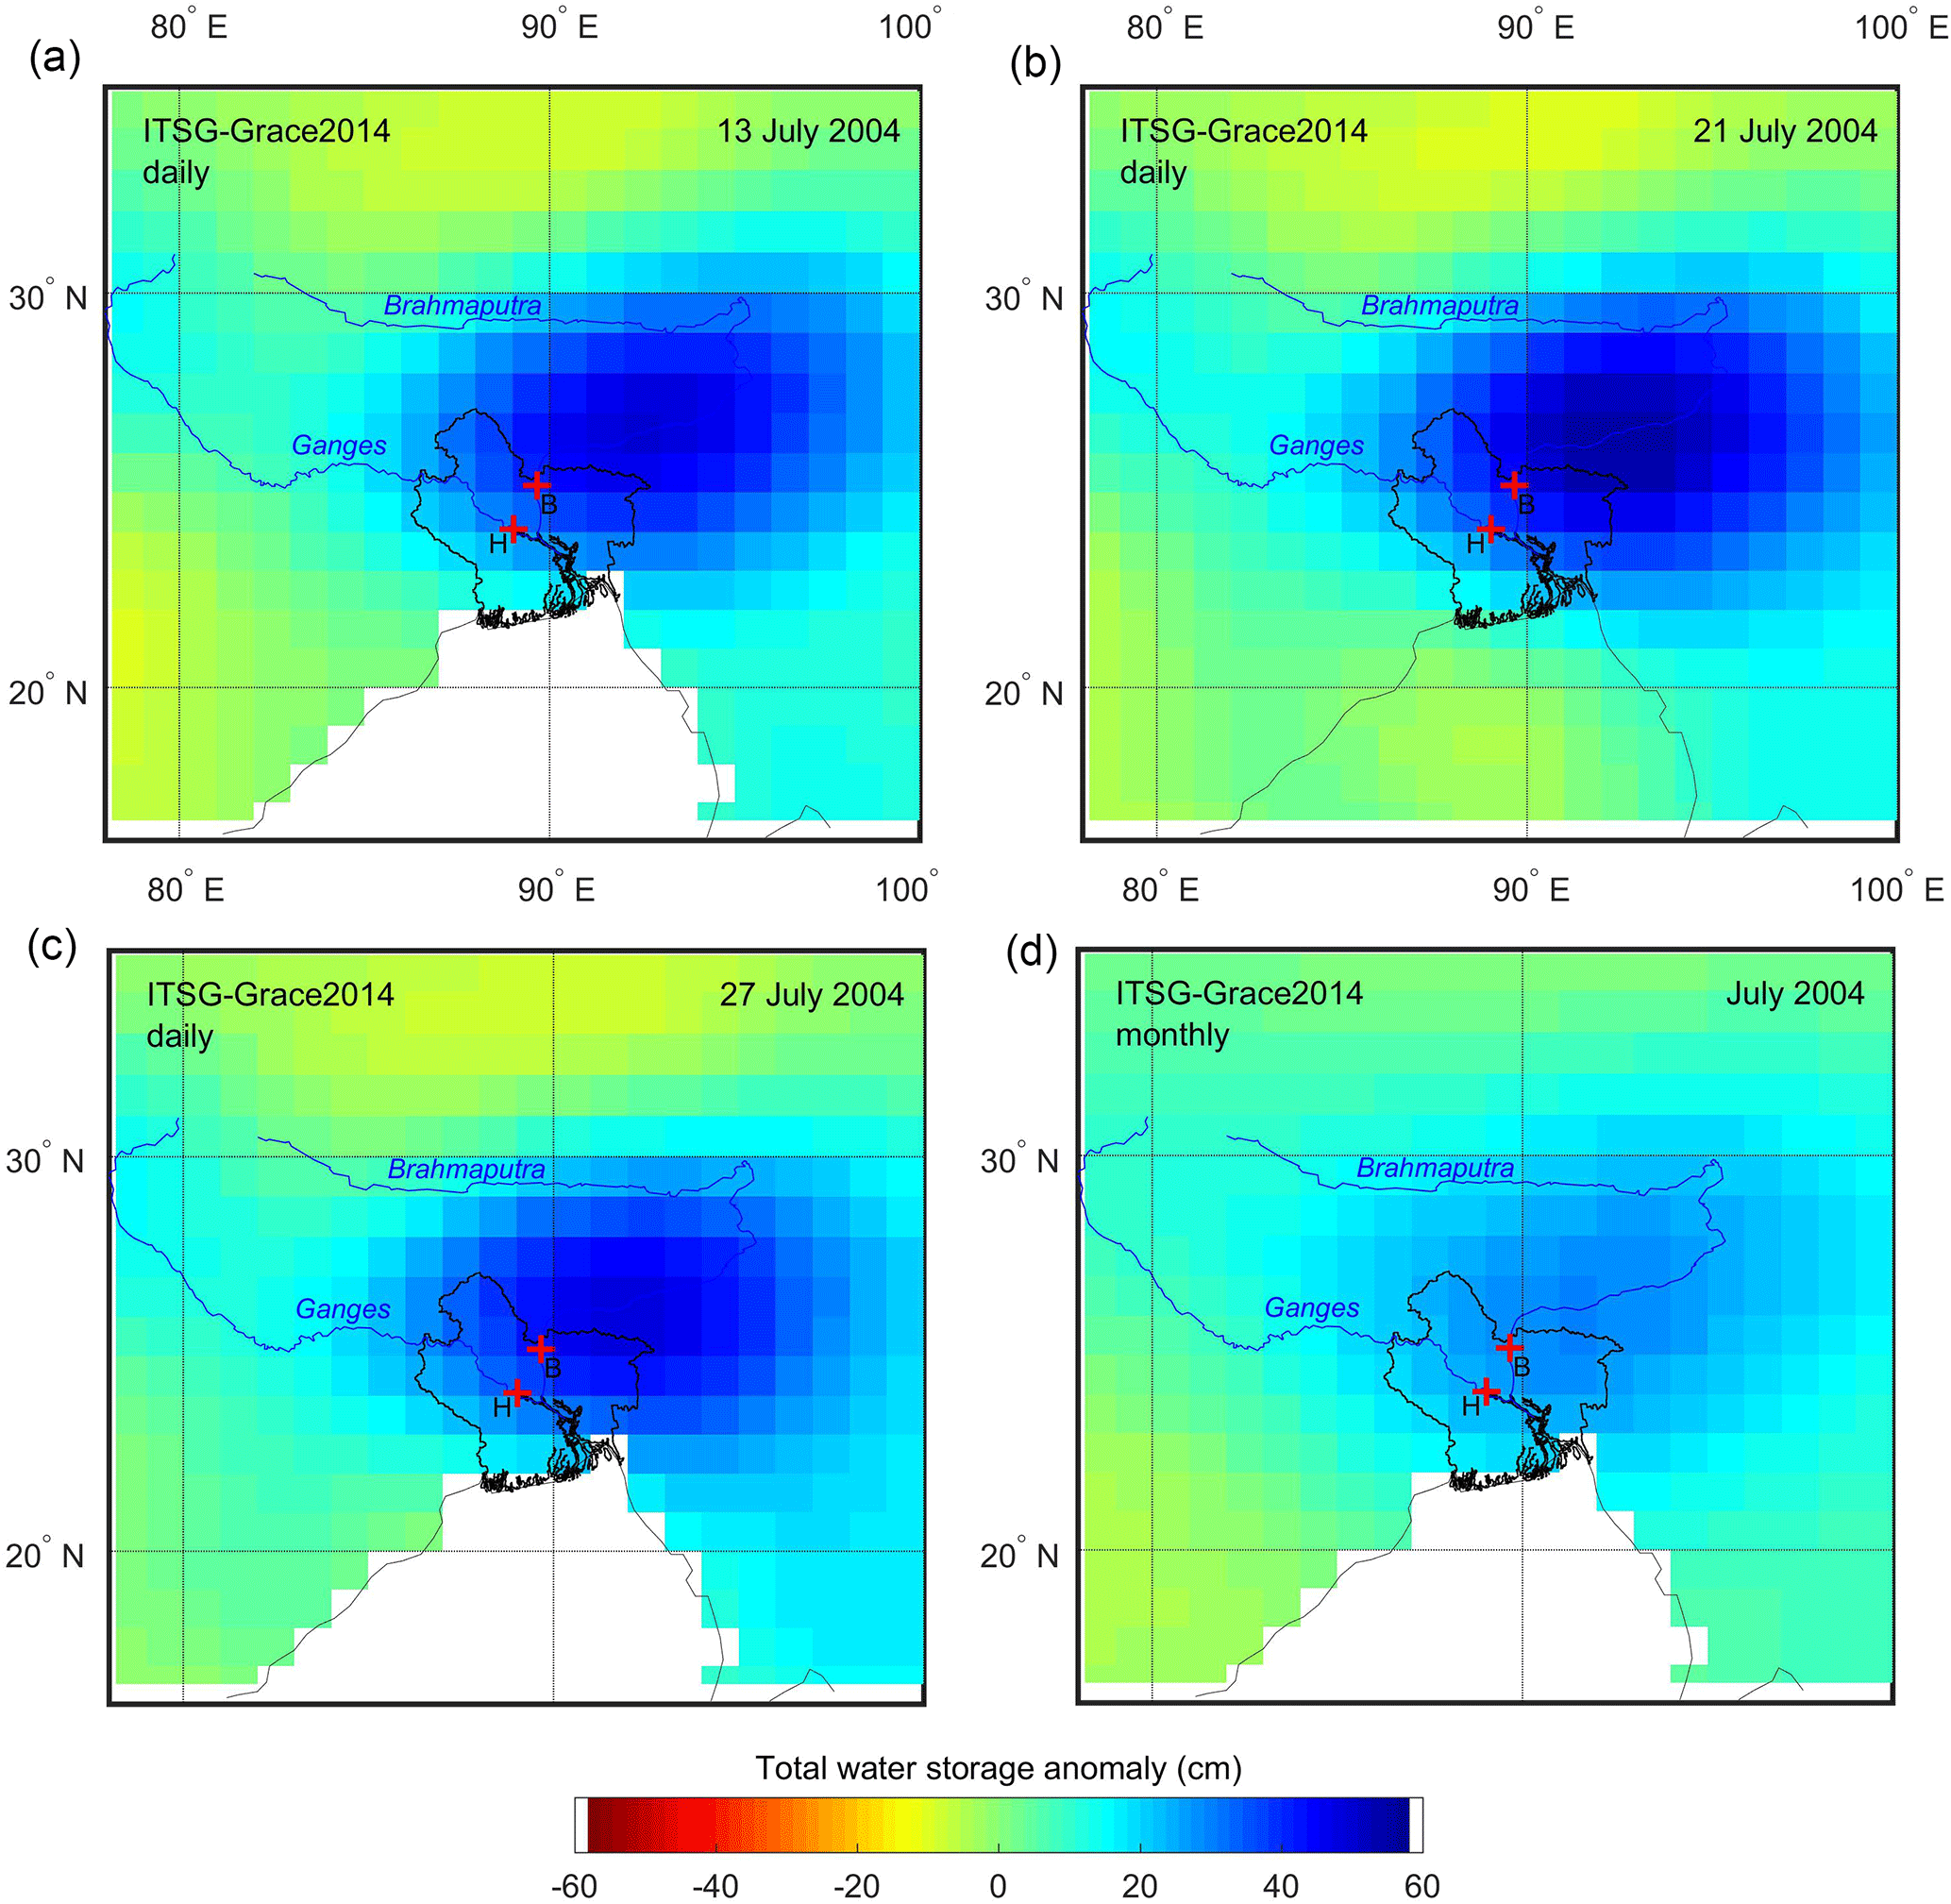
Figure 2Daily and monthly water storage anomalies of the ITSG-Grace2014 solution for the Ganges–Brahmaputra Delta (outline indicated) on (a) 13 July 2004, (b) 21 July 2004, (c) 27 July 2004 and (d) July 2004. Increased TWSAs are related to flooding. River runoff stations are Bahadurabad (B) in the Brahmaputra and Hardinge Bridge (H) in the Ganges.
Currently, the latency in data product processing and release consists of a nominal time delay of the GRACE Level-1 instrument data (11 days) and of the derived monthly global Level-2 gravity field products (60 days). Temporal sampling is at best 7–10 days, but most reliably 1 month, caused by a need to accumulate GRACE observations over this time period. Both latency and temporal averaging currently limit the potential use of the GRACE Level-3 products (i.e., TWSAs) for flood monitoring and early-warning systems. Daily GRACE gravity field solutions based on a Kalman filter approach (Kurtenbach et al., 2012) have been validated against ocean signals in the Antarctic circumpolar current, which showed the possibility of detecting high-frequent ocean mass variations (Bergman and Dobslaw, 2012). Recently, Sakumura et al. (2016) proposed a method for improved high-frequency signal capture via a regularized sliding window mascon (RSWM) product, which approximates a daily GRACE solution using a moving weighting scheme of 21 adjacent days of observational data, with about 10 days' delay.

Figure 3Daily and monthly water storage anomalies of the GFZ RBF solution for the Ganges–Brahmaputra Delta on (a) 11 July 2004, (b) 24 July 2004, (c) 31 July 2004 and (d) July 2004. Key is as in Fig. 2.
For the first time, this study presents a hydrological evaluation of daily GRACE gravity field solutions based on a Kalman filter approach, which are scheduled for an operational run in 2017 with a time delay of just 5 days, in part enabled by quick-look Level-1 data with a time delay of 1 day (made available on request by NASA Jet Propulsion Laboratory (JPL)), by comparing the time series to observed river runoff in the Ganges–Brahmaputra Delta (GBD) under flood conditions. The world's largest river delta, situated at the confluence of two river systems with a combined discharge surpassed only by the Amazon and the Congo, is subject to short-lived flooding throughout summer and early autumn each year. In a typical year, 20–30 % of Bangladesh, which occupies most of the GBD, can be inundated for days during the monsoon, mostly in low-lying fields (Steckler et al., 2010). Major flooding events occur with a return period of 4–5 years (Hopson and Webster, 2010), causing widespread devastation in this densely populated part of the world. Two of these major flood events coincide with the GRACE mission's lifetime (March 2002–present). In July 2004, the Brahmaputra exceeded critical flood levels twice in a fortnight, inundating 38 % of the country (Best et al., 2007). In July and September 2007, two separate major flood peaks in the Brahmaputra caused inundation lasting weeks, affecting 42 % of the country (Islam et al., 2010).
2.1 Computation of daily GRACE Solutions
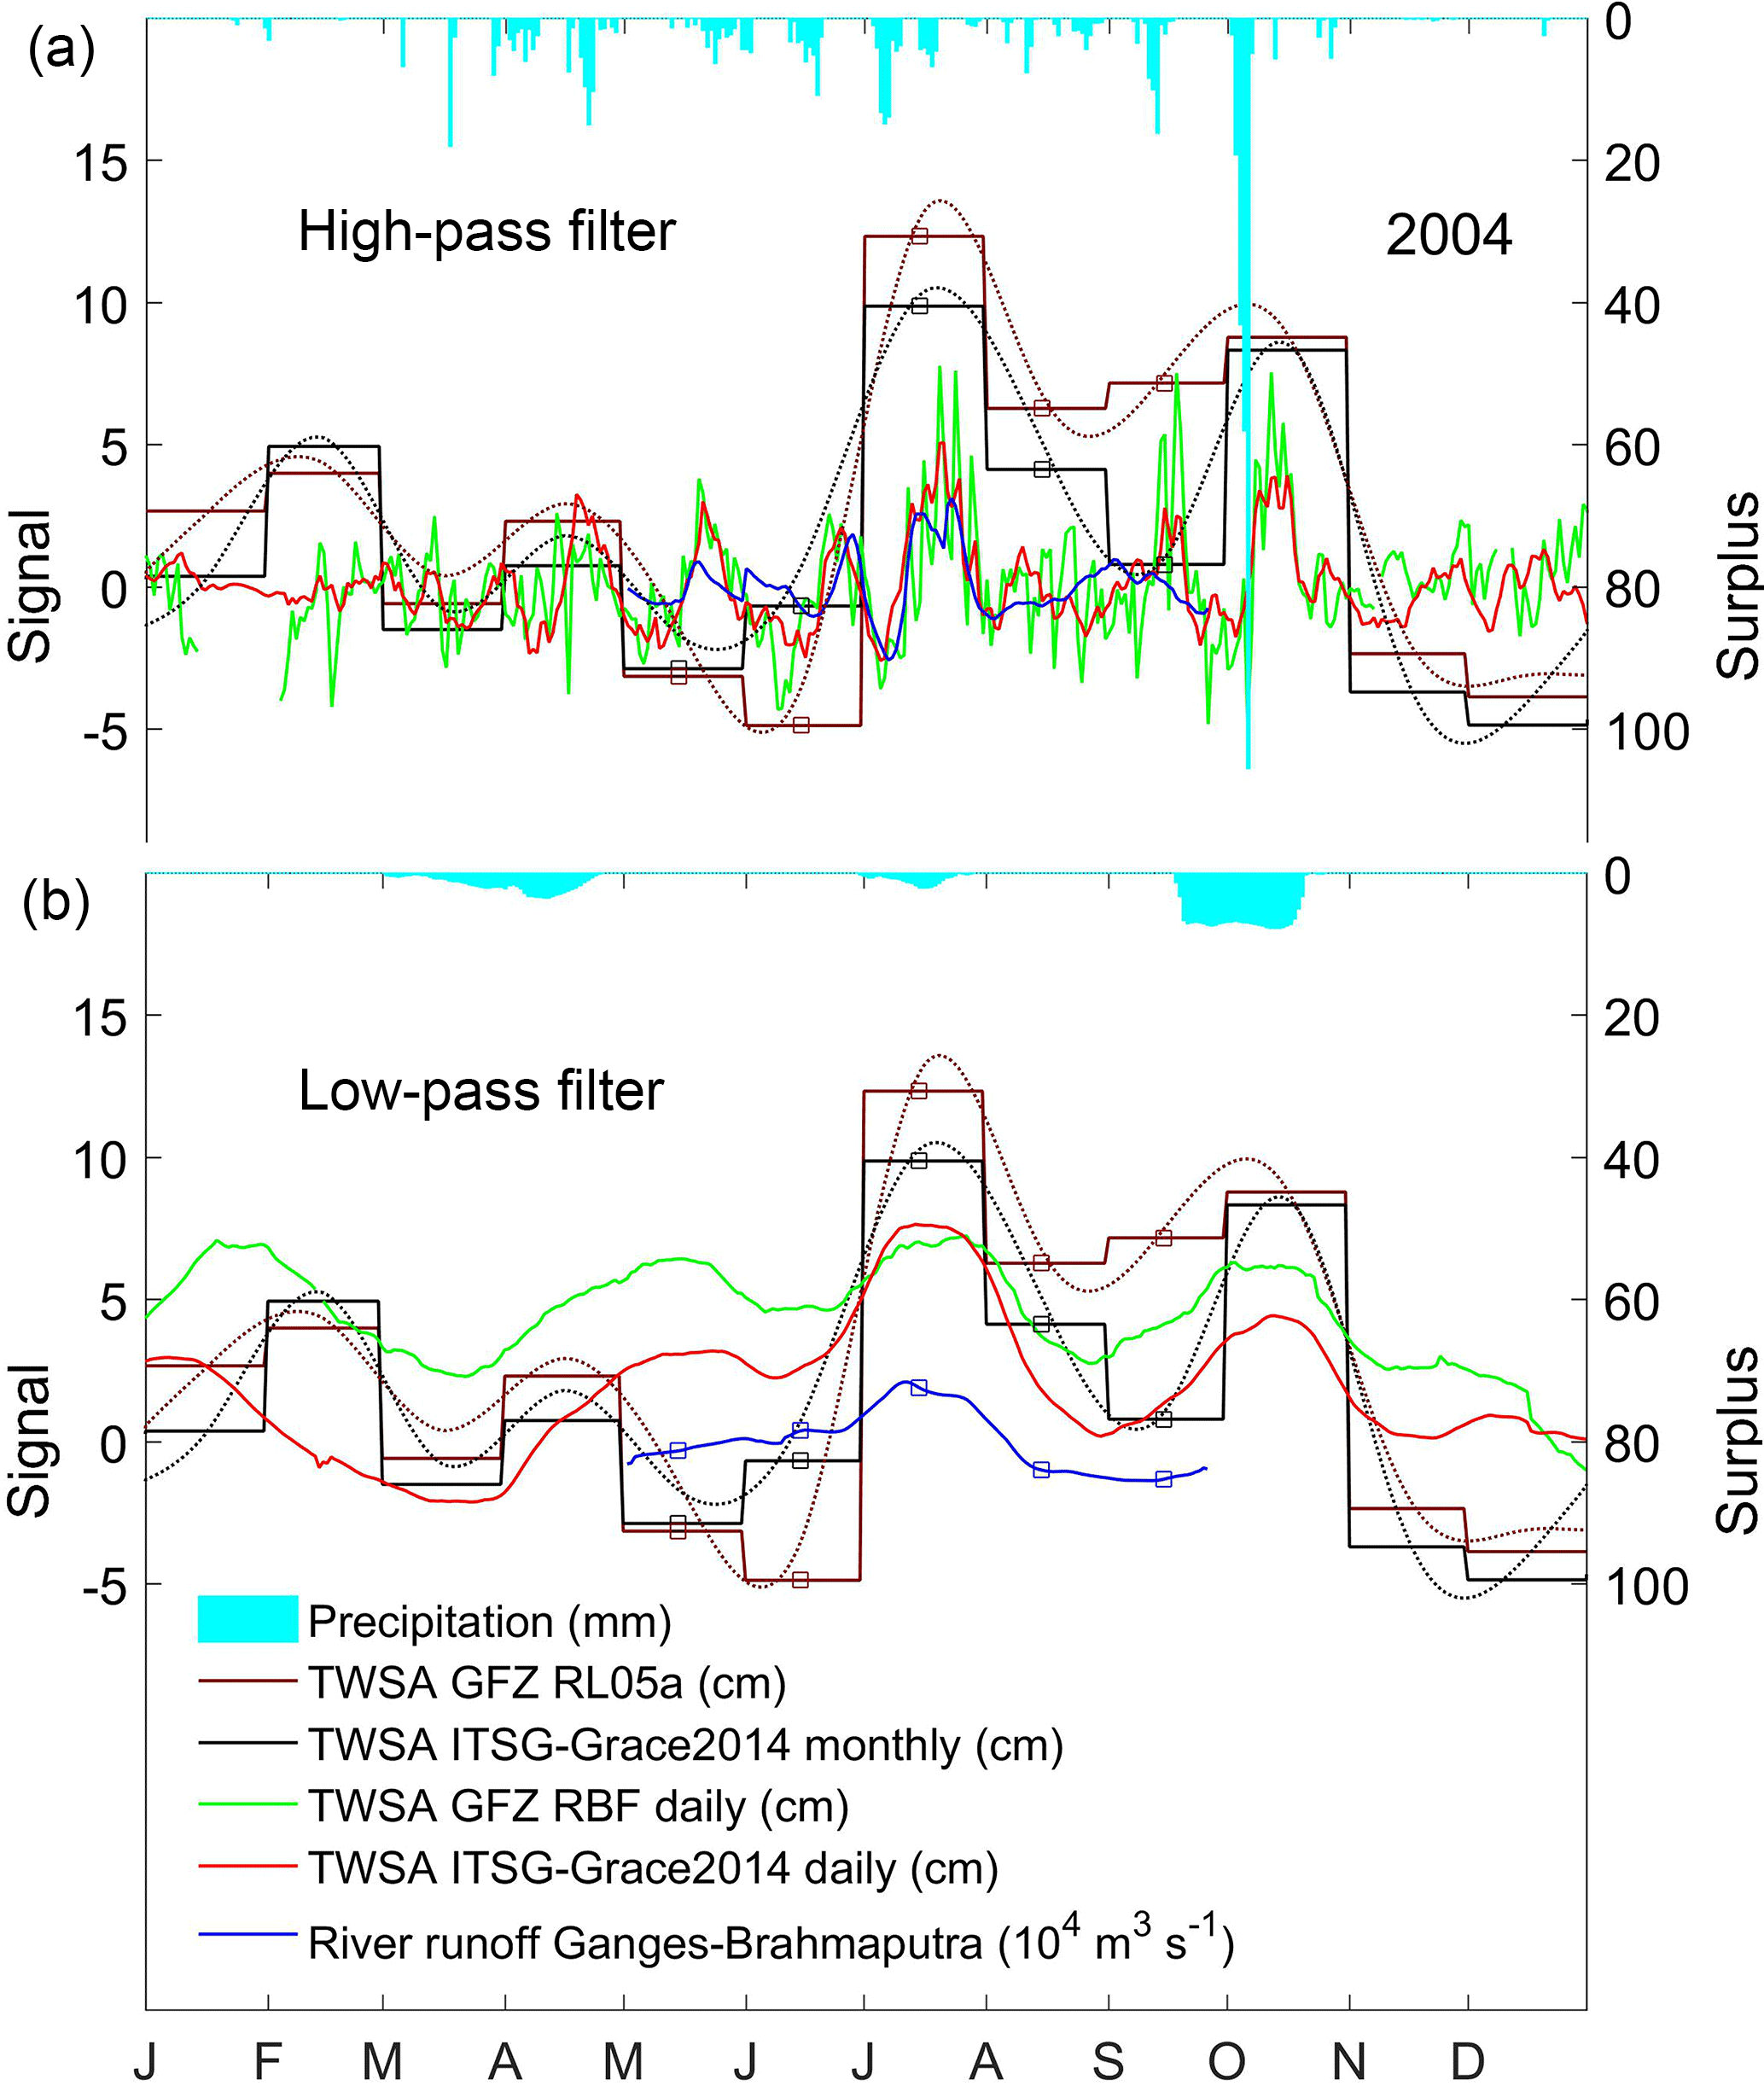
Figure 4Daily and monthly area mean GRACE total water storage anomalies (TWSAs) and daily river runoff (left axis) together with the precipitation surplus (right axis) for the GBD in 2004. The daily data are separated into a high-frequency (a) and a low-frequency signal (b) by means of a 31-day high-pass filter. A series of cubic spline interpolations (dotted line) is fitted to the monthly solutions (step line). The squares represent (the number of) monthly values. The low-frequency signals and the monthly solutions have the mean seasonal cycle removed.
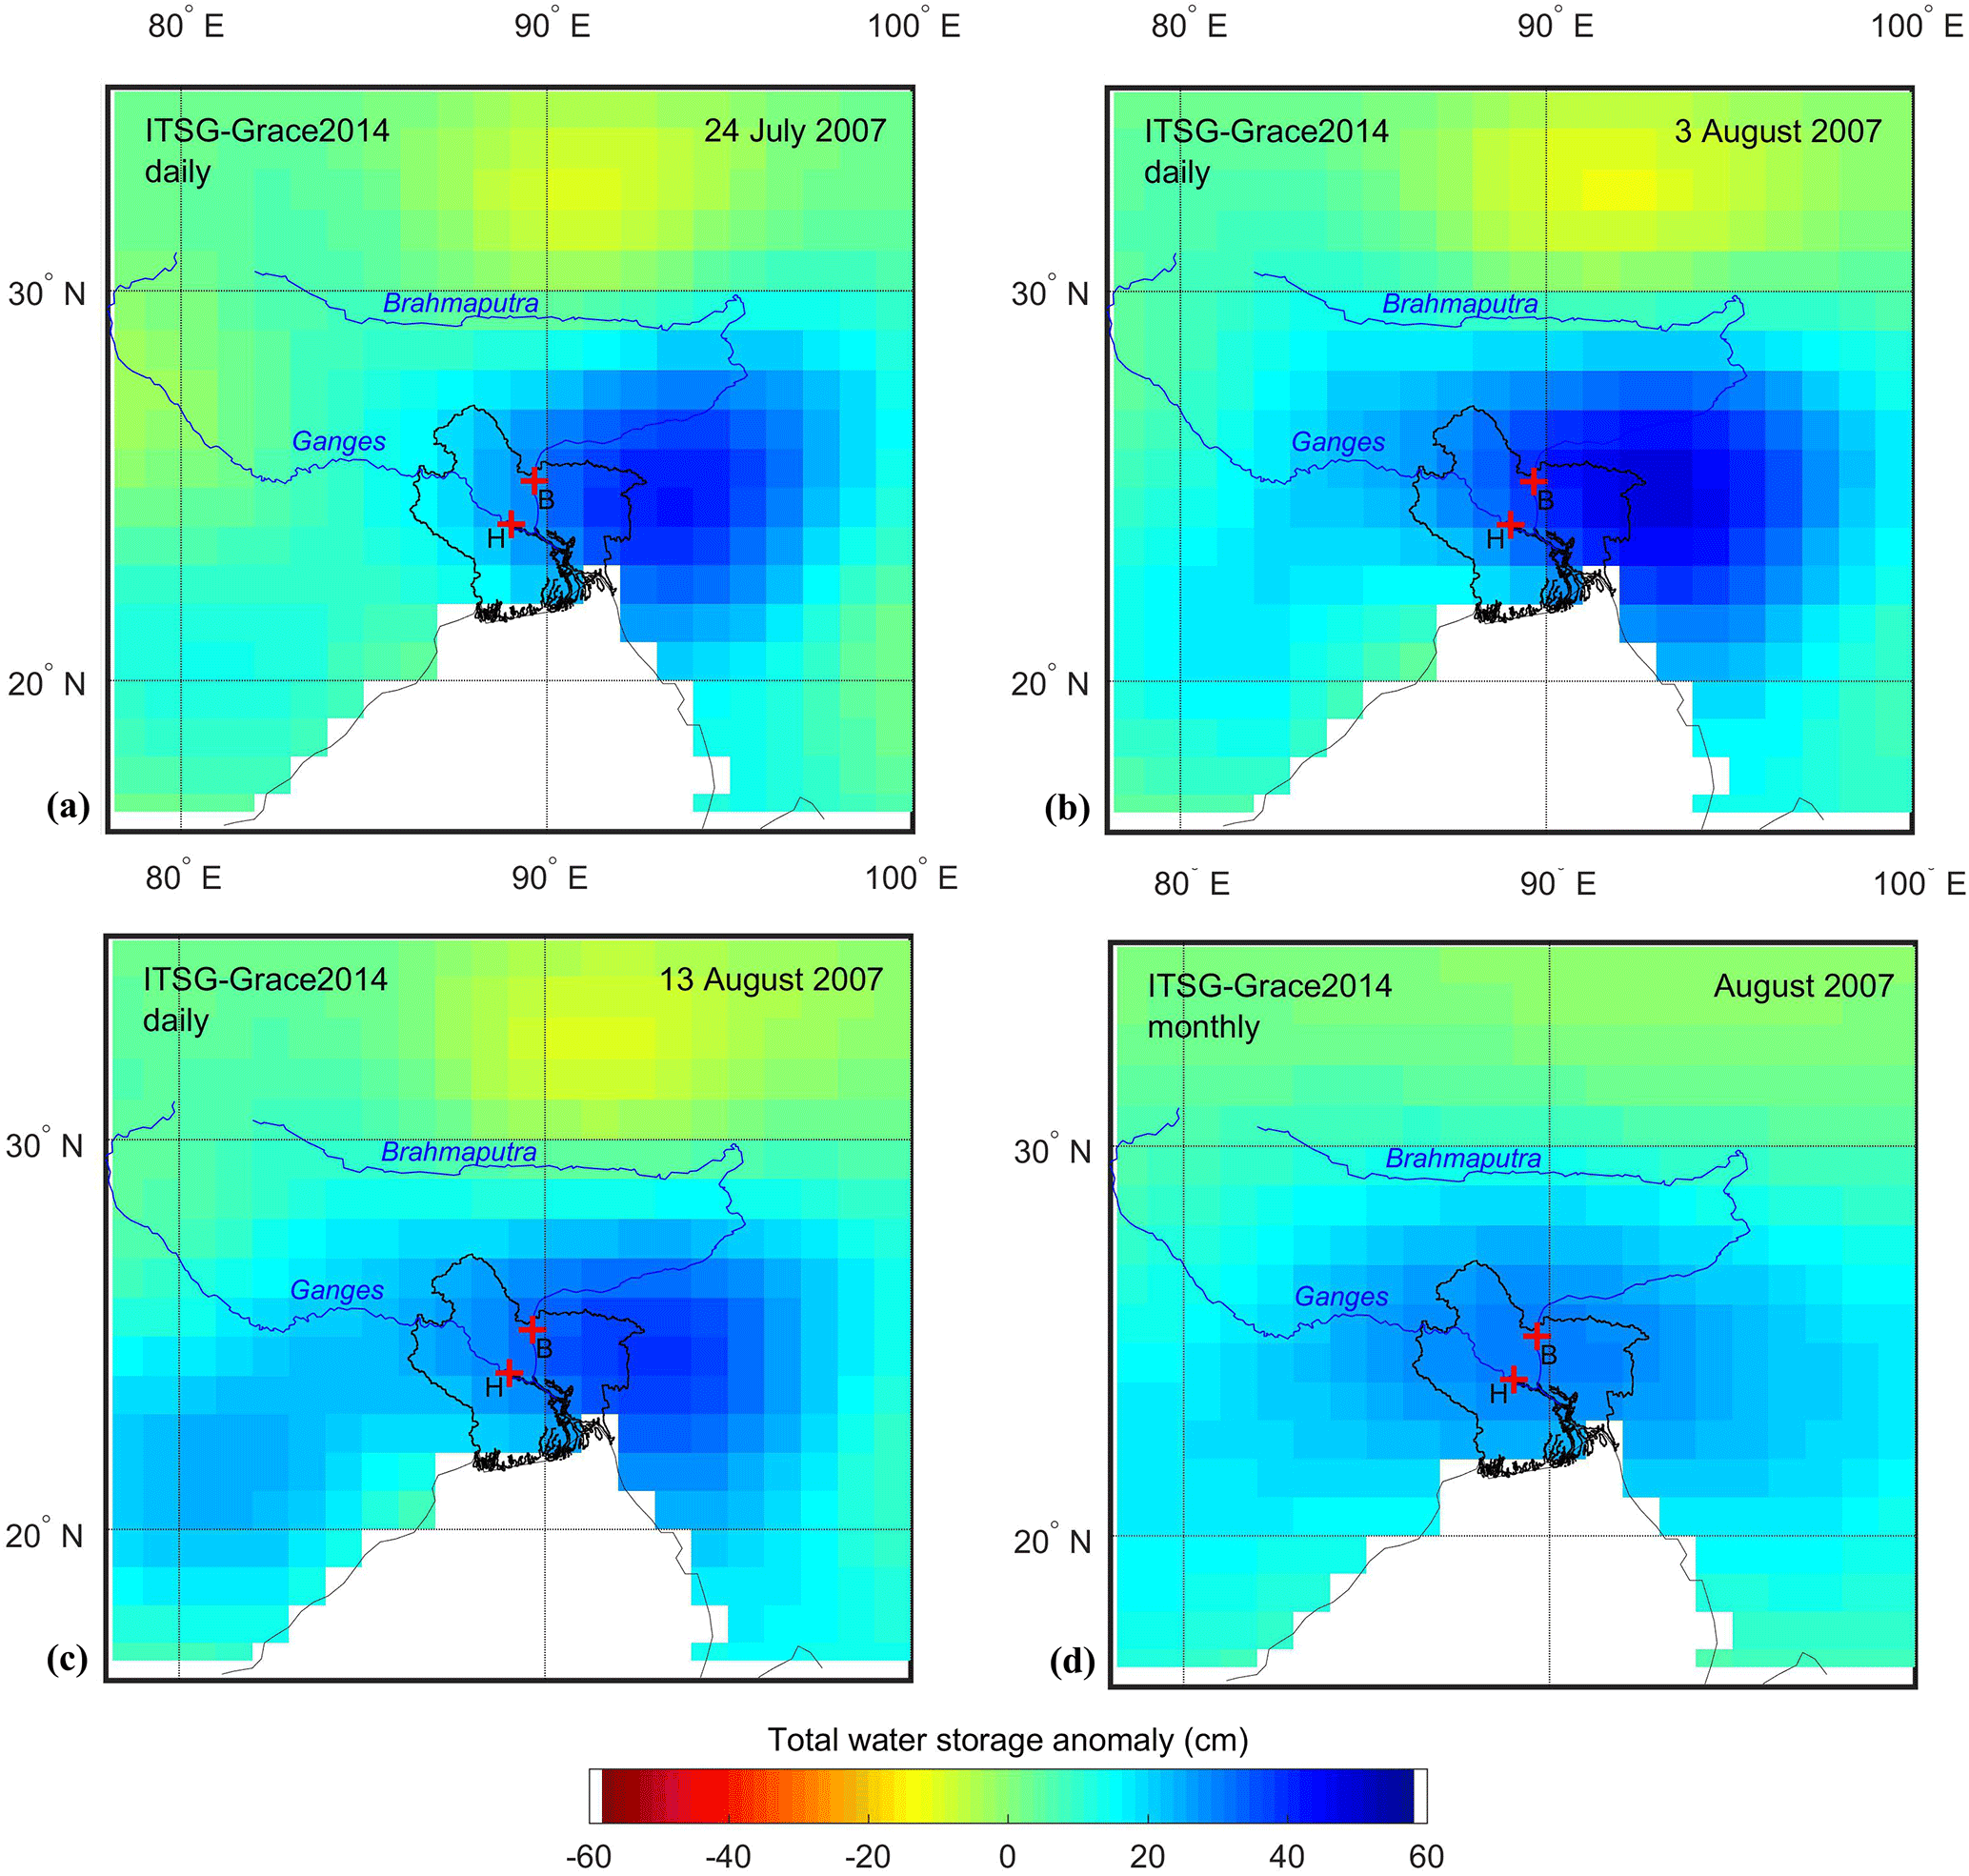
Figure 5Daily and monthly water storage anomalies of the ITSG-Grace2014 solution for the Ganges–Brahmaputra Delta on (a) 24 July 2007, (b) 3 August 2007, (c) 13 August 2007 and (d) August 2007. Key is as in Fig. 2.
Compared to monthly solutions, the limited spatial coverage within 1 day does not allow for the GRACE satellite constellation to observe the full gravity field signal alone. Limited spatial sampling in an east–west direction means that GRACE data contribute little to no information to potential coefficients with orders higher than approximately 15. It is therefore necessary to introduce additional information to obtain reliable estimates of the full global gravity field signal. Applied to the determination of daily gravity field variations, this means that information on how the variable gravity field evolves with time is required. Since geophysical processes are not random, one can assume that the Earth's time-variable gravity field does not change arbitrarily from one day to the next. Kurtenbach et al. (2012) proposed to model this temporal evolution as a first-order Markov process, which can be fully described by its auto- and cross-covariance. Applied to daily GRACE solutions, the process to be modeled is the residual gravity field signal that is present in the observations after other effects, such as long-term, secular and nontidal ocean and atmosphere variations, have been reduced. The main geophysical constituents left in the GRACE data are therefore continental hydrology, cryosphere, solid earth and errors in the background models (Kurtenbach et al., 2012). For the daily solutions of the ITSG-Grace2014 release (Mayer-Gürr et al., 2014) used in this analysis, the model output of the updated ESA Earth System Model (Dobslaw et al., 2015) is used to approximate the unknown covariance structure of this residual gravity field signal. The 6-hourly model output is resampled to 1 day using daily averaging. These daily averages are subsequently reduced by their sample mean, trend and annual signal. Finally, the empirical auto- and cross-covariance is computed from the resulting state vectors.
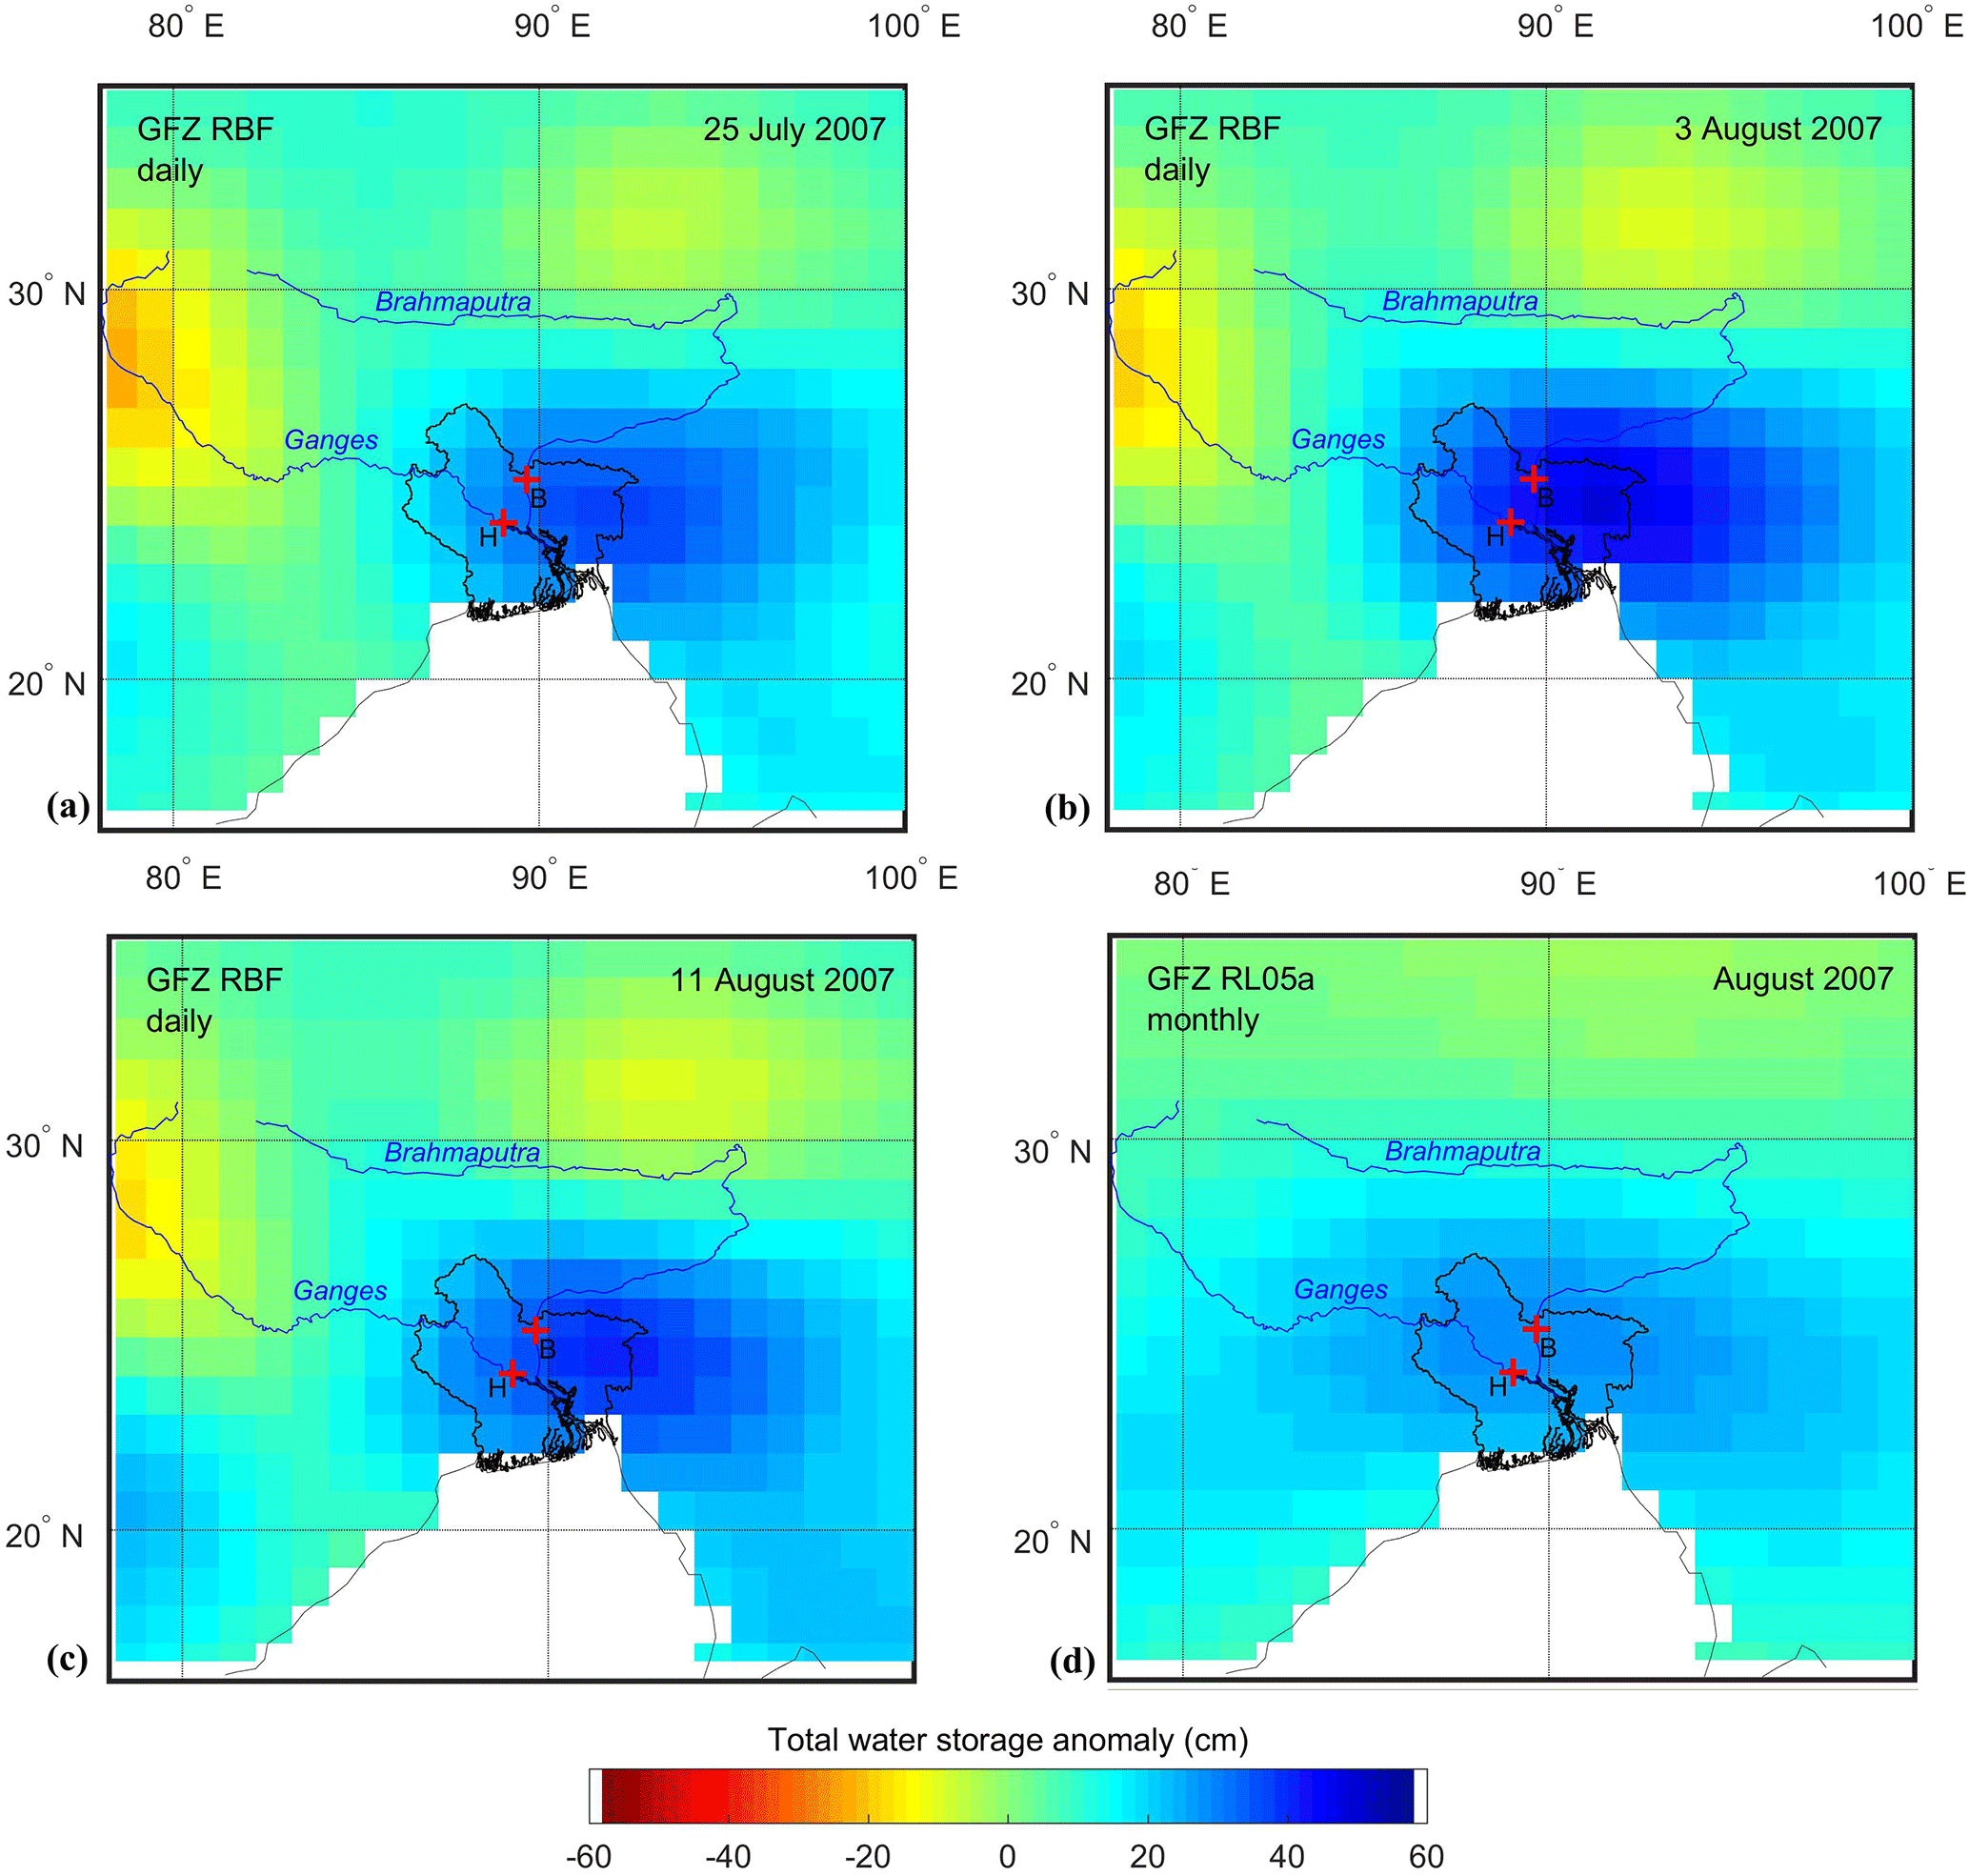
Figure 6Daily and monthly water storage anomalies of the GFZ RBF solution for the Ganges–Brahmaputra Delta on (a) 25 July 2007, (b) 3 August 2007, (c) 11 August 2007 and (d) August 2007. Key is as in Fig. 2.
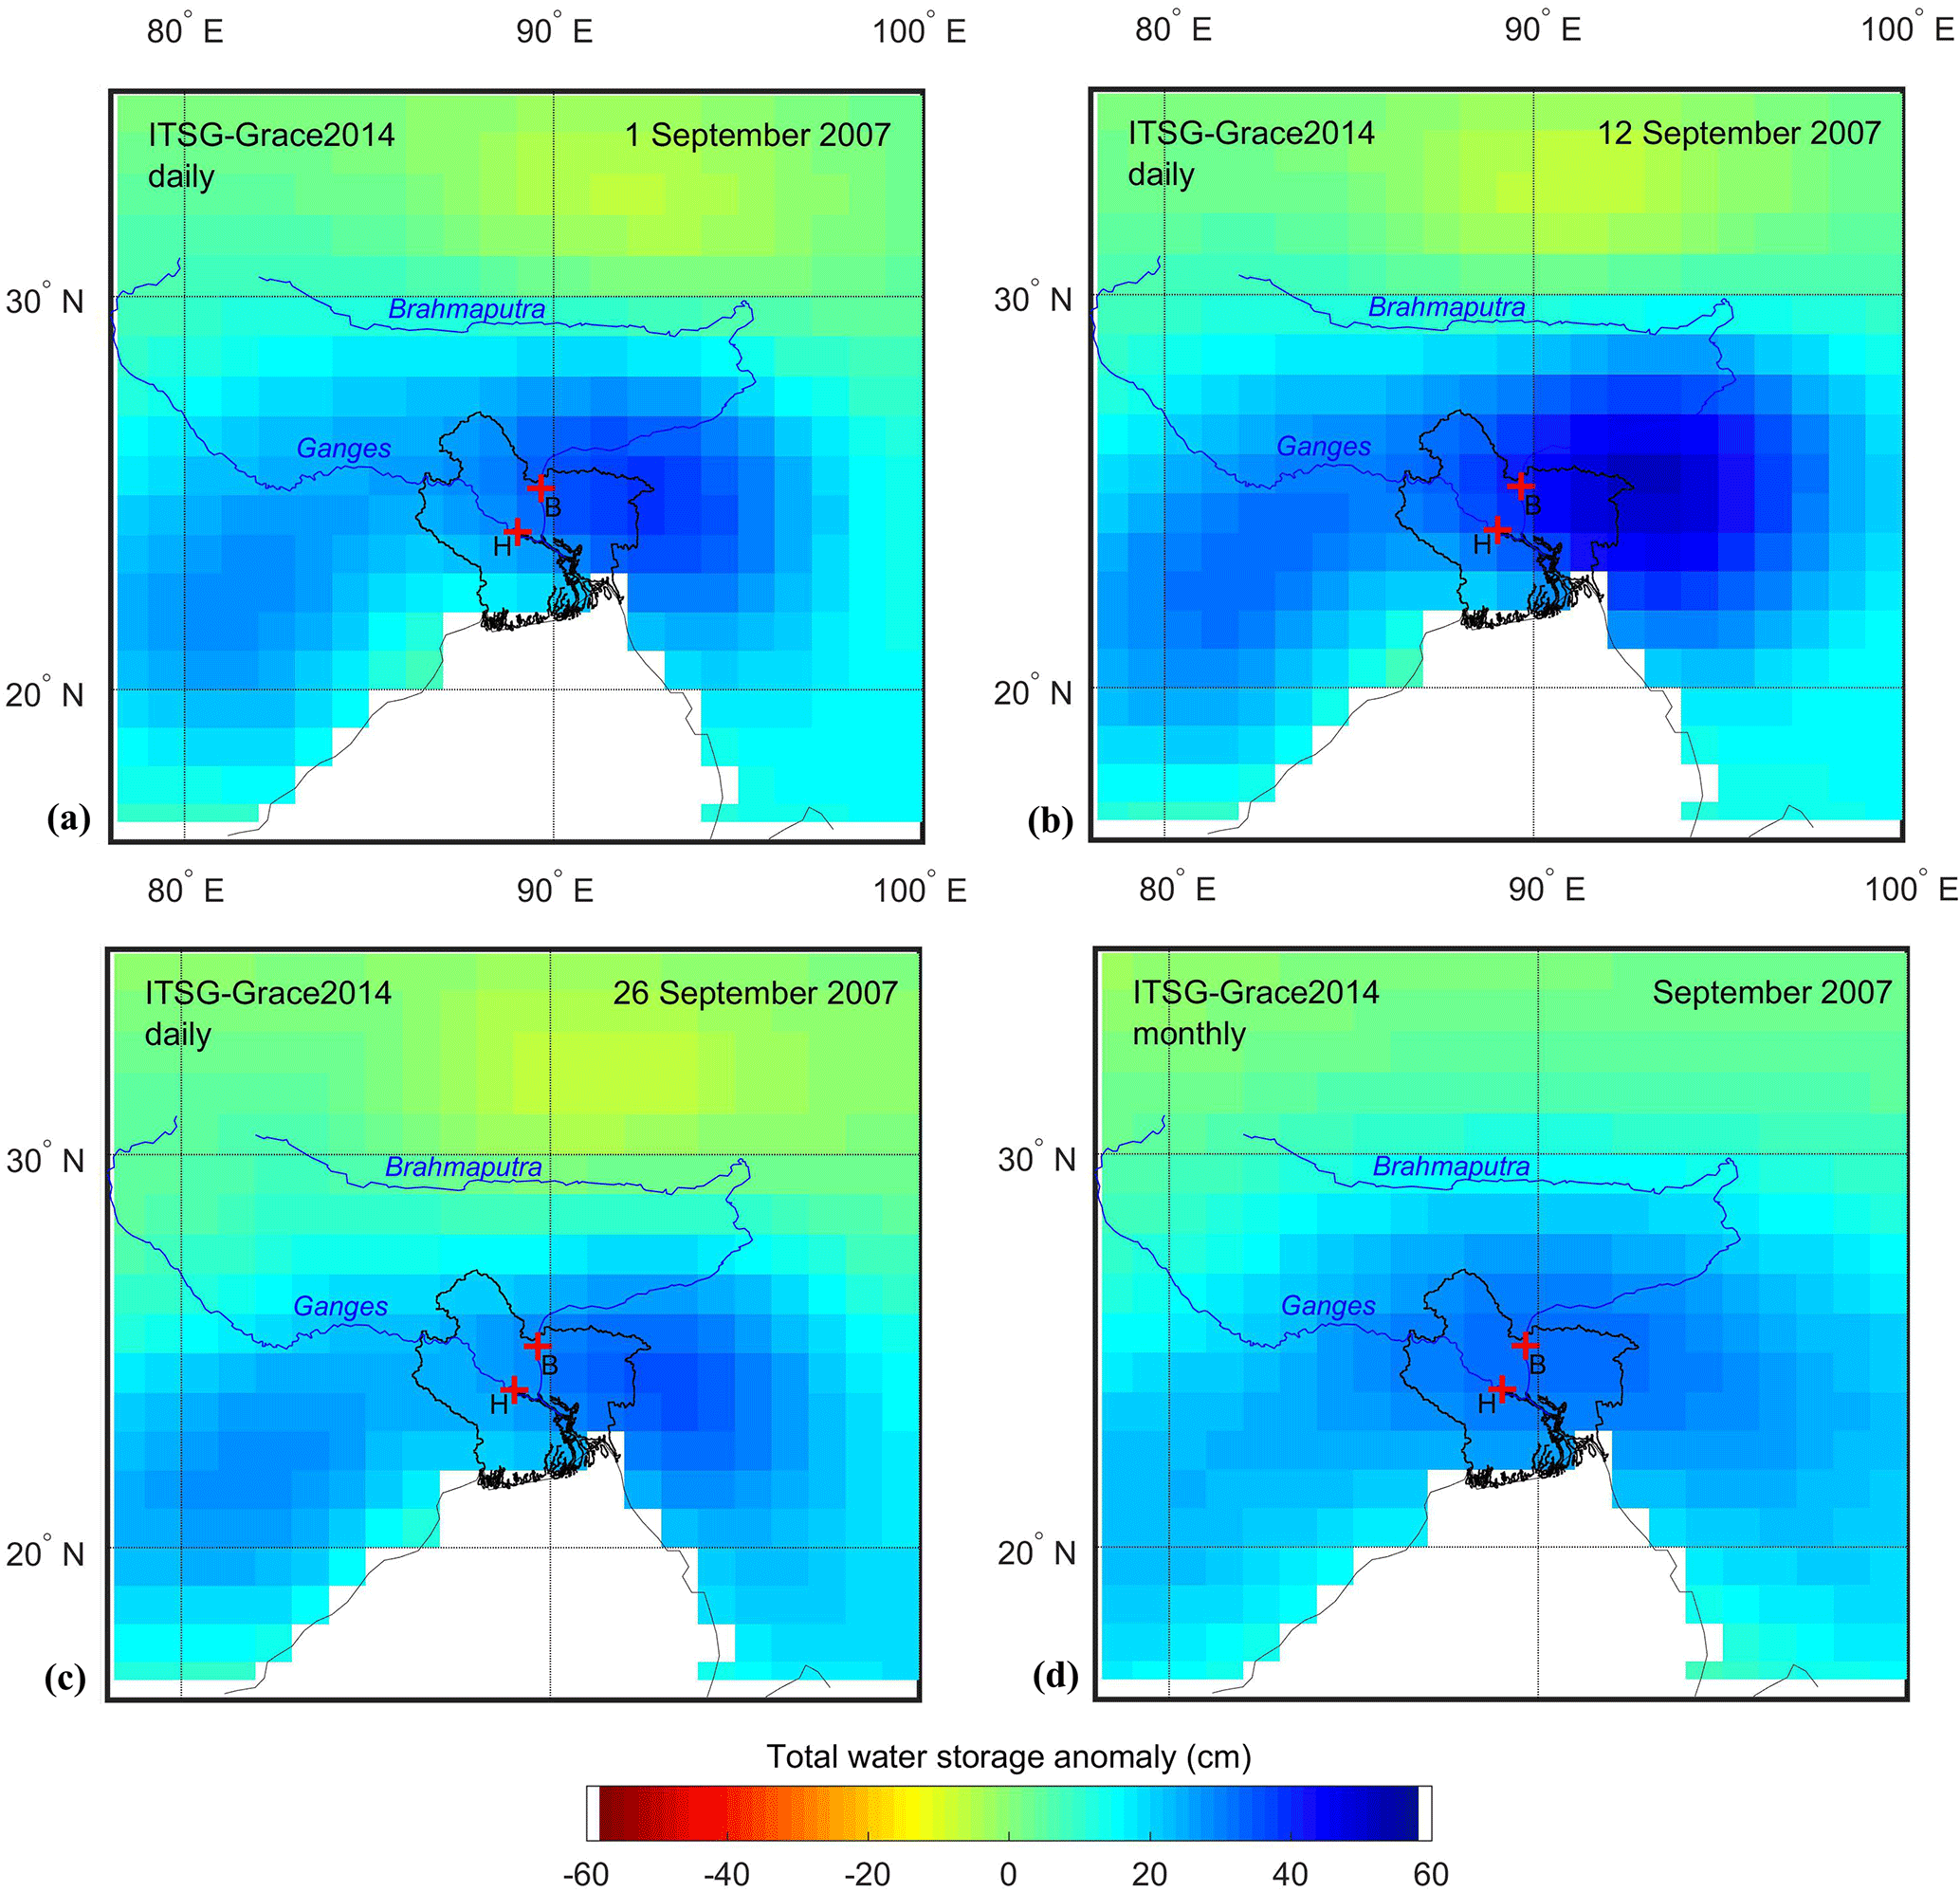
Figure 7Daily and monthly water storage anomalies of the ITSG-Grace2014 solution for the Ganges–Brahmaputra Delta on (a) 1 September 2007, (b) 12 September 2007, (c) 26 September 2007 and (d) September 2007. Key is as in Fig. 2.
Table 1Correlation of daily and monthly TWSAs and daily precipitation with river runoff anomalies in(to) the GBD for the years of major flooding in 2004 and 2007. A high-pass filter (HPF) with a 31-day window separates daily data. The low-pass filter (LPF) component of the filter, the monthly data and a series of cubic spline interpolations (CSIs) fitted to the monthly data have the mean seasonal cycle removed. Pearson's linear correlation coefficient (r), sample size (n) and a (p) value for testing the hypothesis of no correlation are indicated. Time lag, if applicable, is indicated in days in brackets (a positive time lag denotes a delayed river runoff response).
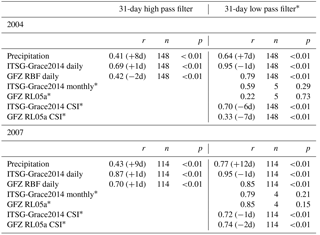
*The mean seasonal cycle has been removed.
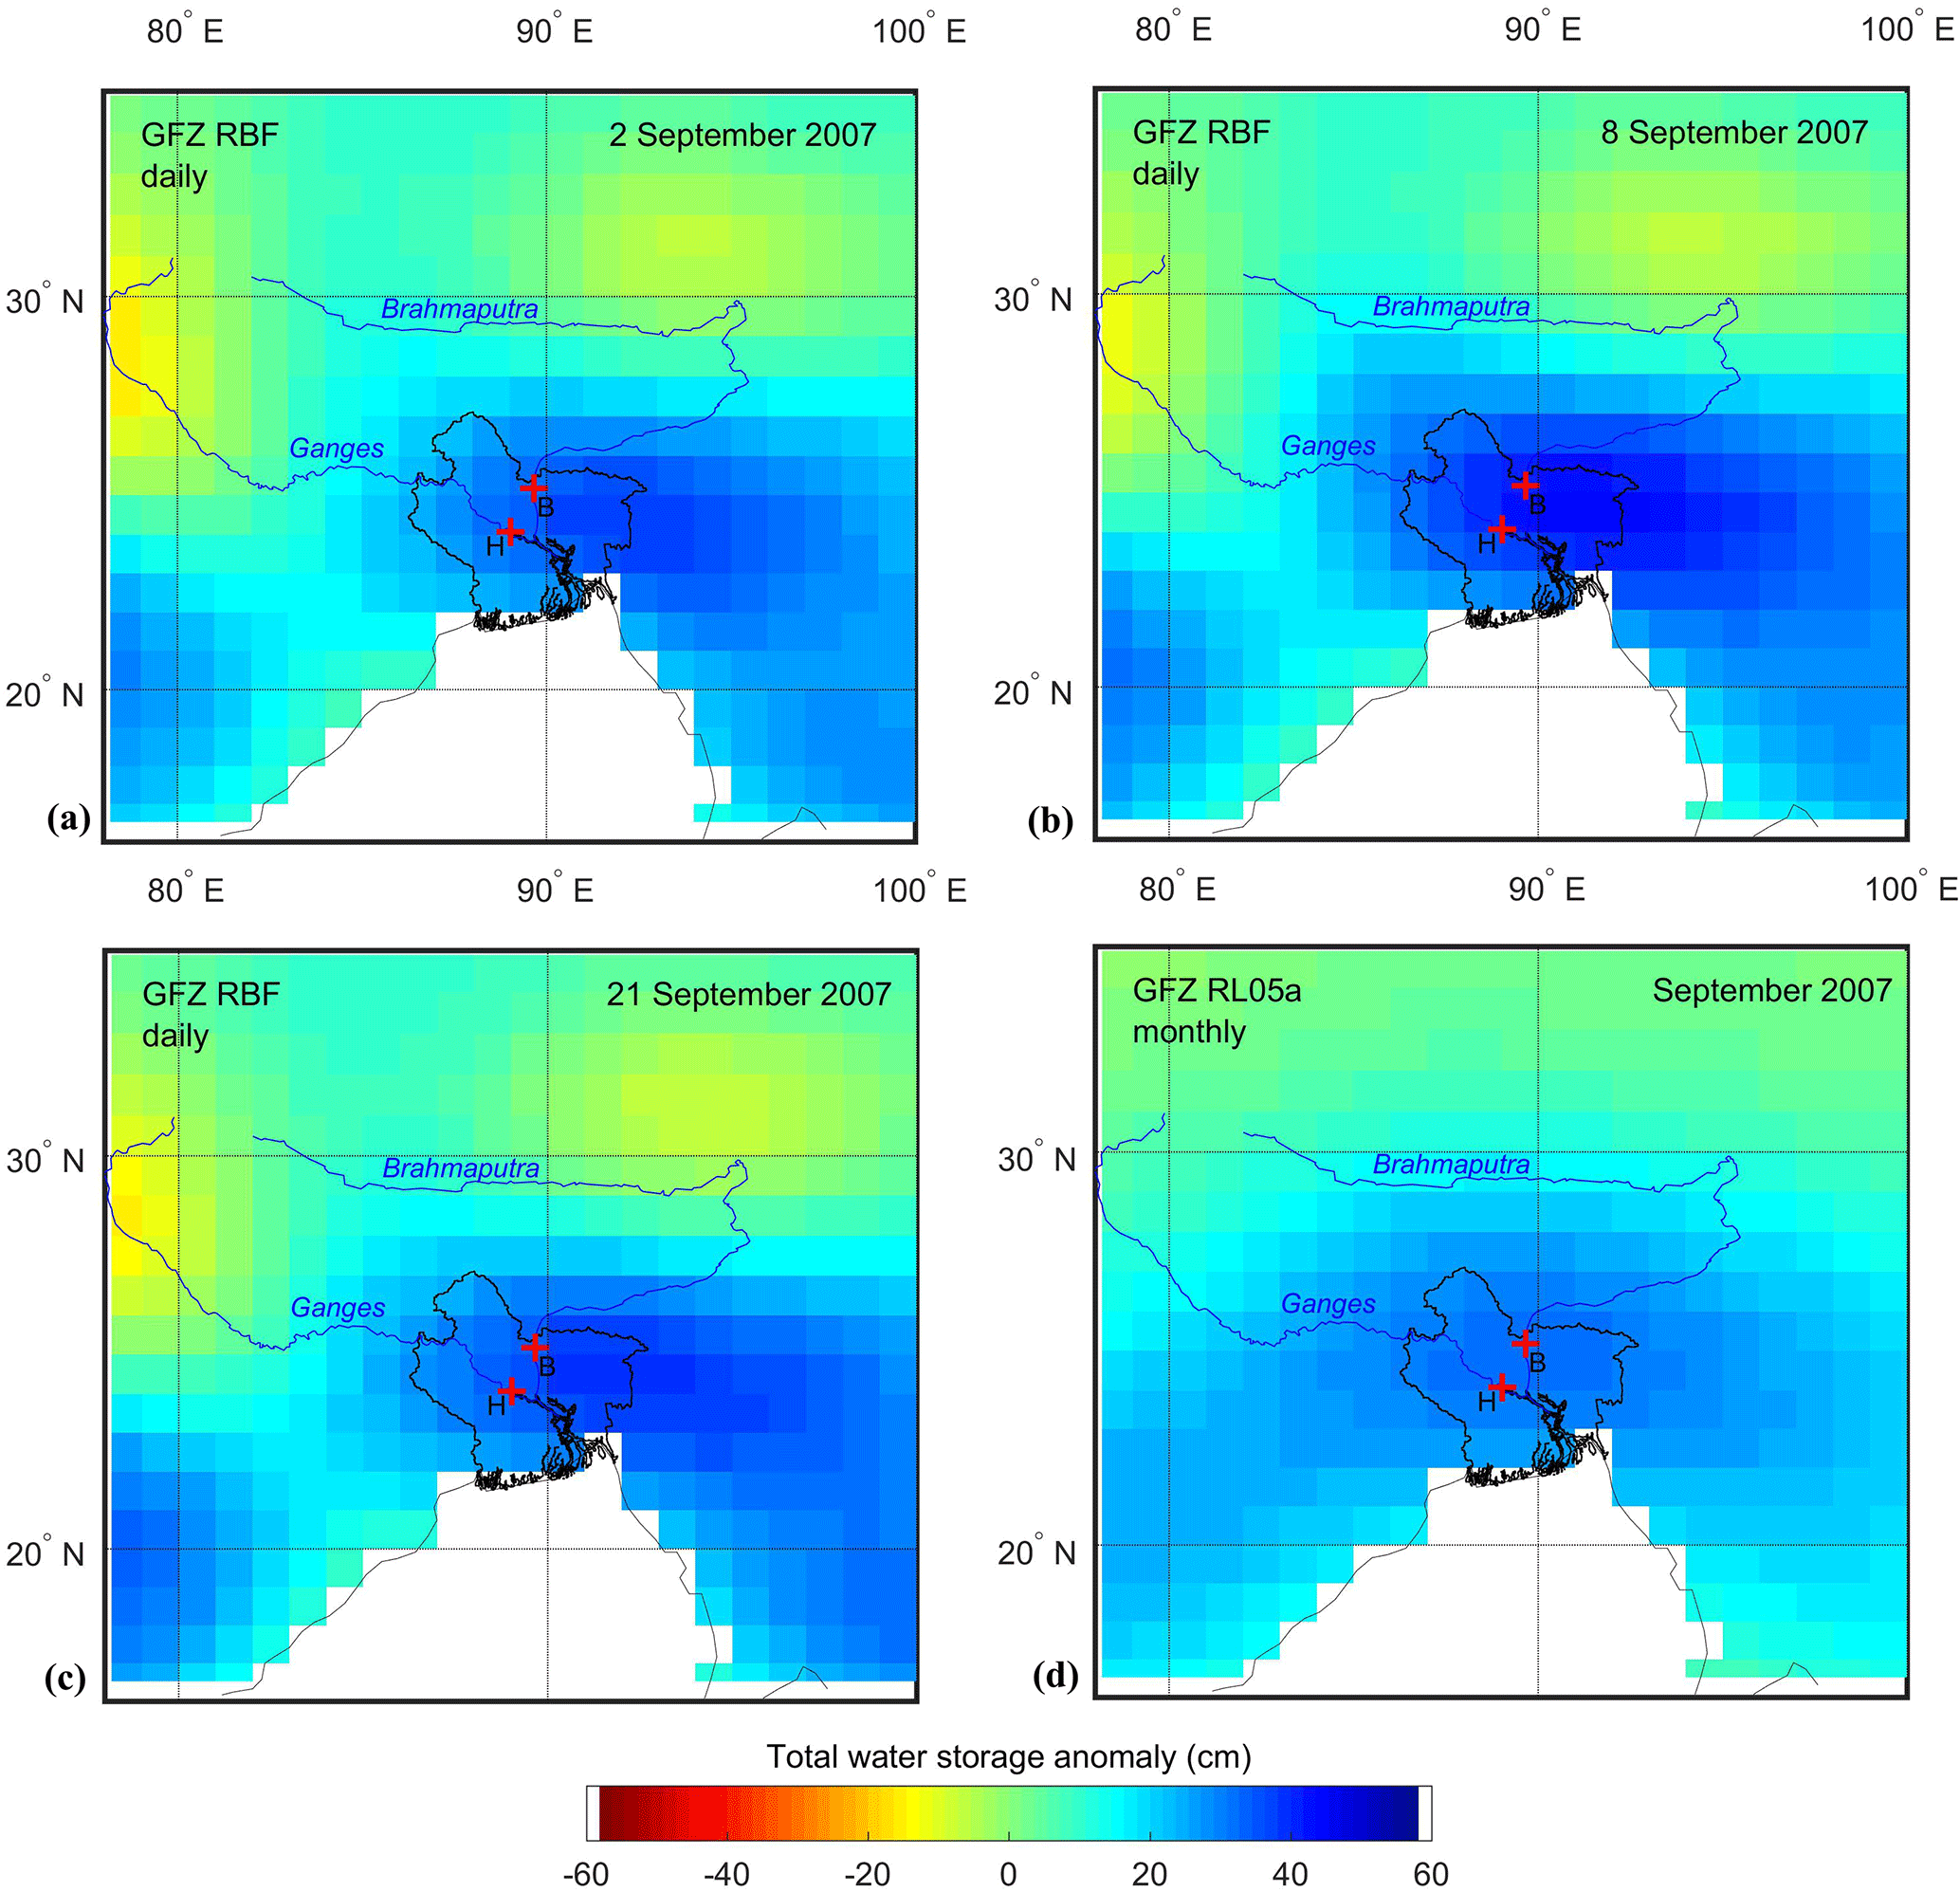
Figure 8Daily and monthly water storage anomalies of the GFZ RBF solution for the Ganges–Brahmaputra Delta on (a) 2 September 2007, (b) 8 September 2007, (c) 21 September 2007 and (d) September 2007. Key is as in Fig. 2.
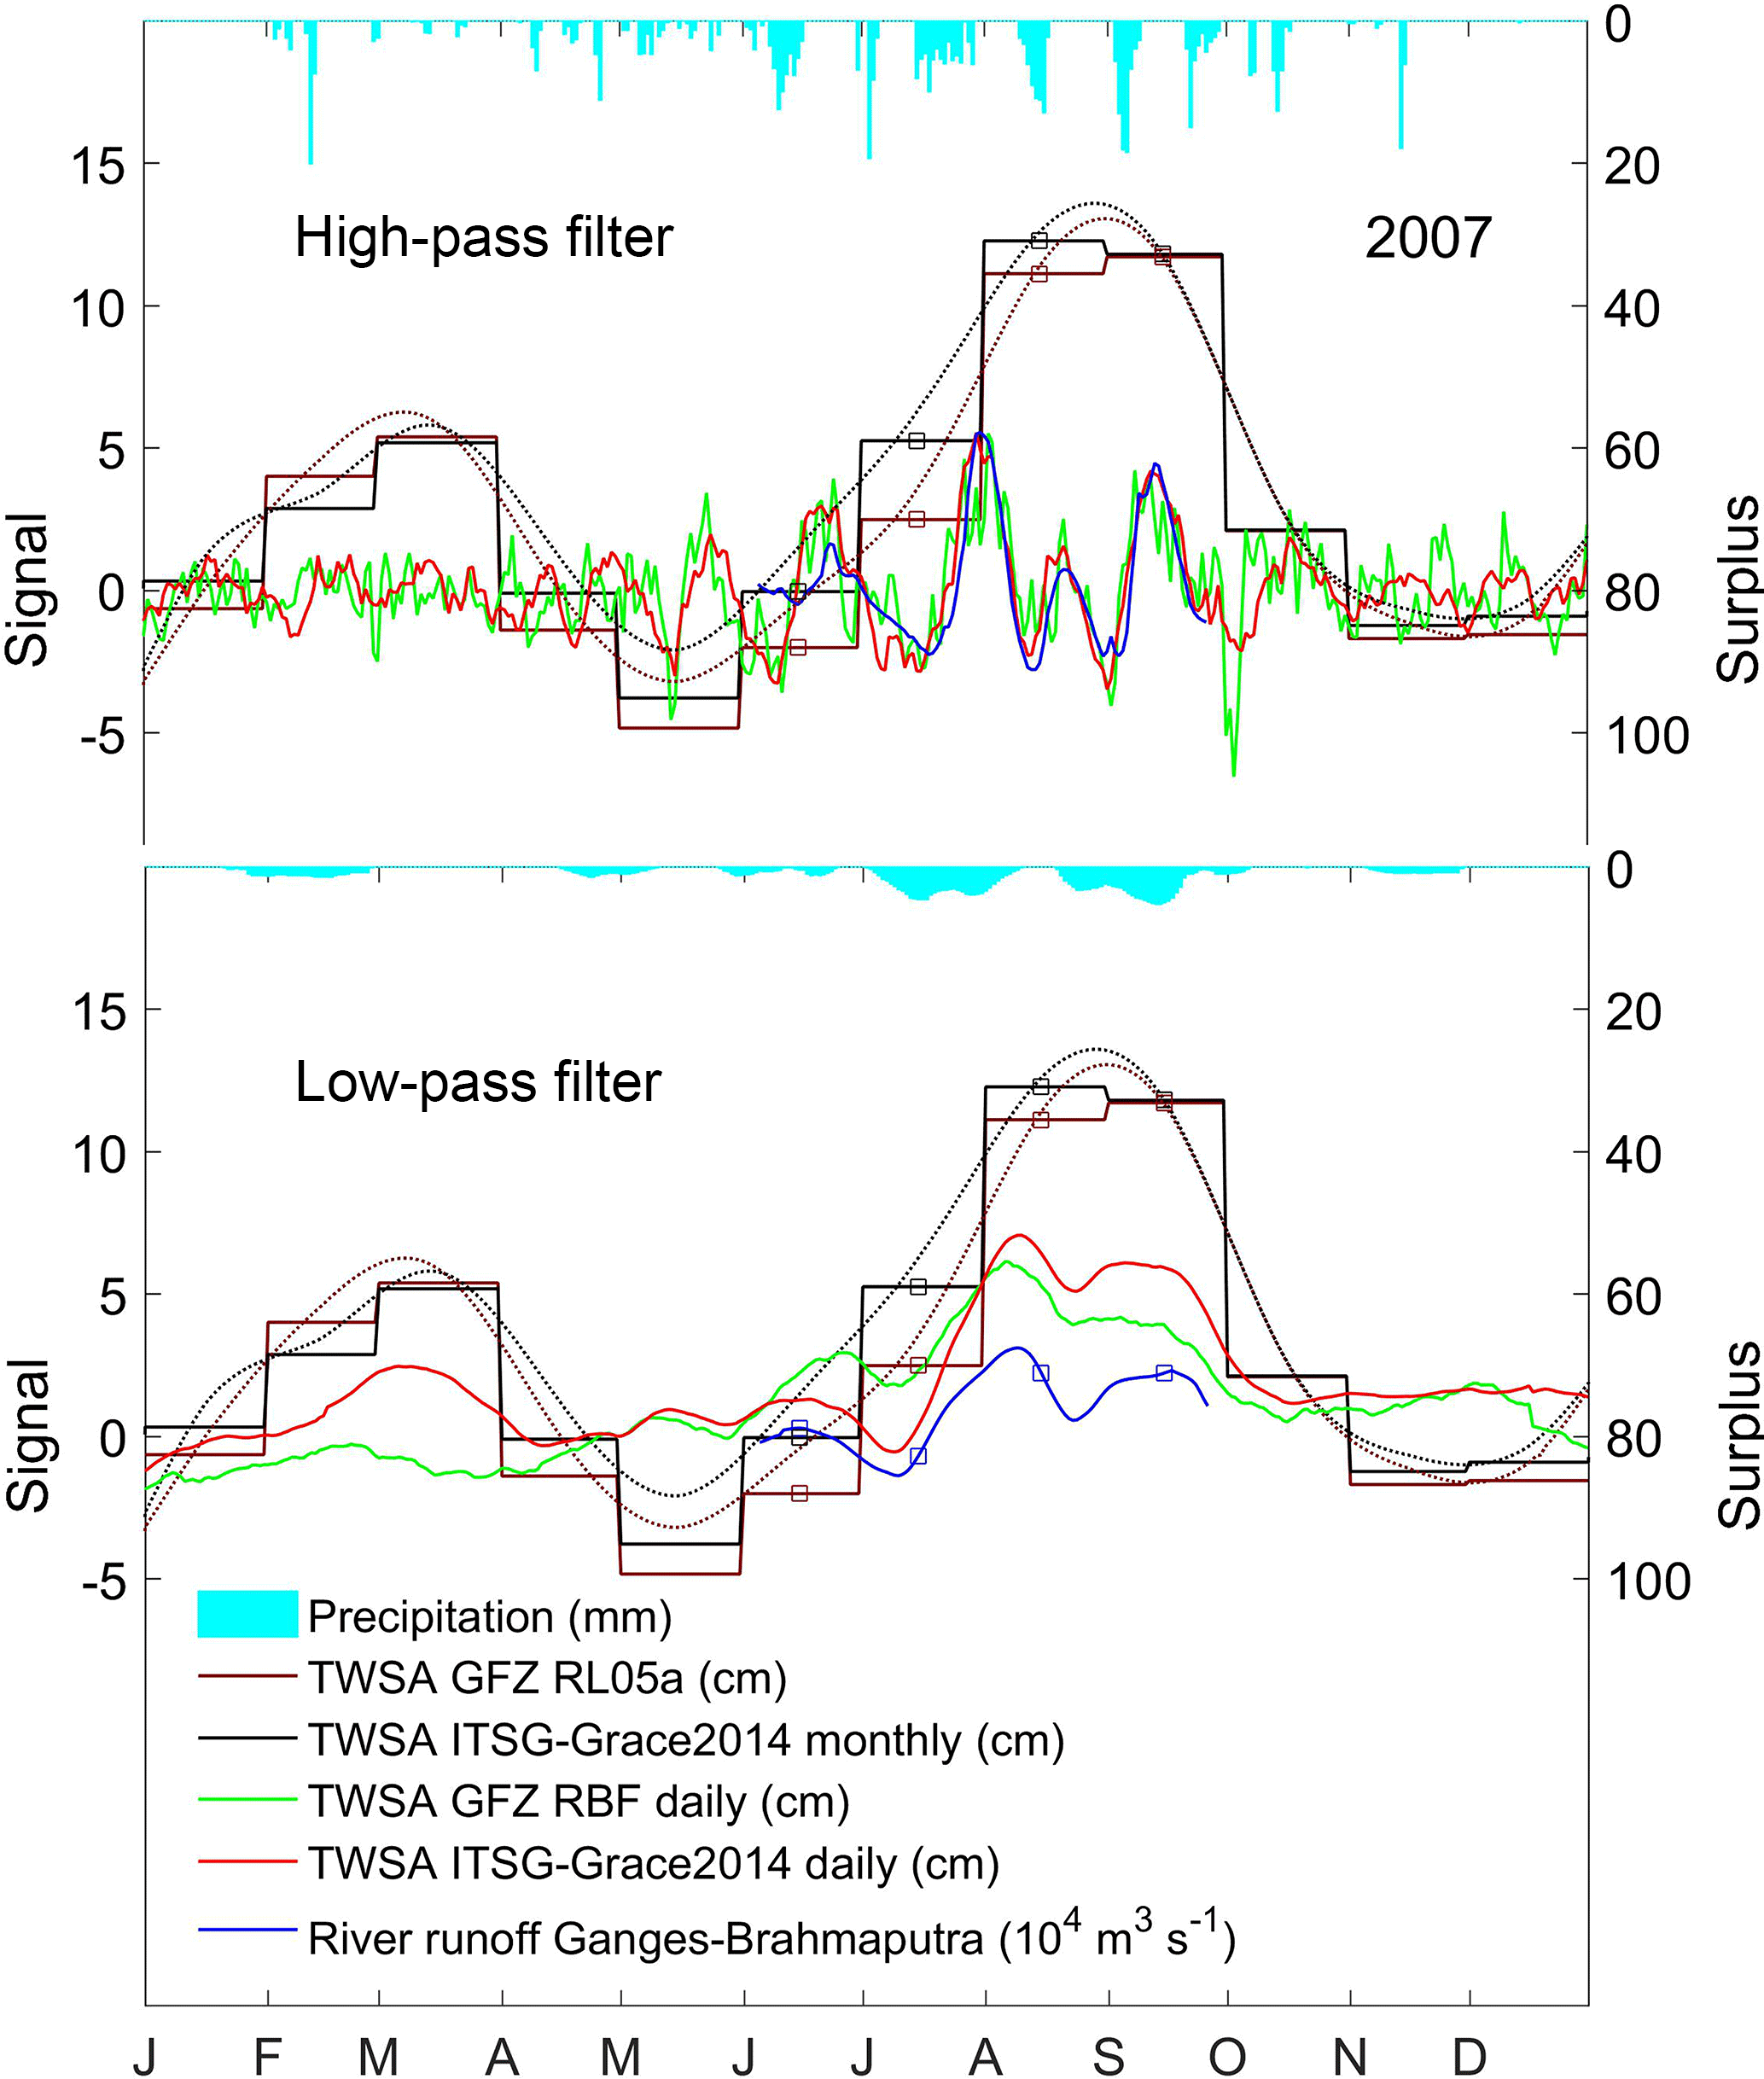
Figure 9Daily and monthly area mean GRACE total water storage anomalies (TWSAs) and daily river runoff (left axis) together with the precipitation surplus (right axis) for the GBD in 2007. Key is as in Fig. 4.
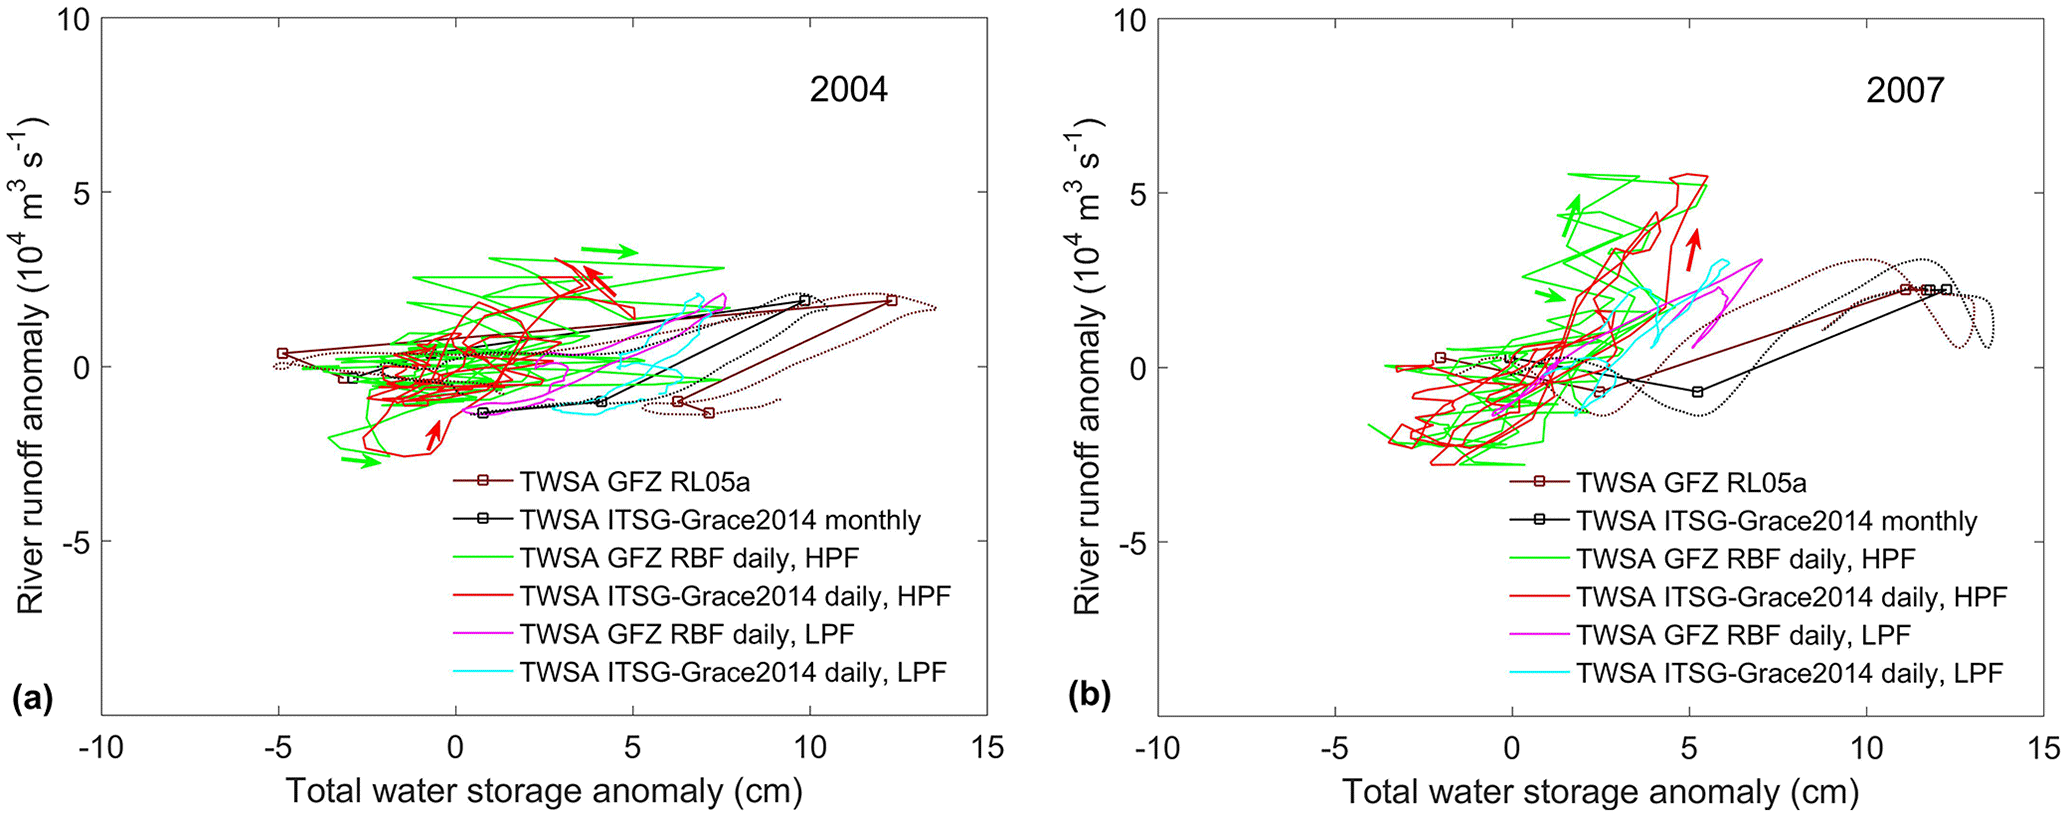
Figure 10Anomalies of river runoff vs. total water storage for (a) 2004 and (b) 2007. A high-pass filter (HPF) with a 31-day window separates daily data into a HPF and an LPF component. A cubic spline interpolation (dotted line) is fitted to the monthly data. The LPF signals and monthly data have the mean seasonal cycle removed. Arrows indicate (local) directions in the HPF signal hysteresis loop.
For the daily GRACE solutions from GFZ, empirical functions for the auto- and cross-covariance matrices are derived from harmonic analysis of WaterGAP Global Hydrology Model (Döll et al., 2003) output and the Atmosphere and Ocean De-aliasing Level-1B (AOD1B) products (Dobslaw et al., 2013), as well as GFZ monthly solutions (Dahle et al., 2012). The GFZ daily solution employs radial basis functions (RBFs) to map the measured GRACE twin-satellite range accelerations into the mass anomaly (or water equivalent) surface layer. Precise dynamic orbits of the satellite trajectories using Global Positioning System (GPS) data complement the microwave measurements of acceleration in the line of sight between the GRACE twin satellites (Gruber et al., 2014).
A widely used tool to combine prior information of the underlying process and measurements of this process is the Kalman filter (Kalman, 1960). Given the previously derived process model, one can predict the Earth's gravity field for the following epoch and compute the corresponding accuracy information using covariance propagation. This prediction is consequently updated by forming a weighted mean between the predicted and observed state, whereby the weights of both observation groups are determined by their respective covariance matrix. For the ITSG-Grace2014 daily solutions (Kurtenbach et al., 2012), the Kalman filter is run in a forward as well as a backward direction. This allows for a smoothed estimate of the state vectors by computing the weighted minimum-variance mean of both time series (Rauch et al., 1965). Since the future purpose of the daily GRACE solutions is an NRT service mode, the GFZ RBF solutions in this study have been processed with the Kalman filter in forward mode only (Gruber and Gouweleeuw, 2018).
2.2 Derivation of gridded water storage anomalies from daily and monthly GRACE solutions
To derive gridded TWSAs from daily and monthly gravity field potential coefficients, the general processing scheme used for the GRACE land water mass grids provided by GRACE Tellus is followed (Swenson, 2012; Landerer and Swenson, 2012). This post-processing scheme can be split into three steps: (1) replace the C20 coefficient (Earth's oblateness), (2) transform the potential coefficients into the center of the Earth by adding degree 1 coefficients and (3) apply a spatial filter to the coefficients.
For the ITSG-Grace2014 daily solution, the C20 coefficient is replaced by linear interpolation of the monthly satellite laser ranging time series provided by Cheng et al. (2011). Similarly, daily degree 1 coefficients are obtained by linear interpolation of the monthly time series provided through Tellus, based on the methodology described in Swenson et al. (2008). The maximum degree used to calculate TWSAs equals 40. Glacial isostatic adjustment (GIA) correction has been applied using the model from A et al. (2013). Since the daily GRACE solutions are constrained within the least squares adjustment, no additional spatial filtering is necessary. For comparison, the monthly solutions of ITSG-Grace2014 (Mayer Gürr et al., 2014), calculated to a maximum spherical harmonic degree of 90, are also considered. Here, the same models as for the daily solutions are applied. However, since the monthly solutions are unconstrained, the coefficients were smoothed by a DDK2 anisotropic filter (Kusche et al., 2009).
The GFZ daily solutions make use of the same models as are used in the post-processing of ITSG-Grace2014, except for degree 1, which is also taken from a satellite laser ranging (SLR) estimate (Cheng et al., 2010). As with the daily ITSG solution, no additional spatial filtering was performed. Due to the parameterization in the spatial domain, no exact maximum degree is given, but the signal content is comparable to the ITSG-2014 daily solution. The monthly solutions from GFZ (RL05a, Dahle et al., 2012), calculated to a maximum spherical harmonic degree of 90, are corrected using the same models, and a DDK2 filter is applied. Both daily and monthly solutions are then propagated to TWSAs on a 1∘ × 1∘ grid (∼ 100 km at 25∘ latitude). The actual spatial resolution of the gridded TWSAs, however, is lower, with approximately 330 and 500 km for monthly and daily solutions, respectively.
3.1 Process dynamics
To illustrate the possible impact of the process dynamics that may originate from the hydrological models on the daily Kalman GRACE solutions, three different daily gravity time series are computed using stochastic information from three different models, i.e., the WaterGAP Global Hydrological Model (WGHM), the Land Surface Discharge Model (LSDM) and the Global Land Data Assimilation System (GLDAS), respectively. The GRACE observational data input is identical for each time series. It can therefore be assumed that differences in the gravity field time series are caused by the different predictors only. Figure 1a–c show the water storage variability and the differences between the three hydrological/land surface models and the three daily GRACE solutions computed using the stochastic information of these models as well as the differences between the GRACE solutions and the hydrological models. For each time series, secular and annual variations are removed. The results show that, first, the differences between the three hydrological models may vary as much as the variability of the daily signal simulated by each hydrological model alone (Fig. 1a). Secondly, the difference between the daily GRACE solutions (Fig. 1b) is consistent and relatively low, while the variability of each daily GRACE solution alone is consistent and relatively high. Finally, the difference between a daily GRACE solution and a particular hydrological model varies for each hydrological model, but is consistent for any of the three daily GRACE solutions (Fig. 1c). It is therefore concluded that there is hardly any model-specific information left in the daily GRACE solutions and that the information from the actual GRACE observations clearly dominates.
3.2 The 2004 flood
Figures 2 and 3 show a succession of daily GRACE TWSAs for ITSG-Grace2014 on (a) 13 July, (b) 21 July and (c) 27 July 2004 and for GFZ RBF on (a) 11 July, (b) 24 July and (c) 31 July 2004, respectively, together with (d) the monthly ITSG-Grace2014 and GFZ RL05a gravity field solution for July 2004, respectively. The sampling dates are chosen such that they represent the (local) peaks in the respective (high-pass filter, HPF) daily gravity time series corresponding with discharge peaks. Elevated daily TWSA values for the larger GBD (∼ 210 000 km2 area, including Bangladesh and parts of northeast India) on these dates show a progression of widespread flooding in the delta within half a month (a) just before, (b) during and (c) after peak flooding, which cannot be resolved temporally in (d) the monthly solutions. Partly due to temporal averaging and the different filtering techniques (see above), the signal amplitude of the daily and monthly gravity field solutions also cannot be compared directly. For example, lower TWSAs in the monthly solutions may be partly due to post-processing (filtering) of the GRACE observations, resulting in signal attenuation (Kusche et al., 2009). Different process dynamics, which are also partly reflected in different noise levels, cause the daily solutions to peak on different days. Spatially, the GFZ RBF solution shows more variation between the three daily snapshots, while high TWSA values are slightly more focussed. All solutions, however, show comparable spatial patterns of increased TWSAs along the Brahmaputra northeast of the GBD. Flood stages were reached between 10 and 26 July 2004 in the Brahmaputra at Bahadurabad (B) river runoff station, while the Ganges at Hardinge Bridge (H) did not reach critical flood levels (Hopson and Webster, 2010).
Figure 4 shows time series of area mean values of daily and monthly GRACE TWSAs and observed daily river runoff anomalies, together with the daily precipitation surplus. The added value of the daily GRACE solutions is demonstrated by means of a HPF with a near-monthly (31-day) window (upper panel). The HPF is applied to daily anomalies (mean reduced) of total water storage, river runoff and precipitation for the period between 2003 (start of the record of daily GRACE solutions) and 2009 (end of daily river runoff record). The remaining part of the daily time series, the low-pass component of the filter (LPF), is also shown (lower panel), together with a series of cubic spline interpolations (both panels, dotted line) fitted to the monthly GRACE gravity field solutions (both panels, step line). The LPF and monthly time series have the mean seasonal cycle (2003–2009) removed in order to focus on the sub-seasonal anomalies. To facilitate comparison with area mean TWSAs, the observed daily river runoff at the two stations is combined. Daily precipitation is taken from the WFDEI (WATCH Forcing Data methodology applied to ERA-Interim data) dataset (Weedon et al., 2014), using Global Precipitation Climatology Centre (GPCC) precipitation totals. The precipitation surplus, computed as an area mean for the GBD, represents the positive HPF signal (upper panel). The HPF river runoff signal peaks on 23 July, coinciding with the reported flood stage of the Brahmaputra at Bahadurabad station between 10 and 26 July (Hopson and Webster, 2010). The HPF water storage signals of ITSG-Grace2014 and GFZ RBF peak 2 days earlier and 1 day later, on 21 and 24 July, respectively. Correlation, expressed as Pearson's linear correlation coefficient (r), between the HPF signals of precipitation (surplus) and river runoff anomalies (Table 1) is strongest during a period in which the seasonally corrected LPF signals of the daily GRACE solutions increase and peak, from mid-June to the end of July (r=0.62 (p<0.01) at a 9-day time lag). This also applies to the HPF signals of river runoff and water storage anomalies (r=0.89 (p<0.01) at a 2-day time lag and r=0.60 (p<0.01) at a 1-day time lag for ITSG-Grace2014 and GFZ RBF, respectively). The short time lag in the maximum correlation of the HPF signals indicates that part of the river runoff does not enter longer term floodplain or subsurface stores during this time, but is transported through the GBD and discharged into the ocean. The strong correlation of the HPF signals of precipitation, runoff and storage during this period suggests river runoff and precipitation contribute to flooding not only when regional water storage peaks, but also shortly prior to that, when the available stores are still filling up. A successive drop in the level of regional water storage, manifested by a decrease of the LPF signal of the daily GRACE solutions, is reflected in a weaker correlation of the HPF signals of precipitation, runoff and storage. River runoff data are missing to evaluate the correlation for another period of increased regional water storage, which coincides with a period of extreme precipitation surplus, with a peak of 106 mm on 6 October.
3.3 The 2007 flood
The Brahmaputra exceeded critical flood levels at Bahadurabad during two distinct periods in 2007, i.e., 26 July–6 August and 8–17 September (Hopson and Webster, 2010). As in 2004, the Ganges at Hardinge Bridge did not reach critical flood levels. Figures 5 and 6 show a sequence of daily GRACE TWSAs for ITSG-Grace2014 for the first flood peak on (a) 24 July, (b) 3 August and (c) 13 August 2007 and for GFZ RBF on (a) 25 July, (b) 3 August and (c) 11 August 2007, respectively, together with (d) the monthly ITSG-Grace2014 and GFZ RL05a gravity field solutions for August 2007, respectively. Figures 7 and 8 show a sequence of daily GRACE TWSAs for ITSG-Grace2014 for the second flood peak on (a) 1 September, (b) 12 September and (c) 26 September 2007 and for GFZ RBF on (a) 2 September, (b) 8 September and (c) 21 September 2007, respectively, together with (d) the monthly ITSG-Grace2014 and GFZ RL05a gravity field solutions for September 2007, respectively. Again, the series of daily snapshots reflect the progression of flooding in the delta (a) just before, (b) during and (c) after peak flooding, which is beyond the temporal resolution of (d) the monthly solution. As in 2004, the two daily solutions do not necessarily peak on the same day (second flood peak), while spatial patterns of peak TWSAs show slightly different areas of concentration.
Figure 9 shows time series of the area mean values of daily and monthly GRACE TWSAs and observed daily river runoff anomalies, together with the daily precipitation surplus. The high-pass filtered daily gravity field solutions clearly reflect the two peaks of the HPF daily river runoff anomalies on 31 July and 13 September, and a smaller peak in between on 21 August.
As in 2004, correlation between the HPF signals of precipitation (surplus) and river runoff anomalies (Fig. 9, upper panel) is strongest during a period in which the LPF signals of the daily GRACE solutions peak (r=0.61 at an 8-day time lag). In 2007, however, the period of strong correlation is defined by a flattened peak, during which water storage plateaus and which lasts from the end of July to mid-October, with only a small drop around 23 August. Similarly, the correlation between the HPF signals of river runoff and water storage anomalies peaks during this period (r=0.95 and r=0.77 at a 1-day time lag for ITSG-Grace2014 and GFZ RBF, respectively). This indicates that the available water storage in the area is close to capacity during an extended period of time (∼ 2 months) and additional inputs of runoff and precipitation can only be stored in the river during this time. The stronger correlation of anomalies of water storage with river runoff into the GBD than with precipitation within the GBD suggests that river runoff is a stronger driver for major flooding than precipitation in the GBD, particularly for the 2007 flood (Steckler et al., 2010; Islam et al., 2010). Both in 2004 and 2007, water storage increases slightly before river runoff, possibly due to the large GRACE satellite footprint, which detects increasing water storage in the upstream reaches of the Brahmaputra and Ganges rivers earlier than recorded as runoff at the gauges (see e.g., Fig. 2).
The strong correlation of the seasonally corrected low-frequency signals (Fig. 9, lower panel and Table 1) indicates that river runoff (volume of ∼700 and ∼770 km3 for 2004 and 2007, respectively) also contributes predominantly to sub-seasonal storage variations (∼100 and ∼110 km3 for 2004 and 2007, respectively), while correlation with precipitation in the GBD (∼450 and ∼ 475 km3 for 2004 and 2007, respectively) is weaker. This corresponds with the results of the HPF signals for 2004 and suggests that river runoff into the GBD and, to a lesser degree, precipitation within the GBD not only trigger major flooding when water stores in the region have already been filled and peak, but they also contribute to creating these conditions for flooding. Table 1 further shows that the correlation of the LPF signal of the daily GRACE solutions with runoff exceeds that of the monthly GRACE data, including the fitted series of cubic spline interpolations. The stronger correlation indicates that the seasonally corrected LPF signal contains additional information at this frequency compared to the DDK filtered monthly GRACE data. A similar result for the 2004 flood is reported by Sakumura et al. (2016), who found good agreement of the signal amplitude at (sub-)seasonal frequencies for their RSWM product with in situ data and the Center of Space Research (CSR) RL05 monthly solutions.
For both floods, the added value of the daily GRACE solutions is further illustrated in Figs. 4 and 9. Although phase and amplitude differ, the dynamics of the series of cubic spline interpolations (CSIs, dotted line) fitted to the monthly GRACE solutions (step line) are comparable to that of the LPF signal of daily GRACE solutions and river runoff anomalies in 2004 (Fig. 4, lower panel). In 2007, the CSI series resolve the flood as a single event, while the LPF signal of daily GRACE solutions is able to distinguish the two flood peaks (Fig. 9, lower panel). Additionally, the HPF signal of the daily GRACE solutions (upper panels) is able to capture the HPF signal of the river runoff anomalies, particularly during the period in which regional water storage is filling up and peaks (2004) or plateaus (2007).
This is further illustrated in Fig. 10, which shows the frequency-separated anomalies of river runoff vs. total water storage in the GBD for the flood years of 2004 and 2007 (Riegger and Tourian, 2014; Reager et al., 2015; Sproles et al., 2015). Generally, the hypothesis that storage can drive river runoff tends to indicate a slower process evolution through subsurface water storage and baseflow generation, expressed by a strong correlation at longer (monthly) timescales. Daily HPF runoff is expected to be less correlated with and more variable than daily HPF storage, caused by precipitation that runs off quickly and does not enter storage for a significant amount of time. The fact that there is still a strong correlation between daily HPF storage and HPF river runoff, particularly for the 2007 flood (Table 1), points towards a scenario of increased storage in the river itself, in which the variation of daily total water storage reflects the inflow of river water into the delta. This water inflow can only be stored in the river during the time of flooding, when the available water storage in the area is at (near) capacity. However, while trends of the HPF signal of daily water storage and river runoff anomalies show agreement over periods of a few days, the higher frequency content of the daily solutions is not reflected in the daily river runoff. This high-frequency variation is attributed to process noise of the Kalman filter approach and a repeat period of 4 days for the GRACE satellites to pass over the GBD. Propagation of the full formal error matrix to the area mean value for each time step estimates the resulting noise level in the ITSG-Grace2014 and GFZ RBF daily solutions at approximately 1 and 1.45 cm TWSAs, respectively. These numbers are confirmed by an empirical estimate using the methodology of Bonin et al. (2012). The difference in apparent noise in the two daily time series can primarily be attributed to the process models employed, which result in different temporal constraints and degrees of spatial filtering.
Daily GRACE gravity field solutions have been evaluated against daily river runoff data for major flood events in the Ganges–Brahmaputra Delta (GBD) in 2004 and 2007. Compared to the monthly gravity field solutions, the trends over periods of a few days in the daily gravity field solutions are able to reflect temporal variations in river runoff during major flood events. This is especially true for the larger flood in 2007, for which three consecutive peaks in daily river runoff, of which two exceeded critical flood levels, are replicated. The daily temporal resolution is sufficiently high to reflect these area mean variations of water storage anomalies, but the spatial resolution is too low to accurately locate the flood-affected area. While the daily ITSG-Grace2016 solution shows relatively higher correlation with river flow and higher temporal consistency, the daily GFZ RBF solution exhibits a better spatial focus of the flooded area, possibly indicating a higher content of the hydrological signal.
GRACE total water storage anomaly data are integrated observations of multiple water storage compartments (e.g., river storage, lakes and floodplains, soil moisture and groundwater). The strong correlation of high-pass filtered daily river runoff anomalies and TWSAs suggests that river water constitutes a large part of the daily total water storage variation during flooding, when other water stores are at (near) capacity and cannot absorb additional inputs of runoff or precipitation. Strong correlation further indicates that the remaining part of the daily GRACE data, the low-pass component of the filter, also contains additional information at this frequency compared to the monthly GRACE data. The analysis further suggests that river runoff into the GBD, mainly generated by precipitation in the upstream reaches of the Ganges–Brahmaputra basin, is a stronger driver for major flooding than precipitation in the GBD, particularly for the larger flood of 2007.
This first hydrological evaluation of the daily GRACE gravity field solutions based on a Kalman filter approach confirms their potential for gravity-based large-scale flood monitoring. This particularly applies to short-lived, high-volume floods, as they occur in the GBD with a 4–5-year return period. These results imply that with the release of the daily gravity field solutions in near-real time, flood monitoring may be supported for large events.
Discharge station data are kindly provided by the Bangladesh Water Development Board. Geocenter estimates, C20 SLR time series and the GIA model have been acquired from http://grace.jpl.nasa.gov (Grace Tellus, 2015). The daily GRACE gravity solutions solutions are available from ftp://ftp.tugraz.at (Mayer-Gürr et al., 2015) and ftp://gfzop.gfz-potsdam.de/EGSIEM/ (Gruber et al., 2016).
The authors declare that they have no conflict of interest.
This research is funded by the European Union's Horizon 2020 project
European Gravity Service for Improved Emergency Management (EGSIEM) under
grant agreement no. 637010. We thank John T. Reager for his comments and
suggestions, which greatly helped to improve the manuscript. Further, we
thank Natthachet Tangdamrongsub and an anonymous reviewer for their input and
constructive comments.
The article processing charges for this open-access
publication were covered by a Research
Centre of the Helmholtz Association.
Edited by: Wouter Buytaert
Reviewed by: Natthachet Tangdamrongsub and one anonymous referee
A, G., Wahr, J., and Zhong, S.: Computations of the viscoelastic response of a 3-D compressible Earth to surface loading: an application to Glacial Isostatic Adjustment in Antarctica and Canada, Geophys. J. Int., 192, 557–572, https://doi.org/10.1093/gji/ggs030, 2013.
Bergmann, I. and Dobslaw, H.: Short-term transport variability of the Antarctic circumpolar current from satellite gravity observations, J. Geophys. Res., 117, C05044, https://doi.org/10.1029/2012JC007872, 2012.
Best, J. L., Ashworth, P., Sarker, M. H., and Roden, J.: The Brahmaputra-Jamuna River, Bangladesh, in: Large Rivers: Geomorphology and Management, 395–430, John Wiley, Chichester, UK, 2007.
Bonin, J. A., Bettadpur, S., and Tapley, B. D.: High-frequency signal and noise estimates of CSR GRACE RL04, J. Geod., 86, 1165, https://doi.org/10.1007/s00190-012-0572-5, 2012.
Chen, J. L., Wilson, C. R., and Tapley, B. D.: The 2009 exceptional Amazon flood and interannual terrestrial water storage change observed by GRACE, Water Resour. Res., 46, W12526, https://doi.org/10.1029/2010WR009383, 2010.
Cheng, M., Ries, J. C., and Tapley, B. D.: Variations of the Earth's figure axis from satellite laser ranging and GRACE, J. Geophys. Res., 116, B01409, https://doi.org/10.1029/2010JB000850, 2011.
Dahle, C., Flechtner, F., Gruber, C., König, D., König, R., Michalak, G., and Neumayer, K. H.: GFZ GRACE Level-2 Processing Standards Document for Level-2 Product Release 0005, Scientific Technical Report STR 12/02–Data, Revised Edition, January 2013, Potsdam, 21 pp., https://doi.org/10.2312/GFZ.b103-1202-25, 2012.
Dobslaw, H., Flechtner, F., Bergmann-Wolf, I. , Dahle, C., Dill, R., Esselborn, S. Sasgen, I., and Thomas, M.: Simulating high-frequency atmosphere-ocean mass variability for de-aliasing of satellite gravity observations: AOD1B RL05, J. Geophys. Res., 118, 3704–3711, doi.org/10.1002/jgrc.20271, 2013.
Dobslaw, H., Bergmann-Wolf, I., Dill, R., Forootan, E., Klemann, V., Kusche, J., and Sasgen, I.: The updated ESA Earth System Model for future gravity mission simulation studies, J. Geodesy, 89, 505–513, https://doi.org/10.1007/s00190-014-0787-8, 2015.
Döll, P., Kaspar, F., and Lehner, B.: A global hydrological model for deriving water availability indicators: model tuning and validation, J. Hydrol., 207, 105–134, https://doi.org/10.1016/S0022-1694(02)00283-4, 2003.
Grace Tellus: Geocenter estimates, C20 SLR time series, GIA model, available at: http://grace.jpl.nasa.gov, last access: 17 November 2015.
Gruber, C. and Gouweleeuw, B. T.: Short latency monitoring of continental, ocean- and atmospheric mass variations using GRACE inter-satellite accelerations, Geophysical Journal International, in review, 2018.
Gruber, C., Moon, Y., Flechtner, F., Dahle, C., Novàk, P., Koenig, R., and Neumayer, H.: Submonthly GRACE Solutions from Localizing Integral Equations and Kalman Filtering. Earth on the Edge: Science for a Sustainable Planet, Proceedings of the IAG General Assembly, Melbourne, Australia, 28 June–2 July 2011, Series: International Association of Geodesy Symposia, edited by: Rizos, C. and Willis, P., 139, 383–389, 2014.
Gruber, C., Moon, Y., Flechtner, F., Dahle, C., Novàk, P., Koenig, R., and Neumayer, H.: Submonthly GRACE Solutions from Localizing Integral Equations and Kalman Filtering, available at ftp://gfzop.gfz-potsdam.de/EGSIEM/, last access: 05 April 2016.
Hopson, M., and Webster, P. J.: A 1–10-Day Ensemble Forecasting Scheme for the Major River Basins of Bangladesh: Forecasting Severe Floods of 2003–07, J. Hydrometeor., 11, 618–641, https://doi.org/10.1175/2009JHM1006.1, 2010.
Islam, A. S., Haque, A., and Bala, S. K.: Hydrologic characteristics of floods in Ganges-Brahmaputra–Meghna (GBM) delta, Natural Hazards, 54, 797–811, https://doi.org/10.1007/s11069-010-9504-y, 2010.
Kalman, R. E.: A New Approach to Linear Filtering and Prediction Problems, J. Basic Eng.-T. Asme., 82, 35–45, https://doi.org/10.1115/1.3662552, 1960.
Kurtenbach, E., Eicker, A., Mayer-Gürr, T., Hohlschneider, M., Hayn, M., Fuhrmann, M., and Kusche, J.: Improved daily GRACE gravity field solutions using a Kalman smoother, J. Geodyn., 59–60, 39–48, https://doi.org/10.1016/j.jog.2012.02.006, 2012.
Kusche, J., Schmidt, R., Petrovic, S., and Rietbroek, R.: Decorrelated GRACE time-variable gravity solutions by GFZ, and their validation using a hydrological model, J. Geodesy, 83, 903–913, https://doi.org/10.1007/s00190-009-0308-3, 2009.
Landerer, F. W. and Swenson, F. C.: Accuracy of scaled GRACE terrestrial water storage estimates, Water Resour. Res., 48, W04531, https://doi.org/10.1029/2011WR011453, 2012.
Mayer-Gürr, T., Zehentner, N., Klinger, B., and Kvas, A.: ITSG-Grace2014: a new GRACE gravity field release computed in Graz, available at: http://www.itsg.tugraz.at/research/ITSG-Grace2014 (last access: 20 May 2015), 2014.
Mayer-Gürr, T., Zehentner, N., Klinger, B., and Kvas, A.: ITSG-Grace2014: a new GRACE gravity field release computed in Graz, available at: ftp://ftp.tugraz.at, last access: 20 May 2015.
Molodtsova, T., Molodtsov, S., Kirilenko, A., Zhang, X., and VanLooy, J.: Evaluating flood potential with GRACE in the United States, Nat. Hazards Earth Syst. Sci., 16, 1011–1018, https://doi.org/10.5194/nhess-16-1011-2016, 2016.
Rauch, H. E., Tung, F., and Striebel, C. T.: Maximum likelihood estimates of linear dynamic systems. AIAA, 3, 1445–1450, https://doi.org/10.2514/3.3166, 1965.
Reager, J. T. and Famiglietti, J.: Global terrestrial water storage capacity and flood potential using GRACE, Geophys. Res. Lett., 36, L23402, https://doi.org/10.1029/2009GL040826, 2009.
Reager, J. T., Thomas, B. F., and Famiglietti, J.: River basin flood potential inferred using GRACE gravity observations at several months lead time, Nat. Geosci., 7, 588592, https://doi.org/10.1038/ngeo2203, 2014.
Reager, J. T., Thomas, A. C., Sproles, E. A., Rodell, M., Beaudoing, H. K., Li, B., and Famiglietti, J. S.: Assimilation of GRACE Terrestrial Water Storage Observations into a Land Surface Model for the Assessment of Regional Flood Potential, Remote Sens., 7, 14663–14679, https://doi.org/10.3390/rs71114663, 2015.
Riegger, J. and Tourian, M. J.: Characterization of runoff-storage relationships by satellite gravimetry and remote sensing, Water Resour. Res., 50, 3444–3466, https://doi.org/10.1002/2013WR013847, 2014.
Sakumura, C., Bettapur, S., Save, H., and McCullough, C.: High-frequency terrestrial water storage signal capture via a regularized sliding window mascon product from GRACE, J. Geophys. Res.-Sol. Ea., 121, 4014–4030, https://doi.org/10.1002/2016JB012843, 2016.
Sproles, E. A., Leibowitz, S. G., Reager, J. T., Wigington Jr., P. J., Famiglietti, J. S., and Patil, S. D.: GRACE storage-runoff hystereses reveal the dynamics of regional watersheds, Hydrol. Earth Syst. Sci., 19, 3253–3272, https://doi.org/10.5194/hess-19-3253-2015, 2015.
Steckler, M. S., Nooner, S. L., Akhter, S. H., Chowdhury, S. K., Bettadpur, S., Seeber, L., and Kogan, M. G.: Modeling Earth deformation from monsoonal flooding in Bangladesh using hydrographic, GPS, and Gravity Recovery and Climate Experiment (GRACE) data, J. Geophys. Res., 115, B08407, https://doi.org/10.1029/2009JB007018, 2010.
Swenson, S., Chambers, D., and Wahr, J.: Estimating geocenter variations from a combination of GRACE and ocean model output, J. Geophys. Res., 113, B08410, https://doi.org/10.1029/2007JB005338, 2008.
Swenson, S. C.: GRACE monthly land water mass grids NETCDF RELEASE 5.0. Ver. 5.0. (PO.DAAC, CA, USA), available at: https://doi.org/10.5067/TELND-NC005 (last access: 20 May 2015), 2012.
Swenson, S. C. and Wahr, J. M.: Estimating signal loss in regularized GRACE gravity field solutions, Geophys. J. Int., 185, 693–702, https://doi.org/10.1111/j.1365-246X.2011.04977.x, 2011.
Tapley, B. D., Bettadpur, S., Ries, J. C., Thompson, P. F., and Watkins, M. M.: GRACE measurements of mass variability in the Earth system, Science, 305, 503–505, https://doi.org/10.1126/science.1099192, 2004.
Weedon, G. P., Balsamo, G., Bellouin, N., Gomes, S., Best, M. J., and Viterbo, P.: The WFDEI meteorological forcing data set: WATCH Forcing Data methodology applied to ERA-Interim reanalysis data, Water Resour. Res., 50, 7505–7514, https://doi.org/10.1002/2014WR015638, 2014.