the Creative Commons Attribution 4.0 License.
the Creative Commons Attribution 4.0 License.
 | 03 May 2018
More frequent flooding? Changes in flood frequency in the Pearl River basin, China, since 1951 and over the past 1000 years
Qiang Zhang
Xihui Gu
Vijay P. Singh
Peijun Shi
Flood risks across the Pearl River basin, China, were evaluated using a peak flood flow dataset covering a period of 1951–2014 from 78 stations and historical flood records of the past 1000 years. The generalized extreme value (GEV) model and the kernel estimation method were used to evaluate frequencies and risks of hazardous flood events. Results indicated that (1) no abrupt changes or significant trends could be detected in peak flood flow series at most of the stations, and only 16 out of 78 stations exhibited significant peak flood flow changes with change points around 1990. Peak flood flow in the West River basin increased and significant increasing trends were identified during 1981–2010; decreasing peak flood flow was found in coastal regions and significant trends were observed during 1951–2014 and 1966–2014. (2) The largest three flood events were found to cluster in both space and time. Generally, basin-scale flood hazards can be expected in the West and North River basins. (3) The occurrence rate of floods increased in the middle Pearl River basin but decreased in the lower Pearl River basin. However, hazardous flood events were observed in the middle and lower Pearl River basin, and this is particularly true for the past 100 years. However, precipitation extremes were subject to moderate variations and human activities, such as building of levees, channelization of river systems, and rapid urbanization; these were the factors behind the amplification of floods in the middle and lower Pearl River basin, posing serious challenges for developing measures of mitigation of flood hazards in the lower Pearl River basin, particularly the Pearl River Delta (PRD) region.
- Article
(8157 KB) - Full-text XML
- BibTeX
- EndNote


Climatic extremes are one of the crucial drivers of meteorological and hydrological hazards, such as floods and droughts (IPCC, 2007; Li et al., 2016). Meanwhile, climate change is expected to intensify the global hydrological cycle, which will potentially lead to a general increase in the intensity and frequency of extreme climatic events (Ohmura and Wild, 2002; Alan et al., 2003; Zhang et al., 2013). This will, in turn, have direct implications for hydrological extremes, such as floods and droughts (IPCC, 2013). However, the impacts of climate change on hydrological extremes are expected to vary across different regions over the globe due to the prevailing hydrometeorological regimes and the nature of climate change in specific regions (Beniston and Stephenson, 2004; Burn et al., 2015).
Due to remarkable differences in the hydrometeorological processes that generate floods, climate change can increase or decrease the magnitude, duration, frequency and even nonstationarity of extreme hydrological events, such as floods considered in this study (Gu et al., 2016; Vormoor et al., 2016; Zhang et al., 2016). A very recent study by Zhang et al. (2015a) corroborated the changes in hydrological extremes across China but also found the increasing impact of human activities on fluvial hydrological processes. Changes in hydrometeorological triggers are believed to be the first step to project likely future changes in flood-generating processes (Hall et al., 2014; Vormoor et al., 2016). This is particularly the case with flood processes in the Pearl River basin, the second largest river basin in China in terms of flow volume, in a region with a highly developed economy, a dense population, and important megacities, such as Guangdong, Macau, and Hong Kong. This constituted the motivation for this study. Hydrometeorological extremes often have disastrous impacts on society, water resources, agricultural activities, urban infrastructure, and also ecosystems (Das et al., 2013; Li et al., 2016). Floods, in particular, damage infrastructure, take away many lives, and are one of the costliest types of natural disaster in economic and human terms (Bouwer and Vellinga, 2003). This is also true for China where floods tend to have more significant impacts on agriculture than droughts (Zhang et al., 2015b).
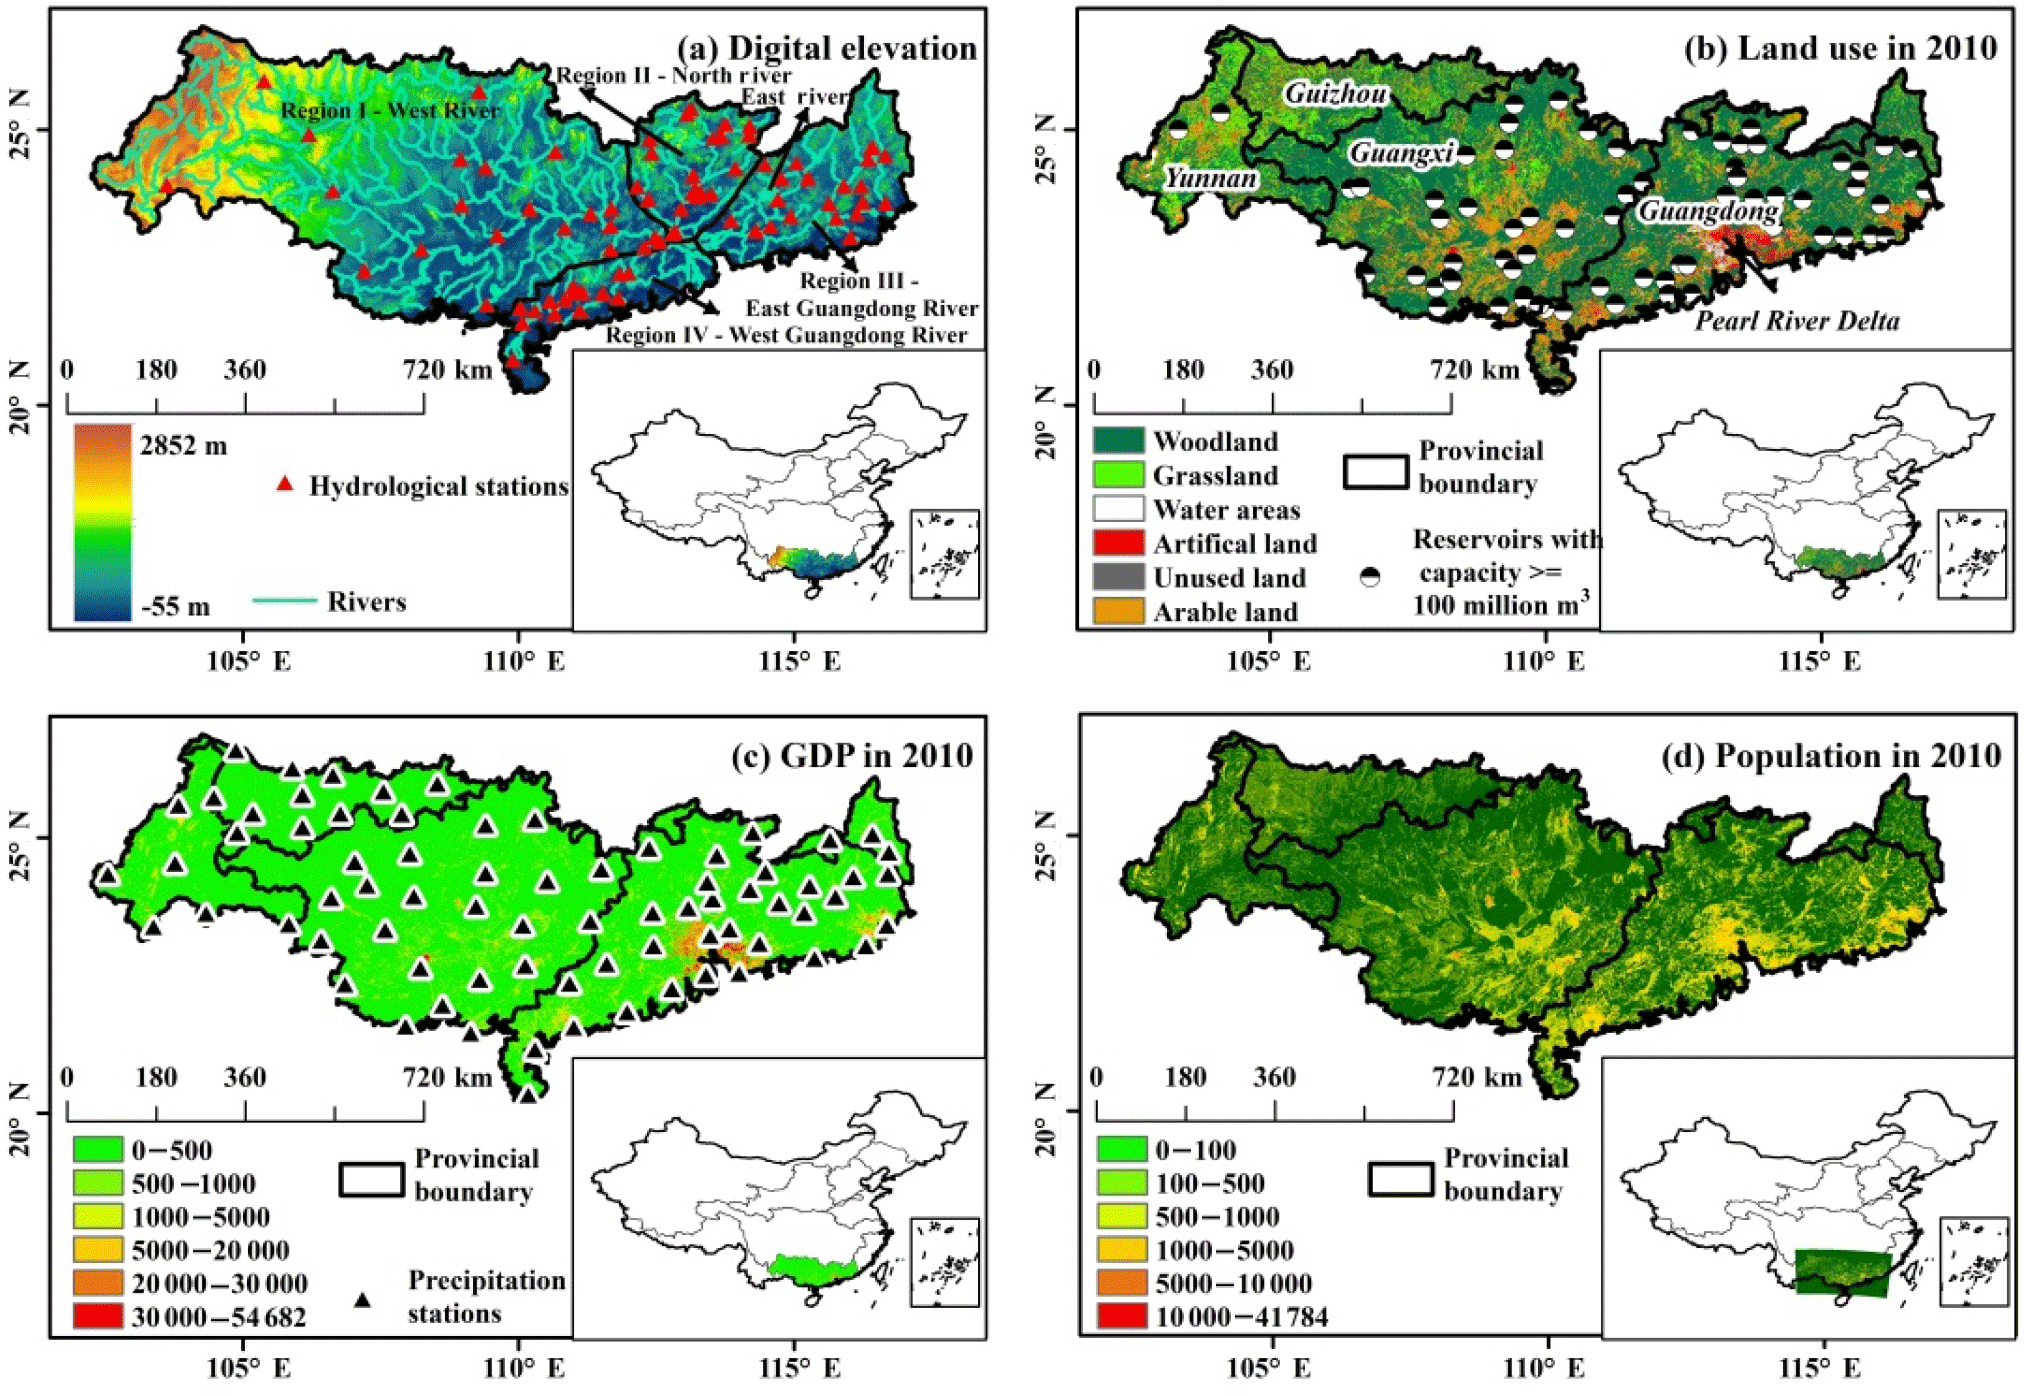
Figure 1Locations of hydrological stations, precipitation gauging stations, and water reservoirs, and spatial patterns of land use, socio-economy, and population across the Pearl River basin.
Increasing catastrophic losses due to natural hazards have attracted widespread public awareness of extreme events in recent years (e.g., Beniston and Stephenson, 2004; Zolina et al., 2004). By 2100, the mean annual global surface temperature will increase by 1.4–5.8 ∘C, and future climatic and hydrological extremes will tend to increase and intensify correspondingly (Beniston et al., 2007; IPCC, 2007). Therefore, it is important to investigate flood behavior, and related studies can be of practical value in water resources management. It should be noted that precipitation extremes have a predominant effect on floods (Jena et al., 2014). Studies on precipitation extremes across the Pearl River basin have indicated that the amount of rainfall has changed little but the variability has increased over the time interval divided by change points (Zhang et al., 2009). Further, changes in the characteristics of precipitation extremes across the Pearl River basin are similar to those around the globe (Hirsch and Archfield, 2015); i.e., frequencies of precipitation extremes are increasing but magnitudes have moderate changes. However, increasing precipitation extremes are observed mainly in the lower Pearl River basin, including the Pearl River Delta (PRD) region (Zhang et al., 2012), and also partly in the middle Pearl River basin. Therefore, it can be expected that flood risk should be higher in the middle and lower Pearl River basin or coastal regions (Pino et al., 2016).
In general, extreme floods are rare and hence there is limited opportunity to collect adequate samples of such events in order to make reliable predictions. Therefore, the question is how best to extrapolate limited data to extreme events, when no or only short series of such events are available (Kjeldsen et al., 2014). High quality data and analyses of long historical records of peak extreme events are important to determine whether climate is becoming extreme or variable (Nicholls, 1995). To that end, flood records of 1000 years from Guangdong Province (which covers the lower Pearl River basin) and Guangxi Province (which covers the middle Pearl River basin) were collected to overcome the limitations of short gauge-station-based flood records for analyzing floods, and this is also the significance of this study.
The historical flood records were collected from two books compiled by Wen and Song (2006) and Wen and Yang (2007). These two books include abundant records relevant to various meteorological disasters, such as tropical cyclones, droughts, floods, and frosts. The historical flood records should be screened out from these abundant records, and this is quite a time-consuming job. Therefore, only a few reports were found concerning flooding changes over a long period such as 1000 years in this study based on historical records. In addition, historical flood records in other regions of the globe have been used to analyze the changes in flood frequency (e.g., Mudelsee et al., 2003). Mudelsee et al. (2003) collected flood records from AD 1000 to AD 2000, and pointed out no upward trends in the occurrence of extreme floods in central Europe. Mudelsee et al. (2004) indicated that historical flood records can provide reliable and unique information on heavy floods at least since AD 1500 in the Elbe and Oder rivers, which further emphasized the merits of historical records in the study of flooding frequency from a long-term perspective.
Therefore, the objectives of this study are (1) to quantify abrupt changes and trends of flood events; (2) to characterize temporal changes of 10-year flood flow and spatial distribution of flood magnitude > 10-year flood magnitude (the flood peak is expected to occur, on average, once every 10 years); and (3) to determine frequency and occurrence rate based on 1000-year flood records. Potential causes of spatiotemporal patterns of floods across the Pearl River basin and related implications are also discussed. This study provides a clear picture showing the evolution of floods in both space and time in a humid river basin and shows the response of hydrological extremes to climate change and human activities.
2.1 Study region
The Pearl River (97∘39′ E–117∘18′ E; 3∘41′ N–29∘15′ N) (Fig. 1), with a drainage area of 4.42 × 10⁵ km2, is the second largest river in China in terms of flow volume (PRWRC, 1991). It includes three major tributaries: West River, North River, and East River. The West River (region I) is the largest tributary, accounting for 77.8 % of the total drainage area of the basin. The North River (region II) is the second largest one, with a drainage area of 46 710 km2. The East River (region III) accounts for 6.6 % of the total area of the Pearl River. And region IV, which is beyond the three major tributaries, is located in the west of the Guangdong Province (Fig. 1). The annual mean temperature ranges between 14 and 22∘ C and the precipitation mainly occurs during April–September (Zhang et al., 2009), accounting for 72–88 % of the annual precipitation (PRWRC, 1991).

The Pearl River basin is covered mainly by two provinces, i.e., Guangdong and Guangxi (Fig. 1b). Numerous water reservoirs have been built in northern, eastern, and western Guangdong and also central and southern Guangxi (Fig. 1b). In addition, widespread urbanization can be observed in the PRD, eastern Guangdong, and coastal regions of Guangdong (Chen et al., 2009) (Fig. 1b), which has a highly developed economy (Fig. 1c) and dense population settlements (Fig. 1d). Central and southern Guangxi is dominated by croplands (Fig. 1b). The streamflow variations of the Pearl River basin have a considerable influence on the hydrological processes of the PRD, one of the most complicated deltaic drainage systems in the world (Chen et al., 2009). Flat terrain at low-lying altitude and the downstream location, together with rapid economic development and population growth over the past 3 decades, have made the PRD region more and more vulnerable to natural hazards, such as floods, salinity intrusion, and storm surges. In recent years, engineering facilities and other modifications of the Pearl River network have been designed to strengthen flood protection and to cater for huge requirements of building materials.
2.2 Data
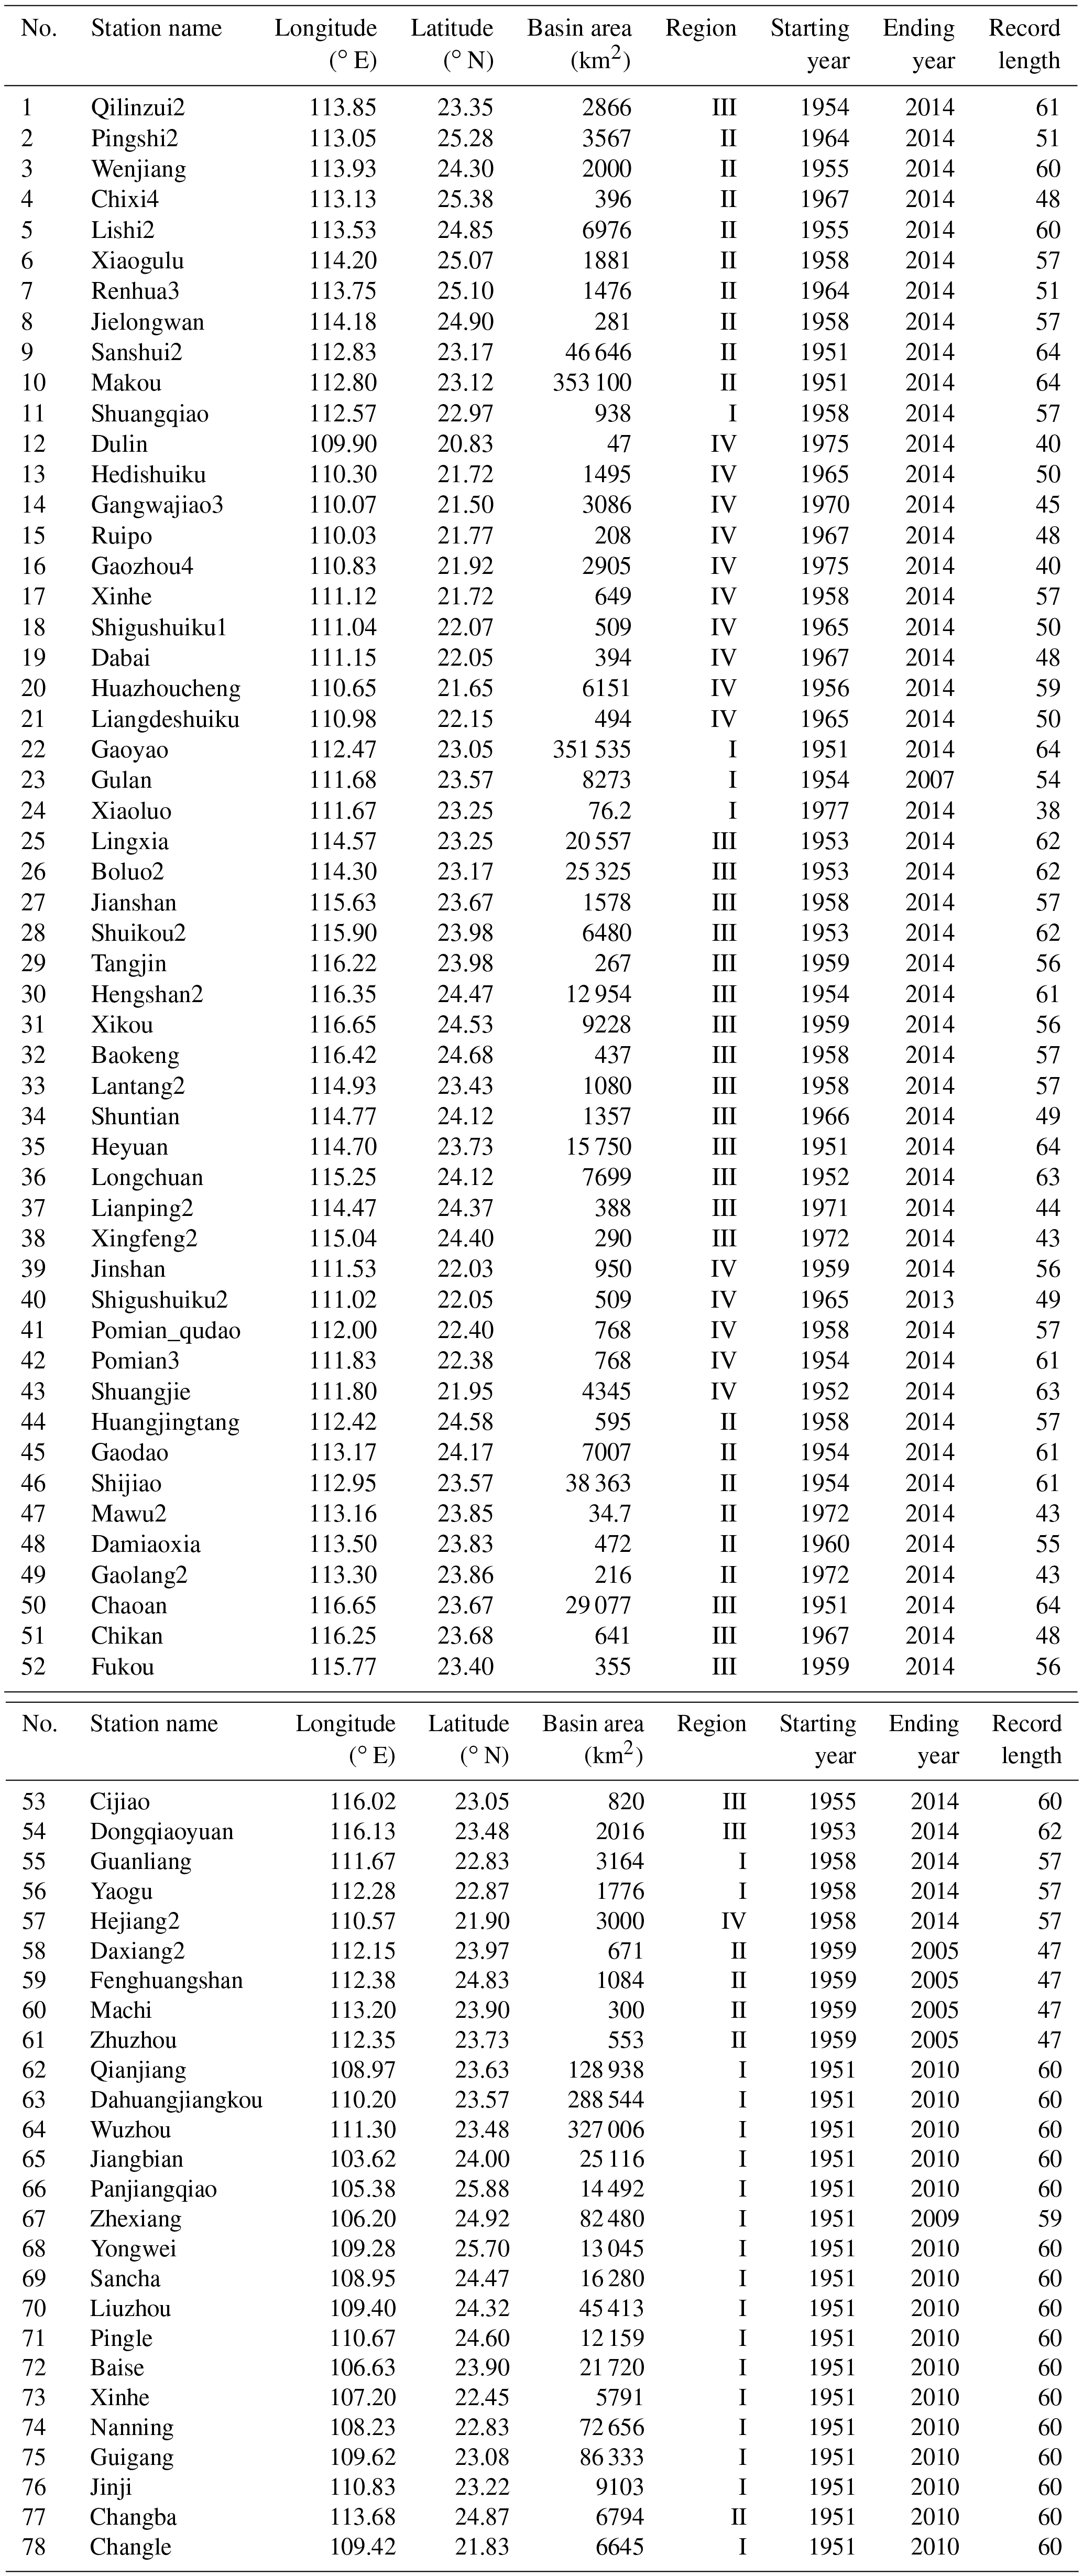
The annual largest 1-day streamflow data (i.e., annual maxima) were collected from 78 hydrological stations across the Pearl River basin (Table 1). Locations of these hydrological stations are shown in Fig. 1a. Additionally, daily precipitation data were also collected from 74 stations across the Pearl River basin and their locations are shown in Fig. 1c. All the precipitation and hydrological data cover the period of 1951–2014. Detailed information of these hydrological (Table 1) and precipitation data can be found in Fig. 2. The hydrological data were provided by the Water Conservancy Bureau of the Pearl River Water Conservancy Commission, and the precipitation data were collected from the National Climate Center, which can be obtained at http://data.cma.cn/ (last access: 23 April 2018). The quality of these data was firmly controlled before release.
There are fewer than 1 % missing values in daily precipitation data (Zhang et al., 2018). The missing precipitation data for 1–2 days were filled by the average precipitation of the neighboring days. Consecutive days with missing data were interpolated by the long-term average of the same days of other years. For the objectives of this study, the gap-fill method did not significantly affect the final results. A similar method was used by Zhang et al. (2011) to fill daily missing precipitation values. The annual largest 1-day streamflow data from 78 hydrological stations were directly collected from the Water Conservancy Bureau of the Pearl River Water Conservancy Commission. The annual largest 1-day streamflow data were compiled before release of the data. The missing values of annual largest 1-day streamflow data were filled by the average value of the neighboring years.
Mudelsee et al. (2003) classified floods into three types, based on inundation area and flood-induced losses: (1) floods that occur locally with short duration and little damage; (2) regional floods that have a relatively longer duration and cause damage to hydraulic infrastructure and also cause casualties; and (3) fluvial disastrous floods that have a longer lasting duration (usually days or weeks) and cause serious and even disastrous damage to hydraulic infrastructure and cause massive casualties. In this study, historical flood records were collected from documented flood records compiled by Wen and Song (2006) and by Wen and Yang (2007). The documented flood records for Guangdong and Guangxi provinces covered a period of 383–2000 and 107–2000, respectively. The disasters were recorded in history books, local chronicles, water conservancy archives, documents, and so on. For the sake of the study on relations between climate change and disasters, the group was developed to compile the documented nature disaster records spanning almost 2000 years for each province in China based on multisource information. The group selected the recorded flood events with mutual confirmation in different documents as far as possible. In addition, the flood event with more relevant information, such as magnitude, mortality, flood-damaged and flood-affected cropland areas, and flood-induced damaged water conservancy facilities, is more likely to be selected.
The director of the group is Wen, who served as the director of the China Meteorological Administration, and one of the group is Ding, who is an academician of the Chinese Academy of Sciences. The members of the group, who come from a senior government authority or who are famous scientists, can largely ensure the quality of the data. Based on flood types defined by Mudelsee et al. (2003), only disastrous flood events were singled out, since floods occurred almost annually. Meanwhile, flood records before AD 1000 were not complete and contained missing information; thus disastrous flood records during a period of 1000–2000 were singled out and analyzed in this study. A flood event, which caused loss of lives, submersed more than 10 000 farmland areas, or destroyed important water conservancy facilities, will be classified as a disastrous flood event.
3.1 Detection of change points and trends
The Pettitt method (Pettitt, 1979) is a nonparametric test and enables the detection of change in the mean (median) when the change point time is unknown. This method has been widely used in detection of change points (Villarini et al., 2009) and was also used in this study. The test is based on the Mann–Whitney statistic for testing whether the two samples X1,… , Xm and Xm+1, …, Xn come from the same population. The p value, in statistic testing, is computed using the limiting distribution approximated by Pettitt (1979), which is valid for continuous variables (e.g., Villarini et al., 2009). The 95 % confidence level was used to evaluate the significance of change point in the study.
Trends were tested by nonparametric trend detection methods which are less sensitive to outliers than parametric statistics are. In this study, the modified version of the Mann–Kendall (MMK) trend test method was used which was proposed by Hamed and Rao (1998) based on effective or equivalent sample size to eliminate the effect of autocorrelation. MMK has been used in analyzing the effect of global warming on small aquatic ecosystems (Daufresne et al., 2009). In this study MMK was employed to explore trends in flood series, with the significance level set at 5 %. For the computation procedure one can refer to Daufresne et al. (2009). The change point and trend detection methods are only applied for the observations during 1951–2014.
3.2 Generalized extreme value (GEV) model
The GEV distribution has been widely used in the analysis of hydrometeorological extremes (e.g., Gu et al., 2016) and has three parameters, i.e., the location, μ, the scale, α (α > 0), and the shape, κ. In this paper, the GEV is used to calculate the return period of flood events. The cumulative density function (cdf) of a random variable y drawn from a GEV distribution is given as follows (Cannon, 2010):
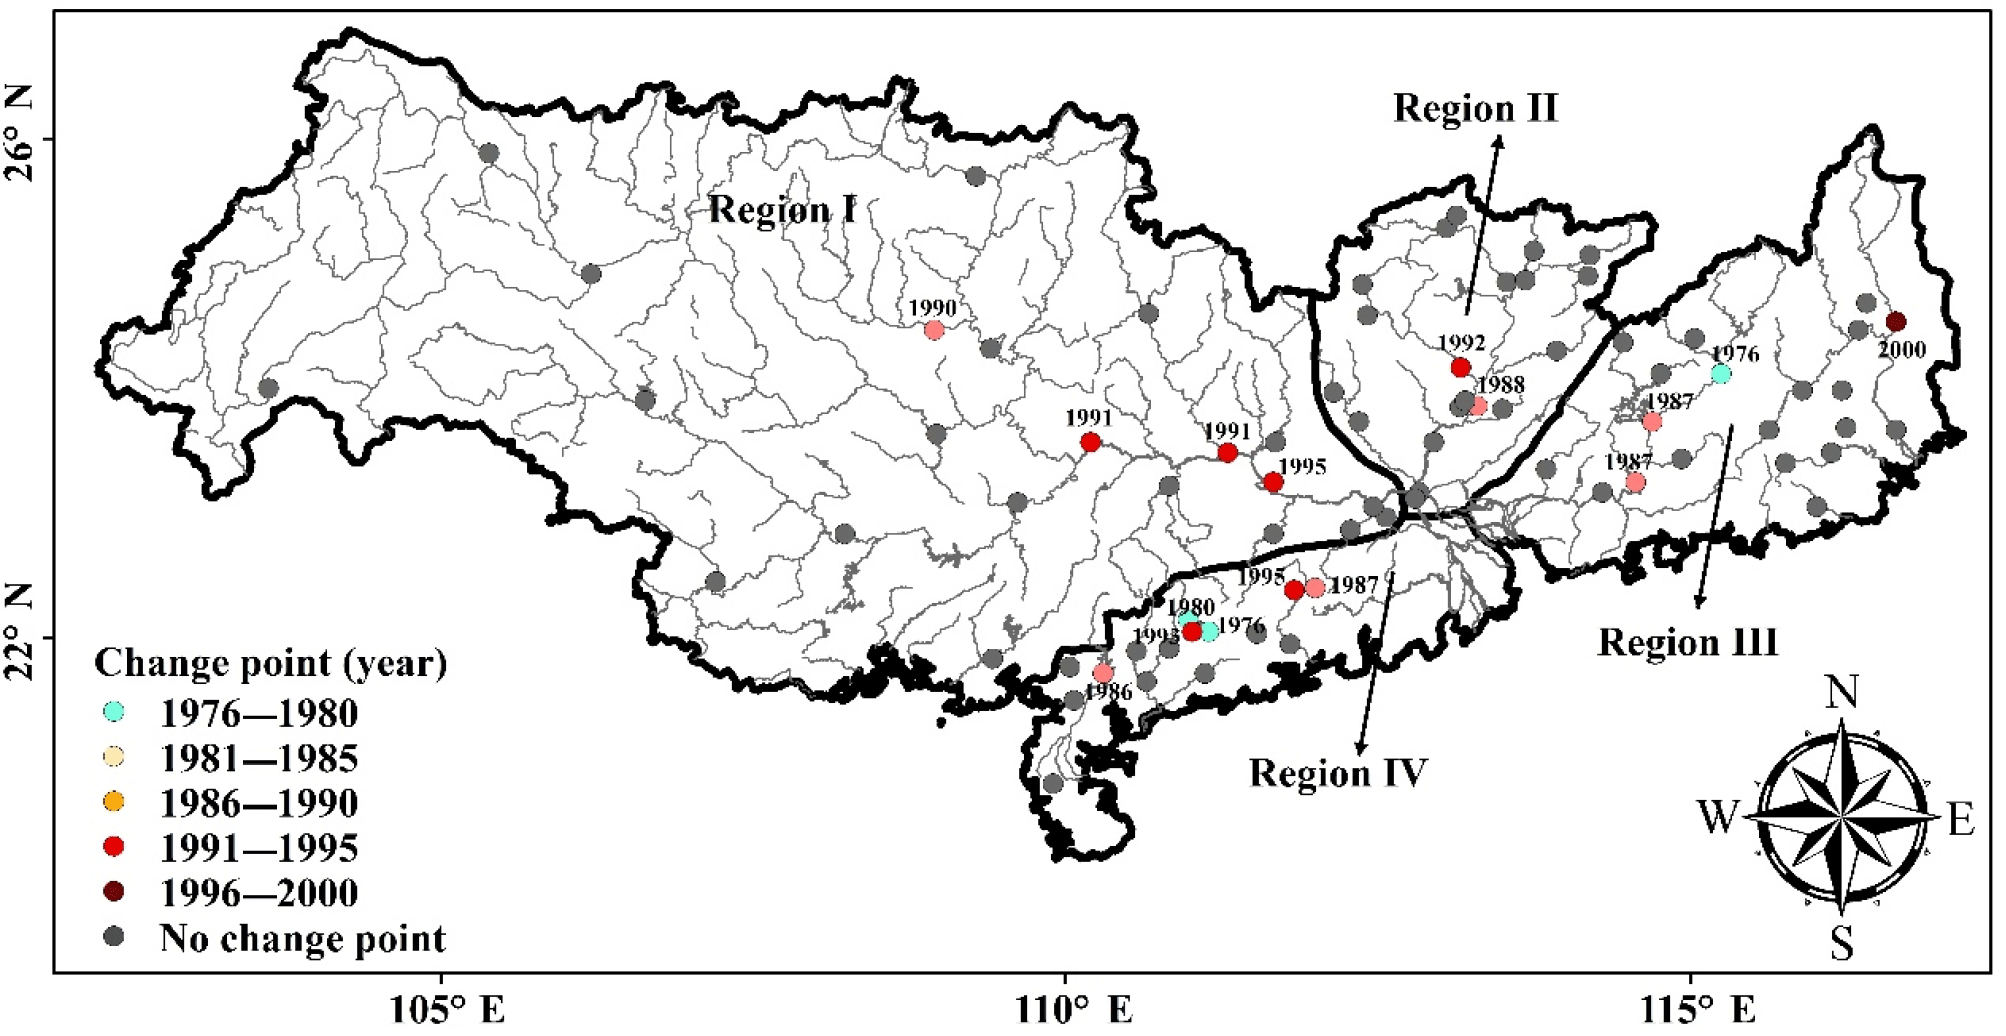
Figure 3Spatial distribution of change points using the Pettitt test for peak flood flow changes.
3.3 Kernel density estimation of occurrence rates of floods
The kernel density estimation method is used to estimate the occurrence rates of historical floods. The estimation of occurrence rates of time-dependent extreme events can be computed as follows(Mudelsee et al., 2003, 2004):
where Ti is the timing of the ith flood event with a unit of days; m is the number of floods; K(⋅) is the kernel function; and h is the width of the kernel function. The Gaussian kernel function is the widely used kernel function, which can use the Fourier space and produce a smoothed estimation of the occurrence rates of extreme events (Mudelsee et al., 2003, 2004):
where y= (t−Ti) h−1. The occurrence rate of an extreme event, λ(t), denotes the number of an extreme event exceeding threshold values given a certain time interval, t. The time interval of time series is [t1, tm]. Since no data are available outside of the time interval, i.e., [t1, tm], λ(t) near the boundaries of the time interval is usually underestimated. In this case, a kind of pseudodata is used to reduce the error as a result of underestimated λ(t). A mapping technique is used to produce the pseudodata (Mudelsee et al., 2004). pT is the pseudodata outside of the time interval of [t1, tm] for the flood series. For t < t1, pT[i] ]; and the same procedure was done for t > tm. The extended series is 1.5 times longer than the original one. The computation of λ(t) based on the extended data series was based on
where Ti is the timing of the ith flood event based on the extended data series with a unit of day; m∗ is the sample size of the extended data series. Also, the selection of window width, h, is important for the estimation of λ(t). Too small a window width, h, selected for the computation of λ(t) will substantially influence the randomness of λ(t); too large a window width, h, may cause over-smoothing of the data series, and hence details in information may be excluded. The cross-validation method was used to determine the width of the window (Mudelsee et al., 2003). The kernel density estimation method is only applied for the historical floods.
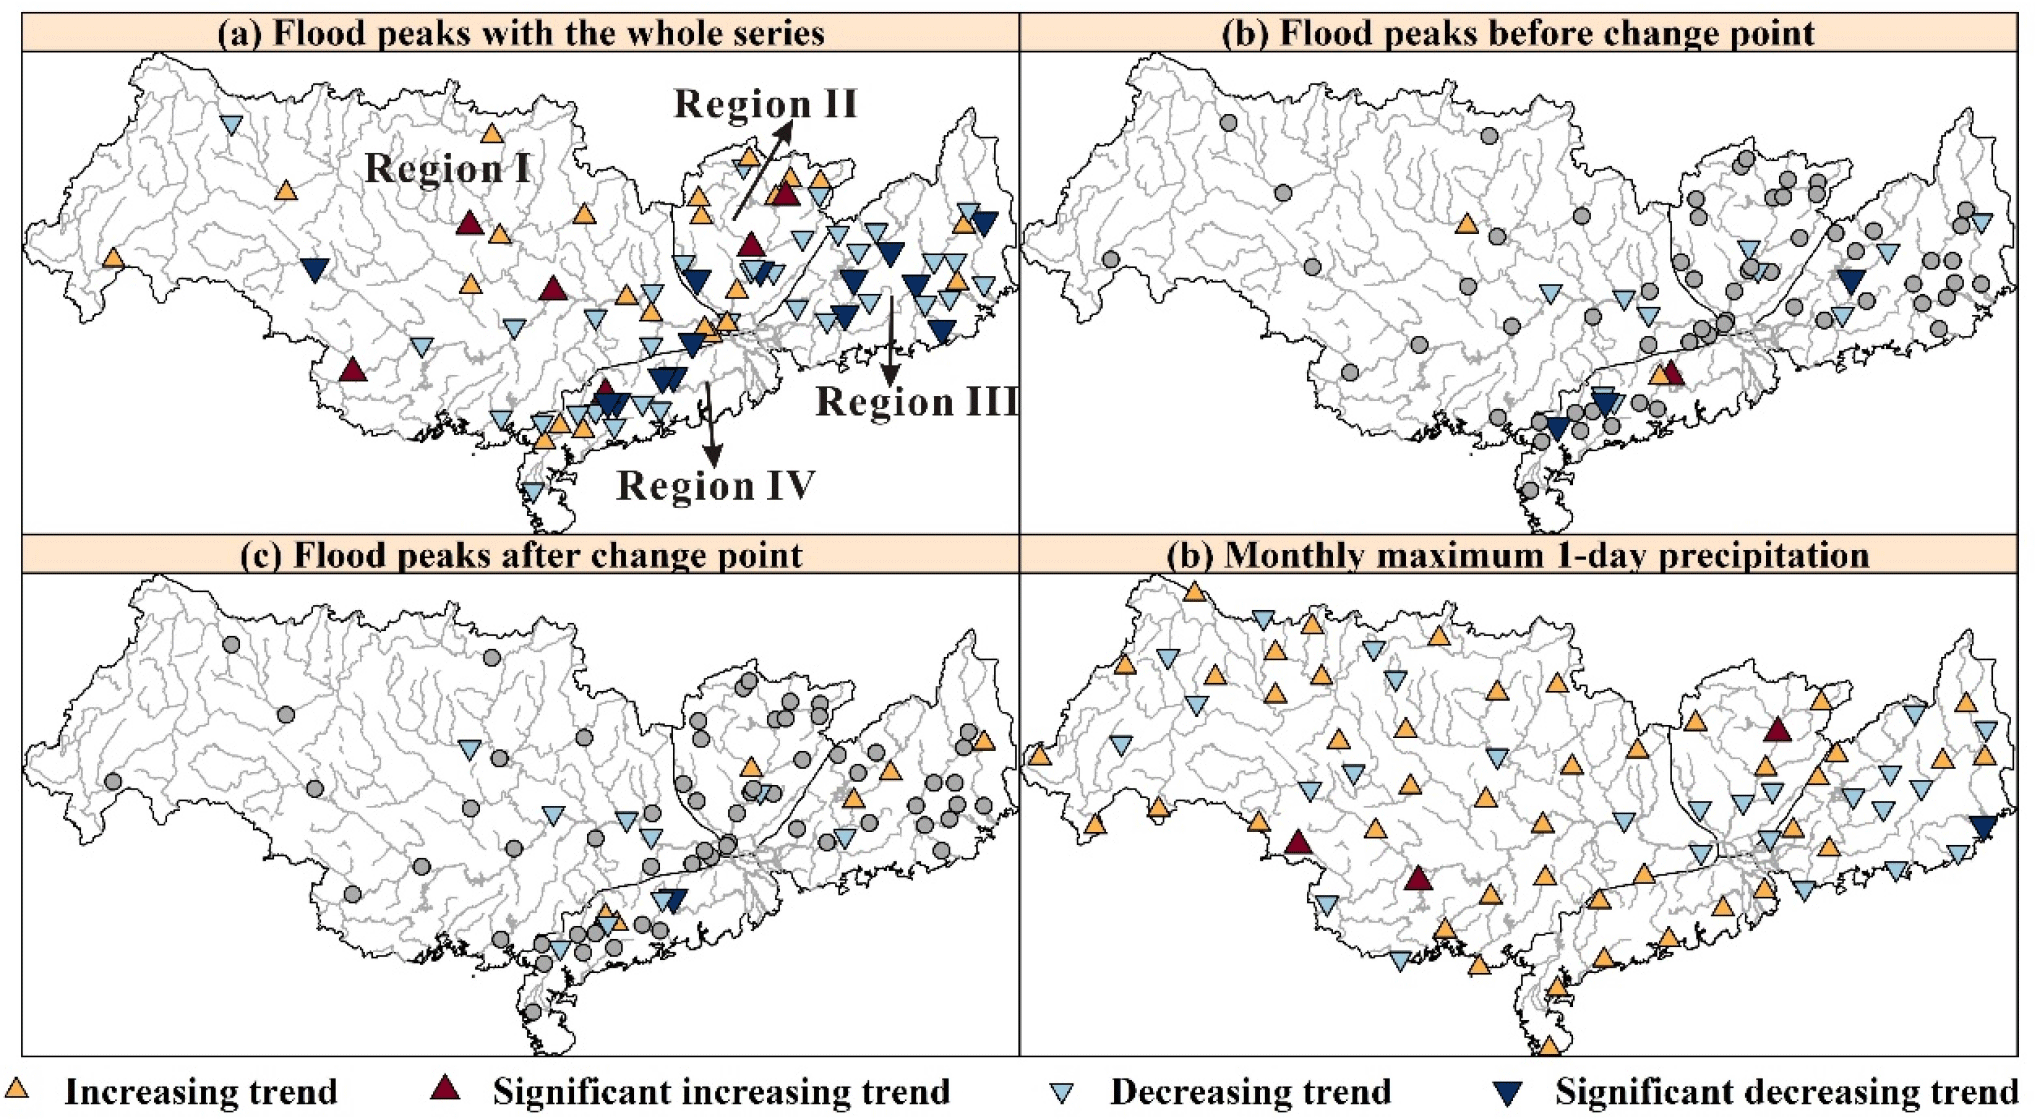
Figure 4Trends in (a) flood peaks with the whole series, (b) flood peaks before the change point, (c) flood peaks after the change point, and (d) precipitation extremes. The gray dots in (b) and (c) indicate the stations without a change point.
3.4 Confidence interval by Bootstrap technique
The bootstrap technique and Eq. (4) can be combined to enable uncertainty analysis of the occurrence rate of floods, λ(t), using the following procedure (Mudelsee et al., 2004).
-
Based on the extended data series, , the simulated T+ of the same series length can be obtained using the bootstrap technique.
-
The occurrence rates, λ+(t), of sample extreme events, T+, can be computed using Eq. (5).
-
Steps 2 and 3 above will be repeated 2000 times, and λ+(t) of 2000 samples can be obtained.
-
The 90 % confidence interval for λ+(t) will be obtained using the quantile method.
4.1 Change points and trends of peak flood flow
Analyses of change points and trends were only applied in observed flood events (i.e., annual maxima of period of 1951–2014). Figure 3 illustrates spatial patterns of stations with different change points of peak flood flow. It can be observed from the figure that only 16 out of 78 stations, accounting for 20.5 % of the total stations, were characterized by significant change points of peak flood flow changes, and most of these stations are found in the middle and lower Pearl River basin. In the coastal regions of the lower Pearl River basin, 10 out of 16 stations with significant change points were observed, accounting for 62.5 % of the total stations, characterized by significant change points of peak flood flow. Generally, flooding in the Pearl River basin is mainly attributed to precipitation extremes which were observed mainly in the middle and lower Pearl River basin and particularly in the lower Pearl River basin (Zhang et al., 2012). Results of change points of precipitation maxima by Zhang et al. (2009) indicated that precipitation maxima were dominated by significant change points during 1980–1993, and significant change points of peak flood flow series detected in this study were during 1986–1995, showing significant impacts of precipitation extremes on flooding. These results showed that significant change points of flood processes were found mainly in the middle Pearl River basin and particularly in the lower Pearl River basin. In addition, human impacts on flood processes cannot be ignored, and this is particularly the case for the East River basin (Zhang et al., 2015c), where three large water reservoirs were built that controlled 11 700 km2 of drainage area.

Figure 6K–S test results of performance of GEV fitting of peak flood flow of the Pearl River basin.
Significant increasing peak flood flow was observed mainly in the northeastern West River basin, the mainstream of the Pearl River basin, the northern North River basin, the southeastern West River basin, and the southern North River. Significant decreasing peak flood flow was observed mainly in the southeastern West River, the southern North River basin, and also parts of rivers along the coastal regions of the lower Pearl River basin (Fig. 4a). Most stations show decreases in flood peaks both before and after the change point, especially in regions I and IV (Fig. 4b, c). However, the flood peaks in region III changed from a decreasing trend before the change point to an increasing trend after the change point, suggesting shifted and/or modified physical mechanisms behind flood generation processes. Significant increasing precipitation extremes were found in the northeastern West River basin and the northern North River basin, and significant decreasing precipitation extremes were detected in the East River basin. Hence, spatial patterns of peak flood flow matched those of precipitation extremes (Fig. 4a, d), implying that floods in these regions were impacted mainly by precipitation extremes. The southeastern West River basin and rivers in the west parts of region III were dominated by significant increasing precipitation extremes but significant decreasing peak flood flow (Fig. 4). Human activities exerted considerable impacts on flood processes in these regions. Cropland in the Guangxi Province was found mainly in the southeastern Jiangxi Province (Fig. 1b), and irrigated cropland showed a significant increase (Zhang et al., 2015b). The volume of water withdrawal for agricultural irrigation during 2014 only reached 2.09×110 m3. Meanwhile, the total water storage capacity of water reservoirs of the Guangxi Province reached 6.74×10¹⁰ m3, and more than half of the reservoirs were built in the southeastern West River basin (Fig. 1b). The western parts of the region III were also dominated by croplands and large-scale reservoirs (Fig. 1b), agricultural water consumption reached 2.24×10¹⁰ m3, and the total storage capacity of reservoirs reached 4.48×10¹⁰ m3 during 2014. These human activities greatly decreased peak flood flow volume in these regions. Therefore, increasing human impacts on flood processes should attract considerable concern for the management of water resources and mitigation of flood hazards (Zhang et al., 2015a).
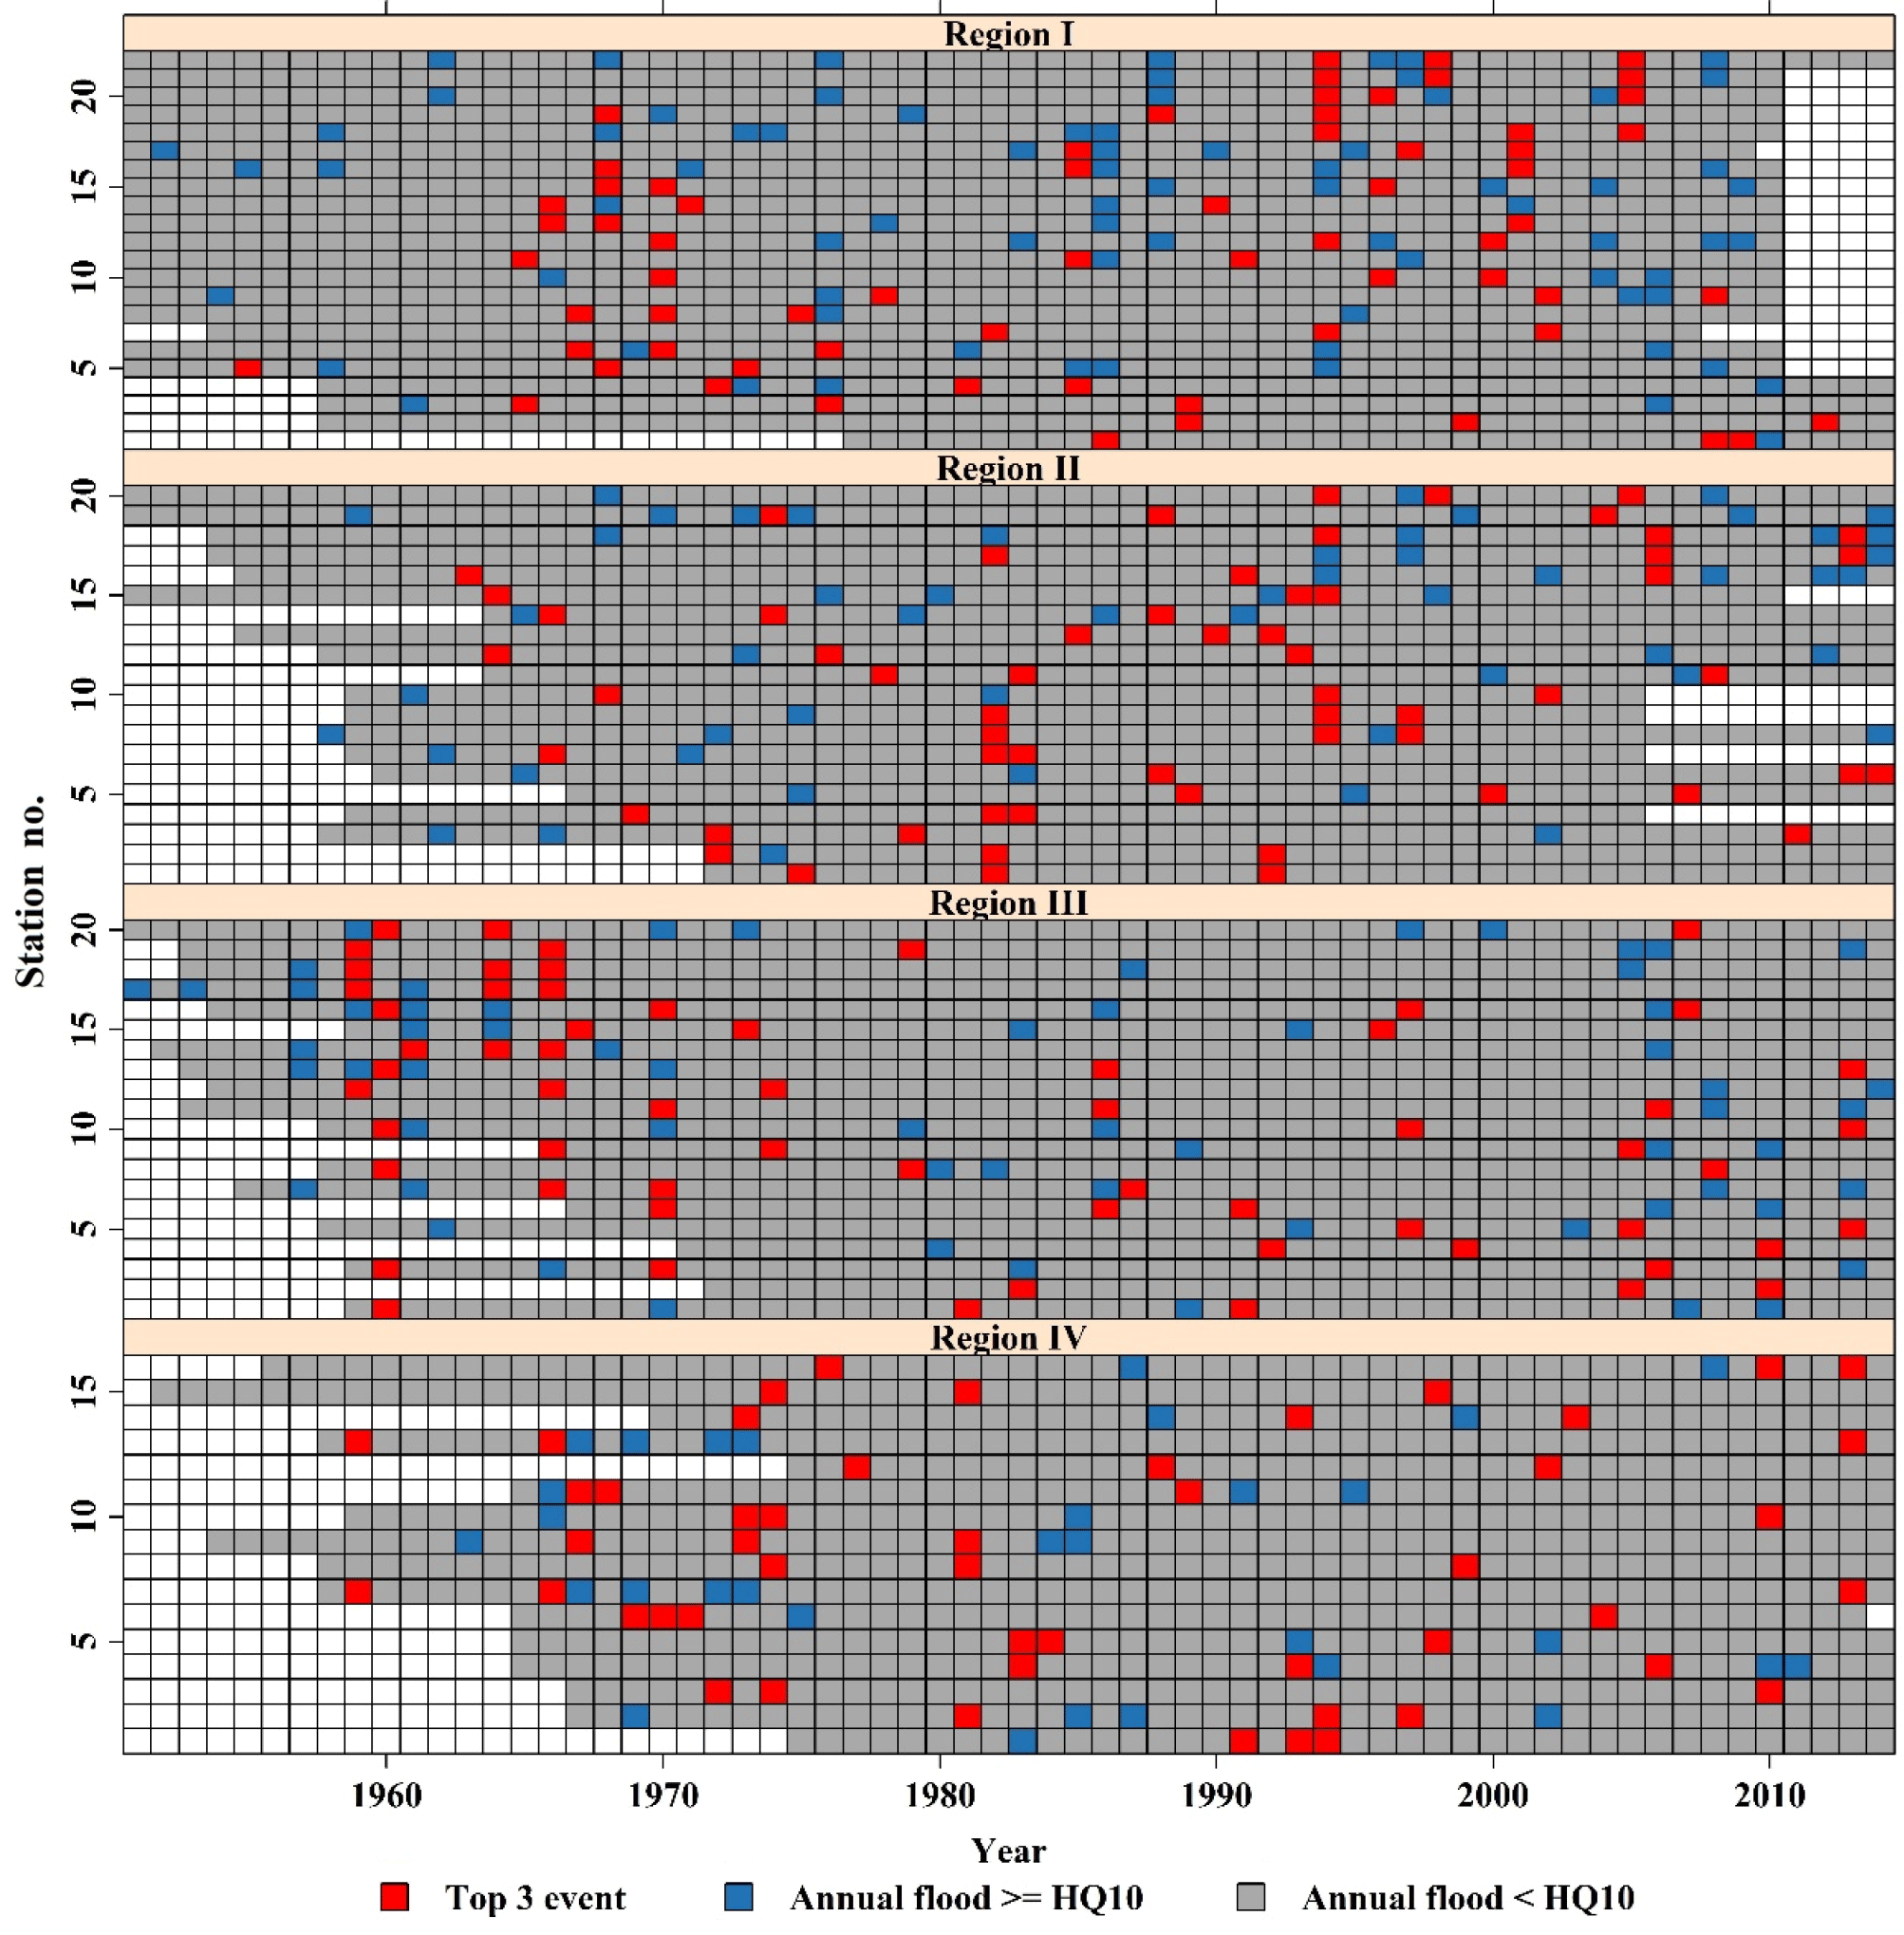
Figure 7GEV-model-based estimated return periods of peak flood flow at hydrological stations considered in this study across the Pearl River basin.
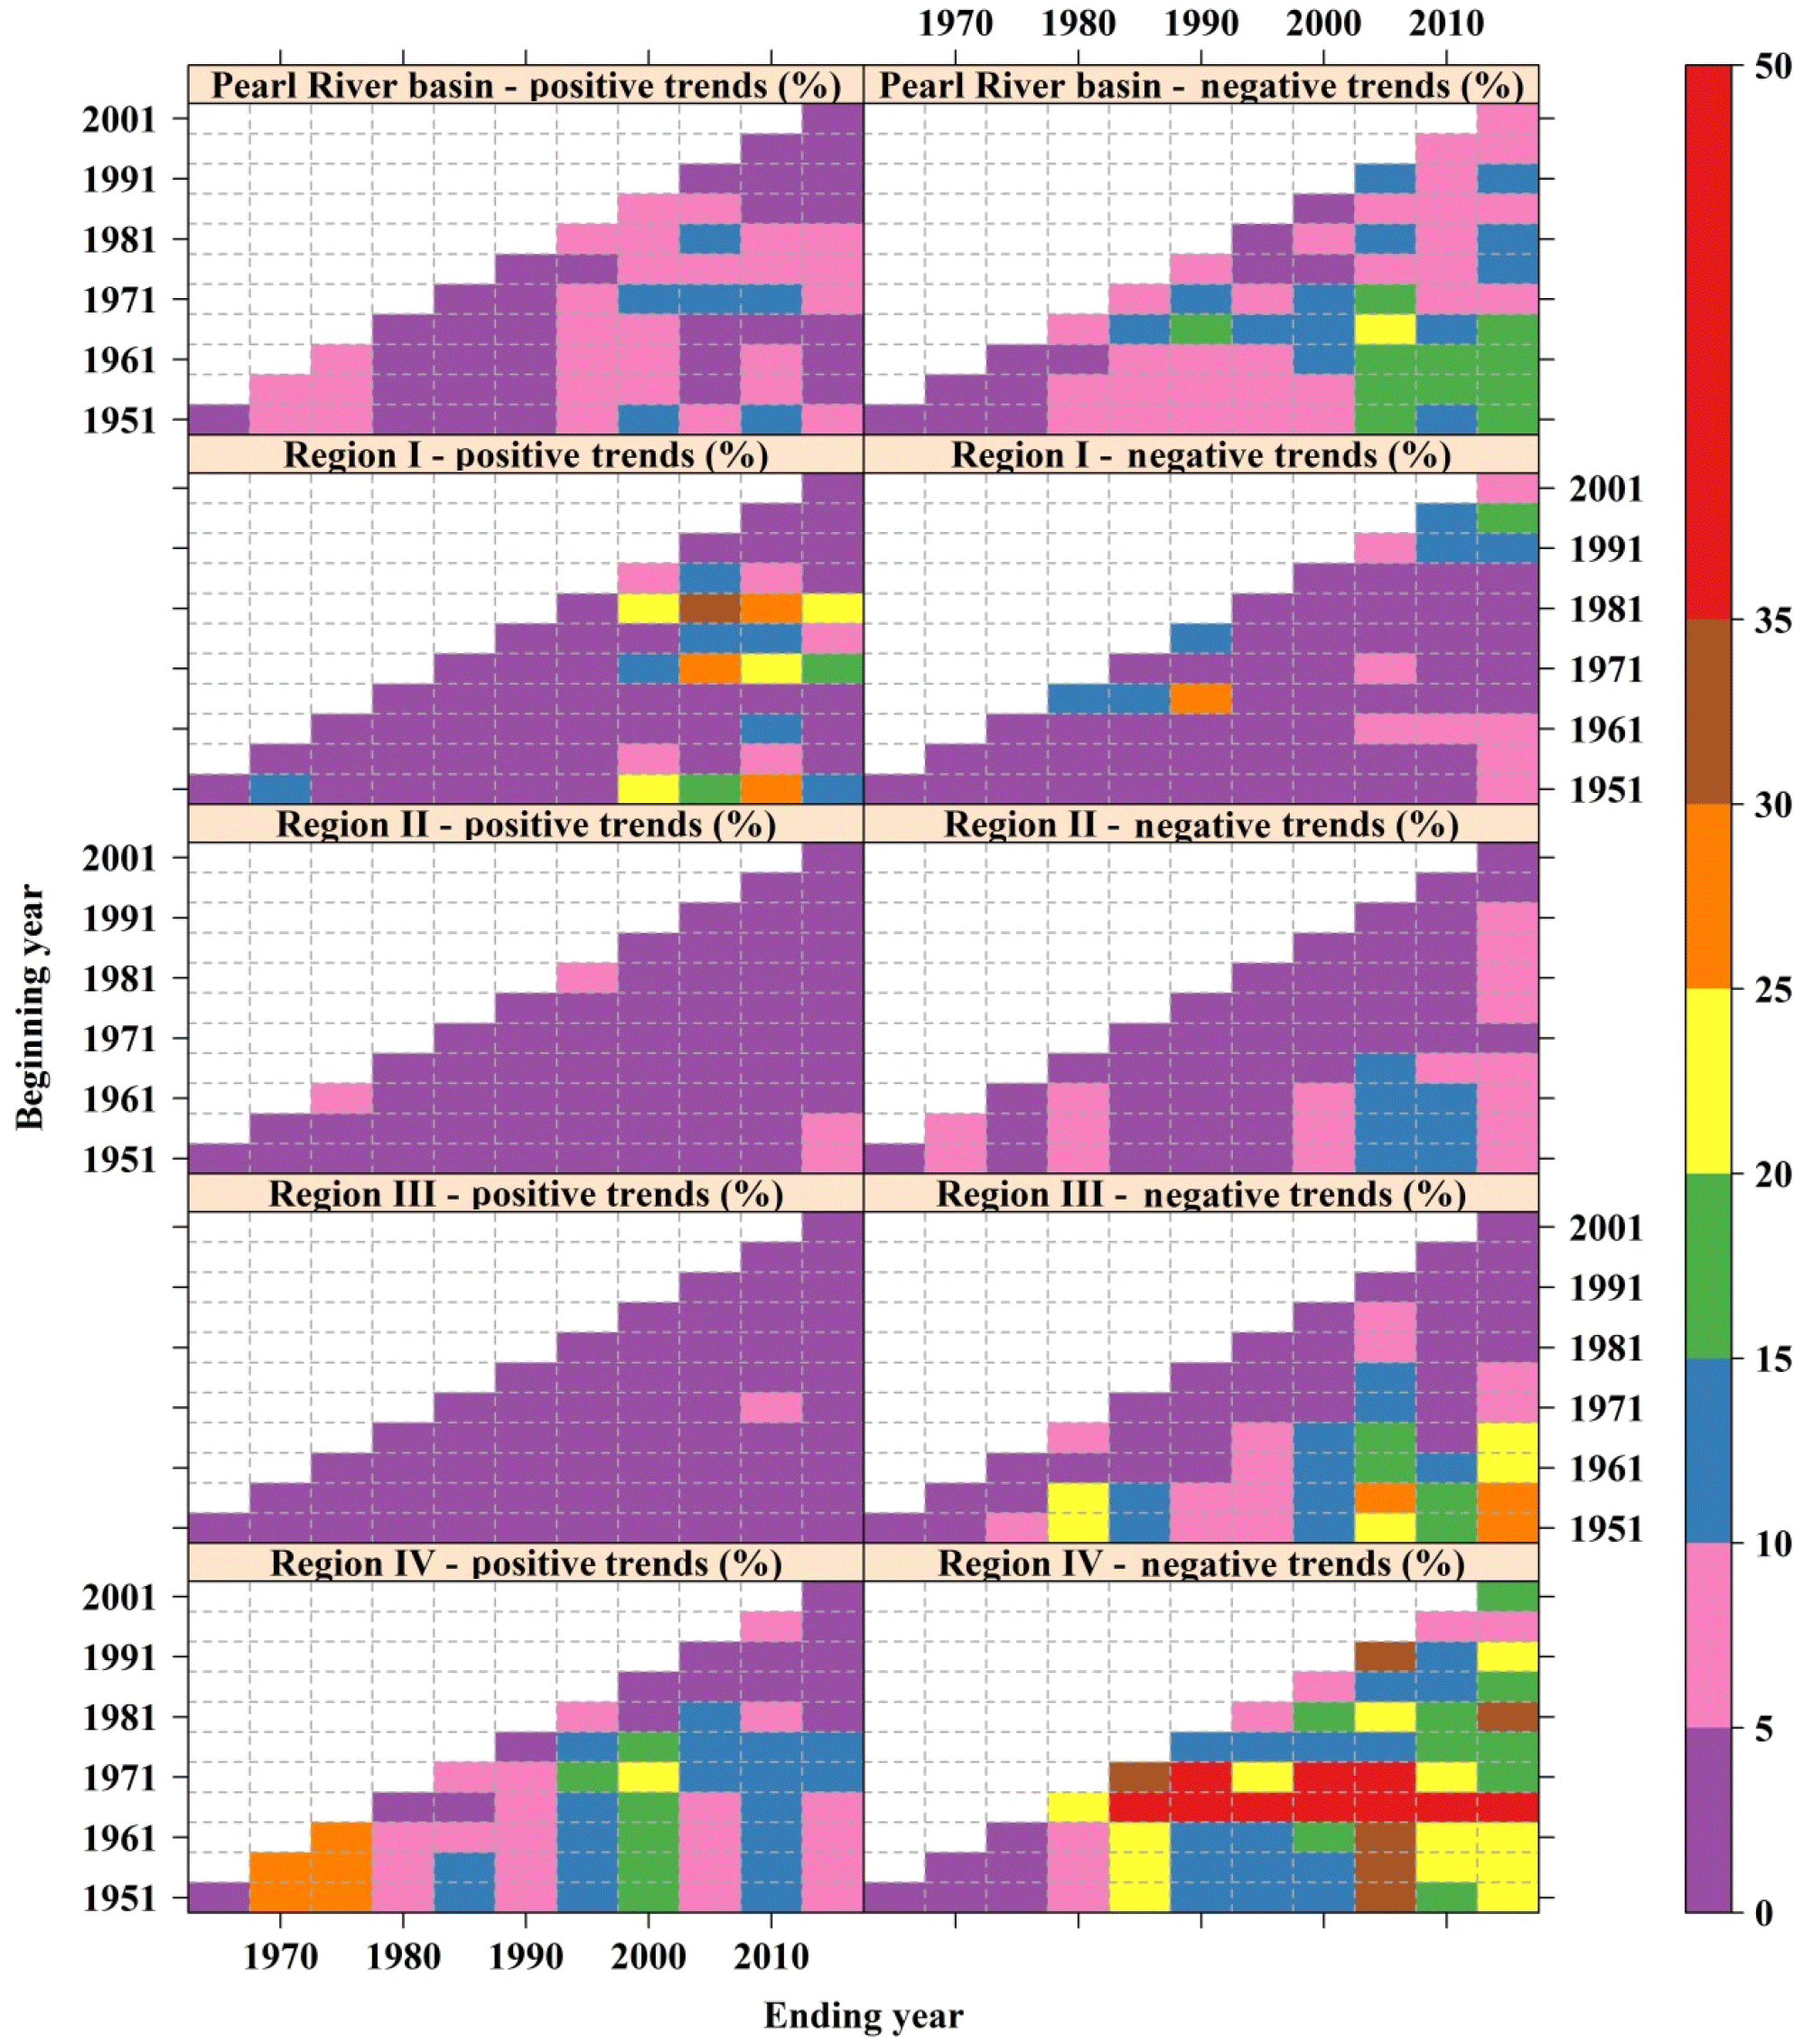
To determine trends of peak flood flow during specific time intervals, multi-scale trend analysis was done (Fig. 5). Trends were identified by changing the time interval by shifting the beginning and ending time of the interval by a time step of 5 years. The shortest time interval was 15 years to ensure the validity of statistical analysis. The percentages of stations with significant trends were also analyzed (Fig. 5). The percentage of stations with significant trends in almost all time intervals was relatively low, being about 15 % and even lower. However, stations with significant decreasing trends of peak flood flow during 1966–2005 accounted for 20–25 % of the total stations considered in the study (Fig. 5). Significant increasing peak flood flow was identified during 1981–2010 in the West River basin, and stations with significant increasing peak flood flow during 1981–2010 accounted for 25–35 % of the total stations. Stations with significant decreasing peak flood flow during 1966–1990 accounted for 25–30 % of the total stations (Fig. 5). Peak flows in the North River basin had moderate changes without statistically detectable trends (Fig. 5). Significant decreasing peak flood flow can be observed at the stations in the East River basin or eastern parts of the region III, and stations with significant decreasing peak flood flow during 1951–1980 and 1951–2014 accounted for 20–25 and 25–30 % of the total stations (Fig. 5). Stations with significant decreasing peak flood flow were fewer in number after 1981 (Fig. 5), implying amplified flood regimes after 1981 in the eastern parts of the region III. Larger changing variability of peak flood flow in the western parts of the region III was observed. Stations with significant increasing peak flood flow during 1951–1975 accounted for 30–35 %, and fewer stations were characterized by significant increasing peak flood flow after 1966. Peak flood flow after 1966 turned out to be significantly decreasing (Fig. 5); stations with significant decreasing peak flood flow accounted for 35–50 % of the total stations.
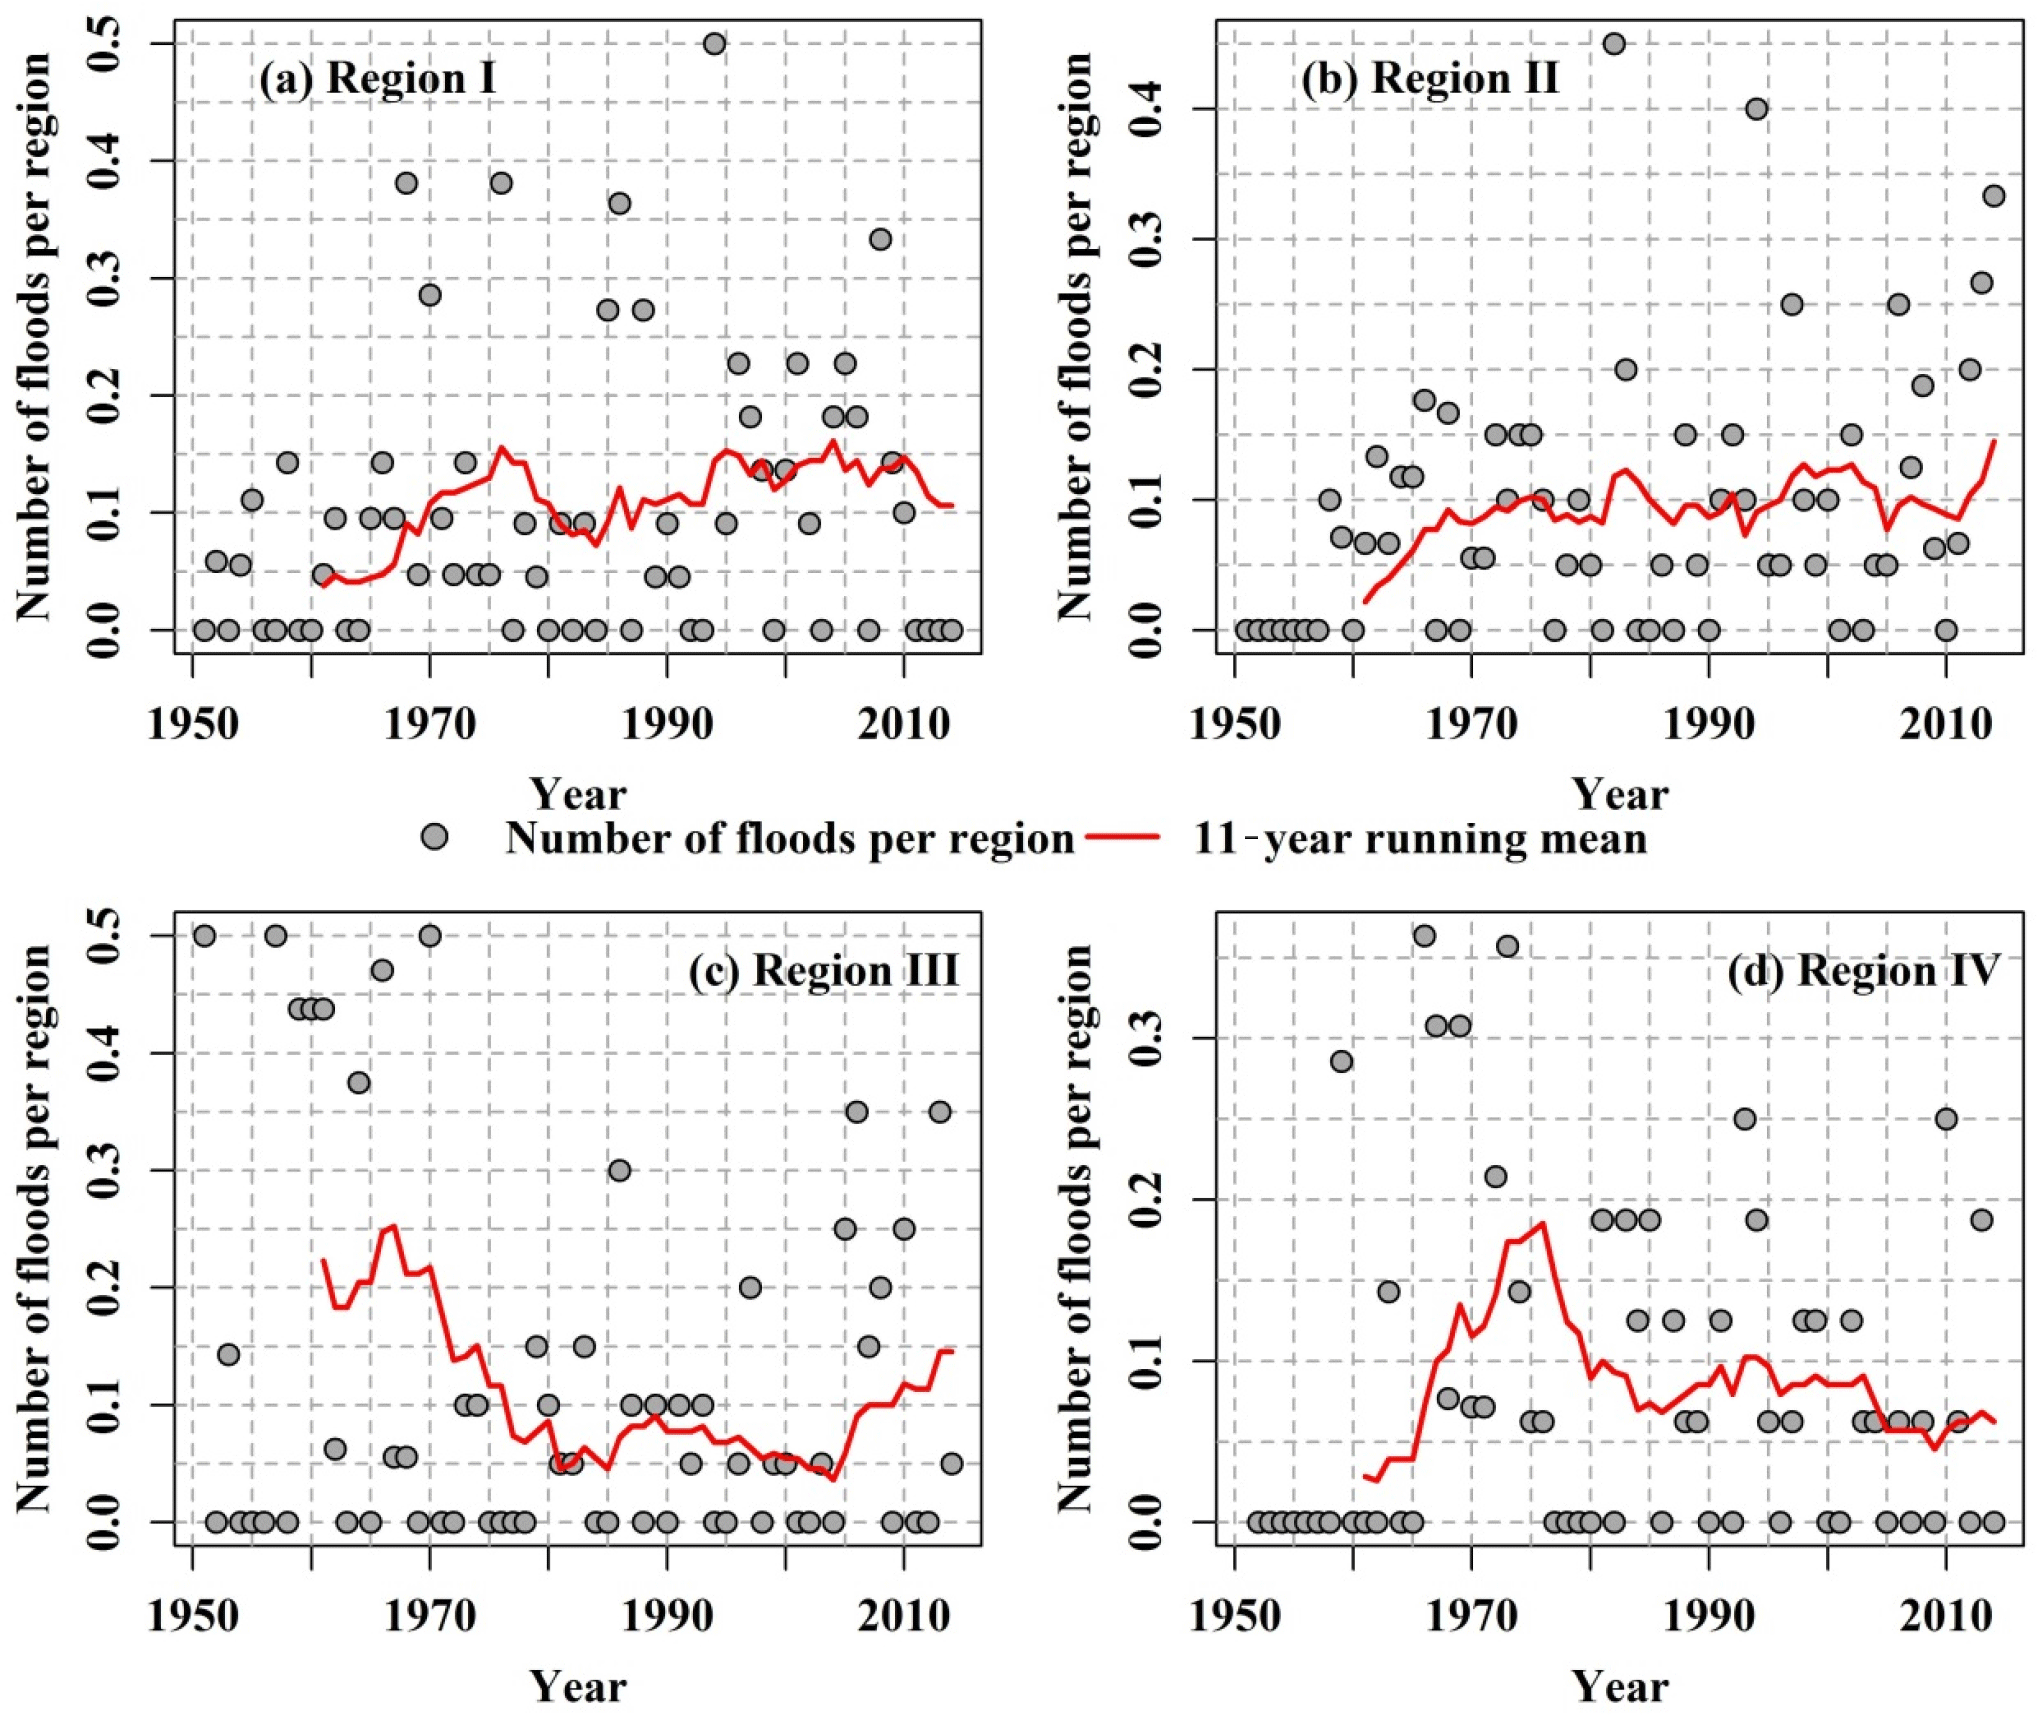
Figure 8Temporal changes of percentage of stations with flood events of magnitude of > 10-year flood magnitude.
The detailed information of flood events that occurred in the past 60 years can be used to verify the observed results in Fig. 5. For example, we observed significant increasing peak flood flow during 1981–2010 in the West River basin. The recorded flood events also showed that the floods with high magnitude intensively occurred in this period (i.e., 1981–2010). During 20 years from 1981 to 2000 only, the West River basin was hit by five floods with return periods larger than 20 years: (1) a flood during 18–23 June 1983, which caused 147 deaths; (2) a flood during 21 August–September 1988, which caused 58 deaths; (3) a flood during 12–17 June 1994, which caused 224 deaths; (4) a flood during 16–19 July 1996, which caused 252 deaths; and (5) a flood during 16–26 June 1998, which caused 81 deaths.
4.2 GEV-based flood frequency
The GEV model was used to fit peak flood flow series (i.e., annual maxima of period of 1951–2014) and the Kolmogorov–Smirnov (K–S) statistic D was used to evaluate the goodness of fit of GEV-based fitting performance (Fig. 6). Figure 6 indicated that peak flood flow series at almost all stations, except two stations, was well modeled by the GEV at 0.05 significance level. The peak flood flow series at these two stations were also modeled by the GEV at the 0.1 significance level. Therefore, the GEV was used for flood frequency analysis across the Pearl River basin. Return periods of floods at all hydrological stations were estimated and spatial patterns were also characterized across the basin. It can be observed from Fig. 7 that floods of > 10-year flood magnitude occurred with high frequency. However, large floods occurred in a clustering manner at the annual timescale. About 40 % of the total number of the three largest flood events of all stations occurred during two time intervals, i.e., 1965–1970 and 1993–2002 (i.e., 90 of total 236) (Fig. 7). This is particularly true of region I, where 38 out of 66 three largest floods occurred at 22 stations during these two time intervals (region I in Fig. 7). There was no temporal clustering observed for the three largest floods that occurred in the North River basin, but the spatial concentration was identified (region II in Fig. 7). Taking the great floods that occurred during May 1982 across the entire North River basin as an example, flood events > 10-year floods were observed at 9 out of 20 stations, and the largest three floods measured were observed at 7 stations.
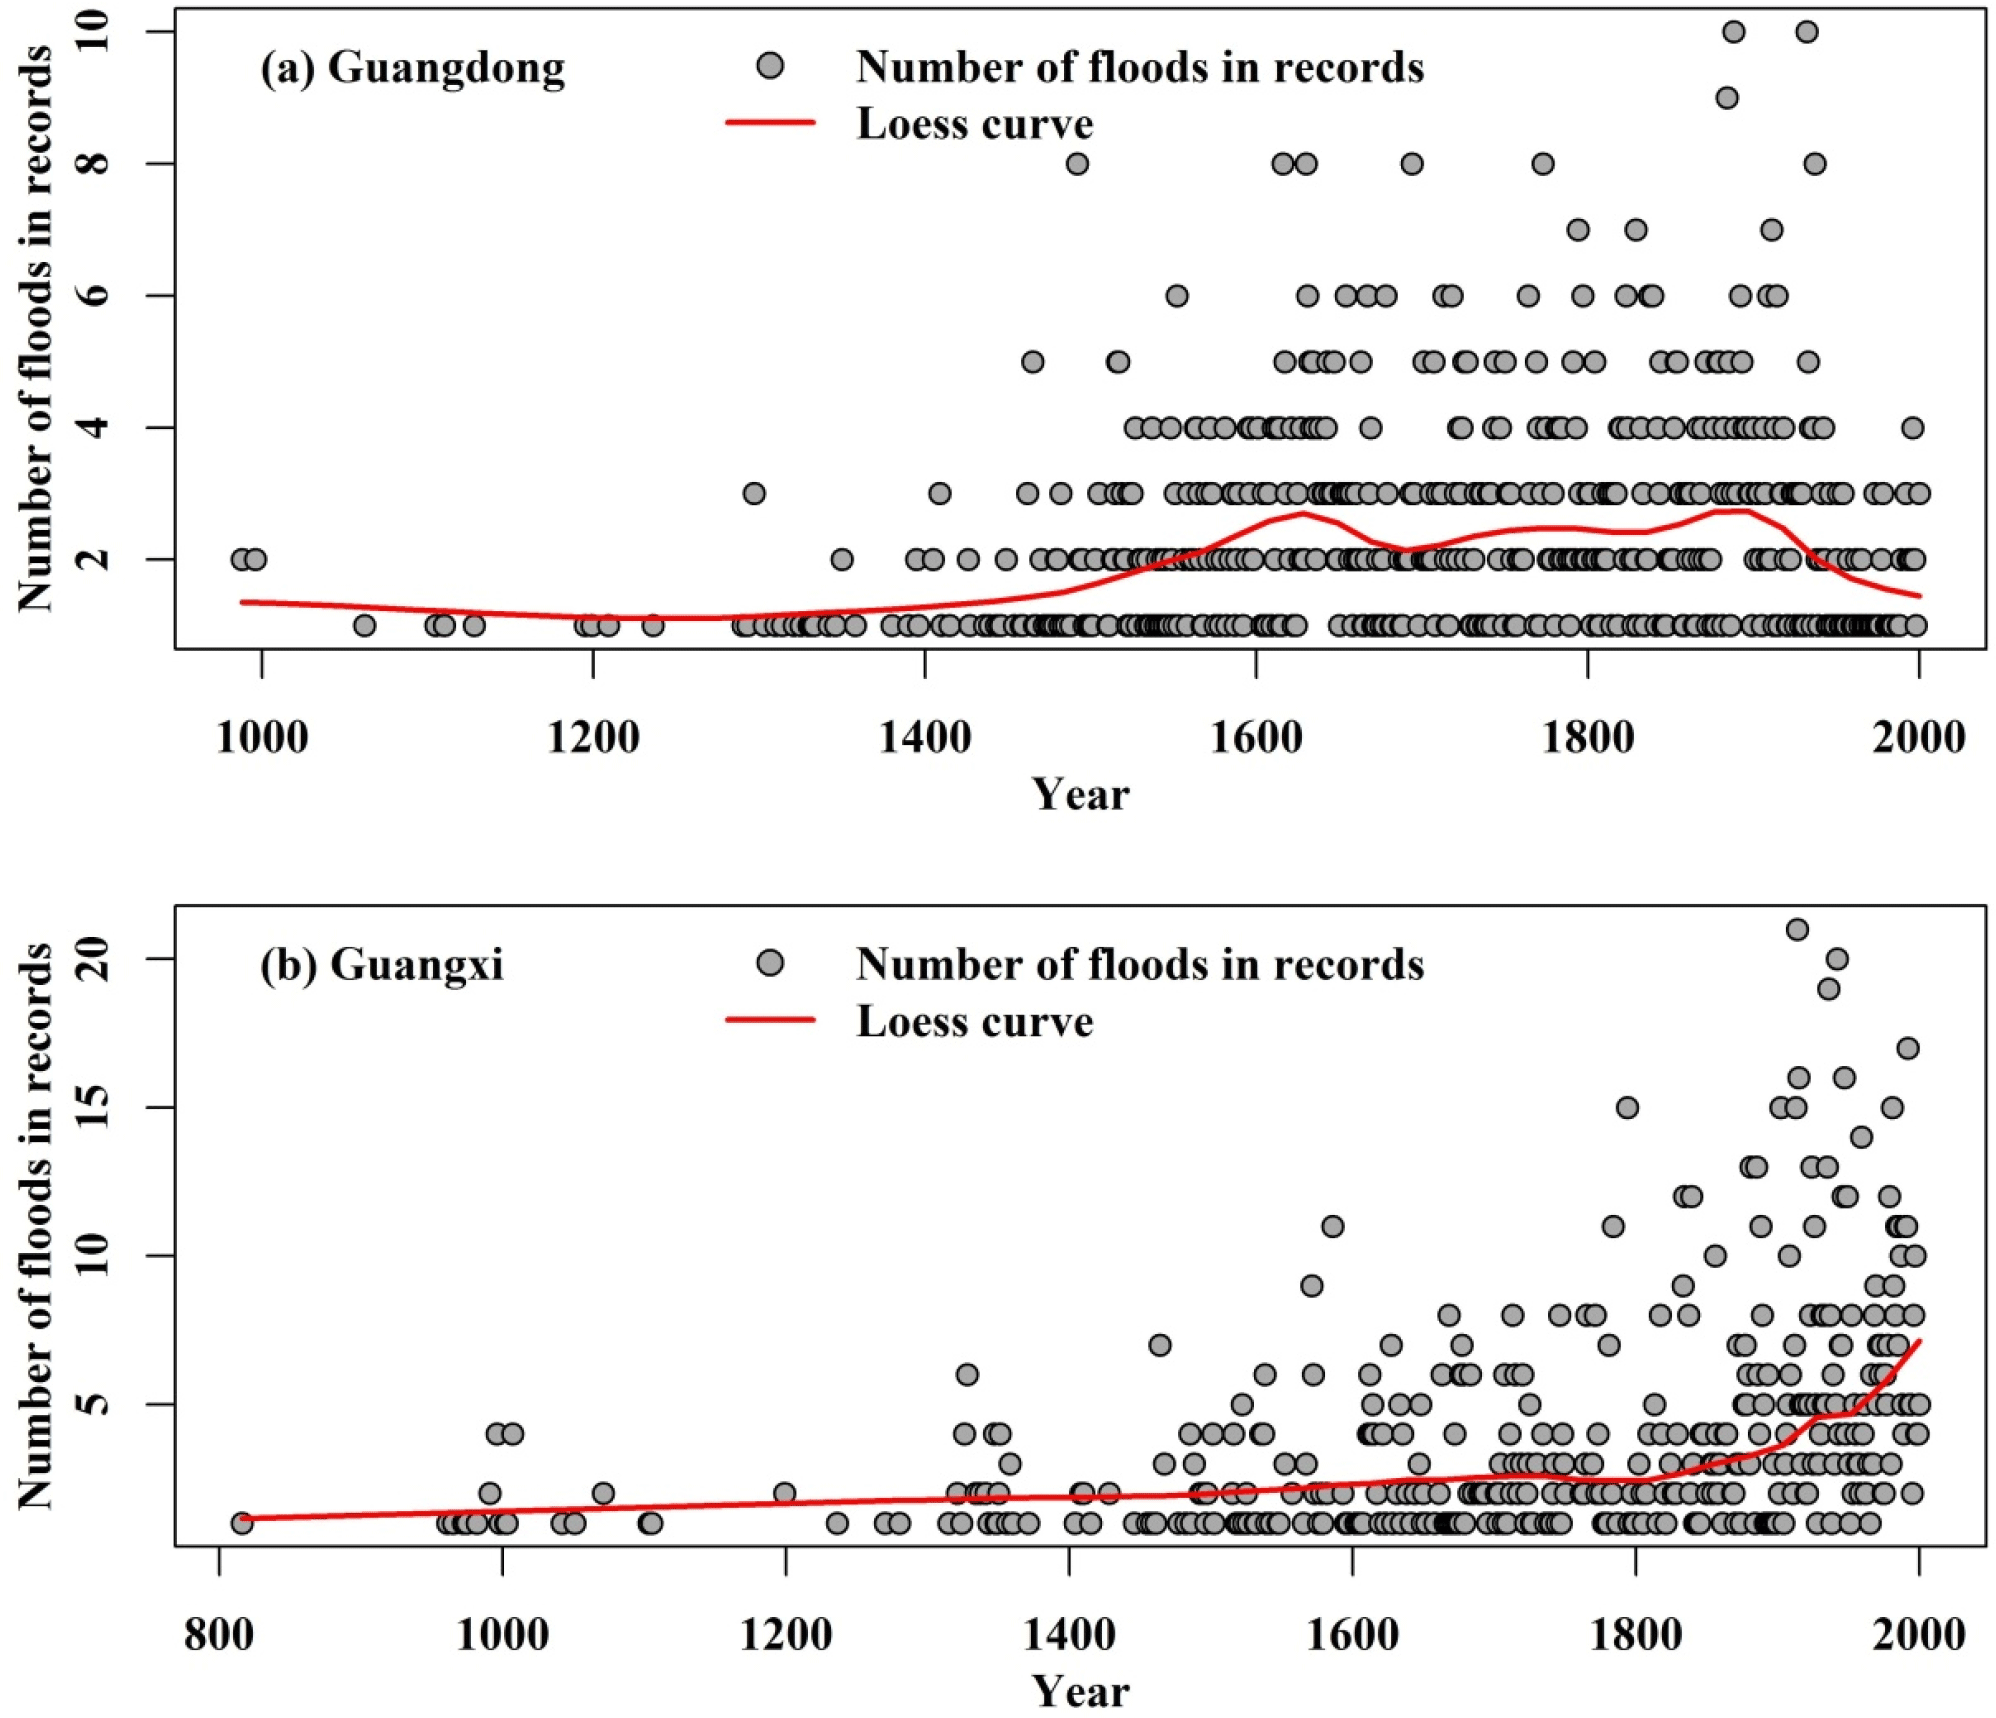
Figure 9Temporal changes in occurrence rates of flood hazards of the past 1000 years in Guangdong (a) and Guangxi provinces (b).
The survey of floods across the West and North River basins indicated that higher probability was expected for the simultaneous occurrence of floods in both North and West River basins. For example, 1994 was a serious flooding year and floods that occurred in the West River basin at 11 stations were larger than 10-year floods and 7 out of 11 stations were dominated by the largest three floods of the recorded floods. Meanwhile, peak flood flows at 8 stations in the North River basin were larger than 10-year flood and 6 out of 8 stations were dominated by the three largest floods recorded. The occurrence of large floods in the east parts of region III was evidently uneven in time and the measured largest three floods occurred mainly during 1958–1969, and decreased occurrence rates were observed for large floods after 2005. However, floods > 10-year floods were amplified after 2005. The occurrence of large floods in the eastern parts of region III was also subject to spatial clustering, and floods > 10-year floods were usually observed at numerous stations at the same time (region III in Fig. 7). Moreover, large floods occurred in a clustering manner during 1966–1974 and occurrence rates of large floods after 1980 exhibited moderate changes (region IV in Fig. 7).
The percentage of stations with flood regimes > 10-year floods to the total stations for each region was counted and trends were evaluated by the 11-year moving average method (Fig. 8), with the aim to determine the occurrences of large floods in both space and time. It can be seen from Fig. 8a that the percentage of stations dominated by the occurrence of large floods in West River basin had moderate changes with a slight increasing tendency (Fig. 8a), and particularly after 1990. The percentage of stations dominated by the occurrence of large floods had an increasing tendency, and this increasing tendency was maintained during the entire time interval considered in this study (Fig. 8b). The percentage of stations with the occurrence of large floods followed similar changing patterns, i.e., increase and then decrease, implying enhanced risks of floods across the entire region (Fig. 8c ,d).

Figure 10Temporal variations of frequency of flood hazards during the past 1000 years in Guangdong and Guangxi provinces.
4.3 Flood risks based on historical flood records
Based on historical flood records, the occurrence rates of floods during the past 1000 years in the Guangdong and Guangxi provinces were analyzed, and a local polynomial regression fitting technique was used to smooth the series. It can be observed from Fig. 9a that the occurrences of floods had increasing trends before AD 1600 and reached the peak value in about AD 1600 in Guangdong Province. The occurrences of floods had moderate variations during 1600–1900 with moderate variability. These results will be further evaluated using the kernel density estimation method in the next section. However, the occurrence of floods in Guangxi Province told another story when compared to those in Guangdong Province (Fig. 9b). A moderate increasing tendency of occurrence rates of floods was observed before 1800 AD and the time interval after AD 1800 witnessed abruptly elevating occurrence rates of floods, and this is particularly the case during the past 100 years, i.e., 1900–2000 (Fig. 9b).
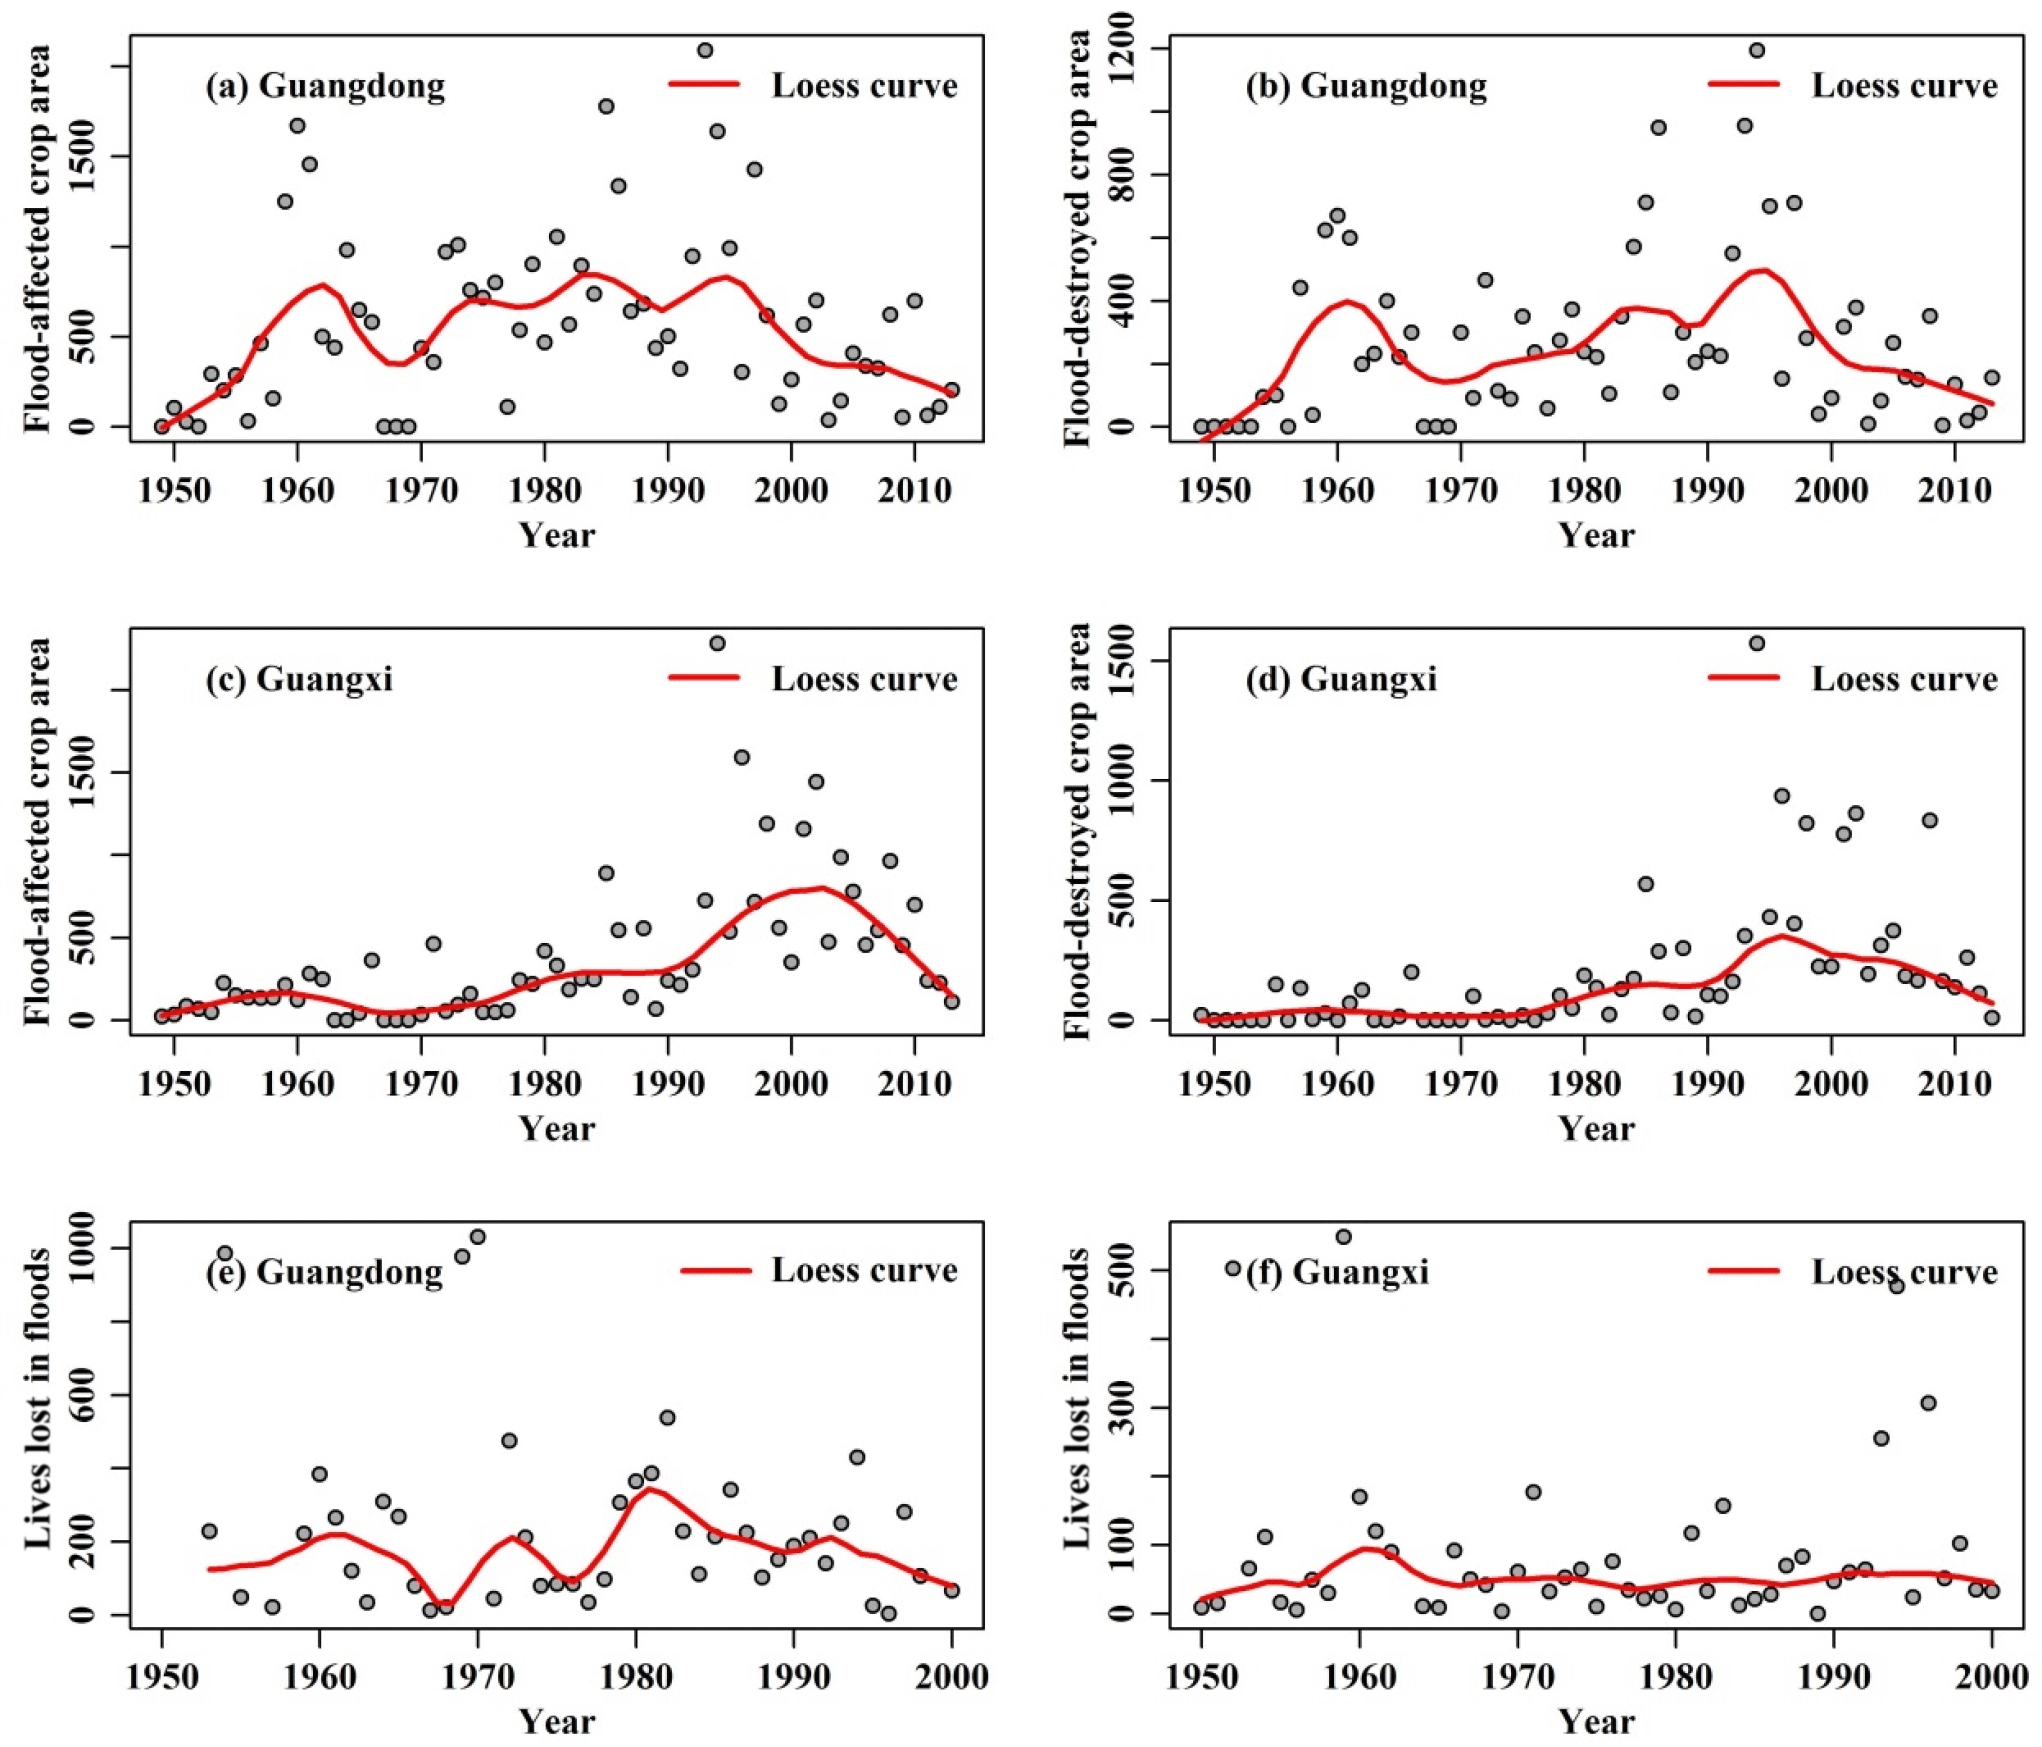
Figure 11Temporal changes of flood-hazard-induced crop areas and mortality in Guangdong and Guangxi provinces.
Basin-scale hazardous flood events were identified based on the flood criterion defined by Mudelsee et al. (2003, 2004). Meanwhile, flood risks of the past 1000 years were evaluated using the kernel estimation method (Fig. 10). The width of the time window was 56 years and 41 years for hazardous floods in the Guangdong and Guangxi provinces based on the cross-validation method (Fig. 10b, d). Moreover, the time window of 30 years was used to have a closer look at the occurrence rates of hazardous floods (Fig. 10a, c). It can be seen from Fig. 10 that hazardous floods had an increasing tendency in general, except the time interval of 1400–1800, which was characterized by decreasing occurrence rates. The past 200 years witnessed a sharp amplification of floods in the Guangxi and Guangdong provinces. Significant amplification of floods in the middle and lower Pearl River basin, and particularly in the past 200 years, should attract considerable concern.
Because the period of the past 60 years is a segment in the past 1000 years, analyzing the historical flood records is beneficial for understanding the changes in flooding during the past 60 years. For example, we observed increasing trends in floods in region I (most parts in Guangxi Province) during the past 60 years. Actually, basin-scale hazardous flood events have shown a sharp amplification in the past 200 years in Guangxi Province. As we all know, the influences of human activities on flood generations are considerable smaller in the past 200 years (except for the past 60 years) than in the past 60 years and are even neglected. However, human-induced climate change has enhanced continually in the past 200 years when the world experienced the industrial revolution. Therefore, the increasing flooding in the past 60 years, beginning in the past 200 years in Guangxi Province, is very likely caused by climate change.
Change points and trends analyses showed that only a few stations showed a change point or significant trend in the flood peaks. In other words, the flood peaks are stationary in most of the stations considered in this study. Our previous study has also detected the trends in flood peaks before and after the change points, indicating that no significant trends have been found (e.g., Zhang et al., 2014). Taking change points in the West River as an example, change points of flood peaks in the mainstream of the West River occurred in approximately 1990 in spite of a few differences. The flood peaks of the West River basin are heavily influenced by the confluences of tributaries on the upstream of the West River, and the factors causing abrupt changes in the mean are complicated and unclear. The influence of hydraulic facilities is considerable. However, after the 1990s a few hydraulic facilities were constructed and their influence can be ignored. Analysis of precipitation extremes in the Pearl River basin indicated that the amount of rainfall changed little but its variability increased over the time interval divided by change points. Abrupt changes of precipitation maxima shifted in different seasons. However, change points of precipitation maxima in summer occurred in 1990, 1988, and 1991, which are in line with changes points of flood peaks of the West River basin. It should be noted that floods mainly occur during the summer season. Therefore, it can be tentatively stated that abrupt changes of flood peaks of the West River basin are mainly the result of abrupt behavior of precipitation maxima. However, due to spatiotemporal patterns of precipitation maxima in the Pearl River basin and the production and confluence of flood streamflow, the abrupt behavior of flood peaks usually does not match that of precipitation maxima. Moreover, human interference also introduces considerable uncertainty and causes obscure relations between abrupt changes of flood peaks and precipitation maxima. This analysis implies abrupt changes of flood peaks due to various influencing factors.
The Guangdong Province is dominated by high urbanization, a highly developed socio-economy, and a high population density, and this is particularly the case for the PRD region (Fig. 1b, c, and d). Intense human activities, such as in-channel sand dredging, building of levees, and fast urbanization, have greatly altered physical and geographical features of underlying surfaces and hence modified the flooding processes. The volume of sand dredged during the 1990s in the North and East River basins was, respectively, 3.38×10⁶ and 1.50×10⁶ m3 year−1, causing deepening of the river channel (e.g., Luo et al., 2007). Massive building of levees and simplification of river channel systems have caused widespread gathering of floodwaters and hence amplification of floods.
Taking the PRD as an example, during the past 60 years, more than 20 000 levees were combined with 400 levees, and the length of river channel was reduced from 10 000 to 5000 km. In addition, the construction of large-scale reservoirs greatly reduced the occurrence rates and magnitude of floods (Fig. 11a, b and c). However, fast and massive urbanization, such as the urbanization rate of the Guangdong Province reaching 67.67 %, caused fast production of floods and hence enhanced flood risk (Fig. 10a). Increasing flood magnitudes in the past 60 years (Fig. 3a) and increasing occurrence rates of floods in the past 100 years (Fig. 9b) caused increased losses of agricultural production and increased numbers of casualties (Fig. 11c, d, and f). However, when compared to Guangdong Province, Guangxi Province was dominated by lower urbanization and a lower population density (Fig. 1d); human activities did not exert significant impacts on floods. Increasing precipitation extremes and particularly increasing precipitation concentration (Zhang et al., 2012, 2013) triggered discernable amplification of floods in the Guangxi Province. Therefore, the past 200 years also witnessed the intensification of hazardous floods, which undoubtedly posed a challenge for the mitigation of flood hazards in the lower Pearl River basin, particularly the PRD region. Although the fluvial disastrous floods may be ignored in earlier time periods, the increases in the number of extreme floods are significant and sharp. The lack of reported flood events in earlier years may be one of the reasons for these sharp increases. However, we think it is not enough to explain this. Taking Guangxi Province as an example, the significant increase is continual, especially for the past 200 years (Fig. 9b). In the past 200 years, the lack of reported extreme floods did not make so much difference and the number of floods was still significantly increasing. When researchers try to use historical flood records, the lack of reported flood events is the problem that all users must face; it was not only a problem for us but also for Mudelsee et al. (2003). In addition, the time span is larger, the problem is more difficult to solve. Nevertheless, historical flood information can definitely provide valuable information to improve our understanding of the changes in flood frequency.
Evaluation of flood risks was done in both space and time across the Pearl River basin, China, based on peak flood flow data from 78 hydrological stations during the period of 1951–2014 and 1000-year flood hazard records. The following conclusions can be drawn from this study.
No statistically significant changes can be detected in the peak flood flow series at most of the stations, but significant changes were observed at 16 out of 78 stations. Stations with significant peak flood flow changes were found in the mainstream of the West River basin, the East River basin, and rivers in the western parts of the coastal regions, and the change points were mainly during the 1990s. Abrupt changes of peak flood flow in the West River basin were attributed to the abrupt behavior of precipitation extremes. The construction of large-scale hydraulic facilities and reservoirs was the major cause behind abrupt behavior of peak flood flow in the coastal regions.
The northern parts and mainstream of the West River basin and northern North River basin were dominated by significant increasing peak flood flow, implying amplification of floods. Peak flood flow in the East River basin however had significant decreasing trends which were attributed to the changes in precipitation extremes. It should be emphasized that precipitation extremes were increasing in the southeastern West River basin and western parts of the coastal regions, and peak flood flow in these regions was decreasing. Expanding agricultural irrigation and hydrological regulation of reservoirs were the causes of decreasing peak flood flow in these regions. A closer look at the abrupt behavior of peak flood flow indicated that significant increasing peak flood flow was identified during 1981–2010 at 25–35 % of the stations in the West River basin; significant decreasing peak flood flow was observed during 1951–2014 at 25–30 % of the stations in the East River basin; and 30–35 % of the stations in the western parts of the coastal region were dominated by significant increasing peak flood flow during 1951–1975, and 35–50 % of the stations were dominated by significant decreasing peak flood flow.
The largest three flood events were concentrated during two time intervals, i.e., 1965–1970 and 1993–2002. The percentage of stations characterized by floods > 10-year floods increased after 1975. The East River basin was dominated by the concentrated occurrence of the three largest flood events during 1958–1969, and the percentage of stations with floods > 10-year floods increased after 2000. Results indicated temporal and spatial clustering of flood hazards. This point should attract considerable concern for the mitigation to flood hazards.
Historical flood records of the past 1000 years have told an interesting story about flood risks in basin-scale hazardous flood events from a long-term perspective. Flood risks of the middle and lower Pearl River basin were enhanced, and this is particularly the case in the past 100 years. Particularly, the flood risks in the middle and lower Pearl River basin in terms of disastrous flood regimes increased, posing serious challenges for the mitigation of flood hazards in the PRD region.
The annual largest 1-day streamflow data (i.e., annual maxima) were collected from the Water Conservancy Bureau of the Pearl River Water Conservancy Commission. These datasets are not publicly accessible due to governmental restrictions, but can be obtained by writing to the corresponding authors. Daily precipitation data were provided by the National Climate Center, China, which can be publicly accessed at http://data.cma.cn/ (last access: 23 April 2018). The information from historical flood records was collected from two books, i.e., Collections of meteorological hazards in China: Guangdong volume and Guangxi volume (Wen and Song, 2006; Wen and Yang, 2007). Both of these books have been published in public.
The authors declare that they have no conflict of interest.
This work is financially supported by the Fund for the National Natural Science
Foundation of China (grant no. 41771536), the National Science Foundation for
Distinguished Young Scholars of China (grant no. 51425903), the Creative Research
Groups of the National Natural Science Foundation of China (41621061), and the
Fundamental Research Funds for the Central Universities, China University of
Geosciences (Wuhan) (grant no. CUG180614). In addition, our cordial gratitude
should be extended to the editor, Fuqiang Tian, two anonymous
reviewers, and Natascha Töpfer as well for their professional and
pertinent comments and suggestions, which were greatly helpful for further
quality improvement of this manuscript. Detailed information such as data can
be obtained by writing to the corresponding author at
zhangq68@mail.sysu.edu.cn.
Edited by:
Fuqiang Tian
Reviewed by: two anonymous referees
Alan, D. Z., Justin, S., Edwin, P. M., Bart, N., Eric, F. W., and Dennisa, P. L.: Detection of intensification in global- and continental-scale hydrological cycles: Temporal scale of evaluation, J. Climate, 16, 535–547, 2003.
Beniston, M. and Stephenson, D. B.: Extreme climatic events and their evolution under changing climatic conditions, Global Planet. Change, 44, 1–9, 2004.
Beniston, M., Stephenson, D. B., Christensen, O. B., Ferro, C. A. T., Frei, C., Goyette, S., Halsnaes, K., Holt, T., Jylhä, K., Koffi, B., Palutikof, J., Schöll, R., Semmler, T., and Woth, K.: Future extreme events in European climate: an exploration of regional climate model projections, Climatic Change, 81, 71–95, 2007.
Bouwer, L. and Vellinga, P.: Changing climate and increasing costs-implications for liability and insurance climatic change: implications for the hydrological cycle and for water management, edited by: Beniston, M., Springer, Netherlands, 429–444, 2003.
Burn, D. H. and Whitfield, P. H.: Changes in floods and flood regimes in Canada, Can. Water Resour. J., 1784, 1–12, 2015.
Cannon, A. J.: A flexible nonlinear modelling framework for nonstationary generalized extreme value analysis in hydroclimatology, Hydrol. Process., 24, 673–685, 2010.
Chen, Y. D., Zhang, Q., Xu, C.-Y., and Yang, T.: Change-point alterations of extreme water levels and underlying causes in Pearl River Delta, China, River Res. Appl., 25, 1153–1168, 2009.
Das, T., Maurer, E. P., Pierce, D. W., Dettinger, M. D., and Cayan, D. R.: Increases in flood magnitudes in California under warming climates, J. Hydrol., 501, 101–110, 2013.
Daufresne, M., Lengfellner, K., and Sommer, U.: Global warming benefits the small in aquatic ecosystems, P. Natl. Acad. Sci. USA, 106, 12788–12793, 2009.
Hamed, H. K. and Rao, R. A.: A modified Mann-Kendall trend test for autocorrelated data, J. Hydrol., 204, 182–196, 1998.
Gu, X., Zhang, Q., Singh, V. P., and Liu, L.: Nonstationarity in the occurrence rate of floods in the Tarim River basin, China, and related impacts of climate indices, Global Planet. Change, 142, 1–13, 2016.
Hall, J., Arheimer, B., Borga, M., Brázdil, R., Claps, P., Kiss, A., Kjeldsen, T. R., Kriauciuniene, J., Kundzewicz, Z. W., Lang, M., Llasat, M. C., Macdonald, N., McIntyre, N., Mediero, L., Merz, B., Merz, R., Molnar, P., Montanari, A., Neuhold, C., Parajka, J., Perdigão, R. A. P., Plavcová, L., Rogger, M., Salinas, J. L., Sauquet, E., Schär, C., Szolgay, J., Viglione, A., and Blöschl, G.: Understanding flood regime changes in Europe: a state-of-the-art assessment, Hydrol. Earth Syst. Sci., 18, 2735–2772, https://doi.org/10.5194/hess-18-2735-2014, 2014.
Hirsch, M. R. and Archfield, S. A.: Not higher but more often, Nat. Clim. Change, 5, 198–199, 2015.
IPCC: Climate change: The physical science basis, United Kingdom and New York, NY, USA, Cambridge University Press, 2007.
IPCC: Summary for policymakers, in: The Physical Science Basis, Contribution of Working Group I to the Fifth Assessment Report of the Intergovernmental Panel on Climate Change, edited by: Stocker, T. F., Qin, D., Plattner, G.-K., Tignor, M., Allen, S. K., Boschung, J., Nauels, A., Xia, Y., Bex, V., Midgley, P. M., Cambridge University Press, 2013.
Jena, P. P., Chatterjee, C., Pradhan, G., and Mishra, A.: Are recent frequent high floods in Mahanadi basin in eastern India due to increase in extreme rainfalls?, J. Hydrol., 517, 847–862, 2014.
Kjeldsen, T. R., Macdonald, N., Lang, M., Mediero, L., Albuquerque, T., Bogdanowicz, E., Brazdil, R., Castellarin, A., David, V., Fleig, A., Gul, G. O., Kriauciuniene, J., Kohnova, S., Merz, B., Nicholson, O., Roald, L. A., Salinas, J. L., Sarauskiene, D., Šraj, M., Strupczewski, W., Szolgay, J., Toumazis, A., Vanneuville, W., Veijalainen, N., and Wilson, D.: Documentary evidence of past floods in Europe and their utility in flood frequency estimation, J. Hydrol., 517, 963–973, 2014.
Li, J., Chen,Y. D., Zhang, L., Zhang, Q., and Chiew, F. H. S.: Future changes in floods and water availability across China: Linkage with changing climate and uncertainties, J. Hydrometeorol., 17, 1295–1314, 2016.
Luo, X. L., Zeng, E. Y., Ji, R. Y., and Wang, C. P.: Effects of in-channel sand excavation on the hydrology of the Pearl River Delta, China, J. Hydrol., 343, 230–239, 2007.
Mudelsee, M., Börngen, M., Tetzlaff, G., and Grünewald, U.: No upward trends in the occurrence of extreme floods in central Europe, Nature, 425, 166–169, 2003.
Mudelsee, M., Börngen, M., Tetzlaff, G., and Grünewald, U.: Extreme floods in central Europe over the past 500 years: Role of cyclone pathway “Zugstrasse Vb”, J. Geophys. Res., 109, D23101, https://doi.org/10.1029/2004JD005034, 2004.
Nicholls, N.: Long-term climate monitoring and extreme events, Climatic Change, 31, 231–245, 1995.
Ohmura, A. and Wild, M.: Is the hydrological cycle accelerating?, Science, 298, 1345–1346, 2002.
Pettitt, A. N.: A non-parametric approach to the change-point problem, Appl. Stat., 28, 126–135, 1979.
Pino, D., Ruiz-Bellet, J. L., Balasch, J. C., Romero-León, L., Tuset,J., Barriendos, M., Mazon, J., and Castelltort, X.: Meteorological and hydrological analysis of major floods in NE Iberian Peninsula, J. Hydrol., 541, 63–89, 2016.
PRWRC (Pearl River Water Resources Committee): The Zhujiang Archive, vol 1, Guangdong Science and Technology Press, Guangzhou, 1991 (in Chinese).
Villarini, G., Serinaldi, F., Smith, A. J., and Krajewski, F. W.: On the stationarity of annual flood peaks in the continental United States during the 20th century, Water Resour. Res., 45, W08417, https://doi.org/10.1029/2008WR007645, 2009.
Vormoor, K., Lawrence, D., Schlichting, L., Wilson, D., and Wong, W. K.: Evidence for changes in the magnitude and frequency of observed rainfall vs. snowmelt driven floods in Norway, J. Hydrol., 538, 33–48, 2016.
Wen, K. and Song, L.: Collections of meteorological hazards in China-Guangdong version, Beijing, Meteorological Press, 2006.
Wen, K. and Yang, N.: Collections of meteorological hazards in China-Guangxi version, Beijing, Meteorological Press, 2007.
Zhang, Q., Xu, C.-Y., Becker, S., Zhang, Z. X., Chen, Y. D., and Coulibaly, M.: Trends and abrupt changes of precipitation maxima in the Pearl River basin, China, Atmos. Sci. Let., 10, 132–144, 2009.
Zhang, Q., Singh, V. P., Li, J., and Chen, X.: Analysis of the periods of maximum consecutive wet days in China, J. Geophys. Res., 116, D23106, https://doi.org/10.1029/2011JD016088, 2011.
Zhang, Q., Singh, V. P., Peng, J., Chen, Y. D., and Li, J.: Spatial-temporal changes of precipitation structure across the Pearl River basin, China, J. Hydrol., 440–441, 113–122, 2012.
Zhang, Q., Li, J., Singh, V. P., and Xiao, M.: Spatio-temporal relations between temperature and precipitation regimes: implications for temperature-induced changes in the hydrological cycle, Global Planet. Change, 111, 57–76, 2013.
Zhang Q., Gu X., Singh V. P., Xiao M., and Xu C.-Y.: Stationarity of annual flood peaks during 1951–2010 in the Pearl Riverbasin, China, J. Hydrol., 519, 3263–3274, 2014.
Zhang, Q., Gu, X., Singh, V. P., Xu, C.-Y., Kong, D., Xiao, M., and Chen, X.: Homogenization of precipitation and flow regimes across China: changing properties, causes and implications, J. Hydrol., 530, 462–475, 2015a.
Zhang, Q., Gu, X., Singh, V. P., Kong, D., and Chen, X.: Spatiotemporal behavior of floods and droughts and their impacts on agriculture in China, Global Planet. Change, 131, 63–72, 2015b.
Zhang, Q., Gu, X., Singh, V. P., Xiao, M., and Chen, X.: Evaluation of flood frequency under non-stationarity resulting from climate change and human activities in the East River basin, China, J. Hydrol., 527, 565–575, 2015c.
Zhang, Q., Liu, J., Singh, V. P., Gu, X., and Chen, X.: Evaluation of impacts of climate change and human activities on streamflow in the Poyang Lake basin, China, Hydrol. Process., 30, 2562–2576, 2016.
Zhang, Q., Gu, X., Li, J., Shi, P., and Singh, V. P.: The impact of tropical cyclones on extreme precipitation over coastal and inland areas of China and its association to the ENSO, J. Climate, 31, 1865–1880, https://doi.org/10.1175/JCLI-D-17-0474.1, 2018.
Zolina, O., Kapala, A., Simmer, C., and Gulev, K. S.: Analysis of extreme precipitation over Europe from different reanalysis: a comparative assessment, Global Planet. Change, 44, 129–161, 2004.