the Creative Commons Attribution 3.0 License.
the Creative Commons Attribution 3.0 License.
Pairing FLUXNET sites to validate model representations of land-use/land-cover change
Paul A. Dirmeyer
Zhichang Guo
Natalie M. Schultz
Land surface energy and water fluxes play an important role in land–atmosphere interactions, especially for the climatic feedback effects driven by land-use/land-cover change (LULCC). These have long been documented in model-based studies, but the performance of land surface models in representing LULCC-induced responses has not been investigated well. In this study, measurements from proximate paired (open versus forest) flux tower sites are used to represent observed deforestation-induced changes in surface fluxes, which are compared with simulations from the Community Land Model (CLM) and the Noah Multi-Parameterization (Noah-MP) land model. Point-scale simulations suggest the CLM can represent the observed diurnal and seasonal changes in net radiation (Rnet) and ground heat flux (G), but difficulties remain in the energy partitioning between latent (LE) and sensible (H) heat flux. The CLM does not capture the observed decreased daytime LE, and overestimates the increased H during summer. These deficiencies are mainly associated with models' greater biases over forest land-cover types and the parameterization of soil evaporation. Global gridded simulations with the CLM show uncertainties in the estimation of LE and H at the grid level for regional and global simulations. Noah-MP exhibits a similar ability to simulate the surface flux changes, but with larger biases in H, G, and Rnet change during late winter and early spring, which are related to a deficiency in estimating albedo. Differences in meteorological conditions between paired sites is not a factor in these results. Attention needs to be devoted to improving the representation of surface heat flux processes in land models to increase confidence in LULCC simulations.
- Article
(8415 KB) - Full-text XML
-
Supplement
(1119 KB) - BibTeX
- EndNote
Earth system models (ESMs) have long been used to investigate the climatic impacts of land-use/land-cover change (LULCC) (cf. Pielke et al., 2011; Mahmood et al., 2014). Results from sensitivity studies largely depend on the land surface model (LSM) that is coupled to the atmospheric model within ESMs. In the context of the Land-Use and Climate, Identification of Robust Impacts (LUCID) project, Pitman et al. (2009) found disagreement among the LSMs in simulating the LULCC-induced changes in summer latent heat flux over the Northern Hemisphere. de Noblet-Ducoudré et al. (2012) and Boiser et al. (2012) argued that the inter-model spread of LULCC sensitivity (especially regarding the partitioning of available energy between latent and sensible heat fluxes within the different land-cover types) highlights an urgent need for a rigorous evaluation of LSMs. From Phase 5 of the Coupled Model Intercomparison Project (CMIP5), Brovkin et al. (2013) also found different climatic responses to LULCC among the participating models, and the diverse responses are associated with different parameterizations of land surface processes among ESMs. To deal with the uncertainties in LULCC sensitivity among models, the Land Use Model Intercomparison Project (LUMIP) has been planned, with a goal to develop metrics and diagnostic protocols that quantify LSM performance and related sensitivities with respect to LULCC (Lawrence et al., 2016).
However, a paucity of useful observations has hindered the assessment of the simulated impacts of LULCC and limited the understanding of the discrepancies among models. In situ and satellite observations make it possible to quantify the impacts of LULCC on land surface variables. Satellite-derived datasets have been used to explore the albedo, evapotranspiration (ET), and land surface temperature changes due to historical LULCC (Boisier et al., 2013, 2014) and the climatic effects of forest (Li et al., 2015).
Meanwhile, the development of FLUXNET (Baldocchi et al., 2001) enables the study of land surface responses to different land-cover types based on paired field observations from neighboring flux towers over forest and open land (Juang et al., 2007; Lee et al., 2011; Luyssaert et al., 2014; Teuling et al., 2010; Williams et al., 2012). In terms of LSM evaluation, the paired site observations have been mainly used to simulated impacts of LULCC on land surface temperature (Chen and Dirmeyer 2016; Lejeune et al., 2016; Vanden Broucke et al., 2015). However, a more fundamental question, “whether a model can represent the observed LULCC-induced changes in surface energy fluxes well”, has not been thoroughly investigated, even though we know that the turbulent fluxes are tightly associated with both energy and water exchange between the land surface and atmosphere.
In this study, we evaluate the performance of the Community Land Model (CLM) version 4.5 and the Noah Multi-Parameterization (Noah-MP) LSM in simulating the impacts of LULCC on surface energy fluxes based on observations from FLUXNET sites. The CLM and Noah-MP represent perhaps the two most readily available and widely used state-of-the-art community land models developed in the US. The CLM is chosen because, as the land component of the Community Earth System Model (CESM), it prioritizes the simulation of biogeophysical and biogeochemical processes for climate applications (Oleson et al., 2013). Much effort has gone into improving the representation of the land–atmosphere interactions among different biomes (Bonan et al., 2011), and the model itself has been used for many LULCC sensitivity studies (e.g., Chen and Dirmeyer, 2016, 2017; Schultz et al., 2016; Lejeune et al., 2017; Lawrence et al., 2012). Noah-MP has found use mainly in shorter timescale, limited area applications, such as weather and hydrologic forecasting, and as a LSM run at very high resolution coupled to mesoscale models (e.g., WRF-Hydro, Gochis et al., 2015). It is intended to become the LSM used in global weather and seasonal forecasting applications at the National Centers for Environmental Prediction (NCEP). Its performance over varying land-cover types has direct consequences for its use in forecast models.
The rest of this paper is structured as follows. Section 2 describes the datasets used in the study and experimental design. Section 3 presents a comparison between observations and model simulations in surface latent and sensible heat flux, ground heat flux, and net radiation. Section 4 shows the uncertainties within the FLUXNET pairs and model simulations. Sections 5 and 6 include discussion and conclusions, respectively.
2.1 Observational data
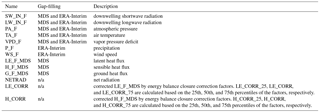
We use half-hourly observations from 24 selected pairs of flux sites from the FLUXNET2015 Tier 1 dataset (http://fluxnet.fluxdata.org/data/fluxnet2015-dataset) and 4 pairs from the AmeriFlux dataset (Baldocchi et al., 2001). These observations include meteorological forcings for the LSM, and surface flux measurements for model validation, which include latent heat flux (LE), sensible heat flux (H), ground heat flux (G), and net radiation (Rnet). All of these variables have been gap-filled (Reichstein et al., 2005; Vuichard and Papale, 2015). Table 1 shows the variable names and gap-filling algorithms used in FLUXNET2015. Because there is no directly measured humidity variable reported, which is needed as a meteorological forcing for the LSMs, relative humidity is calculated based on the reported vapor pressure deficit and surface air temperature (Eqs. 1 and 2).
in which Ta is air temperature (∘C), es is saturation vapor pressure (hPa), VPD is vapor pressure deficit (hPa), and RH is relative humidity (%). Additionally, for the turbulent flux measurements over 18 pairs, FLUXNET2015 provides “corrected” fluxes based on an energy balance closure correction factor, which is calculated for each half-hour as (. More details about the data processing can be found on the FLUXNET2015 website (http://fluxnet.fluxdata.org/data/fluxnet2015-dataset/data-processing/).
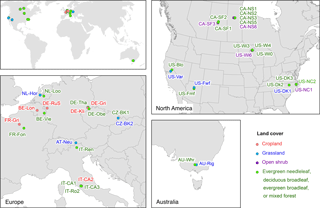
To simulate local land-cover change for each pair, one flux tower is located in forest (deciduous, evergreen, or mixed; broadleaf or needleleaf) and the other is in a nearby open land-cover type (grassland, cropland, or open shrub). Figure 1 shows the locations of the paired sites. Their general characteristics are listed in Table S1. The median linear distance between the paired sites is 21.6 km, and the median elevation difference is 20.0 m. Because of their proximities, the paired sites share similar atmospheric background conditions; however, they are not identical (Chen and Dirmeyer, 2016). Below we show that the differences in meteorology are usually small and not likely a dominant factor in simulated surface flux differences in most of the pairs. We consider the differences (open minus forest) in observed surface fluxes to be representative of the effects of LULCC (deforestation in this case).
2.2 Model simulations
We have run the offline version of CLM4.5 and Noah-MP at the point scale for individual sites. The forcing data, described below, include downwelling longwave radiation (W m−2), downwelling shortwave radiation (W m−2), air temperature (K), precipitation (mm s−1), relative humidity (%), surface pressure (Pa), and wind speed (m s−1) at half-hourly time steps. The plant functional type (PFT) in the CLM for each site is identified based on its reported land-cover type (Table S1) with prescribed climatological satellite phenology (Lawrence and Chase, 2010). Because of the focus on biogeophysical impacts of LULCC in this study, the biogeochemistry carbon–nitrogen module has been disabled in our simulations. The initial conditions for each site are generated by cycling through available atmospheric forcings for about 40 years until soil moisture and temperature reach quasi-equilibrium.
The differences in simulated surface fluxes between the paired sites are compared against the observations, so that the performance of the CLM in representing LULCC-induced surface flux changes can be evaluated. In the single-point simulations, two types of forcing data are used for each site: (1) measurements at this site; (2) measurements at the neighboring paired site. Consequently, three types of differences in simulated surface fluxes can be calculated: (1) the difference derived from individual forcings; (2) the difference from identical “forest forcings” (both of the paired sites use the same forcings measured at the forest site); (3) the difference from identical “open forcings” (both of the paired sites use the same forcings measured at the open sites). Such an experimental design can eliminate well the influence from the uncertainties of forcing data and the difference in the atmospheric background of the paired sites.
The ultimate goal of evaluating the CLM's performance at single-point scale is to assess its ability to be used in global LULCC sensitivity simulations in both offline and coupled modes. The paired sites are close enough that they are typically located within a single grid cell of the CESM. Moreover, the sub-grid heterogeneity of the CLM allows the biogeophysical processes to be calculated at the individual PFT level (15 PFTs available), and makes it possible to output surface fluxes for individual land-cover types. The paired sites can be presented as paired PFTs within a single grid of the CESM. They then share the same atmospheric forcings, and their differences can be considered as the impacts of LULCC. It should be noted that the PFT-level calculation is independent of the percentage of individual PFTs in the grid cell. Therefore, the coverage of the PFTs in the shared grid cell does not influence the flux difference between the paired PFTs in the global simulations.
We run the CLM offline, globally driven by the CRUNCEP forcings from 1991 to 2010 (Viovy, 2011) and present land-cover conditions (Lawrence et al., 2012) at a horizontal resolution of 0.9∘ × 1.25∘. The paired PFTs are identified based on the locations and land-cover types of the FLUXNET paired sites, to ensure the single-point and global simulations are comparable.
Schultz et al. (2016) found the shared-soil-column configuration for vegetated land units in the CLM caused issues with PFT-level ground heat fluxes. They propose an individual-soil-column scheme (PFTCOL) to better represent the PFT-level energy fluxes, so we also extract and examine the output for the paired PFTs from the PFTCOL model configuration. Details about the PFTCOL simulations can be found in Schultz et al. (2016). Additionally, a coupled simulation with the Community Atmosphere Model (CAM) has also been conducted. It shows very similar results to the offline simulations, because the paired PFTs in a single model grid box always share the same atmospheric forcings no matter if the CLM is run offline or coupled with the CAM. Therefore, results from the coupled simulation are not included in this study.
Furthermore, we compare the performance of the CLM with Noah-MP (Niu et al., 2011), which serves as a participant model in Land Data Assimilation Systems (LDAS, Cai et al., 2014). Single-point Noah-MP simulations are conducted in the same way as CLM simulations to ensure their comparability. The monthly leaf area index (LAI) of each site is identical to the prescribed satellite-based LAI in the corresponding CLM simulation. Table S2 shows selected options for various physical processes in Noah-MP. Information about all model simulations is summarized in Table 2.
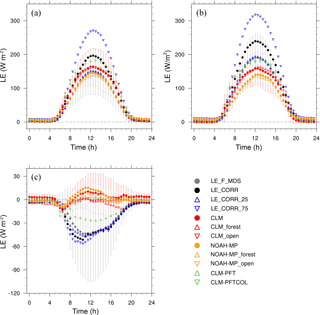
Figure 2The diurnal cycle of LE (W m−2) averaged over all the open sites (a) and forest sites (b) and their difference (open−forest, c) during the summer. The gray error bars indicate the standard deviation of the observed LE (MDS) among the sites; the red error bars are for the simulated LE in the CLM case. Details about the four types of FLUXNET observations can be found in Table 1. Information about model simulations in the CLM and Noah is given in Table 2.
First, we analyze the diurnal and seasonal cycles of surface energy fluxes and the LULCC-induced changes. The diurnal cycle analysis is primarily focused on summer (DJF for the two austral sites and JJA for the other sites). The seasonal cycle for the austral sites is shifted by 6 months to keep summer in the middle of the time series when comparing or compositing with the Northern Hemisphere sites. The results shown below are composites averaged over all open (or forest) sites or open-forest pairs. Not all sites have energy-balance corrected fluxes available; exclusion of those sites shows very similar results for uncorrected fluxes to the average over all sites (or pairs, not shown). There are also some pairs with relatively large changes in surface fluxes. Exclusion of those pairs shows very consistent patterns with the results including all sites, even though there is a slight influence on the magnitude of the changes (Fig. S1). Therefore, all sites are included in our analyses for each variable.
3.1 Latent heat flux (LE)
Figure 2a–b shows the diurnal cycle of LE averaged over all the open sites and forest sites during summer. Compared with the observations without energy-balance correction, single-point CLM simulations overestimate LE for the open sites with both their actual meteorological forcings and the nearby forest forcings, but underestimate LE over the forest sites. The extracted PFT-level output from the global simulations also exhibit similar biases. Relative to the CLM, Noah-MP simulations show better agreement with observations over the open sites, but a greater underestimation over forest. The energy-balance correction tends to increase the values of LE. Therefore, both the CLM and Noah-MP have negative biases compared to the corrected fluxes (except LE_CORR_25 over the open sites).
Figure 2c shows the difference in the diurnal cycle of LE due to LULCC (deforestation). It should be noted that there is a substantial spread among the pairs in model simulations and especially observations, indicating the diverse geographical backgrounds and specific vegetation changes of these paired sites. The observations suggest an overall lower summer daytime LE over the open land compared to forest. In spite of the considerable spread among the energy-balance corrected LE observations (Fig. 2a, b), the differences between the forest and open lands show consistent signals. However, both CLM and Noah-MP single-point simulations fail to represent the observed decreased daytime LE as a result of deforestation. The simulated LE over the open land is usually slightly greater than the forest from 10:00 to 16:00 at local time. Such a discrepancy may be attributed to the large underestimation of daytime forest LE in the models. Meanwhile, simulations by different forcings of the paired sites show robust signals, implying that the bias of the simulated LE sensitivity should not be attributed to the uncertainties of the forcing data. For the CLM global simulations, the PFTCOL case exhibits a similar diurnal pattern to the single-point simulations, while decreased daytime LE is found consistently only in the PFT simulations. As CLM-PFT is less physically realistic than CLM-PFTCOL from a soil hydrologic perspective, its superior performance needs further investigation.
To explore the mechanism of the LE changes within the CLM, we examine the changes in the three components of evapotranspiration, namely canopy evaporation, canopy transpiration, and ground evaporation (Fig. 3). Unfortunately, these separate components are not measured and cannot be directly validated. The CLM, PFT, and PFTCOL simulations show an agreement in decreased canopy evaporation after deforestation, with the greatest decrease during the early morning. There is also an agreement in an overall decreased canopy transpiration, but CLM simulations do not exhibit an obvious change during the morning, when greatly decreased canopy transpiration can be found in the PFT and PFTCOL simulations. The main discrepancy among model versions is found in ground evaporation, which increases after deforestation in the CLM and PFTCOL simulations. The increased ground evaporation has exceeded the decreased canopy evaporation and transpiration, resulting in slightly increased LE (Fig. 2c). Interestingly, the PFT simulations, which have known issues with PFT-level ground heat flux (Schultz et al., 2016), show decreased daytime ground evaporation. Along with decreased canopy evaporation, transpiration, and ground evaporation, the total LE decreases sharply after deforestation in the PFT simulations, which agrees better with the observations than other simulations (Fig. 2c). However, the decreased ground evaporation may be associated with a problematic soil-column scheme at sub-grid scale, which undermines the credibility of the agreement between the observations and PFT simulations.
Figure 4 shows the changes in monthly LE after deforestation across the annual cycle. There is clear and consistent seasonality in the LE changes from the observations. The four types of observations show decreased LE (up to −24.0 W m−2) during local summer. There is little change in LE in the uncorrected observations during the winter season. However, there is significantly increased LE (up to +17.9 W m−2) in the energy-balance corrected observations in late winter and early spring. Neither the CLM nor Noah-MP captures the observed seasonality of LE change. As found in the change in the diurnal cycle of the LE, the PFTCOL simulations exhibit a similar pattern to the single-point simulations, while the PFT simulations show decreased LE throughout the year, with the maximum from May to August, and the best correlation (R=0.81, P<0.01) with observations.
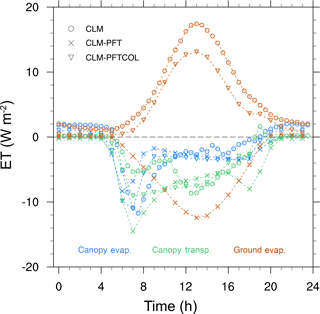
Figure 3Change in the diurnal cycle of components (colors) of evapotranspiration (canopy evaporation, canopy transpiration, and ground evaporation) due to LULCC from forest to open land (open−forest).
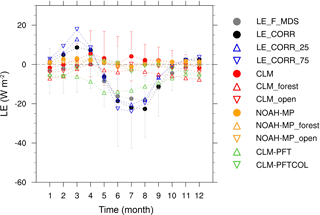
Figure 4Change in the seasonal cycle of LE (W m−2) due to LULCC from forest to open land (open−forest).
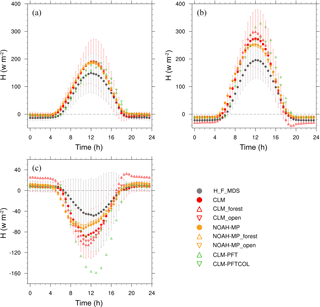
Figure 5The diurnal cycle of H (W m−2) averaged over all the open sites (a) and forest sites (b) and their difference (open−forest, c) during the summer. The gray error bars indicate the standard deviation of the observed H among the sites; the red error bars are for the simulated H in the CLM case.
3.2 Sensible heat flux (H)
Figure 5a–b show the diurnal cycle of H averaged over all open and forest sites during local summer. Generally, the models overestimate H throughout the day, with the largest positive bias during midday. Compared with the observations without energy-balance correction, the overestimation can be up to 86.5 W m−2 from the CLM over the forest during noon and 46.4 W m−2 over the open sites. The difference in H between the forest and open sites is shown in Fig. 5c. Robust signals are found among the four types of observations, so results from the energy-balance corrected observations are not included hereafter, but are shown in Fig. S2. Both observations and models exhibit a clear diurnal pattern of change in H after deforestation – a small nighttime increase and a large daytime decrease. Observations show a large spread among the 28 pairs, which is much greater than that from the CLM simulations, indicating uncertainties and variability among the observed fluxes and the robustness of simulated H sensitivity to LULCC in the LSM. Compared with the observations, the CLM shows a greater H decrease, which is twice as much as in the observations. The overestimated H decrease may be related to the large positive bias in H over the forest sites (Fig. 5b). Additionally, the PFT simulations show the largest H decrease, which may be associated with the ground heat issues in the shared-soil-column scheme.
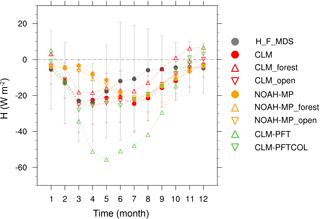
Figure 6Change in the seasonal cycle of H (W m−2) due to LULCC from forest to open land (open−forest).
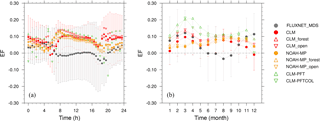
Figure 7Change in the summer diurnal (a) and seasonal (b) cycles of EF (unitless) due to LULCC from forest to open land (open−forest). The observed EF (FLUXNET_MDS) is calculated based on the MDS gap-filled LE (LE_F_MDS) and H (H_F_MDS).
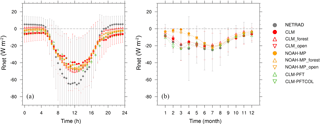
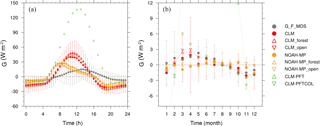
Figure 8Change in the summer diurnal (a) and seasonal (b) cycles of G (W m−2) due to LULCC from forest to open land (open−forest). It should be noted that the changes in the CLM-PFT simulation are much further from the observations than the other simulations. Some of its values are beyond the limit of the figure (b). The smallest value is −11.2 W m−2 in January, while the largest value is 52.9 W m−2 in May.
Seasonally, decreased H is found throughout the year after deforestation in both observations and models (except for the same-forest-forcing CLM simulations in winter, Fig. 6). The greatest decrease is observed during spring, when both of the single-point CLM and PFTCOL simulations show good agreement. However, CLM and Noah-MP simulations also show a large decrease during summer, which has not been observed in the FLUXNET dataset. Again, the PFT simulations show the greatest H decrease among the simulations and the largest bias compared with the observations during the warm season.
Additionally, evaporative fraction (EF), which is defined as the ratio of LE to the available energy (LE + H), is a useful diagnostic of the surface energy balance (Gentine et al., 2011). Meanwhile, most of the correction methods to solve the imbalance issue of the surface energy budget assume that the Bowen ratios for small- and large-scale eddies are similar or even equal (Wilson et al., 2002; Foken, 2008; Zhou and Wang, 2016). Under such an assumption, EF can be independent of the energy closure issue, because EF is related to the Bowen ratio (B) as
Figure 7 shows the change in the diurnal (summer only) and seasonal cycle of EF due to LULCC from forest to open land. During summer, there are small changes in observed daytime EF (Fig. 7a) because of the decreases in both LE and H. However, both CLM and Noah-MP show increased daytime EF due to the decreased H and slightly increased LE after deforestation. Seasonally, the models show year-around increased EF, however, which is not observed in FLUXNET from June to September, further demonstrating the models' deficiencies in representing energy partitioning during summer.
3.3 Diurnal and seasonal cycle of ground heat flux (G) and net radiation (Rnet)
Figure 8a shows the change in the diurnal cycle of G after deforestation. Both the observations and models exhibit increased G during the day and decreased G during the night. However, models overestimate the magnitude of the G change, and discrepancies also exist in the timing of maximum change. The greatest increase in G is observed during the early afternoon, while the greatest increase in simulated G occurs at noon in the CLM (single-point and PFTCOL) and during the morning in Noah-MP. Because G is strongly correlated with Rnet (Santanello and Friedl, 2003), we examine the timing of maximum observed G and Rnet during summer. There are some sites showing about a 1 h lag between maximum Rnet and G (not shown). Therefore, the lag between simulated and observed peaks in G change can be partially attributed to the uncertainties in G measurements that are commonly estimated with heat flux plates installed at some depth (e.g., 5–10 cm) below the surface (Wang and Bou-Zeid, 2012), while the LSM simulated G is calculated at the surface. Meanwhile, the G changes (in both the diurnal and seasonal cycles) in the PFT simulations are further from the observations than the other simulations. Such disagreement further confirms the issues with the sub-grid soil-column scheme in the CLM, which is discussed in the following section. The changes in observed G also have a clear seasonal pattern – an increase during the warm season and a decrease during the cold season (Fig. 8b). This seasonality is captured well by the CLM simulations (especially the simulations with identical forcings for the paired sites) in both magnitude and timing, but is not evident in Noah-MP simulations.
After exploring the three flux components of the surface energy balance, it is worthwhile examining the change in Rnet after deforestation. During summer, the observations show that Rnet slightly increases during the night, and decreases considerably (up to −65.7 W m−2) during the day, which can be attributed to the increased albedo after deforestation (Fig. 9a). Decreased daytime Rnet is also found in the CLM simulations, but with a slightly smaller magnitude. Seasonally, there is a good agreement between the observations and CLM simulations, showing a large Rnet decrease during spring and summer but a relatively small decrease during autumn and winter (Fig. 9b). The Noah-MP simulations are comparable to the CLM, but with a notable deficiency in simulating the Rnet change during late winter and early spring.
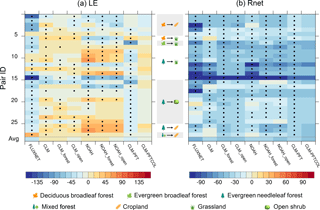
Figure 10Change (open−forest) in observed and simulated LE (a) and Rnet (b) during summer daytime (averaged during the period 08:00–16:00) over individual pairs and their averages. The vertical labels show the pair IDs from 1 to 28 based on Table S1. The pairs are grouped based on the type of LULCC (shown as the icons in the middle). The bottom row is the average over all pairs. The Student's t test is performed on the daily (daytime average) time series for each pair. Dots indicate statistically significant changes at the 95 % confidence level. No significant test is carried out for the CLM-PFTCOL simulation (the last column), because we only have long-term averaged hourly output for each month.
4.1 Uncertainties among the FLUXNET pairs
The results discussed above are based on composites averaged over all forest and open sites. It is worthwhile examining the uncertainties in surface flux changes among different paired sites. Figure 10a shows the changes in summer daytime (08:00–16:00) LE from the observations and model simulations across the 28 pairs. This time period is chosen because it is the time of the greatest differences in surface energy fluxes (Figs. 2c, 5c, 7a, 8a). The observations show decreased LE associated with deforestation over 23 pairs, among which the pairs of evergreen needleleaf forest and open shrub (nos. 16–25) exhibit consistent decreases and the pairs of deciduous broadleaf forest and crops (nos. 1–4) show the overall greatest decrease. However, both the CLM and Noah-MP show relatively weak increases over most of the pairs, which further demonstrate their deficiency in simulating LE change. Additionally, for both the CLM or Noah, the choice of forcing does not exert much influence on the simulated change in summer daytime LE.
The changes in Rnet over individual pairs are shown in Fig. 10b. There are 27 pairs (all except number 21) showing decreased Rnet after deforestation, with the greatest decreases over the pairs of evergreen needleleaf forest and grassland. Both the CLM and Noah-MP capture the observed decreases in Rnet well over most of the pairs.
It should be noted that pair 15 shows large LE and Rnet changes in Fig. 10. This pair consists of a site over valley grassland and the other site over mountain evergreen needleleaf forest with 60.29 km separation and 1186 m elevation difference. There are significantly different air temperature and downwelling longwave radiation measurements between the sites (Fig. S3). Such large differences in LE and Rnet here are likely associated with the distinct although proximate geographical sites. Even though the exclusion of this site does not make a significant change to the composite analysis in Sect. 3 (not shown), it may raise another question of whether the simulated sensitivity of surface energy fluxes is associated with the inconsistencies of atmospheric forcings of LSMs at the single pair level.
4.2 Uncertainties within the forcings for LSMs
Based on the composite analysis in Sect. 3, we have found that the simulated changes in surface energy fluxes with identical forcings (either from forest or open sites) are consistent with the simulations with individual forcings, demonstrating that the overall sensitivities of surface energy fluxes are robust among the choices of different forcings. In this sub-section, we explore the uncertainties of the simulated surface flux changes due to the different forcings for individual pairs, especially with the focus on the roles of separation and elevation difference in the simulated sensitivity of surface energy fluxes.
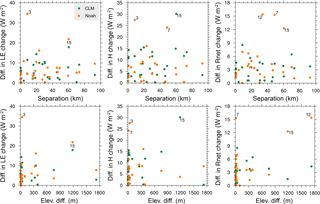
Figure 11Sensitivity of differences in simulated surface energy flux changes (left column: LE, middle: H, and right: Rnet) between “forest forcing” and “open forcing” simulations to site separation (top) and elevation difference (bottom) between the forest and open sites in individual pairs. The pair nos. 3, 7, 12, and 15 are labeled because of the greatest differences in surface flux changes.
Since we have simulations with identical forcings for the paired sites, the difference in surface flux changes between “forest forcings” and “open forcings” can be considered as the simulated sensitivity of surface energy fluxes to variation in the atmospheric forcings. Figure 11 shows the relationship with separation and elevation difference for individual pairs. Overall, the flux changes are not associated with the separation and elevation difference between the paired sites, further confirming the robustness of simulated signals from paired-site simulations. Nevertheless, some “outliers” are identified. In the CLM simulations, only pair 15 shows large differences in LE and H change. However, pairs 3, 7, and 12 also exhibit large differences in Noah-MP simulations. The uncertainties in pairs 12 and 15 may be attributed to their large elevation differences. For pair 7 in Australia, Noah-MP shows greater sensitivity of H and Rnet to atmospheric forcings over the evergreen broadleaf forest than grassland (not shown), leading to large differences in the surface flux changes. However, this is the only pair with evergreen broadleaf forest, and its behavior in Noah-MP needs further investigation. Even though the pair 3 sites are close with small elevation differences, we found considerably different downwelling shortwave and longwave radiation between the two sites (not shown), which may explain the uncertainties in the Noah-MP simulations.
This study has examined simulated changes in the surface energy budget in response to local land-cover change based on paired proximate FLUXNET sites with differing land cover. Our results suggest that the CLM represents the observed changes in Rnet and G well, but there remain issues in simulating the energy partitioning between LE and H, which also further confirms the large uncertainties in simulated ET responses to LULCC revealed in several recent studies (e.g., Pitman et al., 2009; Boisier et al., 2012, 2014; de Noblet-Ducoudré et al., 2012; Vanden Broucke et al., 2015). Based on the observations, deforestation generally leads to a decrease in summer daytime Rnet, accompanied by decreased LE and H. On the one hand, the CLM captures the observed signal of H change, but overestimates the decrease due to its large overestimation of H over the forest. On the other hand, the model underestimates the LE over the forest, leading to an opposite signal (a slight increase) of LE change compared to the observations. Simulations in Noah-MP show similar biases. Therefore, uncertainties in current LULCC sensitivity studies may persist specifically in the representation of turbulent fluxes over forest land-cover types.
Scrutinizing the three components of ET suggests that the simulated increase in summer daytime LE is mainly attributable to a large increase in ground evaporation, which counteracts the decreased canopy evaporation and transpiration. This may raise another issue about the soil resistance parameterization in CLM4.5. Previous studies indicate that the model generates excessive ground evaporation when the canopy is sparse or absent (Swenson and Lawrence, 2014; Tang et al., 2015). If there is overestimated ground evaporation over the open land, such a bias can also contribute to the disagreement in the LULCC-induced ET changes. Swenson and Lawrence (2014) have implemented a dry surface layer for the soil resistance parameterization to solve this issue for the upcoming CLM5. An extension of the evaluation with CLM5 would be useful to examine whether the issue within the soil resistance parameterization is responsible for the uncertainties in ET changes.
Besides the uncertainties in estimating turbulent fluxes over different land-cover types, the simulations show that differences in the meteorological forcings between nearby paired sites seem to have little impact on the simulation of surface flux changes due to LULCC. Many LSMs besides the CLM employ a sub-grid tiling parameterization where multiple land surface types exist within a single grid box, each maintaining a separate set of surface balances and returning a weighted average set of fluxes to the atmosphere based on areal coverage of each surface type. In this arrangement, each land surface type within a grid box receives the same meteorological forcing from the overlying atmospheric model. It appears from our forcing-sensitivity studies that this arrangement does not significantly impact the simulation of surface flux changes associated with LULCC on the grid scale.
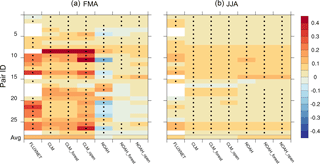
Figure 12Change (open−forest) in observed and simulated daytime albedo during late winter/early spring (FMA, a) and summer (JJA, b). White areas indicate missing observations.
That said, the sub-grid comparison between different land-cover types may yet be problematic due to the shared soil-column issue for vegetated land units in the CLM (Schultz et al., 2016). Both the single-point observations and simulations show significant differences in surface soil moisture between most of the paired sites, even though no clear drying or wetting pattern is found (Fig. S4). The differences between the paired sites suggests that the shared soil column for vegetated land in the CLM may not represent soil moisture and temperature well at the sub-grid scale, which may influence the simulations of land surface energy and water fluxes. We find an unreasonably large change in PFT-level G between forest and open land especially for the seasonal cycle in PFT simulations, while both observations and single-point and PFTCOL simulations show a seasonal change with a very small range (within ±3 W m−2). As G is calculated as the residual of the surface energy budget in the CLM (Oleson et al., 2013), this sub-grid G issue may cast even more uncertainties on the calculation of LE and H at the PFT level, as well as their aggregated values at the grid level for regional or global simulations. Therefore, caution should be taken when examining the LULCC sensitivity which involves sub-grid PFT changes.
Compared with the CLM, Noah-MP exhibits a similar ability to simulate surface flux changes, except for a deficiency in simulating H and Rnet changes during late winter and early spring. We have examined the daytime albedo change after deforestation, calculated from available shortwave radiation terms, from observations and model simulations during local late winter/early spring (February–April, FMA) and summer (Fig. 12). Both the CLM and Noah-MP agree with the observations during summer. However, Noah-MP does not capture the observed albedo increase over nearly half of the pairs during late winter/early spring. Greater disagreement is also found during the local winter season (DJF, not shown), suggesting a deficiency in snowmelt timing or snow albedo sensitivity to LULCC, despite improvement in the snow surface albedo simulations by implementation of the Canadian Land Surface Scheme (CLASS; Verseghy, 1991) in Noah-MP (Niu et al., 2011).
Finally, it should be recognized that the observational data are not perfect. In particular, there may be systematic biases or even trends in specific instruments that contribute to the perceived differences between paired sites (e.g., site 3). Ideally, redundant instrumentation at sites, or in this case the rotation of an extra set of instruments among nearby paired sites, could be used to identify, quantify, and account for significant systematic biases in measurements for suspicious variables. Furthermore, footprints of the flux towers may bias the comparison of surface fluxes between the open and forest sites (Baker et al., 2003; Griebel et al., 2016). In other words, the observed differences between sites can only be partially attributed to LULCC because their environmental conditions may also be different. As most of the current studies used paired sites to represent LULCC, we have assumed that the paired sites share similar background atmospheric conditions, and any observed differences in surface climate conditions can be attributed to LULCC (e.g., Lejeune et al., 2017; Luyssaert et al., 2014; Teuling et al., 2010; Vanden Broucke et al., 2015). Meanwhile, model simulations with the different forcings can effectively examine the effects of the local environment of individual sites, because their footprints can also be taken by the meteorological measurements. Our results show robust signals of LULCC-induced changes in surface fluxes, implying that impacts of footprints at individual sites are probably trivial.
This study has evaluated the performance of two state-of-the-art LSMs in simulating the LULCC-induced changes in surface energy fluxes. Observations from 28 FLUXNET pairs (open versus forest) are used to represent the observed flux changes following deforestation, which are compared with the LSM simulations forced with meteorological data from the observation sites. Diurnal and seasonal cycles of the flux changes have been investigated.
The single-point simulations in the CLM and Noah-MP show the greatest bias in simulating LE change. Significantly decreased daytime LE is observed during local summer, but is not captured by the models. The observed LE changes also exhibit an evident seasonality, which is not represented in the model. The energy partitioning between LE and H might be a common issue within the LSMs. Other studies have noted problems in the simulation of surface fluxes by LSMs, including poor performance relative to non-physical statistical models (Best et al., 2015; Haughton et al., 2016).
The sub-grid comparison from the global simulations in the CLM yields unrealistic changes in G and H when the soil column is shared among vegetated land units, even though there is a better agreement in LE change with the observations. The individual-soil-column scheme improves the representation of the PFT-level energy flux changes, but uncertainties still remain as with the point-scale simulations. Therefore, these uncertainties must be considered when interpreting global experiments of LULCC sensitivity studies with current LSMs.
Consistent aggregate performance across many paired sites suggests the problems in these LSMs may not lie primarily with parameter selection at individual sites, but with more fundamental issues of the representation of physical processes in LSMs. The simulation of LULCC may or may not have become more consistent among models since LUCID (de Noblet-Ducoudré et al., 2012), but consistency with observed biophysical responses appears to be lacking. LUMIP (Lawrence et al., 2016) will be a step toward better LSM simulation of LULCC responses, and ultimately better simulations of the response of climate to LULCC.
Measurements at paired sites can be accessed at the Fluxdata website (http://fluxnet.fluxdata.org/data/fluxnet2015-dataset). Output from the CLM and Noah-MP simulations in this study are available upon request (lchen15@gmu.edu).
The supplement related to this article is available online at: https://doi.org/10.5194/hess-22-111-2018-supplement.
This study was supported by the National Science Foundation (AGS-1419445).
This work used eddy covariance data acquired and shared by the FLUXNET
community, including these networks: AmeriFlux, CarboEuropeIP, CarboItaly,
CarboMont, Fluxnet-Canada, GreenGrass, ICOS, and OzFlux-TERN. The ERA-Interim
reanalysis data are provided by ECMWF and processed by LSCE. The FLUXNET eddy
covariance data processing and harmonization were carried out by the European
Fluxes Database Cluster, AmeriFlux Management Project, and Fluxdata project
of FLUXNET, with the support of CDIAC and the ICOS Ecosystem Thematic Center,
and the OzFlux, ChinaFlux and AsiaFlux offices. We thank all site
investigators and flux networks for their work in making our model evaluation
possible. The authors wish to thank Ahmed Tawfik at the National Center for
Atmospheric Research for his assistance in preparing forcing datasets for the
AmeriFlux sites. Computing resources for the CLM and Noah-MP experiments were
provided by the NSF/CISL/Yellowstone supercomputing facility.
Edited by: Shraddhanand Shukla
Reviewed by:
Eleanor Blyth and two anonymous referees
Baker, I., Denning, A. S., Hanan, N., Prihodko, L., Uliasz, M., Vidale, P., Davis, K., and Bakwin, P.: Simulated and observed fluxes of sensible and latent heat and CO2 at the WLEF-TV tower using SiB2.5, Global Change Biol., 9, 1262–1277, https://doi.org/10.1046/j.1365-2486.2003.00671.x, 2003.
Baldocchi, D., Falge, E., Gu, L., Olson, R., Hollinger, D., Running, S., Anthoni, P., Bernhofer, C., Davis, K., Evans, R., Fuentes, J., Goldstein, A., Katul, G., Law, B., Lee, X., Malhi, Y., Meyers, T., Munger, W., Oechel, W., Paw, K. T., Pilegaard, K., Schmid, H. P., Valentini, R., Verma, S., Vesala, T., Wilson, K., and Wofsy, S.: FLUXNET: A New Tool to Study the Temporal and Spatial Variability of Ecosystem–Scale Carbon Dioxide, Water Vapor, and Energy Flux Densities, B. Am. Meteorol. Soc., 82, 2415–2434, https://doi.org/10.1175/1520-0477(2001)082<2415:FANTTS>2.3.CO;2, 2001.
Betts, A. K.: Understanding Hydrometeorology Using Global Models, B. Am. Meteorol. Soc., 85, 1673–1688, https://doi.org/10.1175/BAMS-85-11-1673, 2004.
Boisier, J. P., de Noblet-Ducoudré, N., and Ciais, P.: Historical land-use-induced evapotranspiration changes estimated from present-day observations and reconstructed land-cover maps, Hydrol. Earth Syst. Sci., 18, 3571–3590, https://doi.org/10.5194/hess-18-3571-2014, 2014.
Boisier, J. P., de Noblet-Ducoudré, N., and Ciais, P.: Inferring past land use-induced changes in surface albedo from satellite observations: a useful tool to evaluate model simulations, Biogeosciences, 10, 1501–1516, https://doi.org/10.5194/bg-10-1501-2013, 2013.
Boisier, J. P., de Noblet-Ducoudré, N., Pitman, A. J., Cruz, F. T., Delire, C., van den Hurk, B. J. J. M., van der Molen, M. K., Müller, C., and Voldoire, A.: Attributing the impacts of land-cover changes in temperate regions on surface temperature and heat fluxes to specific causes: Results from the first LUCID set of simulations, J. Geophys. Res.-Atmos., 117, D12116, https://doi.org/10.1029/2011JD017106, 2012.
Bright, R. M., Zhao, K., Jackson, R. B., and Cherubini, F.: Quantifying surface albedo and other direct biogeophysical climate forcings of forestry activities, Glob. Change Biol., 21, 3246–3266, https://doi.org/10.1111/gcb.12951, 2015.
Brovkin, V., Boysen, L., Arora, V. K., Boisier, J. P., Cadule, P., Chini, L., Claussen, M., Friedlingstein, P., Gayler, V., van den Hurk, B. J., Hurtt, G. C., Jones, C. D., Kato, E., de Noblet-Ducoudré, N., Pacifico, F., Pongratz, J., and Weiss, M.: Effect of Anthropogenic Land-Use and Land-Cover Changes on Climate and Land Carbon Storage in CMIP5 Projections for the Twenty-First Century, J. Climate, 26, 6859–6881, https://doi.org/10.1175/JCLI-D-12-00623.1, 2013.
Cai, X., Yang, Z., Xia, Y., Huang, M., Wei, H., Leung, L. R., and Ek, M. B.: Assessment of simulated water balance from Noah, Noah-MP, CLM, and VIC over CONUS using the NLDAS test bed, J. Geophys. Res.-Atmos., 119, 13751–13770, https://doi.org/10.1002/2014JD022113, 2014.
Chen, L. and Dirmeyer, P. A.: Adapting observationally based metrics of biogeophysical feedbacks from land cover/land use change to climate modeling, Environ. Res. Lett., 11, 034002, https://doi.org/10.1088/1748-9326/11/3/034002, 2016.
Chen, L. and Dirmeyer, P. A.: Impacts of Land Use/Land Cover Change on Afternoon Precipitation over North America, J. Climate, 30, 2121–2140, https://doi.org/10.1175/JCLI-D-16-0589.1, 2016.
de Noblet-Ducoudré, N., Boisier, J., Pitman, A., Bonan, G. B., Brovkin, V., Cruz, F., Delire, C., Gayler, V., van den Hurk, B. J., Lawrence, P. J., van der Molen, M. K., Müller, C., Reick, C. H., Strengers, B. J., and Voldoire, A.: Determining Robust Impacts of Land-Use-Induced Land Cover Changes on Surface Climate over North America and Eurasia: Results from the First Set of LUCID Experiments, J. Climate, 25, 3261–3281, https://doi.org/10.1175/JCLI-D-11-00338.1, 2012.
Dirmeyer, P. A., Koster, R. D., and Guo, Z.: Do Global Models Properly Represent the Feedback between Land and Atmosphere?, J. Hydrometeor., 7, 1177–1198, https://doi.org/10.1175/JHM532.1, 2006.
Foken, T.: The Energy Balance Closure Problem: An Overview, Ecol. Appl., 18, 1351–1367, https://doi.org/10.1890/06-0922.1, 2008.
Gochis, D. J., Yu, W., and Yates, D. N.: The WRF-Hydro Model Technical Description and User's Guide, Version 3.0, NCAR Technical Document, 120 pp., available at: https://www.ral.ucar.edu/sites/default/files/public/images/project/WRF_Hydro_User_Guide_v3.0.pdf, 2015.
Griebel, A., Bennett, L. T., Metzen, D., Cleverly, J., Burba, G., and Arndt, S. K.: Effects of inhomogeneities within the flux footprint on the interpretation of seasonal, annual, and interannual ecosystem carbon exchange, Agr. Forest Meteorol., 221, 50–60, https://doi.org/10.1016/j.agrformet.2016.02.002, 2016.
Janowiak, J. E., Kousky, V. E., and Joyce, R. J.: Diurnal cycle of precipitation determined from the CMORPH high spatial and temporal resolution global precipitation analyses, J. Geophys. Res.-Atmos., 110, D23105, https://doi.org/10.1029/2005JD006156, 2005.
Juang, J., Katul, G., Siqueira, M., Stoy, P., and Novick, K.: Separating the effects of albedo from eco-physiological changes on surface temperature along a successional chronosequence in the southeastern United States, Geophys. Res. Lett., 34, L21408, https://doi.org/10.1029/2007GL031296, 2007.
Lawrence, D. M., Hurtt, G. C., Arneth, A., Brovkin, V., Calvin, K. V., Jones, A. D., Jones, C. D., Lawrence, P. J., de Noblet-Ducoudré, N., Pongratz, J., Seneviratne, S. I., and Shevliakova, E.: The Land Use Model Intercomparison Project (LUMIP) contribution to CMIP6: rationale and experimental design, Geosci. Model Dev., 9, 2973–2998, https://doi.org/10.5194/gmd-9-2973-2016, 2016.
Lawrence, D. and Vandecar, K.: Effects of tropical deforestation on climate and agriculture, Nat. Clim. Change, 5, 27–36, 2015.
Lawrence, P. J. and Chase, T. N.: Investigating the climate impacts of global land cover change in the community climate system model, Int. J. Climatol., 30, 2066–2087, https://doi.org/10.1002/joc.2061, 2010.
Lawrence, P. J., Feddema, J. J., Bonan, G. B., Meehl, G. A., O'Neill, B. C., Oleson, K. W., Levis, S., Lawrence, D. M., Kluzek, E., Lindsay, K., and Thornton, P. E.: Simulating the Biogeochemical and Biogeophysical Impacts of Transient Land Cover Change and Wood Harvest in the Community Climate System Model (CCSM4) from 1850 to 2100, J. Climate, 25, 3071–3095, https://doi.org/10.1175/JCLI-D-11-00256.1, 2012.
Lee, X., Goulden, M. L., Hollinger, D. Y., Barr, A., Black, T. A., Bohrer, G., Bracho, R., Drake, B., Goldstein, A., Gu, L., Katul, G., Kolb, T., Law, B. E., Margolis, H., Meyers, T., Monson, R., Munger, W., Oren, R., Paw U, K. T., Richardson, A. D., Schmid, H. P., Staebler, R., Wofsy, S., and Zhao, L.: Observed increase in local cooling effect of deforestation at higher latitudes, Nature, 479, 384–387, https://doi.org/10.1038/nature10588, 2011.
Lejeune, Q., Seneviratne, S. I., and Davin, E. L.: Historical land-cover change impacts on climate: comparative assessment of LUCID and CMIP5 multi-model experiments, J. Climate, 30, 1439–1459, https://doi.org/10.1175/JCLI-D-16-0213.1, 2016.
Li, Y., Zhao, M., Motesharrei, S., Mu, Q., Kalnay, E., and Li, S.: Local cooling and warming effects of forests based on satellite observations, Nat. Comm., 6, 6603, https://doi.org/10.1038/ncomms7603, 2015.
Luyssaert, S., Jammet, M., Stoy, P. C., et al.: Land management and land-cover change have impacts of similar magnitude on surface temperature, Nat. Clim. Change, 4, 389–393, https://doi.org/10.1038/nclimate2196, 2014.
Mahmood, R., Pielke, R. A., Hubbard, K. G., Niyogi, D., Dirmeyer, P. A., McAlpine, C., Carleton, A. M., Hale, R., Gameda, S., Beltrán-Przekurat, A., Baker, B., McNider, R., Legates, D. R., Shepherd, M., Du, J., Blanken, P. D., Frauenfeld, O. W., Nair, U. S., and Fall, S.: Land cover changes and their biogeophysical effects on climate, Int. J. Climatol., 34, 929–953, https://doi.org/10.1002/joc.3736, 2014.
Niu, G.-Y., Yang, Z.-L., Mitchell, K. E., Chen, F., Ek, M. B., Barlage, M., Kumar, A., Manning, K., Niyogi, D., Rosero, E., Tewari, M., and Xia, Y.: The community Noah land surface model with multiparameterization options (Noah-MP): 1. Model description and evaluation with local-scale measurements, J. Geophys. Res.-Atmos., 116, D12109, https://doi.org/10.1029/2010JD015139, 2011.
Oleson, K. W., Lawrence, D. M., Bonan, G. B., Drewniak, B., Huang, M., Koven, C. D., Levis, S., Li, F., Riley, W. J., Subin, Z. M., Swenson, S. C., Thornton, P. E., Bozbiyik, A., Fisher, R., Heald, C. L., Kluzek, E., Lamarque, J.-F., Lawrence, P. J., Leung, L. R., Lipscomb, W., Muszala, S., Ricciuto, D. M., Sacks, W., Sun, Y., Tang, J., Yang, Z.-L.: Technical Description of version 4.5 of the Community Land Model (CLM), NCAR Technical Note, TN-503+STR, National Center for Atmospheric Research, Boulder, CO, USA, 434 pp., available at: http://www.cesm.ucar.edu/models/cesm1.2/clm/CLM45_Tech_Note.pdf, 2013.
Pielke, R. A., Pitman, A., Niyogi, D., Mahmood, R., McAlpine, C., Hossain, F., Goldewijk, K. K., Nair, U., Betts, R., Fall, S., Reichstein, M., Kabat, P., and de Noblet, N.: Land use/land cover changes and climate: modeling analysis and observational evidence, Wiley Interdisciplinary Reviews: Climate Change, 2, 828–850, https://doi.org/10.1002/wcc.144, 2011.
Pitman, A. J., de Noblet-Ducoudré, N., Cruz, F. T., Davin, E. L., Bonan, G. B., Brovkin, V., Claussen, M., Delire, C., Ganzeveld, L., Gayler, V., van den Hurk, B. J. J. M., Lawrence, P. J., van der Molen, M. K., Müller, C., Reick, C. H., Seneviratne, S. I., Strengers, B. J., and Voldoire, A.: Uncertainties in climate responses to past land cover change: First results from the LUCID intercomparison study, Geophys. Res. Lett., 36, L14814, https://doi.org/10.1029/2009GL039076, 2009.
Portmann, F. T., Siebert, S., and Döll, P.: MIRCA2000—Global monthly irrigated and rainfed crop areas around the year 2000: A new high-resolution data set for agricultural and hydrological modeling, Global Biogeochem. Cy., 24, L14814, https://doi.org/10.1029/2008GB003435, 2010.
Reichstein, M., Falge, E., Baldocchi, D., Papale, D., Aubinet, M., Berbigier, P., Bernhofer, C., Buchmann, N., Gilmanov, T., Granier, A., Grünwald, T., Havránková, K., Ilvesniemi, H., Janous, D., Knohl, A., Laurila, T., Lohila, A., Loustau, D., Matteucci, G., Meyers, T., Miglietta, F., Ourcival, J.-M., Pumpanen, J., Rambal, S., Rotenberg, E., Sanz, M., Tenhunen, J., Seufert, G., Vaccari, F., Vesala, T., Yakir, D., and Valentini, R.: On the separation of net ecosystem exchange into assimilation and ecosystem respiration: review and improved algorithm, Global Change Biol., 11, 1424–1439, https://doi.org/10.1111/j.1365-2486.2005.001002.x, 2005.
Santanello, J. A. and Friedl, M. A.: Diurnal Covariation in Soil Heat Flux and Net Radiation, J. Appl. Meteor., 42, 851–862, https://doi.org/10.1175/1520-0450(2003)042<0851:DCISHF>2.0.CO;2, 2003.
Schultz, N. M., Lee, X., Lawrence, P. J., Lawrence, D. M., and Zhao, L.: Assessing the use of subgrid land model output to study impacts of land cover change, J. Geophys. Res.-Atmos., 121, 6133–6147, https://doi.org/10.1002/2016JD025094, 2016.
Swenson, S. C. and Lawrence, D. M.: Assessing a dry surface layer-based soil resistance parameterization for the Community Land Model using GRACE and FLUXNET-MTE data, J. Geophys. Res.-Atmos., 119, 10299–10312, https://doi.org/10.1002/2014JD022314, 2014.
Tang, J., Riley, W. J., and Niu, J.: Incorporating root hydraulic redistribution in CLM4.5: Effects on predicted site and global evapotranspiration, soil moisture, and water storage, J. Adv. Model Earth Sy., 7, 1828–1848, https://doi.org/10.1002/2015MS000484, 2015.
Teuling, A. J., Seneviratne, S. I., Stöckli, R., Reichstein, M., Moors, E., Ciais, P., Luyssaert, S., van den Hurk, B., Ammann, C., Bernhofer, C., Dellwik, E., Gianelle, D., Gielen, B., Grünwald, T., Klumpp, K., Montagnani, L., Moureaux, C., Sottocornola, M., and Wohlfahrt, G.: Contrasting response of European forest and grassland energy exchange to heatwaves, Nat. Geosci., 3, 722–727, https://doi.org/10.1038/ngeo950, 2010.
Vanden Broucke, S., Luyssaert, S., Davin, E. L., Janssens, I., and van Lipzig, N.: New insights in the capability of climate models to simulate the impact of LUC based on temperature decomposition of paired site observations, J. Geophys. Res.-Atmos., 120, 5417–5436, https://doi.org/10.1002/2015JD023095, 2015.
Verseghy, D. L.: Class – A Canadian land surface scheme for GCMS, I. Soil model, Int. J. Climatol., 11, 111–133, https://doi.org/10.1002/joc.3370110202, 1991.
Viovy, N.: CRUNCEP data set for 1901–2008, available at: https://www.earthsystemgrid.org/dataset/ucar.cgd.ccsm4.CRUNCEP.v4.html, 2011.
Vuichard, N. and Papale, D.: Filling the gaps in meteorological continuous data measured at FLUXNET sites with ERA-Interim reanalysis, Earth Syst. Sci. Data, 7, 157–171, https://doi.org/10.5194/essd-7-157-2015, 2015.
Williams, C. A., Reichstein, M., Buchmann, N., Baldocchi, D., Beer, C., Schwalm, C., Wohlfahrt, G., Hasler, N., Bernhofer, C., Foken, T., Papale, D., Schymanski, S., and Schaefer, K.: Climate and vegetation controls on the surface water balance: Synthesis of evapotranspiration measured across a global network of flux towers, Water Resour. Res., 48, W06523, https://doi.org/10.1029/2011WR011586, 2012.
Wilson, K., Goldstein, A., Falge, E., Aubinet, M., Baldocchi, D., Berbigier, P., Bernhofer, C., Ceulemans, R., Dolman, H., Field, C., Grelle, A., Ibrom, A., Law, B. E., Kowalski, A., Meyers, T., Moncrieff, J., Monson, R., Oechel, W., Tenhunen, J., Valentini, R., and Verma, S.: Energy balance closure at FLUXNET sites, Agr. Forest Meteorol., 113, 223–243, https://doi.org/10.1016/S0168-1923(02)00109-0, 2002.
Xu, Z., Mahmood, R., Yang, Z., Fu, C., and Su, H.: Investigating diurnal and seasonal climatic response to land use and land cover change over monsoon Asia with the Community Earth System Model, J. Geophys. Res.-Atmos., 120, 1137–1152, https://doi.org/10.1002/2014JD022479, 2015.
Zhang, L., Mao, J., Shi, X., Ricciuto, D., He, H., Thornton, P., Yu, G., Li, P., Liu, M., Ren, X., Han, S., Li, Y., Yan, J., Hao, Y., and Wang, H.: Evaluation of the Community Land Model simulated carbon and water fluxes against observations over ChinaFLUX sites, Agr. Forest Meteorol., 226–227, 174–185, https://doi.org/10.1016/j.agrformet.2016.05.018, 2016.
Zhou, C. and Wang, K.: Biological and Environmental Controls on Evaporative Fractions at AmeriFlux Sites, J. Appl. Meteor. Climatol., 55, 145–161, https://doi.org/10.1175/JAMC-D-15-0126.1, 2016.


