the Creative Commons Attribution 4.0 License.
the Creative Commons Attribution 4.0 License.
 | 09 Feb 2026
Rapid flood mapping from aerial imagery using fine-tuned SAM and ResNet-backboned U-Net
Hadi Shokati
Kay D. Seufferheld
Peter Fiener
Thomas Scholten
Flooding is a major natural hazard that requires a rapid response to minimize the loss of life and property and to facilitate damage assessment. Aerial imagery, especially images from unmanned aerial vehicles (UAVs) and helicopters, plays a crucial role in identifying areas affected by flooding. Therefore, developing an efficient model for rapid flood mapping is essential. In this study, we present two segmentation approaches for the mapping of flood-affected areas: (1) a fine-tuned Segment Anything Model (SAM), comparing the performance of point prompts versus bounding box prompts, and (2) a U-Net model with ResNet-50 and ResNet-101 as pre-trained backbones. Our results showed that the fine-tuned SAM performed best in segmenting floods with point prompts (Accuracy: 0.96, IoU: 0.90), while bounding box prompts led to a significant drop (Accuracy: 0.82, IoU: 0.67). This is because flood images often cover the image from edge to edge, making bounding box prompts less effective at capturing boundary details. For the U-Net model, the ResNet-50 backbone yielded an accuracy of 0.87 and an IoU of 0.72. Performance improved slightly with the ResNet-101 backbone, achieving an accuracy of 0.88 and an IoU of 0.74. This improvement can be attributed to the deeper architecture of ResNet-101, which allows more complex and detailed features to be extracted, improving U-Net's ability to segment flood-affected areas accurately. The results of this study will help emergency response teams identify flood-affected areas more quickly and accurately. In addition, these models could serve as valuable tools for insurance companies when assessing damage. Moreover, the segmented flood images generated by these models can serve as training data for other machine learning models, creating a pipeline for more advanced flood analysis and prediction systems.
- Article
(5515 KB) - Full-text XML
- BibTeX
- EndNote


Floods are among the world's most common, pervasive, and expensive natural disasters (Smith et al., 2014; Tingsanchali, 2012). Floods cause the greatest number of fatalities, according to the United Nations (Kuenzer et al., 2013). Global warming is expected to increase the frequency and intensity of floods, further amplifying their devastating impacts (Kamilaris and Prenafeta-Boldú, 2018). Recent catastrophic floods in Australia (Kelly et al., 2023), Japan (Lin et al., 2020), Spain (Ezzatvar and López-Gil, 2024) and Germany (Lehmkuhl et al., 2022) underline that flooding is not limited to the countries of the Global South. However, in countries where the infrastructure for flood protection is inadequate, the loss of human life is significantly higher. In the Global North, economic losses are generally higher than in the Global South (Taguchi et al., 2022), as long as no major infrastructure projects such as dams are affected. Effective flood management is therefore essential to mitigate these losses.
Flood management involves four stages: prevention, preparedness, response, and recovery (Plate, 2002). Remote sensing data plays a critical role in the response and recovery stages. This data is particularly valuable for assessing damage and providing actionable information to speed up recovery efforts, such as guiding insurance claims or resource allocation (De Leeuw et al., 2014). In recent years, satellite data from platforms such as Sentinel-2, Landsat 8 and Landsat 9 have been widely used for flood-affected area detection (Portalés-Julià et al., 2023). Satellite imagery provides valuable information to identify flood zones, assess damage and support flood forecasting and risk assessment models. However, due to revisit limitations, such data is not always available immediately after flood events. As a dense cloud cover is often associated with flood events, it can be challenging to obtain cloud-free images after floods. To overcome such limitations, images taken from UAVs and helicopters can provide an effective alternative to satellite data for flood detection (Hashemi-Beni et al., 2018). UAVs and helicopters can capture high-resolution images at lower altitudes and are less susceptible to cloud interference. They are also cost-effective and offer greater flexibility in the scheduling of surveys (Klemas, 2015; Shokati et al., 2023, 2024; Sugiura et al., 2005; Yao et al., 2019).
Rapid damage assessment is crucial for flood response, as delays can exacerbate the humanitarian and economic toll. However, recording and processing large volumes of aerial images in real time requires efficient and accurate automated methods. To counter this, conventional machine learning models such as Support Vector Machine (SVM), Random Forest (RF) and Maximum Likelihood Classifier (MLC) are often used for flood detection (Tanim et al., 2022). However, these models face challenges such as reliance on manual feature engineering, inability to capture complex features such as textural patterns and neglect of spatial correlations in data. To overcome these challenges, deep learning models have proven to be a powerful tool, demonstrating remarkable effectiveness in various computer vision applications such as image classification (Jackson et al., 2023; Qiao et al., 2024), object detection (Ye et al., 2023), and image segmentation (Shokati et al., 2025; Zhang et al., 2023). In particular, numerous studies have leveraged segmentation techniques to identify areas affected by flooding, demonstrating their potential to address real-world challenges. For example, (Pally and Samadi, 2022) developed a flood image classifier using different convolutional neural network (CNN) architectures for segmentation and object detection to calculate water levels and flood areas. In another study, Safavi and Rahnemoonfar (2023) compared the performance of different encoder-decoder and two-pathway architectures to segment flood-affected areas. Similarly, Wieland et al. (2023) investigated the use of CNNs in detecting water bodies from high-resolution remote sensing imagery. In addition, Wagner et al. (2023) compared 32 CNNs for water segmentation using a dataset of 1128 images depicting river water surfaces.
Deep learning-based approaches in hydrology and especially in flood management have made significant progress in recent years (e.g. Pan et al., 2019; Wang et al., 2020). However, many models still rely on large datasets for training, which can affect their performance if the data are limited, unbalanced or specialized (e.g. Mallah et al., 2022). The model may memorize its features in such cases, leading to overfitting (Safonova et al., 2023). Data augmentation and transfer learning are the most commonly used methods to work with small or highly specialized datasets (Safonova et al., 2023). In data augmentation, new samples are generated by applying different transformations, with the choice of method depending on the type, quality and quantity of data, and transfer learning uses models pre-trained on large datasets, adapting their learned features to new tasks (Safonova et al., 2023). An example of the application of these techniques to soil erosion is presented by (Shokati et al., 2025) who fine-tuned the SAM, a model pre-trained on a large dataset with over 1 billion masks from 11 million images, to segment erosion and deposition features in agricultural fields. Their approach demonstrated that despite the complexity of erosion and deposition processes and their detection, the fine-tuned SAM model achieved high performance. Another transfer-learning approach uses a residual U-Net architecture (Ronneberger et al., 2015), which improves segmentation performance by utilizing pre-trained features. U-Net is widely known for its effectiveness in segmentation tasks such as hydrological streamline detection (Xu et al., 2021) and sea-land segmentation (Shamsolmoali et al., 2019). Incorporating residual connections, as implemented by Onojeghuo et al. (2023), can further improve feature propagation and model convergence. The availability of pre-trained deep neural networks such as ResNet (He et al., 2016) trained on large datasets such as ImageNet (Krizhevsky et al., 2012) facilitates cross-domain knowledge transfer, for example, from natural image classification to remote sensing image segmentation. In particular, combining CNN architectures such as U-Net with ResNet and transfer learning has improved performance on complex tasks such as water body segmentation (Ghaznavi et al., 2024) and plant mapping (Onojeghuo et al., 2023).
Despite significant progress in applying transfer learning in various areas of computer vision, its application to small aerial image datasets for flood management is still largely unexplored. The primary goal in this context is to map the extent and location of flooded areas. Rapid data collection with helicopters and UAVs, for which only a small dataset is required, makes it possible to use this approach to evaluate preventive and preparatory measures before and during flood events. Furthermore, integrating satellite data could eventually lead to a comprehensive flood forecasting and monitoring system.
The central aim of this study is to test the potential of two advanced transfer learning techniques – the fine-tuned SAM and the U-Net architecture with ResNet-50 and ResNet-101 backbones – for automated and fast flood area detection and mapping. By automating the mapping process, our approach aims to speed up damage assessment and enable authorities to respond more efficiently and mitigate the financial and human toll of flooding. The priority is to record the extent and location of the flooded areas to assess the extent of the damage and predict possible further damage. Specifically, we address the following research questions:
-
Which combination of prompt (bounding box or point prompts) for SAM and backbone (ResNet-50 or ResNet-101) for U-Net provides the best performance in flood area detection?
-
How do the fine-tuned SAM and U-Net architecture differ in terms of segmentation accuracy for flood area detection using UAV and helicopter imagery?
-
How do the elements of the sky, such as clouds or open sky, affect segmentation accuracy?
2.1 Dataset
This study uses a flood area dataset comprising 290 images with their corresponding masks acquired from Karim et al. (2022). The images were captured using UAVs and helicopters with optical sensors in different regions, including flood events in southern Germany (2013), Karnataka, Kerala and Maharashtra in India (2019), Sabah in Malaysia (2021) and Bangladesh (2022). The dataset includes a variety of scenes, including rural areas, urban areas, peri-urban areas, greenery, buildings, mountains, rivers, sky, and roads, with masks created using Label Studio software (Fig. 1).
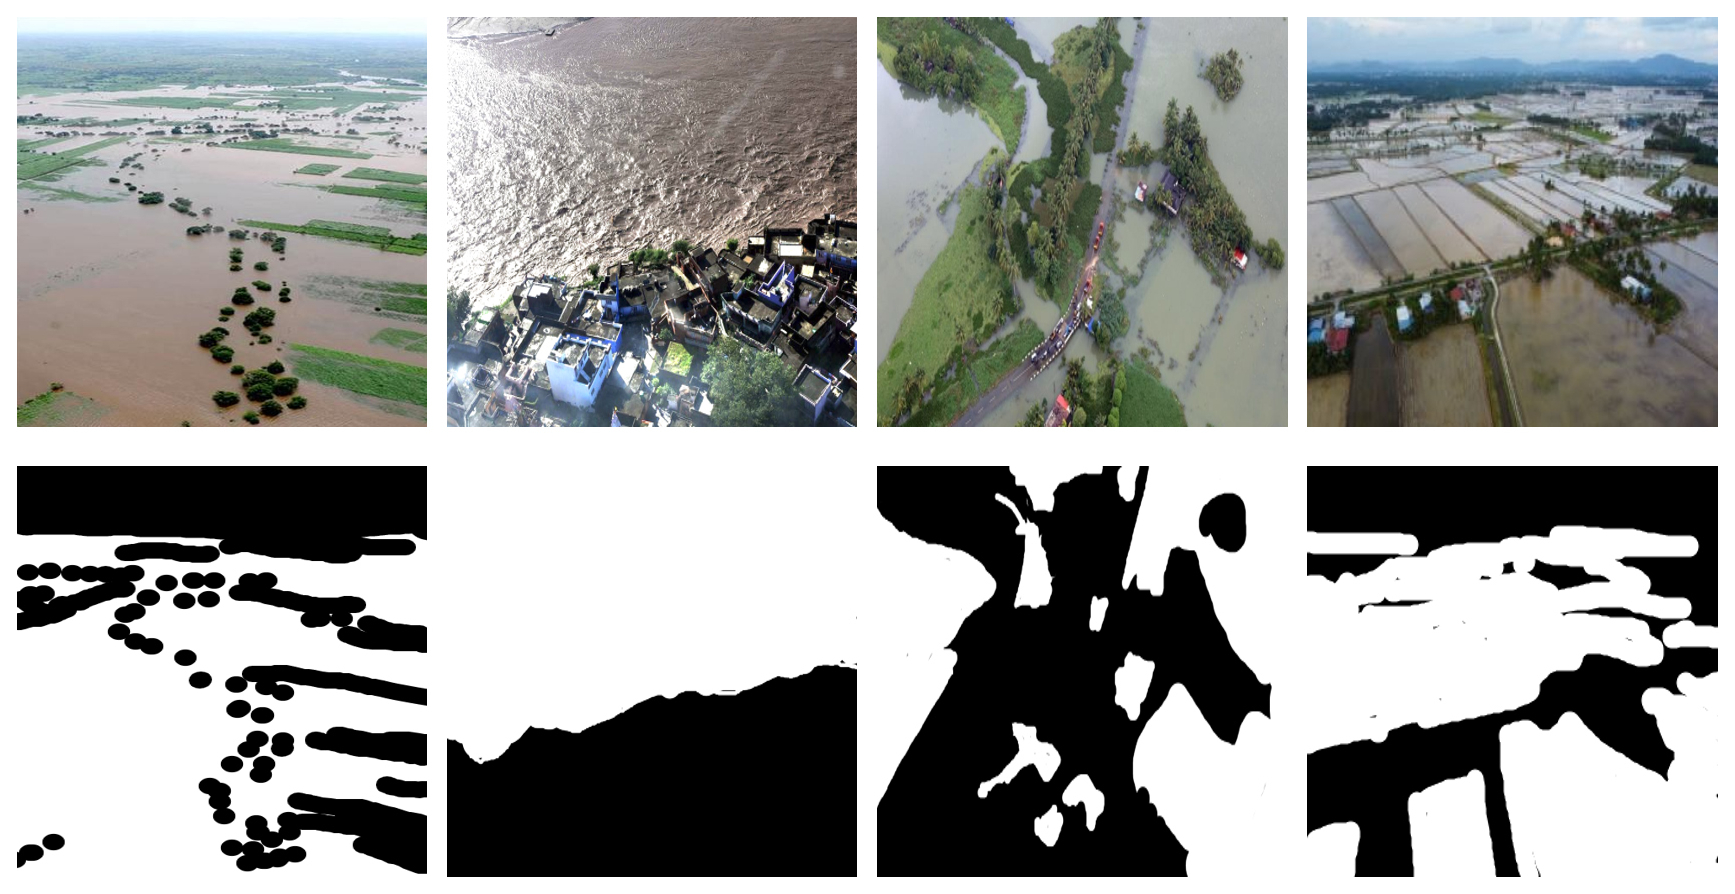
Figure 1Example images from the Flood Area dataset (top) with their corresponding ground truth masks (bottom). Images and their corresponding masks are from Karim et al. (2022).
Due to the use of different platforms and sensors, the imaging conditions were inherently inconsistent. The camera angle during imaging was inconsistent. In some cases, no clouds or sky elements were visible due to the low camera angle, while in other cases, sky elements such as clouds or open sky were visible due to greater camera rotation. In addition, the images were taken at different heights, resulting in different spatial resolutions. The image dimensions also varied considerably: the width ranged from 219 to 3648 pixels and the height from 330 to 5472 pixels. To ensure the uniformity of the dataset for modeling purposes, all images were resized to 256×256 pixels prior to analysis.
2.2 Network Architecture
2.2.1 Fine-tuning Segment Anything Model
The Segment Anything Model (SAM) developed by Meta AI Inc., USA is an image segmentation model trained on 1 billion masks extracted from 11 million images. As the name suggests, it can segment any image without the need for additional training data (Kirillov et al., 2023). The architecture of SAM is composed of three primary components: an image encoder, which is built on a robust Vision Transformer (ViT) backbone and extracts features from the input image; a prompt encoder, which uses the input prompts to create embeddings; and a mask decoder, which generates the final mask by combining the outputs of the previous components (Fig. 2).
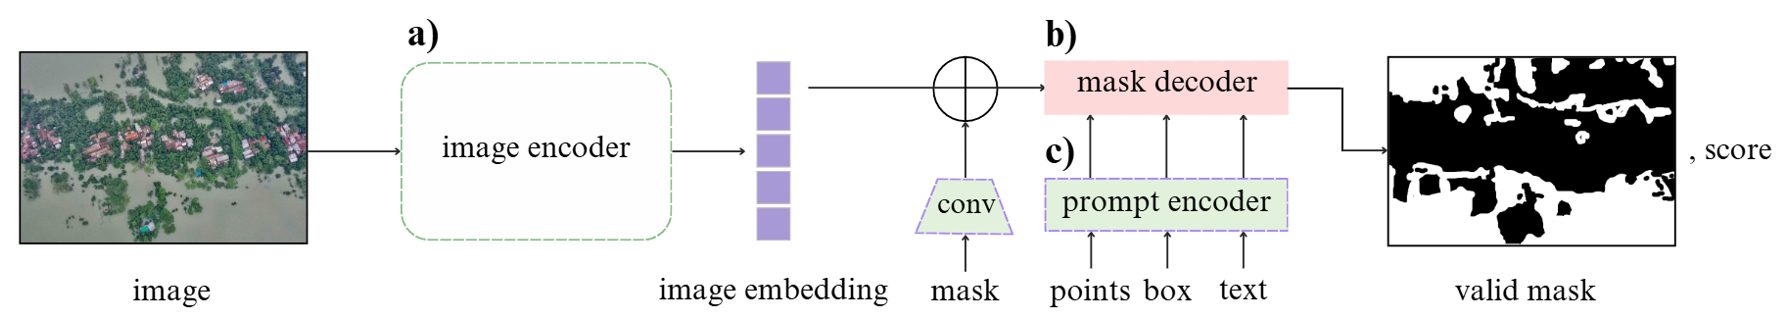
Figure 2Schematic figure of the Segment Anything Model architecture, where the image encoder processes the image to extract features, which are combined with the prompt encoder's embeddings and passed to the mask decoder to generate the final segmentation mask. Image and mask are from Karim et al. (2022).
The SAM architecture enables the integration of human prompts, which increases the efficiency of annotation by the human in the loop. The prompts guide the model to focus on specific regions of the image, improving segmentation accuracy. These prompts can take different forms, e.g., bounding box, point and text. To implement prompt-based interaction with the SAM architecture, we used both bounding box and point prompts in a fully automated manner. For the bounding box prompts, we first identified all foreground pixels in the annotated images (pixels representing flood). The bounding box was then computed as the smallest rectangle enclosing all foreground pixels in each binary mask by determining their minimum and maximum x and y coordinates. For the point prompts, we randomly selected 30 foreground pixels per image. To ensure spatial diversity and avoid clustering, a minimum Euclidean distance of 10 pixels was set between two selected points. This restriction contributed to a more representative coverage of the flooded area, which in turn improves segmentation accuracy.
SAM offers several variants, each tailored to different computational requirements and based on distinct configurations of the Vision Transformer (ViT) backbone: ViT-Base, ViT-Large, and ViT-Huge, containing approximately 91M, 308M, and 636M parameters, respectively (Kirillov et al., 2023). Upon evaluating these variants, we observed that their effectiveness in detecting flood-affected areas was remarkably comparable. To optimize our computational resources, we opted for the ViT-Base variant as it offers a favorable balance between performance and efficiency.
Although SAM can process any image without additional training, its performance may be limited in complex tasks. In such cases, fine-tuning can enhance its segmentation accuracy (Shokati et al., 2025). Fine-tuning is a transfer learning technique that applies a pre-trained model, such as SAM, which has already learned general patterns from a large dataset. A task-specific dataset, such as a flood dataset, is then prepared and formatted to match the model's input requirements. Certain layers of the model are either frozen or modified to regulate the extent to which training updates alter the original knowledge. The model is then trained with the new dataset at a lower learning rate to refine its understanding without overwriting prior knowledge. After training, the model's performance is evaluated using a validation set, and hyperparameters are adjusted for optimization. Once the model achieves satisfactory accuracy, it is deployed and continuously monitored to ensure robust performance on real-world data. In this study, the mask decoder of SAM (Fig. 2b) is fine-tuned (modified) as it has a simple and efficient design that requires fewer computational resources (Sun et al., 2024). This ensures that the fine-tuning process is fast, efficient, and requires less memory. In this process, the other two components, the image encoder (Fig. 2a) and the prompt encoder (Fig. 2c) are kept fixed (frozen), meaning their parameters are not updated during fine-tuning. This ensures that only the mask decoder is modified.
2.2.2 U-Net architecture with ResNet as the backbone
U-Net is a fully convolutional neural network introduced in 2015 for segmenting biomedical images (Ronneberger et al., 2015). Over time, it has been adapted for other fields, such as remote sensing. With its U-shaped architecture, U-Net comprises a down-sampling path (encoder) and an up-sampling path (decoder). This structure enables the convolutional network to learn and combine features at various levels of detail, which is critical for accurately segmenting small regions and fine details in images.
The down-sampling path follows a typical convolutional network architecture. It involves repeated applications of 3×3 convolutions (without padding), each followed by a ReLU (Rectified Linear Unit) activation and a 2×2 max-pooling operation with a stride of 2 to reduce the spatial dimensions. At each down-sampling stage, the number of feature channels doubles, enabling the network to extract increasingly complex features while progressively losing spatial information. This part of the network is crucial for capturing high-level features from the input image.
The up-sampling path is the reverse of the down-sampling path. This part of the network utilizes deconvolution operations to double the spatial dimensions of the feature maps. Following each deconvolution, a concatenation operation is performed with the corresponding feature maps from the down-sampling path to restore spatial information. This process helps recover the details lost during the down-sampling phase and enhances the network's spatial accuracy for final segmentation. Skip connections are used to concatenate feature maps from the corresponding layers in the encoding path to the decoding layers, ensuring the recovery of information lost during down-sampling. At the end of the architecture, a 1×1 convolutional layer is applied to map the feature maps to the desired number of segmentation classes. This final layer assigns a class label to each pixel, producing the segmented output.
To achieve better results with limited data, we apply knowledge from transfer learning in this study. Specifically, we use a residual neural network (ResNet) (He et al., 2016) pre-trained on ImageNet as the encoder backbone of U-Net. The weights of the pre-trained encoder are kept frozen to utilize the existing low-level feature representations (such as edges, corners, and textures), while only the U-Net decoder is trained on our dataset. This allows the decoder to adapt to our segmentation task without updating the encoder's weights (Fig. 3).
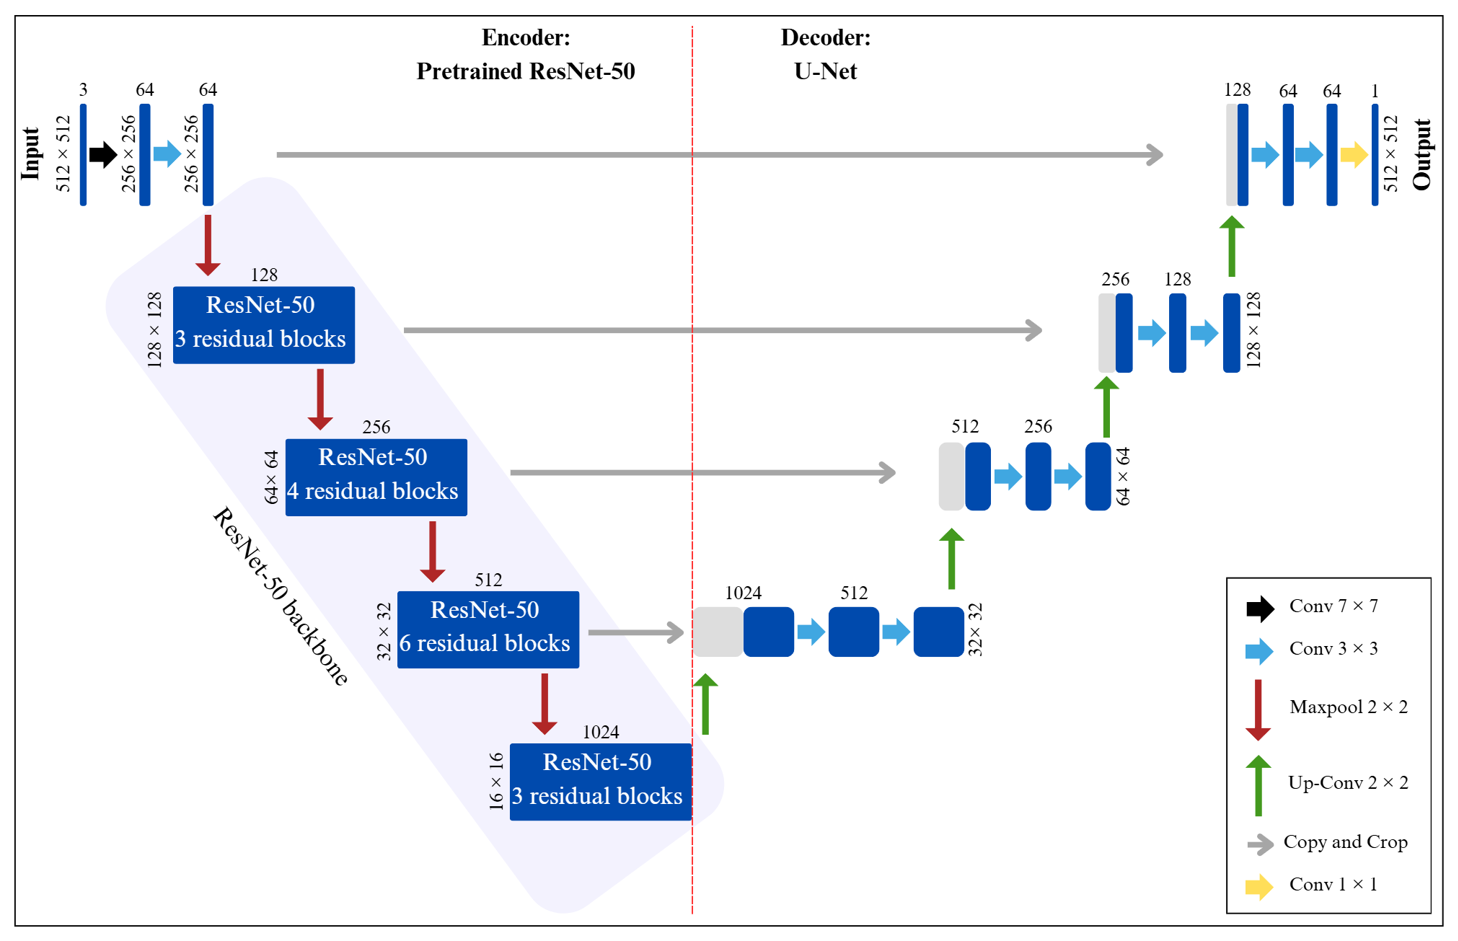
Figure 3Architecture of U-Net with ResNet-50 backbone (adapted from Manos et al., 2022).
ResNet is a convolutional neural network (CNN) that uses identity skip connections to solve the degradation issue that occurs when accuracy reaches saturation and rapidly deteriorates as network depth grows. Convolutions of 1×1, 3×3, and 1×1 series are used to stack several bottleneck residual blocks to create it. There are several variations of the ResNet model depending on the network's depth, including ResNet18, ResNet34, ResNet50, ResNet101, and others. ResNet50 and ResNet101, which have 50 and 101 layers, respectively, were used in this study.
2.3 Experimental Training Setup
For the segmentation model, 70 % of the flood area dataset (204 samples) was used for training. Data augmentation was applied exclusively to the training set to increase the diversity of the training data. These included geometric transformations such as random horizontal and vertical flips and rotations of up to 30° as well as color-based transformations such as random grayscale transformations and Gaussian blurs with a kernel size of 3, all applied with a probability of 0.5. The model was trained for 50 epochs, with each epoch representing a complete pass the training data through the model. A batch size of 4 and a learning rate of 1e−3 were used. A learning rate scheduler was employed to adjust the learning rate if the validation loss did not decrease over 10 consecutive epochs, reducing the previous learning rate by multiplying it by a factor of 0.1. Additionally, 15 % of the dataset (43 samples) was used for model validation at the end of each epoch. Among the 50 models generated, the one with the lowest validation loss was selected as the best model and tested on the remaining dataset (15 %, 43 samples). The Adam optimizer algorithm was utilized due to its strong adaptability (Liu et al., 2023). To minimize the discrepancy between observed and predicted flood extents, we used the Dice-Cross-Entropy Loss, which averages the Dice loss and cross-entropy loss. This composite loss function is widely used in model training, as it balances the strengths of both components (Hadlich et al., 2023; Shokati et al., 2025). It facilitates rapid convergence and often improves final performance, particularly enhancing the Dice coefficient (Hadlich et al., 2023), which is critical for accurately capturing the spatial overlap between predicted and actual flood areas. The dice and cross-entropy losses are calculated as:
Where LDice and LCE are dice and cross-entropy losses, respectively, N is the number of pixels, is the ground truth binary indicator of the class label c of pixel i, and is the corresponding predicted segmentation probability.
Experiments were carried out using Python and the PyTorch framework on a Windows 11 computer equipped with an NVIDIA GeForce RTX 4070 Ti GPU.
2.4 Model performance evaluation
The performance of segmentation models is usually evaluated using several metrics, e.g. intersection-over-union (IoU), dice coefficient, recall, precision and accuracy. IoU quantifies the overlap between the predicted and true flood-affected regions, with higher values indicating better model performance in terms of accurately identifying flood-affected areas. The dice coefficient is similar to IoU, but emphasizes correct positive predictions, making it particularly useful in scenarios with class imbalance. Recall measures the model's ability to correctly identify all flood-affected regions, with higher values reflecting fewer overlooked regions. Precision evaluates the accuracy of the model's positive predictions and indicates the proportion of correctly identified flood-affected regions out of all predicted positive outcomes. Finally, accuracy provides an overall measure of the correctness of the model, considering both correct predictions of flood-affected and non-flood-affected regions. However, it may not be as informative for highly imbalanced datasets. Each of these metrics provides different insights into the performance of the model and can be used together for a comprehensive assessment. They are given in the following equations (Vinayahalingam et al., 2023):
Where TP, TN, FP, and FN stand for the pixel labels for true positives, false positives, true negatives, and false negatives, respectively.
3.1 Training and validation losses
Both U-Net (with ResNet-50 and ResNet-101 as backbones) and fine-tuned SAM (with bounding box and point prompts) models were trained for 50 epochs (Fig. 4). For the SAM models, whether trained with point or bounding box prompts, the training loss exhibited a sharp decline at the beginning of the training process. This was followed by a slower, more gradual decrease until the final epochs. Similarly, the validation loss initially experienced a steep decline, which then slowed progressively until the point where the downward trend almost stopped, especially for bounding box prompts where the validation loss even increased very slightly, which could be a sign of overfitting (Shorten and Khoshgoftaar, 2019). A comparison of training and validation losses between the point and the bounding box prompts revealed that the model trained with the point prompts generally performed better in both learning the training set and generalizing to the validation set.
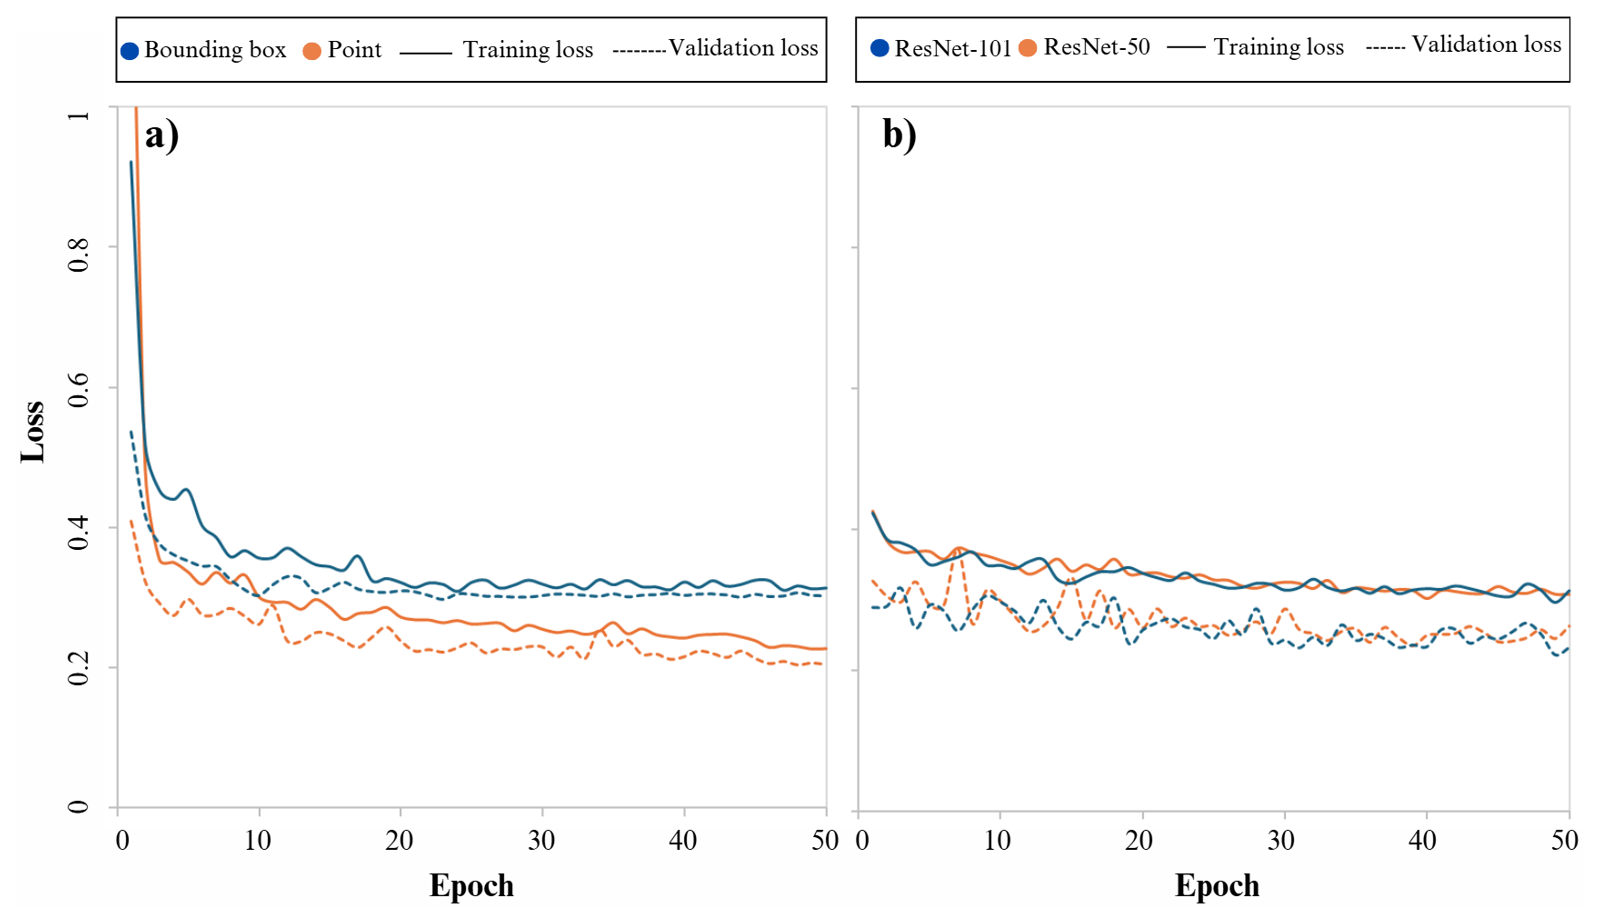
Figure 4Training and validation losses for (a) Segment Anything Model with point and bounding box prompts and (b) U-Net model with ResNet-50 and ResNet-101 backbones.
For the U-Net model, both training loss and validation loss gradually decreased throughout the training process, whether ResNet-50 or ResNet-101 was used as the backbone. This indicates that the model effectively learned the relationships within the training set while also improving its ability to generalize to unseen data (validation set). The training and validation loss values were nearly identical when using ResNet-50 and ResNet-101 as backbones, suggesting that both backbones performed similarly in terms of learning and generalization capabilities.
3.2 Performance of the model on the validation set
For the SAM model with point prompts (SAM-Points), all evaluation metrics consistently increased during the initial epochs, followed by stabilization in the later epochs (Fig. 5a). The SAM model with bounding box prompts (SAM-Bbox) demonstrated a similar trend, with metrics steadily increasing before reaching stability (Fig. 5b). Comparing these two prompting methods revealed that the SAM-Points (Fig. 5a) outperformed the SAM-Bbox (Fig. 5b) regarding overall validation performance.
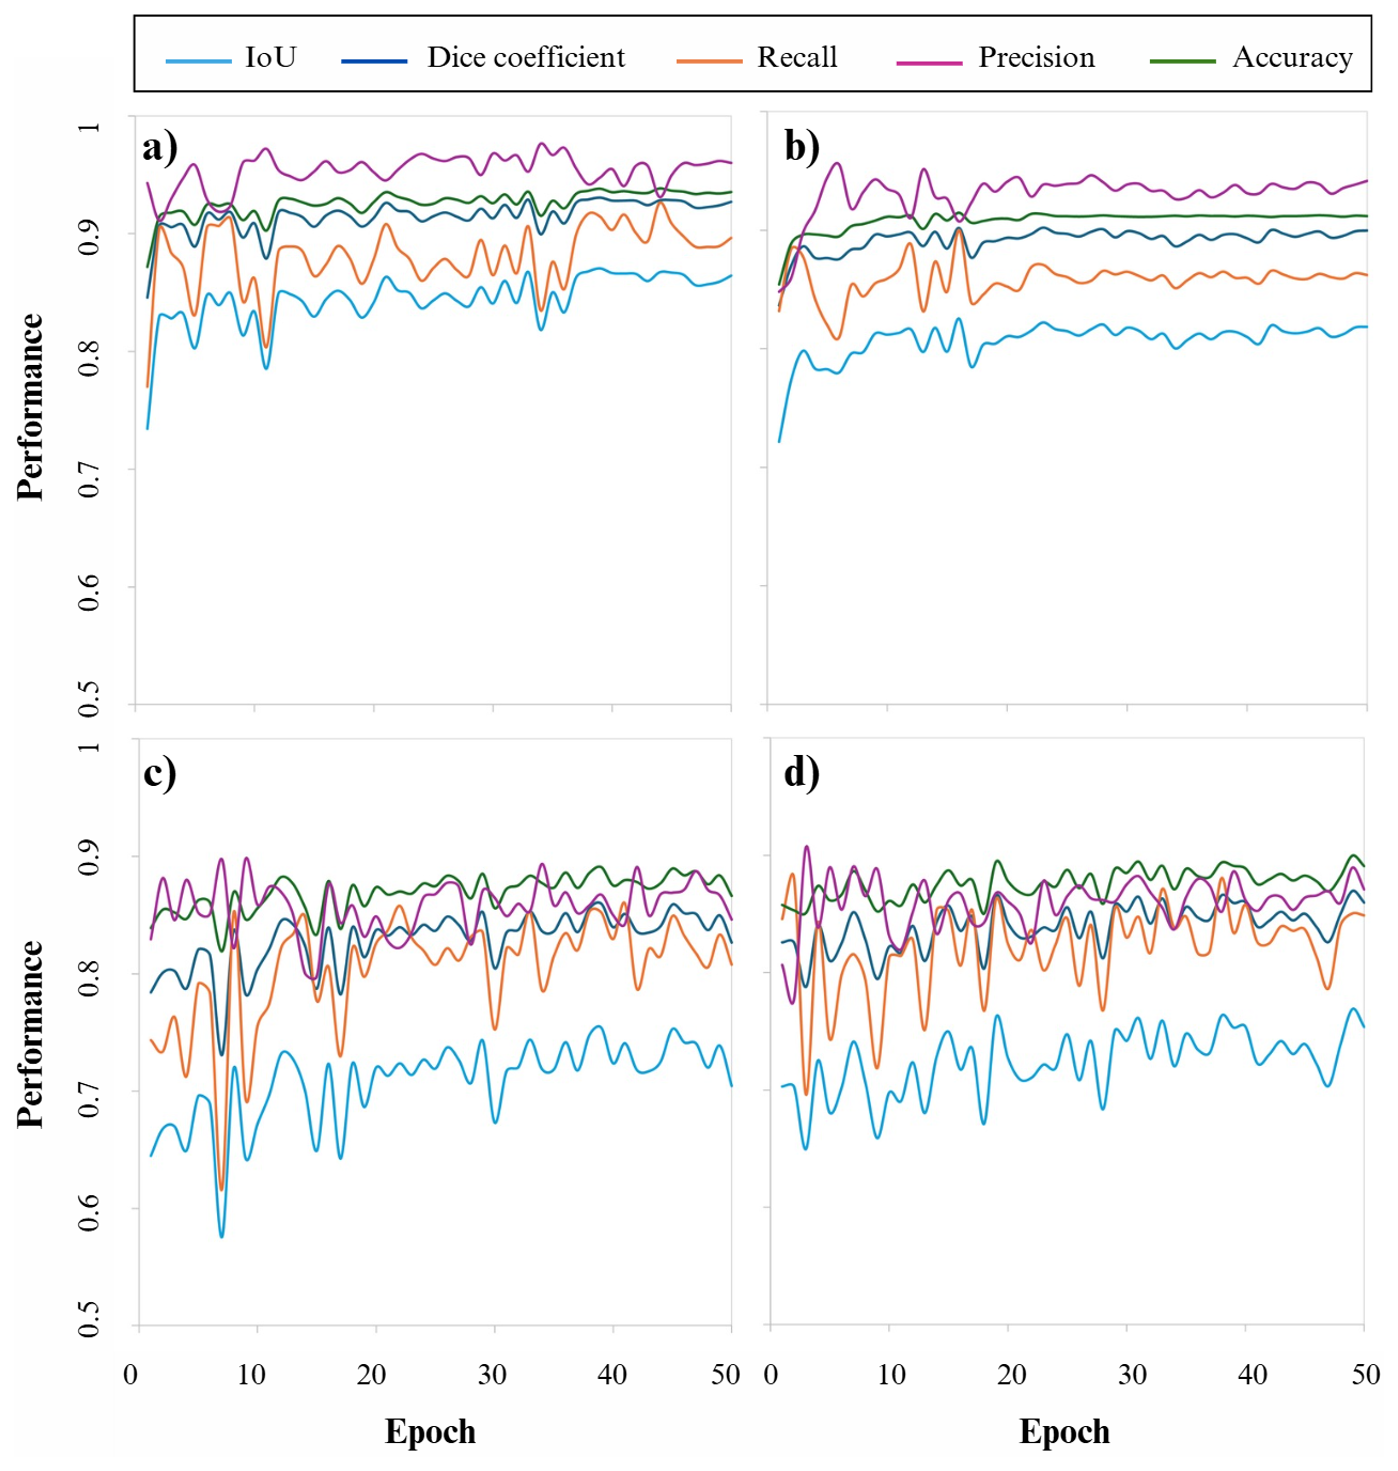
Figure 5Performance of the Segment Anything Model on validation set using (a) point prompts and (b) bounding box prompts and the performance of U-Net model with (c) ResNet-50 and (d) ResNet-101 backbones.
For the U-Net model, the metrics for the ResNet-50 backbone showed a steady improvement, eventually reaching stabilization (Fig. 5c). The U-Net model with the ResNet-101 backbone followed a similar trajectory, with only minor differences in terms of stability (Fig. 5d). A direct comparison of the two backbone configurations revealed that both ResNet-50 and ResNet-101 backbones performed similarly in learning and generalization for the U-Net model.
When comparing the performance of the SAM model to the U-Net model, regardless of the prompt type or backbone configuration, the SAM model consistently outperformed the U-Net model on the validation set.
3.3 Evaluating segmentation results
In this study, the performance of the SAM and U-Net models was evaluated for segmenting flooded areas. The SAM model was assessed with two types of prompts, point prompts and bounding box prompts, while the U-Net model was tested with two backbone types, ResNet-50 and ResNet-101. The results of the different metrics are shown in Table 1, and examples of the segmentation results of all models are shown in Fig. 6.
Table 1Segmentation results of the test dataset using the Segment Anything Model with point and bounding box prompts (SAM-Points and SAM-Bbox models, respectively) and the U-Net model with ResNet-50 and ResNet-101 backbones (the highest accuracies are in bold).
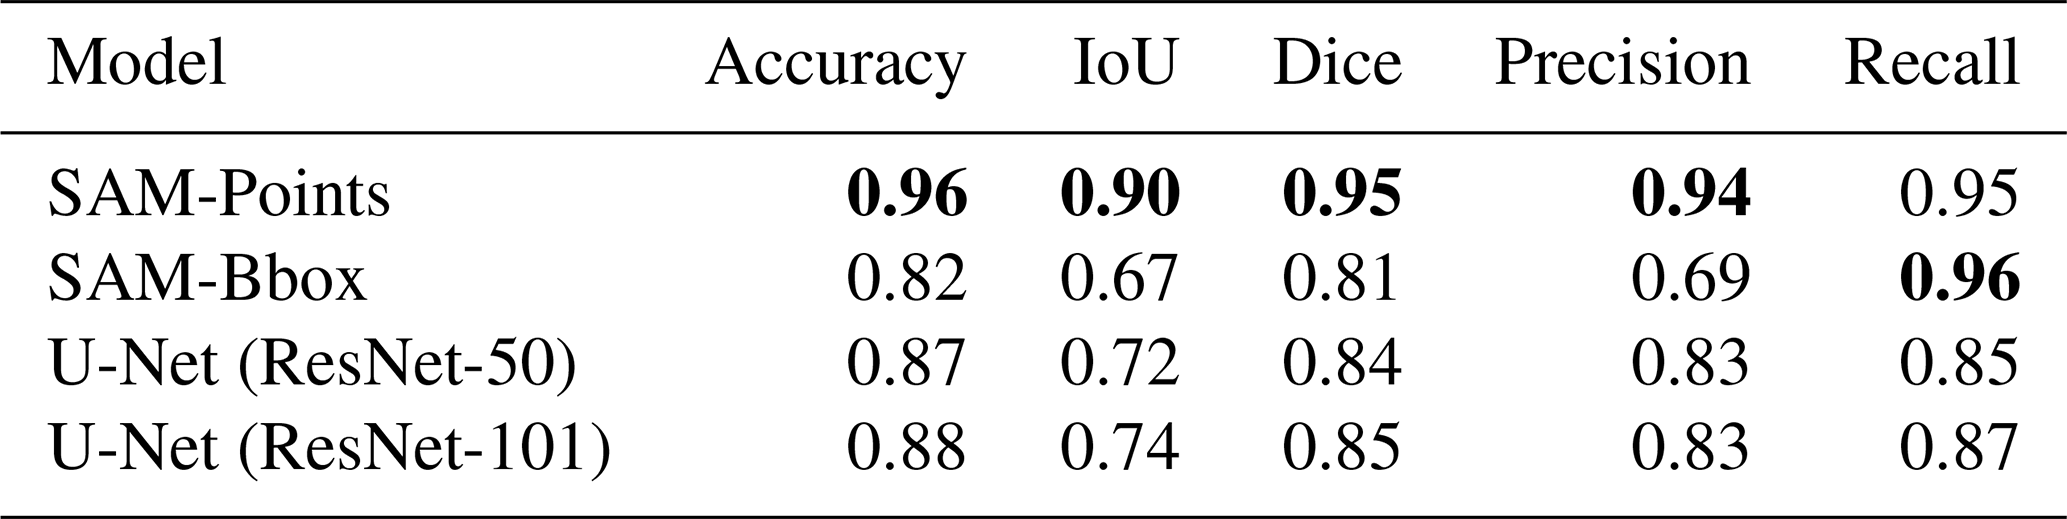
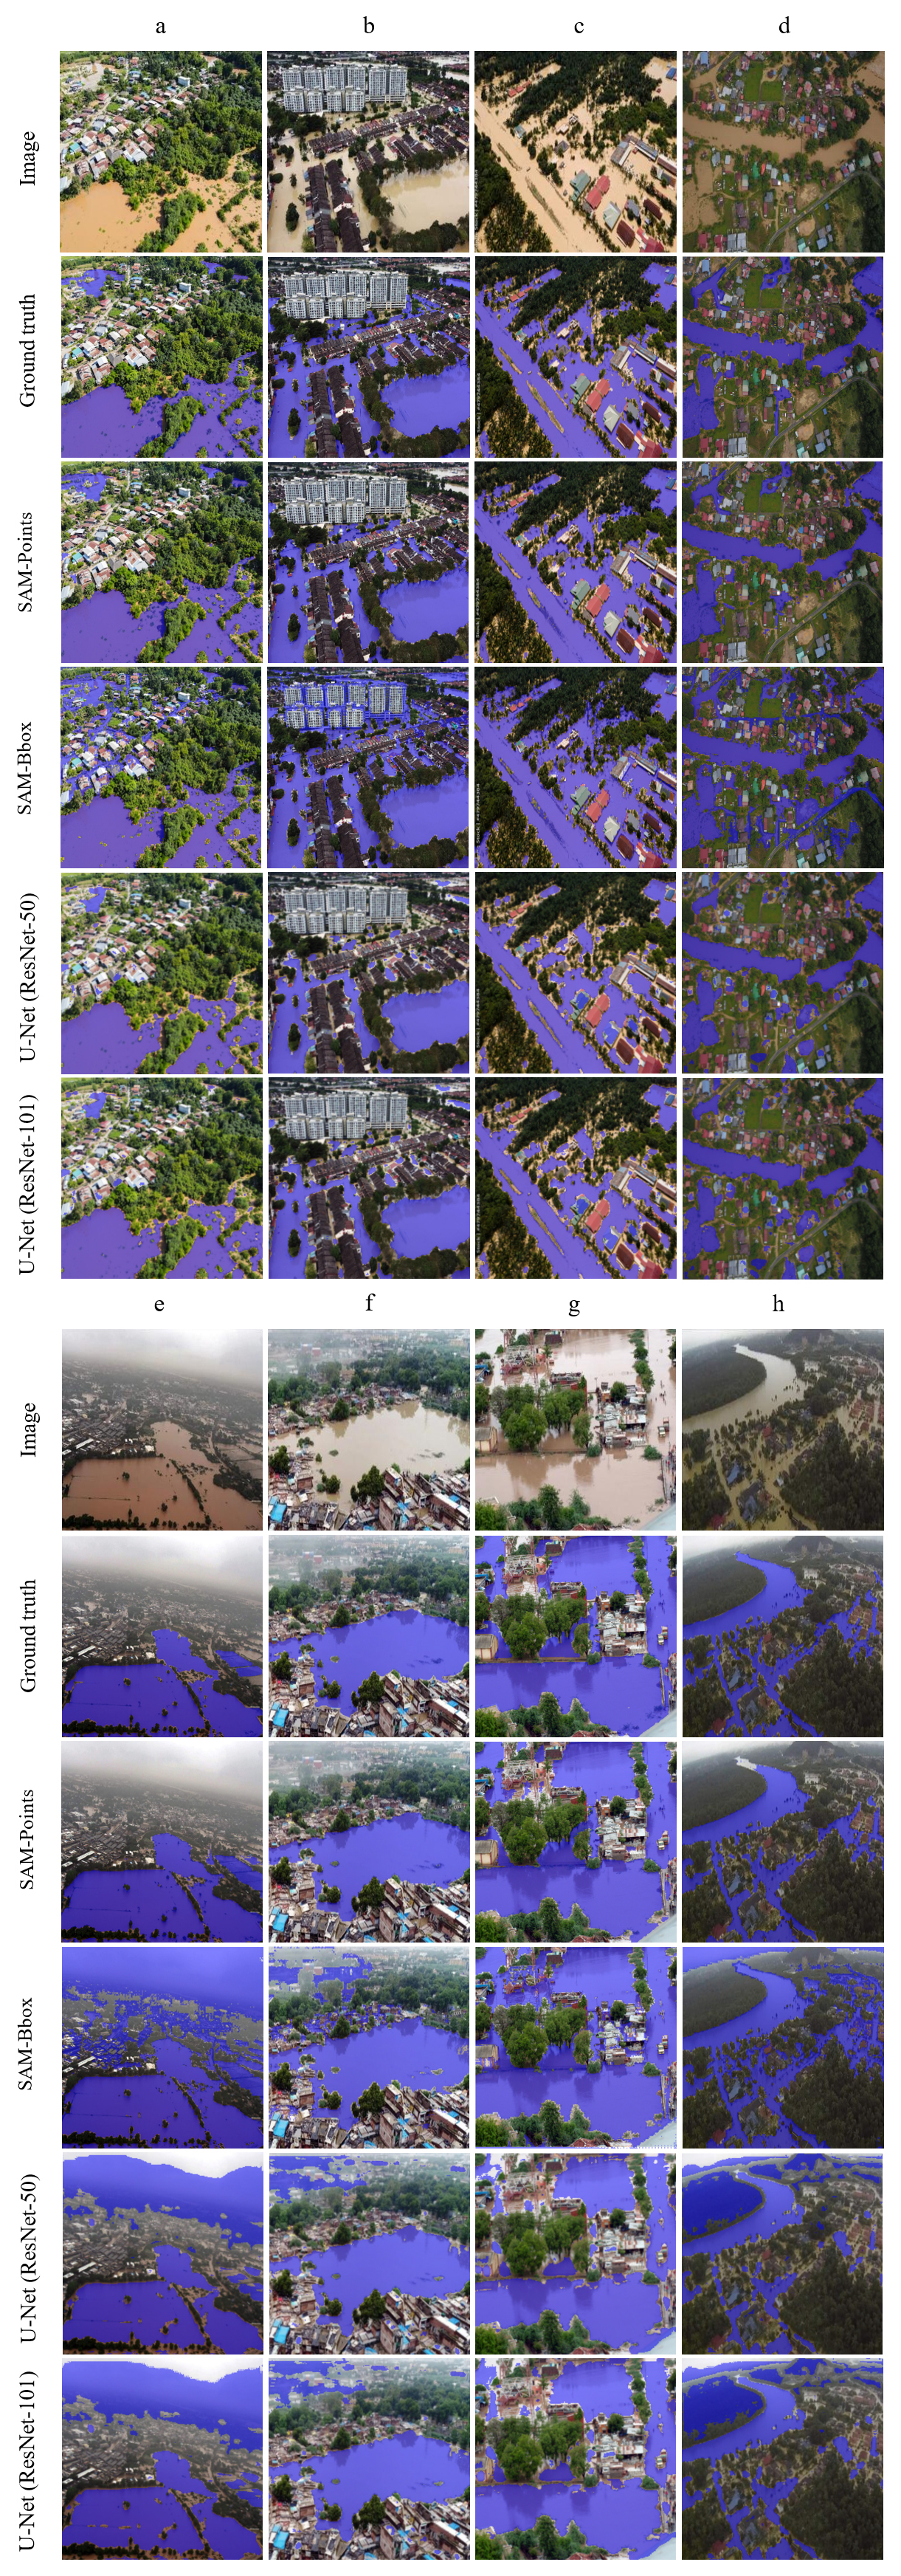
Figure 6Example segmented images using the Segment Anything Model with point and bounding box prompts (SAM-Points and SAM-Bbox models, respectively) and the U-Net model with ResNet-50 and ResNet-101 backbones. Subplots (a–h) correspond to different samples from the dataset of Karim et al. (2022).
The results indicated that the SAM-Points outperformed all other models (Table 1). The strong performance of this model can be primarily attributed to the ability of the point prompts to provide precise spatial information. This information allows the model to recognize the exact boundaries of the flood-affected areas and to make accurate predictions. This ability is particularly important in regions where light intensity varies significantly (e.g. Fig. 6e and h), or the boundaries of flooding are unclear. In addition, the architecture of the SAM model uses input prompts, which increases the accuracy of its predictions and contributes to its superior performance.
The SAM-Bbox showed the weakest performance among all other models (Table 1). Although SAM-Bbox achieved the highest recall (0.96), it performed worse on other metrics compared to SAM-Points. The higher recall indicates the model's strong ability to identify flood-affected areas. However, the lower precision (0.69) shows that it is difficult to delineate the boundaries accurately, resulting in extraneous or non-contiguous areas being part of the flood-affected areas. This limitation arises from the limited information provided by the bounding box prompts, which only provides the general framework of the target area without offering detailed boundary data. In other words, the bounding box prompts provide the model with limited information about the exact boundaries, which increases the probability of false-positive predictions.
While the existing literature suggests that bounding box prompts often perform better than point prompts in different contexts (Cheng et al., 2023; Gaus et al., 2024; Mazurowski et al., 2023; Xie et al., 2024), the choice of prompt is highly dependent on the specific nature of the dataset. Flood segmentation is a rare case where point prompts outperform bounding box prompts. In the data analyzed, the flooding areas often extend across the entire image from one edge to another. Consequently, a bounding box usually covers most of the image and provides the model with less detailed information than point prompts. Theoretically, this lower granularity of information from bounding box prompts leads to poorer performance in such cases. In addition, the inherently diffuse and irregular nature of flood boundaries makes point prompts stronger cues for guiding the model, while bounding box prompts typically include both flooded and non-flooded regions, providing the model with less discriminatory guidance. However, this observation must be interpreted in light of the specific assumptions and methodological choices made in our study. In particular, both types of prompts were generated fully automatically and without manual refinement, and the point prompts were spatially constrained to ensure dispersion across the flooded regions. These design decisions, in combination with the inherent characteristics of flood imagery, such as large, amorphous regions that often cover significant portions of the image, have a direct impact on the relative effectiveness of each prompt type. Therefore, the superior performance of point prompts observed in our experiments should not be generalized to other domains without carefully considering the characteristics of the dataset properties and the prompt generation strategies.
The U-Net models used in this study showed moderate performance in flood segmentation (Table 1). Notably, the U-Net model with a ResNet-101 backbone outperformed the model with a ResNet-50 backbone. This improved performance of the ResNet-101 backbone was also reported in a study by Ait El Asri et al. (2023) which focused on aerial image segmentation. The superior performance of the ResNet-101 can be attributed to its ability to extract more complex and detailed features from the images due to its deeper layers, allowing U-Net to identify flood-affected areas with higher accuracy. However, the difference between the two models was minimal, and U-Net with ResNet-101 only outperformed ResNet-50 on a few images (e.g. Fig. 6g). The small difference in results suggests that increasing the network depth does not significantly improve performance in the context of flood segmentation. This could be because flooding patterns are not complex enough to require deeper architecture for effective analysis. Nevertheless, the performance of U-Net with both backbones lagged behind that of SAM-Points, highlighting the superiority of the SAM model in utilizing prompt-based information to improve prediction accuracy. The superior performance of the fine-tuned SAM model compared to U-Net was also noted in similar studies by Lehmiani et al. (2023) and Moghimi et al. (2024). However, although SAM demonstrates higher accuracy, it is important to consider the computational trade-offs. Moghimi et al. (2024) observed that SAM requires significantly more computational resources, with approximately three times the parameter count of models like U-Net and longer training times. Therefore, while SAM with point prompts provides the highest precision for flood mapping, U-Net remains a more computationally efficient alternative.
In summary, regarding the first research question, which investigates the optimal combination of prompts for SAM and backbones for U-Net, the results indicated that the SAM-Points performed better than the SAM-Bbox. In addition, the U-Net model with the ResNet-101 backbone performed better than the model with ResNet-50. In response to the second research question on the differences in segmentation accuracy between the fine-tuned SAM model and the U-Net model with ResNet-50 and ResNet-101 backbones, our results showed that the SAM-Points model significantly outperformed both U-Net configurations, while the SAM-Bbox model had the weakest performance among all models tested. This generally aligns with findings by Moghimi et al. (2024), who reported that fine-tuned SAM achieved superior segmentation accuracy compared to established deep learning models such as U-Net, DeepLabV3+, and PSPNet across multiple river scene datasets. However, a key methodological difference exists: Moghimi et al. (2024) fine-tuned SAM without using any input prompts to enable fully automated segmentation. In contrast, our study evaluated the impact of specific prompt types, revealing that while point prompts significantly outperformed U-Net, bounding box prompts failed to do so. This suggests that although SAM's architecture is inherently powerful, its performance in flood mapping is highly sensitive to the prompting strategy used.
To answer the research question regarding the effects of sky elements on segmentation accuracy, our analysis revealed that segmentation accuracy of all models decreased in images where sky elements such as clouds or open sky were present due to significant camera rotation angles, compared to conditions where the camera provided a near top-down view (e.g. Fig. 6e and h). This finding is consistent with the results of Simantiris and Panagiotakis (2024). Moghimi et al. (2024) similarly highlighted that the dynamic nature of water, exhibiting varying colors and reflecting the sky and surrounding structures, poses significant difficulties for segmentation models, although deep learning approaches generally handle these artifacts better than traditional methods. This is because segmentation methods are often based on color information. If the color of objects such as the sky or clouds is similar to the color of the areas affected by the flood, the model may have difficulty distinguishing them from the flood and incorrectly segment them as part of the flood zone. This problem was less pronounced in the SAM-Points than in the other models, while it was more prominent in the SAM-Bbox, as each bounding box usually covers almost the entire image. In other words, sky elements can be falsely considered as potential regions for segmentation.
3.4 Effectiveness of the models in real-world applications
The results of this study highlight the effectiveness of U-Net (with ResNet-50 and ResNet-101 backbones) and fine-tuned SAM (with bounding box and point prompts) models in segmenting flood-affected areas. Despite variations in flight altitude, image quality, resolution and viewing angles, these models performed remarkably well. In real-world scenarios, where such variations are common, these models can be expected to process aerial images of affected regions quickly and without additional training. This rapid prediction capability can help emergency teams immediately identify flooded areas and take the necessary measures. In addition, these models are of great benefit to insurance companies in assessing damage, speeding up insurance payments and improving post-crisis services. In summary, these approaches offer significant benefits for flood crisis management and help minimize human and economic flood impacts through timely and precise interventions.
3.5 Dataset size and diversity considerations
Determining the optimal dataset size in transfer learning does not depend on a universal static threshold; rather, it is a function of task complexity, model architecture, and the domain similarity between the source and target tasks. In transfer learning, large-scale pre-trained models such as SAM (Kirillov et al., 2023) and ResNet (He et al., 2016) already capture rich, generalized feature representations from millions of natural images. This is further supported by recent research on water segmentation using SAM, which suggests that the model's robust spatial priors can achieve high performance even with minimal labeled data (Zamboni et al., 2025). As a result, a relatively small number of labeled samples is often sufficient for fine-tuning to achieve high performance in specialized applications.
Our dataset consists of 290 images covering flood events in countries such as Germany, India, Malaysia, and Bangladesh. This geographic diversity ensures variability in environmental conditions, land cover types, flood characteristics, and illumination. The inclusion of both UAV and helicopter imagery from different camera angles and altitudes further increases this variability, providing a robust basis for model generalization. Additionally, data augmentation techniques (such as rotations, flips, grayscale transformations, and Gaussian blur) increased the effective training diversity and reduced the risk of overfitting. Empirically, our results (Table 1) demonstrate that the fine-tuned SAM model achieved an IoU of 0.90 and an accuracy of 0.96 on unseen data, confirming that the dataset sufficiently captured the variability required for reliable flood segmentation. Comparable studies on environmental and remote sensing tasks (e.g., Ghaznavi et al., 2024; Shokati et al., 2025) have reported strong performance using datasets of similar size, reinforcing the suitability of our sample in the context of transfer learning-based flood segmentation.
In this study, we used two advanced transfer learning techniques: the fine-tuned SAM model and the U-Net architecture with ResNet-50 and ResNet-101 backbones to detect flood-affected areas. Using the Flood Area dataset, which includes UAV and helicopter aerial images of flood-affected areas, we aimed to evaluate and compare the performance of these models in accurately segmenting flood-affected areas. Our results showed that the fine-tuned SAM model outperformed the U-Net model when point prompts were used, while it performed worst among all models when bounding box prompts were used. This emphasizes the crucial role of prompting strategies in influencing the performance of the fine-tuned SAM model in flood segmentation. The results of the study offer practical benefits for emergency response teams as they allow for a faster and more accurate assessment of the areas affected by the floods. In addition, the models are also of great value to insurance companies in the damage assessment phase. Despite these promising results, there is still room for further research. A limitation of the present study is that the Flood Area dataset we used (290 aerial images and associated masks) did not include GPS/georeferenced metadata, so it was not possible to produce georeferenced results. Addressing this dataset limitation in future works would enable more accurate and actionable relief. Future work could also include the development of a user-friendly interface that allows emergency responders and insurance professionals to seamlessly utilize these models and effectively interpret the results. In addition, extending the models to predict high-risk areas before flooding occurs – using inputs such as topographical data, rainfall trends and river flow information – could further enhance their utility.
The codes and data supporting the findings of this study are openly available in the GitHub repository at: https://github.com/hadi1994shokati/Flood-segmentation (last access: 4 February 2026; https://doi.org/10.5281/zenodo.18485640, Shokati, 2026).
HS: Conceptualization, Data curation, investigation, Methodology, Formal analysis, Software, Visualization, Writing – original draft. KDS: Writing – review and editing. PF: Funding acquisition, project administration, Data curation, Conceptualization, Supervision, Writing – review and editing. TS: Funding acquisition, Supervision, Conceptualization, project administration, Data curation, Writing – review and editing.
The contact author has declared that none of the authors has any competing interests.
Publisher's note: Copernicus Publications remains neutral with regard to jurisdictional claims made in the text, published maps, institutional affiliations, or any other geographical representation in this paper. The authors bear the ultimate responsibility for providing appropriate place names. Views expressed in the text are those of the authors and do not necessarily reflect the views of the publisher.
This research has been supported by the Deutsche Forschungsgemeinschaft (grant no. SCHO 739/25-1).
This open-access publication was funded by the Open Access Publication Fund of the University of Tübingen.
This paper was edited by Theresa Blume and reviewed by Saham Mirzaei and one anonymous referee.
Ait El Asri, S., Negabi, I., El Adib, S., and Raissouni, N.: Enhancing building extraction from remote sensing images through UNet and transfer learning, International Journal of Computers and Applications, 45, 413–419, https://doi.org/10.1080/1206212X.2023.2219117, 2023.
Cheng, D., Qin, Z., Jiang, Z., Zhang, S., Lao, Q., and Li, K.: SAM on Medical Images: A Comprehensive Study on Three Prompt Modes, arXiv [preprint], https://doi.org/10.48550/arXiv.2305.00035, 2023.
De Leeuw, J., Vrieling, A., Shee, A., Atzberger, C., Hadgu, K. M., Biradar, C. M., Keah, H., and Turvey, C.: The Potential and Uptake of Remote Sensing in Insurance: A Review, Remote Sensing, 6, 10888–10912, https://doi.org/10.3390/rs61110888, 2014.
Ezzatvar, Y. and López-Gil, J. F.: Urgent call for enhanced flood preparedness and response in Spain, The Lancet, 404, 2419–2420, https://doi.org/10.1016/S0140-6736(24)02506-6, 2024.
Gaus, Y. F. A., Bhowmik, N., Isaac-Medina, B. K. S., and Breckon, T. P.: Performance Evaluation of Segment Anything Model with Variational Prompting for Application to Non-Visible Spectrum Imagery, in: Proceedings of the IEEE/CVF Conference on Computer Vision and Pattern Recognition, 3142–3152, https://doi.org/10.1109/CVPRW63382.2024.00320, 2024.
Ghaznavi, A., Saberioon, M., Brom, J., and Itzerott, S.: Comparative performance analysis of simple U-Net, residual attention U-Net, and VGG16-U-Net for inventory inland water bodies, Applied Computing and Geosciences, 21, 100150, https://doi.org/10.1016/j.acags.2023.100150, 2024.
Hadlich, M., Marinov, Z., and Stiefelhagen, R.: AutoPET Challenge 2023: Sliding Window-based Optimization of U-Net, arXiv [preprint], https://doi.org/10.48550/arXiv.2309.12114, 2023.
Hashemi-Beni, L., Jones, J., Thompson, G., Johnson, C., and Gebrehiwot, A.: Challenges and Opportunities for UAV-Based Digital Elevation Model Generation for Flood-Risk Management: A Case of Princeville, North Carolina, Sensors, 18, 3843, https://doi.org/10.3390/s18113843, 2018.
He, K., Zhang, X., Ren, S., and Sun, J.: Deep residual learning for image recognition, in: Proceedings of the IEEE conference on computer vision and pattern recognition, 770–778, https://doi.org/10.1109/CVPR.2016.90, 2016.
Jackson, J., Yussif, S. B., Patamia, R. A., Sarpong, K., and Qin, Z.: Flood or Non-Flooded: A Comparative Study of State-of-the-Art Models for Flood Image Classification Using the FloodNet Dataset with Uncertainty Offset Analysis, Water, 15, 875, https://doi.org/10.3390/w15050875, 2023.
Kamilaris, A. and Prenafeta-Boldú, F. X.: Disaster Monitoring using Unmanned Aerial Vehicles and Deep Learning, arXiv [preprint], https://doi.org/10.48550/arXiv.1807.11805, 2018.
Karim, F., Sharma, K., and Barman, N. R.: Flood Area Segmentation, Kaggle [data set], https://www.kaggle.com/datasets/faizalkarim/flood-area-segmentation/data (last access: 4 February 2026), 2022.
Kelly, M., Schwarz, I., Ziegelaar, M., Watkins, A. B., and Kuleshov, Y.: Flood Risk Assessment and Mapping: A Case Study from Australia's Hawkesbury-Nepean Catchment, Hydrology, 10, 26, https://doi.org/10.3390/hydrology10020026, 2023.
Kirillov, A., Mintun, E., Ravi, N., Mao, H., Rolland, C., Gustafson, L., Xiao, T., Whitehead, S., Berg, A. C., Lo, W.-Y., Dollar, P., and Girshick, R.: Segment Anything, in: Proceedings of the IEEE/CVF International Conference on Computer Vision, 4015–4026, https://doi.org/10.48550/arXiv.2304.02643, 2023.
Klemas, V. V.: Coastal and Environmental Remote Sensing from Unmanned Aerial Vehicles: An Overview, Journal of Coastal Research, 31, 1260–1267, https://doi.org/10.2112/JCOASTRES-D-15-00005.1, 2015.
Krizhevsky, A., Sutskever, I., and Hinton, G. E.: ImageNet Classification with Deep Convolutional Neural Networks, Advances in Neural Information Processing Systems, https://doi.org/10.1145/3065386, 2012.
Kuenzer, C., Guo, H., Huth, J., Leinenkugel, P., Li, X., and Dech, S.: Flood Mapping and Flood Dynamics of the Mekong Delta: ENVISAT-ASAR-WSM Based Time Series Analyses, Remote Sensing, 5, 687–715, https://doi.org/10.3390/rs5020687, 2013.
Lehmiani, Y., Belattar, S., and Mahmoudi, A.: A Comparative Study of SAM's Performance Against Three U-Net Architectures on Retinal Vessels Segmentation Task, in: 2023 14th International Conference on Intelligent Systems: Theories and Applications (SITA), 1–7, https://doi.org/10.1109/SITA60746.2023.10373700, 2023.
Lehmkuhl, F., Schüttrumpf, H., Schwarzbauer, J., Brüll, C., Dietze, M., Letmathe, P., Völker, C., and Hollert, H.: Assessment of the 2021 summer flood in Central Europe, Environ. Sci. Eur., 34, 107, https://doi.org/10.1186/s12302-022-00685-1, 2022.
Lin, S.-S., Zhang, N., Xu, Y.-S., and Hino, T.: Lesson Learned from Catastrophic Floods in Western Japan in 2018: Sustainable Perspective Analysis, Water, 12, 2489, https://doi.org/10.3390/w12092489, 2020.
Liu, C., Li, H., Xu, J., Gao, W., Shen, X., and Miao, S.: Applying Convolutional Neural Network to Predict Soil Erosion: A Case Study of Coastal Areas, International Journal of Environmental Research and Public Health, 20, 2513, https://doi.org/10.3390/ijerph20032513, 2023.
Mallah, S., Delsouz Khaki, B., Davatgar, N., Scholten, T., Amirian-Chakan, A., Emadi, M., Kerry, R., Mosavi, A. H., and Taghizadeh-Mehrjardi, R.: Predicting Soil Textural Classes Using Random Forest Models: Learning from Imbalanced Dataset, Agronomy, 12, 2613, https://doi.org/10.3390/agronomy12112613, 2022.
Manos, E., Witharana, C., Udawalpola, M. R., Hasan, A., and Liljedahl, A. K.: Convolutional Neural Networks for Automated Built Infrastructure Detection in the Arctic Using Sub-Meter Spatial Resolution Satellite Imagery, Remote Sensing, 14, 2719, https://doi.org/10.3390/rs14112719, 2022.
Mazurowski, M. A., Dong, H., Gu, H., Yang, J., Konz, N., and Zhang, Y.: Segment anything model for medical image analysis: An experimental study, Medical Image Analysis, 89, 102918, https://doi.org/10.1016/j.media.2023.102918, 2023.
Moghimi, A., Welzel, M., Celik, T., and Schlurmann, T.: A comparative performance analysis of popular deep learning models and segment anything model (SAM) for river water segmentation in close-range remote sensing imagery, IEEE Access, 12, 52067–52085, https://doi.org/10.1109/ACCESS.2024.3385425, 2024.
Onojeghuo, A. O., Miao, Y., and Blackburn, G. A.: Deep ResU-Net Convolutional Neural Networks Segmentation for Smallholder Paddy Rice Mapping Using Sentinel 1 SAR and Sentinel 2 Optical Imagery, Remote Sensing, 15, 1517, https://doi.org/10.3390/rs15061517, 2023.
Pally, R. J. and Samadi, S.: Application of image processing and convolutional neural networks for flood image classification and semantic segmentation, Environmental Modelling & Software, 148, 105285, https://doi.org/10.1016/j.envsoft.2021.105285, 2022.
Pan, B., Hsu, K., AghaKouchak, A., and Sorooshian, S.: Improving Precipitation Estimation Using Convolutional Neural Network, Water Resources Research, 55, 2301–2321, https://doi.org/10.1029/2018WR024090, 2019.
Plate, E. J.: Flood risk and flood management, Journal of Hydrology, 267, 2–11, https://doi.org/10.1016/S0022-1694(02)00135-X, 2002.
Portalés-Julià, E., Mateo-García, G., Purcell, C., and Gómez-Chova, L.: Global flood extent segmentation in optical satellite images, Sci. Rep., 13, 20316, https://doi.org/10.1038/s41598-023-47595-7, 2023.
Qiao, X., Roy, S. K., and Huang, W.: 3-D Sharpened Cosine Similarity Operation for Hyperspectral Image Classification, IEEE Journal of Selected Topics in Applied Earth Observations and Remote Sensing, 17, 1114–1125, https://doi.org/10.1109/JSTARS.2023.3337112, 2024.
Ronneberger, O., Fischer, P., and Brox, T.: U-Net: Convolutional Networks for Biomedical Image Segmentation, in: Medical Image Computing and Computer-Assisted Intervention – MICCAI 2015, Cham, 234–241, https://doi.org/10.1007/978-3-319-24574-4_28, 2015.
Safavi, F. and Rahnemoonfar, M.: Comparative Study of Real-Time Semantic Segmentation Networks in Aerial Images During Flooding Events, IEEE Journal of Selected Topics in Applied Earth Observations and Remote Sensing, 16, 4–20, https://doi.org/10.1109/JSTARS.2022.3219724, 2023.
Safonova, A., Ghazaryan, G., Stiller, S., Main-Knorn, M., Nendel, C., and Ryo, M.: Ten deep learning techniques to address small data problems with remote sensing, International Journal of Applied Earth Observation and Geoinformation, 125, 103569, https://doi.org/10.1016/j.jag.2023.103569, 2023.
Shamsolmoali, P., Zareapoor, M., Wang, R., Zhou, H., and Yang, J.: A Novel Deep Structure U-Net for Sea-Land Segmentation in Remote Sensing Images, IEEE Journal of Selected Topics in Applied Earth Observations and Remote Sensing, 12, 3219–3232, https://doi.org/10.1109/JSTARS.2019.2925841, 2019.
Shokati, H.: hadi1994shokati/Flood-segmentation: Flood Segmentation (Version V01), Zenodo [code], https://doi.org/10.5281/zenodo.18485640, 2026.
Shokati, H., Mashal, M., Noroozi, A., Mirzaei, S., and Mohammadi-Doqozloo, Z.: Assessing soil moisture levels using visible UAV imagery and machine learning models, Remote Sensing Applications: Society and Environment, 32, 101076, https://doi.org/10.1016/j.rsase.2023.101076, 2023.
Shokati, H., Mashal, M., Noroozi, A., Abkar, A. A., Mirzaei, S., Mohammadi-Doqozloo, Z., Taghizadeh-Mehrjardi, R., Khosravani, P., Nabiollahi, K., and Scholten, T.: Random Forest-Based Soil Moisture Estimation Using Sentinel-2, Landsat-8/9, and UAV-Based Hyperspectral Data, Remote Sensing, 16, 1962, https://doi.org/10.3390/rs16111962, 2024.
Shokati, H., Engelhardt, A., Seufferheld, K., Taghizadeh-Mehrjardi, R., Fiener, P., Lensch, H. P. A., and Scholten, T.: Erosion-SAM: Semantic segmentation of soil erosion by water, Catena, 254, 108954, https://doi.org/10.1016/j.catena.2025.108954, 2025.
Shorten, C. and Khoshgoftaar, T. M.: A survey on Image Data Augmentation for Deep Learning, J. Big Data, 6, 60, https://doi.org/10.1186/s40537-019-0197-0, 2019.
Simantiris, G. and Panagiotakis, C.: Unsupervised Color-Based Flood Segmentation in UAV Imagery, Remote Sensing, 16, 2126, https://doi.org/10.3390/rs16122126, 2024.
Smith, M. W., Carrivick, J. L., Hooke, J., and Kirkby, M. J.: Reconstructing flash flood magnitudes using `Structure-from-Motion': A rapid assessment tool, Journal of Hydrology, 519, 1914–1927, https://doi.org/10.1016/j.jhydrol.2014.09.078, 2014.
Sugiura, R., Noguchi, N., and Ishii, K.: Remote-sensing Technology for Vegetation Monitoring using an Unmanned Helicopter, Biosystems Engineering, 90, 369–379, https://doi.org/10.1016/j.biosystemseng.2004.12.011, 2005.
Sun, J., Yan, S., Yao, X., Gao, B., and Yang, J.: A Segment Anything Model based weakly supervised learning method for crop mapping using Sentinel-2 time series images, International Journal of Applied Earth Observation and Geoinformation, 133, 104085, https://doi.org/10.1016/j.jag.2024.104085, 2024.
Taguchi, R., Tanoue, M., Yamazaki, D., and Hirabayashi, Y.: Global-Scale Assessment of Economic Losses Caused by Flood-Related Business Interruption, Water, 14, 967, https://doi.org/10.3390/w14060967, 2022.
Tanim, A. H., McRae, C. B., Tavakol-Davani, H., and Goharian, E.: Flood Detection in Urban Areas Using Satellite Imagery and Machine Learning, Water, 14, 1140, https://doi.org/10.3390/w14071140, 2022.
Tingsanchali, T.: Urban flood disaster management, Procedia Engineering, 32, 25–37, https://doi.org/10.1016/j.proeng.2012.01.1233, 2012.
Vinayahalingam, S., Berends, B., Baan, F., Moin, D. A., van Luijn, R., Bergé, S., and Xi, T.: Deep learning for automated segmentation of the temporomandibular joint, Journal of Dentistry, 132, 104475, https://doi.org/10.1016/j.jdent.2023.104475, 2023.
Wagner, F., Eltner, A., and Maas, H.-G.: River water segmentation in surveillance camera images: A comparative study of offline and online augmentation using 32 CNNs, International Journal of Applied Earth Observation and Geoinformation, 119, 103305, https://doi.org/10.1016/j.jag.2023.103305, 2023.
Wang, Q., Li, J., Jin, T., Chang, X., Zhu, Y., Li, Y., Sun, J., and Li, D.: Comparative Analysis of Landsat-8, Sentinel-2, and GF-1 Data for Retrieving Soil Moisture over Wheat Farmlands, Remote Sensing, 12, 2708, https://doi.org/10.3390/rs12172708, 2020.
Wieland, M., Martinis, S., Kiefl, R., and Gstaiger, V.: Semantic segmentation of water bodies in very high-resolution satellite and aerial images, Remote Sensing of Environment, 287, 113452, https://doi.org/10.1016/j.rse.2023.113452, 2023.
Xie, W., Willems, N., Patil, S., Li, Y., and Kumar, M.: SAM Fewshot Finetuning for Anatomical Segmentation in Medical Images, in: Proceedings of the IEEE/CVF Winter Conference on Applications of Computer Vision, 3253–3261, https://doi.org/10.1109/WACV57701.2024.00322, 2024.
Xu, Z., Wang, S., Stanislawski, L. V., Jiang, Z., Jaroenchai, N., Sainju, A. M., Shavers, E., Usery, E. L., Chen, L., Li, Z., and Su, B.: An attention U-Net model for detection of fine-scale hydrologic streamlines, Environmental Modelling & Software, 140, 104992, https://doi.org/10.1016/j.envsoft.2021.104992, 2021.
Yao, H., Qin, R., and Chen, X.: Unmanned Aerial Vehicle for Remote Sensing Applications—A Review, Remote Sensing, 11, 1443, https://doi.org/10.3390/rs11121443, 2019.
Ye, T., Qin, W., Zhao, Z., Gao, X., Deng, X., and Ouyang, Y.: Real-Time Object Detection Network in UAV-Vision Based on CNN and Transformer, IEEE Transactions on Instrumentation and Measurement, 72, 1–13, https://doi.org/10.1109/TIM.2023.3241825, 2023.
Zamboni, P. A. P., Blanch, X., Marcato Junior, J., Gonçalves, W. N., and Eltner, A.: Do we need to label large datasets for river water segmentation? Benchmark and stage estimation with minimum to non-labeled image time series, International Journal of Remote Sensing, 46, 2719–2747, https://doi.org/10.1080/01431161.2025.2457131, 2025.
Zhang, Y., Liu, P., Chen, L., Xu, M., Guo, X., and Zhao, L.: A new multi-source remote sensing image sample dataset with high resolution for flood area extraction: GF-FloodNet, International Journal of Digital Earth, 16, 2522–2554, https://doi.org/10.1080/17538947.2023.2230978, 2023.