
the Creative Commons Attribution 4.0 License.
the Creative Commons Attribution 4.0 License.
 | 18 Nov 2026
Assessing the contribution of extratropical cyclones to river floods that caused property damage in Quebec, Canada
Clarence Gagnon

Daniel F. Nadeau
Alejandro Di Luca
Benoit Brault
Romane Hamon
Nicolas L. Roy
Marc-André Bourgault
François Anctil
In the past few decades, the province of Quebec in eastern Canada has experienced widespread and costly flood events, yet the contribution of extratropical cyclones to these floods remains unquantified. This paper presents a methodology for analysing the contribution of extratropical cyclones (ETCs) to 498 fluvial floods that occurred in watersheds in southern Quebec, Canada, between 1991 and 2020, and highlights key characteristics shared by the 200 flood ETCs (storms that contributed to flooding) identified in the study. This analysis combined reconstituted river outputs, government financial aid claims following flooding, ETC tracks, and precipitation data to identify flood events and their relevant ETCs. ETC contribution was defined as the percentage of rainfall during a search window surrounding each flood event that was associated with the relevant ETCs. Most of these floods occurred in the spring (74.7 %). The majority (72.7 %) of flood events had a high (50 %–75 %) to very high (>75 %) ETC contribution, and only 2.6 % of events (mostly occurring in summer) had a negligible (<5 %) ETC contribution. Flood ETCs had larger percentages of tracks originating from the Central United States–Gulf of Mexico (+30.3 %) and lower percentages of tracks originating from Quebec–Maritimes (−16.7 %) and Western Canada–Pacific Ocean (−12.8 %) compared to non-flood ETCs (storms that did not contribute to flooding but spent at least one hour inside the Baseline Southern Quebec domain, N=6027). Flood ETCs also spent on average 18.2 h more in the domain and generally tracked over southern Quebec as opposed to over the Atlantic Ocean along the east coast of North America or over northern Quebec like non-flood ETCs. The percentages of financial aid claims allotted to flood ETCs were highly variable. Just five of the 200 flood ETCs were associated with 51.0 % of all financial aid claims filed during the 30-year period, indicating that a high to very high ETC contribution rarely resulted in widespread flooding. The method developed in this study could be applied to other regions or types of storms analysed (e.g. tropical cyclones and mesoscale convective systems) to further our understanding of the atmospheric causes of flooding in northeastern North America.
- Article
(8665 KB) - Full-text XML
-
Supplement
(18677 KB) - BibTeX
- EndNote


Globally, between 2003 and 2022, floods affected 74.6 million people, had an associated cost of 41.1 billion US dollars, and led to 5518 deaths, on average, per year (Centre for Research on the Epidemiology of Disasters et al., 2024). According to the Canadian Disaster Database, flooding was the most frequent natural disaster in Canada between 1900 and 2005 (Public Safety Canada, 2025b; Sandink et al., 2010). Canada's largest and second most populous province, Quebec, received 51 % of Canada's flood disaster assistance between 1988 and 2001 (Roy et al., 2003), despite accounting for only 23.8 % of the country's population in 2001 (Statistics Canada, 2025b). In the past 30 years, Quebec has experienced deadly, widespread and costly flood events. The Saguenay flood of July 1996 claimed ten lives (Tremblay and Guillaud, 2019), while the spring of 2017 and 2019 floods affected over 250 municipalities each time (Bourgault et al., 2022; Ministère de l'Environnement, de la Lutte contre les changements climatiques, de la Faune et des Parcs, 2025). More recently, in the summer of 2024, flooding caused by the remnants of Hurricane Debby resulted in the costliest natural disaster in the history of the province (Insurance Bureau of Canada, 2024).
Spring freshet (fluvial) flooding, which is caused by a combination of snowmelt and rainfall, is the most common type of flooding in Quebec (Javelle et al., 2003; Sandink et al., 2010), with the floods of spring 2011, 2017, and 2019 being prime examples (Benoit et al., 2022; Riboust and Brissette, 2016; Saad et al., 2014; Teufel et al., 2019). In the snow-free season, heavy or prolonged rainfall can also lead to fluvial flooding, as was seen during the Saguenay flood of 1996 (Tremblay and Guillaud, 2019). Flash flooding can also occur in the summer due to intense, short-lived rainfall. This is not surprising, given that Quebec experiences some of the highest short duration (less than 1 h) maximum rainfall intensities in Canada (Buttle et al., 2016). Other mechanisms that can cause flooding in the province include rain on snow, ice jams, and storm surges (Buttle et al., 2016; Danard et al., 2003). Ultimately, fluvial flooding is most often caused by excessive precipitation (Bourgault et al., 2022), which is set to increase by 10 %–40 % in Quebec by the end of the century (Martel et al., 2021) in combination with snowmelt. Since extratropical cyclones (ETCs) are responsible for most of the precipitation in the middle latitudes, they are at the forefront of flood-triggering mechanisms in regions dominated by fluvial floods (Hawcroft et al., 2012).
Over Quebec, the precipitation associated with ETCs accounts for up to 85 % of the total winter (DJF) precipitation and at least 70 % of the total summer (JJA) precipitation (Hawcroft et al., 2012). Additionally, the proportion of extreme hourly precipitation events associated with ETCs ranges from 50 %–95 % throughout the year, being closer to 80 %–95 % in DJF and reaching the lowest values in JJA (Chen and Di Luca, 2025; Pfahl and Wernli, 2012). For instance, in the summer of 1996, an ETC traveled from southern Manitoba, traveled over the Great Lakes, and then moved over the Saguenay region, where it brought more than 250 mm of rainfall to some areas in less than 48 h. The cyclone remained stationary for 24 h due to blocking by two anticyclones located to the east, which prolonged precipitation over the Saguenay region (Milbrandt and Yau, 2001; Tremblay and Guillaud, 2019). In spring of 2017, two consecutive ETCs were associated with the flooding of the Ottawa River basin. The first one originated from the central US, while the other traveled up the east coast of North America before reaching Quebec (Teufel et al., 2019). Similarly, the fall 1996 flood, which resulted in the evacuation of 1000 residents in the Montreal and Mauricie regions (Public Safety Canada, 2025a), was linked to an ETC moving up the east coast of North America and becoming blocked by a strong anticyclone (Perrier and Slivitzky, 1999). Thus, a thorough analysis of the causes of flooding in Quebec must include the quantification of the contribution of ETCs, given that they are associated with most of the precipitation, including extreme precipitation events.
The province of Quebec is surrounded by major bodies of water such as the Hudson Bay, the Great Lakes, and the eastern seaboard, which can increase heat fluxes and intensify cyclones (Chen et al., 2022a; Klock et al., 2002). Thus, storms that cause flooding can develop in many regions, typically to the south or west of the province, before moving east or northeast. Mackenzie lows, which form over the Mackenzie River Basin, and Alberta lows, also known as Alberta clippers, originate over the Northern Rockies (Klock et al., 2002). Colorado lows form to the southwest of Quebec, in the Midwestern United States. As they both originate to the west of Quebec, the tracks of the Colorado and Alberta lows sometimes converge over the Great Lakes region (Chen et al., 2022a). Great Lakes lows and Hudson Bay lows form over large bodies of water to the southwest and northwest of Quebec, respectively. Hatteras lows form to the south of Quebec, near Cape Hatteras, over the United States eastern seaboard (Klock et al., 2002; Poan et al., 2018) and can cause hurricane-level damage to the east coast of North America during the cold season (October–April) (Hirsch et al., 2001). Finally, Gulf lows form over the Gulf of Mexico, to the south of Quebec (Klock et al., 2002).
Although some studies have linked the presence of cyclones to specific floods in Quebec (Lin et al., 2019; Milbrandt and Yau, 2001; Rickard et al., 2025; Teufel et al., 2019), these have only considered a few, high-impact, well-known cases. Similarly, case studies examining the role of ETCs or storms in the eastern United States (near our study region) have also focused on a small number of larger floods (Barros and Kuligowski, 1998; Miller, 1990; Smith et al., 2010; Su et al., 2023). River discharge (flood peak) and rainfall data obtained from rain gauges or radar estimates are often used to characterize floods. Therefore, historically, floods occurring in ungauged watersheds could not be analyzed and had to be excluded from case studies, even when they had caused significant damage. Furthermore, using rain gauge data to characterize floods has its limitations as it does not indicate where the consequences of flooding (primarily material loss) were felt in the watershed. Data on material losses following flooding is rarely made available, as it contains sensitive information on claimants, which is why there have been limited large-scale studies on the contribution of ETCs to flooding.
This paper aims to quantify the contribution of ETCs to fluvial flooding and its seasonality in southern Quebec between 1991 and 2020. More specifically, we investigate whether ETCs that trigger flood events have any common characteristics (e.g. cyclogenesis location, trajectories and lifetime). Our aims can be achieved through a series of steps. First, we objectively and systematically identify flood events during the period of interest by combining data on governmental financial assistance with reconstituted river outputs. Government financial assistance data provide evidence of where and when floods caused damage, while reconstituted river output data allow us to cover ungauged watersheds. Next, we attribute rainfall to storms in proximity to the flooded watersheds during flood events, which enables us to classify storms as either contributing to flooding or not. Finally, clustering is performed on the genesis location of the studied storms to enable comparison, allowing us to investigate the characteristics of storms contributing to flooding.
As financial aid data depend on the presence of human populations, it should be noted that the study only focuses on river floods that caused property damage. Furthermore, this analysis does not consider the impact of soil moisture and snowmelt runoff on the onset of flooding, even though these factors are known to influence it. We are also not concerned with the contribution of ETCs to snow accumulation on the ground, which can contribute to flooding when it melts. The focus is on the direct effect of ETC-related rainfall on flooding.
The article is structured as follows. First, Sect. 2 details the various types of data included in this project. Section 3 describes the methodology used to identify flood events, as well as to find and classify relevant ETCs. Then, Sect. 4 presents findings on the distribution of flood events, the contribution of ETCs to flooding, the classification and differences of ETCs as well as the sensitivity analysis of key variables. Finally, Sect. 5 discusses the seasonality of floods and ETC contribution and contextualises the results on flood ETCs within the existing literature.
Figure 1 provides an overview of the article's methodological approach, indicating the baseline datasets (in green), the methods applied (in white, which are described in Sect. 3) and the resulting data of interest (in blue).

Figure 1Overview of the methodological steps (described in Sect. 3) and sources of data (described in Sect. 2) used in the study.
2.1 Reconstituted river outputs: Hydroclimatic Atlas of Southern Quebec
The Hydroclimatic Atlas of Southern Quebec contains time series of river discharge for over 10 000 mostly ungauged river sections across meridional Quebec. It is the study's primary source of hydrological data (Centre d'Expertise Hydrique du Québec, 2025; Lachance-Cloutier et al., 2017). These time series of retrospective daily streamflow estimates are available from 1970 to 2024 and do not include regulated river sections (Government of Quebec and Ouranos, 2022). They focus on a region of southern Quebec spanning approximately 640 000 km2 and located between 45–53° N and 57–80° W (see Fig. 1 in Lachance-Cloutier et al., 2017). For ungauged river sections, discharge time series were reconstructed using statistical interpolation based on observations from 75 gauged sites and outputs from a hydrological model used as the background field. The model field was adjusted to correct spatial discrepancies between observations and initial model estimates. The hydrological model used for this purpose is Hydrotel: a spatially distributed, mostly physically-based model. Hydrotel divides watersheds into relatively homogeneous hydrological units (RHHUs) and river reaches. Rainfall-runoff processes are simulated using RHHUs, and streamflows are simulated using the sub-sections of river reaches (Lucas-Picher et al., 2020). Hydrotel was developed to enable remote-sensed and GIS data (e.g. digital elevation models, soil type and land use maps) to be used as input. Physical or empirical relations are used in the model to simulate the hydrological processes occurring in watersheds, such as snowmelt, surface runoff, river routing and evapotranspiration (Fortin et al., 2001).
The 2-year recurrence flood values for the river sections included in the study were calculated using the average annual maximum discharge values available from the Hydroclimatic Atlas of Southern Quebec between 1991 and 2020. These values were then inputted in the Quebec Fluvial Flood Events (EVE) database to provide additional context surrounding the flood events.
2.2 Flood events: Quebec Fluvial Flood Events (EVE) Database
Flood events in southern Quebec were identified based on 17 587 financial aid claims available in the EVE database of the Quebec Ministry of Public Security (Roy et al., 2024). This database contains claims filed by individuals or businesses in Quebec following flood events between 1991 and 2020. Where a claim was filed, the government provided financial aid to either repair damaged buildings and homes or help people relocate and settle elsewhere. As the database relies on the presence of flood-damaged communities, it only contains data pertaining to populated areas. Consequently, in Quebec, the available data are concentrated in the southern part of the province, along the Saint Lawrence and Ottawa rivers, as well as Lac Saint-Jean, where most of the population lives. This area is located between latitudes 44.99 and 50.47° N, and longitudes 59.61 and 79.42° W. The rest of Quebec is sparsely populated (Statistics Canada, 2025a).
The database contains the location of the damaged building for each claim, as well as important information relating to the nearest river section associated with the flood event. It also lists the dates on which the rising and falling limbs of the hydrographs cross the 2-year recurrence flood value (calculated using data from the Hydroclimatic Atlas of southern Quebec) for each river section. These dates serve as a reference point for the timing and duration of flooding in relation to each claim.
2.3 Watersheds: HydroBASINS vectorized polygons
The watershed delineations used to define the research domain were extracted from HydroBASINS, a secondary data product from the hydroSHEDS project (Lehner and Grill, 2025). This dataset contains sub-basin boundaries at various scales covering the entire globe and is available in polygon format (Lehner et al., 2008; Lehner and Grill, 2013). HydroBASINS features 12 nested, hierarchical sub-basins levels, ranging from largest (level 1) to the smallest (level 12). The average size of level 12 sub-basins globally is 130.6 km2 (Lehner and Grill, 2025). The level 7 polygons were used in this study.
2.4 Precipitation: ERA5 reanalysis
Precipitation data were taken from the European Centre for Medium-Range Weather Forecasts (ECMWF) reanalysis version 5 (ERA5) (Hersbach et al., 2020, 2025). This dataset combines a weather model with billions of observations around the globe from in-situ, upper air, and satellite data to reproduce actual and past meteorological conditions. This study uses hourly total precipitation and snowfall data with a spatial resolution of 0.25° × 0.25°, covering the period from 1991 to 2020.
2.5 Storms: North America Extratropical Cyclone (NAEC) Catalogue
The extratropical cyclones (storms) used in this study were extracted from the NAEC Catalogue between 1991 and 2020 (Chen et al., 2022b). This catalogue contains hourly tracks of extratropical cyclones over North America (20–80° N, 0–180° W) as well as various variables of interest, such as total precipitation, wind speed, and mean sea level pressure (MSLP), averaged over different radii around cyclone centers. Extratropical cyclones are tracked by monitoring the position of their centers over time. The algorithm used for storm detection is applied to the ERA5 dataset (Hersbach et al., 2025) that has a horizontal grid spacing of 0.25° × 0.25°. Storms in the catalogue are identified through a MSLP local minimum, and must have a maximum vorticity (a measure of the spin of air particles, indicative of a region of convergence when positive) greater than 10−5 s−1 within a 200 km radius of the local minimum (Chen et al., 2022a, b). The ERA5 dataset was chosen as the source of precipitation data (as described in Sect. 2.4) due to its consistency with the NAEC Catalogue.
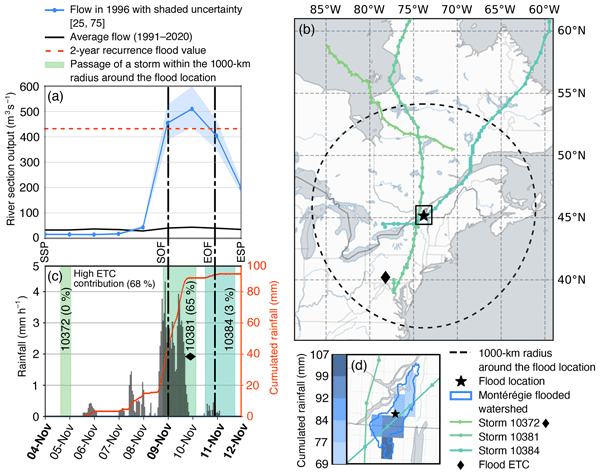
Figure 2 shows how the methodology described in this section (and illustrated in Fig. 1) was applied in practice, using a sample representative local flood event (contained to one watershed) that occurred in November 1996 and resulted in 268 claims being filed.

Figure 2Application of the methodology to the flood event of November 1996 in the Montérégie region. (a) River section discharge (blue) compared with the 2-year recurrence flood value (dashed red) for the flood event. (b) Storm tracks of ETCs entering the search domain (dashed black) between the SSP (start of the search period) and ESP (end of the search period) dates for the flood event and location of the flood (star). Tracks are shown for their entire lifetime (even components before and after they leave the domain). (c) Rainfall in the affected watershed for the local flood event with the contribution of the different ETCs and overall ETC contribution. The SSP, SOF (start of flood), EOF (end of flood), and ESP dates are shown in (a) and (c) and highlighted in bold in (c). The SOF and EOF dates are shown by the dash-dot lines in (a) and (c). The identified flood ETC is highlighted with a diamond (storm #10381) in (b) and (c). (d) Close up view of the Montérégie watershed affected by flooding, flood location (centroid of the watershed), and cumulated rainfall during the search period.
3.1 Identification of flood events
Flood events were identified by grouping financial aid claims from the EVE database according to two variables: location of the damaged buildings (sensitive data) and the Start of Flood (SOF) date. For each financial aid claim entry, the SOF was defined as the date on which the discharge of the river section associated with the claim exceeded the 2-year recurrence flood value for the first time. This is a crude estimate of the true SOF, considering that each construction is subject to flooding at its respective return period, which is usually greater than two years. The river section associated with the claim was the one closest to the damaged buildings. The End of Flood (EOF) corresponded to the date of the last day on which the river section's discharge was above the 2-year recurrence flood value – also a crude estimate. The SOF was always set at the beginning of the day, and the EOF at the end of the day, as this still placed the two time markers 23 h apart if they occurred on the same day (as daily river output values are used). This crucial initial step of grouping financial aid claims in time and space makes it possible to quantify the contribution of ETCs to flooding later on.
3.1.1 Assignment of financial aid claims to their respective watersheds
Financial aid claims were assigned to watersheds based on the level-7 hydroBASINS polygons (Lehner and Grill, 2025). The level 7 polygons watersheds were selected for this purpose because they provided relatively small watersheds (average size of 2920 km2 for those included in the study), yet were large enough to be accurately described using the ERA5 reanalysis precipitation data. Of all North American hydroBASINS polygons, only the 98 watersheds containing at least one Quebec financial aid claim were retained.
3.1.2 Grouping of financial aid claims into local and regional flood events
After grouping the financial aid claims by their watershed, they were organised by their SOF dates. If two (or more) claims had SOF dates that fell within seven days of each other within the same watershed, they were grouped together as one local flood. Not all claims aggregated into one local flood event had the same SOF and EOF dates, as the claims sometimes were associated with more than one river section (with its unique SOF and EOF dates). Thus, the local flood's SOF and EOF dates were defined as the earliest and latest dates, respectively, amongst their aggregated claims. This process is pictured for a fictitious flood in Fig. 3, where seven financial aid claims, close to two flooded river sections are grouped into one local flood on the affected watershed.

Figure 3Visual representation of grouping financial aid claims into a local fictitious flood and selecting the correct SOF and EOF dates among the flooded areas' associated river sections' dates.
Finally, to conduct the analysis, flood locations were defined as watershed centers, rather than the actual locations of the damaged buildings or the sections of the river involved (as shown in Fig. 3), to maintain the confidentiality of the data used. This formed the basis of the search domain for ETCs related to the local flood. Local floods occurring simultaneously in different watersheds were grouped together as a regional flood if they had a difference of up to seven days in their SOF dates.
3.2 Attribution of relevant extratropical cyclones to local flood events
This section outlines the methods used to determine the time interval and physical domain of analysis for each local flood event. It also explains how we estimated the precipitation associated with the local floods, and consequently the different ETCs. These steps ensure that we correctly attribute the most appropriate ETC to each local flood event, accurately representing its contribution to flooding.
3.2.1 Definition of the relevant search period for studying local flood events
To quantify the contribution of ETCs to flooding, we first needed to define the time period during which we analysed the flood. This so-called search period is bound by the Start of the Search Period (SSP) and End of the Search Period (ESP). For the summer (JJA), autumn (SON), and winter (DJF) seasons, the SSP date for the data search was set to five days before the SOF date. For spring (MAM), the SSP date for the data search was set to 15 d before the SOF date (Bourgault et al., 2022). These different SSP dates were chosen based on known seasonal flooding patterns in the region and a careful inspection of the hydrographs of flooded river sections by season. Please note that we performed a sensitivity test on the SSP–SOF period by setting it to ten days for both spring and fall flood events (making the period shorter in spring, and longer in fall) described in Sect. 3.4. For all seasons, the ESP date for the data search was set to one day after the EOF date. A sensitivity test was also performed on a 2 d ESP–EOF period, described in Sect. 3.4. These time markers can be visualized in Fig. 2a and c where the search period lasted eight days, from 4 November (SSP) to 12 November (ESP) and the flood occurred between 9 November (SOF) and 11 November (EOF).
3.2.2 Definition of precipitation associated with local flood events
Once the search period for studying floods had been defined, ERA5 precipitation data were gathered for the affected watershed of each local flood event. At each time step (hourly), the total precipitation and snowfall on the grid points within the watershed were averaged. This was done throughout the search period (between the SSP and ESP dates). The total cumulative values for snowfall, total precipitation, and rainfall were recorded for each analysed event. Rainfall was calculated by subtracting snowfall from total precipitation.
3.2.3 Estimation of precipitation associated with extratropical cyclones
Flood-related precipitation was attributed to ETCs by identifying ETC centers that were within 1000 km from the center of the affected watershed. For each event, ETCs from the NAEC catalogue that entered the search radius during the search period were considered relevant, and all watershed precipitation was assigned to them for as long as they remained within the domain. If there was more than one ETC within the search radius at any moment, the watershed precipitation was associated with the ETC closest to the centre of the studied watershed.
The choice of the search radius was made following several publications on ETCs over North America (Chen et al., 2024; Chen and Di Luca, 2025; Chen et al., 2022a; Hawcroft et al., 2012) and it was decided to keep it constant independently of the seasons, to simplify the method. The choice of a 1000 km radius is discussed further and compared to smaller ones (600 and 800 km) in Sect. 3.4.
The following variables were recorded for each storm occurring during a flood event: time interval in the search radius, quantity and percentage of total precipitation, snowfall, and rainfall over the search period inside the flooded watershed. For each analysed flood event, the ETC contribution was defined as the sum of percentages of the total rainfall associated with all relevant ETCs recorded within the search radius during the search period. The ETC contribution was then categorised according to five levels: negligible (0 %–5 %), low (5 %–25 %), moderate (25 %–50 %), high (50 %–75 %), and very high (75 %–100 %). For the sample flood event shown in Fig. 2, the three ETCs present in the search domain accounted for 68.1 % of the total rainfall for the event, indicating a high ETC contribution.
We hypothesize that the precipitation not associated with ETCs (such as 31.9 % of the rainfall that occurred during the November 1996 flood) could be attributed to different phenomena, such as convective systems, ETCs with a radius of influence greater than 1000 km, or weak systems not reaching the necessary MSLP and vorticity thresholds to be featured in the NAEC Catalogue.
3.3 Classification of extratropical cyclones
This section outlines the process of classifying ETCs. This involves distinguishing between storms that contribute to flooding (flood ETCs) and those that do not (non-flood ETCs), and grouping them according to where they originated. This classification is needed to enable the comparison between the two groups of storms and identify unique characteristics of flood ETCs.
3.3.1 Identification of Baseline Southern Quebec extratropical cyclones and domain
To determine whether the storms identified as flood ETCs exhibited unique characteristics or resembled typical storms in the area, a general climatology of ETCs was conducted for the study area. To achieve this, a broader search domain with a radius of 1000 km was established around the edges of all the watersheds involved in the study. This domain is referred to as the Baseline Southern Quebec domain. Any ETC that entered the Baseline Southern Quebec domain for at least one hour between January 1991 and December 2020 was thus tagged as a Baseline Southern Quebec ETC. Figure 4 shows this domain along with all watersheds included in the study (i.e., where financial aid claims were filed).

Figure 4Watersheds included in the study (filled blue), and the Baseline Southern Quebec domain (dashed blue). Distance between the edges of the ensemble of watersheds and the Baseline Southern Quebec domain is 1000 km.
3.3.2 Clustering of Baseline Southern Quebec extratropical cyclones on cyclogenesis location
The Baseline Southern Quebec ETCs were clustered according to their genesis locations (i.e. their first recorded position in the NAEC Catalogue) using k-means clustering. This method limits the distance between the cluster centers and data points, creating tightly packed clusters. The optimal number of clusters was determined by examining the silhouette score and elbow method plot, and by taking into account the typical regions of cyclogenesis in North America.
3.3.3 Identification of flood extratropical cyclones
The percentage of rainfall associated with individual storms during local flood events was used to distinguish the flood ETCs from the Baseline Southern Quebec ETCs. Hence, Baseline Southern Quebec ETCs were classified as flood ETCs if they accounted for more than 20 % (10 % in MAM) of the total rainfall for any local flood event. Otherwise, they were labelled as non-flood ETCs. The choice of the exact threshold (10 % vs 20 %) was based on observations of the maximal percentage of associated rainfall per storm by season. The longer search periods in MAM reduced the percentage of rainfall associated with individual storms, as the total rainfall accumulated over a longer period was usually greater. This motivated the need for a different threshold in spring. These thresholds are compared to higher ones (+5 %) for spring and fall cases in Sect. 3.4. An example of this distinction between storms is also shown in Fig. 2b–c where only one of the three ETCs present in the search domain qualified as a flood ETC (storm 10381, highlighted by a diamond).
To illustrate the magnitude of the consequences associated with the flood ETCs, their impact was assessed based on the number of related financial aid claims. For each local flood event, claims were assigned to the flood ETC that contributed the most to the cumulative rainfall of the event, meaning that for local floods with more than one flood ETC, only one got attributed the claims. This also meant that a specific storm could be allocated claims relating to more than one local flood event, since local flood events often occurred concurrently in different watersheds. It should also be noted that not all financial aid claims could be associated with a flood ETC, as some flood events did not feature one.
3.4 Sensitivity analysis of key variables for the identification of flood ETCs and ETC contribution
A sensitivity analysis was carried out on spring and fall flood events to assess the impact of varying some key variables on identified flood ETCs and overall ETC contribution. For each of the two seasons, five different scenarios were studied, each with one key parameter varying from the default value, defined herein as the control case. The spring and fall seasons were chosen for this analysis due to their higher number of flood events (N=372 and N=58, respectively), allowing better comparison between the scenarios.
The first scenario involved setting the number of days between the SSP and SOF dates to 10 d, referred to as the days case. For spring, the “days” scenario reduces the duration of the studied interval, as the SSP–SOF period is normally set to 15 d. The opposite is true for fall: the SSP–SOF period is normally set to five days, so the “days” scenario extends the duration of the studied interval. The second scenario involved decreasing the search radius to 600 km around the watershed centers, referred to as the radius1 case. Similarly, the third scenario involved decreasing the search radius to 800 km, referred to as the radius2 case. The fourth scenario involved increasing the threshold of cumulated rainfall during the search period necessary for storms to be considered flood ETCs by 5 %: going from 10 % to 15 % during spring floods and from 20 % to 25 % during fall flood events. This fourth scenario is referred to as the threshold case. Finally, the fifth scenario involved extending the EOF–ESP period by 24 h, referred to as the days end case. The set of variables as well as the results associated with the five scenarios studied and those of the control case are shown in Table S1 in the Supplement.
4.1 Annual and seasonal distribution of flood events
Table 1 shows the seasonal distribution of the 498 local floods identified at the watershed level in southern Quebec between January 1991 and December 2020, and shows the disparity in the number of flood events by season. The majority of these floods (74.7 %) occurred during the spring freshet season (372 events). The remaining flood events were distributed as follows: 48 (9.6 %) in summer, 58 (11.6 %) in fall, and 20 (4.0 %) in winter. The average number of financial aid claims per local flood event were similar for spring, fall, and winter (between 26.1–32.3 claims per flood), but was higher for summer (71.7 claims per flood). This larger number in summer was due to a single summer flood event cumulating 1668 claims (Saguenay flood of 1996), skewing the mean towards higher values. Otherwise, the median number of claims per local flood event were similar between the seasons (4–7 claims), with winter having the highest value. On average, 16.6 local flood events occurred each year (12.4 in spring, 1.9 in fall, 1.6 in summer, and 0.7 in winter). The most active year was 2017, when 75 local flood events occurred throughout the study area.
Table 1Statistics on the seasonal distribution of flood events, their ETC contribution in percentage and qualitative level (in parenthesis), and number of financial aid claims associated.

Seasonal variability of impacts and extent of regional flood events is presented in Fig. 5, where the annual and monthly distribution of the 85 regional flood identified between January 1991 and December 2020 is shown. The figure indicates the number of financial aid claims (colour) and the number of watersheds (circle size) associated with each regional flood event, with both variables increasing non-linearily. More widespread regional events were typically associated with more claims, although not always. Regional events affecting over 35 watersheds and cumulating more than 1000 financial aid claims all occurred in the spring season and were rare. Spring regional flood events were more widespread, involving 7.6 watersheds per event on average. The number of watersheds involved by regional flood event were similar in fall and summer, with 4.5 and 3.4 watersheds on average, respectively. Winter regional flood events were more contained, involving an average of 2.2 watersheds per event. The most widespread event involved 71 watersheds in spring 2017, spread over two months.

Figure 5Yearly and monthly distribution of regional flood events (N=85) between January 1991 and December 2020. The size of the circle indicates the number of watersheds (or local floods) involved in the event while the colour denotes the number of financial aid claims associated to the regional flood events.
4.2 Contribution of extratropical cyclones to flooding
Figure 6 shows the level of ETC contribution to flooding by season for all local flood events. The figure allows to visualize the range of ETC contribution by season, compare between seasons, and highlight modes as well as least frequent season–ETC contribution combinations. Considering all seasons combined, 40.2 % of flood events had a very high ETC contribution. Then, the proportion of events decreased with ETC contribution: 32.5 % of events had a high contribution, 18.5 % had a moderate one, 6.2 % had a low one, and only 2.6 % of events had a negligible ETC contribution. Summer recorded the highest proportion of local flood events with a negligible ETC contribution (14.6 % of all summer floods). For all seasons, the mode of ETC contribution is very high. Table 1 also shows that, overall, the mean ETC contribution for all seasons was in the high (50 %–75 %) range. However, summer was the only season with a median ETC contribution in the very high range (83.5 %), making this season the one with the highest percentages of both very high and negligible ETC contribution.

Figure 6Level of ETC contribution to local floods, shown as percentages of the total number of local flood events by season (in shades of blue) and absolute number of events in each category (numbers in the cells).
4.3 Comparison of flood and non-flood ETCs
4.3.1 Seasonality, origin, and lifetime of flood ETCs
Figure 7a shows the number of storms in each season and indicates whether or not they contributed to a flood event. The figure also shows typical seasonal differences in number of storms per season, highest in DJF and lowest in JJA. Of the 6277 Baseline Southern Quebec storms, 602 occurred during a flood event. Only 200 of these contributed significant rainfall, qualifying as flood ETCs (i.e. contributing at least 10 % of cumulative rainfall during the search period for a flood event in MAM, and at least 20 % in the other seasons). The majority of these flood ETCs were identified in spring, a period prone to flooding due to snowmelt runoff – it should be recalled that this process is not taken into account in our analysis.
Of the 17 587 financial aid claims included in the study, 15 491 (88.1 %) could be associated with at least one flood ETC (meaning that 2096 claims (11.9 %), distributed across 30 (6.0 %) flood events could not). Most of these flood events without a flood ETC occurred in spring (17 events, cumulating 1973 claims), some occurred in summer (eight events, 105 claims), and very few occurred in winter (two events, 10 claims) and fall (three events, eight claims).
Differences in lifetime of storms inside the Baseline Southern Quebec search domain were studied for flood vs non-flood ETCs. Figure 7b shows the lifetime distribution per type, along with their respective medians (white line). The lifetime distributions per type were found to be statistically significantly different from one another (shown with an asterisk), with flood ETCs spending an average of 18.2 h longer in the Baseline Southern Quebec search domain than their non-flood counterparts. This was determined using a Kolmogorov-Smirnov (K-S) test with an α value of 0.05.

Figure 7(a) ETCs included in the study with their season and type (flood ETC and non-flood ETC). (b) Lifetime of all ETCs in the Baseline Southern Quebec search domain, shown for flood and non-flood ETCs. The medians are shown by the white lines. The asterisk (*) denotes a statistically significant difference in the distribution according to the K-S test.
Beside their lifetime in the Baseline Southern Quebec domain, cyclogenesis locations were also compared between the two groups of storms (flood and non-flood ETCs), to highlight any differences. Figure 8 shows the density of cyclogenesis locations for both flood (Fig. 8a) and non-flood (Fig. 8c) ETCs. The darkest areas represent the regions with the highest density, which differed between the two groups of storms. For flood ETCs, the regions with the highest density of cyclogenesis locations were the central United States (over eastern Colorado) and, to a lesser extent, the east coast of the United States (over northern Virginia). For non-flood ETCs, these regions were found in western Canada (over Alberta), as well as off the east coast of the United States and over the Atlantic Ocean. There are clear differences in the density of cyclogenesis locations between the two groups, with maximum densities only reaching up to 6 % for the non-flood ETCs group.

Figure 8(a) Cyclogenesis locations density map for flood ETCs. (b) Track density map for flood ETCs. (c) Cyclogenesis locations density map for non-flood ETCs. (d) Track density map for non-flood ETCs. The Baseline Southern Quebec search domain is shown in dashed black, colors indicate the density (as a percentage of total storms for the sub-plot tracking/generating within 350 km of grid points) from highest (dark) to lowest (light).
Figure 8 also shows the track density for flood (Fig. 8b) and non-flood (Fig. 8d) ETCs. As genesis locations varied between the two groups of storms (Fig. 8a, c), it was also necessary to compare the tracks of flood vs non-flood ETCs, since genesis locations often dictate trajectories of storms. The flood ETCs tracks, which originated mostly in the central and eastern United States, had streamlined trajectories that went roughly northeast, passing through the Great Lakes region and fanning out as they entered Quebec from the SW. Many, though not all, flood ETCs tracked over southern Quebec (>49 % of the tracks). For non-flood ETCs, the area of greatest tracks density (up to 25 % of all tracks) ran along the eastern seaboard of North America (from the United States coast of Massachusetts to the Canadian coast of Newfoundland and Labrador) over the Atlantic Ocean. A secondary, smaller area of high track density for non-flood ETCs ran above the Great Lakes, near the border between Ontario and Quebec. Areas of high track density for non-flood ETCs can also be visualized in Fig. S3 in the Supplement, where the colorbar is unique to each plot, allowing for better visualisation of the tracks and genesis location densities for non-flood ETCs.
Another noticeable difference between the tracks of the two groups is the area of highest track density compared to the Baseline Southern Quebec domain. For non-flood ETCs, the highest track density was located to the southeastern edge of the domain, wherehas for flood ETCs, it was located in its center, over southern Quebec. Thus, flood ETCs generally tracked closer to the study area.
4.3.2 Clustering of cyclogenesis location among flood ETCs
Figure 9a shows the cyclogenesis locations and the clusters (colored dots) of all identified Baseline Southern Quebec storms (storms that crossed the Baseline Southern Quebec search domain during the 1991–2020 period) along with the search domain (dashed black). Dots circled in black show flood ETCs, allowing easy comparison of their spatial distribution with that of non-flood ETCs. Clustering the genesis locations of the storms yielded five different regions of origin: Western Canada–Pacific Ocean, Ontario–Hudson Bay, Quebec–Maritimes, Central United States–Gulf of Mexico, and United States East Coast–Caribbean. The number of storms in each cluster ranged from 984 (Ontario–Hudson Bay) to 1425 (United States East Coast–Caribbean).
Figure 9b shows the distribution of genesis locations for the two groups of storms as percentages, highlighting the differences in region of origin between non-flood and flood ETCs. The non-flood ETCs that were identified were mostly uniform in terms of their genesis location distribution, with percentages ranging from 15.9 % (Ontario–Hudson Bay) to 22.8 % (United States East Coast–Caribbean) per cluster. In contrast, the distribution of genesis locations for flood ETCs was largely non-uniform. The increased proportion of flood ETCs originated from the Central United States–Gulf of Mexico cluster (50.5 %), whereas the decreased proportions came from the Western Canada–Pacific Ocean (7.0 %), and Quebec–Maritimes (4.5 %) clusters. These differences in the distribution of genesis points compared with non-flood ETCs were statistically significant for these clusters (as determined by a chi-squared test with α=0.05 and standardized residuals above/below 2). Although these differences were not statistically significant, flood ETCs showed a higher proportion of storms originating from the United States East Coast–Caribbean (+3.7 %) and a lower proportion originating from the Ontario–Hudson Bay (−4.4 %) clusters than the non-flood ETCs.
While the differences between the two groups of storms were significant when all seasons were considered together, the results were somewhat different when the seasons were analysed independently. Figure S4 in the Supplement shows the distribution of storm genesis points per season. Differences between non-flood ETCs and flood ETCs for spring were significant, and the results reflected those for all seasons combined, with an even higher proportion of flood ETCs originating from the Central United States–Gulf of Mexico (57.5 %). Differences between the two groups in summer and fall were also significant, but with increased proportions of storms originating from the United States East Coast–Caribbean (40.0 % of summer flood ETCs and 76.9 % of fall flood ETCs). Finally, the differences were not significant in winter, which exhibited a more uniform distribution of origin among flood ETCs, ranging from 8.3 % (Quebec–Maritimes) to 33.3 % (Central United States–Gulf of Mexico). It is important to note that the sample sizes of storms in the summer, fall, and winter seasons were small (as shown in Fig. 7a), making the statistical significance of the results more difficult to interpret.
The typical lifetime of a storm in the Baseline Southern Quebec search domain also depended on its region of origin (cluster). Similar to how Fig. 7, which compared differences in lifetime in the domain for flood ETCs vs non-flood ETCs, Fig. 9c shows the distribution of lifetimes per cluster along with their respective medians (white line). Using a K-S test with an adjusted α value of 0.005, it was determined that some clusters had unique lifetime distributions. Both Quebec–Maritimes and Western Canada–Pacific Ocean clusters had distinctive distributions that differed from those of the other clusters. These two clusters had lower lifetime medians: 17 h for Quebec–Maritimes storms, and 28 h for Western Canada–Pacific Ocean storms. Concurrently, storms from these two clusters were also in lower proportions among flood ETCs. However, the test determined that the last three clusters in Fig. 9c (Ontario–Hudson Bay, Central United States–Gulf of Mexico, United States East Coast–Caribbean) came from the same distribution, with medians of 38, 39, and 39 h.

Figure 9(a) Clusters on cyclogenesis of the 6227 Baseline Southern Quebec ETCs included in the study spending at least one hour in the Baseline Southern Quebec search domain (dashed black) between January 1991 and December 2020. Dots with a black edge represent the genesis locations of flood ETCs. (b) Comparison of the distribution of genesis location percentages for the two categories of ETCs. Statistically significant differences are indicated by an asterisk (*) preceding the percentages shown. (c) Lifetime of storms in the Baseline Southern Quebec search domain by cluster of genesis location. The medians are shown by the white lines. The asterisk (*) denotes a statistically significant difference in the distribution.
A comparison of tracks of flood vs non-flood ETCs for clusters Central United States–Gulf of Mexico and United States East Coast–Caribbean was also done but not shown, available in the Supplement in Figs. S5 and S6. This comparison was only done for these two clusters as the number of flood ETCs from the other three clusters were not sufficient (N=23, 14, and 9).
4.3.3 Uneven contribution of flood ETCs to financial aid claims totals
Figure 10a shows the impact (number of financial aid claims associated) and cluster of all flood ETCs associated with at least 100 financial aid claims. The impact of flood ETCs varied greatly. The five most impactful flood ETCs were associated with 51.0 % of all financial aid claims over the 30-year study. Furthermore, the top 18 storms were associated with 75.7 % of all financial aid claims (see bars left of the 75 % claims in Fig. 10a), while the remaining 182 storms were associated with only 12.4 % of claims (as 11.9 % of claims were not associated with a flood ETC). In order of importance, the most impactful ETCs originated predominantly from the Central United States–Gulf of Mexico, United States East Coast–Caribbean, and Ontario–Hudson Bay clusters.
Fig. 10b shows all flood ETCs that were associated with financial aid claims (represented by colored dots corresponding to their cluster) with their number of watersheds affected (number of local floods they are linked to). Similarly to the association with financial aid claims, the association of flood ETCs with local flood events was also highly uneven, with only a few flood ETCs linked to widespread flooding affecting a large number of watersheds. Specifically, one flood ETC was associated with 48 local flood events, which was more than double the value of any other flood ETC (17 watersheds). The right half of Fig. 10b shows that the storms that lead to the most widespread flooding also originated from the same two clusters (Central United States–Gulf of Mexico, and United States East Coast–Caribbean). All storms associated with flooding in more than five watersheds and leading to more than 345 financial aid claims originated from these two clusters. It is important to note that 80 flood ETCs are not pictured on Fig. 10b, as they had lower percentages of cumulated rainfall than those portrayed, and since financial aid claims were associated with flood ETCs with the highest percentage of cumulated rainfall per flood event.

Figure 10(a) Impact (number of financial aid claims associated) of flood ETCs, by importance, showing all flood ETCs with at least 100 financial aid claims associated (N=24), their respective cluster of genesis location and the time of the flood event/storm. (b) Number of financial aid claims and watersheds affected (number of local floods) of flood ETCs associated with financial aid claims (121/200) and their cluster.
4.4 Impact of varying the days, radius, and threshold on identified flood ETCs
4.4.1 Sensitivity analysis results on spring flood events
Figure 11 shows the percentage distribution of genesis location of flood ETCs, as identified through the five alternative scenarios and the control case, resulting from the application of the method to the 372 spring flood events. The figure allows to notice the impact of varying the different parameters of the methodology to the constitution of the flood ETCs group (number of flood ETCs identified and cluster).
For spring, all five alternative scenarios showed very little differences in the distribution of genesis location among identified flood ETCs: the majority of flood ETCs still came from the Central United States–Gulf of Mexico cluster, as can be seen in Fig. 11. The “days” scenario only identified three fewer flood ETCs. This suggests that the chosen search period was conservative, since few flood ETCs were identified during the first five days of the search period for spring flood events. Similarly, the “days end” scenario had a minimal impact on the number of flood ETCs identified: only five more flood ETCs were identified through this scenario.
For the other scenarios, the number of identified flood ETCs were lower than for the control case, with 23 (14.4 %) fewer flood ETCs identified in the “radius2” scenario, 26 (16.3 %) fewer in the “threshold” scenario, and 55 (34.4 %) fewer in the “radius1” scenario. Differences between the control and “radius2” scenarios signify that a small proportion (14.4 %) of flood ETCs identified in the control case track relatively far – between 800 and 1000 km – from the center of the flooded watersheds. This could suggest that events of this kind (where flood ETCs track far from the affected watershed) are associated with fronts, given that these can be located far from an ETC's center (Ahrens, 2009). Differences between the control and “threshold” scenarios indicate that the majority (83.7 %) of flood ETCs identified in the control case had a cumulated rainfall percentage already higher than 15 % in their respective search periods.

Figure 11Distribution of genesis location of flood ETCs identified in MAM flood events for the control case compared to the three other scenarios.
Differences in ETC contribution from the control to the “days” and “days end” scenarios were minimal, with the median ETC contribution falling from 66.1 % to 63.9 % in the “days” case and to 65.5 % in the “days end” case (see Fig. S7 in the Supplement). In contrast, but expectedly, reducing the search radius impacted ETC contribution, decreasing it from a median of 66.1 % in the control case to 49.1 % in the “radius2” case, and to 34.1 % in the “radius1” case (see Fig. S7). The higher value for the control scenario is closer to the expected precipitation associated with ETCs (70 %–85 % depending on the season) for the province (Hawcroft et al., 2012). This suggests that the search radius was not greatly overestimated or underestimated by using a fixed value of 1000 km.
4.4.2 Sensitivity analysis on fall flood events
Even though 58 flood events occurred in fall, only 13 flood ETCs were identified in the control case. For this reason, the results on the sensitivity analysis for the fall season are more challenging to interpret. Nevertheless, in fall, the distribution of provenance of flood ETCs changed very little for the different scenarios studied: storms originating from the United States East Coast–Caribbean cluster composed the majority of flood ETCs, representing between 71.4 % and 77.8 % of storms, depending on the scenario. This can be visualized in Fig. S9 in the Supplement. Only the “radius1” and “days end” scenarios had different number of identified flood ETCs compared to the control case (−4 and +1, respectively).
Extending the EOF–ESP period (“days end” scenario) had a negligible impact on the median ETC contribution (went from 72.9 % in the control to 71.9 %). Interestingly, both the “radius2” and “days” scenario resulted in similar changes to the ETC contribution. By reducing the search radius to 800 km (“radius2” scenario), the ETC contribution lowered to 63.2 %. By increasing the SSP–SOF period from five to ten days, the ETC contribution lowered to 63.4 %, showing that little precipitation occurred during these additional five days at the beginning of the studied time intervals. As with the spring floods analysis, the “radius1” scenario had the lowest median ETC contribution in fall, at 51.6 %.
5.1 Seasonality of floods in Quebec and ETC contribution
Due to the large number of spring flood events, spring storms were more commonly identified as flood ETCs. This is why the seasonal distribution of storm genesis locations was examined (see Fig. S4 in the Supplement). Although a formal statistical attribution was not performed, the findings nonetheless reveal a marked increase in the proportion of United States East Coast–Caribbean storms among flood ETCs in summer and fall (with a stronger signal in fall) relative to non-flood ETCs. We suspect that with more observations, these differences would be statistically significant, as these storms were found among the most impactful (with high numbers of financial aid claims associated) and linked to widespread (with high numbers of watersheds affected) flooding (see Fig. 10). The rarity of winter flood events makes findings related to this season difficult to interpret. Perhaps as a result, no differences in the provenance of ETCs have been found in winter when comparing flood and non-flood ETCs.
The number of local flood events with negligible ETC contribution was highest in summer, as can be seen in Fig. 6. In summer, high-intensity rainfall is often associated with smaller systems, such as mesoscale convective systems and isolated thunderstorms, which can lead to flash flooding (Alpizar et al., 2026; Bourgault et al., 2022; Prein et al., 2023). We hypothesize that, in the cases of summer local floods with negligible to low ETC contribution, these processes could have been responsible for the additional precipitation that led to flooding. Aside from the occurrence of sporadic extreme precipitation, summer is generally a season when flooding is less likely to occur, as river levels are low and can accommodate more rainfall. Therefore, significant rainfall is required for flooding to occur in the summer, which could also explain why this season had the highest median ETC contribution to floods (83.5 %, very high).
The lowest average and median ETC contributions were recorded in spring, which is not surprising considering that other factors, such as snowmelt triggered by sudden temperature increases, can influence spring flooding. We speculate that these processes could reduce the importance of ETC-associated precipitation needed to trigger spring flooding. One of the study's main limitations is that it does not consider land surface processes that could increase the likelihood of flooding at certain times of year or in particular locations, such as soil moisture content and snowpack characteristics. Another important aspect to consider is that the study did not evaluate the impact of ETCs bringing significant amounts of snowfall in the winter to flood events, since the delay between the precipitation and subsequent flooding can be several months.
5.2 Characteristics of flood ETCs
The increased presence of storms from the Central United States–Gulf of Mexico among flood ETCs cannot be entirely attributed to their longer lifetimes. A study of extratropical cyclone climatology across eastern Canada by Plante et al. (2015) showed that, although storms originating in the Gulf of Mexico and southern United States (Central Rockies) did not frequently reach eastern Canada, they had high relative vorticity when they did, suggesting a high potential for damage. A climatology of cold season (October–March) ETCs leading to socially disruptive extreme weather events (EWEs) over central and eastern North America between 1979–2016 found that ETCs leading to EWEs typically formed in three areas: lee of the Rocky Mountains, over the south central United States, and along the east coast of North America (Bentley et al., 2019). One reason these storms were found among ETCs leading to EWEs is their proximity to the Gulf of Mexico, which provides additional moisture and enhances the cyclones' diabatic processes.
The regions of enhanced genesis density for ETCs leading to EWEs are analogous to our clusters in the Central United States–Gulf of Mexico, as well as in the United States East Coast–Caribbean (see Fig. 6 in Bentley et al., 2019). Although their study did not specifically examine ETCs leading to flooding, we can hypothesize that the characteristics of our flood ETCs would resemble those of storms leading to EWEs. Furthermore, the authors found that their ETCs leading to EWEs most frequently formed in November and March. March coincides with the onset of the spring freshet and the majority of floods in Quebec. Therefore, the increased formation of southern storms leading to EWEs during a time when Quebec is vulnerable to flooding could explain why Central United States–Gulf of Mexico storms were more prevalent among our flood ETCs, in addition to having long lifetimes and high intensities.
The aforementioned study (Bentley et al., 2019) also found that ETCs leading to EWEs rarely originated in the southern Canadian Rocky Mountains, as they remained weak when tracking over central and eastern Canada. This was also true for a climatology of extratropical cyclones over the 1979–2009 period in eastern Canada by Plante et al. (2015), which showed that cyclones that formed in high-latitude regions (Northen Rockies and Hudson Bay) were typically weak. Considering this and the shorter lifetimes of these storms in the Baseline Southern Quebec domain, a lower presence of Western Canada–Pacific Ocean storms among flood ETCs is to be expected, and coincides with our findings.
Forming within the Baseline Southern Quebec domain and typically tracking eastward, Quebec–Maritimes storms have shorter lifetimes (22 h less on average than Central United States–Gulf of Mexico storms, see Fig. 9c). This makes them poor flood ETCs candidates, which could explain their limited presence among flood ETCs.
Furthermore, Bentley et al. (2019) have identified that ETCs leading to EWEs forming along the east coast of North America occur more frequently in November and December. This is consistent with our findings, given that 76.9 % of our flood ETCs identified in the fall originated from the United States East Coast–Caribbean cluster (see Fig. S4c). Cold season ETCs have also frequently been associated with flooding in eastern United States (close to our study site) (Smith et al., 2010), and are typically strong and frequent in winter (Plante et al., 2015), which further explains their contribution to Quebec floods.
As can be seen in Fig. 9a, some storms form along 20° N latitude (the southernmost limit of the NAEC Catalogue), which indicates that the Catalogue includes tropical cyclones that have transitioned into the extratropics. The timing and tracks of the nine flood ETCs that generated (first time they were identified in the NAEC Catalogue) between latitudes of 20 and 30° N (circled in black in Fig. 9a) were compared to National Oceanic and Atmospheric Administration (NOAA) historical hurricane tracks to identify potential matches (NOAA, 2025). Out of these nine flood ETCs, which all belonged to the United States East Coast–Caribbean cluster, four had a match among hurricanes or tropical storms. Table 2 provides information on these extratropical transition storms, with some showing above seasonal average number of financial aid claims associated and/or watersheds affected (shown in bold). Figure S10 in the Supplement shows the tracks of these four extratropical transition flood ETCs (from the NAEC Catalogue) and their tropical cyclone matches (from the NOAA historical hurricanes).
Table 2Extratropical transition ETCs identified among flood ETCs with their associated number of financial aid claims and watersheds affected. Numbers in the Storm id column refer to their id in the NAEC Catalogue. Values in bold indicate an above average value for the given season. The levels indicated in parenthesis in the Hurricane (H)/tropical storm (TS) column refers to the maximum category reached by the storm during its lifetime.

This study quantified the contribution of extratropical cyclones to 498 fluvial flood events that occurred in 98 watersheds in southern Quebec between January 1991 and December 2020 and investigated whether flood ETCs (extratropical cyclones that contributed to flooding) had unique genesis locations, lifetimes, or tracks using multiple sources of data (reconstituted river outputs, ERA5 precipitation data, storm tracks, and government financial aid data).
Results on the quantification of ETC contribution to flooding in Quebec showed that the majority of flood events (72.7 %) had a high or very high ETC contribution (>50 % of the rainfall during the search period was associated with ETCs), while only 2.6 % of events, mostly occurring in the summer, had a negligible ETC contribution (<5 % of the rainfall during the search period was associated with ETCs). Although summer exhibited more extreme values, the lowest average ETC contribution (61.8 %) occurred in spring. This is hypothesized to reflect the additional contribution of snowmelt to flooding during this season, although snowmelt itself was not explicitely assessed in this study.
This study revealed that flood ETCs differed from non-flood ETCs (ETCs that did not contribute to flooding but entered the domain during the 30-year study period) in some respects. Flood ETCs had longer lifetimes, spending an average of 18.2 h more in the Baseline Southern Quebec domain than their non-flood counterparts. Lifetime in the domain and cluster of origin were closely related: both Quebec–Maritimes and Western Canada–Pacific Ocean storms spent less time in the domain (an average of 22 and 11 h less, respectively) than United States East Coast–Caribbean and Central United States–Gulf of Mexico storms, and rarely appeared among flood ETCs (constituting only 11.5 % of flood ETCs combined). Given that storms originating from Western Canada–Pacific Ocean are known to weaken as they reach eastern Canada, and that Quebec–Maritimes storms naturally spent less time in the domain because they originated inside it, this is not surprising.
The proportion of storms originating from the Central United States–Gulf of Mexico increased from 20.2 % among non-flood ETCs to 50.5 % among flood ETCs. This is a clear indication that the region of origin (and thus the trajectory) was a key factor in determining whether storms were linked to flooding in the province. It is suspected that the longer lifetime, known intensity, and increased cyclogenesis of these storms in spring – when most flooding occurs – contributed to their larger proportions among flood ETCs.
Not all flood ETCs led to the same consequences: Central United States–Gulf of Mexico and United States East Coast–Caribbean storms both typically resulted in more damage. Storms originating from these two regions were the only ones associated with flood events involving more than 345 financial aid claims or affecting more than five watersheds. Furthermore, the percentage of financial aid claims allocated to flood ETCs was highly variable: the 18 (9 %) most impactful storms were associated with 75.7 % of the financial aid claims. This indicates that, even though floods occurred almost annually during the 30-year study period, a high ETC contribution (which occurred during most floods) did not necessarily lead to widespread flooding in the province. Among United States East Coast–Caribbean flood ETCs, 7.5 % turned out to be extratropical transition cyclones, raising the question of the extent to which these types of storms were involved in flooding compared to extratropical cyclones.
Finally, the trajectories of flood ETCs also differed from those of non-flood ETCs. They were more concentrated over the study area, typically entering Quebec from the south-west over land rather than tracking over the Atlantic Ocean along the east coast of North America or over northern Quebec.
This study proposes a methodology for systematically identifying extratropical cyclones that contribute to flooding (flood ETCs), using data characterizing damages (government financial aid claims) and reconstituted river outputs to determine the timing and location (at the watershed level) of floods. Studying these flood ETCs in detail can provide valuable insight into the atmospheric causes of flooding and help understand the types of storms associated with past catastrophes; in this case those originating from the Central United States–Gulf of Mexico in spring.
As these datasets become more widely available, we hope this work will encourage further large-scale case studies of flood events and motivate the adaptation of this methodology – for example, by considering soil moisture and snowmelt – to improve our understanding of the impacts associated with different types of storms, including tropical cyclones, ETCs or mesoscale convective systems.
All data resulting from this analysis are available at: https://doi.org/10.5683/SP3/98HDVT (Gagnon et al., 2025). The raw data on financial aid claims are not available as it contains sensitive information.
The supplement related to this article is available online at https://doi.org/10.5194/hess-30-7101-2026-supplement.
Clarence Gagnon: Conceptualization, Methodology, Data curation, Formal analysis, Visualization, Writing – original draft. Daniel F. Nadeau: Conceptualization, Methodology, Writing – review and editing, Supervision. Alejandro Di Luca: Conceptualization, Methodology, Writing – review and editing, Supervision. François Anctil: Funding acquisition, Conceptualization, Supervision. Marc-André Bourgault: Supervision. Benoit Brault: Data curation, Visualisation. Romane Hamon: Data curation. Nicolas L. Roy: Data curation.
The contact author has declared that none of the authors has any competing interests.
Publisher's note: Copernicus Publications remains neutral with regard to jurisdictional claims made in the text, published maps, institutional affiliations, or any other geographical representation in this paper. The authors bear the ultimate responsibility for providing appropriate place names. Views expressed in the text are those of the authors and do not necessarily reflect the views of the publisher.
The authors would like to thank Sandra Garneau at the MSP (Ministère de la Sécurité Publique du Québec) for comments and discussions on presentations of preliminary results of the study, Katja Winger and Frédérik Toupin for maintaining a user-friendly local computing facility, and Yassine Hammadi for server and environment-related assistance. The authors would also like to thank members of the HydroNord team at Université Laval, and members of the Pampa team at UQAM for comments on presentation of preliminary results, as well as Tiémé-Frédéric Togola for code development assistance.
This research has been supported by the Quebec government framework for disaster prevention (Cadre pour la prévention des sinistres du gouvernement du Québec), grant no. CPS-21-22-10 (a total grant value of CAD 1 866 000). The research is also an integral part of the REX-PHY project: conducting reviews of past floods that have caused property damage in Quebec – physical aspects (réalisation de retours d'expérience sur les inondations ayant causé des sinistres sur le territoire québécois – pôle physique).
This paper was edited by Shraddhanand Shukla and reviewed by three anonymous referees.
Ahrens, C. D.: Chapter 11: Air Masses and Fronts, in: Meteorology Today: An Introduction to Weather, Climate, and the Environment, Ninth Edition, edited by: Warde, J., Brooks/Cole Cengage Learning, Belmont, CA, United States, 287–311, ISBN 0495555738, 9780495555735, 2009.
Alpizar, M., Di Luca, A., Gachon, P., and Roberge, F.: Mesoscale Convective Systems in Northeastern North America: identification and evaluation with the convective-permitting version of the Canadian Regional Climate Model, Clim. Dynam., 64, 129, https://doi.org/10.1007/s00382-026-08102-6, 2026.
Barros, A. P. and Kuligowski, R. J.: Orographic Effects during a Severe Wintertime Rainstorm in the Appalachian Mountains, Mon. Weather Rev., 126, 2648–2672, https://doi.org/10.1175/1520-0493(1998)126<2648:OEDASW>2.0.CO;2, 1998.
Benoit, C., Demers, I., Roberge, F., Gachon, P., and Laprise, R.: Chapter 2: Inondations des printemps 2017 et 2019 dans le bassin versant de la rivière des Outaouais (Québec, Canada): analyse des facteurs phsyiographiques et météorologiques en cause, in: Les inondations au Québec; Risques, aménagement du territoire, impacts économiques et transformation des vulnérabilités, edited by: Buffin-Bélanger, T., Maltais, D., Gauthier, M., Presses de l'Université du Québec, Québec, Québec, Canada, 29–58, ISBN 9782760557840, 2760557847, 2022.
Bentley, A. M., Bosart, L. F., and Keyser, D.: A Climatology of Extratropical Cyclones Leading to Extreme Weather Events over Central and Eastern North America, Mon. Weather Rev., 147, 1471–1490, https://doi.org/10.1175/MWR-D-18-0453.1, 2019.
Bourgault, M.-A., Boivin, M., Roy, R., Desrochers, G., and Anctil, F.: Chapter 1: Regard sur les mécanismes et les facteurs contrôlant les inondations des bassins versants du Québec méridional, in: Les inondations au Québec; Risques, aménagement du territoire, impacts économiques et transformation des vulnérabilités, edited by: Buffin-Bélanger, T., Maltais, D., Gauthier, M., Presses de l'Université du Québec, Québec, Québec, Canada, 7–28, ISBN 9782760557840, 2760557847, 2022.
Buttle, J. M., Allen, D. M., Caissie, D., Davison, B., Hayashi, M., Peters, D. L., Pomeroy, J. W., Simonovic, S., St-Hilaire, A., and Whitfield, P. H.: Flood processes in Canada: Regional and special aspects, Can. Water Resour. J., 41, 7–30, https://doi.org/10.1080/07011784.2015.1131629, 2016.
Centre d'Expertise Hydrique du Québec: Portrait, https://www.cehq.gouv.qc.ca/atlas-hydroclimatique/carte-portrait/index.htm, last access: 25 November 2025.
Centre for Research on the Epidemiology of Disasters, UCLouvain, and United States Agency for International Development (USAID): 2023 Disasters in Numbers, https://files.emdat.be/reports/2023_EMDAT_report.pdf (last access: 18 October 2026), 2024.
Chen, T.-C. and Di Luca, A.: Characteristics of Precipitation and Wind Extremes Induced by Extratropical Cyclones in Northeastern North America, J. Geophys. Res.-Atmos., 130, e2024JD042079, https://doi.org/10.1029/2024JD042079, 2025.
Chen, T.-C., Di Luca, A., Winger, K., Laprise, R., and Thériault, J. M.: Seasonality of Continental Extratropical-Cyclone Wind Speeds Over Northeastern North America, Geophys. Res. Lett., 49, e2022GL098776, https://doi.org/10.1029/2022GL098776, 2022a.
Chen, T.-C., Di Luca, A., and Winger, K.: North America Extratropical Cyclone (NAEC) Catalogue (V3), Borealis [data set], https://doi.org/10.5683/SP3/LH8OBV, 2022b.
Chen, T.-C., Collet, F., and Di Luca, A.: Evaluation of ERA5 precipitation and 10-m wind speed associated with extratropical cyclones using station data over North America, Int. J. Climatol., 44, 729–747, https://doi.org/10.1002/joc.8339, 2024.
Danard, M., Munro, A., and Murty, T.: Storm Surge Hazard in Canada, Nat. Hazards, 28, 407–431, https://doi.org/10.1023/A:1022990310410, 2003.
Fortin, J.-P., Turcotte, R., Massicotte, S., Moussa, R., Fitzback, J., and Villeneuve, J.-P.: Distributed Watershed Model Compatible with Remote Sensing and GIS Data. I: Description of Model, J. Hydrol. Eng., 6, 91–99, https://doi.org/10.1061/(ASCE)1084-0699(2001)6:2(91), 2001.
Gagnon, C., Nadeau, D. F., Di Luca, A., Brault, B., Hamon, R., Roy, N. L., Bourgault, M.-A. and Anctil, F.: Data for “Assessing the Contribution of Extratropical Cyclones to River Floods That Caused Property Damage in Quebec, Canada” (V1), Borealis [data set], https://doi.org/10.5683/SP3/98HDVT, 2025.
Government of Quebec and Ouranos: Guide de l'Atlas hydroclimatique du Québec méridional, Bibliothèque des Archives nationales du Québec, https://www.cehq.gouv.qc.ca/atlas-hydroclimatique/guide-atlas-hydroclimatique-2022.pdf (last access: 18 October 2026), 2022.
Hawcroft, M. K., Shaffrey, L. C., Hodges, K. I., and Dacre, H. F.: How much Northern Hemisphere precipitation is associated with extratropical cyclones?, Geophys. Res. Lett., 39, L24809, https://doi.org/10.1029/2012GL053866, 2012.
Hersbach, H., Bell, B., Berrisford, P., Hirahara, S., Horányi, A., Muñoz-Sabater, J., Nicolas, J., Peubey, C., Radu, R., Schepers, D., Simmons, A., Soci, C., Abdalla, S., Abellan, X., Balsamo, G., Bechtold, P., Biavati, G., Bidlot, J., Bonavita, M., De Chiara, G., Dahlgren, P., Dee, D., Diamantakis, M., Dragani, R., Flemming, J., Forbes, R., Fuentes, M., Geer, A., Haimberger, L., Healy, S., Hogan, R. J., Hólm, E., Janisková, M., Keeley, S., Laloyaux, P., Lopez, P., Lupu, C., Radnoti, G., de Rosnay, P., Rozum, I., Vamborg, F., Villaume, S., and Thépaut, J. N.: The ERA5 global reanalysis, Q. J. R. Meteorol. Soc., 146, 1999–2049, https://doi.org/10.1002/qj.3803, 2020.
Hersbach, H., Bell, B., and Berrisford, P.: ERA5 hourly data from 1940 to present, Climate Data Store [data set], https://doi.org/10.24381/cds.adbb2d47, 2025.
Hirsch, M. E., DeGaetano, A. T., and Colucci, S. J.: An East Coast Winter Storm Climatology, J. Climate, 14, 882–899, https://doi.org/10.1175/1520-0442(2001)014<0882:AECWSC>2.0.CO;2, 2001.
Insurance Bureau of Canada: The costliest severe weather event in Quebec's history – August flooding caused nearly $2.5 billion in insured damage, https://www.ibc.ca/news-insights/news/the-costliest-severe-weather-event-in-quebec-s-history-august-flooding-caused-nearly-2-5-billion-in-insured-damage (last access: 18 October 2026), 2024.
Javelle, P., Ouarda, T. B. M. J., and Bobée, B.: Spring flood analysis using the flood-duration–frequency approach: application to the provinces of Quebec and Ontario, Canada, Hydrol. Process., 17, 3717–3736, https://doi.org/10.1002/hyp.1349, 2003.
Klock, R., Simard, G., and Mullock, J.: The Weather of Ontario and Quebec, https://www.navcanada.ca/en/lawm-ontario-quebec-en.pdf (last access: 18 October 2026), 2002.
Lachance-Cloutier, S., Turcotte, R., and Cyr, J.-F.: Combining streamflow observations and hydrologic simulations for the retrospective estimation of daily streamflow for ungauged rivers in southern Quebec (Canada), J. Hydrol., 550, 294–306, https://doi.org/10.1016/j.jhydrol.2017.05.011, 2017.
Lehner, B. and Grill, G.: Global river hydrography and network routing: baseline data and new approaches to study the world's large river systems, Hydrol. Process., 27, 2171–2186, https://doi.org/10.1002/hyp.9740, 2013.
Lehner, B. and Grill, G.: HydroBASINS, hydrosheds.org [data set], https://www.hydrosheds.org/products/hydrobasins (last access: 25 November 2025), 2025.
Lehner, B., Verdin, K., and Jarvis, A.: New Global Hydrography Derived From Spaceborne Elevation Data, Eos Trans. Am. Geophys. Union, 89, 93–94, https://doi.org/10.1029/2008EO100001, 2008.
Lin, H., Mo, R., Vitart, F., and Stan, C.: Eastern Canada Flooding 2017 and its Subseasonal Predictions, Atmos. Ocean, 57, 195–207, https://doi.org/10.1080/07055900.2018.1547679, 2019.
Lucas-Picher, P., Arsenault, R., Poulin, A., Ricard, S., Lachance-Cloutier, S., and Turcotte, R.: Application of a High-Resolution Distributed Hydrological Model on a U.S.-Canada Transboundary Basin: Simulation of the Multiyear Mean Annual Hydrograph and 2011 Flood of the Richelieu River Basin, J. Adv. Model. Earth Sy., 12, e2019MS001709, https://doi.org/10.1029/2019MS001709, 2020.
Martel, J.-L., Brissette, F. P., Lucas-Picher, P., Troin, M., and Arsenault, R.: Climate Change and Rainfall Intensity–Duration–Frequency Curves: Overview of Science and Guidelines for Adaptation, J. Hydrol. Eng., 26, 03121001, https://doi.org/10.1061/(ASCE)HE.1943-5584.0002122, 2021.
Milbrandt, J. A. and Yau, M. K.: A Mesoscale Modeling Study of the 1996 Saguenay Flood, Mon. Weather Rev., 129, 1419–1440, https://doi.org/10.1175/1520-0493(2001)129<1419:AMMSOT>2.0.CO;2, 2001.
Miller, A. J.: Flood hydrology and geomorphic effectiveness in the central Appalachians, Earth Surf. Process. Landf., 15, 119–134, https://doi.org/10.1002/esp.3290150203, 1990.
Ministère de l'Environnement, de la Lutte contre les changements climatiques, de la Faune et des Parcs: Crue printanière de 2017: le plus fort apport en eau potentiel depuis 1974, https://www.environnement.gouv.qc.ca/climat/Faits-saillants/2017/crue-printaniere.htm (last access: 25 November 2025), 2025.
NOAA: Let's find a hurricane you're interested in, https://coast.noaa.gov/hurricanes/#map=4/32/-80 (last access: 20 October 2025), 2025.
Perrier, R. and Slivitzky, M.: Survol des cas de pluies abondantes au Québec – Rapport scientifique SEC-Q99-02 dans le cadre de la Série sur les extrêmes climatiques au Québec, https://publications.gc.ca/collections/collection_2025/eccc/en57/En57-34-1-1998-fra.pdf (last access: 18 October 2026), 1999.
Pfahl, S. and Wernli, H.: Quantifying the Relevance of Cyclones for Precipitation Extremes, J. Climate, 25, 6770–6780, https://doi.org/10.1175/JCLI-D-11-00705.1, 2012.
Plante, M., Son, S., Atallah, E., Gyakum, J., and Grise, K.: Extratropical cyclone climatology across eastern Canada, Int. J. Climatol., 35, 2759–2776, https://doi.org/10.1002/joc.4170, 2015.
Poan, E. D., Gachon, P., Laprise, R., Aider, R., and Dueymes, G.: Investigating added value of regional climate modeling in North American winter storm track simulations, Clim. Dynam., 50, 1799–1818, https://doi.org/10.1007/s00382-017-3723-9, 2018.
Prein, A. F., Mooney, P. A., and Done, J. M.: The Multi-Scale Interactions of Atmospheric Phenomenon in Mean and Extreme Precipitation, Earths Future, 11, e2023EF003534, https://doi.org/10.1029/2023EF003534, 2023.
Public Safety Canada: Montreal and Mauricie Region QC, 8–9 November 1996 – Flood, https://cdd.publicsafety.gc.ca/dtpg-eng.aspx?cultureCode=en-Ca&normalizedCostYear=1&dynamic=false&eventId=581 (last access: 25 November 2025), 2025a.
Public Safety Canada: The Canadian Disaster Database, https://www.publicsafety.gc.ca/cnt/rsrcs/cndn-dsstr-dtbs/index-en.aspx (last access: 25 November 2025), 2025b.
Riboust, P. and Brissette, F.: Analysis of Lake Champlain/Richelieu River's historical 2011 flood, Can. Water Resour. J., 41, 174–185, https://doi.org/10.1080/07011784.2014.982190, 2016.
Rickard, L. J., Déry, S. J., Stewart, R. E., and Thériault, J. M.: Meteorologically Related Factors Leading to the 2008, 2018, and 2019 Major Spring Floods in the Transboundary Saint John River (Wolastoq) Basin, J. Hydrometeorol., 26, 201–220, https://doi.org/10.1175/JHM-D-24-0032.1, 2025.
Roy, E., Rousselle, J., and Lacroix, J.: Flood Damage Reduction Program (FDRP) in Québec: Case Study of the Chaudière River, Nat. Hazards, 28, 387–405, https://doi.org/10.1023/A:1022942427248, 2003.
Saad, C., El Adlouni, S., St-Hilaire, A., and Gachon, P.: A nested multivariate copula approach to hydrometeorological simulations of spring floods: the case of the Richelieu River (Québec, Canada) record flood, Stoch. Environ. Res. Risk Assess., 29, 275–294, https://doi.org/10.1007/s00477-014-0971-7, 2014.
Sandink, D., Kovacs, P., Oulahen, G., and McGillivray, G.: Making Flood Insurable for Canadian Homeowners: A discussion Paper, Institute for Catastrophic Loss Reduction (ICLR), 2010.
Smith, J. A., Baeck, M. L., Villarini, G., and Krajewski, W. F.: The Hydrology and Hydrometeorology of Flooding in the Delaware River Basin, J. Hydrometeorol., 11, 841–859, https://doi.org/10.1175/2010JHM1236.1, 2010.
Statistics Canada: Population distribution as of July 1, 2022, by census division, Canada. Map 1.1, https://www150.statcan.gc.ca/n1/pub/91-214-x/2023001/section01-eng.htm (last access: 25 November 2025), 2025a.
Statistics Canada: Table 17-10-0106-01 Population (2001 Census and administrative data), by age group and sex, Canada, provinces, territories, health regions (June 2003 boundaries) and peer groups: https://www150.statcan.gc.ca/t1/tbl1/en/tv.action?pid=1710010601 (last access: 25 November 2025), 2025b.
Su, Y., Smith, J. A., and Villarini, G.: Extreme Convective Rainfall and Flooding from Winter Season Extratropical Cyclones in the Mid-Atlantic Region of the United States, J. Hydrometeorol., 24, 497–520, https://doi.org/10.1175/JHM-D-22-0069.1, 2023.
Teufel, B., Sushama, L., Huziy, O., Diro, G. T., Jeong, D. I., Winger, K., Garnaud, C., De Elia, R., Zwiers, F. W., Matthews, H. D., and Nguyen, V.-T.-V.: Investigation of the mechanisms leading to the 2017 Montreal flood, Clim. Dynam., 52, 4193–4206, https://doi.org/10.1007/s00382-018-4375-0, 2019.
Tremblay, M. and Guillaud, C.: The 1996 Saguenay Flood event and its impacts, Nat. Hazards, 98, 79–89, https://doi.org/10.1007/s11069-018-3494-6, 2019.