
the Creative Commons Attribution 4.0 License.
the Creative Commons Attribution 4.0 License.
 | 10 Nov 2026
Evaluation of sub-daily precipitation variability and its diurnal characteristics in satellite and reanalysis datasets against ground-based observations
Gyuyeon Choi

Paul A. Dirmeyer
The diurnal cycle of precipitation serves as a fundamental diagnostic of the climate system's energy budget and hydrological cycle. Yet comprehensive evaluations of both its regular diurnal and irregular intermittent components across multiple satellite and reanalysis products against extensive ground-based observations remain limited. This study evaluates the boreal summer diurnal cycle across five satellite products and four reanalysis datasets against 6824 ground-based stations over the Northern Hemisphere land regions, complemented by inter-product comparison over quasi-global domain between 60° S and 60° N. Analyses are performed at 3-hourly resolution, combining sub-daily variance decomposition and harmonic analysis with atmospheric moisture budget diagnosis across contrasting precipitation regimes.
Ground-based observations indicate sub-daily fluctuations account for 65.6 % of total precipitation variance, with the irregular component dominating over the repeatable diurnal signal, a fraction that all evaluated datasets systematically underestimate. Reanalysis datasets place the land precipitation maximum 3–6 h ahead of observations, driven by premature convective triggering. Among reanalysis datasets, the Japanese Reanalysis for Three Quarters of a Century (JRA-3Q) shows the smallest phase difference owing to its dynamic convective available potential energy (CAPE) generation rate (DCAPE)-based convective trigger, while the North American Regional Reanalysis (NARR) achieves superior performance over North America through direct assimilation of precipitation observations. Satellite products exhibit the observed late-afternoon precipitation maximum with a phase lag of 1–2 h, arising from the indirect detection of upper-tropospheric ice-scattering signals that persist as convective anvils expand beyond the timing of peak surface precipitation. Among satellite products, the Climate Prediction Center Morphing Technique (CMORPH) shows the closest agreement with observations, as its morphing-based propagation of passive microwave retrievals preserves precipitation timing while its probability density function (PDF)-based bias correction maintains sub-daily temporal structure. These findings provide practical guidance for dataset selection and offer actionable physical insights for improving convective parameterization schemes and satellite retrieval algorithms.
- Article
(12690 KB) - Full-text XML
-
Supplement
(2597 KB) - BibTeX
- EndNote


Precipitation serves as the primary atmospheric engine of the global water cycle, acting as the critical link that governs the continuous exchange of moisture and latent heat between the Earth's surface and the atmosphere (Trenberth et al., 2003). While the latent heat released during condensation is a fundamental driver of global atmospheric circulation (Allan et al., 2020), precipitation itself constitutes the vital water input for terrestrial systems. As the principal source of soil moisture and groundwater, it fundamentally dictates the land-surface water budget, thereby regulating ecosystem functions and sustainable water availability (Oki and Kanae, 2006). The dynamic nature of the hydrological cycle is further underscored by precipitation extremes; excessive rainfall triggers devastating floods, while prolonged deficits lead to droughts. These deficits deplete soil moisture and shift surface energy partitioning, often culminating in complex drought–heatwave compound extremes (Miralles et al., 2019; Zscheischler et al., 2020).
The variability of precipitation spans a wide spectrum of time scales, from interannual to sub-daily, with distinct physical processes governing the hydrological cycle at each scale. Variations at interannual, seasonal, intraseasonal, and synoptic scales are associated with El Niño–Southern Oscillation (He and Li, 2019; Huang and Xie, 2015), monsoons (Wang et al., 2012; Wang and Ding, 2008), the Madden–Julian Oscillation (Jiang et al., 2020; Zhang, 2005), and extratropical cyclones (Catto et al., 2012; Hawcroft et al., 2012; Pfahl and Wernli, 2012), respectively. Beyond these large-scale oscillations, sub-daily variability constitutes a large fraction of the total precipitation budget. Satellite retrievals indicate that sub-daily internal variability explains more than 50 % of the total internal variability during the boreal summer (Ahn et al., 2022). The diurnal cycle, as the dominant component of this sub-daily variance, represents one of the most fundamental modes of the climate system, governed by the 24 h periodicity of Earth's rotation (Christopoulos and Schneider, 2021; Dai, 2001; Yang and Slingo, 2001).
Over land, the diurnal cycle of precipitation often peaks in the afternoon and is intrinsically linked to the surface energy balance. As incoming solar radiation maximizes around noon, the surface responds through intensified sensible and latent heat fluxes. The sensible heat flux deepens the planetary boundary layer (PBL), while the latent heat flux supplies the moisture to the lower atmosphere (Dai, 2024). Specifically, turbulent mixing within the PBL enhances the equivalent potential temperature of the lower atmosphere, facilitating the accumulation of convective available potential energy (CAPE). Concurrently, the weakening of the inversion at the top of the PBL and the upward moisture transport reduce convective inhibition (CIN), ultimately triggering convection (Dai, 2024; Dai et al., 1999). However, a characteristic lag of 3–6 h exists between peak surface fluxes and the precipitation maximum. This delay is attributed to the initial development of shallow cumulus, which experience lateral and cloud-top entrainment of dry environmental air into the convective plumes. This process dilutes the buoyancy within the core of the rising air and suppresses its vertical growth (Tian and Kuang, 2016). Consequently, a transitional period is required for shallow convection to moisten the lower free atmosphere and further erode CIN. As the transition proceeds and the plumes grow, a smaller fraction of the plume is exposed to the environment and the entrainment rate itself decreases, so the dilution weakens and deep convection can develop (Stirling and Stratton, 2012). Through these complex land-atmosphere interactions, the precipitation maximum over most terrestrial regions is realized in the late afternoon to early evening, between 15:00 and 21:00 local solar time (LST) (Dai et al., 1999; Watters et al., 2021).
However, this surface-heating-driven mechanism is not universally dominant. In regions where large-scale dynamical forcing governs precipitation, diurnal characteristics diverge markedly from the solar-driven pattern. For instance, over the US Great Plains (GP), the nocturnal low-level jet (LLJ) intensifies after sunset due to boundary layer decoupling and transports moist air northward from the Gulf of Mexico. The resulting convergence at the poleward terminus of the jet triggers elevated convection and the propagation of mesoscale convective systems (MCSs), leading to a precipitation peak between midnight and early morning (Higgins et al., 1997; Shapiro et al., 2016). Over the Maritime Continent, daytime convection initiated over land propagates offshore via land breezes and gravity waves, resulting in nocturnal-to-early morning rainfall over coastal waters (Love et al., 2011; Lu et al., 2021; Mori et al., 2004). Furthermore, diurnal cycles differ between convective (CP) and large-scale precipitation (LSP); LSP generally exhibits a weak diurnal amplitude with a dawn peak (approximately 06:00 LST), whereas CP displays a robust diurnal cycle peaking in the late afternoon (16:00–20:00 LST). Since total precipitation (TP) is the aggregate of these components, the timing of the TP peak often precedes that of CP by 1–2 h, reflecting the complex interplay between different precipitation regimes (Dai, 2001; Dai and Trenberth, 2004).
In contrast to terrestrial regions, the oceanic diurnal precipitation maximum typically occurs in the early morning (04:00–08:00 LST), with a diurnal amplitude generally weaker than that over land (Dai, 2001; Dai et al., 2007). Over coastal waters, strong daytime heating over adjacent landmasses drives a land–sea breeze circulation that induces low-level convergence over the ocean during the night, resulting in an early-morning precipitation peak (Deser and Smith, 1998). In the tropical and open oceans where continental influence is minimal, differential longwave radiative cooling between cloudy and clear regions during the night enhances nocturnal destabilization and low-level convergence (Gray and Jacobson, 1977). Furthermore, spatial phase differences in semi-diurnal pressure tides can further intensify this early-morning convergence, playing a crucial role in the diurnal timing of oceanic precipitation (Dai et al., 1999).
Given that the diurnal cycle of precipitation results from the complex coupling of radiation, convection, and boundary layer processes, it serves as a critical benchmark for evaluating the physical fidelity of climate models (Cui et al., 2021; Watters et al., 2021). While climate models can reasonably reproduce precipitation characteristics at seasonal and interannual scales, they consistently struggle to simulate a realistic diurnal cycle (Christopoulos and Schneider, 2021; Dong et al., 2023). For instance, the Coupled Model Intercomparison Project (CMIP) Phase 5 and Phase 6 models typically produce a diurnal peak 3–5 h earlier than observations over land, accompanied by a substantial inter-model spread in amplitude. Over the ocean, although the simulated phase is more comparable to observations, the amplitude remains substantially underestimated, a persistent bias across multiple CMIP generations (Christopoulos and Schneider, 2021; Tang et al., 2021). Many models employ CAPE-based convective triggers that activate convection prematurely in response to boundary layer heating. Furthermore, because these schemes often diagnose shallow and deep convection independently, they fail to represent the gradual transition between these two stages (Freitas et al., 2021; Yang et al., 2021). This leads to the well-known “too frequent, too light” problem in diurnal precipitation and an underestimation of the diurnal cycle amplitude (Dai, 2006; Stephens et al., 2010). Additionally, coarse spatial resolution hinders the proper representation of MCS initiation and propagation, particularly in regions dominated by nocturnal peaks (Song et al., 2024). Reanalysis datasets inherit these systemic problems, as precipitation fields largely rely on model physics with limited sub-daily data assimilation, leading to the same premature peaks found in climate models (Dai and Trenberth, 2004; Watters et al., 2021).
Satellite remote sensing has been widely utilized to address the limitations inherent in climate models and reanalyses. In particular, the Tropical Rainfall Measuring Mission (TRMM) launched in 1997, followed by the Global Precipitation Measurement (GPM) mission, has provided unprecedented global observations of the vertical structure and spatiotemporal variability of precipitation (Kummerow et al., 1998). These high-resolution datasets serve as an essential benchmark for validating model physics and reanalysis performance. With the proliferation of diverse satellite products (e.g., the Integrated Multi-satellite Retrievals for GPM, IMERG; the Climate Prediction Center Morphing Technique, CMORPH; and the Global Satellite Mapping of Precipitation, GSMaP), numerous intercomparisons of the diurnal precipitation cycle have been conducted (Afonso et al., 2020; Janowiak et al., 2005). However, differences in retrieval algorithms and temporal sampling strategies among these products lead to large discrepancies in their captured diurnal characteristics (Pradhan et al., 2025; Watters et al., 2021). Furthermore, because satellite-based precipitation estimations rely on indirect proxies (e.g., radiative emission by liquid at lower levels, radiative scattering by ice at upper levels, and cloud-top temperatures) rather than direct surface measurements, they frequently exhibit a systematic phase delay in the diurnal peak relative to ground-based observations (Guilloteau et al., 2018; Petković et al., 2018; Sun et al., 2018).
As discussed above, both satellite and reanalysis datasets possess inherent biases in their representation of the diurnal precipitation cycle. Although various ground-based studies have attempted to diagnose these issues, several critical gaps remain. First, global-scale diurnal cycle analyses have relied on synoptic present weather codes (WMO ww codes from SYNOP reports) rather than direct precipitation measurements (Dai, 2001; Dai et al., 2007). Moreover, studies using hourly precipitation observations are limited to specific regions or a small number of observation sites (Dai, 2024; Tang et al., 2021), leaving a gap in globally representative, ground-observation-based benchmarks. Second, intercomparisons of satellite products have been confined to comparisons among satellite datasets (Pradhan et al., 2025), and no study simultaneously evaluated the diurnal cycle performance of multiple satellite products against a ground-based observation reference. Third, while phase shifts in individual reanalyses such as the European Centre for Medium-Range Weather Forecasts (ECMWF) Reanalysis Version 5 (ERA5) and the Modern-Era Retrospective Analysis for Research and Applications, Version 2 (MERRA-2) have been reported (Dai, 2024; Watters et al., 2021), a comprehensive evaluation remains lacking. Given that convective parameterization has been identified as a primary determinant of diurnal cycle fidelity in global models (Dirmeyer et al., 2012), systematic differences among reanalysis products with distinct convective schemes remain insufficiently explored. This is particularly relevant for the recently improved Japanese Reanalysis for Three Quarters of a Century (JRA-3Q), which features an updated convective parameterization (Kosaka et al., 2024). In particular, the systematic diagnosis of phase shifts through the partitioning of convective and large-scale precipitation remains unexplored across these diverse datasets.
This study addresses these gaps through three objectives. The first is to establish a ground-based benchmark for how precipitation variability is partitioned across temporal frequencies, quantifying the fraction of total variance that resides at sub-daily scales and the proportion of that associated with a diurnal cycle. The second is to evaluate multiple satellite products and reanalyses against this benchmark, extending prior work that has not jointly assessed the diurnal cycle across both product types using a common, dense ground-based reference. The third is to identify the physical origins of the diurnal phase differences among datasets, first by partitioning precipitation into its convective and large-scale components, and then by examining the thermodynamic conditions governing convective initiation in each reanalysis.
To meet these objectives, we use hourly observations from 6824 ground-based stations across Northern Hemisphere (NH) land regions. We evaluate sub-daily precipitation characteristics across five satellite products (IMERG; the TRMM Multi-satellite Precipitation Analysis, TMPA; CMORPH; GSMaP; and the Multi-Source Weighted-Ensemble Precipitation, MSWEP) and four reanalysis datasets (ERA5; JRA-3Q; MERRA-2; and the North American Regional Reanalysis, NARR). Unlike previous studies that focused primarily on the phase and amplitude of the diurnal cycle, this work first quantifies the fraction of TP variability explained by sub-daily fluctuations. We then diagnose the relative contributions of the diurnal (24 h), semi-diurnal (12 h), and higher-order harmonics within the sub-daily band to evaluate the harmonic balance inherent in each product. Furthermore, the study compares the dominant diurnal phase and amplitude across all datasets and investigates the physical drivers of phase shifts, particularly in reanalysis products. Finally, radiosonde observations from the Atmospheric Radiation Measurement (ARM) Southern Great Plains (SGP) site are integrated to explore the boundary layer and convective processes underlying the systematic biases identified in the reanalyses.
The remainder of this paper is organized as follows. Section 2 describes the ground-based observations, satellite products, and reanalysis datasets utilized in this study. Section 3 describes the analytical methods, including sub-daily variance decomposition and harmonic analysis. Section 4 presents the key results, including the decomposition of global precipitation variability across various time scales, an intercomparison of diurnal cycle phase and amplitude, and an analysis of diurnal characteristics for the CP and LSP components. The physical mechanisms are then examined over Northern Hemisphere land under contrasting moisture-supply regimes and at two representative sites, the ARM SGP site and a site in the southeastern United States. Finally, Sect. 5 summarizes the major findings and discusses their broader implications for climate modelling and future observations.
2.1 Ground-based observations
2.1.1 Global precipitation observations
Ground-based rain gauge observations provide direct surface measurements that are widely used as the reference for evaluating satellite and reanalysis datasets (e.g., Dai et al., 2007; Tang et al., 2021; Xie et al., 2007). The observational network comprises six distinct data sources (Table 1): (1) a subset of the Global Sub-Daily Rainfall Dataset (GSDR; Lewis et al., 2019), which provides quality-controlled hourly precipitation from approximately 23 000 gauge stations worldwide, (2) the Hadley Centre Integrated Surface Database (HadISD; Dunn et al., 2016), containing sub-daily precipitation observations from synoptic weather stations with comprehensive quality control, hourly precipitation datasets from (3) Germany Deutscher Wetterdienst (DWD), (4) Environment and Climate Change Canada (ECCC), and (5) Korea Meteorological Administration (KMA) national weather stations, and (6) China Meteorological Forcing Dataset version 1.6 (CMFD; He et al., 2020), which provides gridded 3-hourly precipitation at 0.1° resolution over China based on a fusion of 753 China Meteorological Administration station observations with satellite-based data. These precipitation observations have 1- or 3-hourly temporal resolution.
Table 1Description of ground-based precipitation datasets. The numbers in parentheses in the spatial resolution column indicate the total number of stations used in this study.
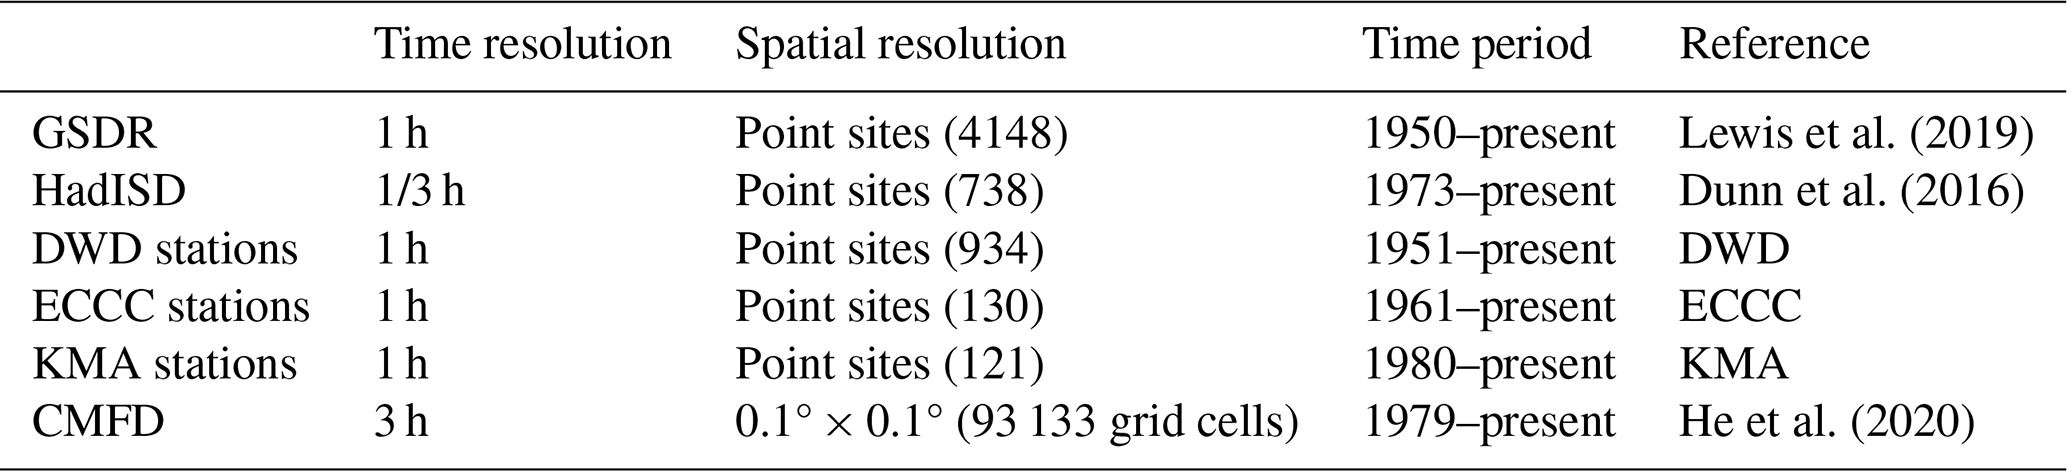
The spatial distribution of gauge observations exhibits substantial regional heterogeneity, with station density predominantly concentrated in the NH, particularly over North America, Europe, and East Asia. To ensure sufficient temporal representativeness, only stations with complete 3-hourly records for at least 3 boreal summers (JJA; 92 d × 3 years = 276 d) are retained. The resulting station network is concentrated in NH mid-latitude land regions, reflecting the global heterogeneity of long-term sub-daily gauge availability. We therefore restrict quantitative validation against ground observations to NH land, while presenting global maps in subsequent figures to characterize the spatial structure of inter-product differences. Over ocean and Southern Hemisphere land, where direct validation is not feasible, multi-satellite (MS) and multi-model (MM) means serve as references for relative inter-product comparison rather than absolute accuracy assessment.
To minimize the influence of coastal precipitation regimes, which are governed by land–sea breeze circulations and offshore propagation of convective systems that are not representative of continental diurnal forcing, stations located within 50 km of the coastline are excluded based on their coordinates. The same distance criterion is applied to CMFD grid cells using their centre coordinates. After applying both the coastal exclusion and the minimum record length criteria described above, the final dataset comprises 6071 point-based stations (North America: 3975, Europe: 1675, East Asia: 421) and 753 CMFD station-based gridded observations over China, yielding a combined total of 6824 observation records (Fig. 1). To minimize inconsistencies in spatial representativeness across datasets, the station statistics are spatially averaged onto a 0.5° × 0.625° grid, and CMFD grid cells are remapped to the same grid, corresponding to the coarsest spatial resolution among the gridded products (MERRA-2). The station statistics and the native CMFD cells are aggregated to each target grid cell by simple averaging of all stations or cells whose centre coordinates fall within it. A grid cell is assigned a value whenever at least one valid station or cell is present, with no minimum number imposed, as the statistics are computed at each station prior to spatial aggregation, and partially covered cells at the network edges are retained on the same basis. This procedure is consistent with the spatial harmonization described in Sect. 3.

Figure 1Locations of ground-based precipitation observations over the Northern Hemisphere. Symbols denote point-based observation stations from each dataset, and the shaded area indicates the spatial coverage of the gridded China Meteorological Forcing Dataset (CMFD) dataset, which is a fusion product combining station observations with reanalysis data. Bracketed numbers indicate the total number of stations or the number of stations to construct the gridded CMFD product. CMFD data courtesy of CMA and collaborators. Boxes delineate the three major regions of station concentration (North America, Europe, and East Asia), with the total number of observations within each region indicated below each box label. Stars mark the two case-study sites examined in Sect. 4.3.2, the Southern Great Plains site (black; 36.6025° N, 97.4925° W) and the southeastern US site (red; 33.5° N, 82° W).
Sub-daily precipitation variance is computed independently at each ground-based station prior to aggregation within each grid cell (hereafter, variance-then-averaging approach). An alternative approach, in which station time series are first averaged at each time step across all contributing stations within a grid cell before variance is computed from the resulting composite time series (hereafter, averaging-then-variance approach), would introduce a systematic dependence on the number of contributing stations (N), since the variance of the mean of random variables is proportional to of the individual variance. Grid-cell variance estimates from that approach would therefore be biased as a function of station density, an attenuation documented in prior studies (Osborn and Hulme, 1997; Light et al., 2022). The variance-then-averaging approach adopted here follows the “statistic-then-grid” order of operations employed in widely used observational datasets (Donat et al., 2013; Gibson et al., 2019).
Figure 2 confirms this behaviour at a representative grid cell in the Central United States, where station subsets of increasing size N are randomly drawn from the full set of Nmax available stations. The variance-then-averaging estimate () remains approximately constant across all values of N, whereas the averaging-then-variance estimate () decreases monotonically as N increases, at a rate more gradual than the theoretical scaling because neighbouring stations are positively correlated. The same behaviour is found at grid cells in Germany and East China (Fig. S1 in the Supplement). The spread in precipitation variance among stations within each grid cell indicates how well the grid-cell mean represents station-level values (Fig. S2). The mean absolute deviation remains below 13 % of the grid-cell mean and shows no systematic relationship with the number of stations.
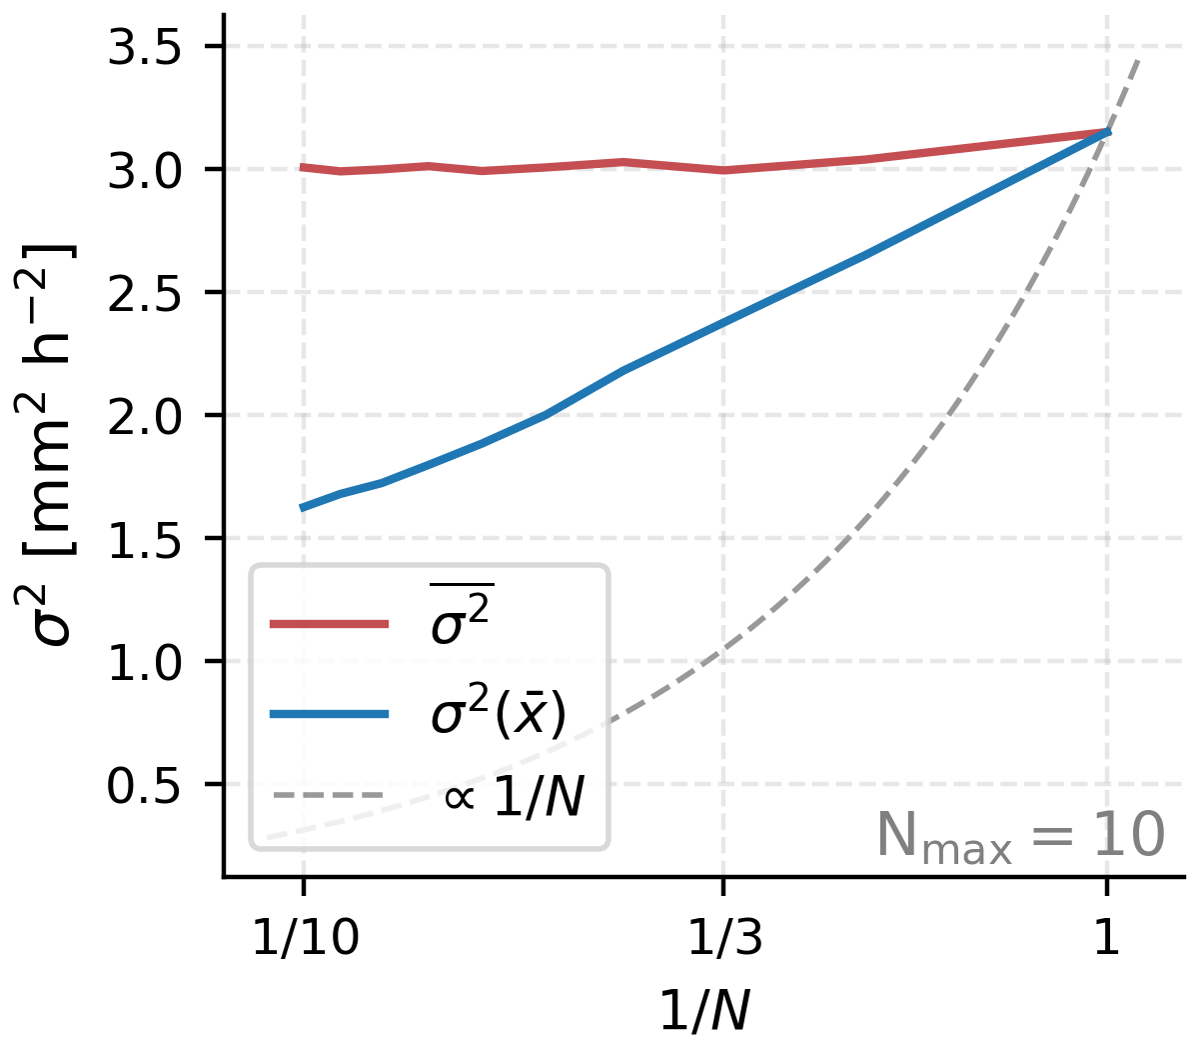
Figure 2Sensitivity of the grid-cell averaged sub-daily precipitation variance (σ2) to the number of stations (N), evaluated at a representative 0.5° × 0.625° grid cell in the Central United States (33.0° N, 96.9° W). For each N from 1 to Nmax, all possible combinations of station subsets are used to compute under two approaches. The , in which variance is computed at each station individually and subsequently averaged across the selected stations (red line). , in which station time series are first spatially averaged and variance is subsequently computed from the resulting mean time series (blue line). The dashed line indicates the theoretical scaling expected when variance decreases solely as a result of averaging independent samples.
2.1.2 SGP site observations
Observational data from the Atmospheric Radiation Measurement (ARM) Southern Great Plains (SGP) observatory, located near Lamont, Oklahoma (36.6025° N, 97.4925° W, 306 m elevation), are used to investigate the physical processes underlying the diurnal cycle of precipitation. The ARM SGP site provides qualified long-term observations of precipitation, atmospheric state variables, and surface energy fluxes that are essential for understanding the mechanisms of diurnal precipitation variability over the central United States.
Hourly precipitation is obtained from the ARM Best Estimate Atmospheric Measurements (ARMBEATM) product (Chen and Xie, 1994). ARMBEATM provides the best estimate of atmospheric states specifically tailored for evaluating global climate models. The precipitation measurements are obtained from both standard and optical rain gauges at the central facility. High-frequency raw measurements at 30 s or 1 min frequency are temporally averaged to an hourly resolution to ensure consistency with model output. These single-point measurements provide quality-controlled precipitation records suitable for a detailed analysis of the diurnal cycle, although they may not fully capture the spatial variability within gridded model domains.
The ARM Variational Analysis (VARANAL) product (Tang et al., 2019; Zhang et al., 2001) provides large-scale forcing fields derived from ground-based observations constrained by ARM surface and top-of-atmosphere measurements. VARANAL was originally designed to drive single-column models, cloud-resolving models, and large-eddy simulations by providing atmospheric boundary conditions derived from consistent estimates of atmospheric state variables and surface fluxes. The SGP continuous forcing dataset combines two data streams, sgp60varanarapC1.c1 (based on Rapid Refresh model) and sgp60varanarucC1.c1 (based on Rapid Update Cycle model), representing conditions averaged over a domain of approximately 370 km × 300 km centered on the SGP central facility at 1-hourly temporal resolution. In this study, surface sensible heat flux and latent heat flux from VARANAL are utilized to examine their relationship with the diurnal precipitation cycle.
Upper-air atmospheric conditions are characterized using radiosonde observations from the Integrated Global Radiosonde Archive (IGRA) version 2 (IGRA2; Durre et al., 2006, 2016) for station USM00074646 located at Lamont, Oklahoma (36.6025° N, 97.4925° W, 306 m elevation), which provides 6-hourly soundings from 2000 to present. The IGRA2 data are used in the place of upper-air measurements from ARMBEATM to calculate CAPE, CIN, moist static energy (MSE), and atmospheric precipitable water tendency (dPW). All observed variables at the SGP site are utilized for the period 2000–2023, using available days within this period. Surface sensible and latent heat fluxes from VARANAL are used as 3-hourly averages, while precipitation data are used as 3-hourly accumulations.
2.2 Satellite-based datasets
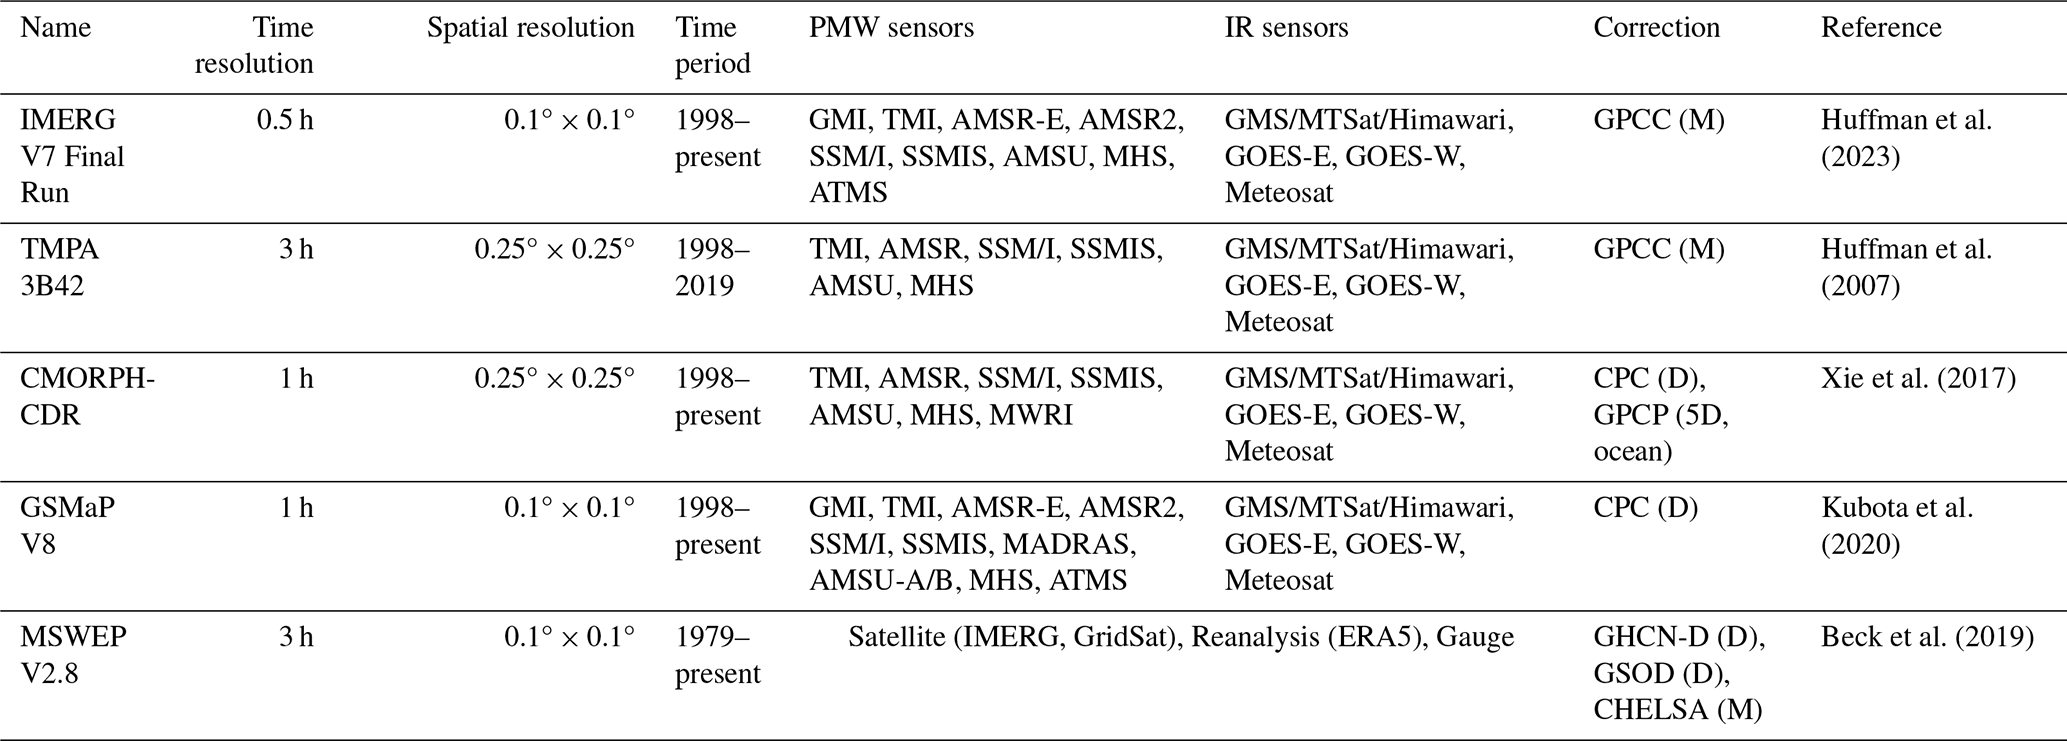
The satellite products and reanalyses evaluated in this study were selected to span the range of design choices relevant to diurnal precipitation characteristics, so that assessing them against direct ground-based observations provides a reference for selecting among them at this time scale. The Integrated Multi-satellite Retrievals for GPM (IMERG) Version 07B Final Run (Huffman et al., 2020, 2023) is a unified algorithm that intercalibrates, merges, and interpolates precipitation estimates from multiple sources including passive microwave (PMW) retrievals from the GPM constellation satellites, microwave-calibrated infrared (IR) satellite estimates, and monthly gauge analyses. IMERG provides global precipitation estimates at 0.1° spatial resolution and 30 min temporal resolution from 1998 to present, using the GPM Core Observatory and TRMM satellites as calibration references.
The algorithm propagates PMW-retrieved precipitation fields forward and backward in time through quasi-Lagrangian interpolation, in which the motion vectors are derived from precipitation (PRECTOT), total precipitable liquid water (TQL), and total column water vapor (TQV) fields of the MERRA-2 analyses (Huffman et al., 2026). A Kalman filter subsequently merges these propagated fields with the estimates derived from the global collection of geostationary IR brightness temperatures (Janowiak et al., 2001) to yield weighted half-hourly precipitation estimates (Joyce and Xie, 2011). The Final Run incorporates monthly gauge adjustments from the Global Precipitation Climatology Centre (GPCC), using the Version 2022 gauge analysis (Schneider et al., 2014, 2022), applying spatially varying ratio multipliers that remain constant throughout each month to correct the bias in satellite-based estimates.
The Tropical Rainfall Measuring Mission (TRMM) Multi-satellite Precipitation Analysis (TMPA) research product (3B42) Version 7 (Huffman et al., 2007) provided 3-hourly precipitation estimates at 0.25° × 0.25° spatial resolution between 50° N and 50° S from 1998 to 2019 when its production was discontinued. TMPA combined PMW precipitation estimates from multiple low-Earth-orbit satellites with geostationary IR estimates (Table 2). The individual sensor PMW estimates were intercalibrated by histogram matching to a common reference, the TRMM Combined Instrument, which merges the TRMM Microwave Imager (TMI) and Precipitation Radar (PR), and merged into a single microwave field. Geostationary IR brightness temperatures were then converted to precipitation through spatially varying coefficients calibrated against this merged microwave field, and these IR-based estimates filled the gaps between microwave overpasses. The research product additionally applied a monthly gauge adjustment, scaling the satellite estimates to match the monthly accumulations of the GPCC gauge analysis (Schneider et al., 2014). Because this adjustment applied a single monthly ratio to every 3-hourly field within the month, it constrained the long-term accumulation while preserving the relative sub-daily structure. TMPA is retained despite its discontinued production because, as the predecessor to IMERG, it fills temporal gaps using calibrated infrared estimates rather than propagating microwave retrievals in time. This contrast with IMERG, CMORPH, and GSMaP allows the effect of temporal propagation on sub-daily variability to be assessed across algorithm generations.
The Climate Prediction Center (CPC) Morphing Technique (CMORPH; Joyce et al., 2004) produces global precipitation estimates by integrating PMW precipitation retrievals from multiple low earth orbit satellites (TMI on TRMM, AMSR on AQUA, SSM/I and SSMIS on DMSP F-13–F-18, AMSU and Microwave Humidity Sounder (MHS) on NOAA-15–19 and MetOp-A/B, and MWRI on FY-3B). Unlike other satellite products that directly combine PMW and IR estimates, CMORPH uses cloud motion vectors derived from consecutive geostationary IR brightness temperature images to realize the propagation of PMW retrievals through time and space. The morphing technique employs a time-weighting scheme that blends forward- and backward-propagated PMW estimates, with weights inversely proportional to the temporal distance from the observation time. This approach yields precipitation estimates at 30 min intervals, effectively bridging the gaps between infrequent PMW overpasses. This morphing approach provided the conceptual basis for the propagation scheme later adopted in IMERG (Joyce and Xie, 2011), although the two algorithms have since diverged, with IMERG now deriving its motion vectors from reanalysis fields rather than from geostationary IR (Tan et al., 2019).
This study uses the bias-corrected CMORPH Climate Data Record (CDR) Version 1.0 (Xie et al., 2017), which applies systematic bias correction to the raw satellite estimates. Over land, bias correction is performed through daily-based probability density function (PDF) matching against the CPC Unified Daily Gauge Analysis, which adjusts the statistical distribution of satellite-estimated precipitation rates to match ground-based observations. Over ocean, the Global Precipitation Climatology Project (GPCP) Pentad (5 d) Product is used to carry out the PDF matching technique in two steps: first using climatological correction based on a 15-year dataset, then applying real-time refinement using a 31 d moving window (Xie et al., 2017). The adjustment coefficients, calculated as the ratio between the mean reference field (CPC gauge or GPCP pentad) and the mean raw CMORPH, are downscaled from daily 0.25° resolution to the native 30 min 8 km resolution. The dataset has a global coverage from 60° S to 60° N spanning from January 1998 to the present.
The Global Satellite Mapping of Precipitation (GSMaP) version 8 gauge-calibrated product (GSMaP_Gauge) provides global hourly precipitation estimates at 0.1° × 0.1° spatial resolution between 60° N and 60° S (Kubota et al., 2020). GSMaP retrieves precipitation using PMW radiometer data from the GPM constellation and integrates them with IR observations from geostationary satellites via a Kalman filtering algorithm, which propagates PMW estimates both forward and backward in time (Ushio et al., 2009). The gauge-calibrated version further refines these satellite-based estimates by incorporating daily rain gauge data from the National Oceanic and Atmospheric Administration (NOAA) CPC Unified Daily Gauge Analysis to enhance accuracy over land (Kubota et al., 2022; Lu and Yong, 2020; Mega et al., 2019). Version 8, released in December 2021, introduces substantial improvements including updated PMW retrieval databases, enhanced orographic rainfall estimation, and a normalization module to homogenize retrievals among multiple microwave sensors (Gao et al., 2024; Tashima et al., 2021; Yamamoto and Kubota, 2022). Additionally, the retrieval domain has been extended toward the poles during PMW overpasses.
The Multi-Source Weighted-Ensemble Precipitation (MSWEP) Version 2.8 (Beck et al., 2019) is a merged dataset that integrates gauge observations, satellite products, and reanalysis outputs using a weighted-ensemble methodology. At a 3 h time step and 0.1° spatial resolution, the non-gauge component combines reanalysis output (ERA5) with satellite-based estimates, for which IMERG is used after 2000 and infrared-based estimates derived from GridSat-B1 brightness temperatures are used for the pre-2000 period. The GridSat-based precipitation is obtained by cumulative distribution function matching the infrared brightness temperatures to CMORPH within air-temperature zones, rather than taken as a direct precipitation product. Weights are assigned based on station density for gauge-based components and comparative skill against nearby gauges for satellite and reanalysis components. All possible combinations of datasets are merged through weighted averaging, with cumulative weights calculated to represent the total information content. The merged satellite–reanalysis estimates of each dataset combination are then cumulative distribution function matched at the 3-hourly time scale to a reference distribution based on the Multi-Source Weather (MSWX) product (Beck et al., 2022) to mitigate spurious light rainfall and the underestimation of heavy precipitation.
MSWEP incorporates systematic daily gauge corrections utilizing multiple sources including the Global Historical Climatology Network–Daily (GHCN-D) and the Global Summary of the Day (GSOD) through a multiplicative approach that preserves sub-daily distributions. Notably, the dataset accounts for regional variations in gauge reporting times (ranging globally from 00Z to 12Z), thereby minimizing temporal mismatches between gridded estimates and gauge observations. Monthly climatology corrections are applied using the Climatologies at High Resolution for the Earth's Land Surface Areas (CHELSA; Karger et al., 2017), replacing the WorldClim-based corrections used in earlier versions. MSWEP further corrects systematic terrestrial biases (e.g., gauge undercatch and orographic effects) by inferring catchment-average precipitation from river discharge observations at 13 762 catchments globally, a discharge-based scheme that distinguishes it from the gauge-based undercatch corrections applied in other products (Beck et al., 2019). The dataset provides global coverage at 0.1° and 3-hourly resolution from 1979 onward.
Table 2Description of satellite-based precipitation datasets. Primary data sources include passive microwave (PMW) and infrared (IR) sensors. Temporal resolution of bias correction is indicated in parentheses (D: daily; 5D: 5 d pentad; M: monthly).
2.3 Reanalysis datasets
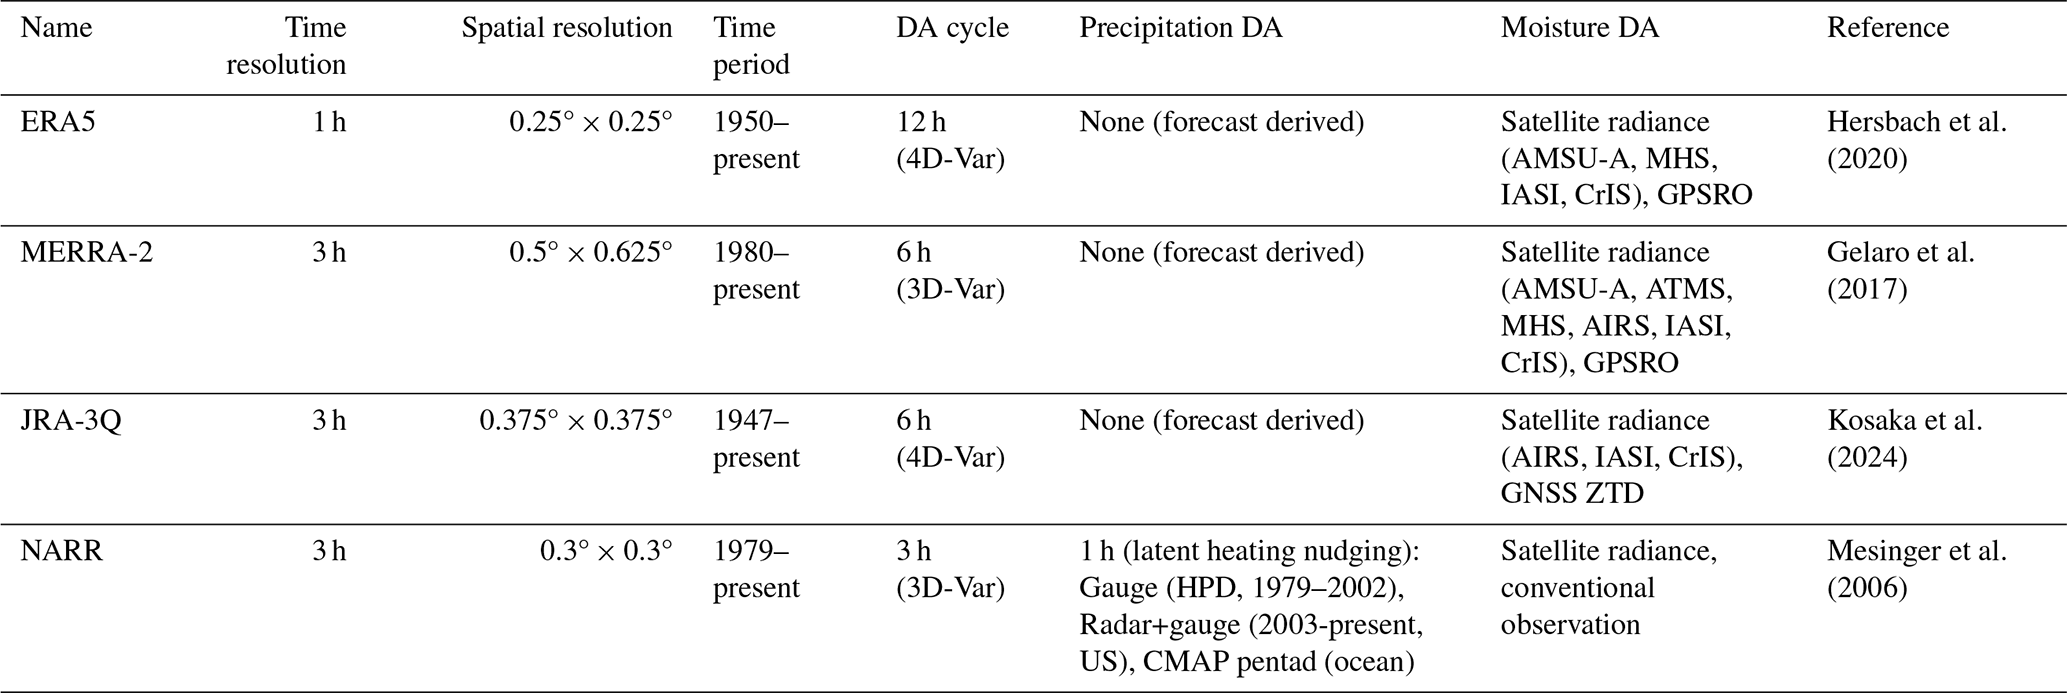
The European Centre for Medium-Range Weather Forecasts (ECMWF) Reanalysis Version 5 (ERA5; Hersbach et al., 2020) provides global hourly atmospheric estimates from 1950 to present. It employs the Integrated Forecasting System (IFS) Cycle 41r2 with a hybrid incremental four-dimensional variational (4D-Var) data assimilation scheme, assimilating observations with 12 h assimilation windows (09:00–21:00 UTC and 21:00–09:00 UTC). The atmospheric model has 0.25° × 0.25° horizontal resolution with 137 hybrid sigma-pressure vertical levels extending from the surface to 0.01 hPa. ERA5 reanalysis incorporates the Hydrology Tiled ECMWF Scheme for Surface Exchanges over Land (H-TESSEL) to simulate land surface variables, utilizing a weakly coupled land data assimilation system to adjust soil moisture and snow depth with screen-level temperature and humidity observations (Balsamo et al., 2009). Notably, ERA5 precipitation is derived from 18 h forecasts initialized twice daily (06:00 and 18:00 UTC), with hourly outputs accumulated from the first 12 h (1–12 h lead time) (Lavers et al., 2022; Soci et al., 2024). Each hourly value corresponds to a forecast lead time of 1–12 h, depending on its temporal proximity to the initialization. Crucially, precipitation observations are not directly assimilated; instead, precipitation is generated as a diagnostic output from the model physics.
The Modern-Era Retrospective Analysis for Research and Applications, Version 2 (MERRA-2), is NASA's global atmospheric reanalysis produced by the Global Modeling and Assimilation Office (GMAO), providing data from 1980 to the present at 0.5° × 0.625° horizontal resolution with hourly temporal resolution (Gelaro et al., 2017). The system utilizes the Goddard Earth Observing System Model, Version 5 (GEOS-5; Molod et al., 2015) with a 6-hourly assimilation window based on the Gridpoint Statistical Interpolation scheme (Wu et al., 2002) and Incremental Analysis Update (IAU) methodology (Bloom et al., 1996). The assimilation system incorporates extensive conventional and satellite-based atmospheric observations, including modern microwave sounders such as the Advanced Microwave Sounding Unit (AMSU-A), Advanced Technology Microwave Sounder (ATMS), and MHS that provide atmospheric temperature and humidity profiles, and hyperspectral infrared radiance instruments such as the Atmospheric Infrared Sounder (AIRS), Infrared Atmospheric Sounding Interferometer (IASI), and Cross-track Infrared Sounder (CrIS) that provide temperature and moisture sounding information. Precipitation fields are generated as a diagnostic output from model physics, without direct correction or assimilation of precipitation observations (Table 3).
The Japanese Reanalysis for Three Quarters of a Century (JRA-3Q) is the third global atmospheric reanalysis produced by the Japan Meteorological Agency (JMA), covering September 1947 to present at TL479 (∼ 0.375°) horizontal resolution (Kosaka et al., 2024). JRA-3Q builds upon its predecessor Japanese 55-year Reanalysis (JRA-55; Kobayashi et al., 2015), by incorporating three major updates: (1) an updated forecast model and data assimilation system based on the JMA operational numerical weather prediction system since December 2018, (2) improved boundary conditions, including updated sea surface temperature and sea ice datasets, and (3) the assimilation of additional observations including Global Navigation Satellite System (GNSS) zenith total delay (ZTD) for atmospheric water vapor, GNSS radio occultation (up to 60 km altitude), airport surface pressures, and hyperspectral infrared sounder radiances (e.g., AIRS, IASI, CrIS) for temperature and humidity profiles. The reanalysis employs a 4D-Var data assimilation system using the JMA Global Spectral Model (GSM), with assimilation cycles every 6 h (00:00, 06:00, 12:00, and 18:00 UTC).
The North American Regional Reanalysis (NARR), produced by NOAA's National Centers for Environmental Prediction (NCEP), provides regional atmospheric data over North America from 1979 to present at ∼ 32 km horizontal resolution and 3-hourly temporal resolution (Mesinger et al., 2006). NARR employs the NCEP Eta Model with a three-dimensional variational (3D-Var) data assimilation system, cycling every 3 h where the 3 h forecast from the previous cycle serves as the first guess. Unlike global reanalyses, NARR assimilates precipitation observations via a latent heating nudging technique (Lin et al., 1999). This method converts observed precipitation into vertical profiles of latent heating, which are then nudged into the model's temperature tendency equation during the forecast step. Over the continental United States, the system assimilates the Hourly Precipitation Dataset (HPD) and Parameter-elevation Regressions on Independent Slopes Model (PRISM; Daly et al., 1994) daily precipitation incorporating diurnal patterns from the Global Reanalysis 2 (GR2) forecasts when the HPD data is unavailable. For Canada and Mexico, GR2-based diurnal patterns are similarly applied to daily national gauge data. Over oceanic regions (south of 27.5° N), Climate Prediction Center Merged Analysis of Precipitation (CMAP) pentad data (Xie and Arkin, 1997) are assimilated; however, north of 42.5° N, precipitation assimilation is omitted due to uncertainties in the CMAP product in high latitudes.
Table 3Description of reanalysis precipitation datasets (DA: data assimilation).
To ensure consistent intercomparison across all precipitation datasets, we perform both spatial and temporal harmonization. All datasets, regardless of their original format (gridded products, point observations, or reanalysis outputs), are remapped to a common spatial resolution of 0.5° × 0.625° (matching the MERRA-2 grid) using bilinear interpolation. This method efficiently transforms heterogeneous inputs onto a unified grid while preserving spatial continuity, thereby minimizing scale-dependent representativeness errors (Gervais et al., 2014; Tustison et al., 2001).
All precipitation products are standardized to 3-hourly accumulated totals (mm 3 h−1). Datasets provided as precipitation rates (e.g., mm s−1, kg m−2 s−1) are converted to mm h−1 and accumulated over 3 h windows, while those originally supplied as 3-hourly accumulations are used directly. This harmonization protocol ensures that discrepancies between products reflect intrinsic variations in retrieval algorithms and data sources rather than inconsistencies in resolution or units (Pradhan et al., 2025). After this data pre-processing, diurnal cycle analyses are restricted to rainy days (daily precipitation ≥ 0.275 mm d−1) to exclude unreliable signals from weak precipitation signals (Watters et al., 2021).
This study focuses exclusively on the boreal summer season (June–August; JJA), when diurnal precipitation variability is strongest over Northern Hemisphere land. Analysis periods vary due to data availability: CMORPH and GSMaP (1998–2023), TMPA (1998–2019), IMERG (1998–2023) and MSWEP (2000–2023), and all reanalysis products (2000–2023). Previous studies suggest that a stable diurnal cycle can be derived from just a few years of data (Covey et al., 2016; Dai et al., 2009; Tang et al., 2021), supporting the robustness of cross-period comparisons despite differences in temporal coverage among datasets. To further assess the sensitivity of the results to the choice of analysis period, we conducted sensitivity tests by restricting selected datasets to non-overlapping sub-periods (e.g., CMORPH: 1998–2007 and 2013–2022) and comparing the resulting diurnal phase estimates against those derived from the full analysis period. The mean phase difference between sub-periods and the full-period analysis is less than 1 h across all tested datasets, confirming that the diurnal cycle characteristics are not substantially sensitive to the choice of analysis period (not shown).
3.1 Sub-daily variance decomposition
To quantify the relative contribution of sub-daily (period < 24 h) variations to the TP variability, a 30th-order Butterworth high-pass filter with a cutoff period of 26 h (Oppenheim and Schafer, 2010) is applied, separating sub-daily frequency components from relatively lower-frequency components (period ≥ 24 h, including daily mean), where their respective variances are denoted by and . The mathematical formulation of the sub-daily variance ratio (ratsubD) is followed as:
where is the variance of the unfiltered time series.
Following Dong et al. (2023) and Covey et al. (2018), is further decomposed into the regular sub-daily variance (), associated with the climatological mean diurnal cycle, and the irregular sub-daily variance (), representing sub-daily fluctuations that deviate from the climatological mean diurnal cycle on individual days:
The regular component is defined as the variance of the climatological mean diurnal cycle , obtained by averaging the high-pass filtered precipitation time series over all days at each time of day i:
where N is the number of sub-daily time steps per day (N=8 for 3-hourly temporal resolution), D is the total number of days, and is the daily mean of . The irregular component is obtained as the residual:
The regular component is further decomposed into Fourier harmonics via Fast Fourier Transform. Since is a periodic sequence with period N, its variance decomposes as:
where and correspond to the diurnal (24 h), semidiurnal (12 h) cycles, respectively, and is the residual variance from higher-order harmonics (period ≤ 8 h).
3.2 Characterization of regular sub-daily components
UTC-based time coordinates are converted to Local Solar Time (LST; tLST) to explicitly account for the solar forcing of diurnal precipitation (LST = UTC , where λ is the longitude in degrees). As 3-hourly time series require an adjustment to align with the discrete time steps, we first calculate , round the result to the nearest integer, and subsequently multiply by 3. This conversion ensures that the diurnal cycle is analysed relative to local solar noon rather than a fixed UTC reference. Such alignment is critical for identifying physically meaningful precipitation phases driven by solar heating.
The sub-daily precipitation is characterized through harmonic analysis, where the precipitation time series are decomposed into Fourier components at each grid point (Cui et al., 2021; Dai, 2001):
where is the daily-mean precipitation, Ak and φk are the amplitude and phase of the k-th harmonic, N is the number of time samples per day (N=8 for 3-hourly data), and . For instance, the 1st harmonic (k=1, 24 h period) represents the primary diurnal signal, while the 2nd harmonic (k=2, 12 h period) captures semi-diurnal variability.
To characterize the relative contribution of individual harmonic components within , Eq. (6), the fractional contribution of each harmonic component to is defined as:
We quantify the relative dominance of variance at specific frequency bands within the regular sub-daily variability (e.g., 1st (k=1), 2nd (k = 2), and high-order (k≥3) harmonics), thereby enabling an assessment of the fidelity of various datasets in capturing the observed spectral balance.
To assess the adequacy of the 1st harmonic component in representing the observed diurnal cycle, we use the rat1. Regions where rat1 ≥ 50 % indicate that the 24 h periodic component accounts for at least half of . The full hierarchy of the variance decomposition described in Sect. 3.1 and Sect. 3.2 is summarized in Fig. 3.
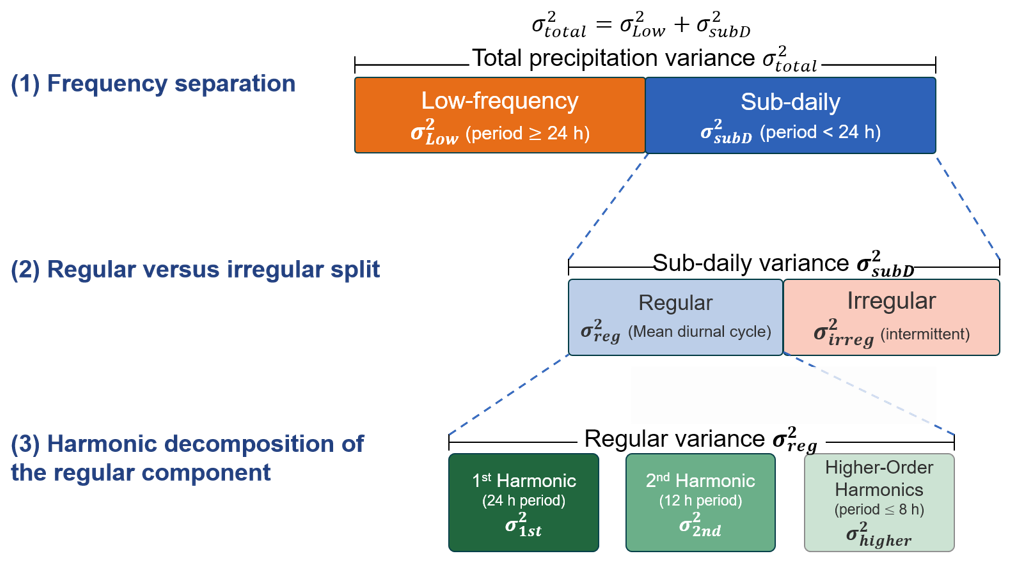
Figure 3Schematic of the sub-daily precipitation variance decomposition, showing the method applied at each tier and the corresponding equations in Sect. 3.1 and 3.2. Box widths are uniform and do not indicate the relative magnitude of each component.
3.3 Evaluation of diurnal phase and amplitude
Gridded satellite-based and modelled datasets are evaluated against ground-based observations with respect to the diurnal characteristics of precipitation phase and amplitude. For phase evaluation, we account for the circular nature of the diurnal cycle by calculating the circular mean bias and circular correlation coefficient. The circular mean bias is computed by converting precipitation peak phase into angular values, determining the circular mean difference between the datasets and observation, and subsequently converting the angular difference back to hours. This approach properly resolves periodicity issues, for instance, recognizing that 23:00 LST and 01:00 LST are only 2 h apart rather than 22 h. Furthermore, we assess the spatial representation of diurnal phase in the datasets using the circular correlation coefficient (Fisher and Lee, 1994). Its mathematical formulation is followed as:
where θ and ϕ represent the diurnal phase, expressed by the azimuthal angle (in radians), from the dataset and observations at each grid cell (i) and the overbar represents the circular mean. The circular correlation coefficient ranges from −1 to +1, where values close to +1 indicate robust agreement in the spatial patterns of the diurnal phase. Statistical significance is assessed via the Fisher-Lee test, which approximates the distribution of the circular correlation under the null hypothesis of no association.
For amplitude evaluation, conventional linear statistics are employed, given that amplitude values are non-circular continuous variables. The mean bias is calculated as the arithmetic mean of differences between the dataset and observed amplitudes across all stations, while spatial correlation is quantified using Spearman's rank correlation coefficient. Spearman's method is preferred over Pearson correlation due to its robustness to outliers and independence from linear assumptions, making it particularly appropriate given the high variability of precipitation amplitudes across different climate regimes.
3.4 Atmospheric water budget framework
To elucidate the physical processes underlying the occurrence of diurnal precipitation, the diurnal variations of atmospheric variables controlling moisture availability and convective triggering are examined. CAPE and CIN are computed with MetPy (May et al., 2022) using a surface-based parcel on the pressure levels common to all four reanalyses, namely 1000, 925, 850, 700, 500, and 400 hPa, with the parcel lifted from the lowest level available at each grid point. Following the atmospheric water budget framework (Song and Wei, 2021), the vertically integrated moisture flux convergence (MFC) is derived as a residual from the water budget equation:
where E is evapotranspiration, P is precipitation, and dPWt is the tendency of atmospheric precipitable water (PW), estimated as . For the observational reference at the ARM SGP site, E is derived from the latent heat flux of the VARANAL product, P from ARMBEATM, and PW from IGRA2 radiosonde observations for each reanalysis product, the corresponding variables from each dataset are used.
MSE is also examined as an integrated measure of the thermodynamic state of the atmosphere. Notably, MSE is considered approximately conserved during adiabatic vertical motions and consists of sensible and latent heat, and geopotential energy, followed as:
where Cp is specific heat at constant pressure, T is temperature, g is gravitational acceleration, z is geopotential height, Lv is the latent heat of vaporization, and q is specific humidity. MSE is computed over the range 925–400 hPa, effectively representing the thermodynamic conditions of the lower-to-middle troposphere essential for convective triggering.
4.1 Precipitation variability in sub-daily time scales
4.1.1 Partitioning of the total variance
Total variance of precipitation at observational sites over NH land during boreal summer is 0.87 mm2 h−2 (Fig. 4a), whereas most precipitation datasets underestimate this variance, and the underestimation is more apparent in the reanalysis products. In contrast, TMPA overestimates the variance. It retains PMW estimates where available and fills the remaining grid boxes with IR estimates calibrated against the PMW estimates (Huffman et al., 2007). The data source at a given grid box can therefore switch between PMW and IR across successive 3-hourly time steps, potentially introducing source-dependent differences in the statistical properties of the resulting time series. This source switching, together with variability in the TRMM Combined Instrument estimates used both as input and as the calibration reference, as well as in the PMW retrievals from the Goddard Profiling Algorithm and the IR estimates, likely contributes to the excess variance. The underestimation of total variance is primarily attributed to the underestimated despite the underestimation of . For instance, while from satellite-based datasets is comparable to observations, they generally underestimate , with the notable exception of TMPA. For reanalysis products, ERA5 reproduces only 64 % of the observed and a mere 28 % of the observed . In contrast, MERRA-2 exhibits the most substantial underestimation, capturing only 46 % of the observed and 13 % of the relative to observations.
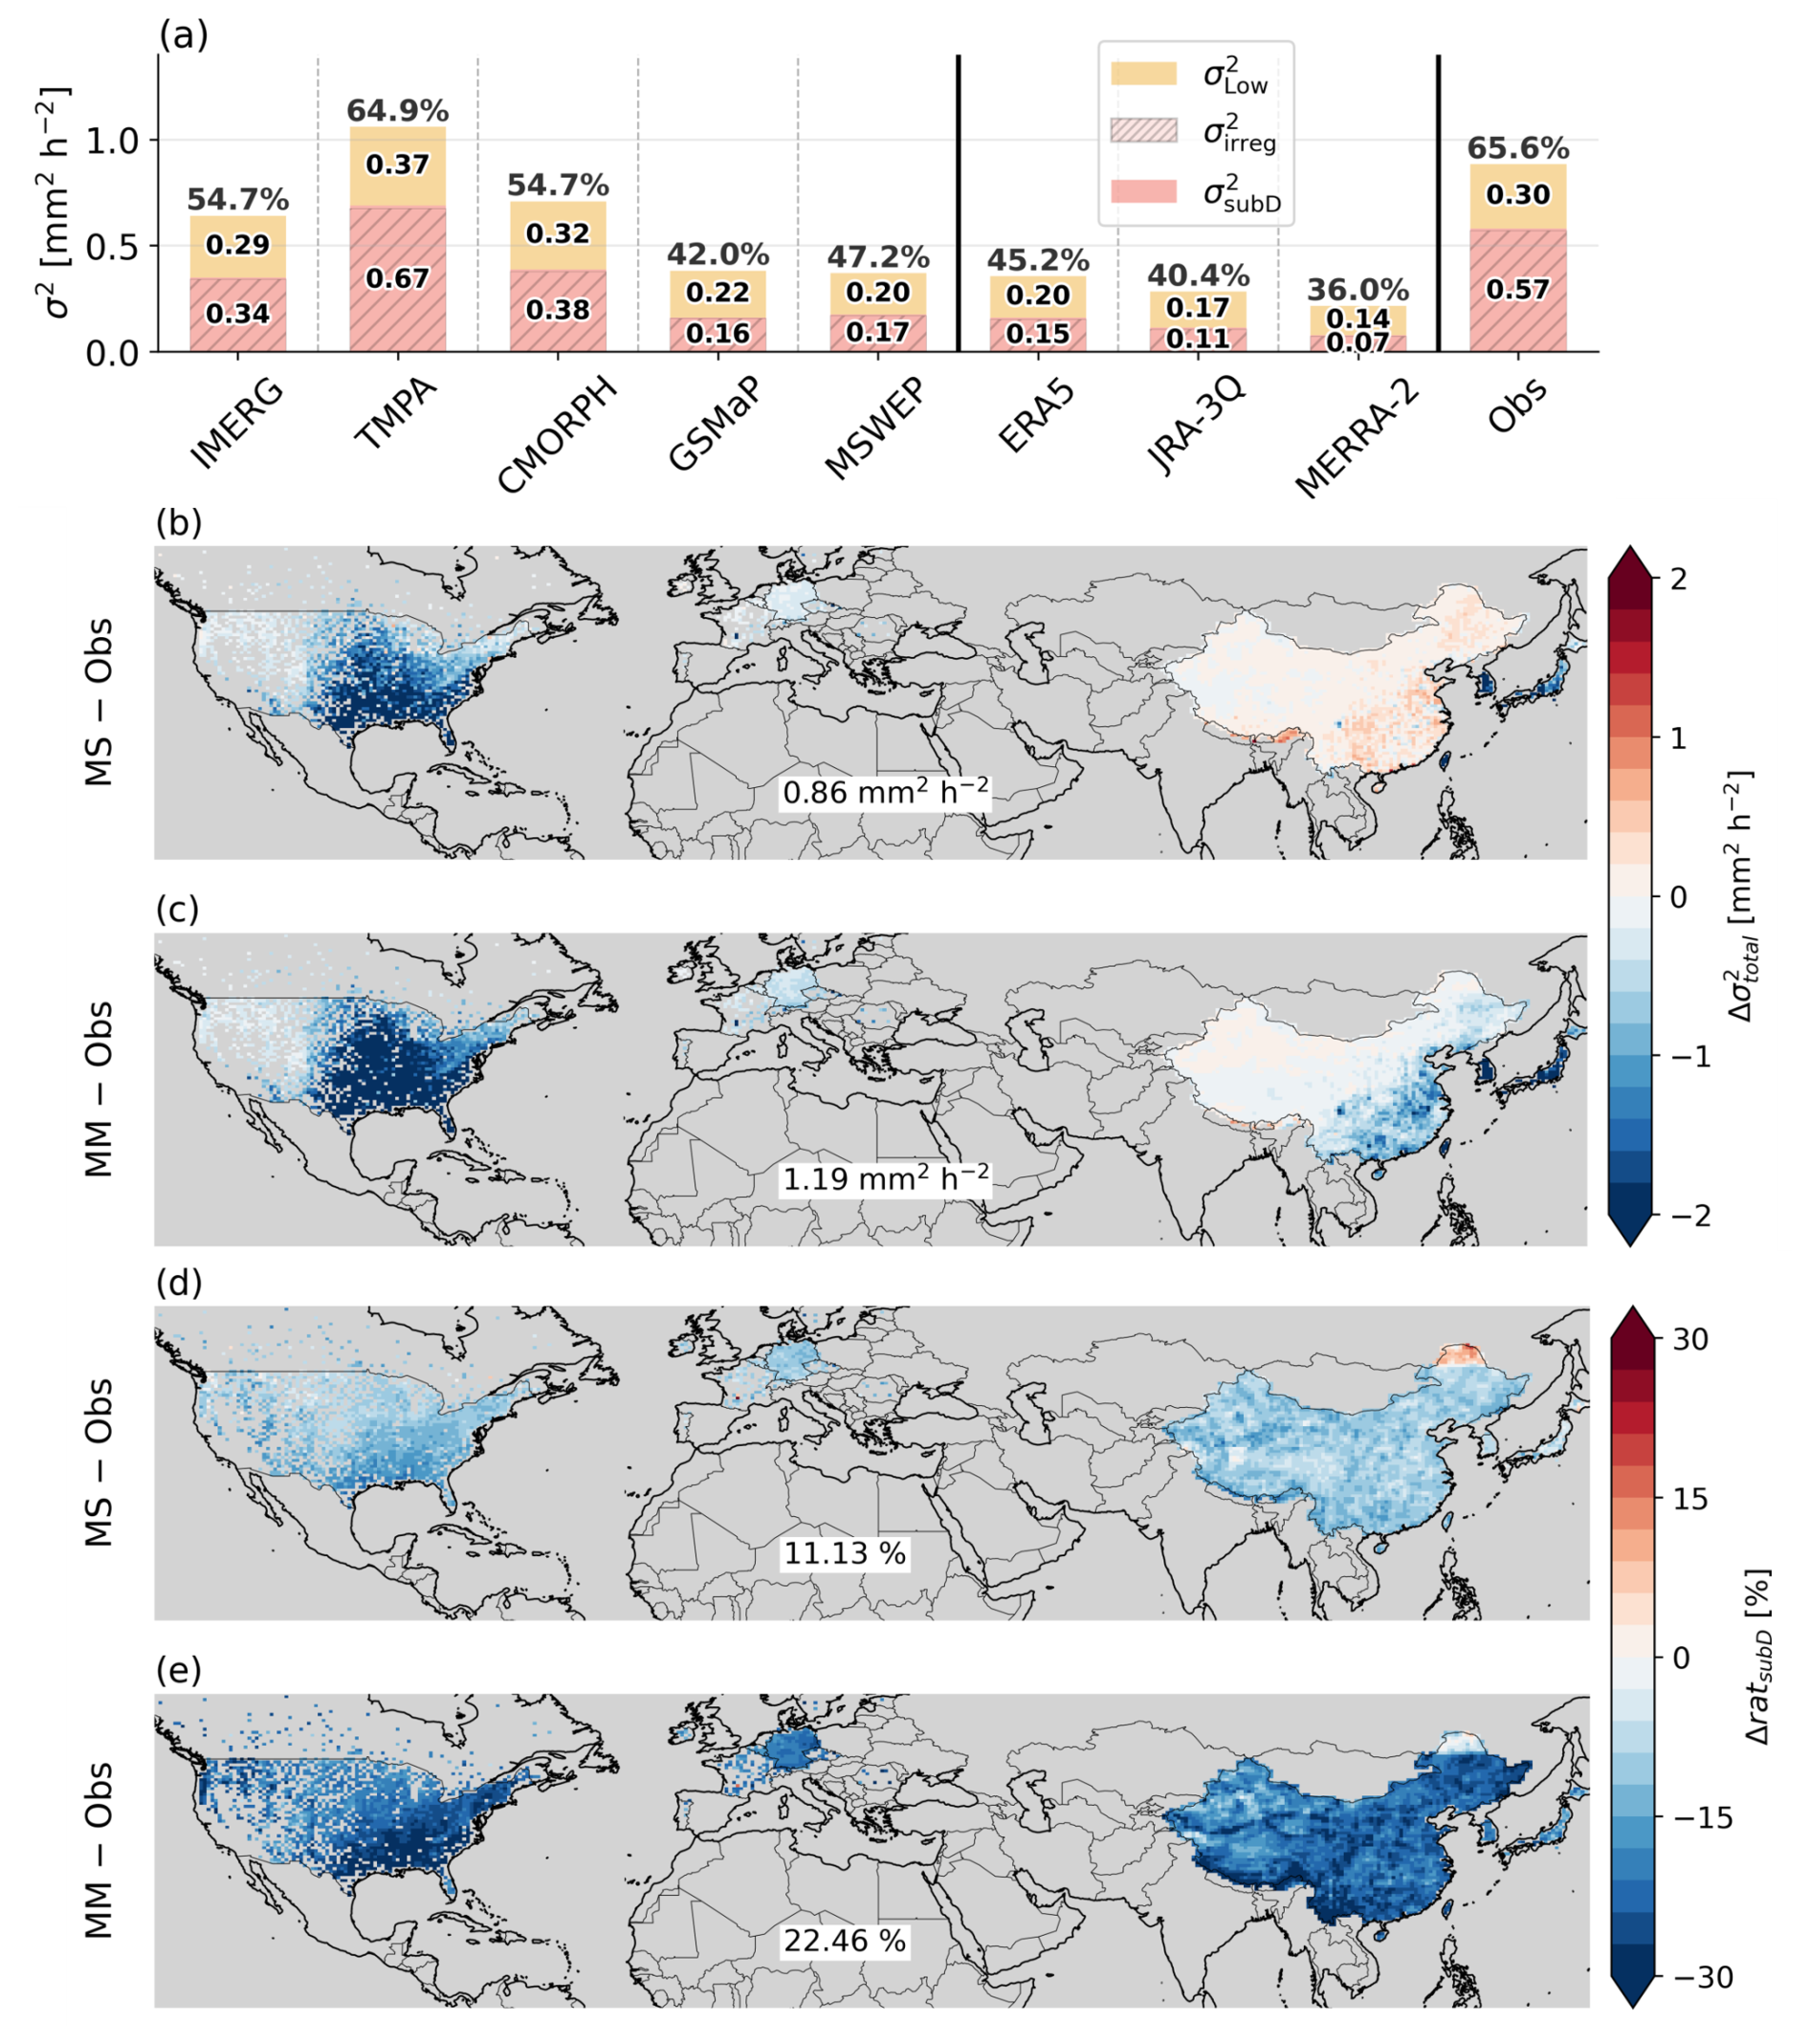
Figure 4(a) Sub-daily (pink) and lower-frequency (orange) variance components of precipitation at observation locations. Sub-daily frequency variance is obtained via high-pass Butterworth filter. Numbers inside bars indicate variance magnitude mm2 h−2, and percentage above bars represent the sub-daily variance ratio (ratsubD). Differences from the ground-based observations, for (b, d) the Multi-Satellite (MS; IMERG, TMPA, CMORPH, GSMaP, MSWEP) and (c, e) the Multi-Model (MM; ERA5, JRA-3Q, MERRA-2) mean, in terms of (b, c) total variance () and (d, e) ratsubD, where the spatial averaged value is noted in each panel below.
Further decomposing into regular () and irregular () components provides additional insight into the source of this underestimation. In observations, accounts for approximately 98 % of , indicating that the repeatable diurnal signal is overwhelmed by day-to-day variability in sub-daily precipitation. While convective intermittency and irregular occurrence of MCSs are likely dominant contributors over land (Covey et al., 2018), other sources (e.g., synoptic-scale forcing variability) also project onto . also exhibits considerable deviation from observations across all datasets. Notably, despite the more severe underestimation of in reanalysis products relative to satellite-based datasets, the relative contribution of within is overestimated in reanalysis products (5 %–8 %) than in satellite-based datasets (2 %–3 %). The disparity in underestimation between and , and particularly the underrepresentation of , is primarily attributed to two factors. First, satellite-based datasets, where gauge-based observations are typically assimilated to correct relatively low-frequency variations (e.g., daily, pentad, and monthly), leave sub-daily scales less constrained. Second, for reanalysis products, the underestimation of is further exacerbated by the inherent limitations of parameterization schemes in capturing precipitation physics at relatively coarse spatial resolutions (Herold et al., 2016; Skok et al., 2016). These constraints lead to an excessive frequency of light precipitation, which hinders the simulation of intense rainfall during sub-daily time scales (Chen et al., 1996; Dai, 2006; Stephens et al., 2010).
The spatially aggregated statistics in Fig. 4a do not indicate where these discrepancies arise, so the Multi-Satellite (MS) and Multi-Model (MM) means are differenced against the ground-based observations over the regions of dense gauge coverage (Figs. 4b–e). Both product groups underestimate over most of Contiguous United States (CONUS), and the deficit is largest over the central and eastern plains, where it exceeds 1.5 mm2 h−2 in MM (Fig. 4b, c). Warm-season precipitation in this region is dominated by organized convective systems that initiate over the Rockies and propagate eastward overnight (Houze, 2004), so an inability to reproduce the intensity of these systems maps directly onto a deficit in total variance. East Asia separates the two product groups more clearly than CONUS: MS remains broadly consistent with the observations across China, whereas MM still exhibits underestimation over southeastern China. The spatial root-mean-square error (RMSE) summarizes this contrast, at 0.86 mm2 h−2 for MS against 1.19 mm2 h−2 for MM. For the ratsubD, both MS and MM underestimate the observations across nearly the entire valid domain. Spatial RMSE values are 11.46 % for MS and 22.13 % for MM (Fig. 4d, e), with MM showing both a larger magnitude and a more spatially extensive deficit. The ratio of the MM to MS spatial RMSE rises from 1.4 for to 2.0 for ratsubD, indicating that reanalysis products depart from the observations more in the frequency partitioning of the variance than in its total magnitude.
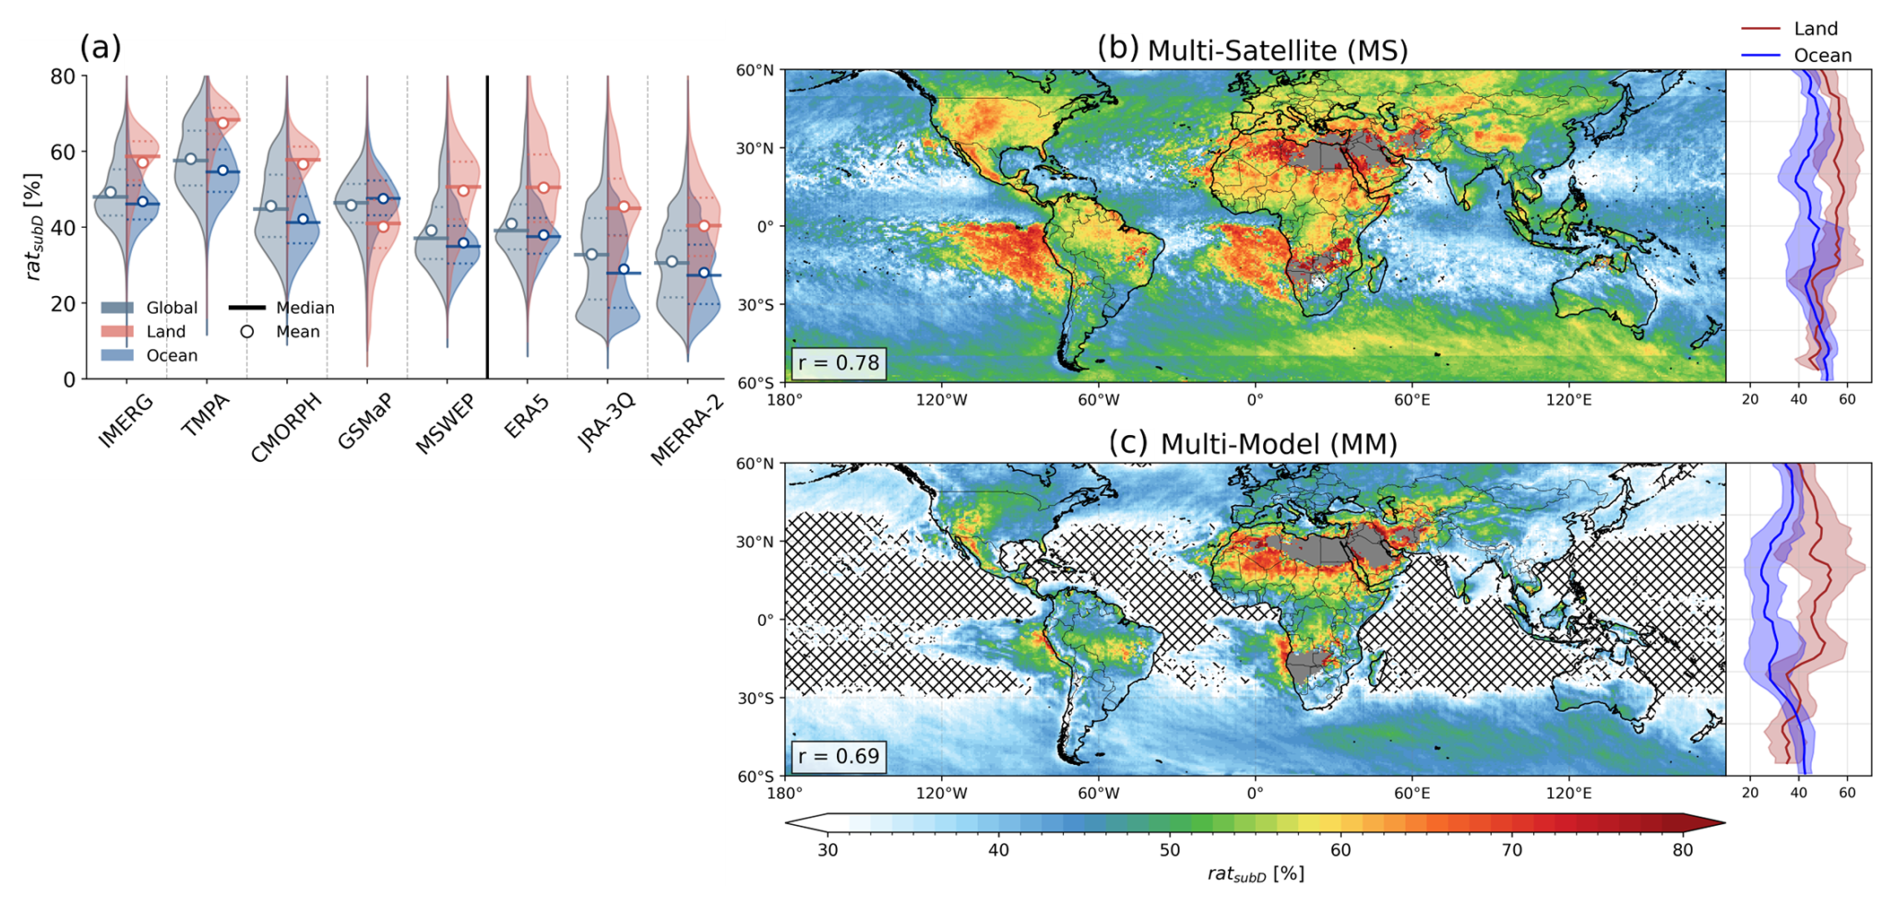
Figure 5(a) Violin plots of the ratsubD distribution for each dataset over the globe (black, left side), land (red, right side), and ocean (blue, right side), where the thick solid line and circle indicate the median and mean, respectively, and dashed lines denote the 25th and 75th percentiles. Spatial distribution of ratsubD from (b) MS and (c) MM, where crossed areas indicate ratsubD is below 30 %. The spatial correlation of both products against ground-based observations is denoted in the lower left of each panel. The zonal averaged distribution over the land (red) and ocean (blue) is displayed on the right of each panel and shading represents ±1 standard deviation.
The observed ratsubD, quantifying the relative contribution of sub-daily precipitation variability against its total variance, exhibits that 65.6 % of total variance is explained by both systematic diurnal and irregular high-frequency fluctuations. This result serves as a benchmark for evaluating whether datasets accurately reproduce the temporal partitioning of precipitation variability. All satellite-based and reanalysis datasets underestimate the observed ratsubD, with modeled products consistently falling below 50 % of the observed value (ERA5: 45.2 %, JRA-3Q: 40.4 %, MERRA-2: 36.0 %). Regarding the land-ocean contrast, ratsubD over land exceeds that over the ocean in most datasets (Fig. 5a). Most land regions exhibit relatively strong sub-daily precipitation variability relative to the ocean, reflecting greater intensity and frequency of convective precipitation events over land (Li et al., 2025). The lower tail of the negatively skewed distribution corresponds to areas where large-scale dynamics or orographic effects suppress typical diurnal signals. Conversely, oceanic distributions are positively skewed, indicating that while most regions exhibit low ratsubD values reflecting the relatively larger contribution of day-to-day precipitation variability to total variance over the ocean (Covey et al., 2018), the upper tail corresponds to specific areas where reduced low-frequency variability yields disproportionately high sub-daily fractions. GSMaP stands out as a notable exception, exhibiting a reversed land–ocean contrast in ratsubD with a lower median over land than over ocean. This may stem from a combination of two land-specific characteristics of the GSMaP retrieval and calibration system. First, GSMaP is known to exhibit a systematic intensity-dependent bias over land, which overestimates light precipitation frequency while underestimating heavy precipitation intensity (Chen et al., 2019; Ning et al., 2017; Pradhan et al., 2025). It suppresses the physical amplitude of both the regular diurnal cycle and the episodic high-frequency fluctuations relative to other satellite products. Second, the gauge calibration of GSMaP is applied exclusively over land, where the hourly rates are optimized so that their 24 h accumulation matches the daily CPC gauge totals (Mega et al., 2019). Because this optimal-estimation scheme adjusts each hour unevenly rather than applying a single daily multiplier, it can reshape the relative magnitudes of the sub-daily fluctuations over land, while the ocean, lacking gauge constraints, retains its original sub-daily structure. In contrast, IMERG adjusts its half-hourly estimates so that they sum to the monthly satellite-gauge combination, applying a single ratio multiplier that is fixed throughout the month (though spatially varying) to every half-hour within that month (Huffman et al., 2026). Because the same factor scales all half-hours equally, the relative sub-daily structure is preserved. Similarly, CMORPH adjusts distributional shape through probability density function matching without constraining hourly magnitudes (Xie et al., 2017).
The ratsubD spatial patterns from MS and MM reveal distinct regional characteristics (Fig. 5b, c). Both product suites represent the pronounced geographic pattern of strong sub-daily variability in land regions where ratsubD reaches approximately 50 %. The reanalysis products exhibit globally lower ratsubD compared to satellite-based datasets, particularly pronounced over the ocean. In the zonally averaged distribution, satellite-based products show relatively uniform ratsubD meridionally both land and ocean areas. In contrast, the modelled distribution displays a pronounced meridional gradient, characterized by distinct disparities between land and ocean, particularly in the tropics. In terms of spatial agreement with ground-based observations over NH land, the MS demonstrates superior performance over the MM, with a spatial correlation of 0.78 compared with 0.69.
4.1.2 Harmonic composition of the regular component
Although dominates across all datasets (Fig. 4a), the regular component is of particular diagnostic value as it encodes the physically interpretable periodic structure of sub-daily precipitation variability including the diurnal and semi-diurnal cycles that are directly linked to surface thermal forcing, boundary layer dynamics, and atmospheric tides. The absolute magnitude of each harmonic component of reveals more pronounced differences than the composition ratios (Fig. 6a), with CMORPH (0.0104 mm2 h−2) showing the closest agreement with observations (0.0094 mm2 h−2) among satellite-based products. Among the reanalysis products, all show smaller absolute values of than the observations, with MERRA-2 exhibiting the lowest value (0.0046 mm2 h−2). ERA5 shows a larger contribution of relative to other datasets.
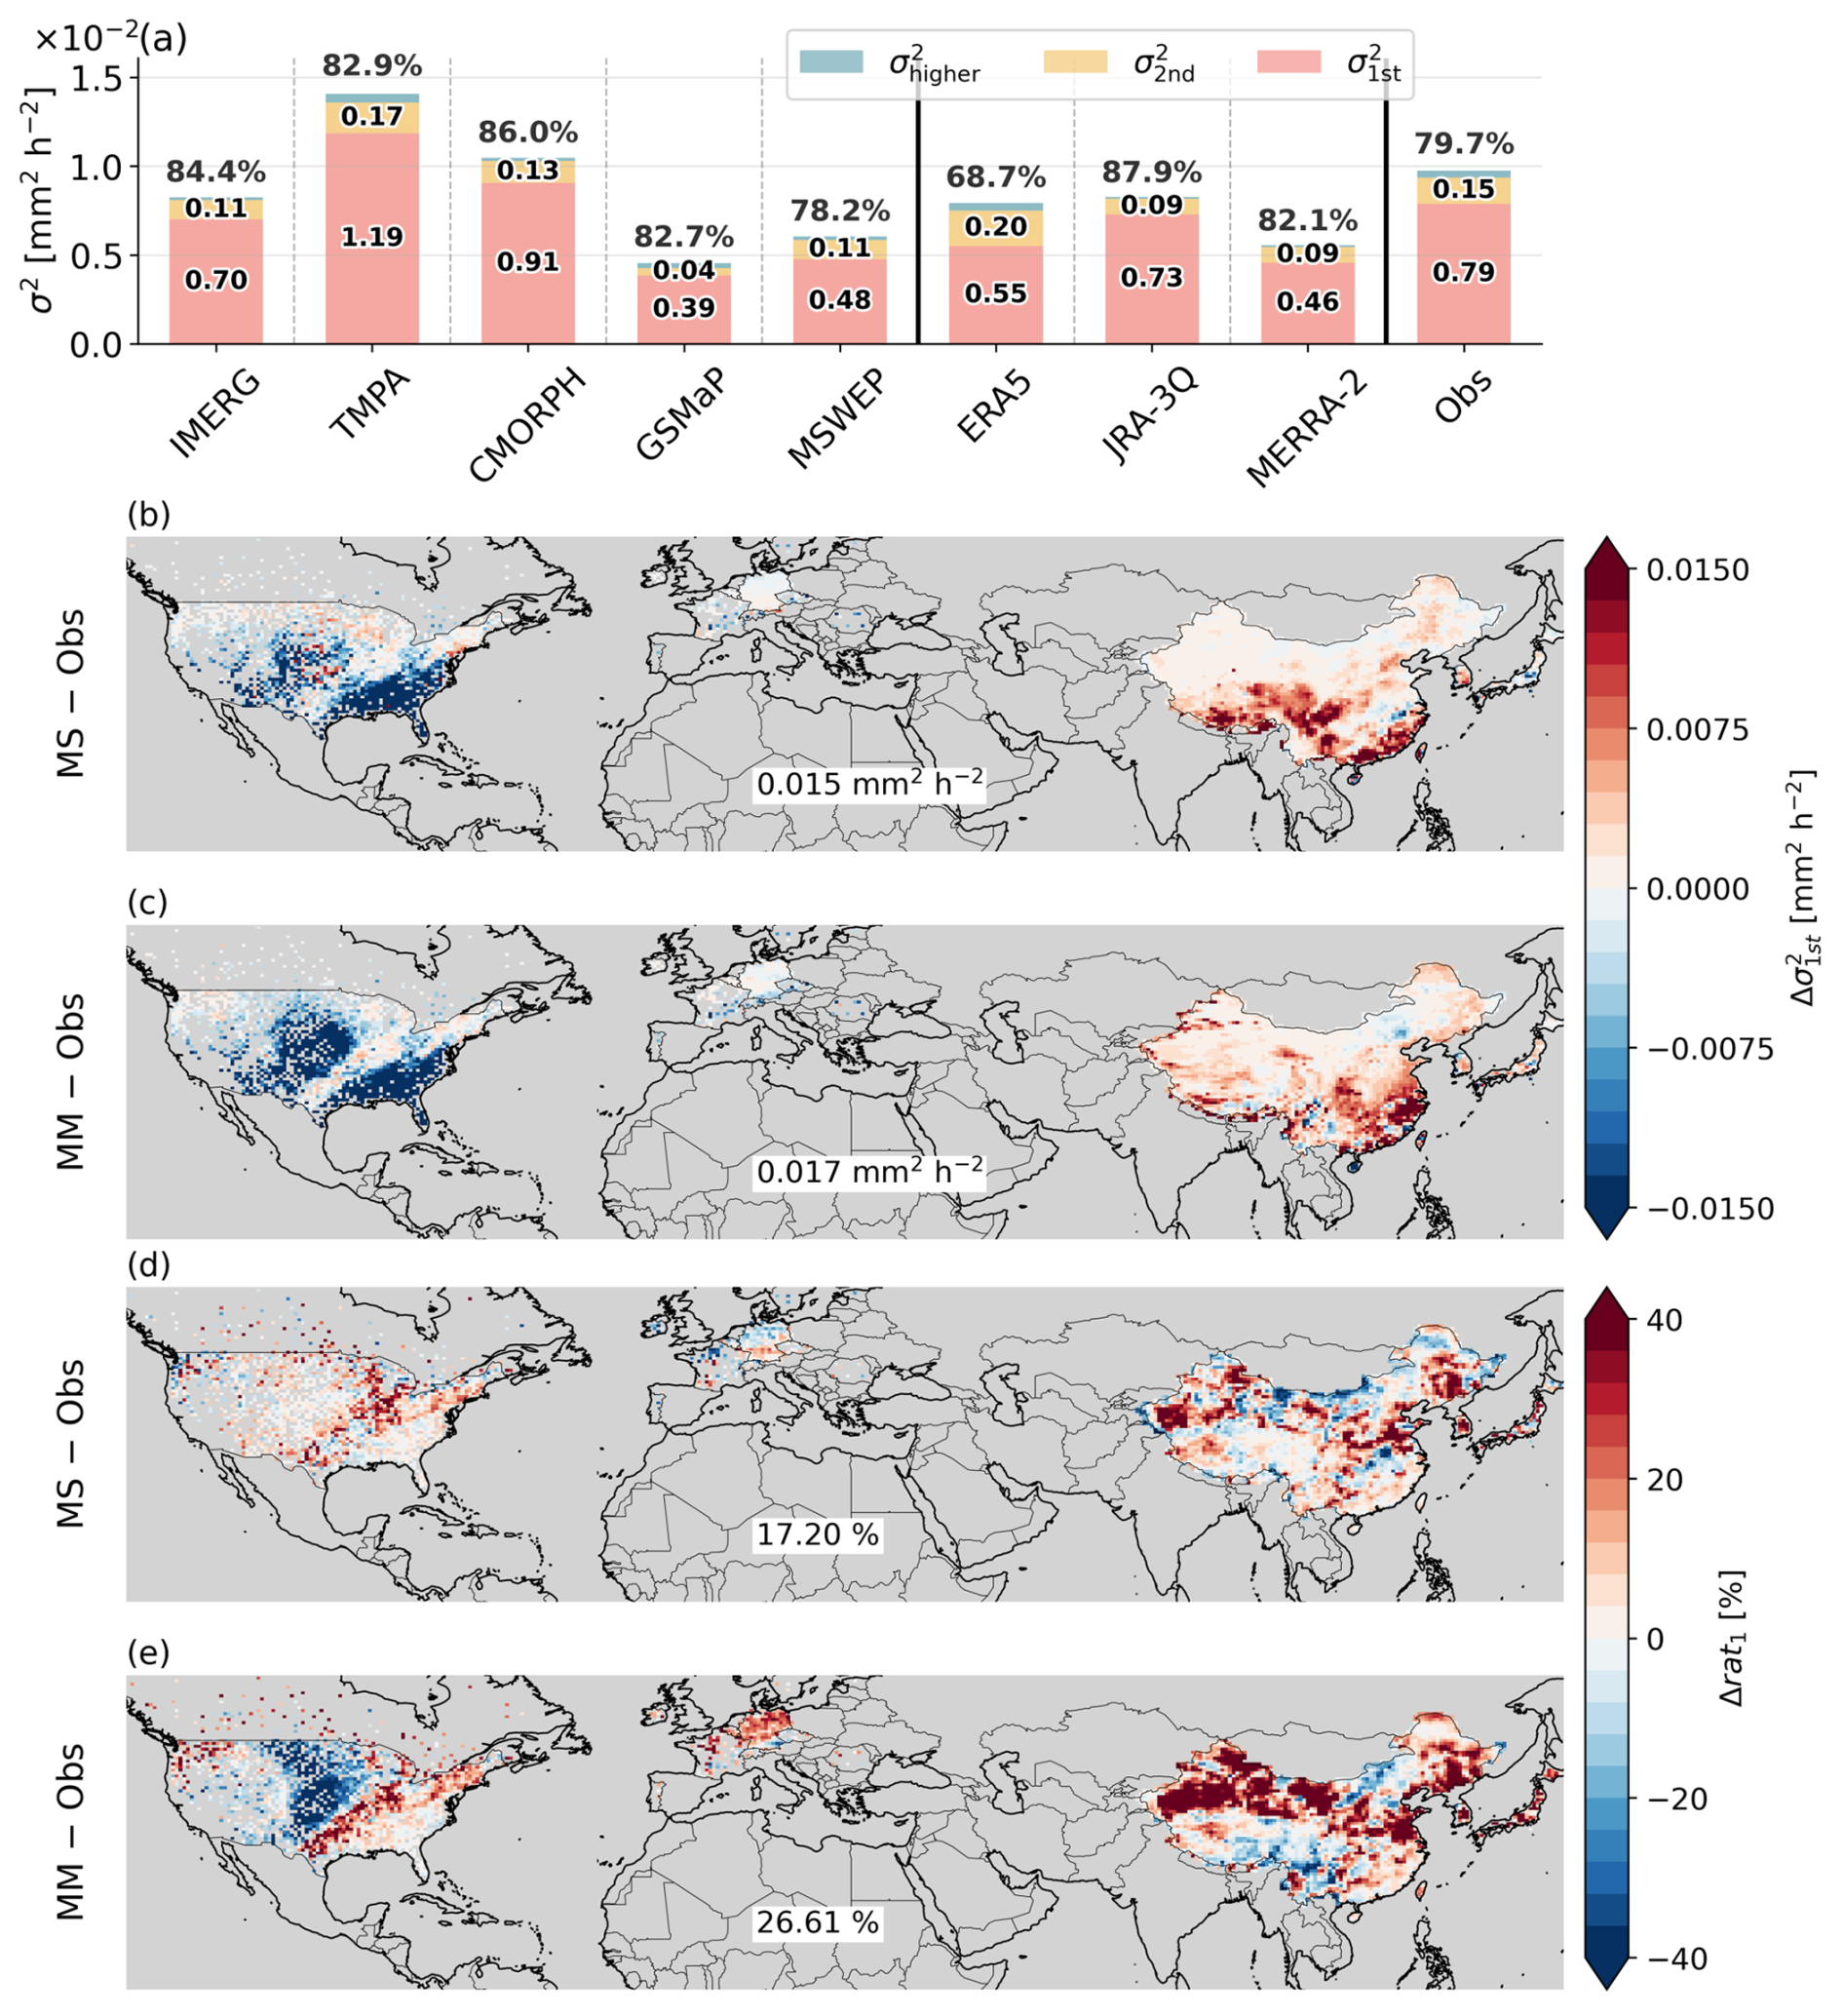
Figure 6(a) Same as Fig. 4a, but for regular sub-daily precipitation variance () decomposed into the 1st (pink), 2nd (orange), and higher-order (blue) harmonic components. (b–e) Same as Fig. 4b–e, but for (b, c) the 1st harmonic variance () and (d, e) its fractional contribution to (rat1).
The regional structure of the difference partly follows that of . Both MS and MM underestimate from the GP to the southern CONUS, with MM showing the larger deficit over a spatially more extensive area (spatial RMSE of 0.015 and 0.017 mm2 h−2, respectively), indicating that the nocturnal convective systems noted above are underestimated in their diurnal amplitude and not only in their total variance. Over China, MS overestimates over southern China, while MM overestimates it more extensively across central and southeastern China, even though is underestimated there (Fig. 4c). The 1st harmonic is therefore not uniformly underestimated across all gridded products. For the rat1, both MS and MM overestimate it over most of the validation domain, with spatial RMSE values of 17.20 % for MS and 26.61 % for MM, and with the largest values over interior and northern China. An overestimated rat1 indicates that is carried almost entirely by the diurnal harmonic, so the second and higher-order components remain weaker than observed and the diurnal cycle is represented as smoother than it actually is. The GP is the exception, where MM underestimates rat1 over the same area in which is most underestimated (Fig. 6c, e).
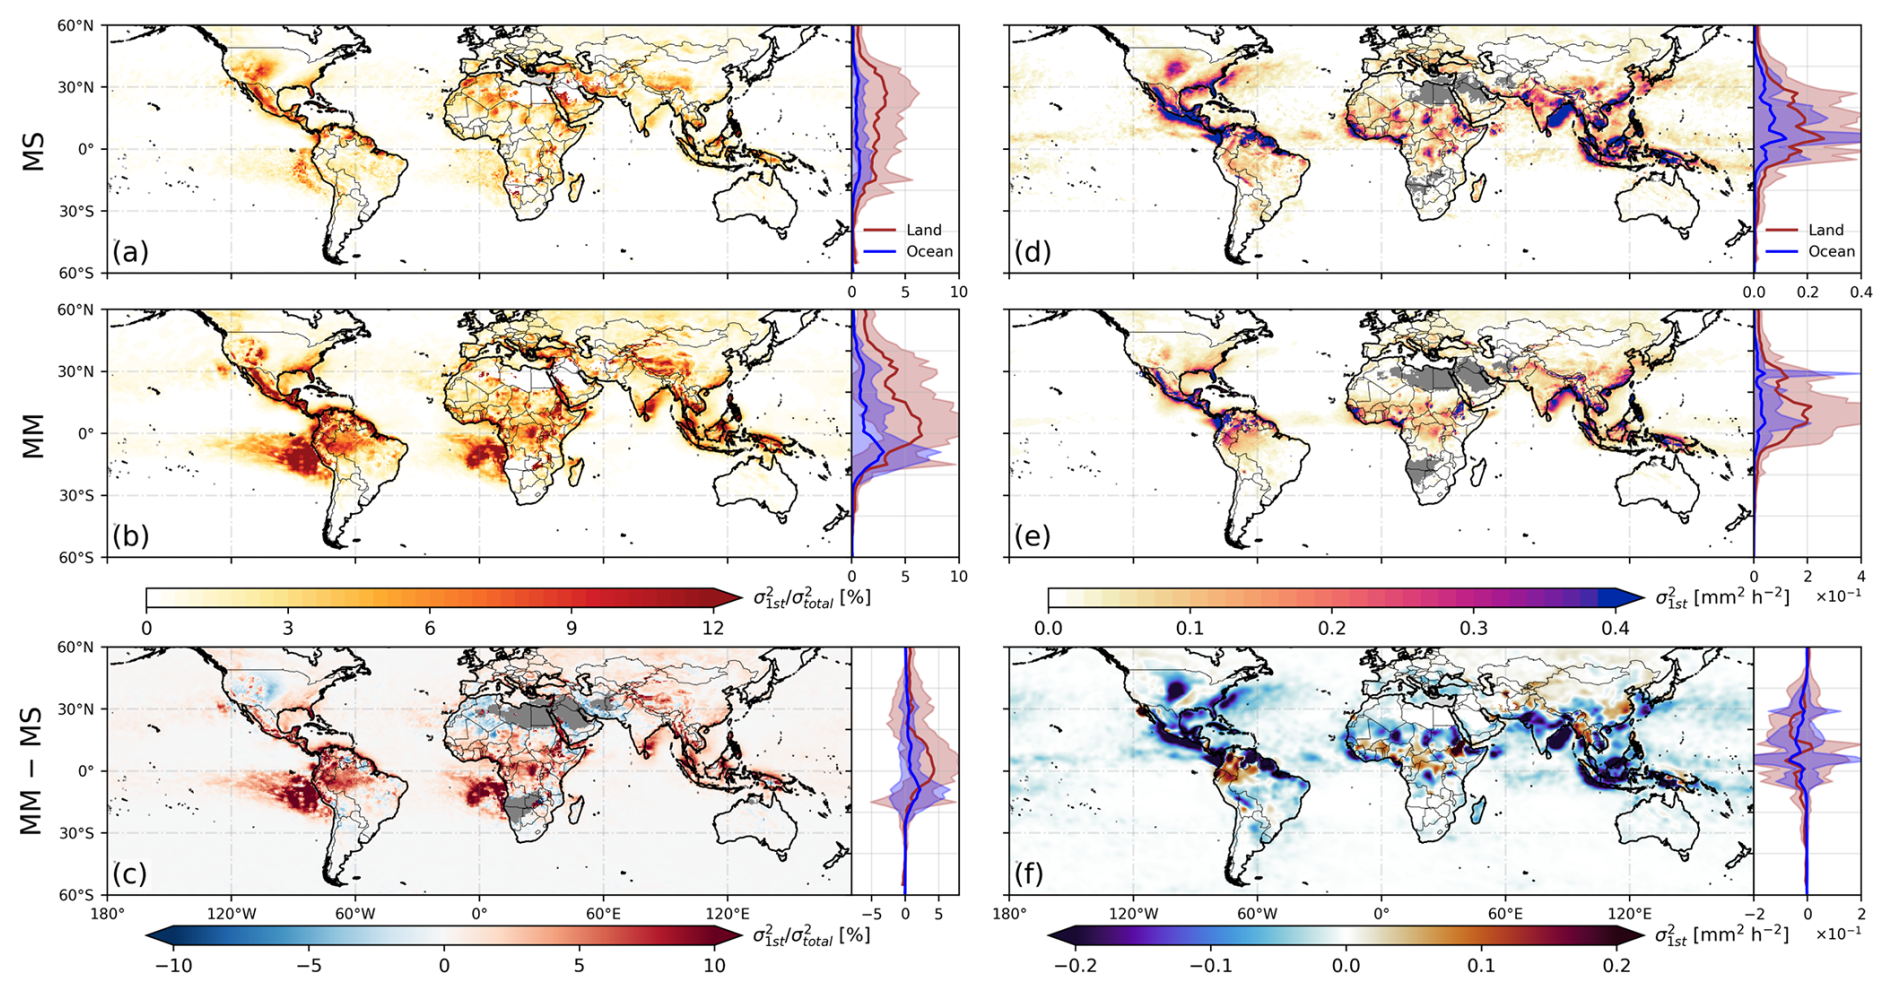
Figure 7(a–c) Spatial distributions of and (d–f) from (a, d) MS, (b, e) MM, and (c, f) their difference (MM − MS). The zonal mean distribution over the land (red) and ocean (blue) is displayed on the right of each panel, where the shading represents ±1 standard deviation.
The magnitude of in MS (Fig. 7a) peaks around 30° N over continental regions, with prominent values over central North America, India, southern China, and interior Africa, whereas over the ocean it is generally lower. In contrast to ratsubD (Fig. 5b, c), MM shows generally larger than the MS (Fig. 7b), with values exceeding 10 % near the equatorial land and decreasing poleward before increasing again around 30° N. This arises from the severe underrepresentation of (cf. Fig. 4a), which reduces disproportionately and thereby inflates the relative contribution of .
The spatial distributions of (Fig. 7d, e) show maximum values over 0–30° N continental regions in both product suites, with particularly prominent signals over southern China, the Amazon, the GP, and the Maritime Continent. The MM (Fig. 7e) consistently underrepresents over both land and ocean, reflecting the characteristic of reanalysis products wherein the relative contribution of within is overestimated while its absolute magnitude is underrepresented. This underrepresentation of is not confined to reanalysis products; satellite-based datasets such as GSMaP and MSWEP also exhibit notably lower absolute values relative to observations, suggesting that the physical intensity of the regular diurnal cycle component remains challenging across multiple product types.
On the other hand, the difference between MS and MM in both (Fig. 7c) and (Fig. 7f) reveals that the origin of this overestimation varies by region. For instance, over the western coast of Chile and southern Africa, the MM overestimates despite negligible differences in itself, indicating that the inflated ratio stems from a reduction in driven by the underrepresentation of rather than from errors in the diurnal cycle amplitude. Over the eastern coast of India, the Maritime Continent, and tropical continental interiors, the MM simultaneously overestimates while underestimating , implying that the far more severe underrepresentation of reduces to a greater extent than the reduction in . In contrast, over the GP and northwestern India, both and are underestimated by the MM, suggesting that in these regions the insufficient physical intensity of the diurnal cycle itself is the dominant source of error, rather than the underrepresentation of .
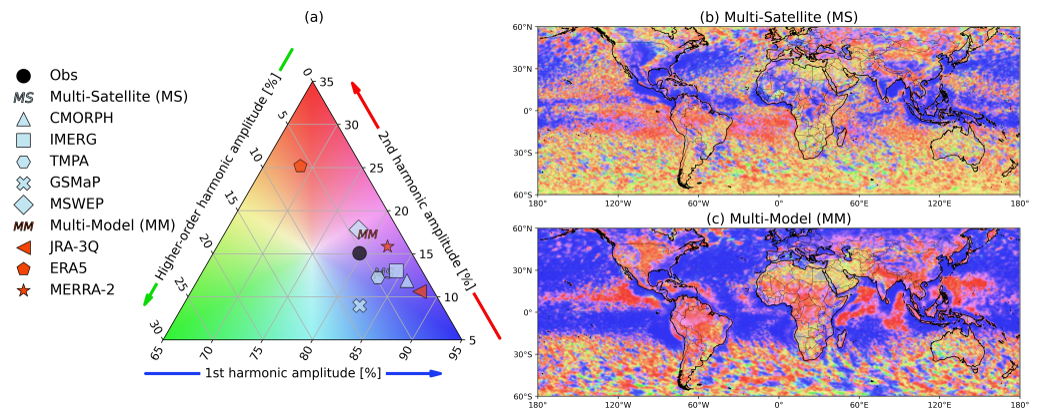
Figure 8(a) Ternary diagram of harmonic amplitude ratios for 1st (bottom axis), 2nd (right axis), and higher-order (left axis) harmonic components of regular sub-daily precipitation variability, where the averaged value from each dataset over grid cells collocated with ground-based observations is marked by a distinct symbol. Shading colour in (a) defines the colour scale used in the spatial distributions of harmonic balance from (b) Multi-Satellite and (c) Multi-Model mean.
To characterize the temporal frequency distribution of regular sub-daily precipitation variability (), the relative contributions of various harmonic components are examined via power spectrum analysis. Ground-based observations show a 1st harmonic (24 h period) fraction of 79.7 %, a 2nd harmonic fraction of 15.1 %, and higher-order contributions of 5.0 % (Fig. 8a). Satellite-based products generally overestimate the contribution of the 1st harmonic relative to observations (MS: 84.1 %), with CMORPH (86.0 %) and TMPA (82.9 %) exhibiting a pronounced overestimation alongside a corresponding underestimation of the 2nd harmonic. Among individual satellite products, MSWEP (78.2 %) captures the observed 1st harmonic fraction well, while also demonstrating superior performance in representing mean climatology (Dirmeyer et al., 2018), suggesting that its multi-source merging approach provides reliable performance across multiple timescales. Within reanalysis products, ERA5 exhibits the lowest 1st harmonic dominance (68.7 %) and the highest 2nd harmonic fraction (25.2 %) of all evaluated datasets, whereas JRA-3Q (87.9 %) presents the most substantial overestimation of the 1st harmonic. While the MM mean (79.4 %) appears numerically closest to observations, this results from the mutual cancellation of ERA5's 2nd harmonic excess and JRA-3Q's 1st harmonic overestimation; therefore, it reflects a statistical artifact rather than a physically consistent reproduction of the observed harmonic balance. The spatial difference against ground-based observations supports this interpretation. Over North America both product suites exceed the observations over the east, but they differ inland, where the MS remains close to or slightly above the observations across the central plains while the MM falls below them. Over Europe the MS differences are small and of mixed sign whereas the MM exceeds the observations over most of the domain, and over East Asia both suites exceed the observations, more so in the MM (Fig. 6d, e). The near-observational domain mean of the MM in Fig. 8a therefore arises from regional contributions of opposite sign rather than from agreement at individual locations.
The spatial distribution of harmonic amplitude ratios in MS (Fig. 8b) indicates that the 1st harmonic dominates over major continental interiors, including the North American Great Plains, India, central Africa, and southeastern China, as well as over midlatitude oceans and continental eastern coasts. Over high-latitude oceans and some subtropical arid regions, no harmonic component exhibits clear dominance, producing irregular patterns that likely reflect insufficient precipitation frequency for stable harmonic decomposition. In contrast, reanalysis products show smaller 1st harmonic amplitudes over major continental interiors compared to the satellite-based retrievals, with correspondingly larger contributions from the 2nd harmonics (Fig. 8c), reflecting the inability of reanalysis convective parameterization to reproduce the observed thermally driven diurnal cycle (Dai, 2024; Tang et al., 2021). The amplified semi-diurnal component in reanalysis products does not reflect a superior representation of physical processes; instead, it indicates the spurious generation of semi-diurnal precipitation variability inherent in model parameterization schemes. Over most ocean basins, the MM exhibits broadly uniform 1st harmonic dominance, including tropical and subtropical regions where the MS displays heterogeneous harmonic compositions. At high latitudes, the MM maintains a comparatively uniform 1st harmonic dominance, contrasting sharply with the spatially incoherent harmonic patterns seen in the MS. This discrepancy between MS and MM is particularly evident over the western Pacific Monsoon Trough, where the 2nd harmonic contribution in the MM exceeds 30 %, whereas the MS exhibits spatially noisy patterns that preclude a clear assessment of harmonic dominance in this region.
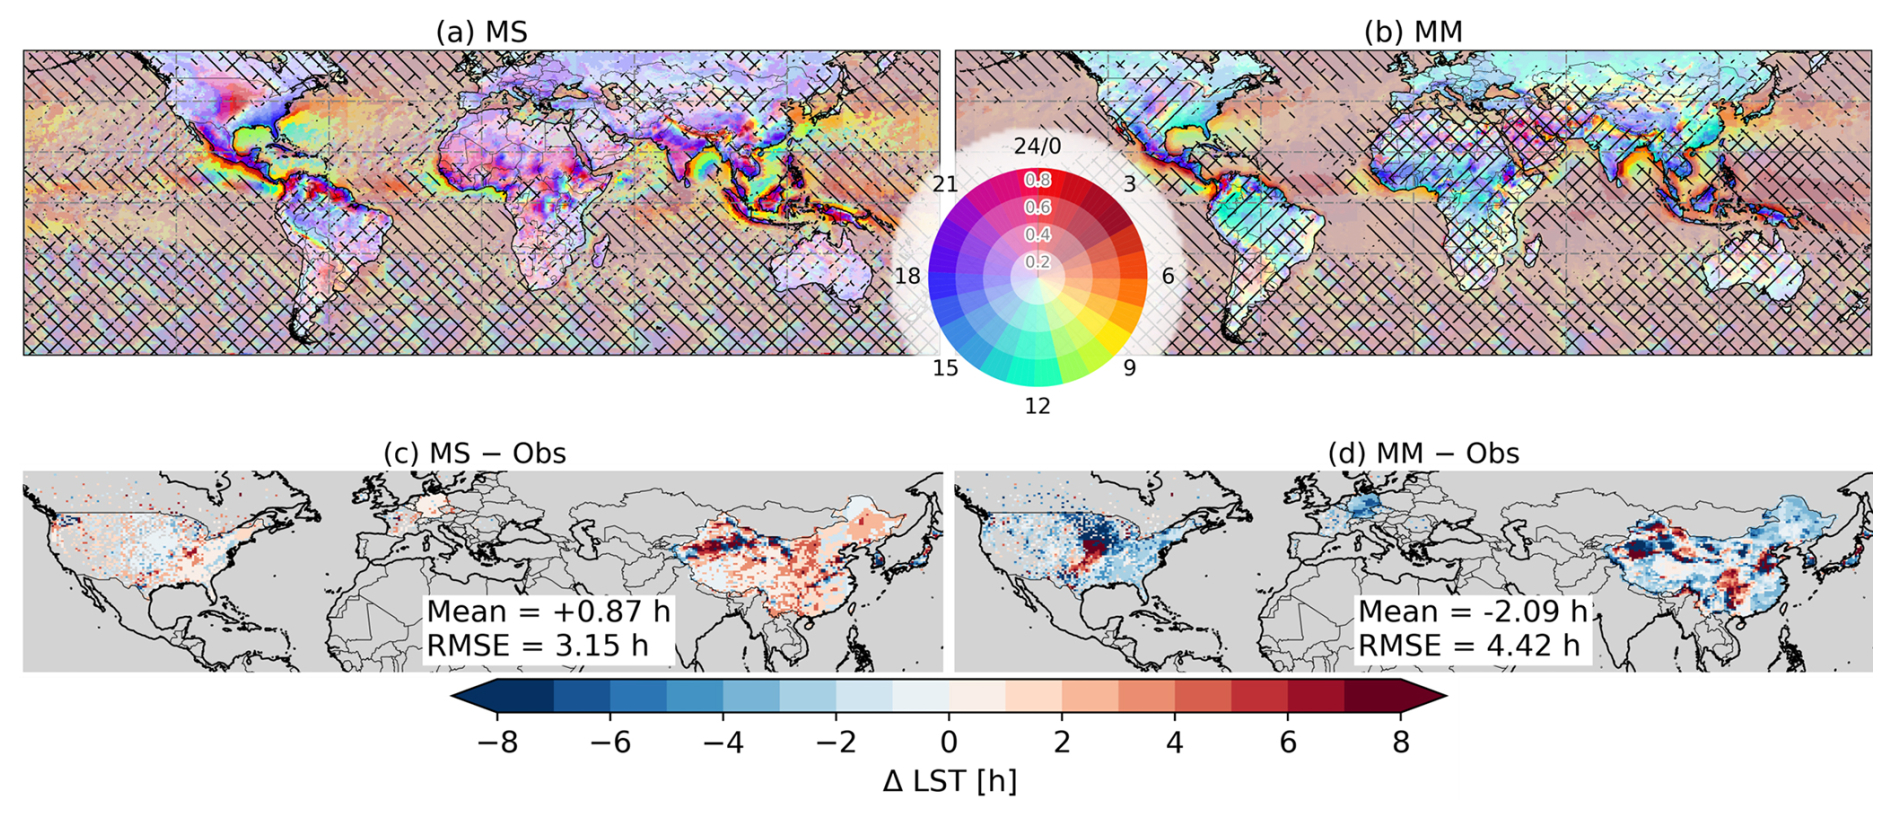
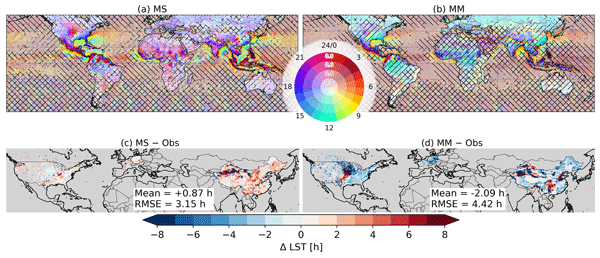
Figure 9Global maps of diurnal phase (colour) and amplitude (colour intensity) of precipitation from (a) MS and (b) MM. Backward slashed area denotes the low precipitation amplitude mask, applied where the daily precipitation amount is less than 0.275 mm or normalized amplitude of diurnal cycle < 30 % (Watters et al., 2021), and forward slash denotes the harmonic dominance mask, applied where rat1 is less than 50 %. (c, d) Differences in diurnal phase from the ground-based observations for (c) MS and (d) MM, with the mean difference and the spatial RMSE given in each panel. The corresponding maps for the individual datasets are shown in Fig. S3.
4.2 Diurnal phase and amplitude across datasets
The MS captures a pronounced land–ocean contrast in the diurnal phase of precipitation (Fig. 9a). Across most tropical, subtropical, and mid-latitude land regions, precipitation predominantly peaks during the late afternoon to evening (15:00–21:00 LST). In contrast, nocturnal to early-morning maxima (21:00–06:00 LST) are evident over the US GP, parts of the Amazon Basin, central Africa, and the eastern periphery of the Tibetan Plateau. These patterns are underpinned by nocturnal precipitation regimes associated with LLJ activity and propagating MCSs. Over the oceans, precipitation manifests a distinctly different temporal signature, with peaks occurring during the early morning (03:00–09:00 LST), consistent with the nocturnal destabilization of the marine boundary layer driven by radiative cooling aloft (Gray and Jacobson, 1977). Furthermore, the diurnal amplitude exhibits considerable spatial heterogeneity, with the most robust variations observed over land, while oceanic regions are characterized by damped amplitudes due to minimal surface diurnal temperature fluctuations. Along coastal regions, intermediate phases (06:00–12:00 LST) emerge between the land and oceanic regimes, reflecting the offshore propagation of convective systems initiated over land, which is particularly pronounced over the Maritime Continent, western India, West Africa, and the Atlantic coast of South America. The individual satellite products share this structure but differ in detail (Figs. S3a–e). CMORPH and IMERG are the most similar because they share a morphing framework, TMPA carries larger amplitudes, and MSWEP is smoother and peaks near 15:00 LST, inheriting the early timing of ERA5.
The MM peaks earlier than the MS over land while remaining close to it over the ocean, where early-morning peaks at 03:00–06:00 LST align well with the observations (Fig. 9b). It has been commonly reported in evaluations of CMIP models and reanalysis datasets (Tang et al., 2021; Watters et al., 2021), and is associated with convective parameterization schemes triggering precipitation too rapidly in response to solar heating over land, whereas radiatively driven oceanic precipitation timing is more realistically reproduced (Dai and Trenberth, 2004). The nocturnal maxima that the MS resolve over the US GP and the eastern periphery of the Tibetan Plateau are weaker and less spatially coherent in the MM, and the diurnal amplitude over land is lower than in the satellite-based datasets throughout. The phase lead over land varies among the reanalyses (Fig. S3f–h). JRA-3Q remains closest to the satellite products peaking at 14:00–18:00 LST over most continental regions and partially reproducing the nocturnal propagation over the US GP and the North China Plain. MERRA-2 peaks uniformly at 09:00–12:00 LST and resolves neither the nocturnal maxima over mountains nor the afternoon peaks over continental interiors.
Comparing the two suites against the ground-based observations places these phase structures on a common reference (Fig. 9c, d). MS departs from the observations less than MM across the validation domain, with spatial RMSE values of 3.15 h against 4.42 h, and the differences are predominantly positive in MS and negative in MM. The corresponding differences for the individual products are given in Fig. S4. Over the CONUS the MS differences remain within about 2 h across most of the domain and are smallest over the US GP, whereas MM is earlier than the observations by 6 h or more over the upper Midwest. A band of large positive differences in MM runs alongside this area from the southern US GP toward the northeast. MM places its peak in the afternoon across this corridor while the observations peak after midnight, so the two are separated by close to half a day and the wrapped difference changes sign between neighbouring cells. The band therefore marks where MM misses the nocturnal propagation rather than where it peaks late. Over Europe the MS differences stay within about 2 h while MM is earlier by 4 to 6 h over Germany and Poland. East Asia carries the largest MS differences, reaching 6 h or more over northwestern China, where the cells concerned are those hatched in Fig. 9a and b for weak diurnal variability and low precipitation amounts. The harmonic balance over the same cells places a large share of in the second and higher-order components (Fig. 8b, c), so a single diurnal harmonic does not describe the sub-daily cycle there and the phase retrieved from it is poorly constrained in both suites. Outside the hatched area, MS is later than the observations by 2 to 4 h over eastern China, so its positive differences concentrate in East Asia while those of MM are negative over almost the whole domain.
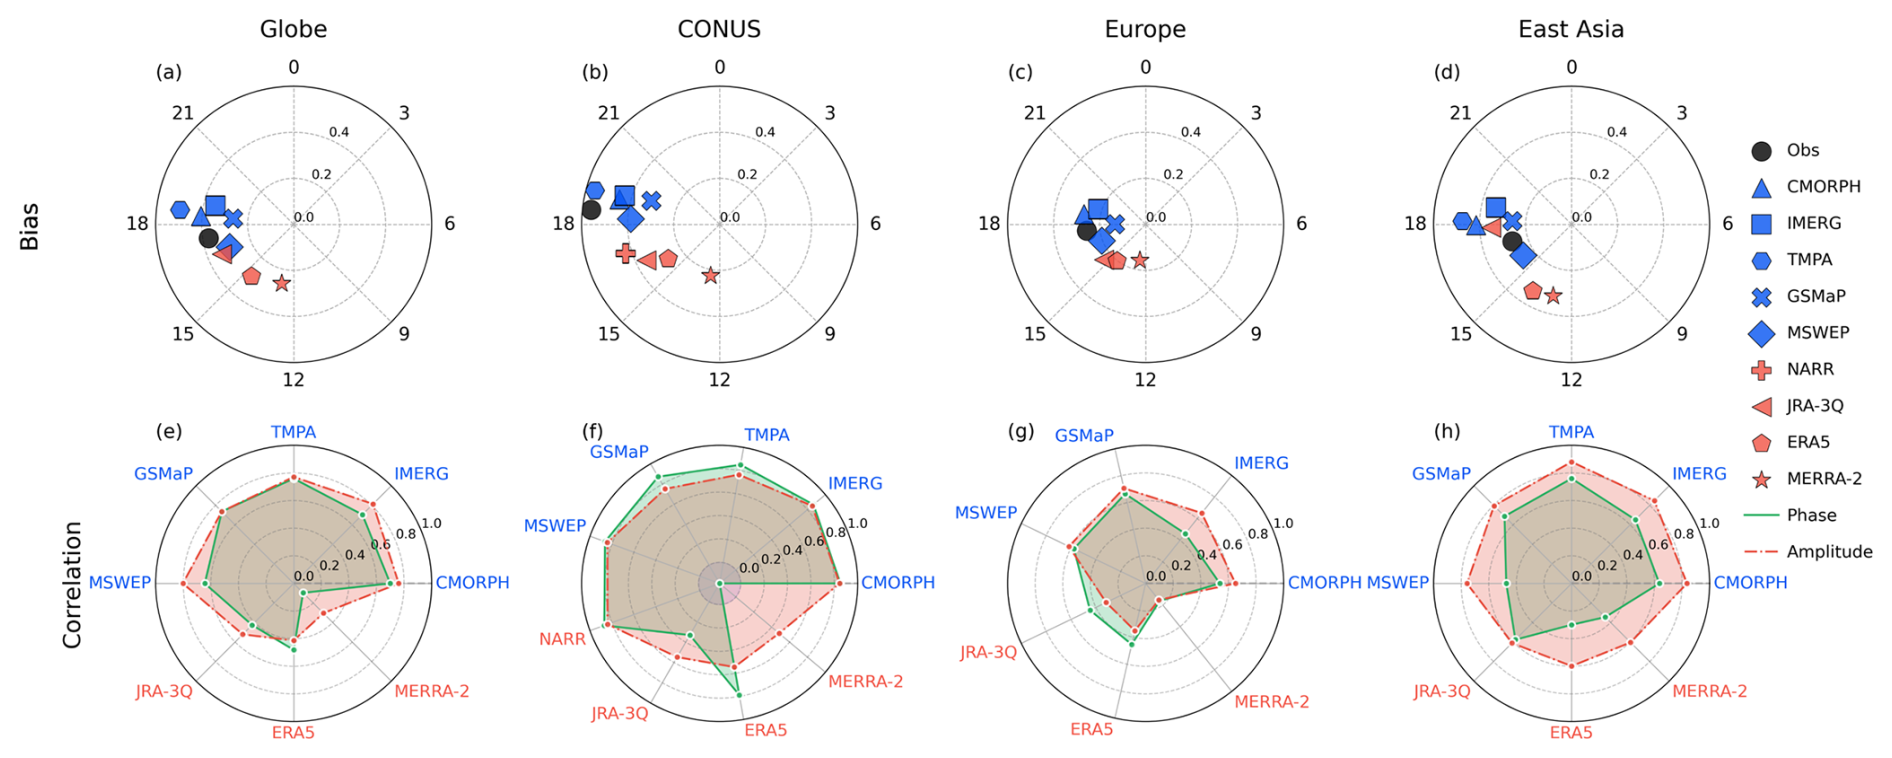
Figure 10Spatially averaged diurnal phase (azimuth) and amplitude (radius) of the precipitation from ground-based observation (black), satellite (blue), and reanalysis (red) datasets over (a) the globe, (b) Contiguous United States (CONUS), (c) Europe (EU), and (d) East Asia (EA), for grid points where the observed rat1 ≥ 50 %. The spatial correlation of diurnal phase (green solid) and amplitude (red dashed) from gridded products with the observation is depicted in (e–h). The corresponding statistics without this criterion are shown in Fig. S6.
The quantitative analysis of diurnal phase and amplitude corroborates the inter-dataset discrepancies identified qualitatively in Fig. 9. While ground-based observations indicate a peak phase at approximately 17:00 LST, most satellite products, despite capturing the general timing, exhibit a systematic temporal lag of approximately 1–2 h (Fig. 10a). This systematic delay is consistent with the indirect detection characteristics inherent in satellite precipitation retrieval algorithms. PMW sensors detect hydrometeors at ice-scattering altitudes in the upper troposphere rather than at the surface, and preferentially capture CP more effectively than stratiform precipitation (Ebert et al., 2007; Hayden and Liu, 2021). Furthermore, the extensive anvil regions of organized convective systems can continue expanding after surface precipitation reaches its maximum and persist even after the convective core dissipates, such that PMW sensors still detect strong ice-scattering signals during phases when surface precipitation has already weakened. The same indirect detection affects IR-based retrievals, which infer precipitation from cloud-top brightness temperatures that are only weakly related to surface rainfall and tend to place the diurnal maximum later; this is particularly relevant for TMPA, which fills the gaps between PMW overpasses with calibrated IR (Huffman et al., 2007). These detection characteristics cannot be separated from the effects of microwave sampling and temporal interpolation in the present analysis.
The temporal interpolation alone does not account for the delay: TMPA exhibits comparable phasing to the other satellite products despite filling the intervals between overpasses with calibrated infrared estimates rather than propagating retrievals in time, and a comparable lag also appears in CMORPH, whose forward- and backward-propagated retrievals are weighted by elapsed propagation time without preference for either direction (Xie et al., 2017). Backward propagation brings the phase closer to the observations, since the IMERG Early (IMERG-E) Run, which propagates forward only, peaks later than the Late (IMERG-L) and Final (IMERG-F) Runs, which propagate in both directions, although a positive offset remains in all three (Fig. S5). The contribution of sampling density cannot be constrained in the same way, since IMERG, CMORPH, and GSMaP draw their retrievals from the same satellite constellation, and a sampling effect would act on all three products alike. Two products depart from this common behaviour. TMPA overestimates the amplitude, which is a direct consequence of the elevated sub-daily variance identified in Fig. 4a. MSWEP displays a phase of approximately 16:00 LST, roughly 1 h earlier than observations. Reanalysis products exhibit premature phase biases and attenuated amplitudes, with peak precipitation timing at 16:00 LST in JRA-3Q, 14:00 LST in ERA5, and 12:00 LST in MERRA-2.
The diurnal cycle of precipitation exhibits distinct regional characteristics. Over the CONUS, where the peak diurnal phase is observed at 18:00 LST, satellite products generally capture the observed timing but tend to underestimate the robust diurnal amplitude (Fig. 10b). One possible contribution to this deficit lies in the ground-based reference rather than in the products. A grid cell represented by a single station carries the diurnal amplitude of that one record, whereas a cell represented by several carries an average in which maxima occurring at different hours partly cancel, which is closer in character to a gridded estimate, and grid cells over CONUS contain fewer stations than those over the Europe (EU) or the East Asia (EA). The amplitude difference does narrow as the number of contributing stations increases (Fig. S7). But the relationship is weak and a substantial deficit remains where several stations contribute, so the station coverage accounts for only part of the difference.
While most reanalysis products highlight the persistent challenges in simulating diurnal precipitation over this region, NARR demonstrates superior fidelity in reproducing both the observed phase and amplitude. This performance is directly attributable to its 3-hourly assimilation of precipitation observations, thereby underscoring the efficacy of precipitation data assimilation in accurately representing diurnal cycle dynamics.
The observed diurnal phases in EU and EA occur around 16:00–17:00 LST, with magnitudes that are comparable between the two regions yet notably smaller than those over CONUS (Fig. 10c, d). These subdued amplitudes are consistent with the lower ratsubD values observed in the EU (50 %–60 %) and EA (30 %–50 %) compared to CONUS (70 %–80 %). This suggests that synoptic-scale and lower-frequency variability account for a greater proportion of the total precipitation variance in these regions. However, the physical mechanisms underlying the weak diurnal amplitudes differ between the two regions. Over the EU, summertime frontal and orographic precipitation contributes substantially to the total rainfall, whereas the thermally driven convective diurnal signal remains relatively weak. In EA, synoptic-scale systems, such as the Meiyu/Baiu/Changma frontal zones associated with the East Asia summer monsoon, account for a substantial portion of the precipitation variability. Despite the EA exhibiting lower ratsubD than the EU, the two regions manifest similar diurnal amplitudes. This likely reflects the larger in the EA driven by synoptic environments, while the activation of nocturnal low-level jets partially sustains the diurnal signal even within LSP systems (Yu et al., 2007).
We further evaluate the spatial consistency of the diurnal phase and amplitude between gridded products and observations (Fig. 10e–h). Regarding the diurnal phase, satellite products achieve the strongest correlations over the CONUS (r>0.8), with moderate agreement over EA (r=0.5–0.7) and the weakest performance over the EU. This reflects the distinct spatial structure of the diurnal cycle over CONUS, with an afternoon maximum over the western and eastern parts of the domain and a nocturnal maximum over the central plains, which the satellite retrievals observe directly whereas the reanalyses do not reproduce from surface heating alone. The complex topography and the coexistence of diverse precipitation mechanisms (e.g., frontal, orographic, and convective) in the EU and EA induce higher spatial variability, complicating the representation of the diurnal phase. Reanalysis products attain lower phase correlations than satellite datasets across all four domains. Across the globe, CONUS, and EU, ERA5 shows comparable or higher phase correlations than JRA-3Q, although its domain-averaged peak occurs 2 h earlier, so JRA-3Q remains closer to the observations in the mean phase. An exception occurs in the diurnal amplitude over EA (Fig. 10h), where most datasets (excluding TMPA) yield correlation coefficients approximately 0.2 higher than their respective phase correlations. This indicates that the spatial distribution of amplitude is more consistently reproduced across datasets than the phase.
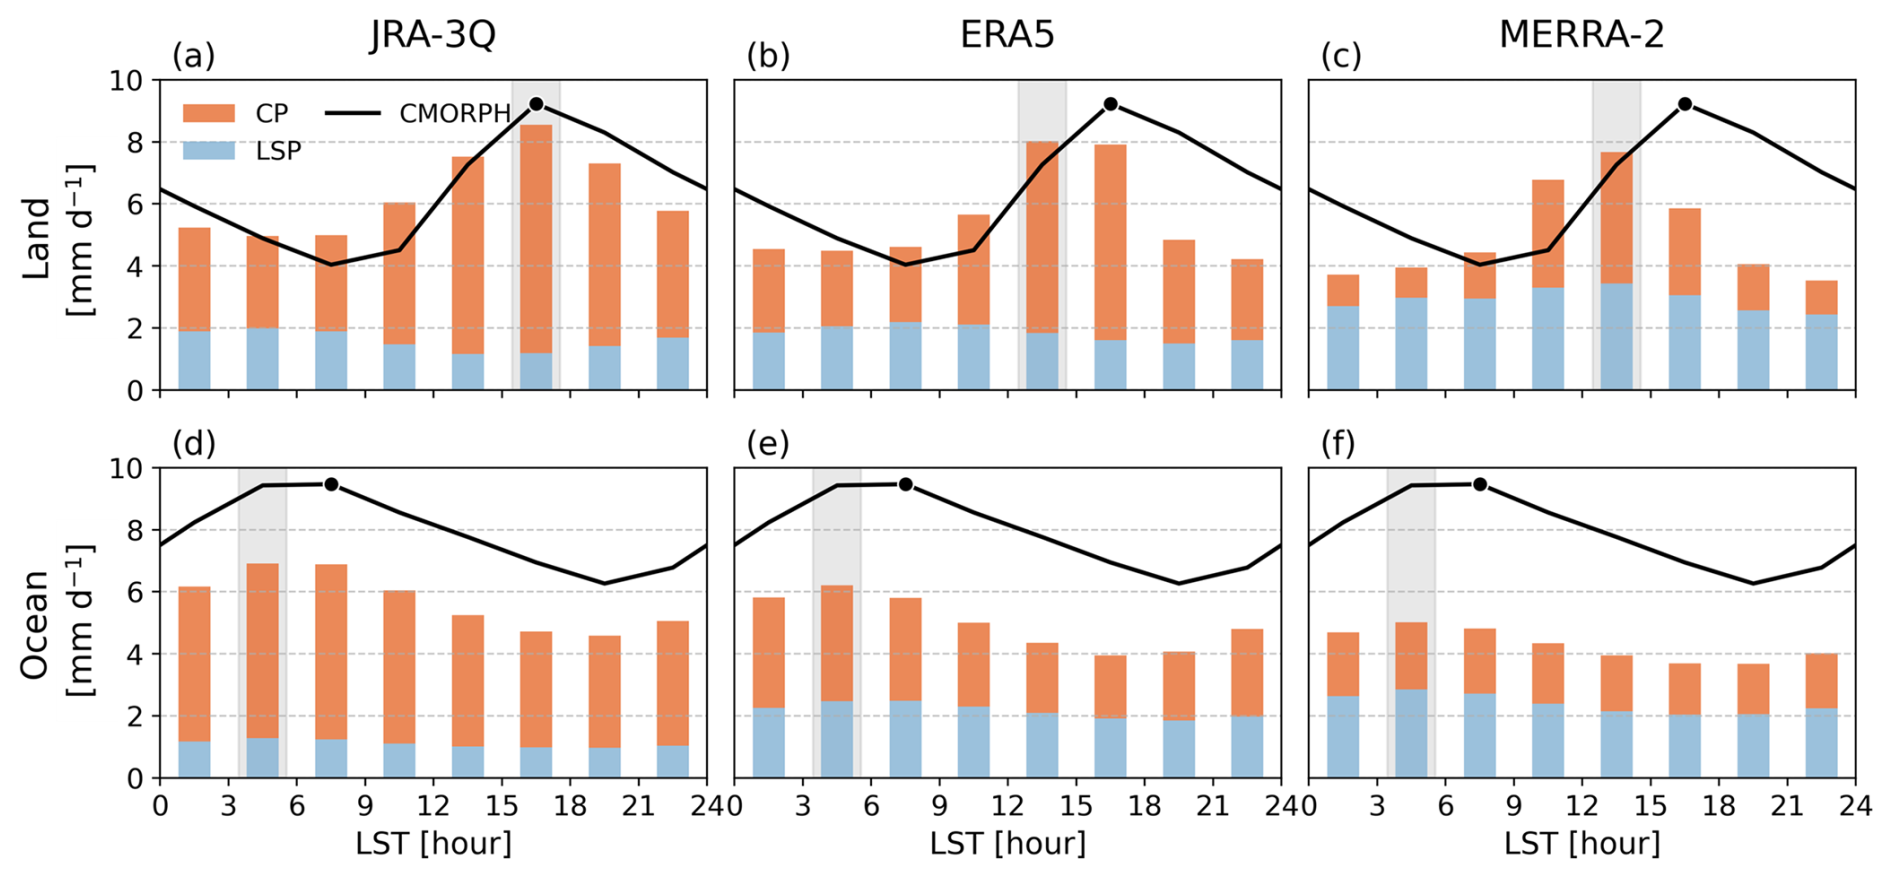
Figure 11Diurnal cycle of area-averaged precipitation over land (a–c) and ocean (d–f) grid cells bounded by 60° S–60° N (only grid points after the masking depicted in Fig. 9), for JRA-3Q (a, d), ERA5 (b, e), and MERRA-2 (c, f). Bars show the partitioning of total precipitation (TP) into convective precipitation (CP, orange), and large-scale precipitation (LSP, blue) components, and the black line shows the TP from CMORPH, with the black dot marking its diurnal maximum. Background shaded bars indicate the local time at which each reanalysis reaches its TP maximum.
To identify the physical processes underlying these phase shifts, we examine the respective contributions of the CP and LSP components to the diurnal cycle of TP (Fig. 11). Among the satellite products evaluated above, CMORPH shows the closest agreement with ground-based observations in representing global diurnal characteristics (Fig. 10a), we therefore adopt it as the reference for the grid-scale comparison. Unlike CMORPH, which provides only TP, reanalysis datasets partition precipitation into convective and large-scale components via their respective parameterization schemes. This partitioning enables a detailed investigation into the physical mechanisms responsible for diurnal phase biases. Specifically, this decomposition is instrumental in determining whether these phase errors originate from convective triggering mechanisms, stratiform precipitation processes, or the complex interplay between the two processes.
Over land, CMORPH and JRA-3Q reach their maximum in the 15:00–18:00 LST interval, whereas ERA5 and MERRA-2 peak one interval earlier at 12:00–15:00 LST (Fig. 11a–c). The phase lead of the reanalyses is clearer in the afternoon decline than in the timing of the maximum. Between 18:00 and 21:00 LST, ERA5 and MERRA-2 retain 4.1–4.8 mm d−1 against 8.3 mm d−1 in CMORPH, about half the observed value, whereas JRA-3Q remains comparable at 7.3 mm d−1. Over the ocean, all three reanalyses peak at 03:00–06:00 LST, within the broad early-morning maximum that CMORPH spans from 03:00 to 09:00 LST (Fig. 11d–f), so the shape of the oceanic cycle is reproduced and the phase lead is confined to land. The distributions of the peak hour across grid cells are consistent with these area-averaged results and are given in Fig. S8, where the observed land maximum is broad and carries a secondary late-evening mode over regions influenced by nocturnal MCSs. In every product the diurnal variation of TP over land follows that of CP. Between the daily minimum and maximum of TP, CP varies by 3.1 to 4.4 mm d−1 across the three products, whereas the corresponding change in LSP does not exceed 1.0 mm d−1, so the large-scale component sets the level of the total rather than its phase, and the same alignment between the TP and CP peak phases holds at the grid scale (Fig. S8b–g). ERA5 is the one exception, where CP peaks in the 15:00–18:00 LST but LSP decreases through the afternoon and moves the TP maximum one interval earlier.
The convective share of the total differs among the products. In JRA-3Q, CP accounts for 86 % of TP over both land and ocean, whereas in MERRA-2 it accounts for less than half, so the large-scale component carries most of the precipitation. ERA5 falls between the two and shifts with surface type, from 67 % over land to 56 % over the ocean. The daily-mean LSP in MERRA-2 is 1.8 times that of JRA-3Q over land, which is consistent with the documented tendency of the Relaxed Arakawa-Schubert (RAS) scheme with a Tokioka-type trigger to suppress deep convective activity (Bacmeister and Stephens, 2011; Gelaro et al., 2017) and to shift the burden of precipitation generation toward large-scale condensation (Tao et al., 2024).
The CP-LSP decomposition thus provides direct evidence that premature convective triggering, rather than LSP processes, serves as the primary driver of systematic early peaks in reanalysis TP. This finding corroborates previous studies that identify convective parameterization as the fundamental source of diurnal phase shift (Dirmeyer et al., 2012). To further elucidate the thermodynamic and moisture budget processes underlying these convective phase biases, the following section examines the diurnal evolution of CAPE, MFC, and other related atmospheric variables.
4.3 Physical mechanisms of the diurnal cycle
4.3.1 Moisture-supply regimes over Northern Hemisphere land
To identify the processes behind this phase shift, we examine the diurnal evolution of key variables related to precipitation occurrence, including CAPE, CIN, MFC, and E, on rainy days (daily precipitation ≥ 0.275 mm d−1) over the Northern Hemisphere land (0°–60° N) during the boreal summer (Fig. 12). The variables are averaged over the grid cells of each regime, so they are used for comparison among products rather than as absolute measures of instability. The separation follows the climatological daily-mean ratio MFC (MFC +E), averaged across the three reanalyses, at a threshold of 0.6 (Fig. S9). Cells above the threshold draw their moisture mainly from horizontal convergence and cells below it from local surface evaporation, so the two regimes correspond to precipitation that is sustained by large-scale transport and to precipitation that is sustained by the surface energy balance.
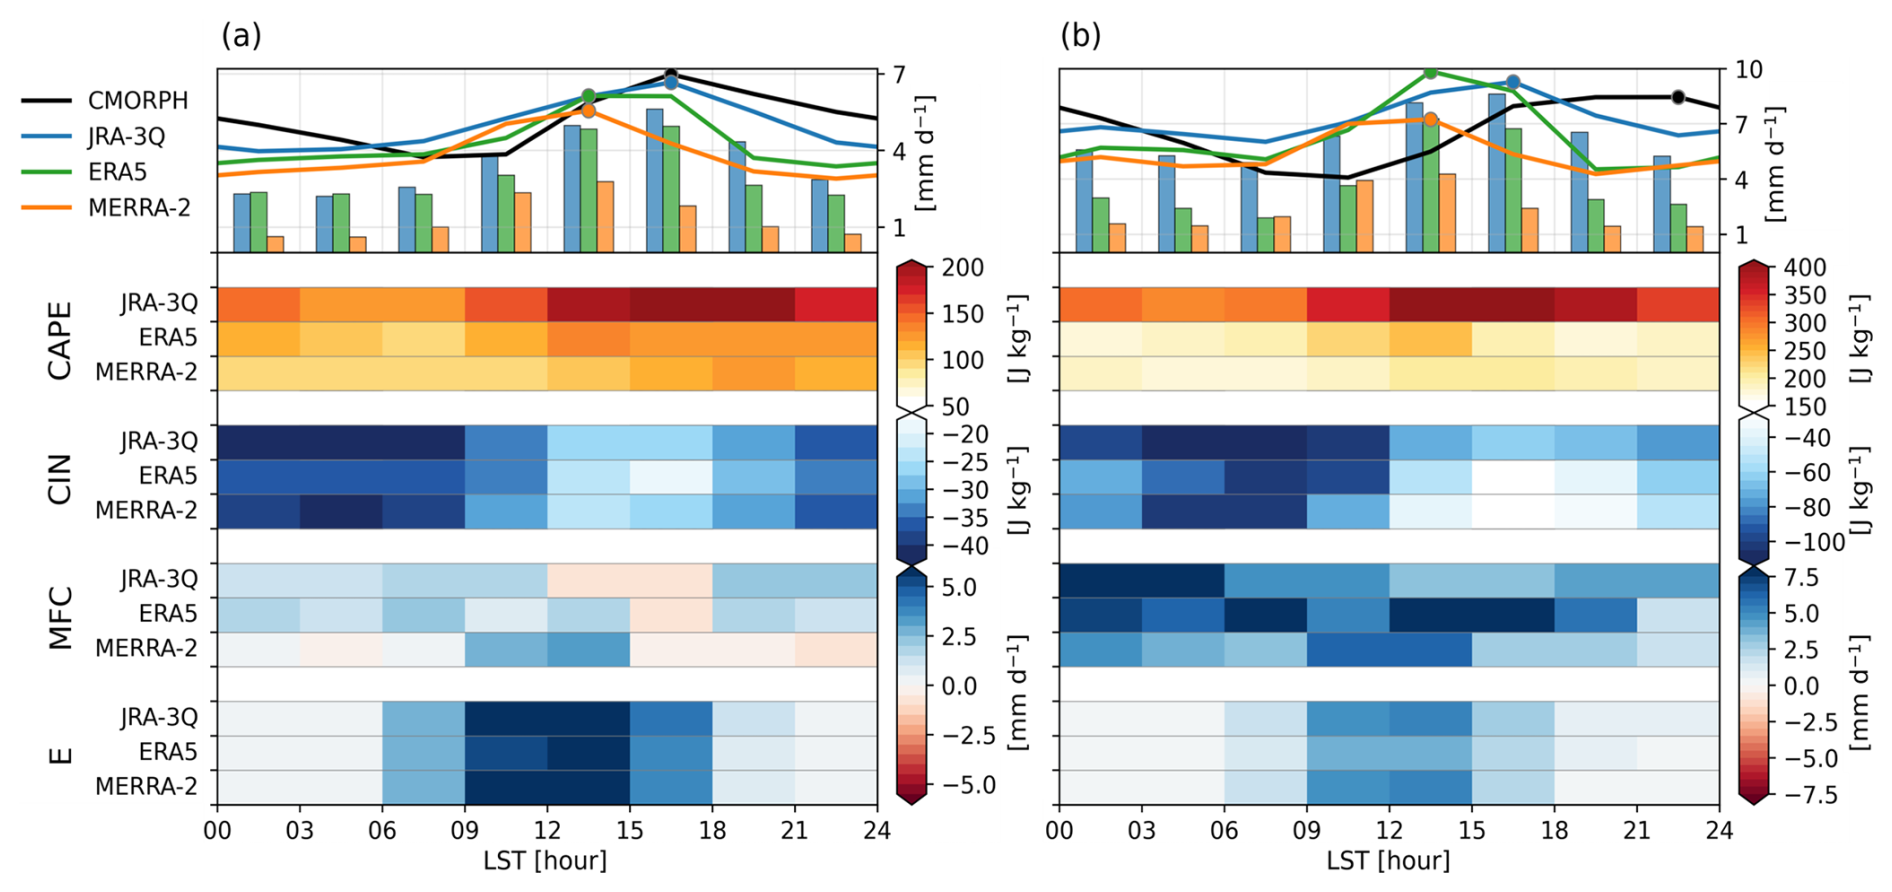
Figure 12Diurnal cycle of area-averaged precipitation and its relevant variables for rainy days (daily precipitation ≥ 0.275 mm d−1) over 0°–60° N, separated by the moisture-supply regime into grid cells where the climatological daily-mean ratio MFC (MFC +E) is (a) at or below 0.6 and (b) above 0.6. Upper panel shows the diurnal cycle of TP (lines) and CP (solid bars) from CMORPH, JRA-3Q, ERA5, and MERRA-2, with circles marking the peak hour of each dataset. Lower panels show diurnal variations of CAPE, CIN, MFC, and E, where each row represents three reanalysis datasets (JRA-3Q, ERA5, and MERRA-2).
The distinction is visible in the observations before any product is considered. In the evaporation-supplied regime, CMORPH reaches its maximum at 15:00–18:00 LST, 3 to 6 h after the surface heating maximum, which is the time required for boundary layer moisture to accumulate, for CIN to erode and for shallow convection to deepen into the free troposphere (Dai et al., 1999; Stirling and Stratton, 2012; Tian and Kuang, 2016). In the convergence-supplied regime, CMORPH reaches its maximum at 21:00–00:00 LST and holds above 7.9 mm d−1 from 15:00 LST through midnight, which reflects the nocturnal precipitation regimes associated with LLJ activity and propagating MCSs. The surface moisture supply does not account for this contrast, since E peaks around 12:00 LST in every product and in both regimes, at 3.9 to 6.6 mm d−1. The two regimes therefore place different demands on the convective schemes, and a single average over the domain conflates them.
In the evaporation-supplied regime, MFC stays close to zero and turns negative during the afternoon in all three products, so the moisture is supplied locally and the phase of the precipitation is governed by the daytime destabilization rather than by the moisture transport. JRA-3Q reaches its maximum at 15:00–18:00 LST, matching the observed phase, whereas ERA5 and MERRA-2 peak 3 h earlier at 12:00–15:00 LST (Fig. 12a). E is alike across the three products, so this difference is not attributable to the surface forcing itself but to how each convective parameterization responds to the resulting destabilization. The evolution of CAPE and CIN describes that response. Their magnitudes differ among the reanalyses despite being computed on the same pressure levels with the same parcel definition and conditional sampling, so the spread reflects differences in the thermodynamic profiles rather than in the diagnostic itself. Consistent with this, the level of free convection (LFC) ordering at 12:00 LST follows the CAPE ordering, with JRA-3Q showing a lower LFC and larger CAPE, indicating that differences in thermodynamic structure contribute to the inter-reanalysis spread in CAPE (Fig. S10).
In JRA-3Q, the two conditions are met at the same hour. CAPE increases gradually after sunrise and reaches its maximum at 15:00 LST (approximately 206 J kg−1) while CIN is weakest at the same hour, and the precipitation maximum follows at 15:00–18:00 LST. CAPE reaches three quarters of that maximum by 09:00 LST, yet the precipitation does not respond while the residual CIN continues to constrain convective development. This behaviour is consistent with the dynamic CAPE generation rate (DCAPE)-based trigger, which requires not only that CAPE exceeds a predefined threshold but also that the rate of CAPE generation by large-scale dynamical processes, such as moisture convergence and free-tropospheric lifting, be sufficiently high. By conditioning the onset on both thermodynamic instability and its rate of generation, the trigger holds convection back through the transition in which shallow cumulus, limited by entrainment of dry environmental air, moisten the lower free troposphere and further erode the residual CIN.
In ERA5 the two conditions are separated. CAPE reaches its peak at 12:00 LST, 3 h earlier than in JRA-3Q, while CIN follows a pattern similar to JRA-3Q, weakening from 12:00 LST and reaching its smallest magnitude at 15:00 LST. TP rises with the CAPE maximum and forms a plateau that holds between 12:00 and 18:00 LST, so precipitation is generated before CIN is fully eroded. CP nonetheless peaks at 15:00–18:00 LST, the same as CMORPH, so the early rise is carried by the total rather than by the convective component. The closure of the modified Tiedtke scheme (Bechtold et al., 2008, 2014) relaxes only the free-tropospheric part of the CAPE, subtracting the contribution generated by boundary layer forcing so that the full instability becomes available to deep convection only at the end of the lower-tropospheric heating and moistening cycle. Where the destabilization originates at the surface, as in this regime, that subtraction holds the convective onset back far enough for CP to peak with the observations, although it does not prevent precipitation from beginning while CIN is still eroding.
MERRA-2 exhibits a different relationship between CAPE and precipitation compared to other products. CAPE reaches its maximum at 18:00 LST, after the precipitation peak at 12:00–15:00 LST, and it continues to increase past the peak while CAPE in JRA-3Q and ERA5 decreases once their precipitation maxima are passed. The convective scheme therefore does not consume the instability at the time precipitation occurs, which is consistent with the RAS convective scheme with Tokioka-type trigger (Bacmeister and Stephens, 2011; Gelaro et al., 2017) to limit the conversion of CAPE into CP, thereby permitting instability to continue building through the afternoon despite the occurrence of precipitation. Instead, the precipitation peak aligns with the maximum phase of E and MFC, both at 12:00 LST, and the strongest midday convergence among the three products, which indicates that MERRA-2 precipitation responds more directly to instantaneous moisture availability than to the cyclic evolution of thermodynamic instability. This behaviour is consistent with the LSP-dominant partitioning (cf., Fig. 11), where suppressed convective activity shifts the burden of precipitation generation toward large-scale condensation processes.
In the convergence-supplied regime, the three products keep the same afternoon timing as in the evaporation-supplied regime, with JRA-3Q peaking at 15:00–18:00 LST and ERA5 and MERRA-2 at 12:00–15:00 LST, while the observed maximum moves to 21:00–00:00 LST (Fig. 12b). None of the schemes respond to the change in the moisture supply, so the phase difference reaches 6 h in JRA-3Q and 9 h in ERA5 and MERRA-2, and the trigger formulations that separate the products in the evaporation-supplied regime no longer distinguish between them. The ingredients for a nocturnal maximum are present. At 21:00 LST, CAPE in all three products remains at three quarters or more of its daily maximum, and MFC in JRA-3Q is largest overnight, more than twice its afternoon value. What changes after the afternoon is CIN, which strengthens in every product between 15:00 LST and midnight. The observed nocturnal maximum requires convection to be initiated against this returning inhibition through the lifting associated with the sustained convergence rather than through surface heating, and none of the three schemes does so. Their precipitation decreases to 4.7–6.4 mm d−1 when CMORPH reaches 8.5 mm d−1, while the afternoon maxima of JRA-3Q and ERA5 exceed the observed daily maximum, so the nocturnal shortage is accompanied by an afternoon surplus.
The two regimes therefore give different answers to the same question. Where the moisture is supplied by local evaporation, the products differ from one another by 3 h and JRA-3Q reproduces the observed phase, so the comparison is informative about the trigger formulations. Where the moisture is supplied by convergence, the three products are indistinguishable from one another and all of them are 6 to 9 h from the observations, because the observed maximum is initiated by sustained lifting rather than by surface heating and none of the schemes represents that pathway. The diurnal phase in the reanalysis products is thus reproduced where precipitation follows the surface energy balance and not where it follows large-scale transport. The same division appears in the phase maps, where MM peaks earlier relative to the observations over the US GP, the region in which the observed maximum occurs at night (Fig. 9d).
4.3.2 Case studies at two sites
The two cases are examined next at the point scale using the ARM SGP site in the US GP, where nocturnal precipitation dominates, and a southeastern US site characterized by afternoon precipitation. The sites and the measurements available at each are summarized in Table 4.
Table 4Specifications of the two case-study sites examined in Sect. 4.3.2. The observations are available only at the Southern Great Plains site, so CMORPH serves as the precipitation reference at the southeastern United States site. The locations of both sites are marked in Fig. 1.
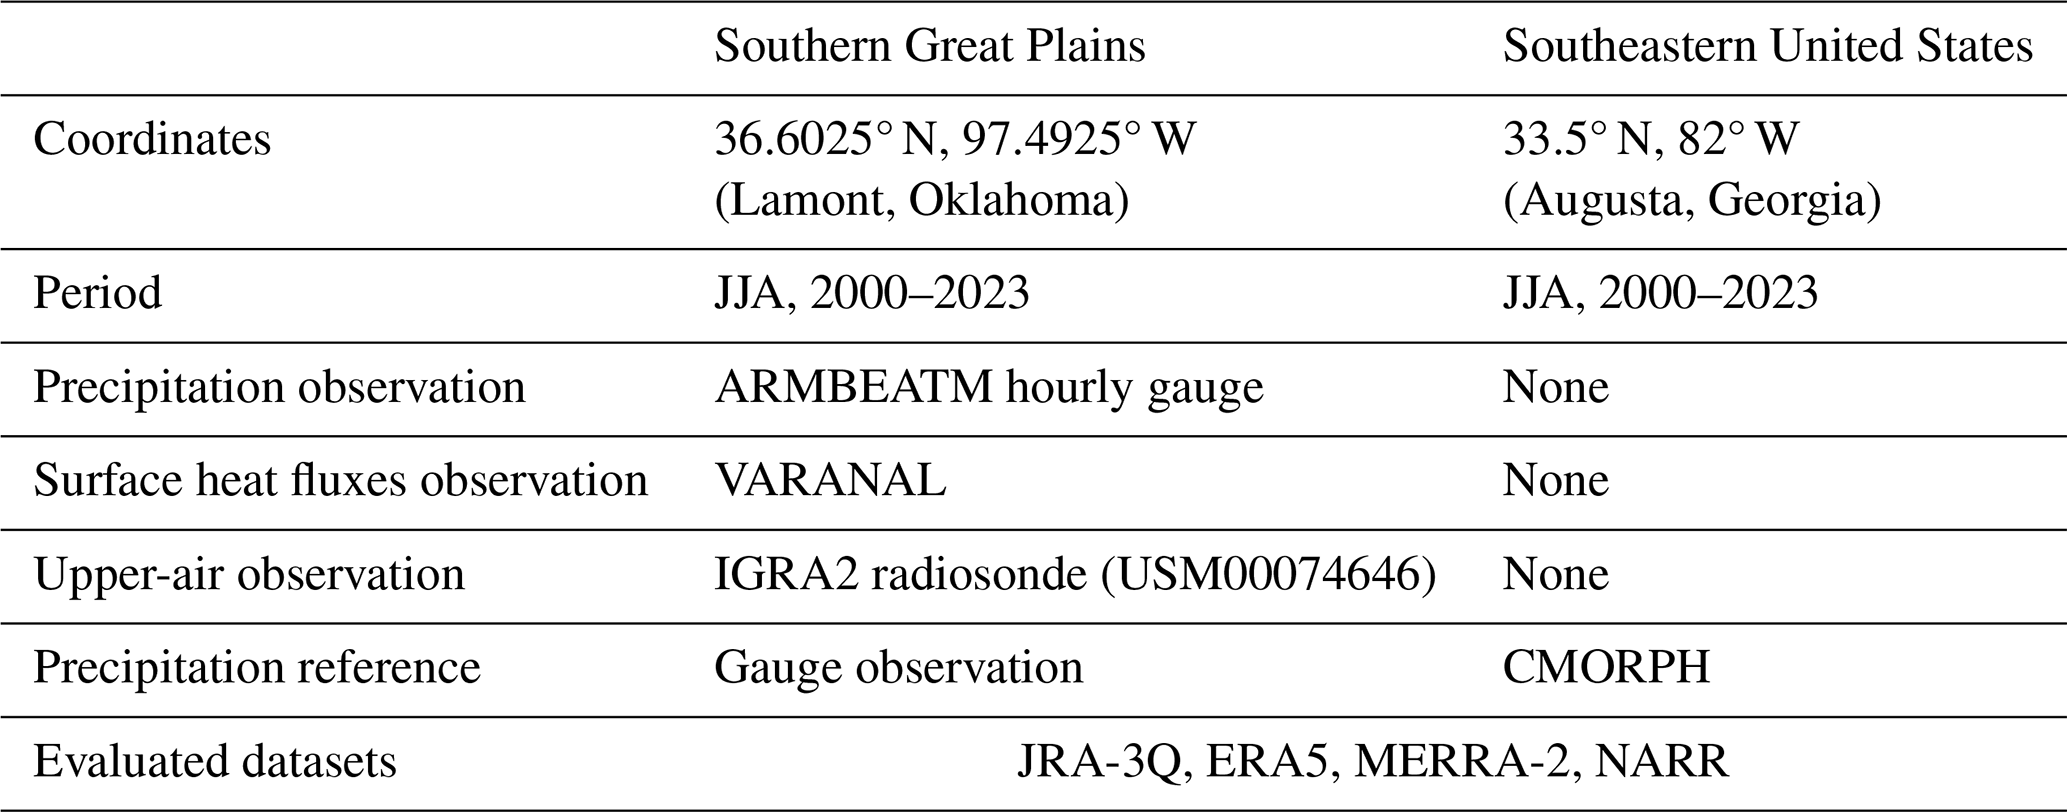
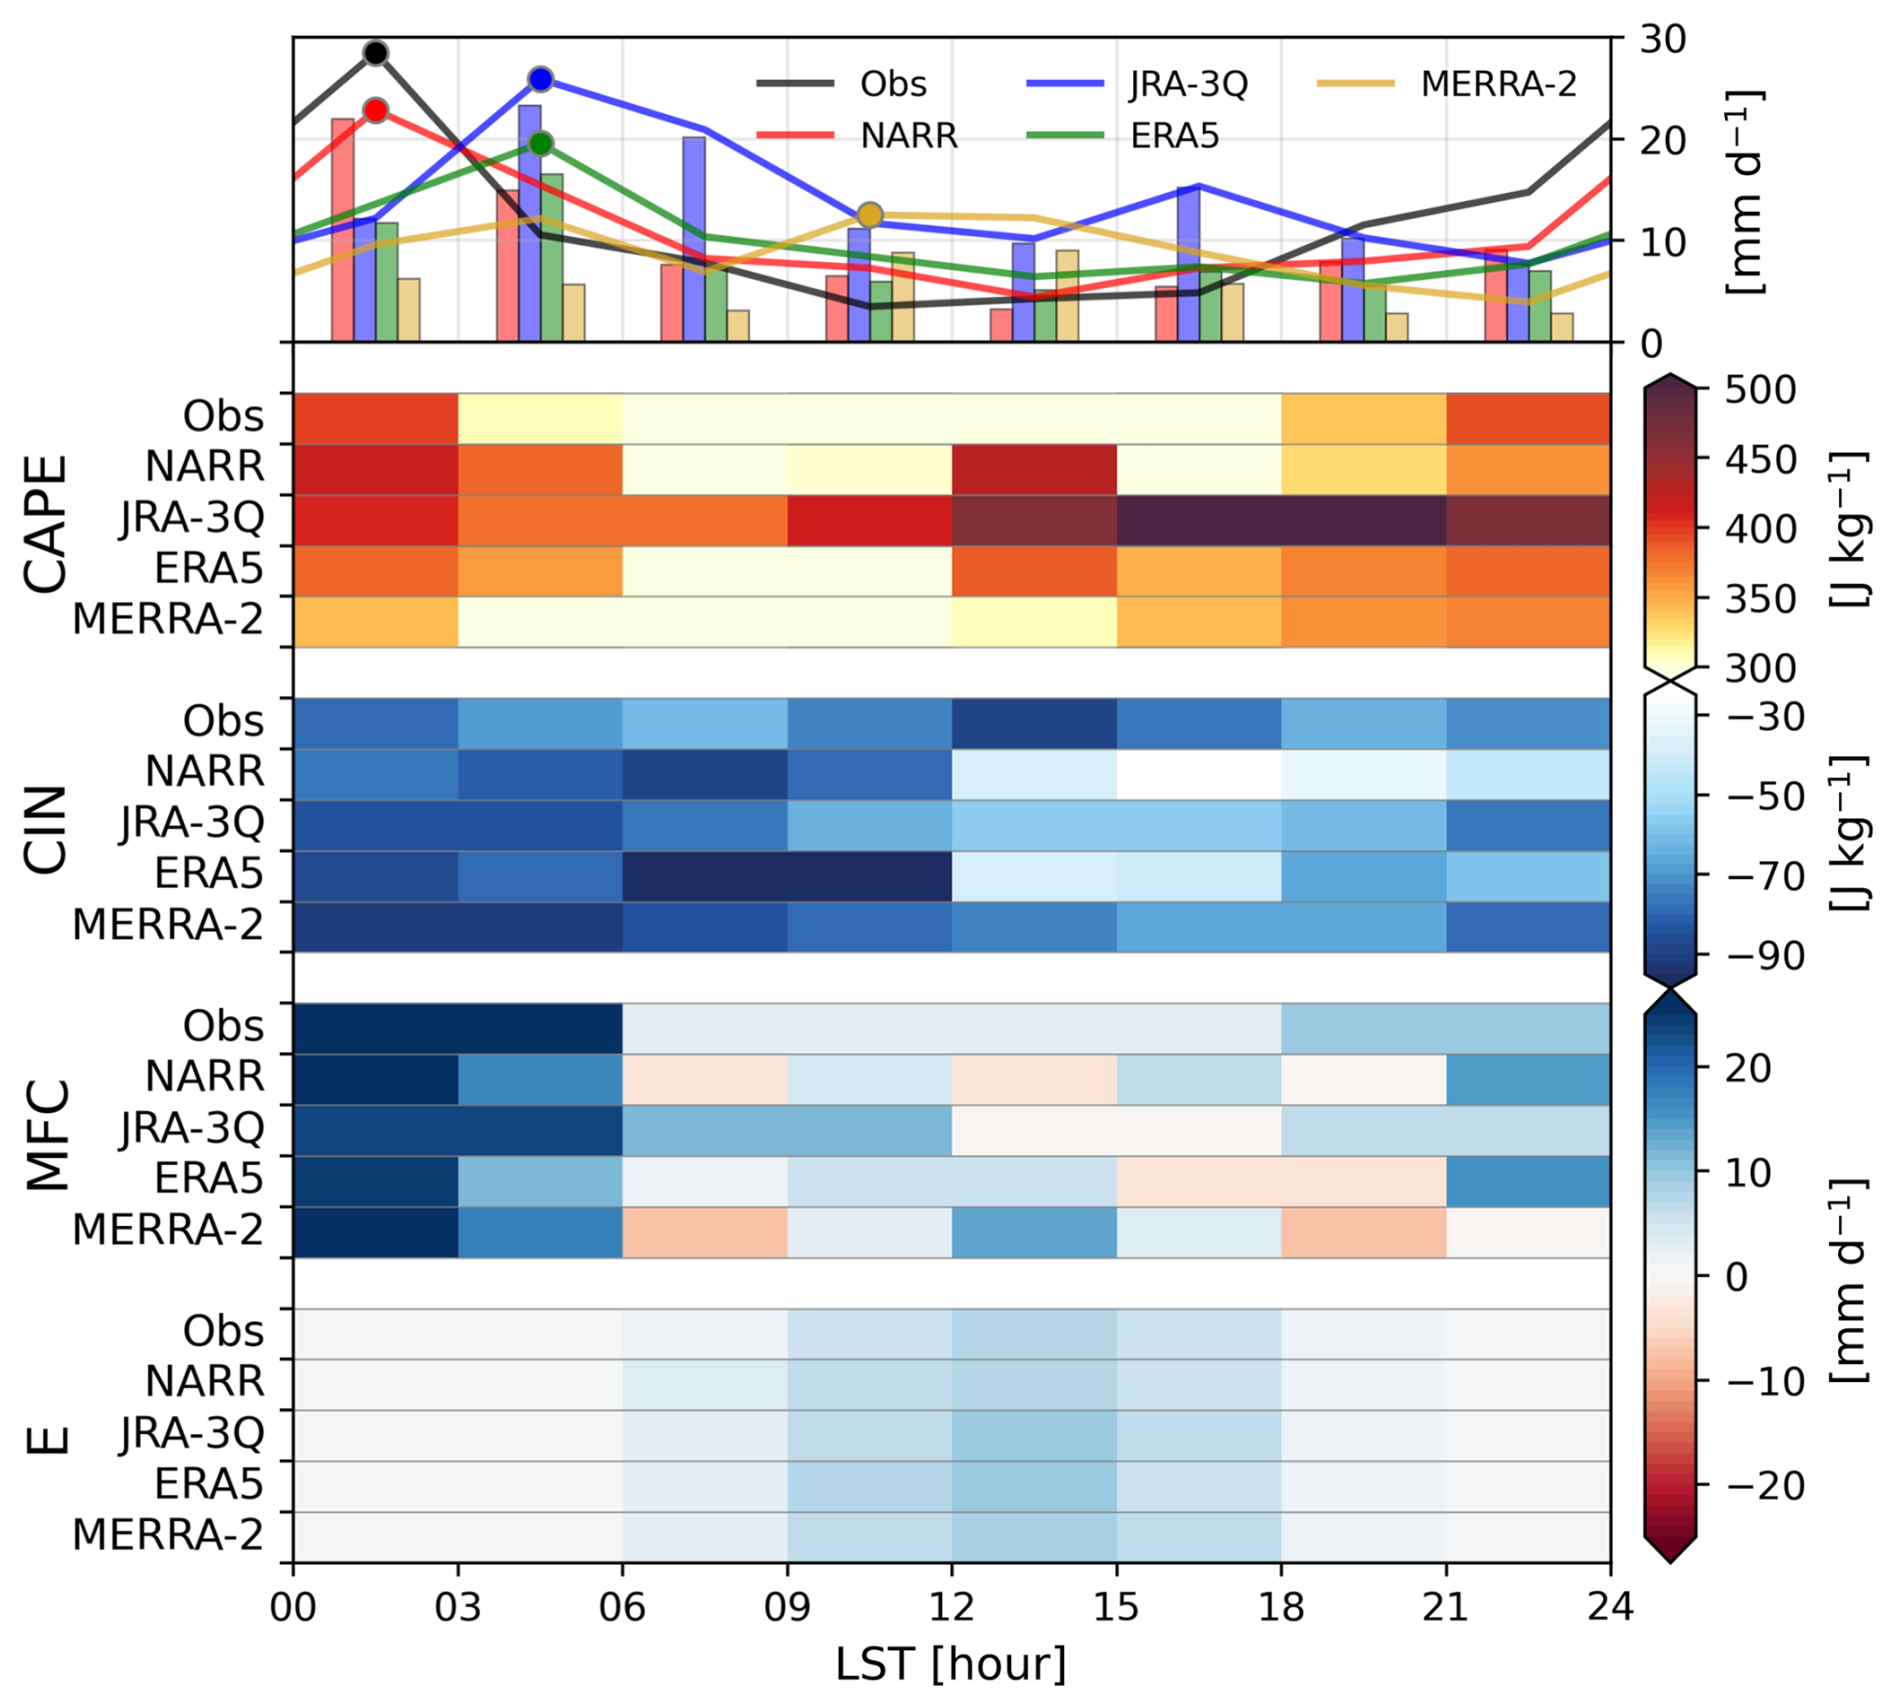
Figure 13Same as Fig. 12, but for ARM SGP site, where results from IGRA2 observation and NARR reanalysis are included.
At the SGP site, the diurnal evolution of key variables governing precipitation occurrence is compared with observations (Fig. 13). E shows similar peaks during 09:00–15:00 LST across all products at the SGP site. However, unlike the evaporation-supplied regime where E provides the essential precondition for convective development, nocturnal precipitation dominates at the SGP site and daytime E does not directly contribute to the nocturnal precipitation maximum (cf., Fig. 12). Observations indicate that MFC serves as the primary moisture source for nocturnal precipitation in this region, rather than daytime moisture supply from the land surface. Observed MFC begins to increase after 18:00 LST and reaches peak values up to 20 mm d−1 during 00:00–06:00 LST, coinciding with the precipitation peak. The vertical profiles of moist static energy (MSE) show the same nocturnal phase, with values in the lower troposphere increasing after sunset as the LLJ transports warm and moist air from the Gulf of Mexico (Fig. S11a). The diurnal phase relationship between CAPE and precipitation follows accordingly. In IGRA2 observations, CIN is weakest at 12:00–15:00 LST, as the LFC rises to its highest level while the lifting condensation level (LCL) remains relatively invariant across the diurnal cycle (not shown). Its magnitude varies little through the day, however, so at this site the diurnal phase is governed more by the evolution of CAPE than by the removal of inhibition. Observed CAPE reaches its maximum at 00:00 LST, which is aligned with the nocturnal precipitation peak.
NARR successfully reproduces both the nocturnal CAPE maximum and the MFC peak phase, exhibiting the strongest nocturnal convergence among the products. This results in a precipitation peak at 00:00–03:00 LST that most closely matches the observations. Its MSE bias is confined to 925 hPa and is negligible between 700 and 500 hPa (Fig. S11b), so the vertical moisture distribution associated with the nocturnal LLJ is the most faithfully reproduced of the four products. In contrast, JRA-3Q and ERA5 exhibit weaker nocturnal MFC values compared to NARR. JRA-3Q shows a double-peak structure, with an afternoon peak at 15:00–18:00 LST driven by the CAPE maximum as CIN erodes to its smallest magnitude at 12:00–18:00 LST and a nocturnal peak (03:00–06:00 LST) driven by MFC. However, this nocturnal precipitation phase is delayed by approximately 3 h relative to both the observed peak and its own MFC maximum. ERA5 similarly displays a broad nocturnal peak between 03:00 and 06:00 LST, representing a consistent 3-hour phase delay. Despite a pronounced CAPE maximum near 12:00–15:00 LST, ERA5 does not develop daytime precipitation, instead responding to nocturnal MFC but with a delayed conversion. Both products carry positive MSE biases in the lower troposphere alongside negative biases between 700 and 500 hPa (Figs. S11c, d), so the mid-troposphere moisture transported by the LLJ is underrepresented, and the delayed conversion of the nocturnal convergence into precipitation is consistent with that shortage.
MERRA-2 presents a distinct moisture budget structure. It captures nocturnal MFC but also exhibits an additional strong daytime convergence peak at 12:00 LST and divergence at 18:00 LST, which distinguishes its MFC diurnal evolution from the other products. It exhibits a relatively weak diurnal cycle in CAPE and a mismatch between instability and rainfall. Its MSE bias is positive at every level (Fig. S11e), yet it produces the weakest nocturnal precipitation of the four products, so both the moisture and the instability are present without being converted into precipitation. This is consistent with the lower precipitation efficiency reported for MERRA-2 (Song and Wei, 2021). The persistence of instability without strong convective development indicates that accumulated energy is not efficiently released, consistent with the decoupled CAPE-precipitation relationship identified in the convergence-supplied regime (cf. Fig. 12b).
The three products fail at different points in the same sequence: NARR reproduces both the nocturnal MFC and the vertical moisture structure delivered by the low-level jet, and its precipitation peaks with the observations; JRA-3Q and ERA5 reproduce the nocturnal convergence but convert it into precipitation 3 h late, without the mid-tropospheric moisture that the low-level jet should deliver; and MERRA-2 peaks in the late morning, with moisture present at every level but little of it converted into precipitation at all. Precipitation timing at the SGP site therefore depends on three factors: the representation of nocturnal MFC, the fidelity of mid-tropospheric moisture transport by the low-level jet, and the efficiency with which accumulated instability is converted into CP (Song et al., 2013; Xie and Zhang, 2000). That NARR reproduces all three is consistent with the constraining effect of precipitation assimilation via latent heating nudging. This technique converts observed precipitation into vertical latent heating profiles and incorporates them into the temperature tendency equation, effectively constraining the convective and grid-scale schemes to produce precipitation at observed times (Lin et al., 1999; Mesinger et al., 2006). This result indicates that where convective parameterizations fail to represent the physical pathway connecting moisture transport to precipitation, direct assimilation of precipitation observations can compensate for that structural limitation. Beyond the SGP site, NARR exhibits the smallest phase biases and the highest correlations with observations across the broader CONUS domain (cf. Fig. 10). For representative sites in the southeastern US where IGRA2 observations are unavailable, NARR is therefore used as the reference for diagnosing the diurnal precipitation characteristics of the other reanalysis products.
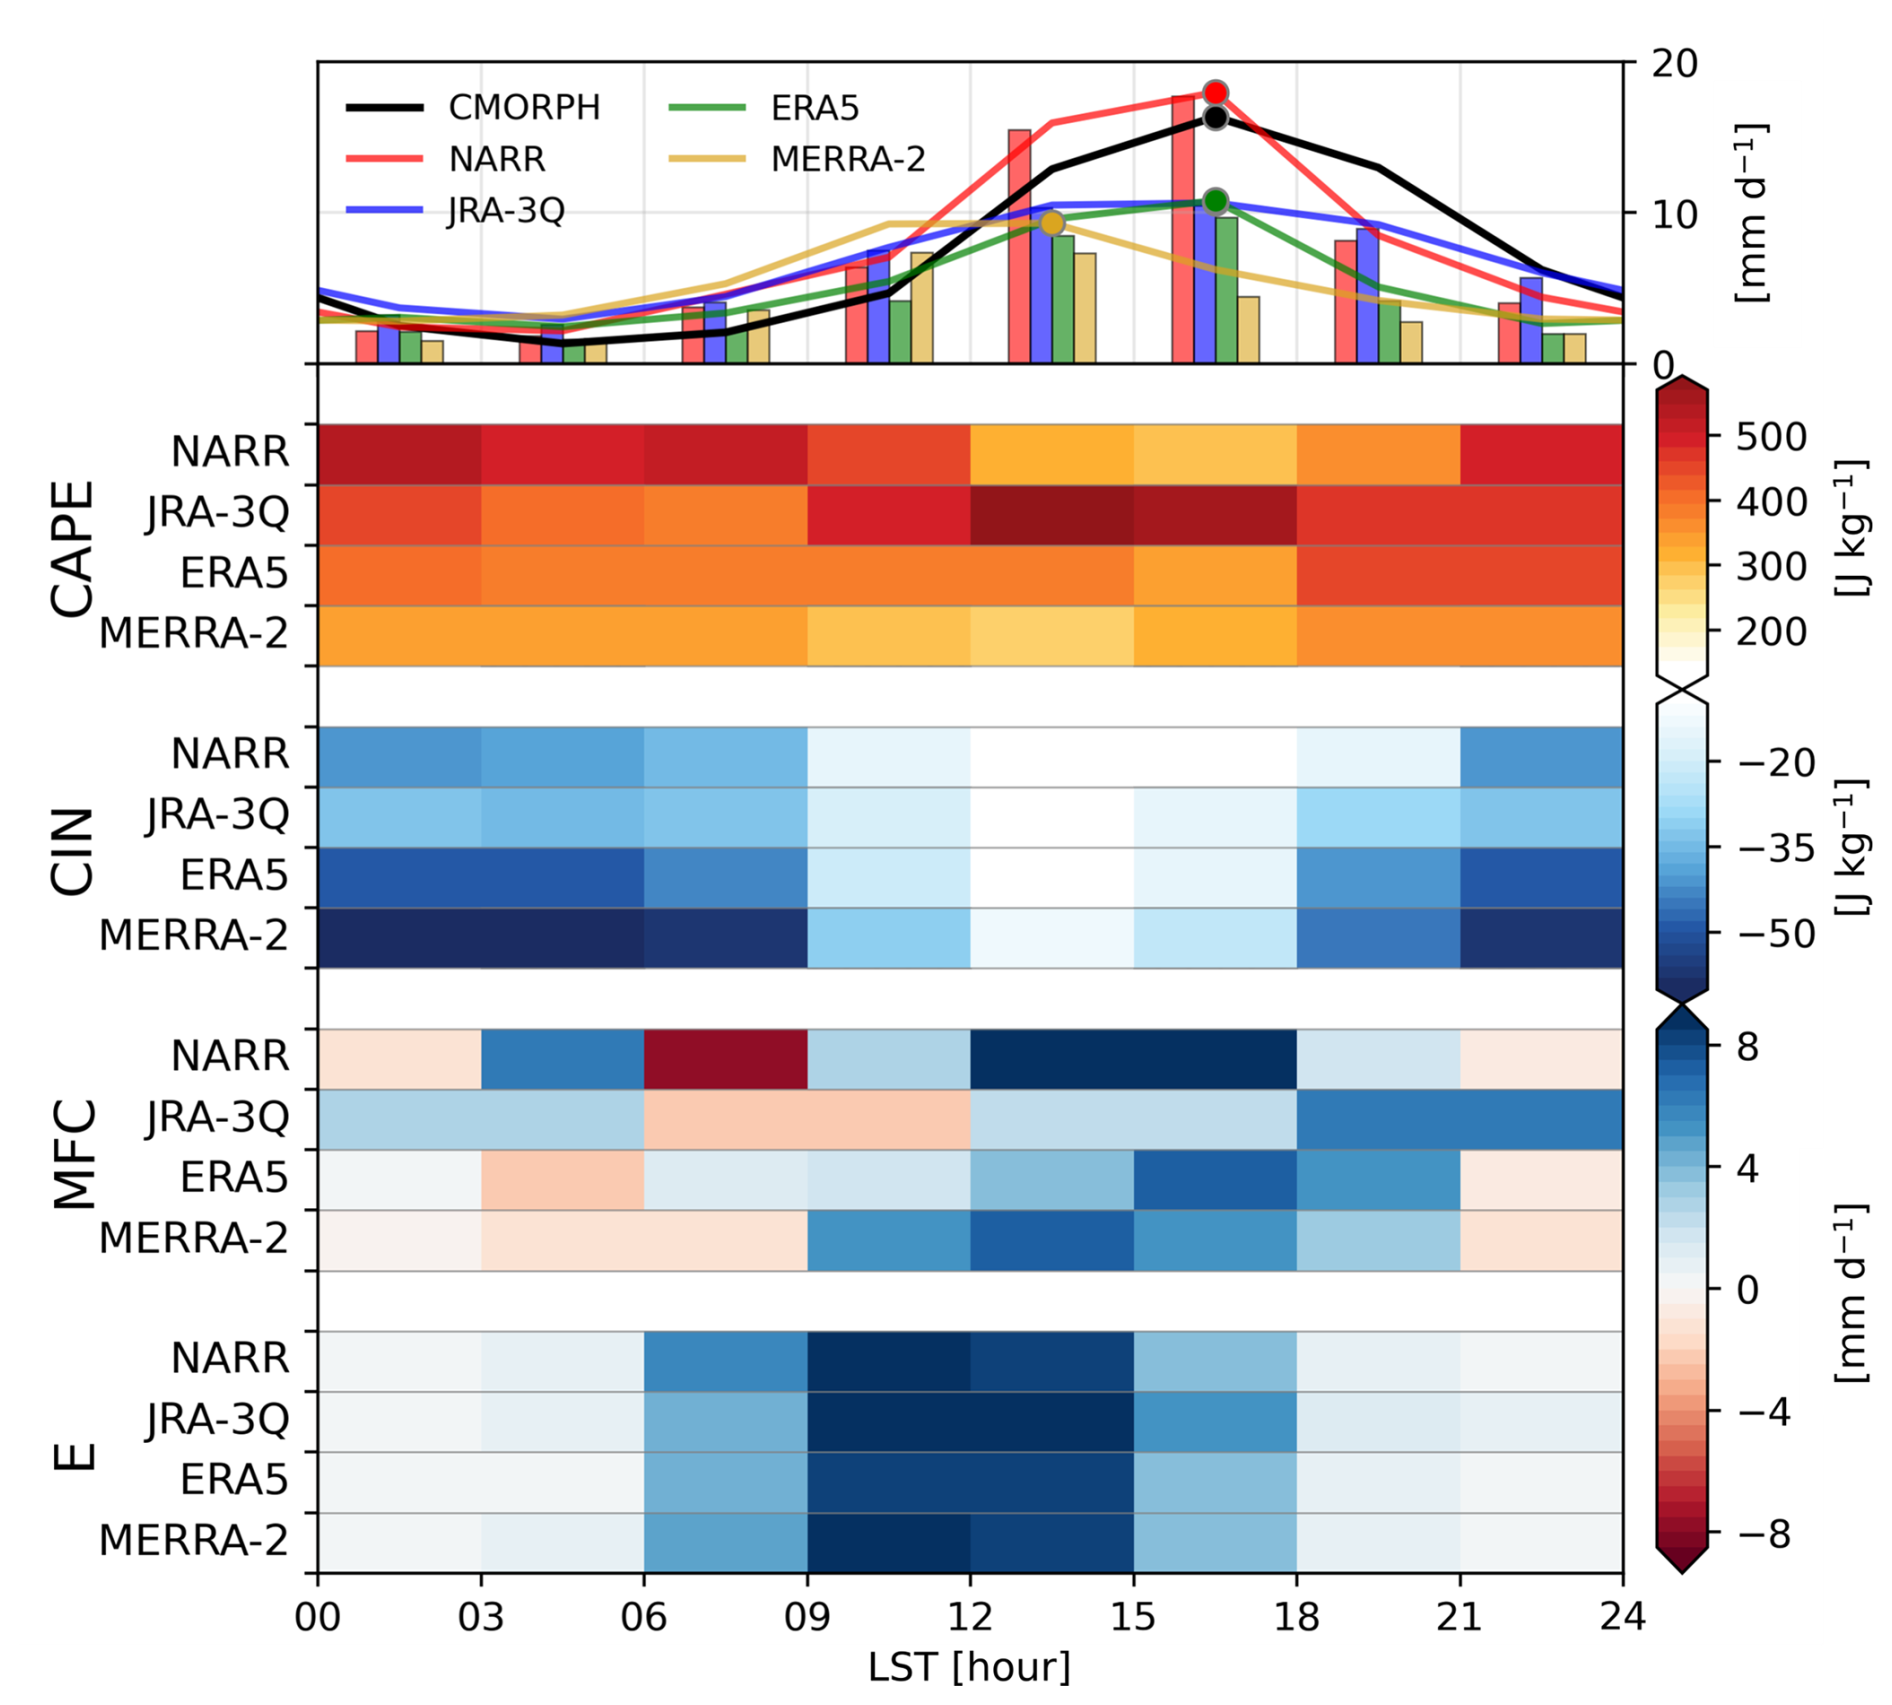
The southeastern US point (33.5° N, 82° W), located near Augusta, Georgia, presents a contrasting case to the SGP (Fig. 14). Summertime precipitation at this location is predominantly governed by the influx of abundant lower-tropospheric moisture along the western periphery of the North Atlantic Subtropical High and intense daytime solar heating, which collectively drive CP during the afternoon (Diem, 2006; Li et al., 2012). Unlike the SGP site, convection here is initiated by daytime boundary layer thermodynamic instability (Rickenbach et al., 2015, 2020), though orographic effects from the Appalachian Mountains may also contribute as a secondary factor through eastward-propagating convective systems (Parker and Ahijevych, 2007). This site, therefore, provides a complementary framework for evaluating how reanalysis convective parameterizations respond to boundary layer thermodynamic forcing, specifically for diagnosing the roles of E and MFC.
CMORPH reveals a distinct precipitation maximum at 15:00–18:00 LST, characterized by land-surface thermodynamic forcing. Among the reanalysis products, NARR demonstrates the highest fidelity in reproducing both the phase and amplitude of the observed diurnal cycle. While ERA5 captures the correct peak phase, it consistently underestimates the precipitation intensity, indicating a dampened convective response to surface forcing. Conversely, JRA-3Q exhibits a 3 h phase lead with a peak at 12:00–15:00 LST, and MERRA-2 displays a notably weak, plateau-like distribution spanning 09:00 to 15:00 LST.
The timing and intensity of convection are regulated by the diurnal evolution of boundary layer instability and inhibition. In NARR and ERA5, CAPE reaches a nocturnal maximum and an afternoon minimum, establishing an anti-phase relationship with precipitation. This nocturnal accumulation is sustained by the preservation of boundary layer moisture from daytime evaporation and free-tropospheric radiative cooling. Convective initiation occurs only after surface heating erodes CIN to near-zero values between 12:00 and 18:00 LST, facilitating the rapid release of stored energy. In contrast, JRA-3Q utilizes a DCAPE-based triggering mechanism that activates convection prematurely while CAPE is still being generated by surface heating, resulting in a coupled CAPE-precipitation relationship and reduced convective intensity. MERRA-2, characterized by the largest nocturnal CIN magnitude, undergoes an abrupt reduction in inhibition at 09:00 LST, which triggers a premature and temporally dispersed release of instability, thereby explaining its plateau-like precipitation structure.
The moisture budget at this site further highlights the distinction between thermodynamic preconditioning and dynamical feedback. Across all evaluated products, E peaks between 09:00 and 15:00 LST, serving as a critical preconditioning process that moistens the boundary layer and reduces the gap between the LCL and the LFC. While E establishes the necessary thermodynamic environment, MFC reveals the dynamic response to convective development. In NARR, the MFC peak during 12:00–18:00 LST signifies that convection-induced mesoscale convergence acts as a positive feedback to amplify thermodynamically initiated precipitation. This feedback-driven intensification is followed by an abrupt decline in precipitation at 18:00–21:00 LST, contrasting with the more symmetrical development and decay observed in CMORPH. ERA5 exhibits a qualitatively similar structure, but its consistent underestimation of the afternoon precipitation amplitude is primarily tied to a weaker MFC response. Furthermore, the rapid decay of precipitation in ERA5 after 18:00 LST is driven by its relatively large CIN magnitude, which reflects a faster post-convective stabilization of the lower troposphere compared to other products. On the other hand, JRA-3Q displays prolonged MFC even after the cessation of E during 18:00–00:00 LST. This sustained moisture convergence, combined with its notably weak CIN, facilitates a gradual rather than sharp decay in precipitation throughout the late evening hours.
This study evaluates sub-daily precipitation variability and diurnal cycle characteristics across five satellite-based products (IMERG, TMPA, CMORPH, GSMaP, and MSWEP) and four reanalysis datasets (ERA5, JRA-3Q, MERRA-2, and NARR), benchmarked against 6824 ground-based observations over the Northern Hemisphere during boreal summer. By quantifying sub-daily variance fractions, decomposing harmonic structures, and diagnosing the physical mechanisms underlying diurnal phase shifts through atmospheric moisture budget analysis complemented by radiosonde observations, this study advances beyond previous intercomparisons confined to satellite products or limited observation sites.
Ground-based observations establish that sub-daily fluctuations account for 65.6 % of total precipitation variance, and that the irregular component associated with convective intermittency and episodic MCS occurrence dominates (approximately 98 %) over the repeatable diurnal signal. All evaluated datasets underestimate this fraction, most of all the reanalysis products, whose parameterization schemes suppress intense sub-daily events while producing light rainfall too often. Within the regular component, the 1st harmonic dominates across all products, but the balance among harmonics is not reproduced, since ERA5 places too much variance in the semi-diurnal component while JRA-3Q overestimates the 1st harmonic component. The multi-model mean matches the observed first harmonic fraction only because these departures cancel, and a comparable cancellation occurs between regions of opposite sign, so agreement in the domain mean does not indicate agreement at individual locations.
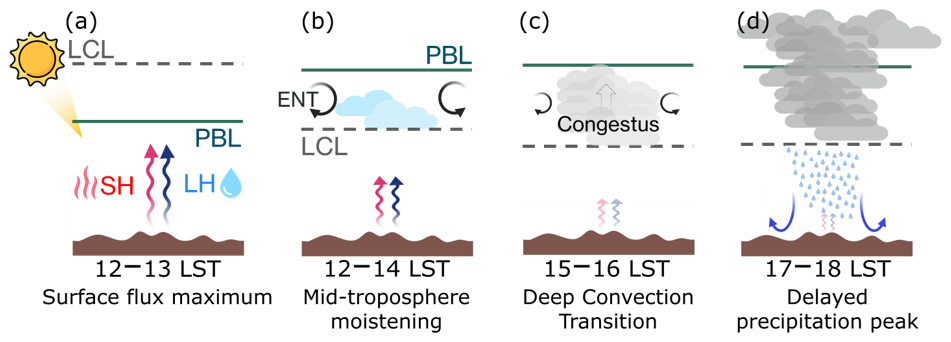
Figure 15Schematic of the shallow-to-deep transition of convective precipitation over land on a summer afternoon. (a) Surface sensible (SH) and latent (LH) heat fluxes peak near 12:00–13:00 LST as the PBL deepens toward the LCL. (b) Shallow cumulus form once the PBL top exceeds the LCL and moisten the lower free troposphere, limited by the entrainment (ENT) of dry environmental air at cloud top. (c) Congestus clouds deepen further within the moistened layer near 15:00–16:00 LST, with weaker ENT as the clouds broaden. (d) Deep convection develops thereafter, and precipitation, reinforced by downdraft outflow at the surface, reaches its maximum near 17:00–18:00 LST.
The two product classes depart from the observations in opposite directions. Satellite products place the afternoon precipitation peak 1–2 h late, which follows from indirect detection by both PMW sensors, which respond to upper-tropospheric ice-scattering signals rather than surface precipitation, and IR retrievals based on cloud-top temperatures. The delay appears alike in products that fill the gaps between overpasses in different ways, so temporal interpolation does not account for it on its own, although the effect of microwave sampling cannot be separated from the detection physics in this analysis. What separates the satellite products is the design of the correction rather than the sensors. CMORPH agrees most closely with the observations in both diurnal phase and amplitude, which reflects a framework that preserves timing through morphing-based propagation and bias correction approach with PDF matching that leaves hourly magnitudes unconstrained. GSMaP shows a reversed land-ocean contrast in sub-daily variance, plausibly associated with its intensity-dependent retrieval bias over land, namely the overestimation of light precipitation frequency and the underestimation of heavy precipitation intensity, then with its daily-scale gauge adjustment. MSWEP inherits an early phase shift from its use of ERA5 reanalysis, illustrating that the choice of reanalysis input can fundamentally compromise the diurnal fidelity of merged satellite products.
Reanalysis products exhibit a phase 3–6 h early over land, from JRA-3Q (16:00 LST) to ERA5 (14:00 LST) and MERRA-2 (12:00 LST). They also underestimate the absolute magnitude of , so the deficiencies extend beyond timing to the intensity. E peaks at the same hour in all three datasets, so the difference lies in how each convective parameterization responds to the resulting destabilization. Figure 15 shows that difference within the sequence separating the surface flux maximum from the precipitation maximum. After the fluxes peak and the PBL deepens past the LCL (a), shallow cumulus moisten the lower free troposphere for 1 to 2 h, a stage held back by the entrainment of dry environmental air at cloud top (b), and only once that layer is moistened can congestus deepen (c) and precipitation reach its maximum (d). The observed lag is the duration of that intermediate stage, and the reanalysis schemes initiate deep convection without completing it.
JRA-3Q departs least from the observations, consistent with its DCAPE-based trigger, which conditions convective onset on both the CAPE threshold and the rate of CAPE generation. That constraint holds the onset through the intermediate stage, but only where moisture is supplied locally at the surface. Comparing the evaporation- and convergence-supplied precipitation regimes shows that this advantage is regime-dependent: JRA-3Q reproduces the observed phase where precipitation is evaporation-supplied, whereas in the convergence-supplied regime all three reanalyses retain their afternoon maxima while the observations peak at night, and the trigger formulation no longer separates the products. The ARM SGP site is one such convergence-supplied location, where NARR uniquely reproduces the observed nocturnal precipitation maximum through direct assimilation of precipitation observations via latent heating nudging. Improving reanalysis diurnal cycles therefore appears to depend on two things: convective triggers that respond to large-scale forcing and not only to local instability, and wider use of precipitation assimilation where the trigger alone is not enough.
The sub-daily fluctuations examined here make up most of total precipitation variance, and every product evaluated in this study underestimates them, whether the precipitation is retrieved from satellite or generated by model physics. Daily and longer averages, which most precipitation evaluations still rely on, do not resolve this part of the variability, even though it is what matters for land-atmosphere coupling (Seo and Dirmeyer, 2022) and for the convective processes analyzed above. Benchmarking several independently developed satellite and reanalysis products against a common set of ground observations helps identify where each product falls short at this time scale and why.
The findings of this study have implications across the disciplines that rely on accurate sub-daily precipitation information. Errors in diurnal phase and intensity in reanalysis products propagate into the representation of land-atmosphere energy and moisture exchanges, bias hydrological simulations of streamflow, and compromise the evaluation of convective parameterization in climate models. The underestimation of sub-daily variance is not confined to one product class but across both satellite and reanalysis datasets, so the representation of precipitation intermittency remains a gap that neither retrieval design nor data assimilation has closed.
This study is limited to Northern Hemisphere land regions during boreal summer, where long-term sub-daily gauge records are dense enough to support the evaluation. Extending the analysis to the Southern Hemisphere, tropical regions, and additional seasons, where the forcing mechanisms and dominant precipitation regimes differ from those examined here, remains a priority for establishing whether the biases identified here generalize beyond the regime sampled. The evaluation of convection-permitting reanalyses, which explicitly resolve mesoscale convective dynamics rather than relying on parameterization, offers a particularly promising avenue for determining whether higher-fidelity process representation can reduce the phase and intermittency biases identified here. Additionally, the rapid emergence of AI-based forecast models such as ECMWF's Artificial Intelligence Forecasting System (AIFS; Lang et al., 2024) raises the question of whether data-driven approaches inherit the phase biases of their training data or instead learn to reproduce the observed diurnal cycle more faithfully.
| Abbreviation | Meaning |
| ARM | Atmospheric Radiation Measurement |
| ARMBEATM | ARM Best Estimate Atmospheric Measurements |
| CAPE | convective available potential energy |
| CIN | convective inhibition |
| CMFD | China Meteorological Forcing Dataset |
| CMIP | Coupled Model Intercomparison Project |
| CMORPH | Climate Prediction Center Morphing Technique |
| CONUS | Contiguous United States |
| CP | convective precipitation |
| CPC | Climate Prediction Center |
| DCAPE | dynamic CAPE generation rate |
| EA | East Asia |
| ECMWF | European Centre for Medium-Range Weather Forecasts |
| ERA5 | ECMWF Reanalysis Version 5 |
| EU | Europe |
| GP | Great Plains |
| GPM | Global Precipitation Measurement |
| GSMaP | Global Satellite Mapping of Precipitation |
| IGRA2 | Integrated Global Radiosonde Archive version 2 |
| IMERG | Integrated Multi-satellite Retrievals for GPM |
| IR | infrared |
| JMA | Japan Meteorological Agency |
| JRA-3Q | Japanese Reanalysis for Three Quarters of a Century |
| LCL | lifting condensation level |
| LFC | level of free convection |
| LLJ | low-level jet |
| LSP | large-scale precipitation |
| LST | local solar time |
| MCS | mesoscale convective system(s) |
| MERRA-2 | Modern-Era Retrospective Analysis for Research and Applications, Version 2 |
| MFC | moisture flux convergence |
| MM | Multi-Model mean |
| MS | Multi-Satellite mean |
| MSE | moist static energy |
| MSWEP | Multi-Source Weighted-Ensemble Precipitation |
| NARR | North American Regional Reanalysis |
| NH | Northern Hemisphere |
| NOAA | National Oceanic and Atmospheric Administration |
| PBL | planetary boundary layer |
| probability density function | |
| PMW | passive microwave |
| RMSE | root-mean-square error |
| SGP | Southern Great Plains |
| TMPA | TRMM Multi-satellite Precipitation Analysis |
| TP | total precipitation |
| TRMM | Tropical Rainfall Measuring Mission |
| UTC | Coordinated Universal Time |
| VARANAL | ARM Variational Analysis |
The analysis code used in this study is available on GitHub (https://github.com/Gyu-kite/Diurnal-cycle-choi-2026, last access: 18 May 2026) and archived on Zenodo (https://doi.org/10.5281/zenodo.19563213) (Choi, 2026).
Ground-based observations used in this study are available from the following sources. A subset of the Global Sub-Daily Rainfall dataset (GSDR; Lewis et al., 2019) is available from Zenodo (https://doi.org/10.5281/zenodo.8369987). HadISD station data (version v3.4.1.2024f) are available from the UK Met Office Hadley Centre (https://www.metoffice.gov.uk/hadobs/hadisd/v341_2024f/download.html, last access: 2 July 2026). German Weather Service (DWD) station observations are available from the DWD Climate Data Center (https://opendata.dwd.de/climate_environment/CDC/observations_germany/climate/hourly/precipitation/historical/, last access: 2 July 2026). Environment and Climate Change Canada (ECCC) station data are available from the ECCC climate data portal (https://dd.weather.gc.ca/today/climate/observations/hourly/csv/, last access: 2 July 2026). Korea Meteorological Administration (KMA) station data are available from the KMA Open MET Data Portal (https://data.kma.go.kr/data/grnd/selectAwsRltmList.do?pgmNo=56, last access: 2 July 2026), subject to the provider's data policy and registration. The China Meteorological Forcing Dataset (CMFD; He et al., 2020) is available from the National Tibetan Plateau Data Center/CASEarth portal (https://data.tpdc.ac.cn/en/data/e60dfd96-5fd8-493f-beae-e8e5d24dece4, last access: 2 July 2026).
Satellite precipitation products are available from the following sources. GPM IMERG Final Run V07 precipitation data are available from the NASA Goddard Earth Sciences Data and Information Services Center (GES DISC; https://disc.gsfc.nasa.gov/datasets/GPM_3IMERGHH_07/summary, last access: 2 July 2026). The TMPA research product (3B42) Version 7 is available from the NASA Goddard Earth Sciences Data and Information Services Center (GES DISC; https://disc.gsfc.nasa.gov/datasets/TRMM_3B42_7/summary, last access: 2 July 2026). CMORPH satellite precipitation data are available from the NOAA National Centers for Environmental Information (https://www.ncei.noaa.gov/data/cmorph-high-resolution-global-precipitation-estimates/access/hourly/0.25deg/, last access: 2 July 2026). GSMaP Version 8 hourly precipitation data were obtained from the JAXA Earth Observation Research Center via the JAXA FTP server (ftp://hokusai.eorc.jaxa.jp/standard/v8/netcdf, registration required; last access: 2 July 2026). MSWEP precipitation data are available for non-commercial research use from GloH2O (https://www.gloh2o.org/mswep/, last access: 2 July 2026).
Reanalysis datasets are available from the following sources. ERA5 reanalysis data are available from the Copernicus Climate Data Store, comprising the hourly data on single levels (https://doi.org/10.24381/cds.adbb2d47, Hersbach et al., 2023a) and on pressure levels (https://doi.org/10.24381/cds.bd0915c6, Hersbach et al., 2023b). JRA-3Q reanalysis data are available from the NSF NCAR Geoscience Data Exchange (GDEX; https://doi.org/10.5065/AVTZ-1H78, Japan Meteorological Agency, 2023; the two-dimensional average diagnostic fields (fcst_phy2m) were used in this study. MERRA-2 reanalysis data are available from the NASA GES DISC, comprising the hourly single-level surface flux diagnostics (M2T1NXFLX; https://doi.org/10.5067/7MCPBJ41Y0K6, Global Modeling and Assimilation Office and Pawson, 2015a) and the six-hourly pressure-level analysis fields (M2I6NPANA; https://doi.org/10.5067/A7S6XP56VZWS, Global Modeling and Assimilation Office and Pawson, 2015b). The North American Regional Reanalysis (NARR) is available from the NCAR Research Data Archive (https://rda.ucar.edu/datasets/ds608.0/, last access: 18 May 2026).
The supplement related to this article is available online at https://doi.org/10.5194/hess-30-6927-2026-supplement.
Conceptualization: GC and ES. Investigation, methodology, and formal analysis: GC, ES, and PAD. Writing (original draft preparation): GC. Writing (review and editing): ES and PAD.
The contact author has declared that none of the authors has any competing interests.
Publisher's note: Copernicus Publications remains neutral with regard to jurisdictional claims made in the text, published maps, institutional affiliations, or any other geographical representation in this paper. The authors bear the ultimate responsibility for providing appropriate place names. Views expressed in the text are those of the authors and do not necessarily reflect the views of the publisher.
This research was supported by the National Research Foundation of Korea (NRF) grant funded by the Korea government (MSIT) (RS-2026-25479797). Gyuyeon Choi was supported by Global–Learning & Academic research institution for Master's⋅PhD students, and Postdocs (LAMP) Program of the National Research Foundation of Korea (NRF) grant funded by the Ministry of Education (RS-2023-00301702).
This research has been supported by the National Research Foundation of Korea (NRF) under RS-2023-00301702 and RS-2026-25479797.
This paper was edited by Francesco Marra and reviewed by two anonymous referees.
Afonso, J. M. de S., Vila, D. A., Gan, M. A., Quispe, D. P., Barreto, N. de J. da C., Huamán Chinchay, J. H., and Palharini, R. S. A.: Precipitation Diurnal Cycle Assessment of Satellite-Based Estimates over Brazil, Remote Sens., 12, 2339, https://doi.org/10.3390/rs12142339, 2020.
Ahn, M.-S., Gleckler, P. J., Lee, J., Pendergrass, A. G., and Jakob, C.: Benchmarking Simulated Precipitation Variability Amplitude across Time Scales, J. Clim., 35, 3173–3196, https://doi.org/10.1175/JCLI-D-21-0542.1, 2022.
Allan, R. P., Barlow, M., Byrne, M. P., Cherchi, A., Douville, H., Fowler, H. J., Gan, T. Y., Pendergrass, A. G., Rosenfeld, D., Swann, A. L. S., Wilcox, L. J., and Zolina, O.: Advances in understanding large-scale responses of the water cycle to climate change, Ann. N. Y. Acad. Sci., 1472, 49–75, https://doi.org/10.1111/nyas.14337, 2020.
Bacmeister, J. T. and Stephens, G. L.: Spatial statistics of likely convective clouds in CloudSat data, J. Geophys. Res. Atmos., 116, D04104, https://doi.org/10.1029/2010JD014444, 2011.
Balsamo, G., Beljaars, A., Scipal, K., Viterbo, P., Van Den Hurk, B., Hirschi, M., and Betts, A. K.: A Revised Hydrology for the ECMWF Model: Verification from Field Site to Terrestrial Water Storage and Impact in the Integrated Forecast System, J. Hydrometeorol., 10, 623–643, https://doi.org/10.1175/2008JHM1068.1, 2009.
Bechtold, P., Köhler, M., Jung, T., Doblas-Reyes, F., Leutbecher, M., Rodwell, M. J., Vitart, F., and Balsamo, G.: Advances in simulating atmospheric variability with the ECMWF model: From synoptic to decadal time-scales, Q. J. R. Meteorol. Soc., 134, 1337–1351, https://doi.org/10.1002/qj.289, 2008.
Bechtold, P., Semane, N., Lopez, P., Chaboureau, J.-P., Beljaars, A., and Bormann, N.: Representing Equilibrium and Nonequilibrium Convection in Large-Scale Models, J. Atmos. Sci., 71, 734–753, https://doi.org/10.1175/JAS-D-13-0163.1, 2014.
Beck, H. E., Wood, E. F., Pan, M., Fisher, C. K., Miralles, D. G., Van Dijk, A. I. J. M., McVicar, T. R., and Adler, R. F.: MSWEP V2 Global 3-Hourly 0.1° Precipitation: Methodology and Quantitative Assessment, Bull. Am. Meteorol. Soc., 100, 473–500, https://doi.org/10.1175/BAMS-D-17-0138.1, 2019.
Beck, H. E., Van Dijk, A. I. J. M., Larraondo, P. R., McVicar, T. R., Pan, M., Dutra, E., and Miralles, D. G.: MSWX: Global 3-Hourly 0.1° Bias-Corrected Meteorological Data Including Near-Real-Time Updates and Forecast Ensembles, Bull. Am. Meteorol. Soc., 103, E710–E732, https://doi.org/10.1175/BAMS-D-21-0145.1, 2022.
Bloom, S. C., Takacs, L. L., Da Silva, A. M., and Ledvina, D.: Data Assimilation Using Incremental Analysis Updates, Mon. Weather Rev., 124, 1256–1271, https://doi.org/10.1175/1520-0493(1996)124<1256:DAUIAU>2.0.CO;2, 1996.
Catto, J. L., Jakob, C., Berry, G., and Nicholls, N.: Relating global precipitation to atmospheric fronts, Geophys. Res. Lett., 39, L10805, https://doi.org/10.1029/2012GL051736, 2012.
Chen, H., Yong, B., Gourley, J. J., Liu, J., Ren, L., Wang, W., Hong, Y., and Zhang, J.: Impact of the crucial geographic and climatic factors on the input source errors of GPM-based global satellite precipitation estimates, J. Hydrol., 575, 1–16, https://doi.org/10.1016/j.jhydrol.2019.05.020, 2019.
Chen, M., Dickinson, R. E., Zeng, X., and Hahmann, A. N.: Comparison of Precipitation Observed over the Continental United States to That Simulated by a Climate Model, J. Clim., 9, 2233–2249, https://doi.org/10.1175/1520-0442(1996)009<2233:COPOOT>2.0.CO;2, 1996.
Chen, X. and Xie, S.: ARM Best Estimate Data Products (ARMBEATM), Atmospheric Radiation Measurement (ARM) User Facility, ARM Data Center [data set], https://doi.org/10.5439/1333748, 1994.
Choi, G.: Gyu-kite/Diurnal-cycle-choi-2026: v1.0.2 – Diurnal cycle analysis code (v1.0.2), Zenodo [code], https://doi.org/10.5281/ZENODO.19563213, 2026.
Christopoulos, C. and Schneider, T.: Assessing Biases and Climate Implications of the Diurnal Precipitation Cycle in Climate Models, Geophys. Res. Lett., 48, e2021GL093017, https://doi.org/10.1029/2021GL093017, 2021.
Covey, C., Gleckler, P. J., Doutriaux, C., Williams, D. N., Dai, A., Fasullo, J., Trenberth, K., and Berg, A.: Metrics for the Diurnal Cycle of Precipitation: Toward Routine Benchmarks for Climate Models, J. Clim., 29, 4461–4471, https://doi.org/10.1175/JCLI-D-15-0664.1, 2016.
Covey, C., Doutriaux, C., Gleckler, P. J., Taylor, K. E., Trenberth, K. E., and Zhang, Y.: High-Frequency Intermittency in Observed and Model-Simulated Precipitation, Geophys. Res. Lett., 45, 12514–12522, https://doi.org/10.1029/2018GL078926, 2018.
Cui, Z., Zhang, G. J., Wang, Y., and Xie, S.: Understanding the Roles of Convective Trigger Functions in the Diurnal Cycle of Precipitation in the NCAR CAM5, J. Clim., 34, 6473–6489, https://doi.org/10.1175/JCLI-D-20-0699.1, 2021.
Dai, A.: Global Precipitation and Thunderstorm Frequencies. Part II: Diurnal Variations, J. Clim., 14, 1112–1128, https://doi.org/10.1175/1520-0442(2001)014<1112:GPATFP>2.0.CO;2, 2001.
Dai, A.: Precipitation Characteristics in Eighteen Coupled Climate Models, J. Clim., 19, 4605–4630, https://doi.org/10.1175/JCLI3884.1, 2006.
Dai, A.: The diurnal cycle from observations and ERA5 in precipitation, clouds, boundary layer height, buoyancy, and surface fluxes, Clim. Dyn., 62, 5879–5908, https://doi.org/10.1007/s00382-024-07182-6, 2024.
Dai, A. and Trenberth, K. E.: The Diurnal Cycle and Its Depiction in the Community Climate System Model, J. Clim., 17, 930–951, https://doi.org/10.1175/1520-0442(2004)017<0930:TDCAID>2.0.CO;2, 2004.
Dai, A., Giorgi, F., and Trenberth, K. E.: Observed and model-simulated diurnal cycles of precipitation over the contiguous United States, J. Geophys. Res. Atmos., 104, 6377–6402, https://doi.org/10.1029/98JD02720, 1999.
Dai, A., Lin, X., and Hsu, K.-L.: The frequency, intensity, and diurnal cycle of precipitation in surface and satellite observations over low- and mid-latitudes, Clim. Dyn., 29, 727–744, https://doi.org/10.1007/s00382-007-0260-y, 2007.
Dai, A., Qian, T., Trenberth, K. E., and Milliman, J. D.: Changes in Continental Freshwater Discharge from 1948 to 2004, J. Clim., 22, 2773–2792, https://doi.org/10.1175/2008JCLI2592.1, 2009.
Daly, C., Neilson, R. P., and Phillips, D. L.: A Statistical-Topographic Model for Mapping Climatological Precipitation over Mountainous Terrain, J. Appl. Meteorol., 33, 140–158, https://doi.org/10.1175/1520-0450(1994)033<0140:ASTMFM>2.0.CO;2, 1994.
Deser, C. and Smith, C. A.: Diurnal and Semidiurnal Variations of the Surface Wind Field over the Tropical Pacific Ocean, J. Clim., 11, 1730–1748, https://doi.org/10.1175/1520-0442(1998)011<1730:DASVOT>2.0.CO;2, 1998.
Diem, J. E.: Synoptic-Scale Controls of Summer Precipitation in the Southeastern United States, J. Clim., 19, 613–621, https://doi.org/10.1175/JCLI3645.1, 2006.
Dirmeyer, P. A., Cash, B. A., Kinter, J. L., Jung, T., Marx, L., Satoh, M., Stan, C., Tomita, H., Towers, P., Wedi, N., Achuthavarier, D., Adams, J. M., Altshuler, E. L., Huang, B., Jin, E. K., and Manganello, J.: Simulating the diurnal cycle of rainfall in global climate models: resolution versus parameterization, Clim. Dyn., 39, 399–418, https://doi.org/10.1007/s00382-011-1127-9, 2012.
Dirmeyer, P. A., Chen, L., Wu, J., Shin, C.-S., Huang, B., Cash, B. A., Bosilovich, M. G., Mahanama, S., Koster, R. D., Santanello, J. A., Ek, M. B., Balsamo, G., Dutra, E., and Lawrence, D. M.: Verification of Land–Atmosphere Coupling in Forecast Models, Reanalyses, and Land Surface Models Using Flux Site Observations, J. Hydrometeorol., 19, 375–392, https://doi.org/10.1175/JHM-D-17-0152.1, 2018.
Donat, M. G., Alexander, L. V., Yang, H., Durre, I., Vose, R., Dunn, R. J. H., Willett, K. M., Aguilar, E., Brunet, M., Caesar, J., Hewitson, B., Jack, C., Klein Tank, A. M. G., Kruger, A. C., Marengo, J., Peterson, T. C., Renom, M., Oria Rojas, C., Rusticucci, M., Salinger, J., Elrayah, A. S., Sekele, S. S., Srivastava, A. K., Trewin, B., Villarroel, C., Vincent, L. A., Zhai, P., Zhang, X., and Kitching, S.: Updated analyses of temperature and precipitation extreme indices since the beginning of the twentieth century: The HadEX2 dataset, J. Geophys. Res. Atmos., 118, 2098–2118, https://doi.org/10.1002/jgrd.50150, 2013.
Dong, W., Krasting, J. P., and Guo, H.: Analysis of Precipitation Diurnal Cycle and Variance in Multiple Observations, CMIP6 Models, and a Series of GFDL-AM4.0 Simulations, J. Clim., 36, 8637–8655, https://doi.org/10.1175/JCLI-D-23-0268.1, 2023.
Dunn, R. J. H., Willett, K. M., Parker, D. E., and Mitchell, L.: Expanding HadISD: quality-controlled, sub-daily station data from 1931, Geosci. Instrum. Methods Data Syst., 5, 473–491, https://doi.org/10.5194/gi-5-473-2016, 2016.
Durre, I., Vose, R. S., and Wuertz, D. B.: Overview of the Integrated Global Radiosonde Archive, J. Clim., 19, 53–68, https://doi.org/10.1175/JCLI3594.1, 2006.
Durre, I., Yin, X., Vose, R. S., Applequist, S., Arnfield, J., Korzeniewski, B., and Hundermark, B.: Integrated Global Radiosonde Archive (IGRA), Version 2, https://doi.org/10.7289/V5X63K0Q, 2016.
Ebert, E. E., Janowiak, J. E., and Kidd, C.: Comparison of Near-Real-Time Precipitation Estimates from Satellite Observations and Numerical Models, Bull. Am. Meteorol. Soc., 88, 47–64, https://doi.org/10.1175/BAMS-88-1-47, 2007.
Fisher, N. I. and Lee, A. J.: Time Series Analysis of Circular Data, J. R. Stat. Soc. Ser. B Methodol., 56, 327–339, https://doi.org/10.1111/j.2517-6161.1994.tb01981.x, 1994.
Freitas, S. R., Grell, G. A., and Li, H.: The Grell–Freitas (GF) convection parameterization: recent developments, extensions, and applications, Geosci. Model Dev., 14, 5393–5411, https://doi.org/10.5194/gmd-14-5393-2021, 2021.
Gao, R., Li, L., Wang, Y., Li, W., Yun, Z., and Gai, Y.: Improvements and limitations of the latest version 8 of GSMaP compared with its former version 7 and IMERG V06 at multiple spatio-temporal scales in mainland China, Atmos. Res., 308, 107517, https://doi.org/10.1016/j.atmosres.2024.107517, 2024.
Gelaro, R., McCarty, W., Suárez, M. J., Todling, R., Molod, A., Takacs, L., Randles, C. A., Darmenov, A., Bosilovich, M. G., Reichle, R., Wargan, K., Coy, L., Cullather, R., Draper, C., Akella, S., Buchard, V., Conaty, A., Da Silva, A. M., Gu, W., Kim, G.-K., Koster, R., Lucchesi, R., Merkova, D., Nielsen, J. E., Partyka, G., Pawson, S., Putman, W., Rienecker, M., Schubert, S. D., Sienkiewicz, M., and Zhao, B.: The Modern-Era Retrospective Analysis for Research and Applications, Version 2 (MERRA-2), J. Clim., 30, 5419–5454, https://doi.org/10.1175/JCLI-D-16-0758.1, 2017.
Gervais, M., Tremblay, L. B., Gyakum, J. R., and Atallah, E.: Representing Extremes in a Daily Gridded Precipitation Analysis over the United States: Impacts of Station Density, Resolution, and Gridding Methods, J. Clim., 27, 5201–5218, https://doi.org/10.1175/JCLI-D-13-00319.1, 2014.
Gibson, P. B., Waliser, D. E., Lee, H., Tian, B., and Massoud, E.: Climate Model Evaluation in the Presence of Observational Uncertainty: Precipitation Indices over the Contiguous United States, J. Hydrometeorol., 20, 1339–1357, https://doi.org/10.1175/JHM-D-18-0230.1, 2019.
Global Modeling and Assimilation Office and Pawson, S.: MERRA-2 tavg1_2d_flx_Nx: 2d, 1-Hourly, Time-Averaged, Single-Level, Assimilation, Surface Flux Diagnostics V5.12.4, NASA Goddard Earth Sciences Data and Information Services Center [data set], https://doi.org/10.5067/7MCPBJ41Y0K6, 2015a.
Global Modeling and Assimilation Office and Pawson, S.: MERRA-2 inst6_3d_ana_Np: 3d, 6-Hourly, Instantaneous, Pressure-Level, Analysis, Analyzed Meteorological Fields V5.12.4, NASA Goddard Earth Sciences Data and Information Services Center [data set], https://doi.org/10.5067/A7S6XP56VZWS, 2015b.
Gray, W. M. and Jacobson, R. W.: Diurnal Variation of Deep Cumulus Convection, Mon. Weather Rev., 105, 1171–1188, https://doi.org/10.1175/1520-0493(1977)105<1171:DVODCC>2.0.CO;2, 1977.
Guilloteau, C., Foufoula-Georgiou, E., Kummerow, C. D., and Petković, V.: Resolving Surface Rain from GMI High-Frequency Channels: Limits Imposed by the Three-Dimensional Structure of Precipitation, J. Atmos. Ocean. Technol., 35, 1835–1847, https://doi.org/10.1175/JTECH-D-18-0011.1, 2018.
Hawcroft, M. K., Shaffrey, L. C., Hodges, K. I., and Dacre, H. F.: How much Northern Hemisphere precipitation is associated with extratropical cyclones?, Geophys. Res. Lett., 39, L24809, https://doi.org/10.1029/2012GL053866, 2012.
Hayden, L. and Liu, C.: Differences in the Diurnal Variation of Precipitation Estimated by Spaceborne Radar, Passive Microwave Radiometer, and IMERG, J. Geophys. Res. Atmos., 126, e2020JD033020, https://doi.org/10.1029/2020JD033020, 2021.
He, C. and Li, T.: Does global warming amplify interannual climate variability?, Clim. Dyn., 52, 2667–2684, https://doi.org/10.1007/s00382-018-4286-0, 2019.
He, J., Yang, K., Tang, W., Lu, H., Qin, J., Chen, Y., and Li, X.: The first high-resolution meteorological forcing dataset for land process studies over China, Sci. Data, 7, 25, https://doi.org/10.1038/s41597-020-0369-y, 2020.
Herold, N., Alexander, L. V., Donat, M. G., Contractor, S., and Becker, A.: How much does it rain over land?, Geophys. Res. Lett., 43, 341–348, https://doi.org/10.1002/2015GL066615, 2016.
Hersbach, H., Bell, B., Berrisford, P., Hirahara, S., Horányi, A., Muñoz-Sabater, J., Nicolas, J., Peubey, C., Radu, R., Schepers, D., Simmons, A., Soci, C., Abdalla, S., Abellan, X., Balsamo, G., Bechtold, P., Biavati, G., Bidlot, J., Bonavita, M., De Chiara, G., Dahlgren, P., Dee, D., Diamantakis, M., Dragani, R., Flemming, J., Forbes, R., Fuentes, M., Geer, A., Haimberger, L., Healy, S., Hogan, R. J., Hólm, E., Janisková, M., Keeley, S., Laloyaux, P., Lopez, P., Lupu, C., Radnoti, G., De Rosnay, P., Rozum, I., Vamborg, F., Villaume, S., and Thépaut, J.: The ERA5 global reanalysis, Q. J. R. Meteorol. Soc., 146, 1999–2049, https://doi.org/10.1002/qj.3803, 2020.
Hersbach, H., Bell, B., Berrisford, P., Biavati, G., Horányi, A., Muñoz Sabater, J., Nicolas, J., Peubey, C., Radu, R., Rozum, I., Schepers, D., Simmons, A., Soci, C., Dee, D., and Thépaut, J-N.: ERA5 hourly data on single levels from 1940 to present, Copernicus Climate Change Service (C3S) Climate Data Store (CDS), https://doi.org/10.24381/cds.adbb2d47, 2023a.
Hersbach, H., Bell, B., Berrisford, P., Biavati, G., Horányi, A., Muñoz Sabater, J., Nicolas, J., Peubey, C., Radu, R., Rozum, I., Schepers, D., Simmons, A., Soci, C., Dee, D., and Thépaut, J-N.: ERA5 hourly data on pressure levels from 1940 to present, Copernicus Climate Change Service (C3S) Climate Data Store (CDS), https://doi.org/10.24381/cds.bd0915c6, 2023b.
Higgins, R. W., Yao, Y., Yarosh, E. S., Janowiak, J. E., and Mo, K. C.: Influence of the Great Plains Low-Level Jet on Summertime Precipitation and Moisture Transport over the Central United States, J. Clim., 10, 481–507, https://doi.org/10.1175/1520-0442(1997)010<0481:IOTGPL>2.0.CO;2, 1997.
Houze, R. A.: Mesoscale convective systems, Rev. Geophys., 42, RG4003, https://doi.org/10.1029/2004RG000150, 2004.
Huang, P. and Xie, S.-P.: Mechanisms of change in ENSO-induced tropical Pacific rainfall variability in a warming climate, Nat. Geosci., 8, 922–926, https://doi.org/10.1038/ngeo2571, 2015.
Huffman, G. J., Bolvin, D. T., Nelkin, E. J., Wolff, D. B., Adler, R. F., Gu, G., Hong, Y., Bowman, K. P., and Stocker, E. F.: The TRMM Multisatellite Precipitation Analysis (TMPA): Quasi-Global, Multiyear, Combined-Sensor Precipitation Estimates at Fine Scales, J. Hydrometeorol., 8, 38–55, https://doi.org/10.1175/JHM560.1, 2007.
Huffman, G. J., Bolvin, D. T., Braithwaite, D., Hsu, K.-L., Joyce, R. J., Kidd, C., Nelkin, E. J., Sorooshian, S., Stocker, E. F., Tan, J., Wolff, D. B., and Xie, P.: Integrated Multi-satellite Retrievals for the Global Precipitation Measurement (GPM) Mission (IMERG), in: Satellite Precipitation Measurement: Volume 1, edited by: Levizzani, V., Kidd, C., Kirschbaum, D. B., Kummerow, C. D., Nakamura, K., and Turk, F. J., Springer International Publishing, Cham, 343–353, https://doi.org/10.1007/978-3-030-24568-9_19, 2020.
Huffman, G. J., Stocker, E. F., Bolvin, D. T., Nelkin, E. J., and Tan, J.: GPM IMERG Final Precipitation L3 Half Hourly 0.1° × 0.1° V07, Goddard Earth Sciences Data and Information Services Center (GES DISC) [data set], https://doi.org/10.5067/GPM/IMERG/3B-HH/07, 2023.
Huffman, G. J., Bolvin, D. T., Joyce, R., Nelkin, E. J., Tan, J., Braithwaite, D., Hsu, K., Kelley, O. A., Nguyen, P., Sorooshian, S., Watters, D. C., West, B. J., and Xie, P.: Algorithm Theoretical Basis Document (ATBD): NASA Global Precipitation Measurement (GPM) Integrated Multi-satellitE Retrievals for GPM (IMERG) Version 07, National Aeronautics and Space Administration (NASA), 54 pp., https://gpm.nasa.gov/resources/documents/imerg-v07-atbd (last access: 15 September 2026), 2026.
Janowiak, J. E., Joyce, R. J., and Yarosh, Y.: A Real-Time Global Half-Hourly Pixel-Resolution Infrared Dataset and Its Applications, Bull. Am. Meteorol. Soc., 82, 205–218, https://doi.org/10.1175/1520-0477(2001)082<0205:ARTGHH>2.3.CO;2, 2001.
Janowiak, J. E., Kousky, V. E., and Joyce, R. J.: Diurnal cycle of precipitation determined from the CMORPH high spatial and temporal resolution global precipitation analyses, J. Geophys. Res. Atmos., 110, D23105, https://doi.org/10.1029/2005JD006156, 2005.
Japan Meteorological Agency: Japanese Reanalysis for Three Quarters of a Century (JRA-3Q), NSF National Center for Atmospheric Research, https://doi.org/10.5065/AVTZ-1H78, 2023.
Jiang, X., Adames, Á. F., Kim, D., Maloney, E. D., Lin, H., Kim, H., Zhang, C., DeMott, C. A., and Klingaman, N. P.: Fifty Years of Research on the Madden-Julian Oscillation: Recent Progress, Challenges, and Perspectives, J. Geophys. Res. Atmos., 125, e2019JD030911, https://doi.org/10.1029/2019JD030911, 2020.
Joyce, R. J. and Xie, P.: Kalman Filter–Based CMORPH, J. Hydrometeorol., 12, 1547–1563, https://doi.org/10.1175/JHM-D-11-022.1, 2011.
Joyce, R. J., Janowiak, J. E., Arkin, P. A., and Xie, P.: CMORPH: A Method that Produces Global Precipitation Estimates from Passive Microwave and Infrared Data at High Spatial and Temporal Resolution, J. Hydrometeorol., 5, 487–503, https://doi.org/10.1175/1525-7541(2004)005<0487:CAMTPG>2.0.CO;2, 2004.
Karger, D. N., Conrad, O., Böhner, J., Kawohl, T., Kreft, H., Soria-Auza, R. W., Zimmermann, N. E., Linder, H. P., and Kessler, M.: Climatologies at high resolution for the earth's land surface areas, Sci. Data, 4, 170122, https://doi.org/10.1038/sdata.2017.122, 2017.
Kobayashi, S., Ota, Y., Harada, Y., Ebita, A., Moriya, M., Onoda, H., Onogi, K., Kamahori, H., Kobayashi, C., Endo, H., Miyaoka, K., and Takahashi, K.: The JRA-55 Reanalysis: General Specifications and Basic Characteristics, J. Meteorol. Soc. Jpn. Ser II, 93, 5–48, https://doi.org/10.2151/jmsj.2015-001, 2015.
Kosaka, Y., Kobayashi, S., Harada, Y., Kobayashi, C., Naoe, H., Yoshimoto, K., Harada, M., Goto, N., Chiba, J., Miyaoka, K., Sekiguchi, R., Deushi, M., Kamahori, H., Nakaegawa, T., Tanaka, T. Y., Tokuhiro, T., Sato, Y., Matsushita, Y., and Onogi, K.: The JRA-3Q Reanalysis, J. Meteorol. Soc. Jpn. Ser. II, 102, 49–109, https://doi.org/10.2151/jmsj.2024-004, 2024.
Kubota, T., Aonashi, K., Ushio, T., Shige, S., Takayabu, Y. N., Kachi, M., Arai, Y., Tashima, T., Masaki, T., Kawamoto, N., Mega, T., Yamamoto, M. K., Hamada, A., Yamaji, M., Liu, G., and Oki, R.: Global Satellite Mapping of Precipitation (GSMaP) Products in the GPM Era, in: Satellite Precipitation Measurement: Volume 1, edited by: Levizzani, V., Kidd, C., Kirschbaum, D. B., Kummerow, C. D., Nakamura, K., and Turk, F. J., Springer International Publishing, Cham, 355–373, https://doi.org/10.1007/978-3-030-24568-9_20, 2020.
Kubota, T., Aonashi, K., Ushio, T., Shige, S., Yamaji, M., Yamamoto, M., Hirose, H., and Takayabu, Y.: A new version of Global Satellite Mapping of Precipitation (GSMaP) product released in December 2021, EGU22-3328, Copernicus Meetings, https://doi.org/10.5194/egusphere-egu22-3328, 2022.
Kummerow, C., Barnes, W., Kozu, T., Shiue, J., and Simpson, J.: The Tropical Rainfall Measuring Mission (TRMM) Sensor Package, J. Atmos. Ocean. Technol., 15, 809–817, https://doi.org/10.1175/1520-0426(1998)015<0809:TTRMMT>2.0.CO;2, 1998.
Lang, S., Alexe, M., Chantry, M., Dramsch, J., Pinault, F., Raoult, B., Clare, M. C. A., Lessig, C., Maier-Gerber, M., Magnusson, L., Bouallègue, Z. B., Nemesio, A. P., Dueben, P. D., Brown, A., Pappenberger, F., and Rabier, F.: AIFS – ECMWF's data-driven forecasting system, arXiv [preprint], https://doi.org/10.48550/arXiv.2406.01465, 2024.
Lavers, D. A., Simmons, A., Vamborg, F., and Rodwell, M. J.: An evaluation of ERA5 precipitation for climate monitoring, Q. J. R. Meteorol. Soc., 148, 3152–3165, https://doi.org/10.1002/qj.4351, 2022.
Lewis, E., Fowler, H., Alexander, L., Dunn, R., McClean, F., Barbero, R., Guerreiro, S., Li, X.-F., and Blenkinsop, S.: GSDR: A Global Sub-Daily Rainfall Dataset, J. Clim., 32, 4715–4729, https://doi.org/10.1175/JCLI-D-18-0143.1, 2019.
Li, L., Li, W., and Kushnir, Y.: Variation of the North Atlantic subtropical high western ridge and its implication to Southeastern US summer precipitation, Clim. Dyn., 39, 1401–1412, https://doi.org/10.1007/s00382-011-1214-y, 2012.
Li, P., Li, X.-F., Yu, J., and Yang, S.: Land-Sea Contrast of Global Hourly Precipitation Intensity in ERA5: Dominant Role of Convective Precipitation, Geophys. Res. Lett., 52, e2025GL114733, https://doi.org/10.1029/2025GL114733, 2025.
Light, C. X., Arbic, B. K., Martin, P. E., Brodeau, L., Farrar, J. T., Griffies, S. M., Kirtman, B. P., Laurindo, L. C., Menemenlis, D., Molod, A., Nelson, A. D., Nyadjro, E., O'Rourke, A. K., Shriver, J. F., Siqueira, L., Small, R. J., and Strobach, E.: Effects of grid spacing on high-frequency precipitation variance in coupled high-resolution global ocean–atmosphere models, Clim. Dyn., 59, 2887–2913, https://doi.org/10.1007/s00382-022-06257-6, 2022.
Lin, Y., Mitchell, K. E., Rogers, E., Baldwin, M. E., and DiMego, G. J.: Test assimilations of the real-time, multi-sensor hourly precipitation analysis into the NCEP Eta model, in: Preprints, 8th Conf. on Mesoscale Meteorology, Boulder, CO, Amer. Meteor. Soc, 341–344, 1999.
Love, B. S., Matthews, A. J., and Lister, G. M. S.: The diurnal cycle of precipitation over the Maritime Continent in a high-resolution atmospheric model, Q. J. R. Meteorol. Soc., 137, 934–947, https://doi.org/10.1002/qj.809, 2011.
Lu, D. and Yong, B.: A Preliminary Assessment of the Gauge-Adjusted Near-Real-Time GSMaP Precipitation Estimate over Mainland China, Remote Sens., 12, 141, https://doi.org/10.3390/rs12010141, 2020.
Lu, J., Li, T., and Wang, L.: Precipitation Diurnal Cycle over the Maritime Continent Modulated by the Climatological Annual Cycle, J. Clim., 34, 1387–1402, https://doi.org/10.1175/JCLI-D-20-0130.1, 2021.
May, R. M., Goebbert, K. H., Thielen, J. E., Leeman, J. R., Camron, M. D., Bruick, Z., Bruning, E. C., Manser, R. P., Arms, S. C., and Marsh, P. T.: MetPy: A Meteorological Python Library for Data Analysis and Visualization, Bull. Am. Meteorol. Soc., 103, E2273–E2284, https://doi.org/10.1175/BAMS-D-21-0125.1, 2022.
Mega, T., Ushio, T., Takahiro, M., Kubota, T., Kachi, M., and Oki, R.: Gauge-Adjusted Global Satellite Mapping of Precipitation, IEEE Trans. Geosci. Remote Sens., 57, 1928–1935, https://doi.org/10.1109/TGRS.2018.2870199, 2019.
Mesinger, F., DiMego, G., Kalnay, E., Mitchell, K., Shafran, P. C., Ebisuzaki, W., Jović, D., Woollen, J., Rogers, E., Berbery, E. H., Ek, M. B., Fan, Y., Grumbine, R., Higgins, W., Li, H., Lin, Y., Manikin, G., Parrish, D., and Shi, W.: North American Regional Reanalysis, Bull. Am. Meteorol. Soc., 87, 343–360, https://doi.org/10.1175/BAMS-87-3-343, 2006.
Miralles, D. G., Gentine, P., Seneviratne, S. I., and Teuling, A. J.: Land–atmospheric feedbacks during droughts and heatwaves: state of the science and current challenges, Ann. N. Y. Acad. Sci., 1436, 19–35, https://doi.org/10.1111/nyas.13912, 2019.
Molod, A., Takacs, L., Suarez, M., and Bacmeister, J.: Development of the GEOS-5 atmospheric general circulation model: evolution from MERRA to MERRA2, Geosci. Model Dev., 8, 1339–1356, https://doi.org/10.5194/gmd-8-1339-2015, 2015.
Mori, S., Jun-Ichi, H., Tauhid, Y. I., Yamanaka, M. D., Okamoto, N., Murata, F., Sakurai, N., Hashiguchi, H., and Sribimawati, T.: Diurnal Land–Sea Rainfall Peak Migration over Sumatera Island, Indonesian Maritime Continent, Observed by TRMM Satellite and Intensive Rawinsonde Soundings, Mon. Weather Rev., 132, 2021–2039, https://doi.org/10.1175/1520-0493(2004)132<2021:DLRPMO>2.0.CO;2, 2004.
Ning, S., Song, F., Udmale, P., Jin, J., Thapa, B. R., and Ishidaira, H.: Error Analysis and Evaluation of the Latest GSMap and IMERG Precipitation Products over Eastern China, Adv. Meteorol., 2017, 1803492, https://doi.org/10.1155/2017/1803492, 2017.
Oki, T. and Kanae, S.: Global Hydrological Cycles and World Water Resources, Science, 313, 1068–1072, https://doi.org/10.1126/science.1128845, 2006.
Oppenheim, A. V. and Schafer, R. W.: Discrete-Time Signal Processing, 3rd edn., Pearson, Upper Saddle River, NJ, 1144 pp., ISBN 978-0-13-198842-2, 2010.
Osborn, T. J. and Hulme, M.: Development of a Relationship between Station and Grid-Box Rainday Frequencies for Climate Model Evaluation, J. Clim., 10, 1885–1908, https://doi.org/10.1175/1520-0442(1997)010<1885:DOARBS>2.0.CO;2, 1997.
Parker, M. D. and Ahijevych, D. A.: Convective Episodes in the East-Central United States, Mon. Weather Rev., 135, 3707–3727, https://doi.org/10.1175/2007MWR2098.1, 2007.
Petković, V., Kummerow, C. D., Randel, D. L., Pierce, J. R., and Kodros, J. K.: Improving the Quality of Heavy Precipitation Estimates from Satellite Passive Microwave Rainfall Retrievals, J. Hydrometeorol., 19, 69–85, https://doi.org/10.1175/JHM-D-17-0069.1, 2018.
Pfahl, S. and Wernli, H.: Quantifying the Relevance of Cyclones for Precipitation Extremes, J. Clim., 25, 6770–6780, https://doi.org/10.1175/JCLI-D-11-00705.1, 2012.
Pradhan, R. K., Markonis, Y., Marra, F., Nikolopoulos, E. I., Papalexiou, S. M., and Levizzani, V.: Diurnal variability of global precipitation: insights from hourly satellite and reanalysis datasets, Hydrol. Earth Syst. Sci., 29, 4929–4949, https://doi.org/10.5194/hess-29-4929-2025, 2025.
Rickenbach, T. M., Nieto-Ferreira, R., Zarzar, C., and Nelson, B.: A seasonal and diurnal climatology of precipitation organization in the southeastern United States, Q. J. R. Meteorol. Soc., 141, 1938–1956, https://doi.org/10.1002/qj.2500, 2015.
Rickenbach, T. M., Ferreira, R. N., and Wells, H.: Springtime Onset of Isolated Convection Precipitation across the Southeastern United States: Framework and Regional Evolution, Mon. Weather Rev., 148, 891–906, https://doi.org/10.1175/MWR-D-19-0279.1, 2020.
Schneider, U., Becker, A., Finger, P., Meyer-Christoffer, A., Ziese, M., and Rudolf, B.: GPCC's new land surface precipitation climatology based on quality-controlled in situ data and its role in quantifying the global water cycle, Theor. Appl. Climatol., 115, 15–40, https://doi.org/10.1007/s00704-013-0860-x, 2014.
Schneider, U., Hänsel, S., Finger, P., Rustemeier, E., and Ziese, M.: GPCC Full Data Monthly Version 2022 at 0.25°: Monthly Land-Surface Precipitation from Rain-Gauges built on GTS-based and Historic Data: Globally Gridded Monthly Totals (2022), Global Precipitation Climatology Centre (GPCC) at Deutscher Wetterdienst [data set], https://doi.org/10.5676/DWD_GPCC/FD_M_V2022_025, 2022.
Seo, E. and Dirmeyer, P. A.: Understanding the diurnal cycle of land–atmosphere interactions from flux site observations, Hydrol. Earth Syst. Sci., 26, 5411–5429, https://doi.org/10.5194/hess-26-5411-2022, 2022.
Shapiro, A., Fedorovich, E., and Rahimi, S.: A Unified Theory for the Great Plains Nocturnal Low-Level Jet, J. Atmos. Sci., 73, 3037–3057, https://doi.org/10.1175/JAS-D-15-0307.1, 2016.
Skok, G., Žagar, N., Honzak, L., Žabkar, R., Rakovec, J., and Ceglar, A.: Precipitation intercomparison of a set of satellite- and raingauge-derived datasets, ERA Interim reanalysis, and a single WRF regional climate simulation over Europe and the North Atlantic, Theor. Appl. Climatol., 123, 217–232, https://doi.org/10.1007/s00704-014-1350-5, 2016.
Soci, C., Hersbach, H., Simmons, A., Poli, P., Bell, B., Berrisford, P., Horányi, A., Muñoz-Sabater, J., Nicolas, J., Radu, R., Schepers, D., Villaume, S., Haimberger, L., Woollen, J., Buontempo, C., and Thépaut, J.-N.: The ERA5 global reanalysis from 1940 to 2022, Q. J. R. Meteorol. Soc., 150, 4014–4048, https://doi.org/10.1002/qj.4803, 2024.
Song, H., Lin, W., Lin, Y., Wolf, A. B., Neggers, R., Donner, L. J., Del Genio, A. D., and Liu, Y.: Evaluation of Precipitation Simulated by Seven SCMs against the ARM Observations at the SGP Site, J. Clim., 26, 5467–5492, https://doi.org/10.1175/JCLI-D-12-00263.1, 2013.
Song, J., Song, F., Feng, Z., Leung, L. R., Li, C., and Wu, L.: Realistic Precipitation Diurnal Cycle in Global Convection-Permitting Models by Resolving Mesoscale Convective Systems, Geophys. Res. Lett., 51, e2024GL109945, https://doi.org/10.1029/2024GL109945, 2024.
Song, Y. and Wei, J.: Diurnal cycle of summer precipitation over the North China Plain and associated land–atmosphere interactions: Evaluation of ERA5 and MERRA-2, Int. J. Climatol., 41, 6031–6046, https://doi.org/10.1002/joc.7166, 2021.
Stephens, G. L., L'Ecuyer, T., Forbes, R., Gettelmen, A., Golaz, J.-C., Bodas-Salcedo, A., Suzuki, K., Gabriel, P., and Haynes, J.: Dreary state of precipitation in global models, J. Geophys. Res. Atmos., 115, D24211, https://doi.org/10.1029/2010JD014532, 2010.
Stirling, A. J. and Stratton, R. A.: Entrainment processes in the diurnal cycle of deep convection over land, Q. J. R. Meteorol. Soc., 138, 1135–1149, https://doi.org/10.1002/qj.1868, 2012.
Sun, Q., Miao, C., Duan, Q., Ashouri, H., Sorooshian, S., and Hsu, K.: A Review of Global Precipitation Data Sets: Data Sources, Estimation, and Intercomparisons, Rev. Geophys., 56, 79–107, https://doi.org/10.1002/2017RG000574, 2018.
Tan, J., Huffman, G. J., Bolvin, D. T., and Nelkin, E. J.: Diurnal Cycle of IMERG V06 Precipitation, Geophys. Res. Lett., 46, 13584–13592, https://doi.org/10.1029/2019GL085395, 2019.
Tang, S., Xie, S., Zhang, M., Tang, Q., Zhang, Y., Klein, S. A., Cook, D. R., and Sullivan, R. C.: Differences in Eddy-Correlation and Energy-Balance Surface Turbulent Heat Flux Measurements and Their Impacts on the Large-Scale Forcing Fields at the ARM SGP Site, J. Geophys. Res. Atmos., 124, 3301–3318, https://doi.org/10.1029/2018JD029689, 2019.
Tang, S., Gleckler, P., Xie, S., Lee, J., Ahn, M.-S., Covey, C., and Zhang, C.: Evaluating the Diurnal and Semidiurnal Cycle of Precipitation in CMIP6 Models Using Satellite- and Ground-Based Observations, J. Clim., 34, 3189–3210, https://doi.org/10.1175/JCLI-D-20-0639.1, 2021.
Tao, C., Xie, S., Ma, H., Bechtold, P., Cui, Z., Vaillancourt, P. A., Van Weverberg, K., Wang, Y., Wong, M., Yang, J., Zhang, G. J., Choi, I., Tang, S., Wei, J., Wu, W., Zhang, M., Neelin, J. D., and Zeng, X.: Diurnal cycle of precipitation over the tropics and central United States: intercomparison of general circulation models, Q. J. R. Meteorol. Soc., 150, 911–936, https://doi.org/10.1002/qj.4629, 2024.
Tashima, T., Kubota, T., Mega, T., and Shige, S.: Improvement of the GSMaP Precipitation Retrieval Algorithm for Microwave Sounders Over Coast, in: 2021 IEEE International Geoscience and Remote Sensing Symposium IGARSS, 832–835, https://doi.org/10.1109/IGARSS47720.2021.9553633, 2021.
Tian, Y. and Kuang, Z.: Dependence of entrainment in shallow cumulus convection on vertical velocity and distance to cloud edge, Geophys. Res. Lett., 43, 4056–4065, https://doi.org/10.1002/2016GL069005, 2016.
Trenberth, K. E., Dai, A., Rasmussen, R. M., and Parsons, D. B.: The Changing Character of Precipitation, Bull. Am. Meteorol. Soc., 84, 1205–1218, https://doi.org/10.1175/BAMS-84-9-1205, 2003.
Tustison, B., Harris, D., and Foufoula-Georgiou, E.: Scale issues in verification of precipitation forecasts, J. Geophys. Res. Atmos., 106, 11775–11784, https://doi.org/10.1029/2001JD900066, 2001.
Ushio, T., Sasashige, K., Kubota, T., Shige, S., Okamoto, K., Aonashi, K., Inoue, T., Takahashi, N., Iguchi, T., Kachi, M., Oki, R., Morimoto, T., and Kawasaki, Z.-I.: A Kalman Filter Approach to the Global Satellite Mapping of Precipitation (GSMaP) from Combined Passive Microwave and Infrared Radiometric Data, J. Meteorol. Soc. Jpn. Ser. II, 87A, 137–151, https://doi.org/10.2151/jmsj.87A.137, 2009.
Wang, B. and Ding, Q.: Global monsoon: Dominant mode of annual variation in the tropics, Dyn. Atmos. Oceans, 44, 165–183, https://doi.org/10.1016/j.dynatmoce.2007.05.002, 2008.
Wang, B., Liu, J., Kim, H.-J., Webster, P. J., and Yim, S.-Y.: Recent change of the global monsoon precipitation (1979–2008), Clim. Dyn., 39, 1123–1135, https://doi.org/10.1007/s00382-011-1266-z, 2012.
Watters, D., Battaglia, A., and Allan, R. P.: The Diurnal Cycle of Precipitation according to Multiple Decades of Global Satellite Observations, Three CMIP6 Models, and the ECMWF Reanalysis, J. Clim., 34, 5063–5080, https://doi.org/10.1175/JCLI-D-20-0966.1, 2021.
Wu, W.-S., Purser, R. J., and Parrish, D. F.: Three-Dimensional Variational Analysis with Spatially Inhomogeneous Covariances, Mon. Weather Rev., 130, 2905–2916, https://doi.org/10.1175/1520-0493(2002)130<2905:TDVAWS>2.0.CO;2, 2002.
Xie, P. and Arkin, P. A.: Global Precipitation: A 17-Year Monthly Analysis Based on Gauge Observations, Satellite Estimates, and Numerical Model Outputs, Bull. Am. Meteorol. Soc., 78, 2539–2558, https://doi.org/10.1175/1520-0477(1997)078<2539:GPAYMA>2.0.CO;2, 1997.
Xie, P., Chen, M., Yang, S., Yatagai, A., Hayasaka, T., Fukushima, Y., and Liu, C.: A Gauge-Based Analysis of Daily Precipitation over East Asia, J. Hydrometeorol., 8, 607–626, https://doi.org/10.1175/JHM583.1, 2007.
Xie, P., Joyce, R., Wu, S., Yoo, S.-H., Yarosh, Y., Sun, F., and Lin, R.: Reprocessed, Bias-Corrected CMORPH Global High-Resolution Precipitation Estimates from 1998, J. Hydrometeorol., 18, 1617–1641, https://doi.org/10.1175/JHM-D-16-0168.1, 2017.
Xie, S. and Zhang, M.: Impact of the convection triggering function on single-column model simulations, J. Geophys. Res. Atmos., 105, 14983–14996, https://doi.org/10.1029/2000JD900170, 2000.
Yamamoto, M. K. and Kubota, T.: Implementation of a Rainfall Normalization Module for GSMaP Microwave Imagers and Sounders, Remote Sens., 14, 4445, https://doi.org/10.3390/rs14184445, 2022.
Yang, B., Wang, M., Zhang, G. J., Guo, Z., Huang, A., Zhang, Y., and Qian, Y.: Linking Deep and Shallow Convective Mass Fluxes via an Assumed Entrainment Distribution in CAM5-CLUBB: Parameterization and Simulated Precipitation Variability, J. Adv. Model. Earth Syst., 13, e2020MS002357, https://doi.org/10.1029/2020MS002357, 2021.
Yang, G.-Y. and Slingo, J.: The Diurnal Cycle in the Tropics, Mon. Weather Rev., 129, 784–801, https://doi.org/10.1175/1520-0493(2001)129<0784:TDCITT>2.0.CO;2, 2001.
Yu, R., Zhou, T., Xiong, A., Zhu, Y., and Li, J.: Diurnal variations of summer precipitation over contiguous China, Geophys. Res. Lett., 34, L01704, https://doi.org/10.1029/2006GL028129, 2007.
Zhang, C.: Madden-Julian Oscillation, Rev. Geophys., 43, RG2003, https://doi.org/10.1029/2004RG000158, 2005.
Zhang, M. H., Lin, J. L., Cederwall, R. T., Yio, J. J., and Xie, S. C.: Objective Analysis of ARM IOP Data: Method and Sensitivity, Mon. Weather Rev., 129, 295–311, https://doi.org/10.1175/1520-0493(2001)129<0295:OAOAID>2.0.CO;2, 2001.
Zscheischler, J., Martius, O., Westra, S., Bevacqua, E., Raymond, C., Horton, R. M., Van Den Hurk, B., AghaKouchak, A., Jézéquel, A., Mahecha, M. D., Maraun, D., Ramos, A. M., Ridder, N. N., Thiery, W., and Vignotto, E.: A typology of compound weather and climate events, Nat. Rev. Earth Environ., 1, 333–347, https://doi.org/10.1038/s43017-020-0060-z, 2020.