the Creative Commons Attribution 4.0 License.
the Creative Commons Attribution 4.0 License.
 | 09 Jan 2026
Increased surface water evaporation loss induced by reservoir development on the Loess Plateau
Xianhong Xie
Yibing Wang
Arken Tursun
Dawei Peng
Xinran Wu
Baolin Xue
Global-scale reservoir construction has significantly enhanced water supply for local production and livelihoods, yet the evaporation losses from these surface water bodies remain poorly understood, particularly in the context of climate change. The majority of existing studies have predominantly focused on non-aquatic terrestrial evaporation, overlooking the intricate evaporation dynamics within aquatic systems. In this study, we address this gap by investigating water body evaporation in the Loess Plateau of China, a region characterized by extensive reservoir development over the past decades. By employing a modified Penman model and utilizing long-term remote sensing water body data to calculate water depths while accounting for the thermal storage capacity of water bodies, we estimated water evaporation rates and total evaporation volumes for the period 2000–2018. Validation against pan evaporation observations demonstrates the efficacy of our improved approach in capturing the water depths and associated evaporation patterns of diverse water bodies in the Loess Plateau. Results reveal a subtle decreasing trend in evaporation rates across the region. However, the total evaporation volume amounts to a substantial 4.16 × 10⁶ m3 d−1, with a notable upward trend at a rate of 0.117 × 10⁶ m3 d−1 yr−1. Attribution analysis shows that while the combined effects of climate change marginally reduced evaporation rates in this study region, the expansion of water bodies has counteracted this trend, resulting in a significant increase in total evaporation losses. Particularly, the development of small- and medium-sized reservoirs and check dams is the primary driver of increased evaporation losses on the Loess Plateau. Given that evaporation losses are comparable to surface water withdrawals in this region, future water management and hydraulic projects must consider such substantial losses. This study fills gaps by quantifying aquatic evaporation across the Loess Plateau and underscores the need for integrated strategies addressing climate change, reservoir expansion, and evaporation.
- Article
(11366 KB) - Full-text XML
- BibTeX
- EndNote


Land surface water bodies, such as reservoirs and lakes, serve as vital sources of “blue water” that sustain human livelihoods and production, while their evaporation processes exert significant influence on climate regulation and energy partitioning across the land surface (Guan and Mascaro, 2023). A large number of studies have been predominantly focused on evaporation from vegetation and soil profile (Jian et al., 2015; Liu et al., 2024; Peng et al., 2024), with scant attention given to the evaporation loss from surface water bodies. Globally, reservoir storage increased rapidly at a rate of 27.82 km3 yr−1 from 1999 to 2018, driven by the construction of thousands of new reservoirs to address rising demands for water supply, irrigation, and energy (Li et al., 2023). However, it has been reported that large reservoirs globally evaporated about 340 km3 yr−1 from 1985 to 2016, which is over 70 % of the amount of municipal water withdrawal in 2010 (Tian et al., 2022). Moreover, the long-term average evaporation volume from lakes worldwide is estimated to be approximately 1500 ± 150 km3 yr−1 (Zhao et al., 2022). Therefore, the impact of water body evaporation losses on human society should not be underestimated.
Surface open water evaporation is influenced by a range of meteorological factors and water surface conditions. These include near-surface air temperature, relative humidity, solar shortwave radiation, wind speed, and the temperature profile within water bodies (Milly and Dunne, 2020; Vystavna et al., 2021). Variations in these factors elicit corresponding changes in both the evaporation rate and evaporation volume. For instance, an elevation in near-surface air temperature over the lakes of the Yunnan-Guizhou Plateau has led to accelerated evaporation rates (Yang et al., 2019a). Beyond these meteorological factors, changes in surface water area also play a crucial role in determining evaporation losses. As an illustration, the total evaporation volume from reservoirs in China has risen, with 96 % of this increase attributed to newly constructed reservoirs (Tian et al., 2021). Similarly, in the United States, while rising temperatures have contributed to an increase in total evaporation loss from reservoirs, this effect has been largely counteracted by a decrease in surface area (Zhao and Gao, 2019). In contrast, the shrinkage of the Aral Sea, driven by massive river diversions for irrigation since the 1960s, exemplifies an anthropogenic change that drastically altered regional hydrology and led to devastating socio-economic consequences (Duan et al., 2024; Micklin, 2010). Another example is the evaporation rates at Siling Co Lake on the Tibetan Plateau, which have decreased partially due to lower wind speeds, contributing to the expansion of the lake surface area, although this expansion is also strongly linked to increased glacier melt and precipitation (Guo et al., 2019).
In recent decades, the Loess Plateau in China has experienced significant climatic shifts, accompanied by substantial variations in vegetation cover (Jiang et al., 2021; Wu et al., 2020; Xie et al., 2015). A notable observation is the enhancement of land surface evaporation, particularly attributed to increased vegetation transpiration (Jiang et al., 2022; Peng et al., 2024), although the response of vegetation water use to global climate drivers is complex and not uniform globally (Wang et al., 2025). Key climate factors such as temperature, radiation, and wind speed all play crucial roles in this process (Bai et al., 2019; Jin et al., 2017; Li et al., 2009). However, this terrestrial-centric perspective captures only a subset of regional hydrological processes. Open-water evaporation constitutes an equally critical component, operating under fundamentally distinct physical mechanisms. Unlike non-aquatic terrestrial evaporation, which is controlled by meteorological conditions and vegetation coverage, open-water evaporation is driven more directly by meteorological factors and energy balances. This distinction underscores the necessity for a closer examination of water body evaporation to fully comprehend the region's hydrological changes.
Moreover, to reduce the sediment content in river systems, a variety of large, medium and small-scale dam and reservoir projects have been carried out on the Loess Plateau (Fu et al., 2017). These projects primarily involve the construction of numerous check-dams across gullies and tributaries, designed to intercept sediment-laden runoff and promote deposition. These interventions have led to notable changes in the water landscape (Liu et al., 2023). This substantial expansion of surface water bodies is expected to enhance water retention, thereby supporting human livelihoods and production (Woolway et al., 2020; Zhou et al., 2020). However, these new water bodies may also exacerbate water evaporation losses, particularly under the arid climatic conditions of the Loess Plateau. The societal and water management relevance of accurately quantifying evaporation from all water bodies, including these numerous smaller ones, is thus paramount, as their cumulative impact can be substantial. Consequently, amidst ongoing climate change and alterations in water body area, there is a pressing need to deepen our understanding of the evolving patterns of water body evaporation, both in terms of rate and volume.
Several methods are accessible for estimating surface water evaporation. Direct in-situ measurement techniques include pan evaporation measurements and eddy covariance (EC) systems, which provide valuable point data often used for validation (Friedrich et al., 2018; Hollinger and Richardson, 2005; Liu et al., 2012; Rotstayn et al., 2006; Woolway et al., 2020). On the other hand, model-based estimation approaches, such as hydrological models, are employed for regional quantification by integrating various meteorological and hydrological factors to simulate evaporation processes across diverse environmental conditions, rendering them suitable for large-scale regions and long-term predictions (Deng et al., 2022; Vishwakarma et al., 2022). Notably, the Penman equation is widely preferred owing to its straightforward application principles, high degree accuracy, and broad applicability (Fuentes et al., 2020; McJannet et al., 2008; Penman, 1948; Tanny et al., 2008). However, a significant challenge arises from the fact that water possesses a significantly higher heat capacity compared to other land types, resulting in pronounced heat storage effects in lakes and reservoirs (Jensen, 2010). The thermal energy within these water bodies tends to move from shallower to deeper regions (Wang et al., 2023), consequently influencing evaporation, sensible heat flux, and net longwave radiation losses at the surface. To address biases in evaporation rate estimations stemming from these factors, Edinger et al. (1968) introduced the concept of equilibrium temperature. Subsequently, De Bruin (1982) incorporated this concept into the estimation of evaporation rates. Zhao and Gao (2019) further enhanced evaporation estimations in open water by establishing a generalized formula for equilibrium temperature.
Despite achieving notable progress, the application of these methods has often been confined to large lakes and reservoirs where bathymetric data are accessible. Consequently, the vast number of small-to-medium-sized reservoirs and check dams, such as those proliferating across the Loess Plateau, have typically been omitted from regional evaporation assessments. This omission stems from a persistent data barrier: the widespread lack of water depth information, which is a crucial parameter for accurately calculating heat storage and evaporation. Although advancements in remote sensing have enabled comprehensive monitoring of surface water area (Li et al., 2020; Zhang et al., 2019a), estimating water depth for numerous small water bodies remains a considerable challenge. This limitation can lead to incomplete regional assessments that may underestimate the full hydrological impact of water bodies.
This study attempts to integrate a novel water depth estimation approach, derived from remote sensing data, with the modified Penman approach. Building upon this enhanced approach, the research objectives are twofold: (1) to estimate the spatial and temporal variability of surface water evaporation rates and volumes on the Loess Plateau, and (2) to identify the key driving factors underlying surface water evaporation losses. This assessment is crucial for facilitating effective regional or local water resource management.
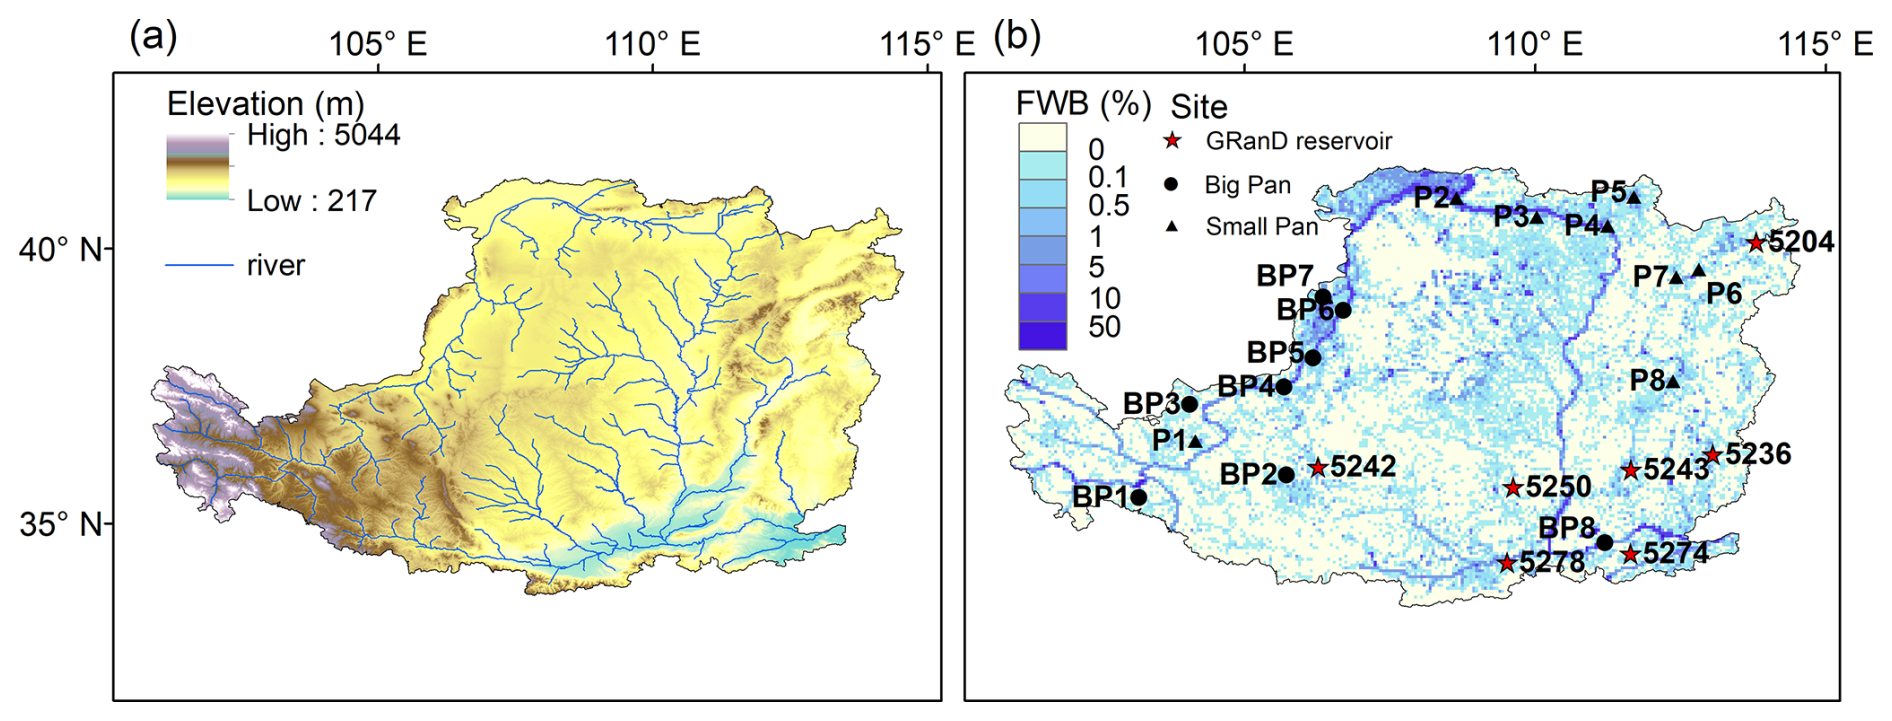
Figure 1Location of the Loess Plateau and its water body distribution: (a) elevation and river systems of the Loess Plateau; and (b) distribution of evaporation observation sites for big pan and small pan, the locations of the GRanD reservoirs used for water depth validation, and fraction of water body (FWB), representing the proportion of water body area per 0.05° grid cell, on the Loess Plateau for the long-term average of 2000–2018.
2.1 Study area
The Loess Plateau is located in the northwestern region of China, with an area of approximately 640 000 km2. Influenced by summer monsoon from the southeast, its climatic conditions in the area show a gradual change from southeast to northwest, with area-average annual precipitation of about 440 mm, concentrated mainly in the summer (Jiang et al., 2021; Sun et al., 2015). The region is predominantly located within the Yellow River basin (Fig. 1a), encompassing subsidiary rivers such as the Wei River. However, the overall availability of surface water resources is still relatively scarce (Xiao et al., 2019).
Characterized by its loose soil structure, the Loess Plateau is highly susceptible to severe soil erosion due to wind and water (Jiang et al., 2019; Zhao et al., 2013). In order to retain soil and sediment and to reduce the amount of sediment load to the main channel, a large amount of small-scale check dams have been constructed within gullies and small tributaries on the Loess Plateau after 2000 (Wang et al., 2021; Zhang et al., 2022). Driven by the economic development of agriculture, industry, and various sectors, there has been a heightened demand for water resources. Consequently, hydraulic infrastructure including reservoirs, has been continuously expanding. Permanent water bodies on the Loess Plateau grew from 1200 km2 in 2000 to 2200 km2 in 2020, and the number of small water bodies has increased from 6721 to 14 082 (Liu et al., 2023). Furthermore, there is a widespread distribution of agricultural irrigation districts in the western and northern regions of the Loess Plateau, e.g., Ningxia Irrigation District and Hetao Irrigation District (Zhang et al., 2019b). All of these factors collectively influence the fraction of surface water bodies on the Loess Plateau (Fig. 1b).
In terms of terrestrial evaporation, the Loess Plateau exhibits an average rate of approximately 1.07 mm d−1, with a statistically significant increasing trend of about 0.015 mm d−1 yr−1 observed in recent decades (Jiang et al., 2022; Peng et al., 2024). This increase in terrestrial evaporation is largely attributed to factors such as increased precipitation and extensive vegetation greening resulting from ecological restoration projects, which enhance transpiration from plants and evaporation from the soil surface. This contrasts with the dynamics of open water evaporation, which is the focus of the current study and is governed by a different set of primary drivers.
2.2 Data
The data used in this study include remote sensing surface water area, meteorological forcing, and other ancillary information. For our analysis covering the period 2000–2018, we utilized monthly surface water area data from the Joint Research Center's Global Surface Water dataset (JRC-GSW; (Pekel et al., 2016)). Although the foundational paper was published in 2016, the JRC-GSW dataset receives continuous updates; we employed the most recent version encompassing our study period (2000–2018). This dataset utilized an expert system classifier based on Landsat satellite imagery to map the spatial dynamics of global surface water, with a spatial resolution of 30 m. The JRC-GSW data have been successfully applied to detect changes in surface water in the Loess Plateau (Liu et al., 2023). To maintain data integrity, we did not use gap-filling methods that could introduce additional uncertainties into our analysis. The driving meteorological data used for surface water evaporation estimation include near-surface air temperature (Ta) at 2 m height, specific humidity (Q), downward surface shortwave radiation (SSR), and wind speed (U) at 10 m height, sourced from the China Meteorological Forcing Dataset (CMFD, v1.6) (He et al., 2020) with a spatial resolution of 0.1° and a temporal resolution of one month. The CMFD data have undergone comprehensive validation in China with reliable performance (Lei et al., 2023; Tan et al., 2021; Wang et al., 2024a; Zhang et al., 2023). Furthermore, surface wind speed data, encompassing both the zonal (U) and meridional (V) components, sourced from ECMWF Reanalysis 5th Generation (ERA5) (Hersbach et al., 2020) were employed to determine the prevailing wind direction, which was then used to calculate downwind width of water bodies. The ancillary data regarding elevation information were from Advanced Spaceborne Thermal Emission and Reflection Radiometer Global Digital Elevation Model (ASTGTM) (NASA/METI/AIST/Japan Spacesystems and U.S./Japan ASTER Science Team, 2019). This dataset has a horizontal spatial resolution of 30 m and a vertical resolution of 1 m.
Open-water evaporation observations were obtained from China Meteorological Administration (CMA, 2023). The observations were performed using big pan (E601) with a diameter of 61.8 cm and small pan with diameter of 20 cm (Fig. 1b). Given the difference between the evaporation from the pan and the near water body, a few studies adjusted the observations using pan coefficients so that the observations are comparable with the evaporation from the near water body (Wu and Li, 2007; Li et al., 2018; Sheng et al., 2007). Following the framework by Shi et al. (1986) for regions in China, we set the pan coefficient as 0.95 for the E601 and 0.75 for the small pan observations. These coefficients have been successfully used in reservoir evaporation estimation in the upper Yellow River, confirming their suitability for our study area (Bai et al., 2023). To ensure the reliability of simulated water depths, in-situ data for validation were sourced from the Global Reservoir and Dam dataset (GRanD) (Lehner et al., 2011) (Fig. 1b). This dataset is a comprehensive global inventory of reservoirs, compiled from multiple authoritative sources and manually verified, which provides key attributes such as storage capacity and water depth. To highlight the magnitude of evaporation loss, we obtained surface water withdrawal data for the Loess Plateau from the Yellow River Water Resources Bulletin (published by the Yellow River Conservancy Commission, YRCC).
2.3 Evaporation estimation
2.3.1 Evaporation rate
To account for the effect of heat storage in a water body, we applied a modified Penman equation based on the approach developed by Zhao and Gao (2019). This method incorporates water depth into the heat storage estimation, thereby enabling more accurate computation of surface water evaporation. This equation follows the traditional Penman equation (Penman, 1948), and explicitly considers the heat storage:
where E is the evaporation rate (mm d−1), s is the slope of the saturation vapor pressure curve (kPa °C−1); Rn is the net radiation (MJ m−2 d−1); ΔU is the heat storage changes of the water body (MJ m−2 d−1); f(u) is the wind function (MJ m−2 d−1 kPa−1); es is the saturated vapor pressure at air temperature (kPa); ea is the air vapor pressure (kPa); λv is the latent heat of vaporization (MJ kg−1); and γ is the psychrometric constant (kPa °C−1).
In the Penman equation, it is assumed that the input meteorological variables are derived from the surface water. However, due to data limitations, we can only obtain meteorological data based on land surface observations. To address the errors associated with the land-based meteorological data, Mcjannet et al. (2012) developed a widely used wind function:
where f(u2) is the wind function (MJ m−2 d−1 kPa−1); u2 is the wind speed at the height of 2 m (m s−1); Lf is the fetch length of the water body (m), fetch length is the surface water width under prevailing wind direction. The prevailing wind direction was determined for each water body on a monthly basis. For each month in the study period, wind speed and direction were calculated from the U and V components through vector synthesis. The statistical distribution of wind directions was then analyzed to identify the single most frequent (i.e., prevailing) direction for that month, which was subsequently used to define the fetch length across the water body.
Another key factor affecting estimation accuracy arises from variations in the energy stored within the water body. The introduction of equilibrium temperature serves as an effective solution (De Bruin, 1982; McMahon et al., 2013). Here, we utilized the more general equilibrium temperature formula derived by Zhao and Gao (2019):
where Te is the equilibrium temperature (°C); εa and εw are emissivity of air and water with cloudiness factor, respectively; k (0.46 MJ m−2 d−1 °C−1) and b (23.38 MJ m−2) are constants; α is the water surface albedo; and K↓ is the downward shortwave radiation (MJ m−2 d−1). The estimation of water column temperature from equilibrium temperature follows the approach of De Bruin (1982), as formulated in Eqs. (4) and (5):
where Tw is the water column temperature at the current time step (°C); Tw0 is the water column temperature at the previous time step (°C); Δt is the time step (set as one month in this study); and τ is the lag time (d), which can be expressed as:
where ρw is the water density (kg m−3); cw is the specific heat of water (MJ kg−1 °C−1); is the average water depth (m); Twb is the wet-bulb temperature (°C); and Swb is the slope of the saturation vapor pressure curve at Twb (kPa °C−1).The change in the heat storage of water can be estimated by:
where the estimated heat storage change, ΔU, is then incorporated into the modified Penman equation (Eq. 1) to account for the energy absorbed by or released from the water body, thereby refining energy balance and improving the accuracy of the evaporation estimation.
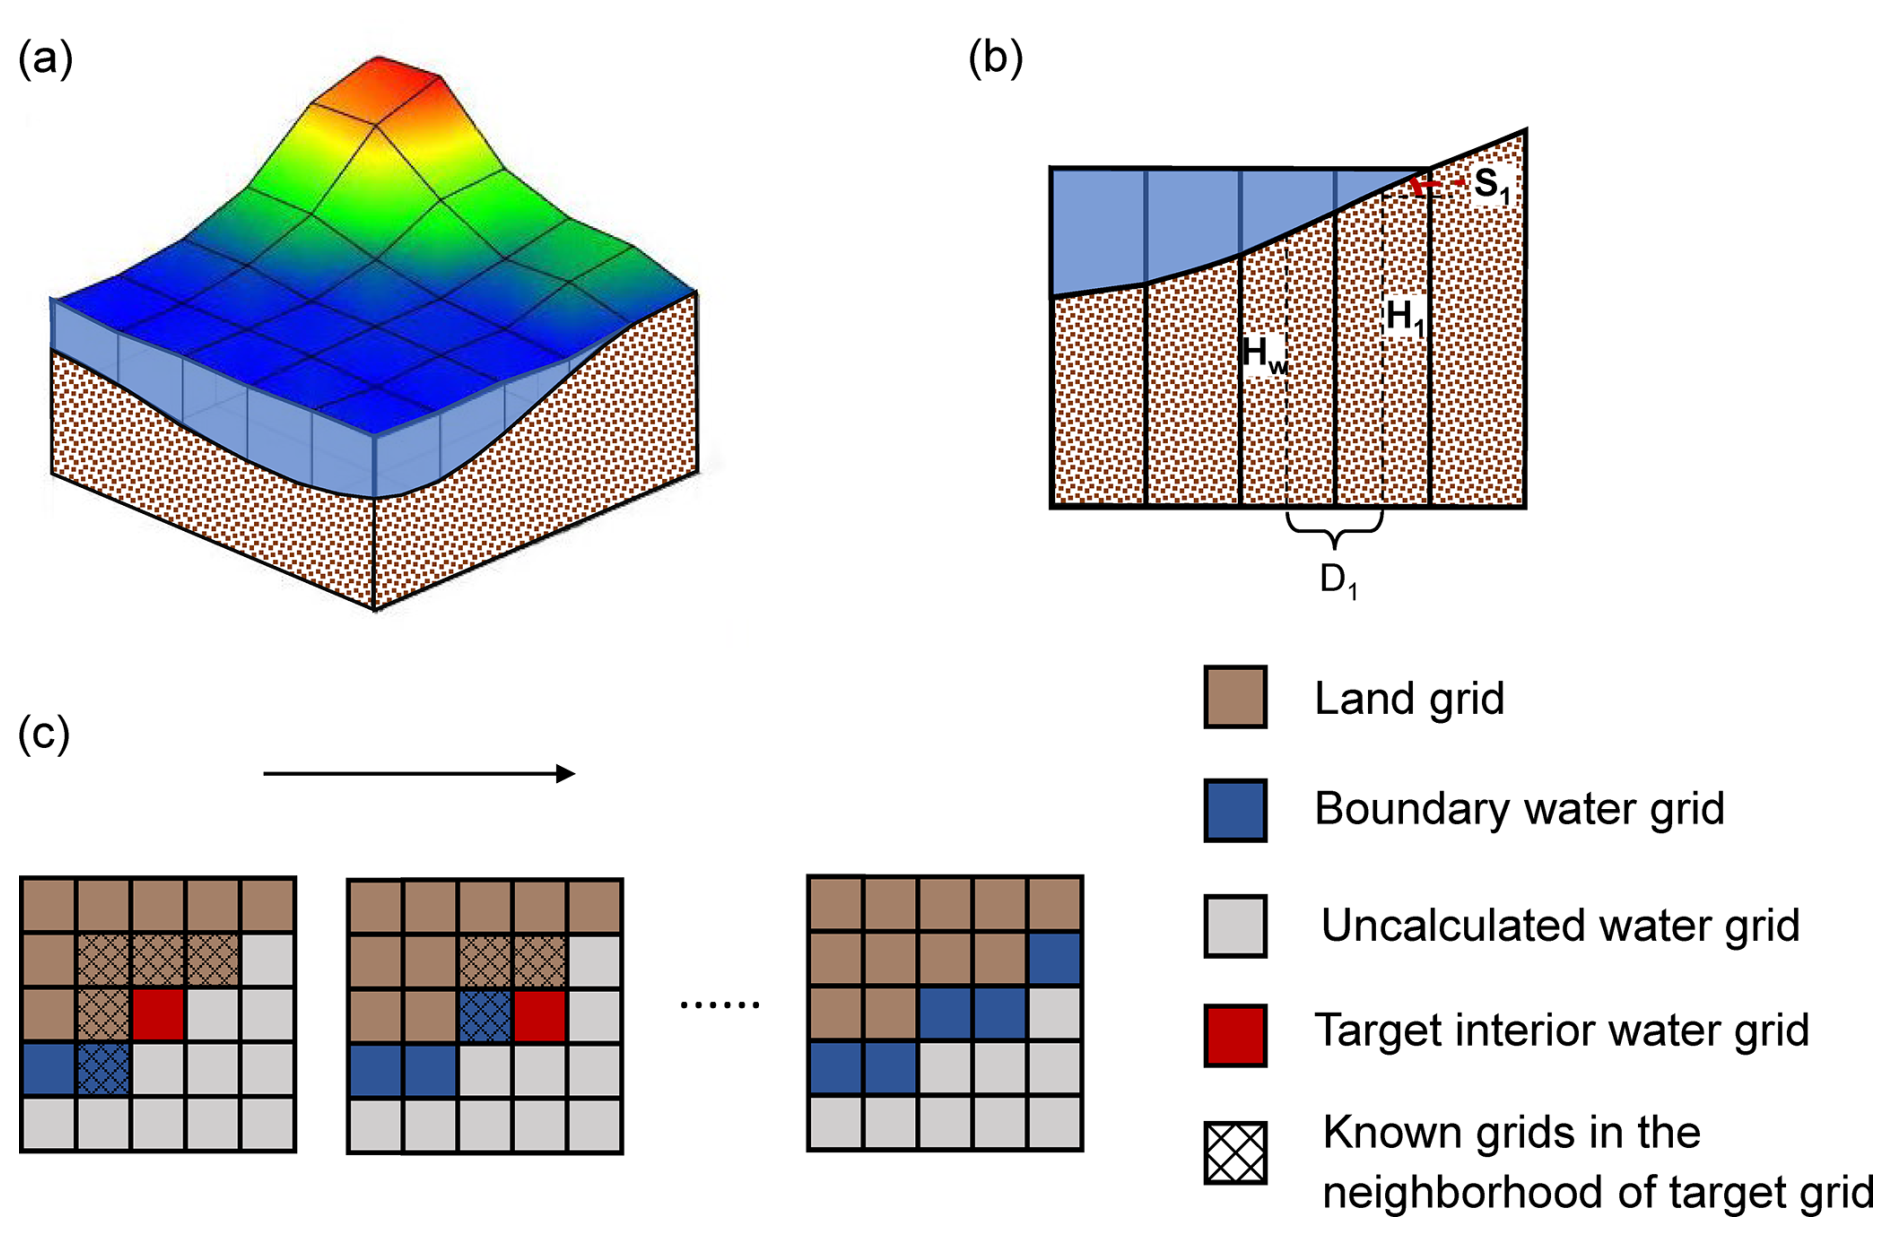
Figure 2Schematic of the water bottom elevation calculation: (a) three-dimensional schematic of a water body, (b) longitudinal section view of a water body, illustrating the relationship between land surface elevation, water surface, and estimated water bottom (where Hw is the target water bottom elevation, H1 is the elevation of the first known grid, S1 is the slope, and D1 is the distance); and (c) the iterative process of calculating the bottom elevation of water grids.
2.3.2 Water depth estimation
In the estimation of evaporation, accounting for water depth variation is crucial, as it fundamentally influences heat storage and transfer dynamics, as shown in Eqs. (5) and (6). A significant challenge arises in quantifying evaporation rates for surface water, largely attributed to the limited availability of water depth data. Digital Elevation Models (DEMs), while valuable, are typically restricted to capturing surface-level information, thereby hindering the acquisition of detailed underwater terrain features. To circumvent this limitation, we proposed a water depth estimation algorithm that operates on the assumption of slope equivalence between the water body and its boundaries, as depicted in Fig. 2. This assumption is justified by the geomorphological context of the Loess Plateau, where the highly erodible nature of the soil promotes a convergence between terrestrial land slopes and subaqueous bed slopes. A similar assumption has been used in other studies (e.g., Liu et al., 2020; Wang et al., 2024b). This approach first relies on the elevation and slope of the land pixels to estimate the water bottom elevation of the boundary water grids. All land pixels and the calculated water grids are marked as known. Subsequently, the water bottom elevation of interior grids is iteratively determined using the same approach based on known neighboring grids within their eight-neighborhood.
For each grid cell (with a resolution of 30 m × 30 m), the determination of water bottom or bed elevation is expressed as:
where, Hw is the water bottom elevation of a target grid cell; n is the total number of marked as known in the eight-neighborhood; Hi is the ith elevation value of the water body boundary or the already calculated elevation value of the water grid; Si is the slope of the ith grid; Di is the distance from the ith grid to the target water grid. The calculation for water body grid follows the rule of starting from the nearest grids to the water body boundary and progressing to the farthest ones.
For a given water body, its average water depth is defined as the difference between the mean elevation of the land boundary grids and the mean waterbed elevation of the water grids:
where is the average water body depth; is the average elevation of the water body boundary; is the average elevation of the waterbed.
Since solar radiation typically penetrates and warms only the upper water column (usually <20 m), a depth threshold of 20 m was assumed in our calculations for any water body deeper than this threshold. The estimated water depths were validated against measurements from a few shallow water bodies (<20 m depth). To assess the impact of the dynamic depth estimates on evaporation estimation, moreover, we conducted a sensitivity analysis (Sect. 3.1.2) by comparing the estimated evaporation against those two other scenarios: (i) a static-depth approach using multi-year average water depth for heat storage computation (Modified Penman-static); and (ii) the standard Penman formulation (ΔU=0 in Eq. 1) excluding depth-dependent storage entirely (Standard Penman).
2.3.3 Evaporation volume
The evaporation volume (EV) or evaporation loss can be expressed as:
where EV is the monthly average evaporation volume (m3 d−1), E is the monthly average evaporation rate (mm d−1), and Area is the surface water bodies area within each grid cell (km2).
2.3.4 Grid-scale evaporation estimation
The spatial resolution for calculating water evaporation should be defined to balance computational demands with both accuracy and clarity of presentation. In this study, the evaporation rates and volumes were computed and mapped at a 0.5° resolution. The input meteorological data from CMFD were spatially interpolated from 0.1° to the 0.05° grid. To ensure temporal consistency with the monthly JRC-GSW surface water area data, all evaporation estimation was performed at a monthly time step using the corresponding CMFD forcing data. For clarity of interpretation, the final evaporation rates and volumes are presented as average daily values.
The computational workflow progresses from water bodies to the grid. First, geometric properties – including mean depth () and effective fetch (Lf) – were derived for each water body identified from the 30 m JRC-GSW dataset. Second, the evaporation rate (E) was computed for each portion in a grid cell: a water body within a single 0.05° grid cell was assigned a single E value based on that cell's meteorology, whereas a water body spanning multiple cells has a unique E value calculated for each portion, whereby meteorological data of the corresponding grid cells are used in combination with the physical properties of the entire water body (overall depth and fetch length). Finally, these values were aggregated to the 0.05° grid scale. The representative evaporation rate for a cell was defined as the area-weighted average of the rates from all water body parts within it. The total evaporation volume for the cell was calculated as the sum of the respective volumes from these parts. This bottom-up approach ensures that high-resolution (30 m) information on water body geometry is preserved while integrating coarser-resolution (0.05°) meteorological data in a physically consistent manner.
2.4 Validation metrics and statistical analysis
The performance of the evaporation estimation model was evaluated against the adjusted pan evaporation data using several statistical metrics. The coefficient of determination (R2) was used to assess the proportion of variance in observed data that could be explained by the model. The root mean square error (RMSE) quantified the average magnitude of the prediction errors in units of mm per month. Additionally, the mean absolute bias (MAB) was calculated to measure the average absolute difference between estimated and observed values, indicating any systematic over- or under-estimation. For all statistical analyses, a significance level of α=0.05 was used.
2.5 Attribution analysis
The change in E is generally driven by four primary climate factors: air temperature, humidity, downward shortwave radiation, and wind speed. The trend in EV, however, is influenced by both these climate factors and the changes in surface water area.
To quantify the contribution of each driving factor, we conducted an attribution analysis based on the outputs from one base simulation and a set of experiments. The methodology for this analysis was adapted from Mao et al. (2015) and Tian et al. (2021), with the specific contribution of each factor calculated as follows:
where Conx is contribution percentage of the variation in element x (e.g., air temperature, specific humidity, shortwave radiation, wind speed, and surface water area) to the trend of the target variable (either E or EV); Trend is the trend of the target variable after detrending all factors except for the element x; Trend is the trend of the target variable after detrending all factors; and Trend is the original trend of the target variable.
The detrending equation for a given variable is presented as
where Yi is a year from 2000 to 2018, is the monthly-scale forcing variable for the year Yi and month m after detrend, is the original monthly-scale forcing variable; is the annual average variable for the year Yi; Yb is the reference year in 2000, and a is the trend in the annual average meteorological variable or the water area. This equation is able to remove the annual trend but preserve the seasonal variation.
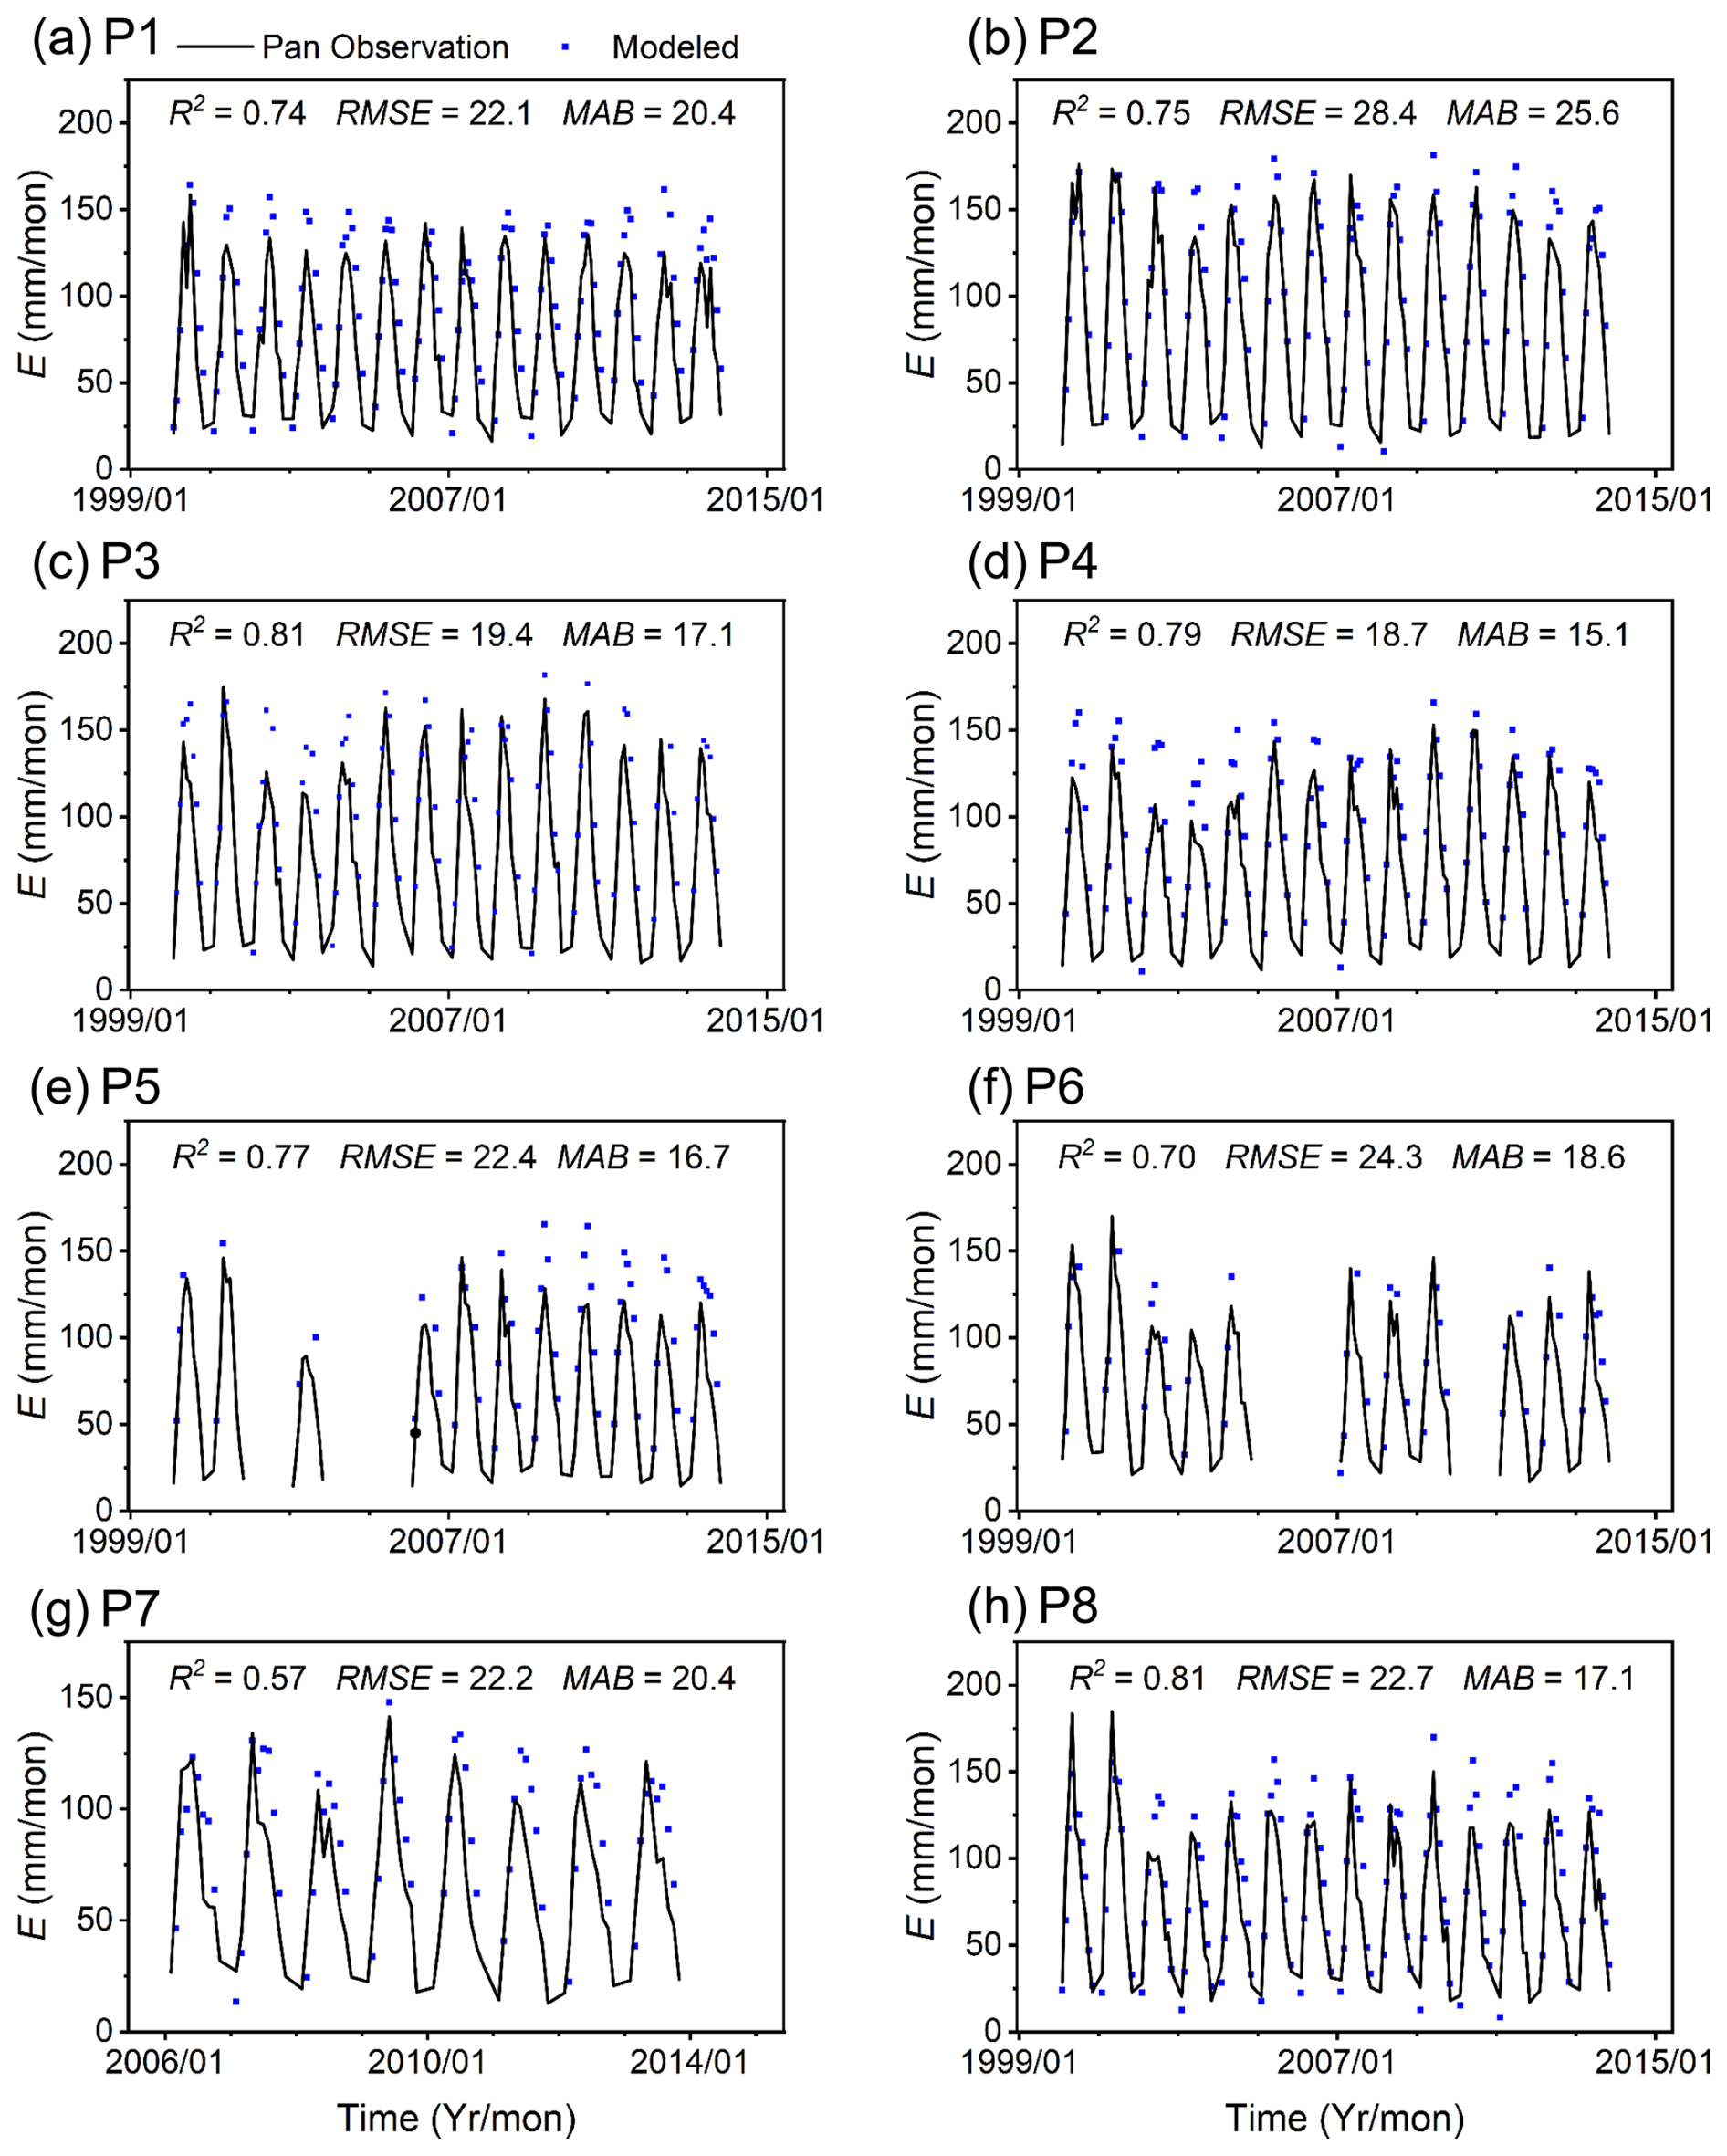
Figure 3Comparison of the estimated evaporation rate (E) and the observations from small pan at eight stations: the plots from (a) to (h) are for the eight stations as shown in Fig. 1.
3.1 Model Evaluation
3.1.1 Validation of evaporation estimation
We first evaluated the evaporation estimation from the modified Penman equation using the adjusted pan observations. For the comparison shown in Figs. 3 and 4, we used the modeled evaporation from the grid cell in which each pan station is located, which represents the area-weighted average evaporation from all water bodies within that cell. This estimation was performed using the dynamic water depth model.
Figure 3 illustrates a comparison between the estimated evaporation rates from water bodies and the observations from the small-pan evaporation. The evaporation estimates exhibit a strong agreement with the observations, capturing the monthly dynamic changes. The average coefficient of determination (R2) for this comparison is 0.75, indicating a robust correlation (Fig. 5a). The average MAB is generally less than 20 mm per month, and the average RMSE stands at approximately 22.54 mm per month (Fig. 5b, c). However, at certain stations, such as station P1, the modified Penman equation slightly overestimates peak evaporation values. Nevertheless, the overall alignment is deemed acceptable.
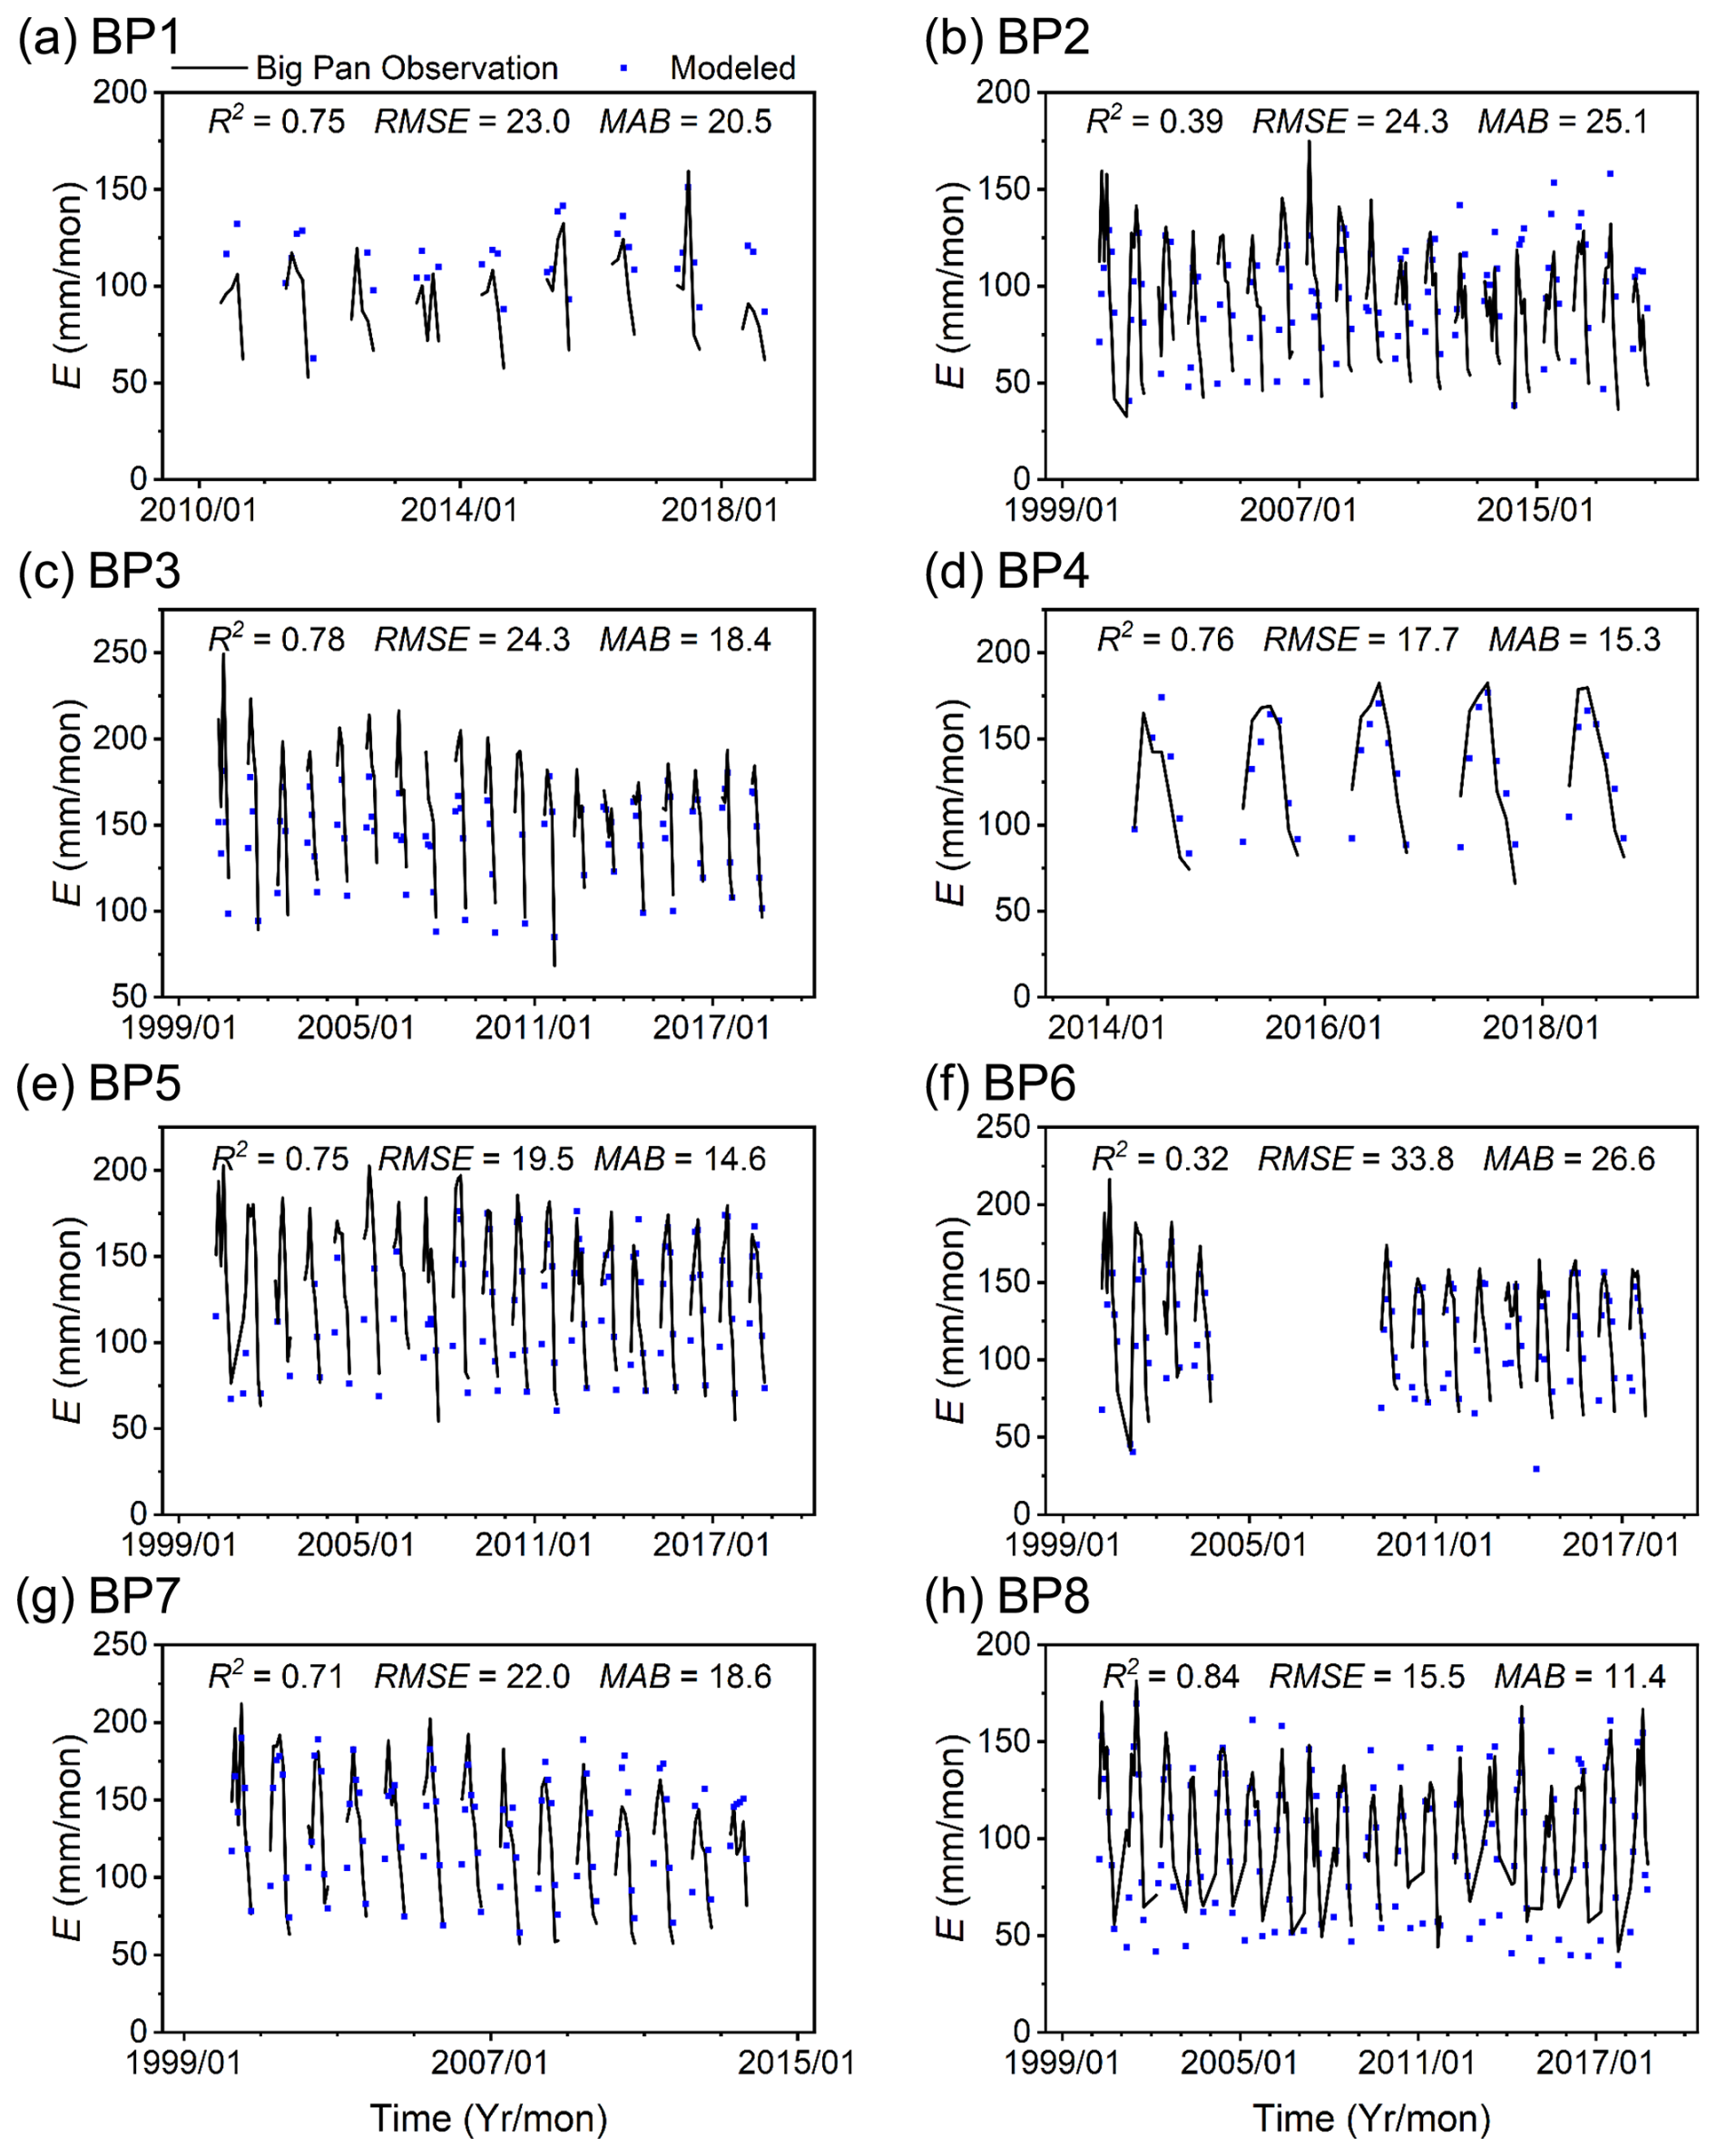
Figure 4Comparison of the estimated evaporation rate (E) and the observations from big pan at eight stations: the plots from (a) to (h) are for the eight stations as shown in Fig. 1.
Figure 4 provides a comparison between the estimated evaporation rates and the observations recorded by big pans. Specifically, the performance metrics for the big-pan observations are comparable to those from the small pans. The average MAB for the big pans is 18.82 mm per month and the average RMSE is 22.50 mm per month, both very similar to the small pan validation results. While the average R2 is lower for big pans (0.66) compared to small pans (0.75), the overall results from both validation observations affirm the model's capability to capture the temporal dynamics of evaporation.
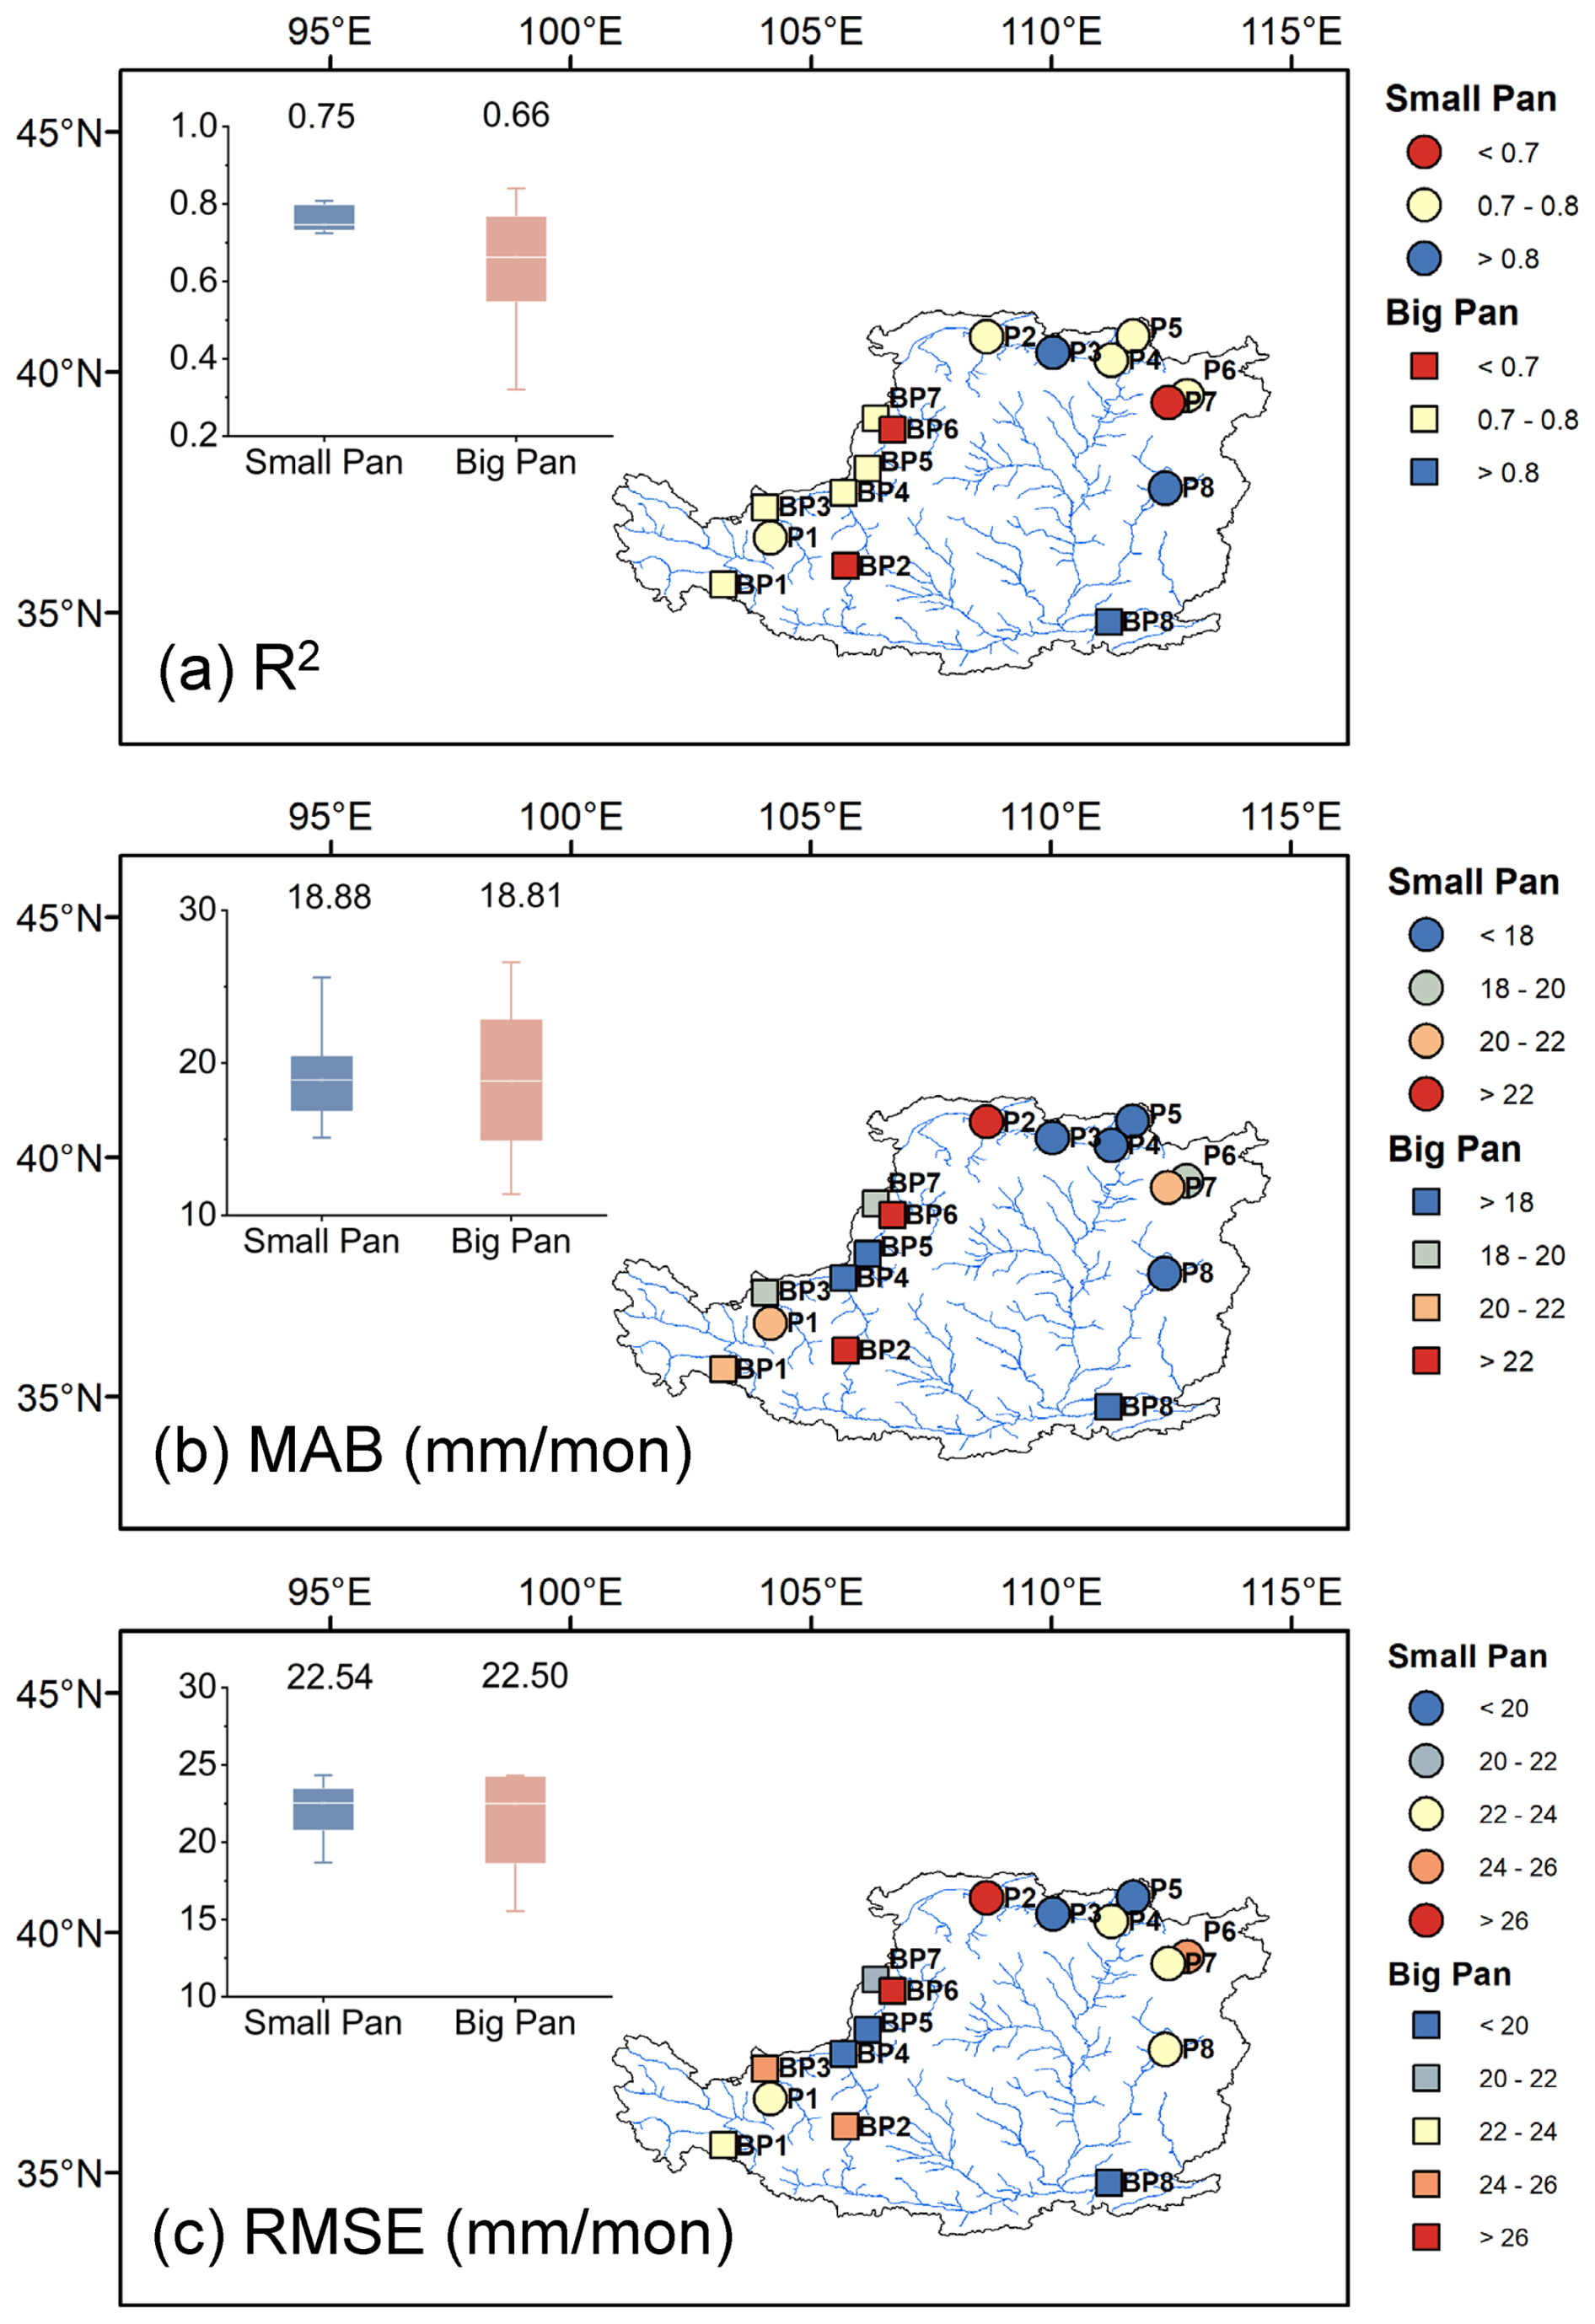
Figure 5The spatial distribution and box plots of the three validation metrics (a) R2, (b) MAB, and (c) RMSE for simulated evaporations compared to observations from small and big pans. Values represent the average for R2, RMSE, and MAB.
Figure 5 presents the spatial distribution of the validation metrics, offering a nuanced understanding of the model's performance across different regions. Notably, the upstream areas exhibit larger estimation errors, likely because the complex terrain introduces significant uncertainties in water depth computation that propagate to the evaporation estimation. In contrast, the midstream and downstream regions demonstrate better accuracy, likely due to more homogeneous environmental conditions and milder temperature variations. The overall consistency between the simulated evaporation and the observations indicates the reliability of the modified Penman method for estimating evaporation, despite some localized discrepancies.
3.1.2 Role of water depth in evaporation estimation
The modified Penman model shows favorable performance, potentially attributable to its incorporation of dynamic water depth variations in heat storage calculations. To verify this hypothesis, here we assessed the water depth estimation approach and the model's sensitivity to water depth using the scenarios described in Sect. 2.3.2.
We selected water bodies with depths of less than the threshold of 20 m for which in-situ water level data were available from the GRanD database (Fig. 1b). Figure 6 shows the estimated water depths against the corresponding measurements. The comparison achieved a correlation with R2 of 0.29, RMSE of 4.47 m, and MAB of 3.89 m. A slight underestimation appears, likely driven by three factors. First, artificial reservoirs have a morphological bias. Our algorithm assumes natural slopes, which often leads to underestimation for engineered reservoirs with steep, vertical dams. Second, terrain complexity introduces uncertainty. The DEM resolution often fails to resolve the steep, narrow geometries of rugged basins, resulting in smoothed elevation profiles. Third, validation uncertainty also arises because we compare dynamic monthly estimates against static reference depths. Nevertheless, these results confirm that our model roughly captures the water levels, thereby providing a reliable foundation for subsequent evaporation estimation.
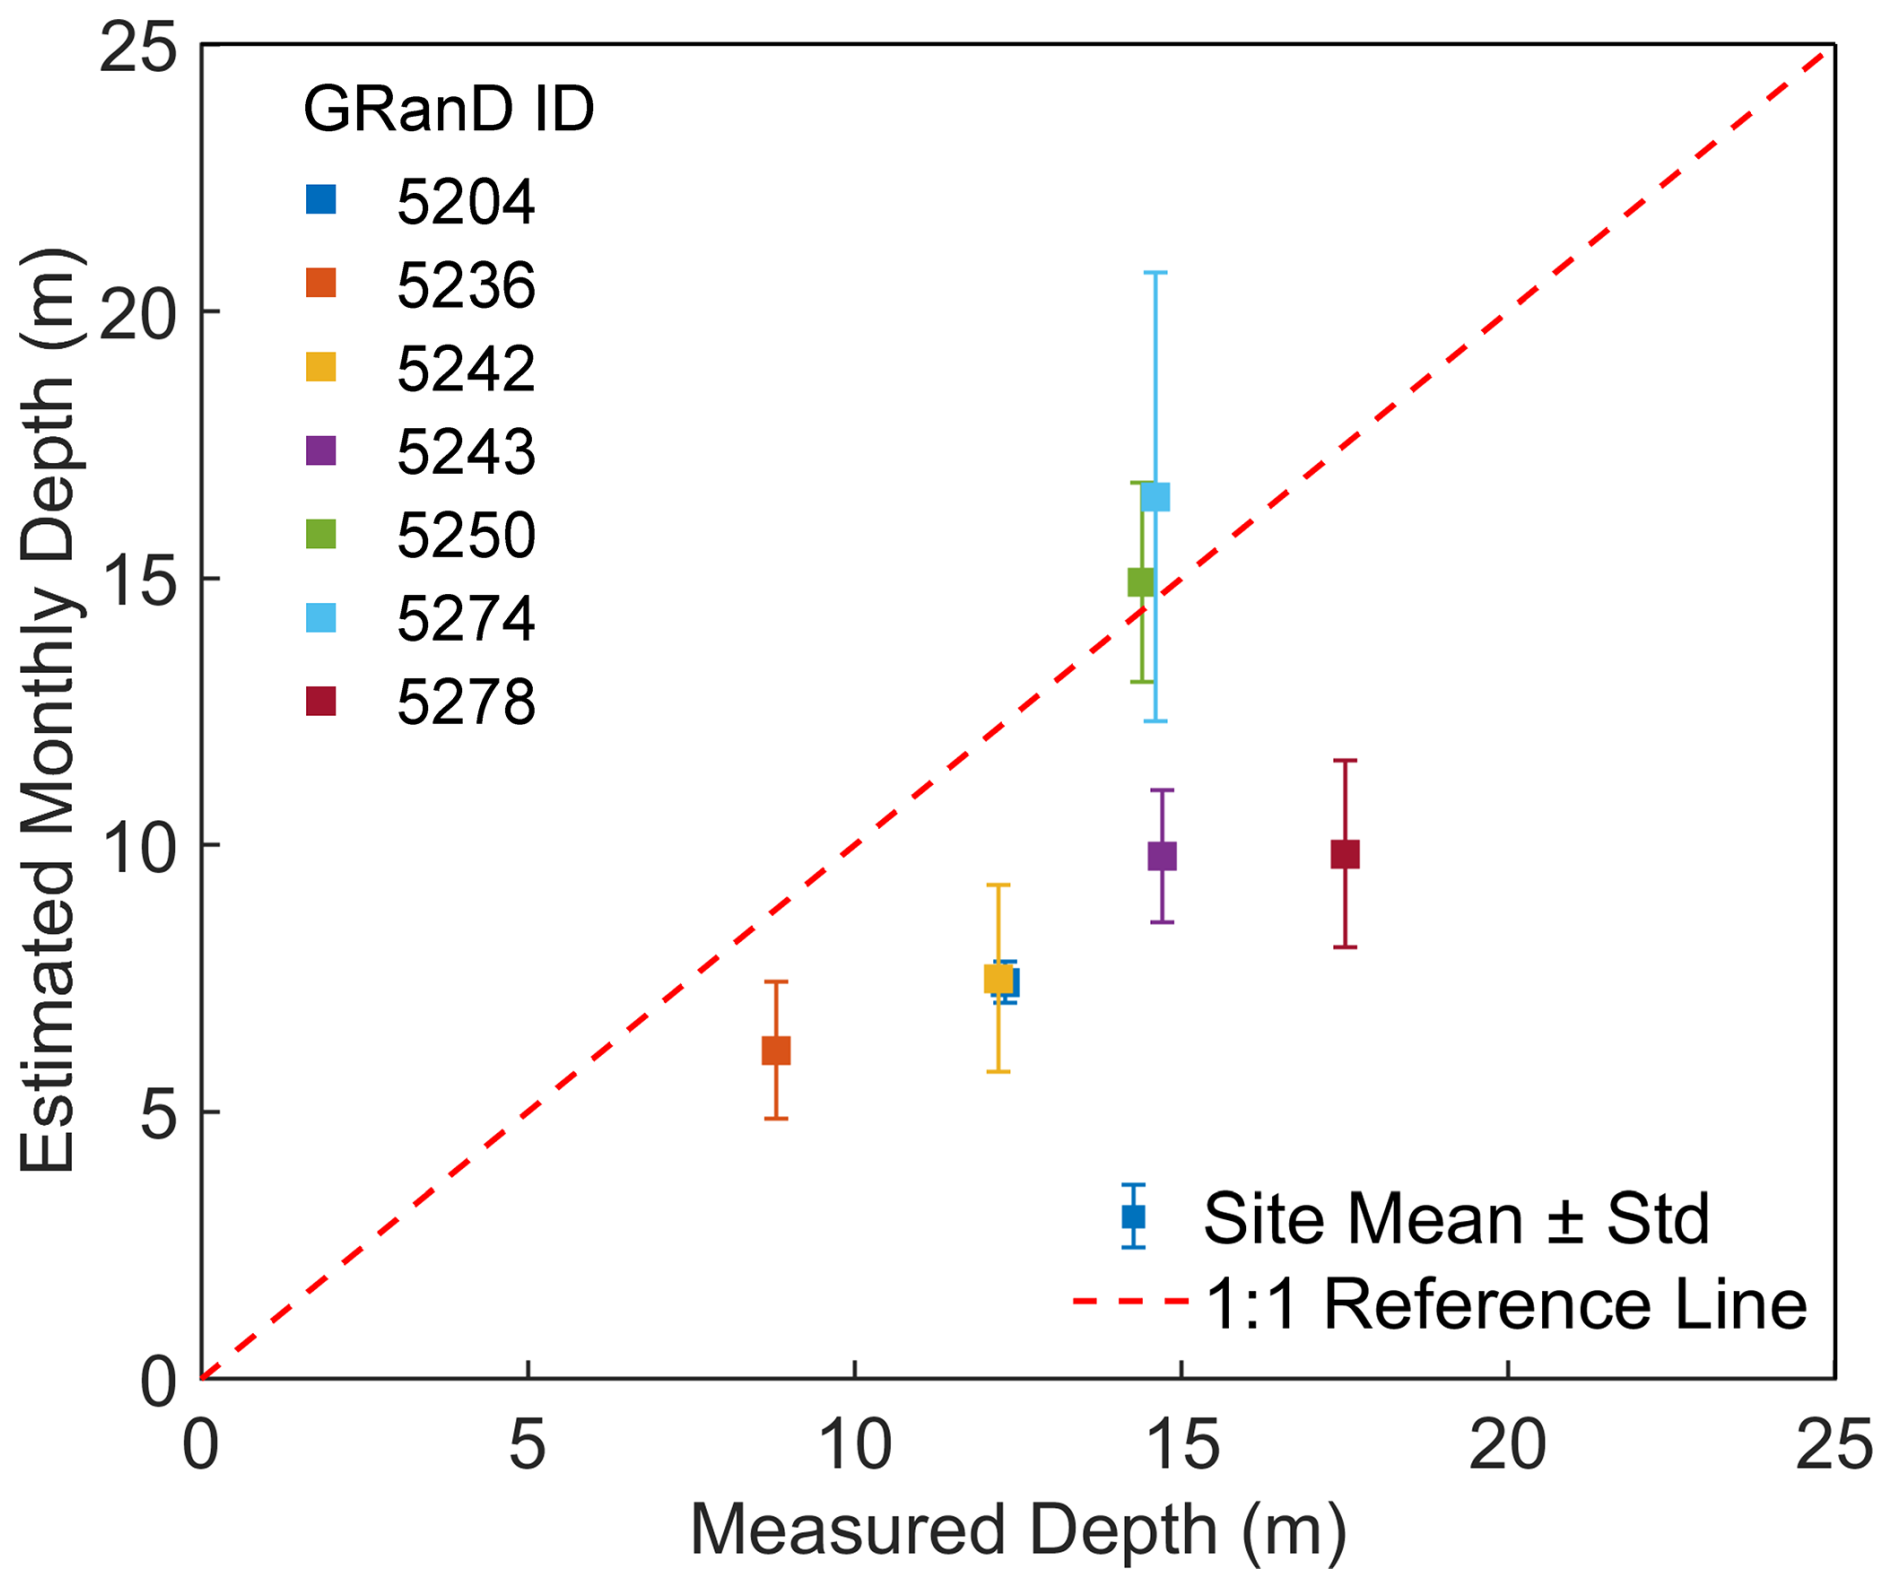
Figure 6Water depth estimation against measured depth. The measured depths are static values from the GRanD database. Error bars on the estimated depths represent the standard deviation of the dynamic monthly estimates. The red dashed line indicates the 1:1 reference.
Subsequently, we identified the effectiveness of the Penman model with the dynamic water depth component. As shown in Table 1, the model employing dynamic depth (Modified Penmandynamic) demonstrated a marked improvement in accuracy. The average R2 value increased from 0.59 for the static scenarios (Modified Penmanstatic) to 0.71 for our dynamic model (Modified Penmandynamic). Concurrently, the RMSE and MAB decreased significantly, from 42.62 and 38.14 to 22.52 and 18.85 mm per month, respectively. In contrast, the standard Penman model exhibited the poorest performance, with a markedly lower R2 of 0.40 and the highest RMSE (54.91 mm per month) and MAB (48.48 mm per month). These validations confirm that the dynamic water depth estimation and the associated heat storage consideration are indispensable for achieving reliable evaporation estimation across the Loess Plateau.
Table 1Evaporation estimation performance of the Penman model with different water depth consideration. Values represent the average for R2, RMSE, and MAB.
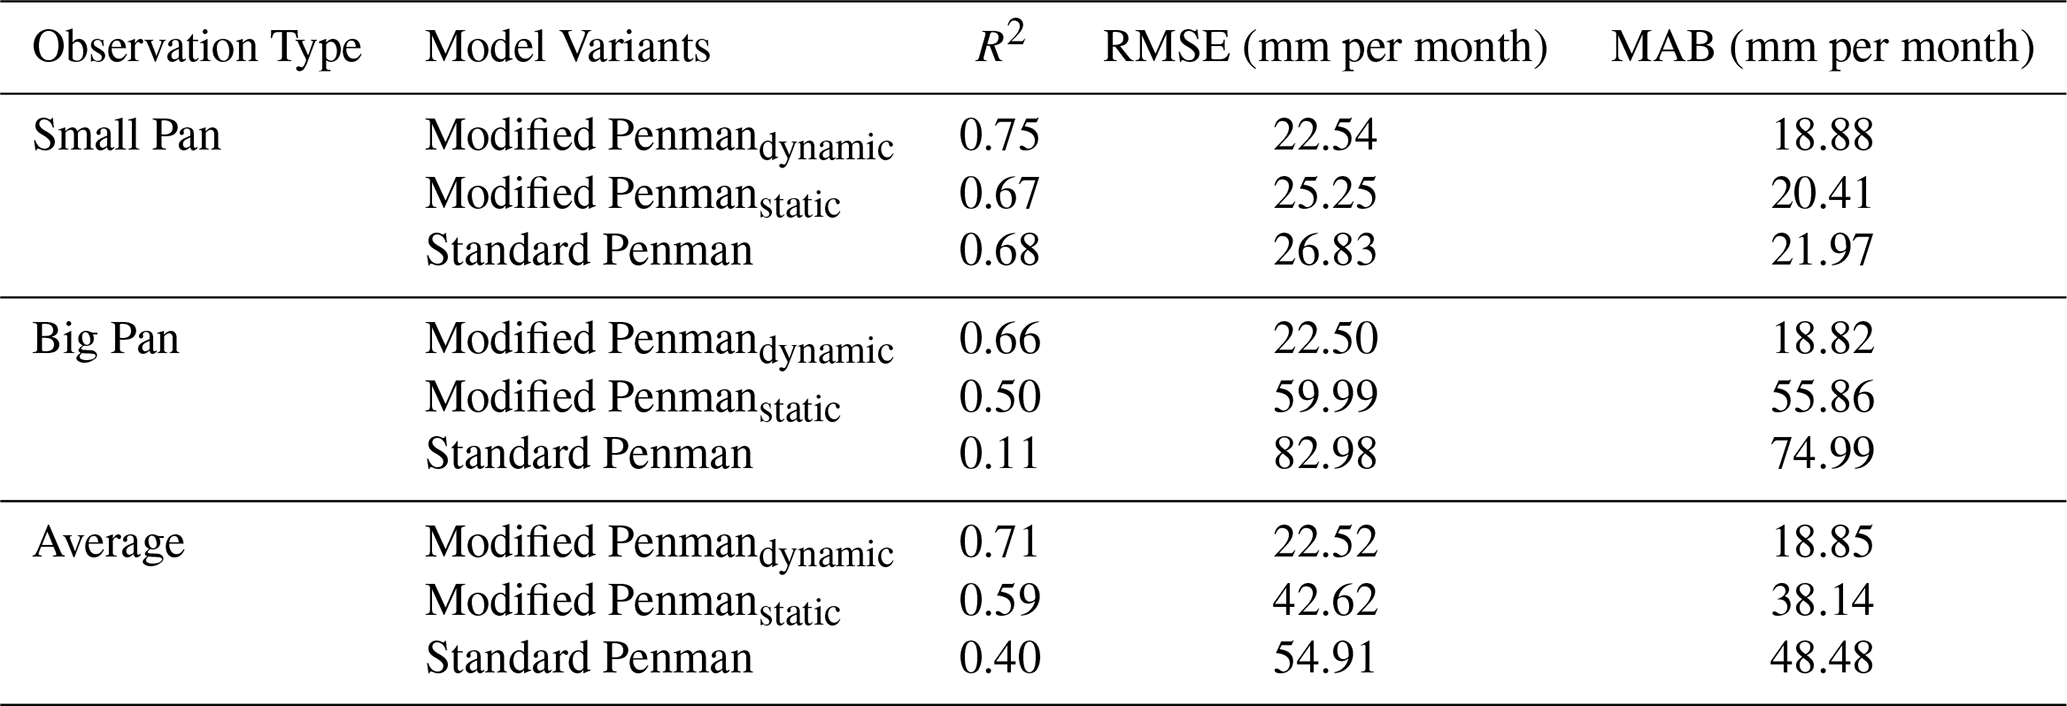
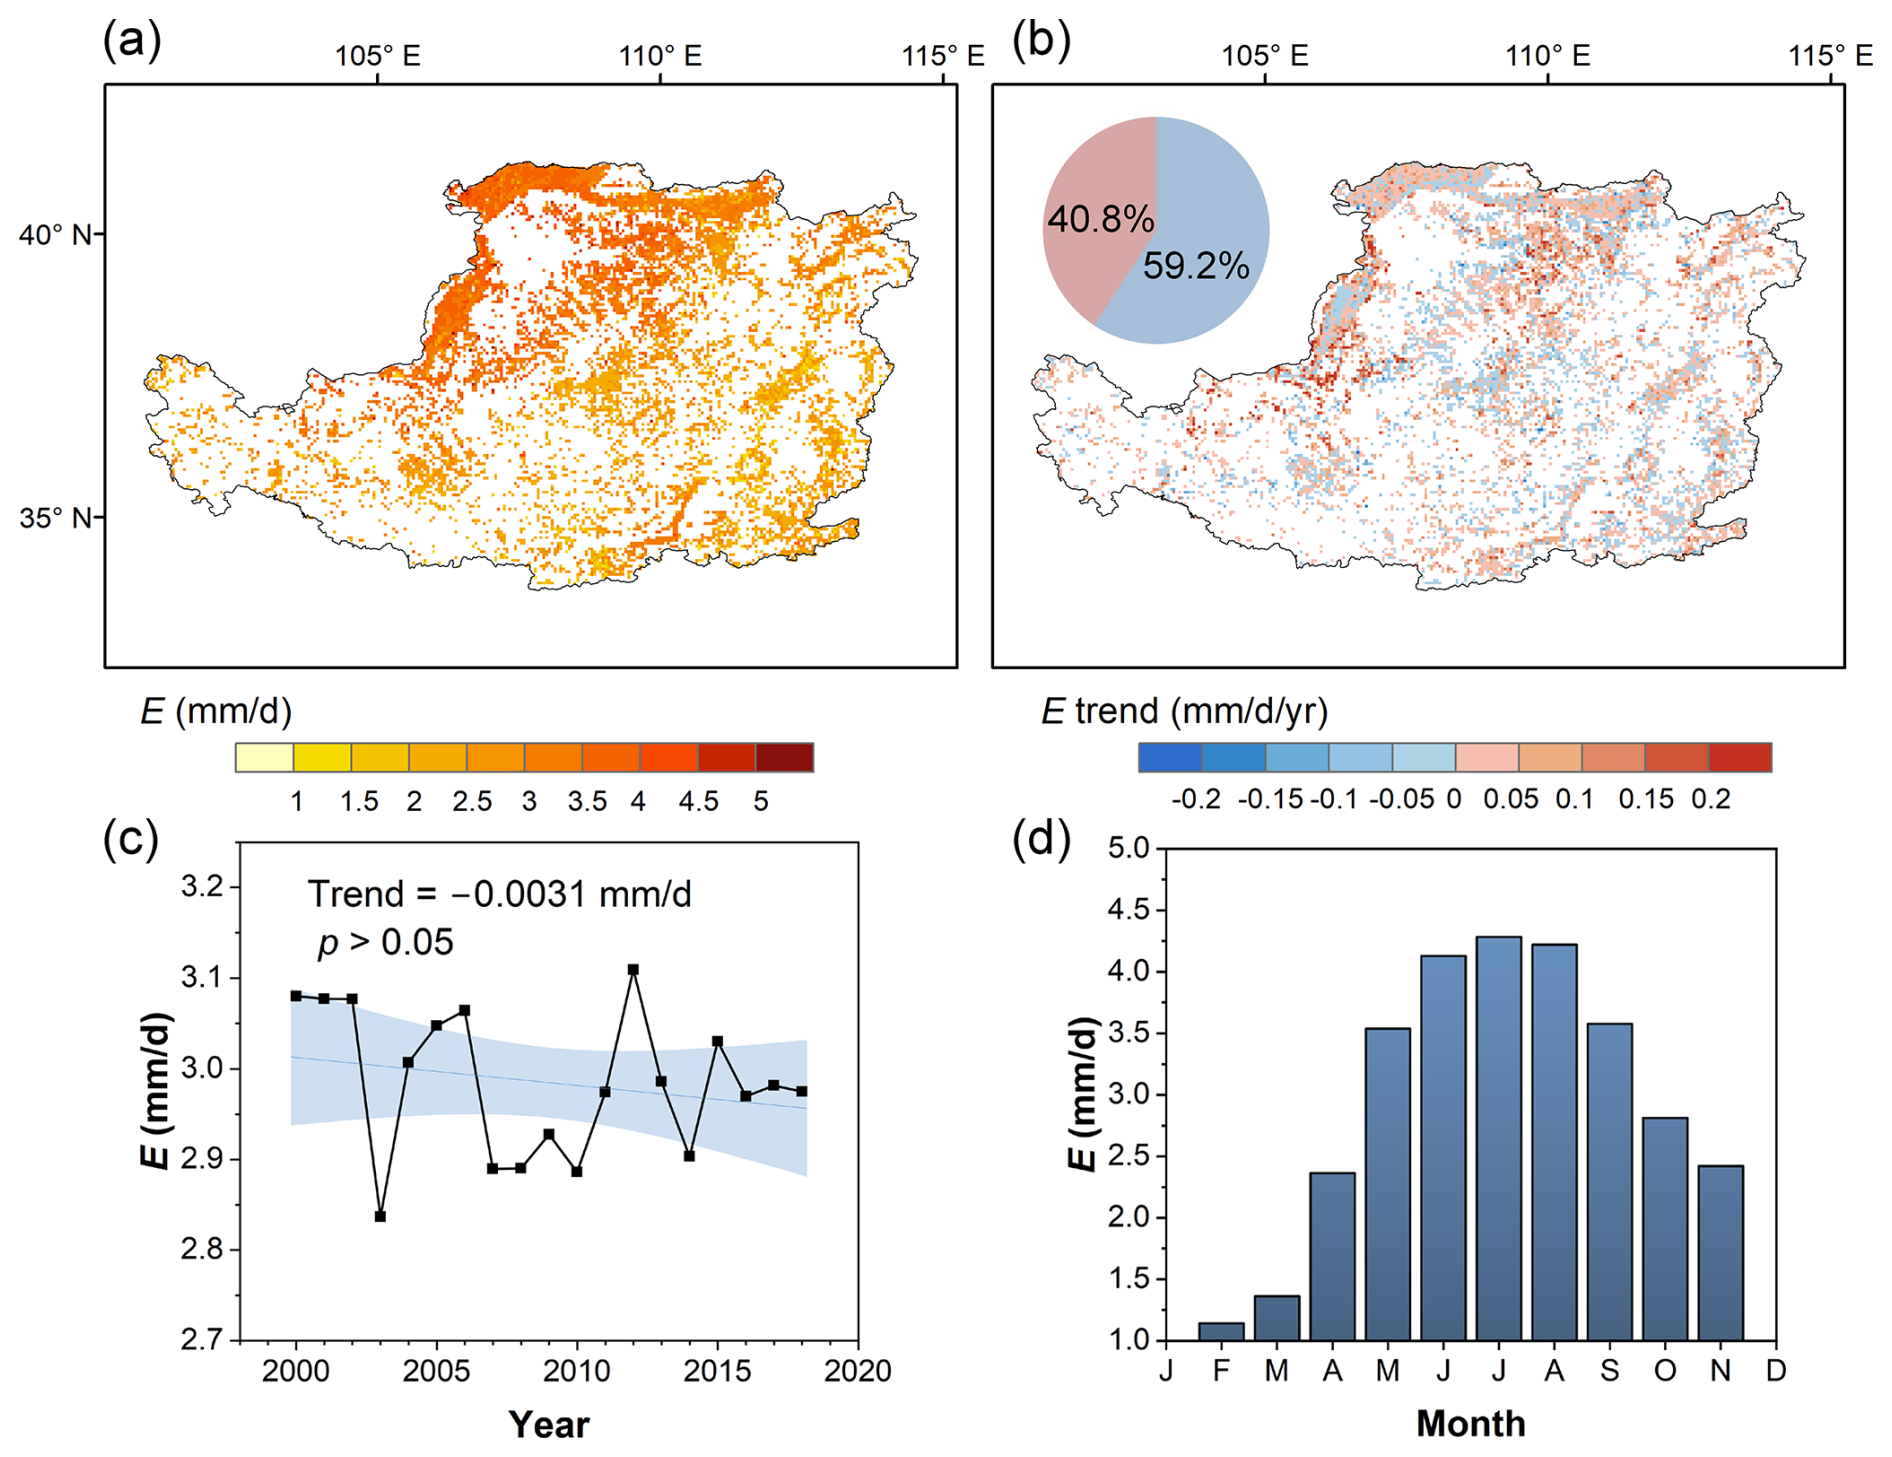
Figure 7Spatiotemporal patterns of open water evaporation rate (E) over the Loess Plateau (2000–2018): (a) Spatial distribution of long-term average E (mm d−1); (b) Spatial distribution of temporal trends in E (mm d−1 yr−1); (c) Interannual variability of averaged E, with the shaded area representing the 95 % confidence interval; and (d) Mean monthly climatology of averaged E for the Loess Plateau. The inset pie chart in (b) shows the water area percentage of positive and negative trends.
3.2 Spatial-temporal variation in evaporation rate
Evaporation from water bodies across the Loess Plateau presents pronounced geographical heterogeneity. The spatial distribution of evaporation exhibits a gradual decrease from the northwest to the southeast, as depicted in Fig. 7a. The long-term average evaporation rates vary between 2.8 and 3.1 mm d−1, with certain areas in the northwest exceeding 5 mm d−1. Temporal changes in evaporation, however, do not follow a discernible trend and appear relatively decentralized, as illustrated in Fig. 7b. Despite this, areas experiencing decreasing evaporation are slightly more extensive than those with increasing evaporation (59.2 % vs. 40.8 %). Notably, regions with significant increases in evaporation rates (p<0.05) are concentrated in the western and north-central Loess Plateau. This spatial pattern suggests that the trends are likely driven by changes in localized meteorological factors and water body characteristics.
Figure 7c and d present the interannual change and seasonality of evaporation rates. Over the period from 2000 to 2018, the long-term average daily evaporation rate on the Loess Plateau was approximately 2.98 mm d−1. However, this rate decreased slightly at a rate of −0.0031 mm d−1 yr−1 (p>0.05), indicating a subtle but consistent decline in evaporation. The interannual variability in evaporation is substantial, with notable lows in 2003, when daily evaporation rates dropped to approximately 2.8 mm d−1. In contrast, other years maintained average evaporation rates around 2.98 mm d−1, reflecting the typical evaporative conditions of the region. Please note that December and January were not considered for evaporation estimation in this study due to low temperatures and freezing of the water bodies.
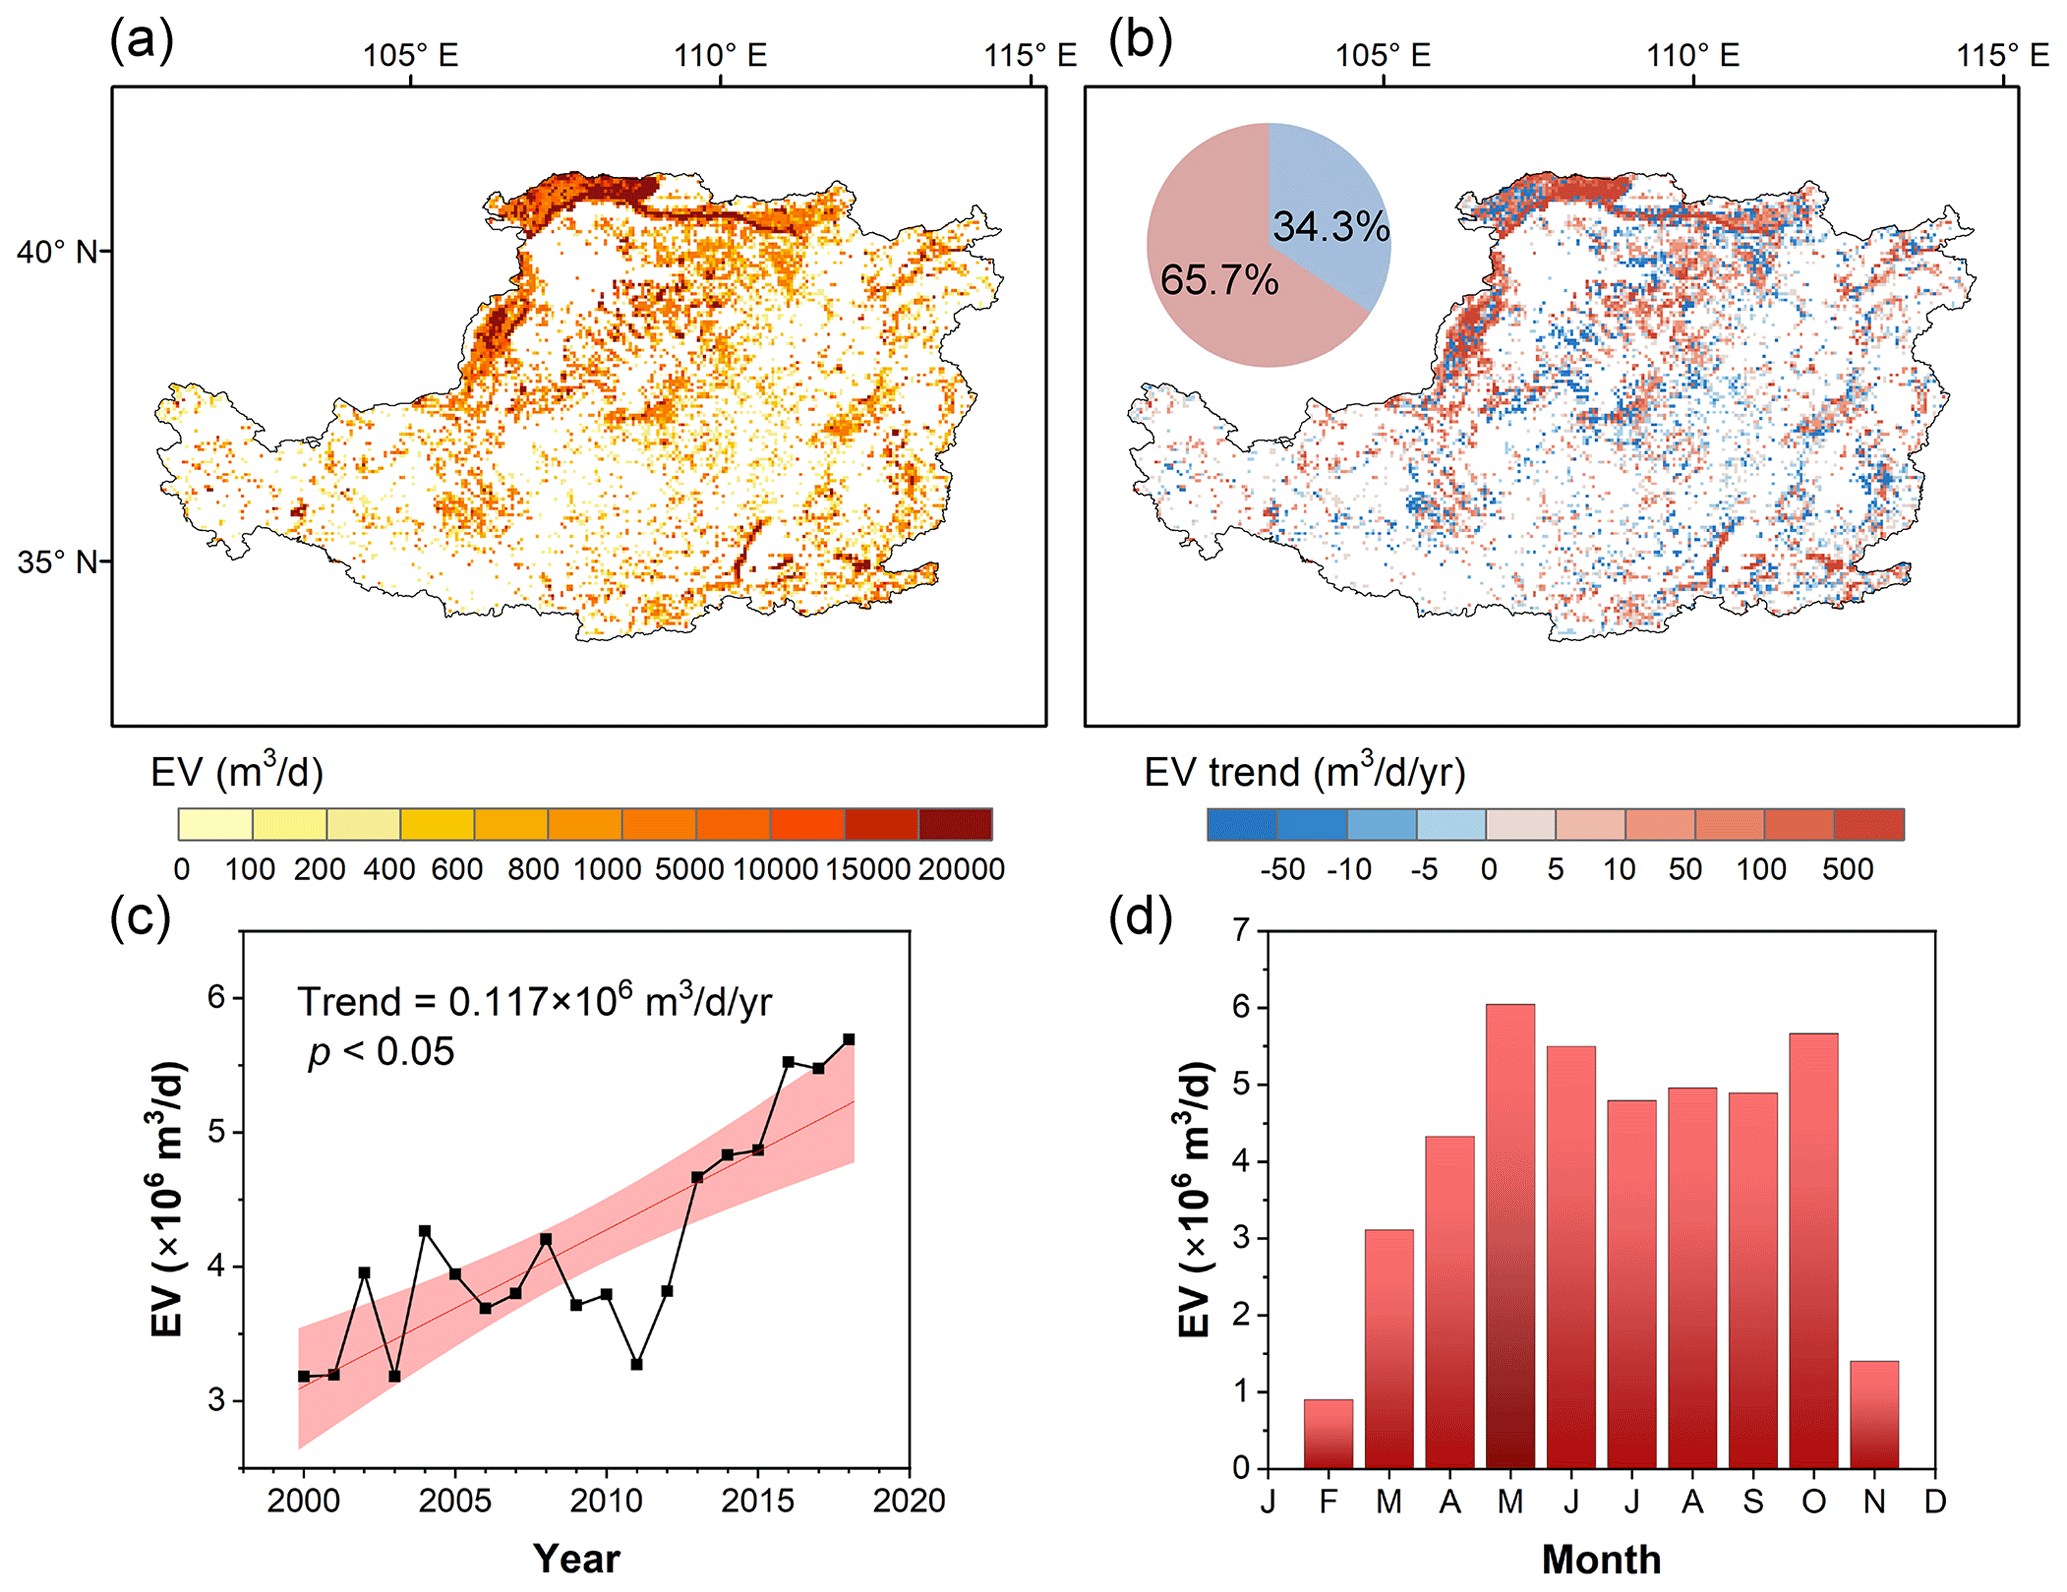
Figure 8Spatiotemporal patterns of open water evaporation volume (EV) over the Loess Plateau (2000–2018): (a) Spatial distribution of long-term average EV (m3 d−1); (b) Spatial distribution of temporal trends in EV (m3 d−1 yr−1); (c) Interannual variability of total EV summed over the entire Loess Plateau, with the shaded area representing the 95 % confidence interval; and (d) Mean monthly climatology of total EV.
3.3 Spatial-temporal variation in evaporation volume
The spatial distribution of evaporation volume (Fig. 8a) reveals a distinct pattern of high evaporation in the northwest and lower values in other regions. In the densely watered northwestern areas, evaporation volumes exceed 20 000 m3 d−1, contrasting sharply with most regions where evaporation remains below 1000 m3 d−1. A notable increasing trend in evaporation volume is observed, particularly concentrated in the northwest (Fig. 8b), coinciding with areas experiencing high evaporation loss. Additionally, significant changes in surface water evaporation loss are evident in the southeastern and central-northern parts of the plateau, where the evaporation volume increased with the rate up to 100 m3 d−1 yr−1.
Figure 8c illustrates the temporal change in daily evaporation volume on the Loess Plateau. A significant upward trend (p<0.05) is observed, with an average annual increase of 0.117 × 10⁶ m3 d−1 yr−1. Evaporation volumes rose from 3.18 × 10⁶ m3 d−1 in 2000 to 5.69 × 10⁶ m3 d−1 in 2018, with a long-term average of 4.16 × 10⁶ m3 d−1 for the period 2000–2018. Seasonal variation in evaporation volume exhibits distinct peaks in spring and autumn, with a yearly maximum of 6.04 × 10⁶ m3 d−1 in May (Fig. 8d). It is noteworthy that while evaporation rates peak during the summer, evaporation volumes peak in May, aligning with seasonal fluctuations in water body areas (Liu et al., 2023). This implies that the seasonal variation in evaporation volume may be dominated by changes in surface water area.
An analysis of temporal fluctuations reveals inconsistencies between evaporation loss and evaporation rate. Specifically, years with low evaporation loss, such as 2000, 2001, 2003, and 2011, do not always correspond to years with low evaporation rates, which were 2003 and 2010. This discrepancy suggests that factors other than meteorological conditions may control evaporation loss.
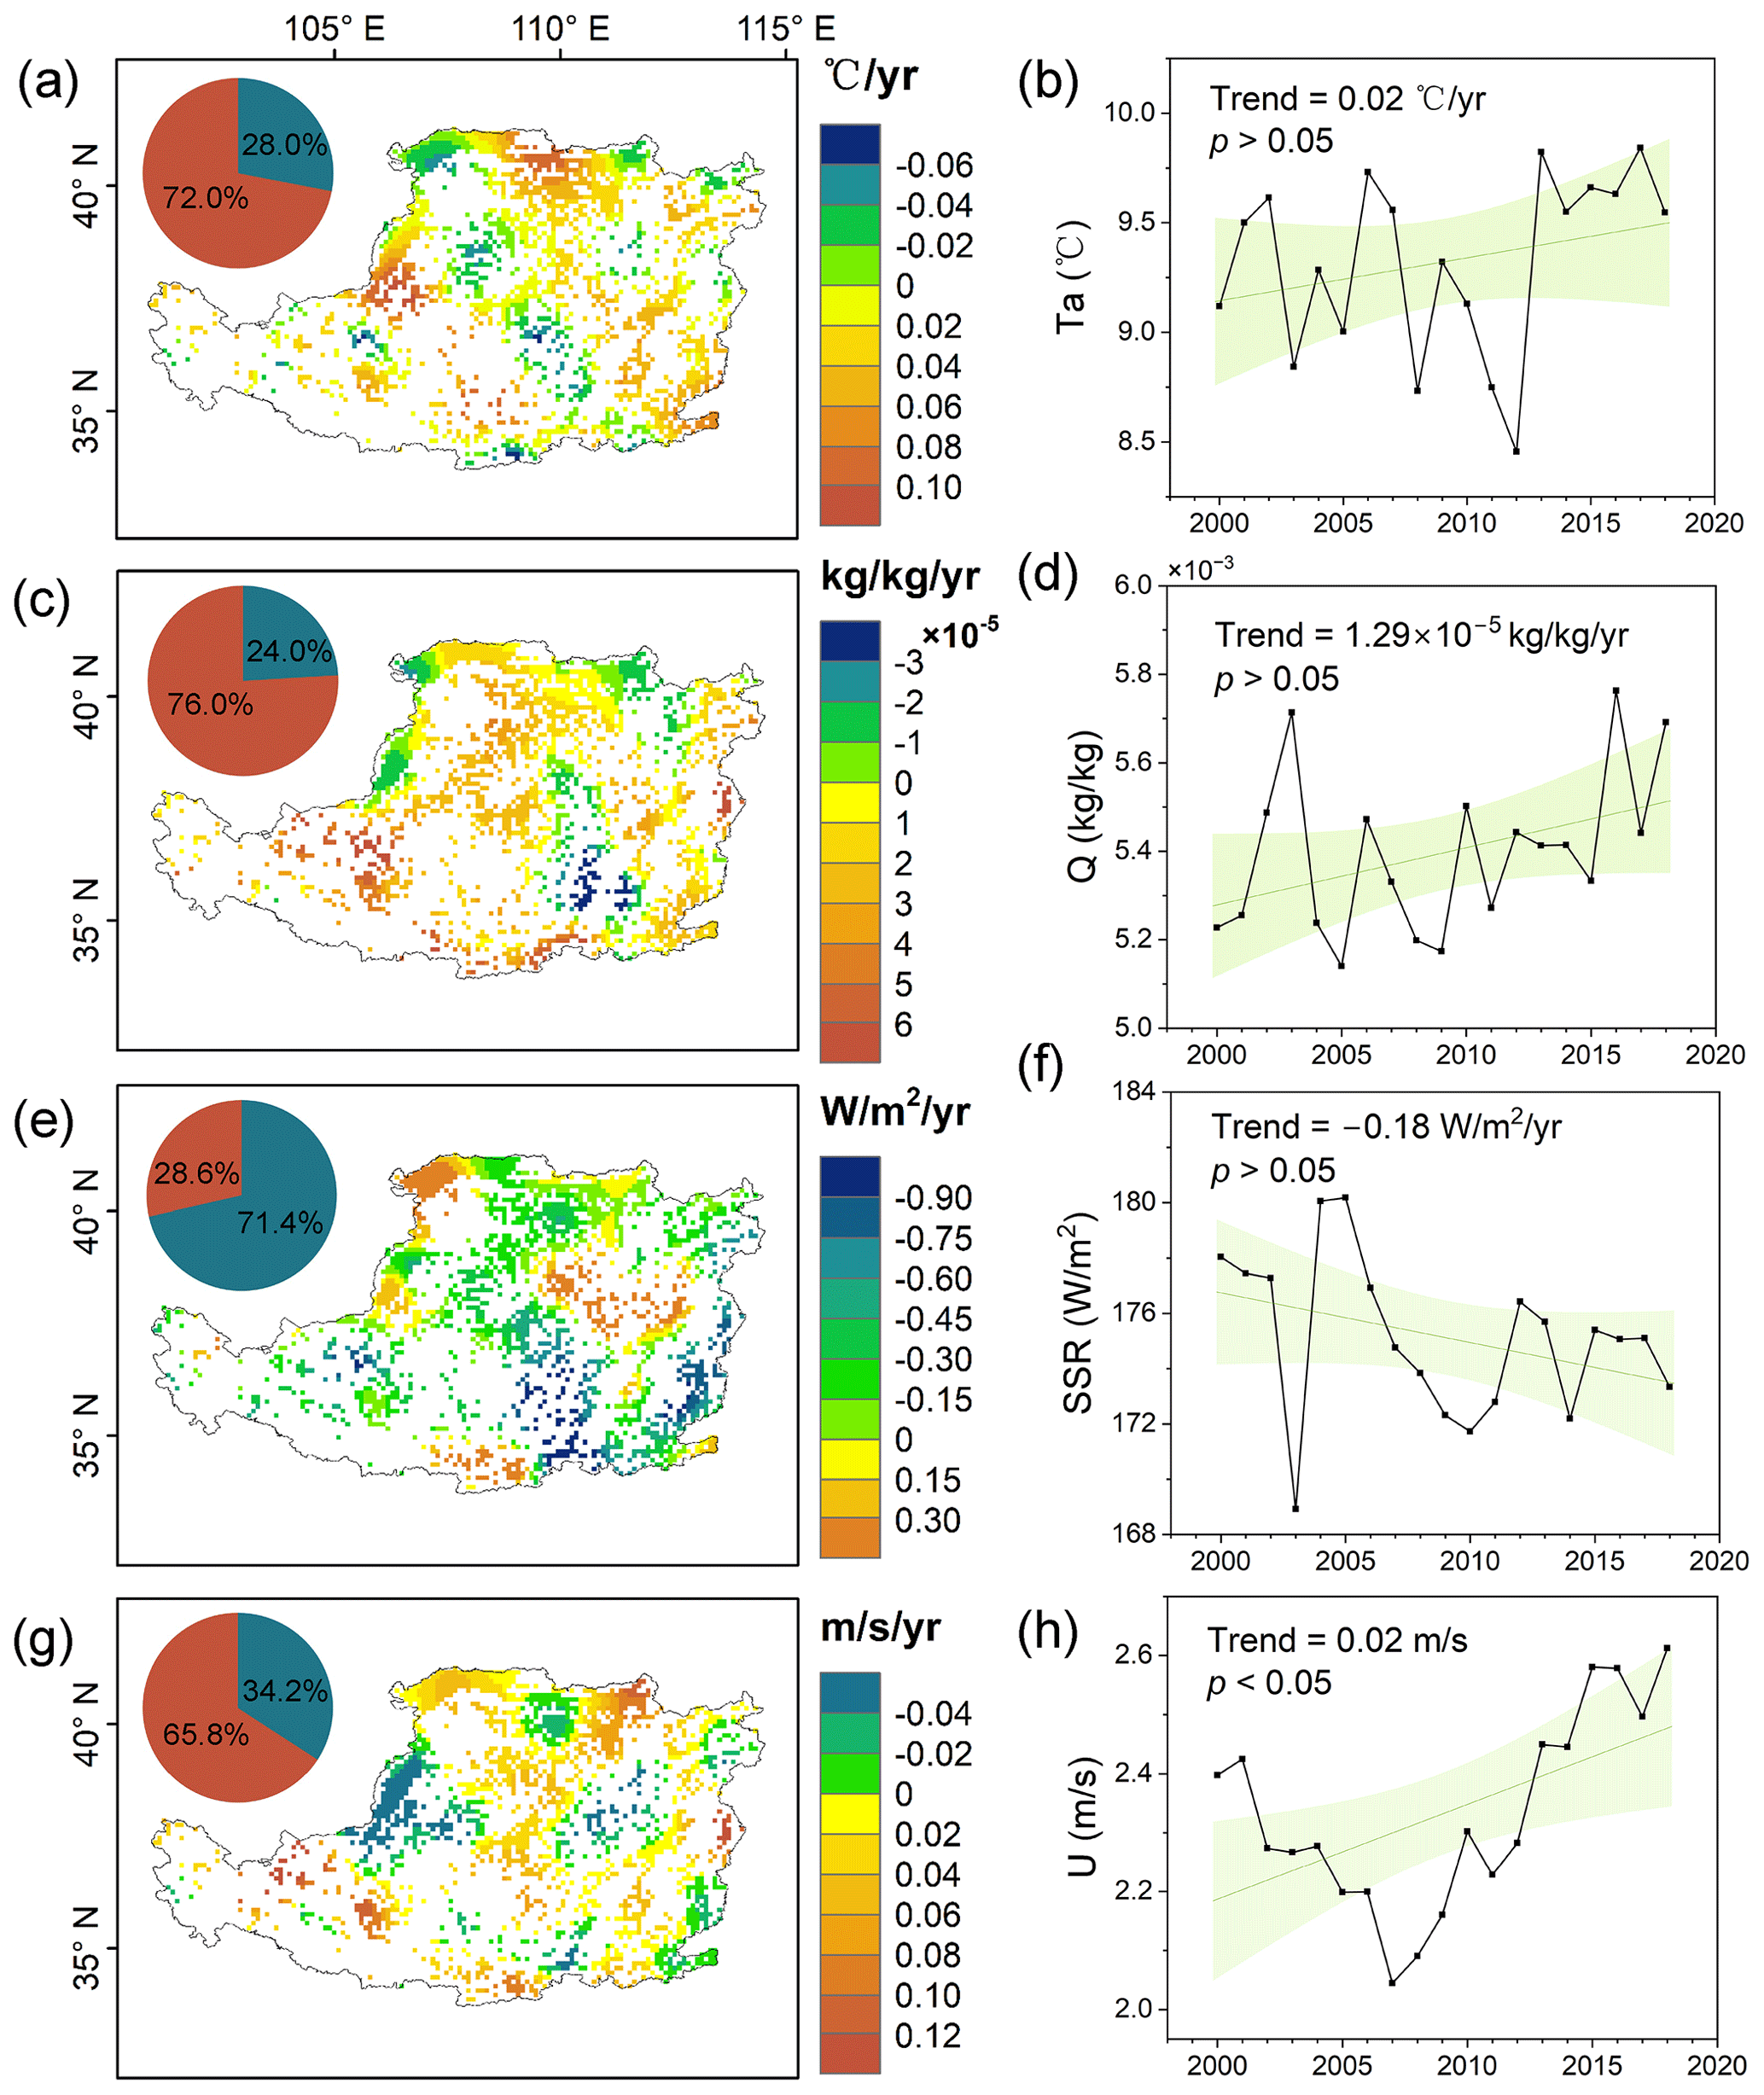
Figure 9Trends in key meteorological drivers over the Loess Plateau from 2000 to 2018: (a) air temperature (Ta) (°C yr−1), (c) specific humidity (Q) (kg kg−1 yr−1), (e) surface shortwave radiation (SSR) (W m−2 yr−1), and (g) wind speed (U) (m s−1 yr−1). Regional average time series of these factors are shown in (b) Ta, (d) Q, (f) SSR, and (h) U. The left pie charts in (a), (c), (e), (g) display the percentages of increasing (dark brown) and decreasing (blue) trends. The shaded areas in the right panels (b), (d), (f), (h) show the 95 % confidence interval. Trends are shown at the original 0.1° resolution of the meteorological forcing data.
3.4 Effect of driving factors on evaporation
3.4.1 Dynamics of driving factors
The Loess Plateau displayed marked spatial heterogeneity in the interannual trends of meteorological factors from 2000 to 2018 (Fig. 9). Ta presents a predominantly increasing trend (72.0 %), with notable exceptions along the northwest-southeast median and a few isolated areas where decreases are observed (Fig. 9a). The southern-central part of the plateau experiences the most substantial cooling, exceeding −0.06 °C yr−1, while the western region undergoes the fastest warming, reaching rates of up to 0.1 °C yr−1. Over the past two decades, the mean annual Ta on the Loess Plateau has stabilized around 9.32 °C, albeit with inter-annual fluctuations indicating a slight increase of 0.02 °C yr−1 (Fig. 9b).
Q follows a similar pattern of increase across most of the Loess Plateau (76.0 %), contrasted with a decreasing trend in a small southeastern sector (Fig. 9c). Over the study period, the annual average Q initially declined slightly during the first decade, subsequently experiencing a rapid increase, with an average rate of 1.29 × 10⁻⁵ kg kg−1 yr−1 (Fig. 9d). In contrast, SSR exhibits a marked decreasing trend across the majority of the region (71.4 %), with upward trajectories visible in a small eastern-central area as well as parts of the northwest (Fig. 9e). The annual average SSR demonstrates a fluctuating but overall downward trend, decreasing at a rate of −0.18 W m−2 yr−1 (Fig. 9f). A dominant majority of water bodies area (65.8 %) exhibit an increasing trend in U, and the magnitude of this increase is substantially stronger than the decreasing trends observed elsewhere. Hence, the annual average U displays a clear upward trend, with a mean increase rate of 0.02 m s−1 yr−1 (p<0.05) (Fig. 9h).
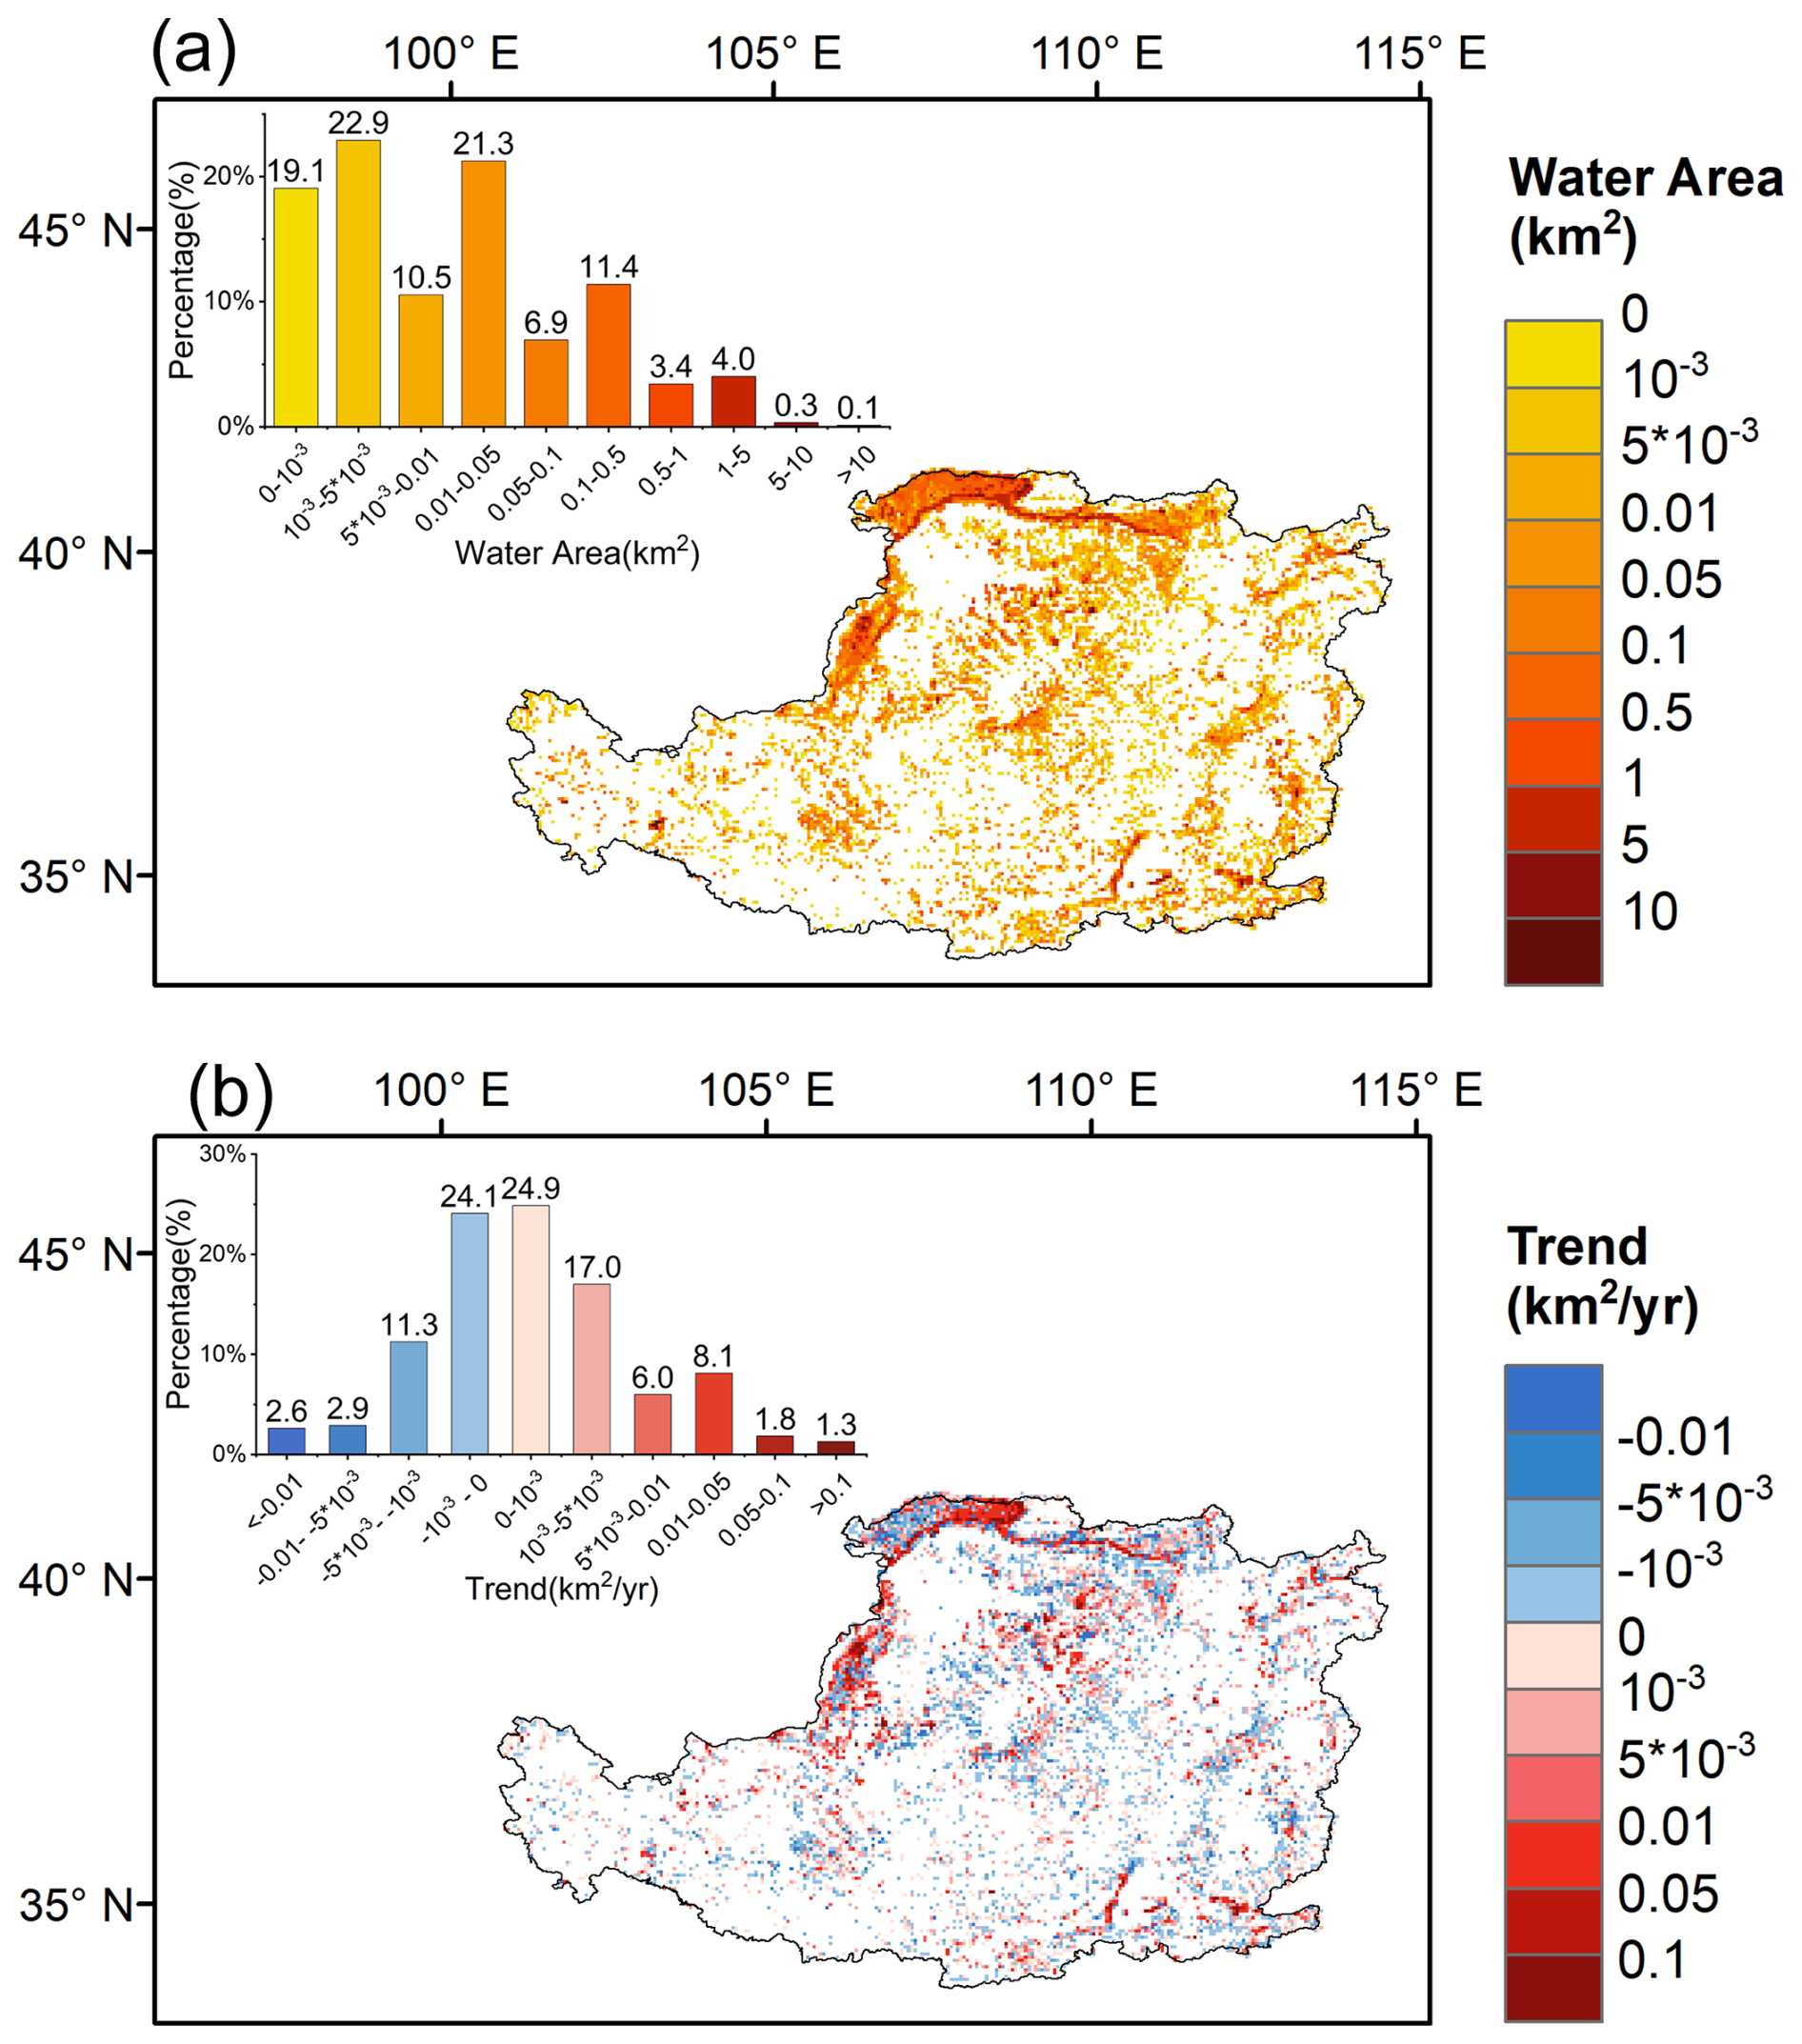
Figure 10Distribution and dynamics of surface water area per 0.05° grid cell on the Loess Plateau during 2000–2018, aggregated from 30 m JRC-GSW data: (a) Long-term average water area (km2 per grid cell); (b) Temporal trend in water area (km2 yr−1 per grid cell). The inset histogram shows the percentage distribution of grid cells.
Compared to meteorological factors, surface water area exhibits more pronounced variations in areas of high human activity. As shown in Fig. 10, the surface water bodies of the Loess Plateau are concentrated in the northwestern region, while the rest of the region exhibits a more dispersed distribution. Notably, water bodies smaller than 0.05 km2 account for 73.8 % of all water body grids on the Loess Plateau (Fig. 10a). Among these, grids showing an increasing trend are nearly 1.5 times those with a decreasing trend (Fig. 10b). This substantial rate of increase underscores the dynamic nature of water body expansion in the region. In parallel, there is a more pronounced trend of growth in surface water area in the northwestern and central regions. This pattern is consistent with the distribution characteristics of evaporation loss as depicted in Fig. 8.
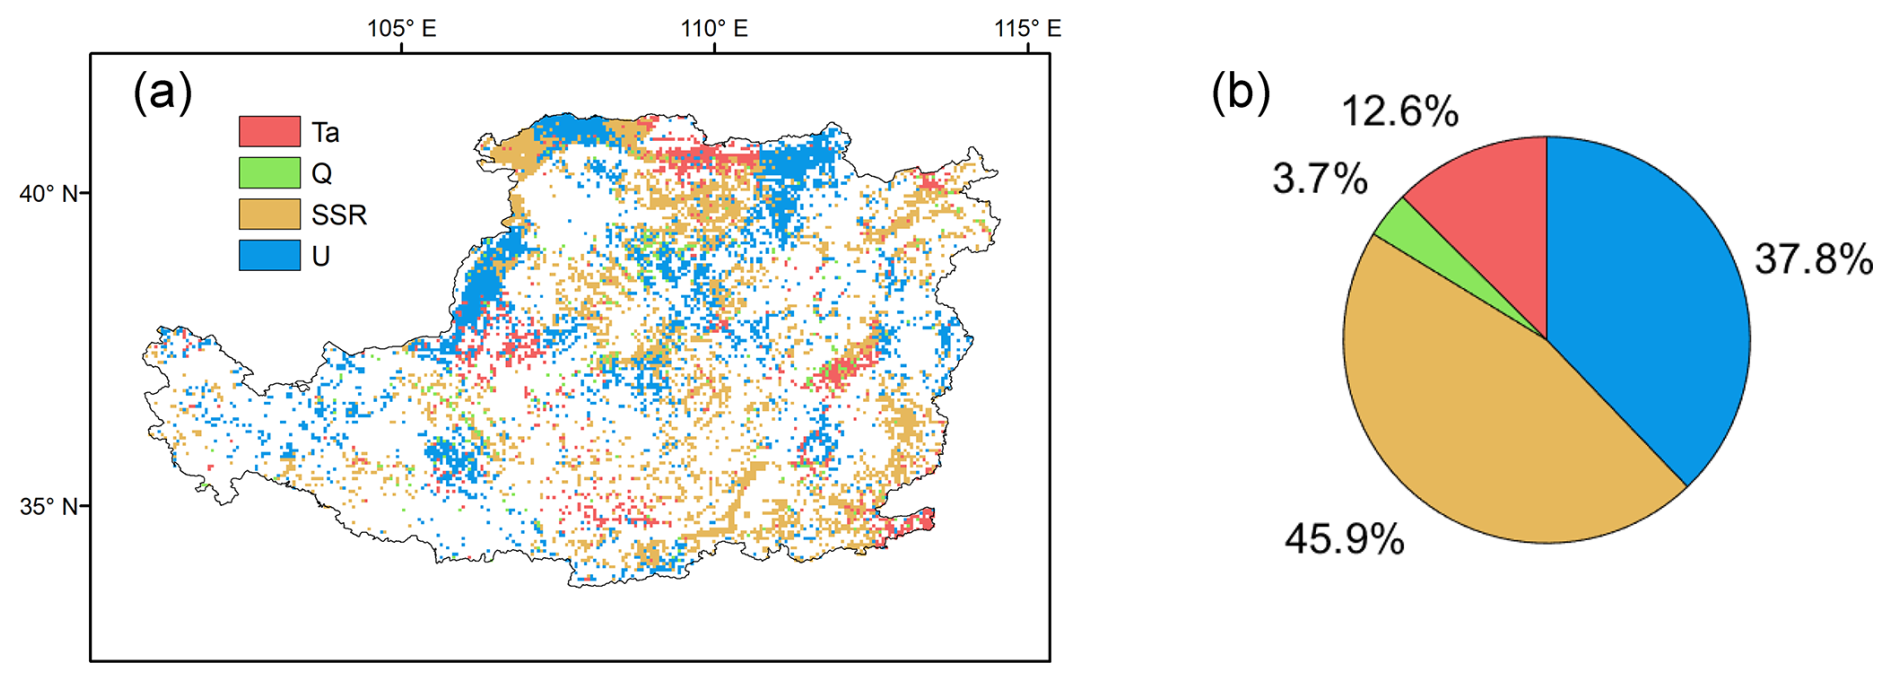
Figure 11Spatial distribution of the dominant meteorological drivers of open-water evaporation rates (a) and their corresponding areal proportions across the Loess Plateau (2000–2018) (b). Each 0.05° grid cell is colored according to the dominant meteorological factors, i.e., Ta, Q, SSR, and U.
3.4.2 Attribution of evaporation rate and volume
The evolving meteorological conditions across the Loess Plateau are expected to fundamentally alter surface water evaporation regimes. To quantify these climate-driven effects, we systematically evaluated the influences of key meteorological variables (air temperature, humidity, solar radiation, and wind speed) on evaporation rates using the scenario-based framework established in Sect. 2.5.
The simulated scenarios reveal distinct spatial patterns in meteorological controls on surface evaporation across the Loess Plateau (Fig. 11). SSR is the most dominant driver, accounting for 45.9 % of the study area, with its influence broadly distributed across the central and southern regions. U is the second most influential factor (37.8 %), with its control concentrated in a distinct zone across the northern plateau. Ta is the dominant factor in 12.6 % of the study area, and its influence is primarily clustered in the western and southwestern sectors. Q has the most limited impact (3.7 %), exhibiting a fragmented and localized influence across the region.
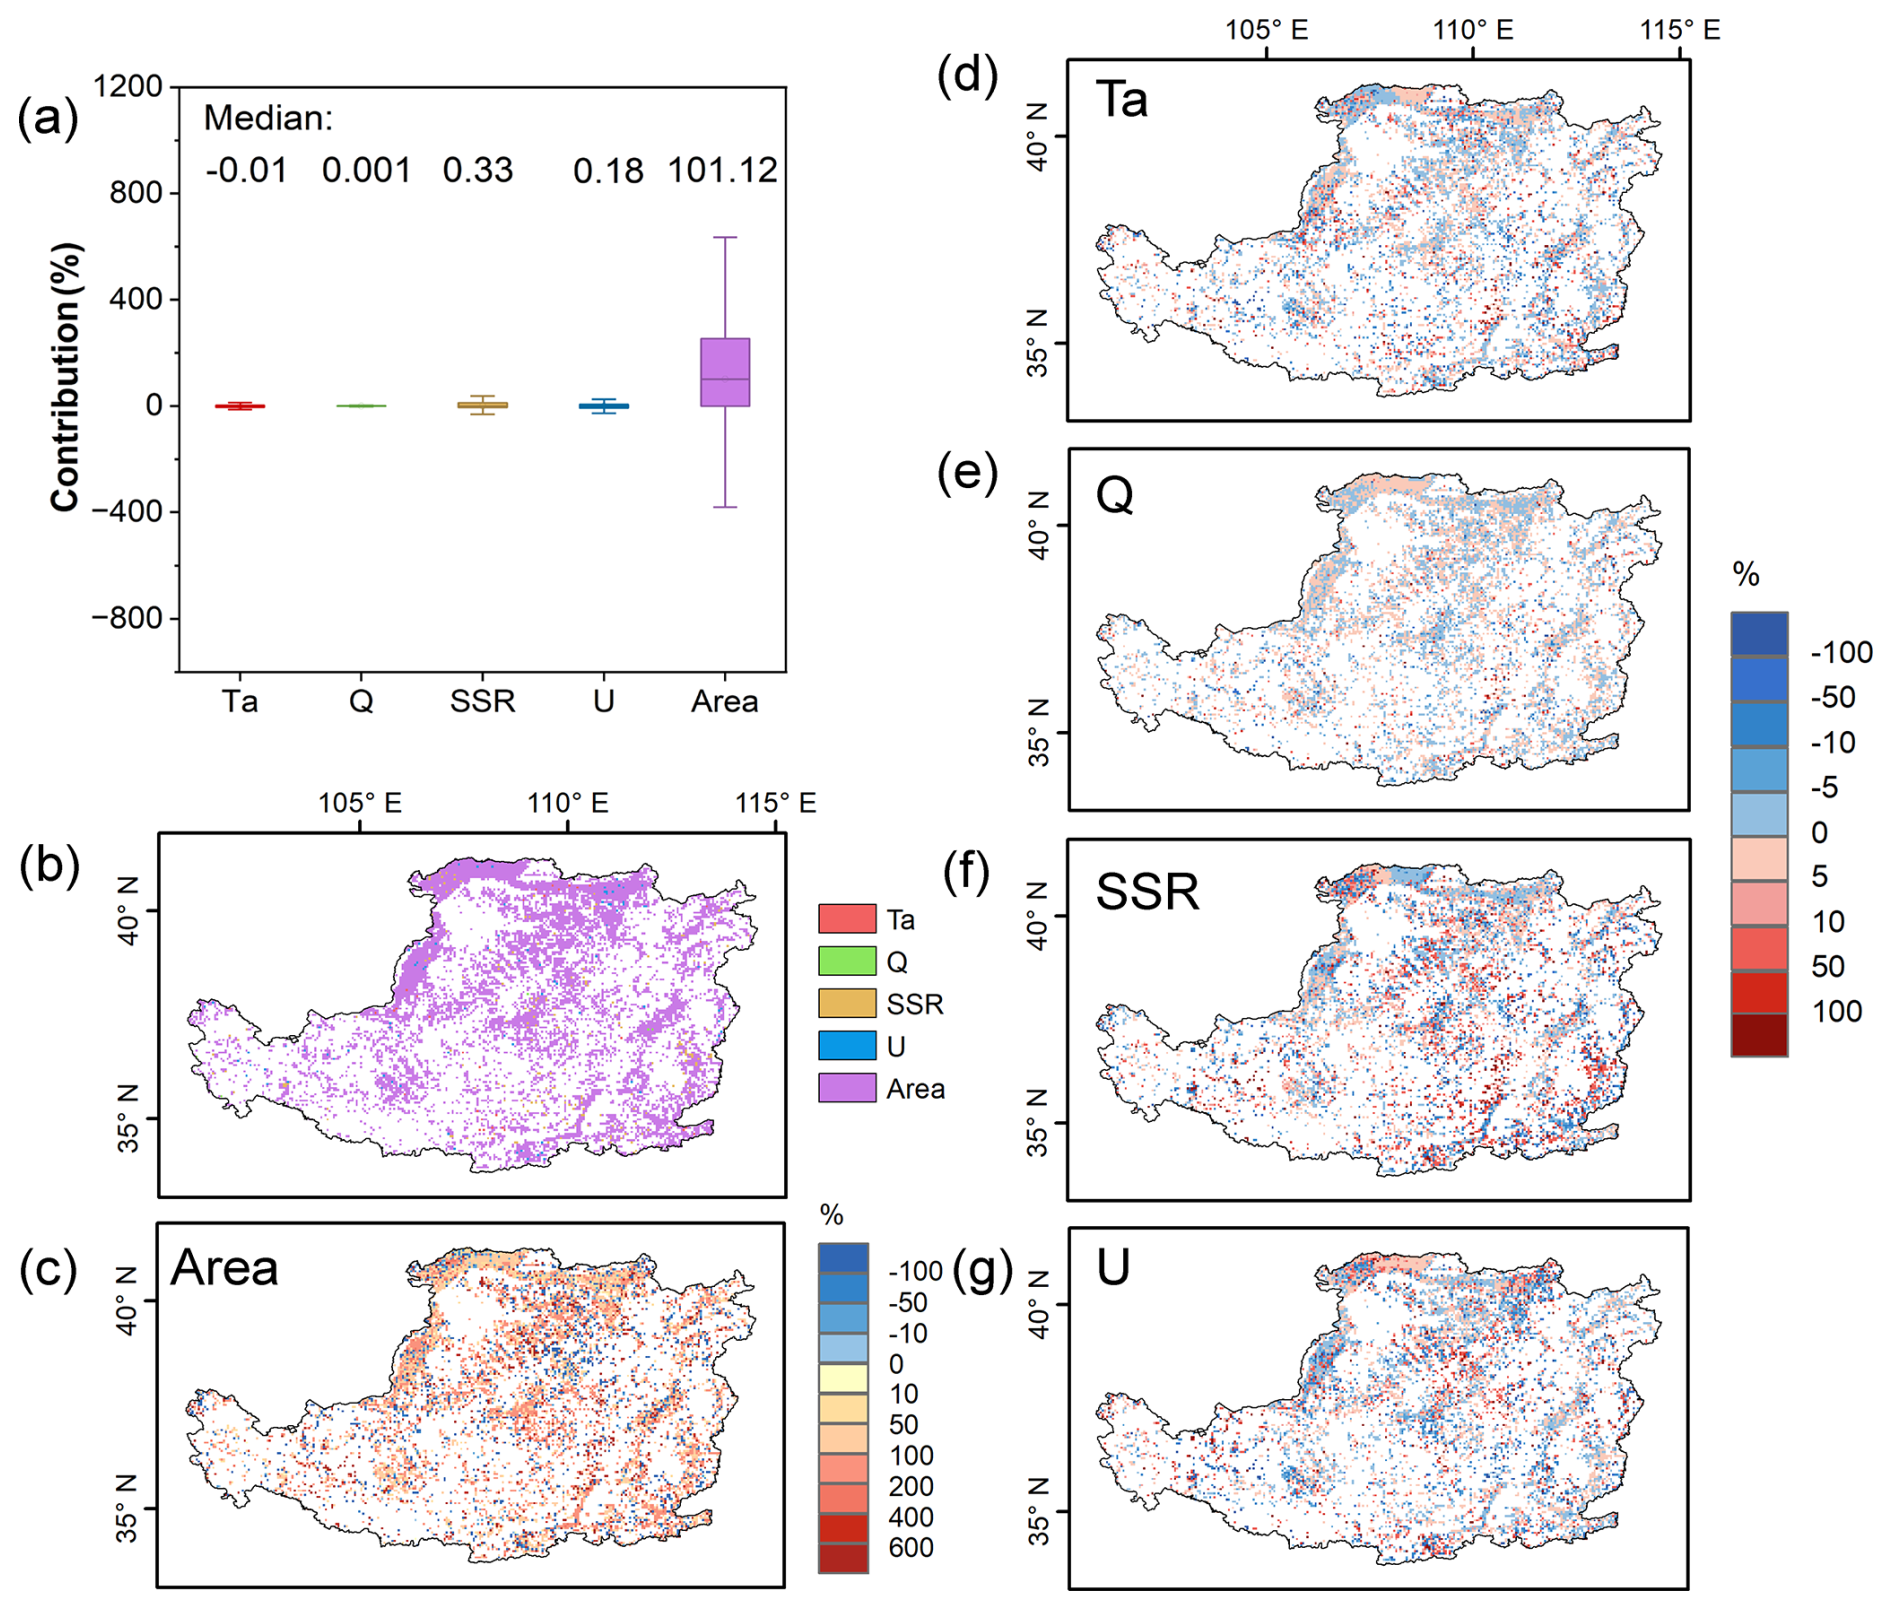
Figure 12(a) The contributions of factors to the changes in evaporation volume. The factors considered are Ta, Q, SSR, U, and Area. (b) Spatial distribution of the dominant driver of the EV trend. Changes in evaporation volume caused by (c) Area, (d) Ta, (e) Q, (f) SSR, and (g) U.
We employed the five detrend experiments to quantify influence of each factor on the evaporation loss, considering surface water area as an additional driver alongside the four meteorological factors. The dominant driver is defined as the factor with the largest absolute contribution percentage among all driving factors. As shown in Fig. 12, water area variations play a significant role in modulating evaporation processes. Across the study area, changes in surface water area account for a substantial 101.12 % of the variation in evaporation volumes, indicating a strong and positive effect (Fig. 12a). In contrast, the net influence of all meteorological factors is comparatively modest, suggesting potential offsetting effects among them. To dissect these contributions spatially, we first identified the dominant driver of the EV trend in each grid cell (Fig. 12b). This map visually confirms that water area change is the primary driver across most of the Loess Plateau.
To reveal the full spatial complexity, including the more subtle influences of meteorological variables, we mapped the specific contribution of each factor individually (Fig. 12c–g). The contribution of water area change is predominantly positive across the Loess Plateau, with values exceeding 50 % in numerous water bodies (Fig. 12c). These changes largely enhance evaporation loss, underscoring the critical role of water body dynamics in regulating evaporation at both local and regional scales. Notably, the central part of the Loess Plateau exhibits a decreasing trend in evaporation volumes, which can be attributed to the shrinkage of water bodies in this area.
In contrast, the influence of meteorological factors on evaporation volumes is relatively modest (Fig. 12d–g). Among these factors, shortwave radiation exhibits the most significant effect, with a median contribution of 0.33 %. However, the cumulative effect of all meteorological factors only accounts for 0.5 % of the variation in evaporation volumes, suggesting potential offsetting trends among these factors, where positive contributions from one factor are neutralized by negative contributions from others. Spatially, the contributions of meteorological factors to evaporation volumes are either positive or negative but remain relatively small, with specific humidity contributing below 5 % in most regions and the other three meteorological factors generally contributing less than 10 %. The above results emphasize the primary importance of water area dynamics in regulating evaporation volumes, while meteorological factors play a secondary, albeit complex role.
4.1 Reliability of evaporation estimation
A significant challenge in estimating evaporation rates arises from fluctuations in the heat storage of the water body. The thermal storage of a water body directly influences its energy contribution and water surface temperature (McMahon et al., 2013), subsequently impacting evaporation rates (Fairall et al., 1996; Schladow, 2015; Nehorai et al., 2013). For instance, the incorporation of the thermal storage term in Lake Mead (Nevada/Arizona) improved the estimated R2 from 0.29 to 0.84 compared to models that excluded it (Zhao and Gao, 2019). Furthermore, water depth emerges as a critical parameter in estimating the heat storage capacity of a water body. Deeper water bodies, particularly when there is a substantial temperature difference between air and water, possess a greater heat storage capacity. This capacity further moderates the disparity between air temperature and water surface temperature, a factor crucial for accurately estimating the heat storage dynamics related to water body depth. Incorporating these dynamics is important to provide a more refined estimation of surface water evaporation (Panin et al., 2006; Wossenu, 2001; Zhang et al., 2024).
To consider the effect of heat storage on evaporation, we employed an equilibrium temperature-based Penman equation and integrated it with a novel dynamic water depth module to assess evaporation rates from water bodies across the Loess Plateau. The comparison between the simulated evaporation rates and those measured using evaporation pans reveals a coefficient of determination (R2) of approximately 0.7, with MAB generally below 20 mm per month. This level of agreement underscores the reliability of our model. While our model entails uncertainties in water depth estimation, it nevertheless demonstrates robustness in simulating water evaporation, as using a static depth or neglecting depth entirely would introduce substantially greater uncertainty (Table 1).
The averaged evaporation rate estimated for the Loess Plateau in this study is about 2.98 mm d−1, demonstrating excellent consistency with evaporation rates reported for specific reservoirs or water bodies in the region. For instance, previous studies focusing on various water bodies within the Loess Plateau have generally reported evaporation rates falling within the range of 2.73 to 3.72 mm d−1 (equivalent to 1000–1358 mm yr−1) (Ma et al., 2013; Ren and Guo, 2006; Tian et al., 2005). This alignment indicates that our methodology, which integrates multiple physical parameters, is capable of producing evaporation estimates that are in good agreement with those derived from more localized studies.
Particularly noteworthy is the high evaporation rate observed in the northwest region of the Loess Plateau, reaching 4–5 mm d−1, which is corroborated by similar observations from Ding et al. (2012). The consistency across these studies, despite differences in methodologies and study areas, suggests that our approach captures the spatial variability of evaporation rates within the Loess Plateau, likely reflecting regional differences in climate and surface water coverage.
To further solidify the estimated evaporation loss, we delved into an analysis of evaporation volume. Direct validation at a regional scale remains challenging due to the scarcity of evaporation volume data for water bodies across the Loess Plateau. Nevertheless, a localized comparison offers valuable insight. In the region upstream of Huayuankou on the Yellow River, our estimated daily evaporation loss (4.16 × 10⁶ m3 d−1) closely matches the value of 4.14 × 10⁶ m3 d−1 reported by Zhang et al. (2014).This close agreement not only supports the accuracy of our methodology but also underscores its potential for broader application in regional hydrological studies.
4.2 Evaporation variability and its drivers
This study presented the spatiotemporal variations in water body evaporation across the Loess Plateau. Our findings unveil a distinct spatial pattern, with evaporation rates consistently higher in the northwestern region compared to the southeastern part. This spatial distribution aligns closely with the regional climate gradient (Fig. 7), suggesting a strong influence of climatic conditions on evaporation dynamics. The relatively higher evaporation rates in the northwest can be attributed to stronger surface shortwave radiation, lower humidity, and potentially higher wind speeds, all of which favor enhanced evaporation. When examining temporal trends over the past two decades, our results indicate a subtle yet non-significant decreasing trend in water body evaporation rates across the Loess Plateau. This trend is primarily driven by changes in key climatic factors. Specifically, while Ta and U have shown an increasing trend (Fig. 9), which typically enhances evaporation, these effects have been counterbalanced by concurrent increases in air humidity and decreases in solar radiation. The combined impact of these changes has led to a net, albeit modest, decrease in evaporation rates. This contrasts sharply with the observed increase in non-aquatic terrestrial evaporation over the Loess Plateau, which has been primarily attributed to increased precipitation and vegetation greening (enhancing transpiration and soil evaporation) (Jiang et al., 2022; Jin et al., 2017; Shao et al., 2019; Zhou et al., 2022). Open water evaporation, unlike non-aquatic terrestrial evaporation, is largely insensitive to direct precipitation inputs (over the water surface) and vegetation changes on surrounding land, explaining their divergent regional trends.
As to the evaporation volume, this study unveils a significant increase over the Loess Plateau during the past two decades, with an ascending rate of 0.117 × 10⁶ m3 d−1 yr−1. Furthermore, there is a distinct seasonal pattern in the evaporation volume, with peaks occurring in May and October. This observed upward trend in total water evaporation is primarily attributed to the expansion of water bodies within the study area, given that a larger surface water area inherently results in greater open-water evaporation losses. This expansion is a direct consequence of the escalating human demand for water across various sectors, including agriculture, industry, domestic use, and ecological preservation (Liu et al., 2023). To meet these burgeoning needs, numerous reservoirs and dams have been constructed, leading to an enlargement of surface water. Additionally, numerous small check dams have been built, mainly for the purpose of reducing sediment load in river channels. These anthropogenic interventions collectively facilitate increased water evaporation losses.
Our attribution analysis reveals a critical distinction between the drivers of evaporation rate and total evaporation volume. The trend in the evaporation rate is governed by a net balance of competing meteorological factors. Among these, variations in SSR and U emerge as the dominant drivers of the rate's spatial and temporal trends, with the slight regional decrease in rate resulting from the offsetting effects of increased humidity and decreased radiation against warming temperatures and higher wind speeds. In contrast, the significant increasing trend in total evaporation volume is overwhelmingly dominated by the expansion of surface water area, which contributes over 100 % to the observed trend and completely masks the modest, negative influence from meteorological drivers. This mechanism explains the paradox of rising total water loss despite a stable or slightly decreasing evaporation rate. Our results further demonstrate that the contribution from area change is far more influential than the contribution from rate change. It is important to note that a negative contribution implies the factor acts as an offsetting agent. For instance, in parts of the southern region, although decreasing solar radiation exerts a negative influence (suppressing evaporation), the significant expansion of water surface area acts as the dominant positive driver (Fig. 12b), overcoming the radiation deficit to maintain an overall increasing trend in evaporation volume. Conversely, the Northwest exhibits a different meteorological pattern. In parts of this region, SSR has actually increased, acting as a key driver to slightly enhance the local evaporation rate. However, as this area also experienced a significant reduction in surface water area, the effect of the decreasing area ultimately overtook the slight increase in the evaporation rate, leading to a net decline in local evaporation volume. Therefore, this interplay highlights that anthropogenic activities, primarily the construction of reservoirs and check dams that expand the water surface, are the ultimate drivers of increased evaporative water loss on the Loess Plateau.
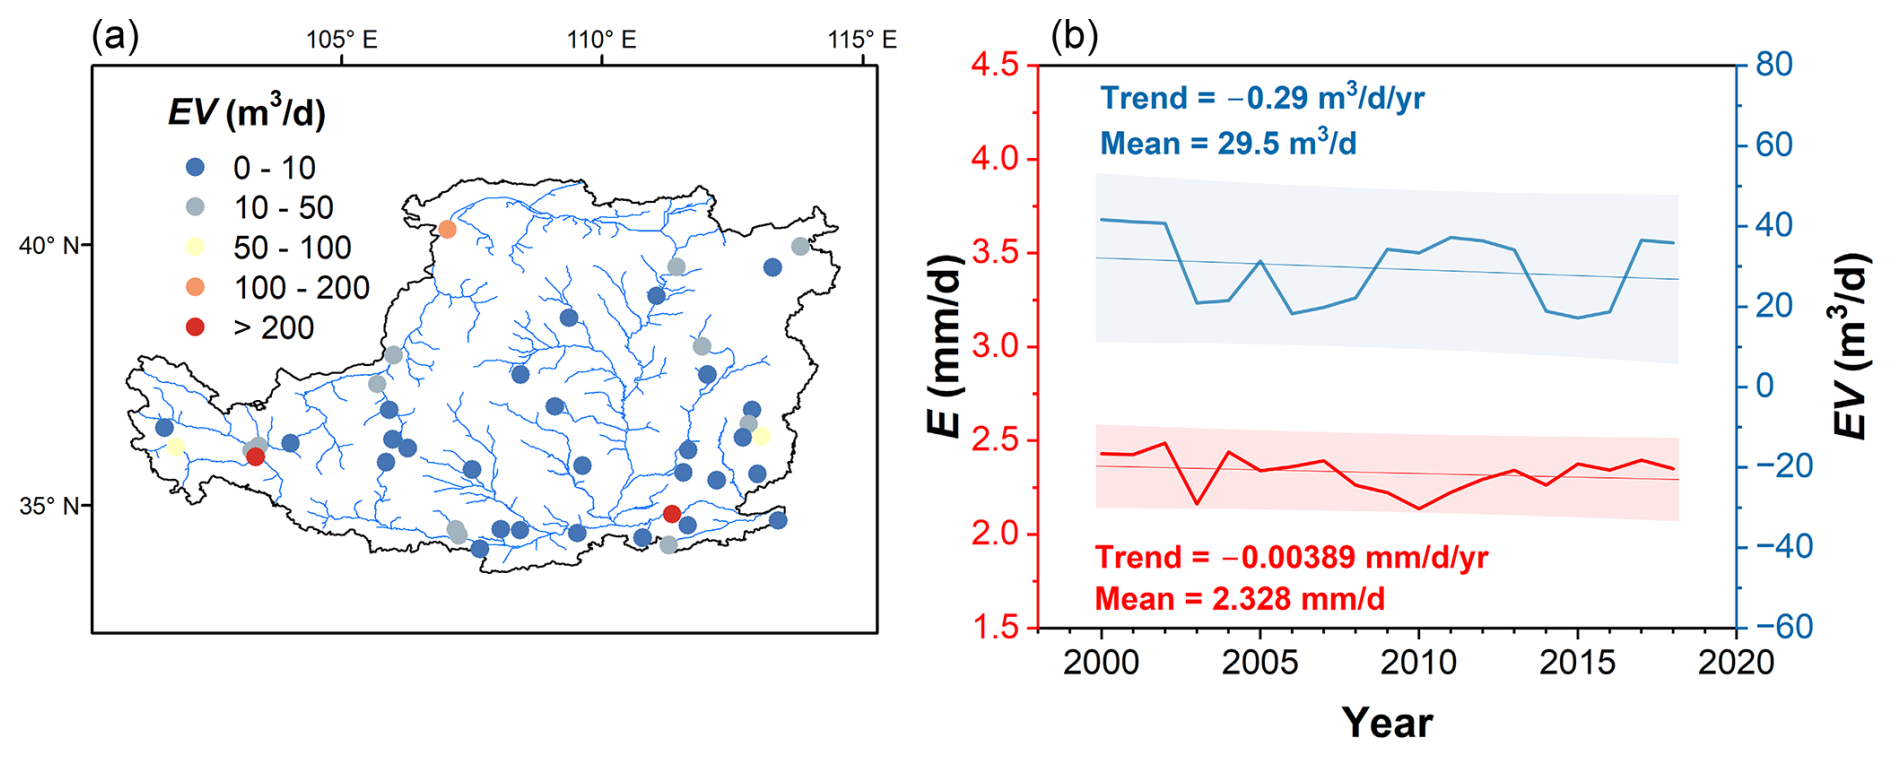
Figure 13Evaporation in 48 large reservoirs in Loess Plateau: (a) The spatial distribution of the reservoirs and their average evaporation volume. (b) E and EV of the reservoirs for the period of 2000 to 2018. The shaded area represents 95 % prediction bands.
While previous studies have contributed to our understanding of water evaporation, they have primarily focused on large reservoirs or lakes (Guseva et al., 2023; Li et al., 2024; Zhao et al., 2023). In contrast, our study encompasses a comprehensive analysis of all water bodies, including various small-scale reservoirs and check dams, as well as large reservoirs/lakes in the Loess Plateau region. We noticed contrasting evaporation volume in large and small water bodies. For the 48 large reservoirs documented in the GRanD database (Lehner et al., 2011), we calculated their evaporation rates and volumes using the same modified Penman model and dynamic surface water area data. The average evaporation rate for the 48 large reservoirs shows a slight decline between 2000 and 2018 (Fig. 13), accompanied by a decrease in the total evaporation volume (−0.29 m3 d−1 yr−1). This trend of the evaporation rate for the large reservoirs roughly aligns with the average evaporation rate over the Loess Plateau (Fig. 7), but contrasts with the increasing total evaporation volume observed across the entire region (Fig. 8). This discrepancy suggests that small- and medium-sized water bodies significantly contribute to the overall evaporation loss on the Loess Plateau. The contrasting trends between large reservoirs and the broader Loess Plateau highlight the complexity of evaporation dynamics in different water body types and scales.
4.3 Implications and limitations
Our study, which employs a modified Penman equation that incorporates dynamic water depth and surface areas, represents a significant advancement in accurately estimating evaporation rates and volumes for open water bodies. This methodological refinement underscores that ignoring the dynamics of water bodies, especially those of small to medium size, leads to substantial uncertainties in evaporation assessments that can propagate to regional water balance calculations (Dawidek and Ferencz, 2014; Stan et al., 2016).
An interesting finding from our research is the paradoxical trend of decreasing evaporation rates yet increasing total evaporation volumes on the Loess Plateau. This finding has profound implications for water resource planning and management in the region. The extensive construction of various reservoirs globally over the past few decades aimed at augmenting local water supplies for agricultural irrigation, industrial, or domestic purposes (Baldassarre et al., 2018; Oki and Kanae, 2006). However, the development of the water conservancy projects has potential of exacerbating evaporation losses – a factor that has largely been overlooked in resource planning. By comparing water evaporation volumes with surface water withdrawal by residents in the Loess Plateau (Fig. 14), we reveal a striking similarity: the total evaporation loss is comparable in magnitude to the average annual surface water withdrawal (approximately 1.55 × 10⁹ m3 yr−1). The ratio of evaporation loss to the withdrawal has escalated from 80 % in 2000 to 130 % in 2017, highlighting considerable evaporation loss and a significant threat to water security in the region. Therefore, future water project planning needs to incorporate evaporation losses to mitigate potential water resource risks.
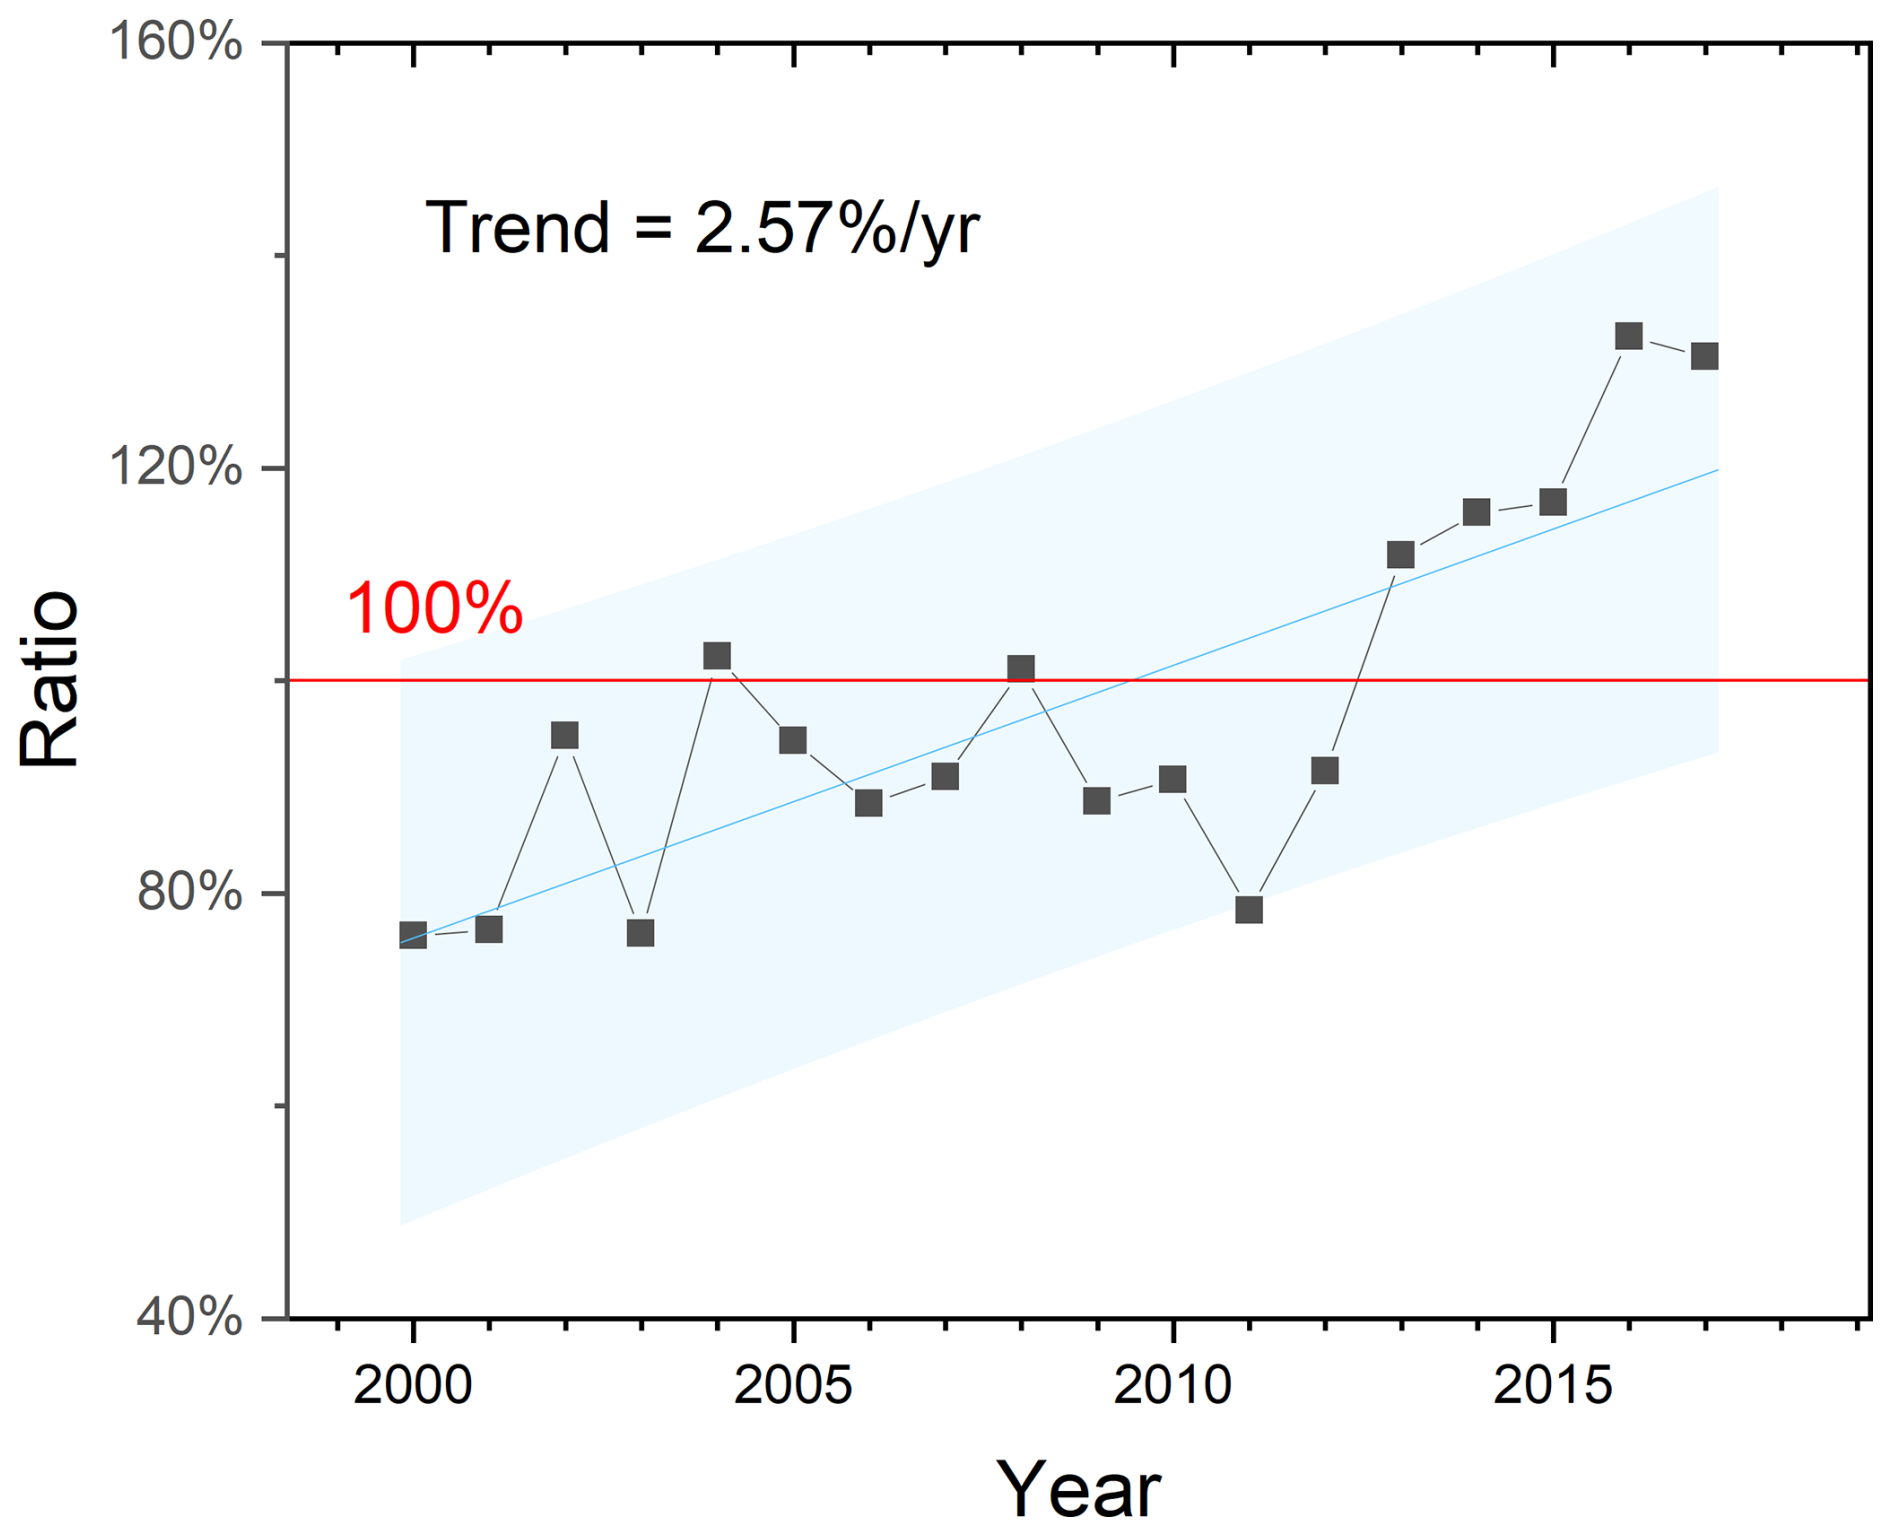
Figure 14The ratio of surface water evaporation volume to annual average water withdrawal by residents on the Loess Plateau from 2000 to 2017.
Previous studies generally focus on large reservoirs or lakes to monitor and investigate their water budgets (Tian et al., 2021, 2022). This may have inadvertently underestimated the contribution of smaller water bodies to overall evaporation as evidenced in this study. These smaller entities are often more sensitive to local climatic and anthropogenic impacts, necessitating a more granular analysis in future research. To comprehensively understand and manage water resources, it is imperative to extend monitoring and modeling efforts to small- and medium-sized water bodies, given their pivotal role in the regional evaporation budget as highlighted in this study.
Therefore, future water management policies and hydraulic engineering must address this scale mismatch. We recommend optimizing the design of new water storage to minimize the surface-area-to-volume ratio, thereby reducing evaporation. Furthermore, it is crucial to prioritize and invest in alternative strategies, such as managed aquifer recharge and evaporation suppression technologies like floating solar panels, particularly for existing smaller, critical reservoirs where relative water loss is highest. This integrated approach is essential for developing a more comprehensive and sustainable regional water budget.
Despite the insights from the methods and findings in our study, several limitations merit acknowledgment. One notable limitation of our study pertains to the reliance on the JRC-GSW water body data for calculating water depth and surface area. It is important to highlight that the JRC-GSW data exhibit seasonal gaps (Liu et al., 2023; Pekel et al., 2016), which could introduce uncertainties into our calculations of water depth, as well as subsequent estimations of evaporation rates and volumes. Since no gap-filling was applied, evaporation was not estimated for periods with missing data. These data absences might reflect variations in water levels and extents that are not captured by our methodology, potentially leading to a conservative estimation of the total evaporation volume. Future research could benefit from incorporating additional data sources or employing advanced remote sensing techniques to validate and complement the JRC-GSW dataset, ensuring a more robust representation of water body dynamics across different seasons.
Another limitation concerns the evaluation of water body evaporation, which was assessed using evaporation pan data collected near the reservoir. Although this approach provided a practical strategy for validation, inherent uncertainties exist. First, fundamental physical discrepancies exist between the validation instruments and the target water bodies. Evaporation pans lack the substantial heat storage capacity of deep reservoirs, leading to distinct energy exchange dynamics in evaporation response. Second, the method used to adjust pan data has limitations. Although adjustments were made to align pan measurements with actual water evaporation conditions, a certain level of uncertainty persists in this extrapolation. These validation uncertainties are further complicated by observed performance differences between large and small pans. Specifically, our model results tend to be higher than the adjusted small pan observations during peak periods (Fig. 3), while occasionally underestimating compared to big pan observations in earlier years (Fig. 4). These discrepancies likely stem from uncertainties in the meteorological forcing data used to drive the model.
While the model relies on the gridded CMFD dataset which represents regional climatic patterns, the evaporation pans capture localized micro-climatic conditions. This mismatch in meteorological inputs explains not only the magnitude differences during peaks but also the divergence in inter-annual trends observed at specific sites (e.g., BP2), where the regional forcing data may exhibit different long-term trends compared to the local station observations. To mitigate this limitation and enhance the accuracy of evaporation estimates, future studies should prioritize the deployment of more comprehensive observational networks. This could include installing eddy covariance systems at multiple reservoir levels or employing floating evaporation pans directly on water surfaces to capture more representative evaporation rates. Such methodologies would not only reduce the inherent uncertainties associated with current measurement techniques but also provide better spatial representativeness and higher temporal resolution of evaporation processes, ultimately leading to more accurate and reliable model outputs. Furthermore, our analysis period (2000–2018) was originally constrained by the availability of the CMFD dataset at the time of our study. Extending the temporal scope to the near-present would significantly enhance the relevance and insight of the trend analysis.
This study improved the heat storage estimation of the Penman model by integrating remote sensing-derived dynamic surface water and topographic information. This model enables the estimation of open water evaporation at regional scale, particularly for the areas where direct water depth observations are unavailable. The improved methodology, validated against adjusted pan evaporation measurements, demonstrated a robust performance with a coefficient of determination exceeding 0.7 and MABs below 20 mm per month, highlighting its efficacy in simulating evaporation dynamics.
Our findings reveal that the average evaporation rate in the Loess Plateau is about 2.98 mm d−1 over the past two decades, with peak values occurring in July and August, albeit showing a slight decreasing trend. However, the total evaporation loss during 2000–2018 stands at 4.16 × 10⁶ m3 d−1, exhibiting a rapid increase at a rate of 0.117 × 10⁶ m3 d−1 yr−1, with seasonal peaks in May and October. Although variations in wind speed and solar radiation are the key determinants of evaporation rate dynamics, the alteration in surface water area constitutes the dominant factor controlling total evaporation volume. Particularly, the proliferation of small- to medium-sized reservoirs and check dams on the Loess Plateau has significantly amplified evaporation losses, which are roughly equivalent to the annual surface water withdrawal in the region.
These findings underscore the importance of considering the dynamic aspects of surface water area and depth in assessing the thermal storage capacity of water bodies for accurate evaporation estimation. The key insights on the cumulative impact of small water bodies and the necessity of depth-aware modeling can be extended to other arid and semi-arid regions facing similar water management challenges. Enhanced monitoring and estimation of evaporation losses, particularly from the cumulative impact of small- to medium-sized reservoirs, are crucial to bolster water security and achieve sustainable water resource management in regions like the Loess Plateau, especially in the context of ongoing climate variability and increasing anthropogenic pressures on water systems.
The datasets utilized in this study are publicly available from their respective official sources: The Joint Research Center's Global Surface Water dataset (JRC-GSW) can be accessed through Google Earth Engine (GEE) platform (Pekel et al., 2016). The China Meteorological Forcing Dataset (CMFD) was obtained from the National Tibetan Plateau Data Center (https://doi.org/10.11888/AtmosphericPhysics.tpe.249369.file, Yang et al., 2019b). ERA5 monthly data were downloaded from the Copernicus Climate Data Store (https://doi.org/10.24381/cds.f17050d7, Hersbach et al., 2023). The Advanced Spaceborne Thermal Emission and Reflection Radiometer Global Digital Elevation Model (ASTER GDEM) version 3 data were acquired from NASA's Land Processes Distributed Active Archive Center (https://doi.org/10.5067/ASTER/ASTGTM.003, NASA/METI/AIST/Japan Spacesystems and U.S./Japan ASTER Science Team, 2019). Evaporation pan observation station records were provided by the China Meteorological Administration (http://data.cma.cn/, last access: 26 January 2023). The data generated in this study (evaporation rate and evaporation volume) can be accessed in a Zenodo repository (https://doi.org/10.5281/zenodo.14963640, Liu, 2025).
X.X. and Y.L. designed the study. Y.L. carried out data processing and computation. Y.L. and X.X. led interpretation of the results and writing of the manuscript. Y.W., A.T., D.P., X.W., and B.X. contributed to the discussion.
The contact author has declared that none of the authors has any competing interests.
Publisher's note: Copernicus Publications remains neutral with regard to jurisdictional claims made in the text, published maps, institutional affiliations, or any other geographical representation in this paper. The authors bear the ultimate responsibility for providing appropriate place names. Views expressed in the text are those of the authors and do not necessarily reflect the views of the publisher.
This study is supported by grants from the National Key Research and Development Program of China (2024YFF1306302) and the National Natural Science Foundation of China (No. 42271021).
This paper was edited by Alexander Gruber and reviewed by two anonymous referees.
Bai, M., Mo, X., Liu, S., and Hu, S.: Contributions of climate change and vegetation greening to evapotranspiration trend in a typical hilly-gully basin on the Loess Plateau, China, Sci. Total Environ., 657, 325–339, https://doi.org/10.1016/j.scitotenv.2018.11.360, 2019.
Bai, P., Cai, C., Liu, X., Wei, T., and Liu, L.: Estimation of Evaporation Losses from Reservoirs in the Upper Yellow River, J. China Hydrol., 43, 86–90 + 110, https://doi.org/10.19797/j.cnki.1000-0852.20220332, 2023.
Baldassarre, G. Di, Wanders, N., Aghakouchak, A., Kuil, L., Rangecroft, S., Veldkamp, T. I. E., Garcia, M., Oel, P. R. Van, Breinl, K., and Van Loon, A. F.: Water shortages worsened by reservoir effects, Nat. Sustain., 1, 617–622, https://doi.org/10.1038/s41893-018-0159-0, 2018.
China Meteorological Administration (CMA): China Meteorological Data Service Center, https://data.cma.cn, last access: 26 January 2023.
De Bruin, H. A. R.: Temperature and energy balance of a water reservoir determined from standard weather data of a land station, J. Hydrol., 59, 261–274, https://doi.org/10.1016/0022-1694(82)90091-9, 1982.
Dawidek, J. and Ferencz, B.: Water balance of selected floodplain lake basins in the Middle Bug River valley, Hydrol. Earth Syst. Sci., 18, 1457–1465, https://doi.org/10.5194/hess-18-1457-2014, 2014.
Deng, H., Tang, Q., Yun, X., Tang, Y., Liu, X., Xu, X., Sun, S., Zhao, G., Zhang, Y., and Zhang, Y.: Wetting trend in Northwest China reversed by warmer temperature and drier air, J. Hydrol., 613, 128435, https://doi.org/10.1016/j.jhydrol.2022.128435, 2022.
Ding, L., Liu, T., Zhang, H., Li, C., and Tong, X.: Analysis of Water Evaporation of Inner Mongolia Section of the Yellow River, Yellow River, 34, 38–40, 2012 (in Chinese).
Duan, Z., Afzal, M. M., Liu, X., Chen, S., Du, R., Zhao, B., Yuan, W., and Awais, M.: Effects of climate change and human activities on environment and area variations of the Aral Sea in Central Asia, Int. J. Environ. Sci. Technol., 21, 1715–1728, https://doi.org/10.1007/s13762-023-05072-8, 2024.
Edinger, J. E., Duttweiler, D. W., and Geyer, J. C.: The Response of Water Temperatures to Meteorological Conditions, Water Resour. Res., 4, 1137–1143, https://doi.org/10.1029/WR004i005p01137, 1968.
Fairall, C. W., Bradley, E. F., Rogers, D. P., Edson, J. B., and Young, G. S.: Bulk parameterization of air-sea fluxes for tropical oceanglobal atmosphere coupled-ocean atmosphere response experiment, J. Geophys. Res. Ocean., 101, 3747–3764, https://doi.org/10.1029/95JC03205, 1996.
Friedrich, K., Grossman, R. L., Huntington, J., Blanken, P. D., Lenters, J., Holman, K. L. D., Gochis, D., Livneh, B., Prairie, J., Skeie, E., Healey, N. C., Dahm, K., Pearson, C., Finnessey, T., Hook, S. J., and KowaLsKi, T.: Reservoir evaporation in the Western United States, Bull. Am. Meteorol. Soc., 99, 167–187, https://doi.org/10.1175/BAMS-D-15-00224.1, 2018.
Fu, B., Wang, S., Liu, Y., Liu, J., Liang, W., and Miao, C.: Hydrogeomorphic Ecosystem Responses to Natural and Anthropogenic Changes in the Loess Plateau of China, Annu. Rev. Earth Planet. Sci., 45, 223–243, https://doi.org/10.1146/annurev-earth-063016-020552, 2017.
Fuentes, I., van Ogtrop, F., and Vervoort, R. W.: Long-term surface water trends and relationship with open water evaporation losses in the Namoi catchment, Australia, J. Hydrol., 584, 124714, https://doi.org/10.1016/j.jhydrol.2020.124714, 2020.
Guan, X. and Mascaro, G.: Impacts of climate change on the food-water nexus in central Arizona, Agric. For. Meteorol., 333, 109413, https://doi.org/10.1016/j.agrformet.2023.109413, 2023.
Guo, Y., Zhang, Y., Ma, N., Xu, J., and Zhang, T.: Long-term changes in evaporation over Siling Co Lake on the Tibetan Plateau and its impact on recent rapid lake expansion, Atmos. Res., 216, 141–150, https://doi.org/10.1016/j.atmosres.2018.10.006, 2019.
Guseva, S., Armani, F., Desai, A. R., Dias, N. L., Friborg, T., Iwata, H., Jansen, J., Lükő, G., Mammarella, I., Repina, I., Rutgersson, A., Sachs, T., Scholz, K., Spank, U., Stepanenko, V., Torma, P., Vesala, T., and Lorke, A.: Bulk Transfer Coefficients Estimated From Eddy-Covariance Measurements Over Lakes and Reservoirs, J. Geophys. Res. Atmos., 128, https://doi.org/10.1029/2022JD037219, 2023.
He, J., Yang, K., Tang, W., Lu, H., Qin, J., Chen, Y., and Li, X.: The first high-resolution meteorological forcing dataset for land process studies over China, Sci. Data, 7, 1–11, https://doi.org/10.1038/s41597-020-0369-y, 2020.
Hersbach, H., Bell, B., Berrisford, P., Hirahara, S., Horányi, A., Muñoz-Sabater, J., Nicolas, J., Peubey, C., Radu, R., Schepers, D., Simmons, A., Soci, C., Abdalla, S., Abellan, X., Balsamo, G., Bechtold, P., Biavati, G., Bidlot, J., Bonavita, M., De Chiara, G., Dahlgren, P., Dee, D., Diamantakis, M., Dragani, R., Flemming, J., Forbes, R., Fuentes, M., Geer, A., Haimberger, L., Healy, S., Hogan, R. J., Hólm, E., Janisková, M., Keeley, S., Laloyaux, P., Lopez, P., Lupu, C., Radnoti, G., de Rosnay, P., Rozum, I., Vamborg, F., Villaume, S., and Thépaut, J. N.: The ERA5 global reanalysis, Q. J. R. Meteorol. Soc., 146, 1999–2049, https://doi.org/10.1002/qj.3803, 2020.
Hersbach, H., Bell, B., Berrisford, P., Biavati, G., Horányi, A., Muñoz Sabater, J., Nicolas, J., Peubey, C., Radu, R., Rozum, I., Schepers, D., Simmons, A., Soci, C., Dee, D., and Thépaut, J.-N.: ERA5 monthly averaged data on single levels from 1940 to present, Copernicus Climate Change Service (C3S) Climate Data Store (CDS) [data set], https://doi.org/10.24381/cds.f17050d7, 2023.
Hollinger, D. Y. and Richardson, A. D.: Uncertainty in eddy covariance measurements and its application to physiological models, Tree Physiol., 25, 873–885, https://doi.org/10.1093/treephys/25.7.873, 2005.
Jensen, M. E.: Estimating evaporation from water surfaces, in: CSU/ARS Evapotranspiration Workshop, Fort Collins, CO, 1–27, https://www.researchgate.net/publication/265749992_Estimating_evaporation_from_water_surfaces (last access: 23 December 2025), 2010.
Jian, S., Zhao, C., Fang, S., and Yu, K.: Effects of different vegetation restoration on soil water storage and water balance in the Chinese Loess Plateau, Agric. For. Meteorol., 206, 85–96, https://doi.org/10.1016/j.agrformet.2015.03.009, 2015.
Jiang, C., Zhang, H., Wang, X., Feng, Y., and Labzovskii, L.: Challenging the land degradation in China's Loess Plateau: Benefits, limitations, sustainability, and adaptive strategies of soil and water conservation, Ecol. Eng., 127, 135–150, https://doi.org/10.1016/j.ecoleng.2018.11.018, 2019.
Jiang, F., Xie, X., Liang, S., Wang, Y., Zhu, B., Zhang, X., and Chen, Y.: Loess Plateau evapotranspiration intensified by land surface radiative forcing associated with ecological restoration, Agric. For. Meteorol., 311, 108669, https://doi.org/10.1016/j.agrformet.2021.108669, 2021.
Jiang, F., Xie, X., Wang, Y., Liang, S., Zhu, B., Meng, S., Zhang, X., Chen, Y., and Liu, Y.: Vegetation greening intensified transpiration but constrained soil evaporation on the Loess Plateau, J. Hydrol., 614, 128514, https://doi.org/10.1016/j.jhydrol.2022.128514, 2022.
Jin, Z., Liang, W., Yang, Y., Zhang, W., Yan, J., Chen, X., Li, S., and Mo, X.: Separating Vegetation Greening and Climate Change Controls on Evapotranspiration trend over the Loess Plateau, Sci. Rep., 7, 1–15, https://doi.org/10.1038/s41598-017-08477-x, 2017.
Lehner, B., Liermann, C. R., Revenga, C., Vörömsmarty, C., Fekete, B., Crouzet, P., Döll, P., Endejan, M., Frenken, K., Magome, J., Nilsson, C., Robertson, J. C., Rödel, R., Sindorf, N., and Wisser, D.: High-resolution mapping of the world's reservoirs and dams for sustainable river-flow management, Front. Ecol. Environ., 9, 494–502, https://doi.org/10.1890/100125, 2011.
Lei, N., Zhou, Z., Zhuang, Q., Chen, W., Chalov, S., Liu, S., Gao, L., and Dong, G.: Performance Evaluation and Improvement of CMFD's Precipitation Products Over Shanghai City, China, Earth Sp. Sci., 10, https://doi.org/10.1029/2022EA002690, 2023.
Li, Q., Luo, Z., Zhong, B., and Zhou, H.: An improved approach for evapotranspiration estimation usingwater balance equation: Case study of Yangtze River Basin, Water (Switzerland), 10, 1–21, https://doi.org/10.3390/w10060812, 2018.
Li, Y., Gao, H., Zhao, G., and Tseng, K. H.: A high-resolution bathymetry dataset for global reservoirs using multi-source satellite imagery and altimetry, Remote Sens. Environ., 244, 111831, https://doi.org/10.1016/j.rse.2020.111831, 2020.
Li, Y., Zhao, G., Allen, G. H., and Gao, H.: Diminishing storage returns of reservoir construction, Nat. Commun., 14, https://doi.org/10.1038/s41467-023-38843-5, 2023.
Li, Y., Li, S., Cheng, L., Zhou, L., Chang, L., and Liu, P.: High Spatiotemporal Estimation of Reservoir Evaporation Water Loss by Integrating Remote-Sensing Data and the Generalized Complementary Relationship, Remote Sens., 16, https://doi.org/10.3390/rs16081320, 2024.
Li, Z., Liu, W. zhao, Zhang, X. chang, and Zheng, F. li: Impacts of land use change and climate variability on hydrology in an agricultural catchment on the Loess Plateau of China, J. Hydrol., 377, 35–42, https://doi.org/10.1016/j.jhydrol.2009.08.007, 2009.
Liu, F., Li, X., Shi, F., Yang, Y., Liu, M., and Cao, G.: Stable isotopes reveal soil evaporation and its controlling factors in the Heihe River source area on the northeastern Qinghai-Tibetan Plateau, J. Hydrol. Reg. Stud., 54, 101901, https://doi.org/10.1016/j.ejrh.2024.101901, 2024.
Liu, H., Zhang, Q., and Dowler, G.: Environmental controls on the surface energy budget over a large Southern Inland water in the united states: An analysis of one-year eddy covariance flux data, J. Hydrometeorol., 13, 1893–1910, https://doi.org/10.1175/JHM-D-12-020.1, 2012.
Liu, K., Song, C., Wang, J., Ke, L., Zhu, Y., Zhu, J., Ma, R., and Luo, Z.: Remote Sensing-Based Modeling of the Bathymetry and Water Storage for Channel-Type Reservoirs Worldwide, Water Resour. Res., 56, 1–19, https://doi.org/10.1029/2020WR027147, 2020.
Liu, Y.: Land surface water evaporation during 2000–2018 on the Loess Plateau, Zenodo [data set], https://doi.org/10.5281/zenodo.14963640, 2025.
Liu, Y., Xie, X., Tursun, A., Wang, Y., Jiang, F., and Zheng, B.: Surface water expansion due to increasing water demand on the Loess Plateau, J. Hydrol. Reg. Stud., 49, 101485, https://doi.org/10.1016/j.ejrh.2023.101485, 2023.
Ma, H., Cui, C., Li, H., Guo, C., and Fan, J.: Analysis on Variation Characteristics of Pan Evaporation in Recent 34 Years in the Loess Plateau (in Chinese), J. Anhui Agric. Sci., 41, 4506–4509, 2013.
Mao, Y., Nijssen, B., and Lettenmaier, D. P.: Is climate change implicated in the 2013-2014 California drought? A hydrologic perspective, Geophys. Res. Lett., 42, 2805–2813, https://doi.org/10.1002/2015GL063456, 2015.
Mcjannet, D. L., Webster, I. T., and Cook, F. J.: Environmental Modelling & Software An area-dependent wind function for estimating open water evaporation using land-based meteorological data, Environ. Model. Softw., 31, 76–83, https://doi.org/10.1016/j.envsoft.2011.11.017, 2012.
McJannet, D. L., Webster, I. T., Stenson, M. P., and Sherman, B. S.: Estimating open water evaporation for the Murray-Darling Basin: A report to the Australian Government from the CSIRO Murray-Darling Basin Sustainable Yields Project, A Rep. to Aust. Gov. from CSIRO Murray-Darling Basin Sustain. Yields Proj., 50, https://calisphere.org/item/ark:/86086/n28051s2 (last access: 23 December 2025), 2008.
McMahon, T. A., Peel, M. C., Lowe, L., Srikanthan, R., and McVicar, T. R.: Estimating actual, potential, reference crop and pan evaporation using standard meteorological data: a pragmatic synthesis, Hydrol. Earth Syst. Sci., 17, 1331–1363, https://doi.org/10.5194/hess-17-1331-2013, 2013.
Micklin, P.: The past, present, and future Aral Sea, Lakes Reserv. Sci. Policy Manag. Sustain. Use, 15, 193–213, https://doi.org/10.1111/j.1440-1770.2010.00437.x, 2010.
Milly, P. C. D. and Dunne, K. A.: Colorado River flow dwindles as warming-driven loss of reflective snow energizes evaporation, Science, 367, 1252–1255, https://doi.org/10.1126/science.aax0194, 2020.
NASA/METI/AIST/Japan Spacesystems and U.S./Japan ASTER Science Team: ASTER Global Digital Elevation Model V003, distributed by NASA EOSDIS Land Processes DAAC [data set], https://doi.org/10.5067/ASTER/ASTGTM.003, 2019.
Nehorai, R., Lensky, N., Brenner, S., and Lensky, I.: The dynamics of the skin temperature of the dead sea, Adv. Meteorol., https://doi.org/10.1155/2013/296714, 2013.
Oki, T. and Kanae, S.: Global hydrological cycles and world water resources, Science, 313, 1068–1072, https://doi.org/10.1126/science.1128845, 2006.
Panin, G. N., Nasonov, A. E., Foken, T., and Lohse, H.: On the parameterisation of evaporation and sensible heat exchange for shallow lakes, Theor. Appl. Climatol., 85, 123–129, https://doi.org/10.1007/s00704-005-0185-5, 2006.
Pekel, J. F., Cottam, A., Gorelick, N., and Belward, A. S.: High-resolution mapping of global surface water and its long-term changes, Nature, 540, 418–422, https://doi.org/10.1038/nature20584, 2016.
Peng, D., Xie, X., Liang, S., Wang, Y., Tursun, A., Liu, Y., Jia, K., Ma, H., and Chen, Y.: Improving evapotranspiration partitioning by integrating satellite vegetation parameters into a land surface model, J. Hydrol., 643, 131928, https://doi.org/10.1016/j.jhydrol.2024.131928, 2024.
Penman, H. L.: Natural evaporation from open water, bare soil and grass, Proc. R. Soc. London. Ser. A. Math. Phys. Sci., 193, 120–145, https://doi.org/10.1098/rspa.1948.0037, 1948.
Ren, G. Y. and Guo, J.: Change in pan evaporation and the influential factors over China: 1956–2000, J. Nat. Resour., 21, 31–44, 2006.
Rotstayn, L. D., Roderick, M. L., and Farquhar, G. D.: A simple pan-evaporation model for analysis of climate simulations: Evaluation over Australia, Geophys. Res. Lett., 33, 1–5, https://doi.org/10.1029/2006GL027114, 2006.
Schladow, S. G.: Tahoe: State of the Lake Report, Report of the UC Davis Tahoe Environmental Research Center, https://tahoe.ucdavis.edu/sites/g/files/dgvnsk4286/files/inline-files/SOTL_2013_Complete_0.pdf (last access: 23 December 2025), 2013.
Shao, R., Zhang, B., Su, T., Long, B., Cheng, L., Xue, Y., and Yang, W.: Estimating the Increase in Regional Evaporative Water Consumption as a Result of Vegetation Restoration Over the Loess Plateau, China, J. Geophys. Res. Atmos., 124, 11783–11802, https://doi.org/10.1029/2019JD031295, 2019.
Sheng, Q., Shen, S. H., and Gu, Z.: Conversion coefficient between small evaporation pan and theoretically calculated water surface evaporation in China, J. Nanjing Inst. Meteorol., 30, 561–565, 2007.
Shi, C., Niu, K., Chen, T., and Zhu, X.: The study of pan coefficients of evaporation pans of water, Sci. Geogr. Sin., 6, 305–313, http://geoscien.neigae.ac.cn/CN/10.13249/j.cnki.sgs.1986.04.305, 1986.
Stan, F., Neculau, G., Zaharia, L., and Ioana-, G.: Study on the evaporation and evapotranspiration measured on the C ă ld ă ru ş ani Lake (Romania), Procedia Environ. Sci., 32, 281–289, https://doi.org/10.1016/j.proenv.2016.03.033, 2016.
Sun, Q., Miao, C., Duan, Q., and Wang, Y.: Temperature and precipitation changes over the Loess Plateau between 1961 and 2011, based on high-density gauge observations, Glob. Planet. Change, 132, 1–10, https://doi.org/10.1016/j.gloplacha.2015.05.011, 2015.
Tan, Q., Xu, Z., Zoha, Y., Liu, J., Ban, C., Liu, X., and Wang, J.: Applicability of China meteorological forcing dataset to the Nianchu River basin, J. Beijing Norm. Univ. Sci., 57, 372–379, https://doi.org/10.12202/j.0476-0301.2020261, 2021.
Tanny, J., Cohen, S., Assouline, S., Lange, F., Grava, A., Berger, D., Teltch, B., and Parlange, M. B.: Evaporation from a small water reservoir: Direct measurements and estimates, J. Hydrol., 351, 218–229, https://doi.org/10.1016/j.jhydrol.2007.12.012, 2008.
Tian, W., Liu, X., Wang, K., Bai, P., Liu, C., and Liang, X.: Estimation of reservoir evaporation losses for China, J. Hydrol., 607, https://doi.org/10.1016/j.jhydrol.2021.126142, 2021.
Tian, W., Liu, X., Wang, K., Bai, P., Liu, C., and Liang, X.: Estimation of global reservoir evaporation losses, J. Hydrol., 607, 127524, https://doi.org/10.1016/j.jhydrol.2022.127524, 2022.
Tian, J., Cui, Q., and Xu, J.: Surface-evaporation of large and middle reservoirs affects the cunount of water resource in the Yellow River valley, Journal-Shandong Agric. Univ., 36, 391, https://doi.org/10.3969/j.issn.1000-2324.2005.03.016, 2005.
Vishwakarma, D. K., Pandey, K., Kaur, A., Kushwaha, N. L., Kumar, R., Ali, R., Elbeltagi, A., and Kuriqi, A.: Methods to estimate evapotranspiration in humid and subtropical climate conditions, Agric. Water Manag., 261, 107378, https://doi.org/10.1016/j.agwat.2021.107378, 2022.
Vystavna, Y., Harjung, A., Monteiro, L. R., Matiatos, I., and Wassenaar, L. I.: Stable isotopes in global lakes integrate catchment and climatic controls on evaporation, Nat. Commun., 12, 1–7, https://doi.org/10.1038/s41467-021-27569-x, 2021.
Wang, D., Wang, D., Mei, Y., Yang, Q., Ji, M., Li, Y., Liu, S., Li, B., Huang, Y., and Mo, C.: Estimates of the Land Surface Hydrology from the Community Land Model Version 5 (CLM5) with Three Meteorological Forcing Datasets over China, Remote Sens., 16, 1–30, https://doi.org/10.3390/rs16030550, 2024a.
Wang, G., Xue, B., Knauer, J., Helman, D., Tao, S., Luo, Y., Wang, J., A, Y., Wang, Y., Jin, H., Fang, Q., Wang, Q., and Xiao, J.: No widespread decline in canopy conductance under elevated atmospheric CO2, Agric. For. Meteorol., 371, 110649, https://doi.org/10.1016/j.agrformet.2025.110649, 2025.
Wang, J., Liu, H., and Shen, L.: An Observational and Modeling Study of Inverse-Temperature Layer and Water Surface Heat Flux, Geophys. Res. Lett., 50, 1–10, https://doi.org/10.1029/2023GL104358, 2023.
Wang, W., Lin, X., Alan Johnson, B., Shi, J., Kumar, P., Leong Tan, M., Gao, G., Min, X., Hu, G., and Zhang, F.: Remote sensing estimation of water storage in the channel-type reservoirs under unknown underwater topographic data, Int. J. Appl. Earth Obs. Geoinf., 130, 103933, https://doi.org/10.1016/j.jag.2024.103933, 2024b.
Wang, Z., Chen, Z., Yu, S., Zhang, Q., Wang, Y., and Hao, J.: Erosion-control mechanism of sediment check dams on the Loess Plateau, Int. J. Sediment Res., 36, 668–677, https://doi.org/10.1016/j.ijsrc.2021.02.002, 2021.
Woolway, R. I., Kraemer, B. M., Lenters, J. D., Merchant, C. J., O'Reilly, C. M., and Sharma, S.: Global lake responses to climate change, Nat. Rev. Earth Environ., 1, 388–403, https://doi.org/10.1038/s43017-020-0067-5, 2020.
Wossenu, A.: Evaporation Estimation for Lake Okeechobee in South Florida, J. Irrig. Drain. Eng., 127, 140–147, https://doi.org/10.1061/(ASCE)0733-9437(2001)127:3(140), 2001.
Wu, D., Xie, X., Tong, J., Meng, S., and Wang, Y.: Sensitivity of Vegetation Growth to Precipitation in a Typical Afforestation Area in the Loess Plateau: Plant-Water Coupled Modelling, Ecol. Modell., 430, 109128, https://doi.org/10.1016/j.ecolmodel.2020.109128, 2020.
Wu, J. and Li, Z.: Advances and prospect of research on water surface evaporation, J. Water Resour. Archit. Eng., 5, 46–50, 2007.
Xiao, J., Wang, L., Deng, L., and Jin, Z.: Characteristics, sources, water quality and health risk assessment of trace elements in river water and well water in the Chinese Loess Plateau, Sci. Total Environ., 650, 2004–2012, https://doi.org/10.1016/j.scitotenv.2018.09.322, 2019.
Xie, X., Liang, S., Yao, Y., Jia, K., Meng, S., and Li, J.: Detection and attribution of changes in hydrological cycle over the Three-North region of China: Climate change versus afforestation effect, Agric. For. Meteorol., 203, 74–87, https://doi.org/10.1016/j.agrformet.2015.01.003, 2015.
Yang, K., Yu, Z., Luo, Y., Zhou, X., and Shang, C.: Spatial-Temporal Variation of Lake Surface Water Temperature and Its Driving Factors in Yunnan-Guizhou Plateau, Water Resour. Res., 55, 4688–4703, https://doi.org/10.1029/2019WR025316, 2019a.
Yang, K., He, J., Tang, W., Lu, H., Qin, J., Chen, Y., and Li, X.: China meteorological forcing dataset v1.6 (1979–2018), National Tibetan Plateau/Third Pole Environment Data Center [data set], https://doi.org/10.11888/AtmosphericPhysics.tpe.249369.file, 2019b.
Zhang, G., Yao, T., Chen, W., Zheng, G., Shum, C. K., Yang, K., Piao, S., Sheng, Y., Yi, S., Li, J., O'Reilly, C. M., Qi, S., Shen, S. S. P., Zhang, H., and Jia, Y.: Regional differences of lake evolution across China during 1960s–2015 and its natural and anthropogenic causes, Remote Sens. Environ., 221, 386–404, https://doi.org/10.1016/j.rse.2018.11.038, 2019a.
Zhang, J., Ge, Y., Yuan, G., and Song, Z.: Consideration of high-quality development strategies for soil and water conservation on the loess plateau, Sci. Rep., 12, 1–13, https://doi.org/10.1038/s41598-022-12006-w, 2022.
Zhang, K., Xie, X., Zhu, B., Meng, S., and Yao, Y.: Unexpected groundwater recovery with decreasing agricultural irrigation in the Yellow River Basin, Agric. Water Manag., 213, 858–867, https://doi.org/10.1016/j.agwat.2018.12.009, 2019b.
Zhang, L., Sun, J., Tian, Y., Zhao, ru, Wang, C., and Guo, fei: Evaporation Loss of the Water Storage Projects in the Region Above Huayuankou of the Yellow River, Yellow River, 36, 95–96, 2014 (in Chinese).
Zhang, Y., Li, X., Chang, X., Jin, H., Huang, A., Liang, J., Cheng, G., and Wang, X.: Sensitivity of simulated frozen ground temperatures to different solar radiation and air temperature products–a case study in the Qilian Mountains in West China, Permafr. Periglac. Process., 34, 513–529, https://doi.org/10.1002/ppp.2187, 2023.
Zhang, Z., Tang, Q., Zhao, G., Gaffney, P. P. J., and Dubois, N.: Lake depth, a key parameter regulating evaporation in semi-arid regions: A case study from Dali Lake, China, Hydrol. Process., 38, https://doi.org/10.1002/hyp.15196, 2024.
Zhao, B., Kao, S. C., Zhao, G., Gangrade, S., Rastogi, D., Ashfaq, M., and Gao, H.: Evaluating Enhanced Reservoir Evaporation Losses From CMIP6-Based Future Projections in the Contiguous United States, Earth's Futur., 11, 1–19, https://doi.org/10.1029/2022EF002961, 2023.
Zhao, G. and Gao, H.: Estimating reservoir evaporation losses for the United States: Fusing remote sensing and modeling approaches, Remote Sens. Environ., 226, 109–124, https://doi.org/10.1016/j.rse.2019.03.015, 2019.
Zhao, G., Mu, X., Wen, Z., Wang, F., and Gao, P.: Soil erosion, conservation, and eco-environment changes in the loess plateau of china, L. Degrad. Dev., 24, 499–510, https://doi.org/10.1002/ldr.2246, 2013.
Zhao, G., Li, Y., Zhou, L., and Gao, H.: Evaporative water loss of 1.42 million global lakes, Nat. Commun., 13, 1–10, https://doi.org/10.1038/s41467-022-31125-6, 2022.
Zhou, F., Bo, Y., Ciais, P., Dumas, P., Tang, Q., Wang, X., Liu, J., Zheng, C., Polcher, J., Yin, Z., Guimberteau, M., Peng, S., Ottle, C., Zhao, X., Zhao, J., Tan, Q., Chen, L., Shen, H., Yang, H., Piao, S., Wang, H., and Wada, Y.: Deceleration of China's human water use and its key drivers, Proc. Natl. Acad. Sci. U. S. A., 117, 7702–7711, https://doi.org/10.1073/pnas.1909902117, 2020.
Zhou, J., Liu, Q., Liang, L., He, J., Yan, D., Wang, X., Sun, T., and Li, S.: More portion of precipitation into soil water storage to maintain higher evapotranspiration induced by revegetation on China's Loess Plateau, J. Hydrol., 615, 128707, https://doi.org/10.1016/j.jhydrol.2022.128707, 2022.