
the Creative Commons Attribution 4.0 License.
the Creative Commons Attribution 4.0 License.
 | 09 Oct 2026
The influence of lakes and reservoirs on estimated flood peaks at hourly vs. daily timescale in the Alps
Jonas Götte
Paul C. Astagneau
Manuela I. Brunner

Water bodies such as lakes and reservoirs can play a crucial role in reducing estimated flood peaks, at both daily and hourly time resolution. While the effect of water bodies on flood peaks has been demonstrated in the past at different time resolutions, it remains unclear how water bodies affect the ratio between estimated daily and hourly quantiles, that is, to which degree their attenuation effect is scale dependent. Here, we analyse how water bodies influence this ratio using two approaches: (1) by comparing estimated daily and hourly flood peak quantiles upstream and downstream of reservoirs of four local case studies, and (2) by comparing daily and hourly flood peak quantiles across a large sample of catchments in Switzerland with various degrees of water-body influence. Our results show that reservoirs dampen hourly peak discharge much more strongly than daily peak discharge, which leads to similar daily and hourly flood peaks downstream of reservoirs. Specifically, our case study analysis highlights that (sub-)hourly peak discharge is attenuated by up to 70 % downstream of reservoirs during flood events with a 10-year return period. We also find that the attenuation effect is particularly pronounced in catchments that are heavily influenced by water bodies, i.e. those catchments where more than 60 % of the area contributes to water body inflow. This implies that daily flood peaks are a good proxy for hourly peaks in strongly regulated catchments in contrast to natural ones. We conclude that considering water body influence on flood peaks is crucial to understand the similarity between daily and hourly flood peaks downstream of water bodies. This suggests that water body influence should also be considered in large-sample studies for which the exact influence may be unknown, and quantified using suitable metrics such as the fraction of the total catchment above the water body.
- Article
(3391 KB) - Full-text XML
- BibTeX
- EndNote


Floods can develop rapidly at sub-daily time scales if they are triggered by intense convective storms, especially in small catchments (e.g., Blöschl, 2022). Therefore, information on maximum flows occurring at a sub-daily time scale, so called instantaneous peak flows (IPFs), is crucial for the design of flood protection infrastructure. Still, floods are often described using daily data because sub-daily data are less frequently available than daily data. Because information on IPFs is often not available, considerable research efforts have been put into estimating IPFs from more commonly available daily flow data (e.g., Fuller, 1914; Ding et al., 2015, 2016; Ding and Haberlandt, 2017; Ellis and Gray, 1966; Bartens et al., 2024; Fill and Steiner, 2003). Such estimates are usually derived by relating the ratio between daily mean flows and IPFs, which is referred to as the peak ratio, to catchment characteristics that are also available in ungauged basins (Ding et al., 2015). Such estimation approaches allow for estimating IPFs in catchments where this information is not available. In terms of the predictors used, they often rely on catchment area because IPFs and daily mean flow differ more strongly in small than in large catchments (Fuller, 1914). Other topographic characteristics that can influence and therefore be used to predict the peak ratio include minimum or mean catchment elevation (Bartens et al., 2024; Canuti and Moisello, 1982; Ding et al., 2015) and catchment slope or relief (Canuti and Moisello, 1982). Furthermore, the peak ratio is affected by the type of flood event considered. For instance, snowmelt-driven winter floods exhibit greater similarity in IPFs and daily flows than rainfall-driven summer floods with very pronounced hourly flood peaks (Ellis and Gray, 1966; Bartens et al., 2024). While the effect of topography and hydro-climatic conditions on the peak ratio has received a lot of attention in the literature, the effect of reservoirs and lakes on this ratio has not yet been studied across a large spatial domain.
Both types of water bodies have been shown to modulate flood peaks. Reservoirs tend to dampen floods (Brunner, 2021; Assani et al., 2006), with the degree of dampening varying depending on reservoir characteristics. Factors influencing the degree of dampening include reservoir storage capacity, management practices, and the flood return period considered (Batalla et al., 2004; Götte et al., 2025; Mei et al., 2017; Merz and Blöschl, 2008; Stecher and Herrnegger, 2022). Flood attenuation is not limited to reservoirs specifically built for flood protection, but extends to those primarily operated for hydropower production (Götte et al., 2025; Stecher and Herrnegger, 2022). Similarly to reservoirs, lakes can substantially modulate streamflow. They decrease streamflow variability (Quin and Destouni, 2018) and primarily lead to more stable baseflow conditions, even when the lake basin (i.e., the lake inflow area) only covers a small part of the river basin (that is, the discharge gauge area) (Leach and Laudon, 2019). They also dampen flood peaks but this dampening effect rapidly decreases downstream (Leach and Laudon, 2019), a phenomenon also observed for reservoirs (Volpi et al., 2018; Cipollini et al., 2025). Both lakes and reservoirs can better buffer intense and short flood events than longer-lasting floods, because the flow volume of these events is usually limited (Xiong et al., 2019). This suggests that the attenuation effect of reservoirs on flood peaks may be scale dependent, which may reduce the contrast between daily and hourly flood peaks downstream of reservoirs.
Distinguishing between a lake and a reservoir is not always straightforward. For instance, Hayes et al. (2017) defined reservoirs as “human-made lakes” and lakes as “naturally occurring low points in the landscape that contain standing water”. These and other definitions neglect the fact that many naturally occurring lakes may be heavily regulated. Many originally natural lakes are regulated by humans to ensure flood protection and the navigability of nearby rivers at all times, examples including Lake Zurich or Lake Lucerne in Switzerland (Wantzen et al., 2008). Clearly separating the two types of water bodies is further complicated by the observation that the behavior of a filled reservoir can be very similar to that of a lake of similar size (Bayliss, 1999). Therefore, considering lakes and reservoirs together as “standing water bodies” is sensible if information on more detailed management practices is unavailable.
Large-sample studies focusing on floods consider these standing water bodies in different ways. For example, Sikorska-Senoner and Seibert (2020) excluded both lakes and reservoirs from their analysis of flood generation processes in Switzerland to avoid including water body attenuation effects on flooding. Other studies focused on “near-natural” catchments by excluding catchments with dams or reservoirs, without accounting for lakes (e.g., Brunner and Fischer, 2022). Again others do not mention lakes or reservoirs at all (e.g., Bartens et al., 2024). If reservoirs are considered, there exist different ways to characterize the degree of regulation of water bodies (here, reservoirs), e.g. by considering their storage capacity (Götte et al., 2025) or by also considering the area influenced by the reservoir (Salwey et al., 2023). Bayliss (1999) introduced the FARL index (flood attenuation by lakes and reservoirs) which is based on the surface area of a water body in relation to the inflow area and the catchment area at the streamflow measurement location. Indices such as FARL, which consider the spatial organization of reservoirs, i.e. their position within a catchment, are strikingly missing from many large sample studies and datasets, which usually rely on lumped catchment characteristics aggregated or averaged at the catchment scale (Tarasova et al., 2024) such as catchment-wide storage, the number of reservoirs, or the percentage of land covered by water bodies. The lack of such information is especially problematic for flood analyses, because previous studies have shown that the location of a reservoir or lake matters for flood peak attenuation (Cipollini et al., 2025; Leach and Laudon, 2019; Volpi et al., 2018).
While previous research has relied on large-samples of catchments to estimate the differences between IPFs and daily mean flows, it remains unassessed how the effect of standing water bodies influences the ratio between daily mean and instantaneous flow peaks downstream of water bodies, that is to which degree the attenuation effect of reservoirs on flood peaks is scale dependent. In this study, we aim to address this research gap by asking how water bodies influence the ratio between IPFs and daily mean flows and therefore the attenuation effect on daily vs. instantaneous peak flows. To address this question, we follow two approaches that complement and reinforce each other: a case study approach that strengthens process understanding and a large-sample analysis that allows us to draw more generalizable conclusions. Using the case study approach, we first analyse the attenuation of sub-daily vs. daily peak flows by lakes and reservoirs at four locations in Central Europe, for which streamflow data are available up- and downstream of water bodies. This approach allows us to illustrate the differences in the dampening effect of water bodies on flood peak quantiles derived from datasets with different temporal resolutions. Using the large-sample approach, we second explore the impact of the catchment fraction influenced by a water body on the ratio between daily and hourly flood quantiles across Switzerland. This allows us to demonstrate that the results derived for the four case studies are generalizable to other catchments.
2.1 Data
2.1.1 Case study catchments – Bavaria and Walensee
We selected four case studies with streamflow gauges both up- and downstream of a water body to demonstrate how daily and sub-daily flows are dampened by water bodies locally. This allows us to isolate the effect of the water body on flood peak attenuation because non-water-body-related alterations of observed streamflow from up- to downstream are minimized. These examples consist of three water bodies in Bavaria (Perlsee, Vilstalsee, Mertsee), which are primarily used for flood protection and recreational purposes, and the Walensee in Switzerland, which is a large natural and unregulated lake. We would have liked to include only Swiss examples to be consistent with the spatial domain considered for the large sample study (see Sect. 2.1.2). However, we did not find enough cases fulfilling the criterion of having up- and downstream gauges with sub-daily streamflow records. The case studies chosen have up- and downstream gauges that are close to each other and the respective water body. For the Bavarian examples, catchment area from the upstream to the downstream location increases between 15 % to 29 %. The Walensee catchment covers a much larger area and has more contributing tributaries, leading to an increase in catchment size of 77 % between the up- and downstream gauges, even though the linear distance between these gauges is less than 4 km (Fig. 1b). This means that this case study does not allow for a clean separation between the influence of the water body and tributaries on flood peaks. Please note that the Linth (draining the area of Canton of Glarus) comes from the South, flows into the Walensee and then leaves the Walensee to the West. As a consequence, the upstream catchment is very narrow and located close to the upstream station (southern gauge).
The streamflow data for the three German case study sites were obtained from the Bavarian Environment Agency (LfU – Bayerisches Landesamt für Umwelt, 2025) at 15 min resolution. We trimmed both the up- and downstream time series to the period after the construction of the reservoir where necessary such that we could directly compare natural flood peaks upstream of the reservoir with their regulated counterparts downstream. Additionally, we excluded early periods of record, for which the 15 min data provided did not show any sub-daily variability and hence represented daily data. These data processing steps resulted in time series covering periods from 38 to 56 years. Catchment shapes were obtained from CAMELS-DE (Loritz et al., 2024) and water body (here: reservoirs) locations from Speckhann et al. (2021). The data sources for the Walensee case are the same as for the rest of Switzerland and are described in Sect. 2.1.2. The length of the time series available for the Walensee is 49 years, for both the up- and downstream gauges of the lake. The flow data was available at an hourly rather than a 15 min resolution.
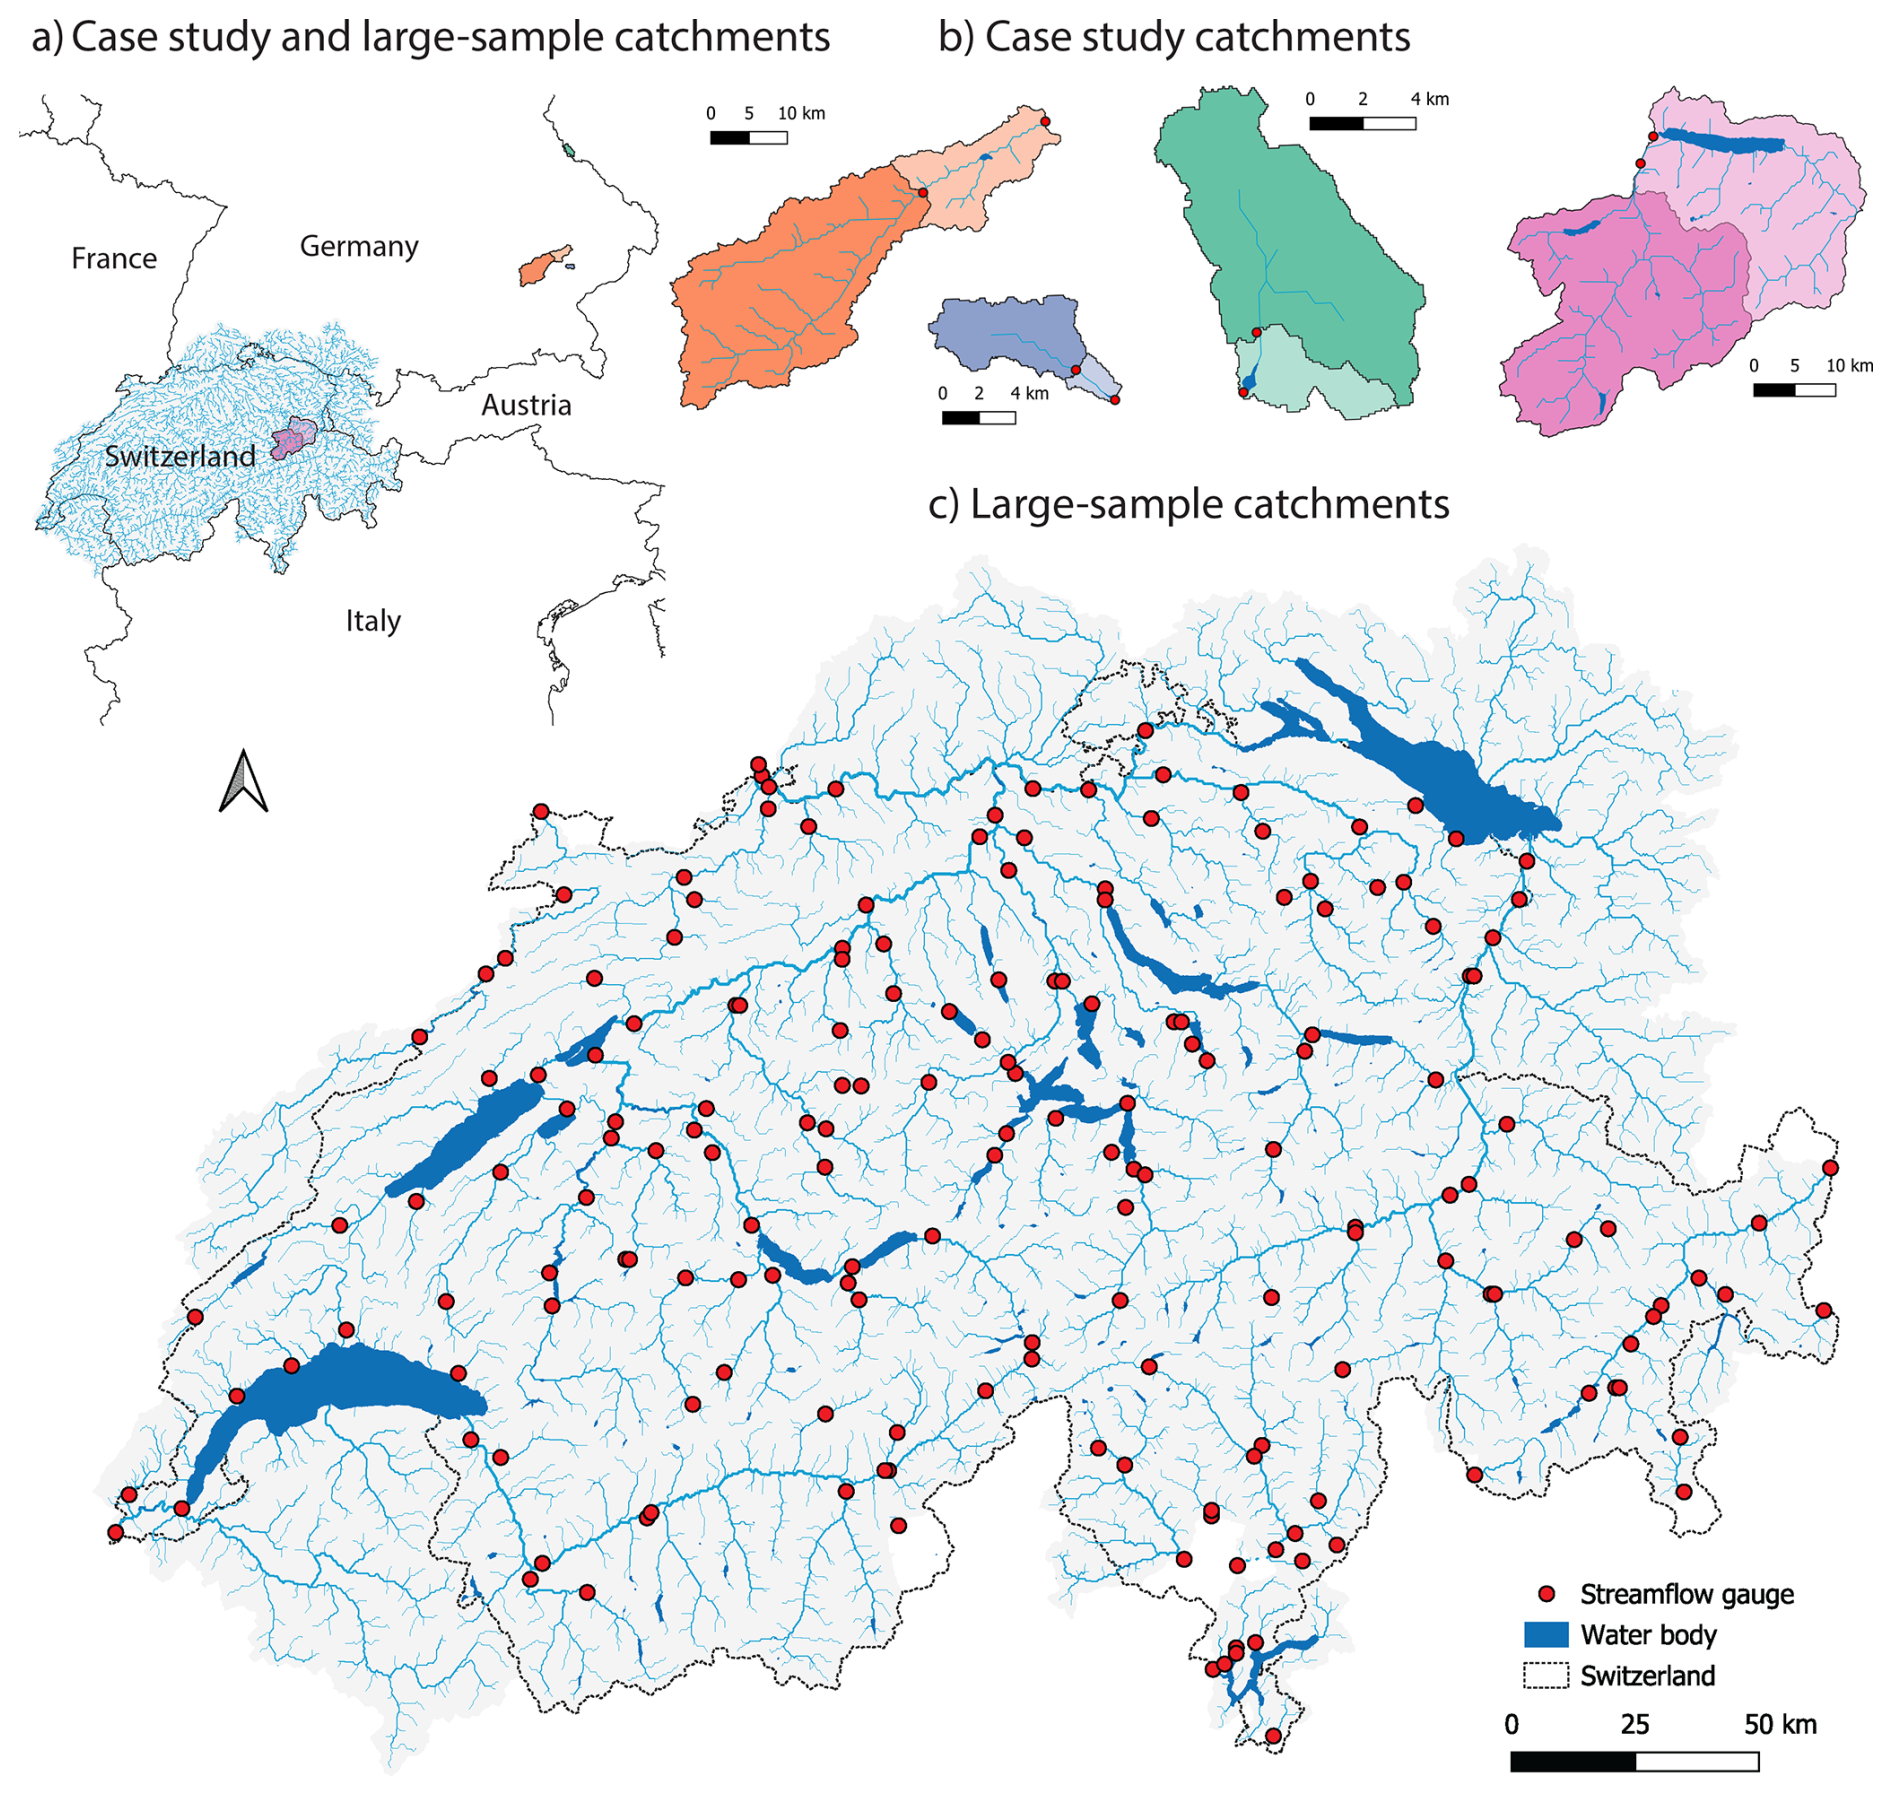
Figure 1(a) Overview of the catchments and streamflow gauges used in the (1) case study and (2) large-sample analysis. (b) Catchments, water bodies and streamflow gauge locations of the four case studies (from left to right: Perlsee, Mertsee, Vilstalsee, Walensee), with upstream and downstream catchments highlighted in saturated and transparent colors, respectively. (c) Streamflow gauges and water bodies within Switzerland included in the large-sample analysis. River lines were taken from Lehner and Grill (2013) and for visualization purposes manually adjusted to reflect real-world lake inflows. In (c), rivers are scaled according to their Strahler number. Water bodies are from FOEN (2021) and their size slightly inflated to ensure the visibility of small water bodies.
2.1.2 Large sample dataset – Switzerland
To evaluate how water bodies influence floods, we compare daily and hourly streamflow data across catchments in Switzerland that vary in terms of how strongly they are influenced by water bodies. In contrast to the upstream–downstream perspective taken for the case studies, the large-sample analysis considers catchments that differ in the distance of their gauge to nearby lakes or reservoirs. That is, it tries to infer the influence of water bodies on floods and the flood ratio by considering catchments with a varying degree of water-body influence. We focus our analysis on Switzerland because it offers over 40 years of high-resolution (hourly) streamflow records and contains numerous lakes of varying sizes. For this analysis, we have selected all streamflow stations from the CAMELS-CH dataset (Höge et al., 2023), which are located within Switzerland (194 stations), and obtained hourly streamflow records for these stations from the Swiss Federal Office for the Environment (FOEN) upon request. From this dataset, we excluded the rivers (1) “Areuse”, (2) “Spöl” and (3) “Arve” because these catchments are either (a) strongly groundwater fed, (b) have regular artificial floods (see Kevic et al., 2018; Robinson et al., 2018) or (c) have the majority of their catchment outside of Switzerland. Additionally, we exclude stations which have less than 10 years of streamflow available after 1980, which results in a final dataset of 183 catchments for the large-sample analysis.
We extracted information about water bodies from a catchment dataset from FOEN (2021). This catchment dataset consists of more than 22 000 subcatchments in Switzerland and includes “all lakes and rivers with a catchment area greater than 1 or 1.5 km2” as individual entities. We selected the 202 subcatchments classified as “Standing Water Body” (“SEE_stehendesGW” in the dataset) and extracted their total catchment area (inflow area). We also estimated the size of several lake catchments outside of Switzerland, which are part of Swiss catchments (see Table A1). Please note that we have not mapped all lakes outside of Switzerland even though some of them are part of the Swiss river catchments. Since we are interested in the total lake-influenced catchment area, we only include the most downstream lake within a catchment. For each gauging station, we take the catchment polygon from CAMELS-CH (Höge et al., 2023) and dissolve all water-body catchments contained within it. Then, we calculate the total area which lies above the most downstream water body in case it is located on the main stem or the most downstream water bodies in the tributaries if they are located in the tributaries and divide it by the river catchment area. This results in the fraction of the total catchment above the water body, referred to in this study and in previous work of Salwey et al. (2023) as the “contributing area percentage” (see Fig. A1 for an overview of the contributing area percentage and catchment sizes of the dataset). Furthermore, we use catchment characteristics obtained from CAMELS-CH (Höge et al., 2023) as additional variables to explain the difference between hourly and daily peak flows. We chose catchment characteristics which can be associated with fast vs. slow runoff, namely the catchment area (area), the biogeographical region within Switzerland (bio_geo_dom), volumetric soil porosity (porosity), minimum catchment elevation (elev_min), the percentage of catchment area steeper than 15 % (steep_area_perc) and the geologic permeability (geo_log10_permeability). We use streamflow data from the start of the 1981 hydrological year (1 October 1980) until the end of the 2024 hydrological year (30 September 2024), resulting in a maximum record length of 44 years (minimum 11 years, 80 % of catchments with at least 40 years of data).
2.2 Methods
2.2.1 Comparison of daily vs. sub-daily flood estimates
To compare daily and sub-daily flood peaks, we work with flood estimates, that is flood quantiles estimated for specific return periods. We use such estimates instead of focusing on individual events as flood events detected in one time series are not necessarily detected in the other series. To do so, we first derive time series of daily mean flows by averaging the sub-daily flow values of each day. For both, daily- and sub-daily timeseries, we identify the annual maxima for each hydrological year (October to September). Then, we fit generalized extreme value distributions (GEVs, Stephenson, 2002) to the annual maxima series of each station, separately for both the daily and sub-daily maxima. These distributions are then used to estimate the flow quantiles corresponding to return periods of 2 to 25 years for the four case studies and for a return period of 10 years for the large-sample analysis. We focus on 10-yearly extreme flows because these represent a good compromise between regular floods (e.g., 2-yearly) and more extreme floods (e.g., 30-yearly) and because they can still be estimated reliably given the rather small sample at hand, which would not be the case for very rare floods with longer return periods. Specifically, we can estimate these 10-yearly floods fairly robustly, given that the streamflow records for most stations exceed 10 years by a large margin (80 % of catchments have at least 40 years of data).
We calculate the ratio between daily and sub-daily flow estimates. For the case studies, for which the sub-daily data comes at a 15 min resolution (exception Walensee), we call this ratio the “daily/sub-daily ratio”. In the large-sample analysis, we use hourly data from Switzerland and hence refer to the daily/hourly flood peak ratio as the “D H ratio”. These terms are similar to the “peak ratio” used in the literature, which usually refers to IPFs (maximum instantaneous flows) which are not available for this study and are expected to be slightly higher than the flood peaks derived from time series at a 15 min or hourly timescale.
2.2.2 Evaluation of water body-influence on daily and sub-daily flows
To quantify the effect of the contributing area percentage on the D H ratio, we try to explain the D H ratio using different catchment characteristics, including but not limited to the contributing area percentage. For that, we set up a random forest model (Breiman, 2001) to predict the D H ratio based on the seven catchment characteristics mentioned above (see Sect. 2.1.2). The random forest model is trained on the observed D H ratios related to the 10-yearly extremes. This model allows us to (a) assess the general predictability of the D H ratio and (b) identify the most important catchment characteristics used for the prediction. To identify the most important characteristics, we use two metrics derived from the random forest model to quantify variable importance: The increase in mean squared error (% INC MSE) and the increase in node purity. The increase in mean squared error indicates by how much a specific characteristic contributes to the accuracy of the model by measuring the increase in the prediction error when the values of a characteristic are randomly permuted. The increase in node purity reflects a characteristic's importance in improving the decision tree's structure by quantifying the total decrease in impurity as quantified by the Gini index from splits using a characteristic (Liaw and Wiener, 2002). Both metrics should provide similar results when it comes to the order of the relative importance of input variables.
Additionally, we use partial dependence plots (Friedman, 2001; Greenwell, 2016) to estimate the marginal effect of the most important variables to predict the D H ratio, that is to identify when the contributing area percentage and catchment area have a strong influence on the D H ratio. These help visualize the relationship between a subset of the predictors and the response while accounting for the average effect of the other predictors in the model. In doing so, they reveal the marginal relationship between the predicted variable and each predictor and can be used to assess the type of relation across the value range of each variable. Based on the partial dependence analysis, we split our large sample into two samples: Strongly and weakly water-body-influenced catchments. We train another random forest model on the weakly water-body-influenced catchments and use it to predict the D H ratio of the strongly water-body-influenced catchments. This analysis aims to highlight the importance of including information on water-body influence to explain the D H ratio in regulated catchments. The results of this analysis emphasize the differences in the D H ratio between weakly and strongly influenced catchments and indicate the uncertainties that arise when not considering water bodies in large-sample flood peak analyses.
Lastly, we evaluate the dampening effect of water bodies on both, daily and hourly peak discharge in the large-sample approach. Therefore, we compare the magnitude of 10-yearly flows in relation to the catchment area for hourly and daily flows in the two groups: weakly and strongly water-body-influenced catchments. We do this by fitting a linear model without an intercept to the log-transformed extreme flows and log-transformed catchment area, and evaluating the slope of this model. We chose this linear modeling approach on a log-log transformation since extreme flows are often assumed to be related to the catchment area with a power law (e.g., Ayalew et al., 2017; Gupta et al., 1996, 2010; Medhi and Tripathi, 2015). We chose a linear model with no intercept to force the regression line through the origin (0,0) because a catchment with a catchment area of 0 should also have a 10-yearly flow of 0. The slope of this regression model shows by how many % points extreme flows increase when the catchment size increases by 1 %.
3.1 Case studies
The four case studies demonstrate that water bodies clearly modulate high flows (Fig. 2). High flows estimated for return periods from 2 to 25 years generally decrease from the gauge upstream of the water body to the one downstream for all four cases, independently of whether daily or sub-daily flows are considered; except for Walensee at a daily-resolution. While water bodies tend to buffer flood peaks at both time resolutions, the strength of this buffering effect differs between daily and sub-daily flows. This is indicated by a smaller difference between sub-daily and daily flows downstream of water bodies compared to the difference upstream. Most notably, the estimated flow magnitudes for both daily and sub-daily flows are almost equivalent in the cases of Perlsee, Vilstalsee and Walensee across return periods (Fig. 2a, b and d), highlighting the suppression of sub-daily flood peaks by the water bodies. We further quantify this observed buffering effect by focusing on the high-flow estimates corresponding to a return period of 10 years, which we are also going to use in the large-sample analysis.
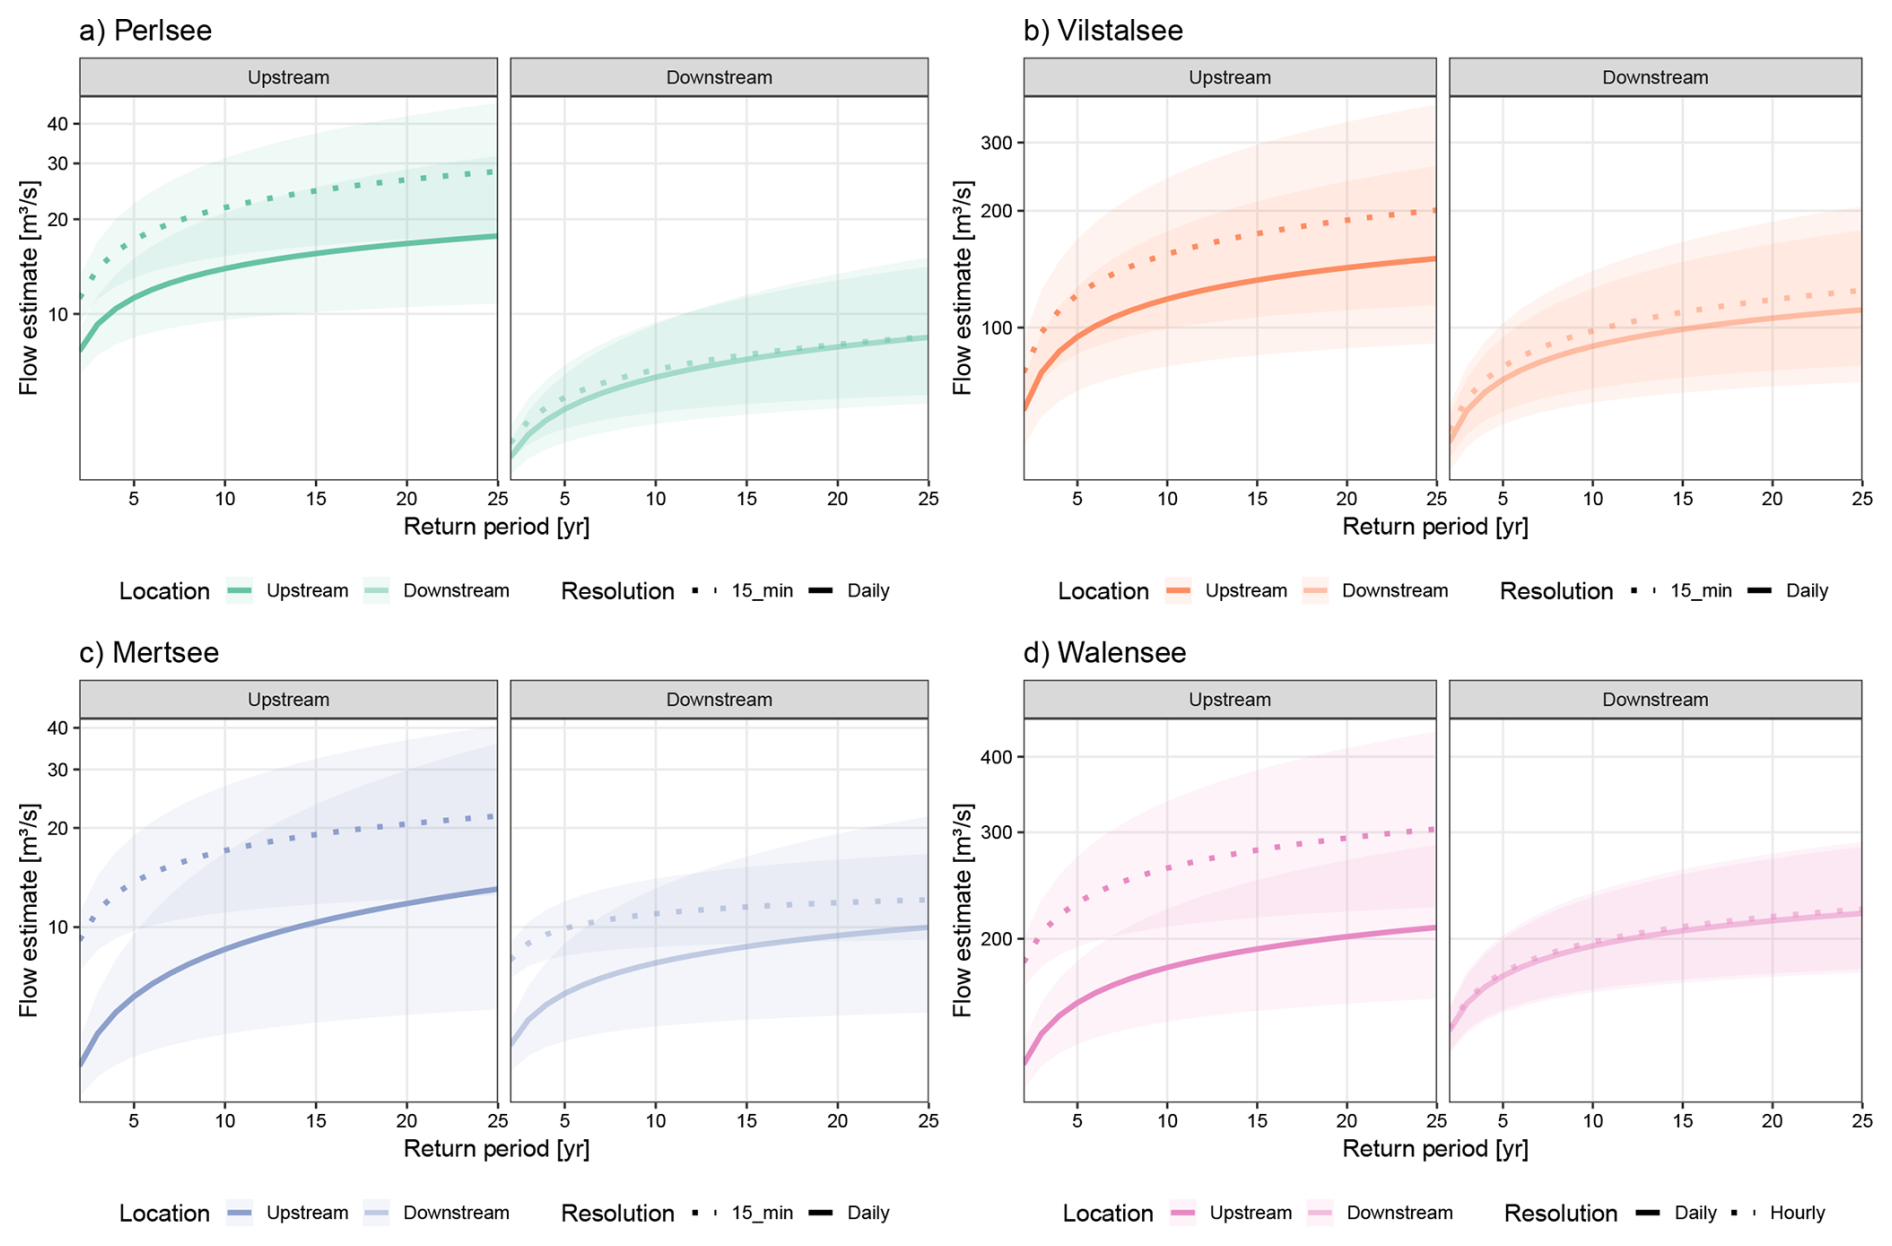
Figure 2Estimates of daily and sub-daily high flows and their uncertainties for return periods from 2 to 25 years (95 % confidence interval) up- and downstream of (a) Perlsee, (b) Vilstalsee, (c) Mertsee and (d) Walensee. The y axes (flow estimates) are scaled logarithmically.
The sub-daily 10-yearly high flows are in all cases substantially more strongly dampened by the water body than the 10-yearly daily flows, as shown by the lower down-/upstream ratios for sub-daily than daily high flows (Fig. 3a). The down-/upstream ratio for 10-yearly extreme flows is 0.12 to 0.33 lower for sub-daily than for daily flows. These ratios correspond to a 70 % to 25 % decrease in sub-daily 10-yearly flows and a change in daily flows ranging from a 55 % decrease at Perlsee to a 9 % increase at Walensee from the upstream to the downstream location. The latter means that the flows downstream of Walensee are higher than those upstream, which is most likely related to the significant increase in catchment size from the upstream to the downstream gauge at this location (the downstream catchment is 77 % larger). The decrease in sub-daily flows, despite the significant increase in catchment size, emphasizes the strong dampening effect of this lake on sub-daily flood peaks.
The stronger dampening of sub-daily flows compared to daily flows results in great similarity between the two quantities, as demonstrated by the increased ratio of daily to sub-daily flows downstream of the water body compared to upstream of the water body (Fig. 3b). Notably, the difference between the 10-yearly daily and sub-daily flows is less than 10 % for three out of the four examples downstream of the water body (shown by ratios close to 1). This difference is 30 % for the Mertsee, which is much higher than for the other three examples, but still much lower than upstream of this lake. Hence, it still represents a substantial increase in the daily/sub-daily ratio from 0.5 to 0.7.
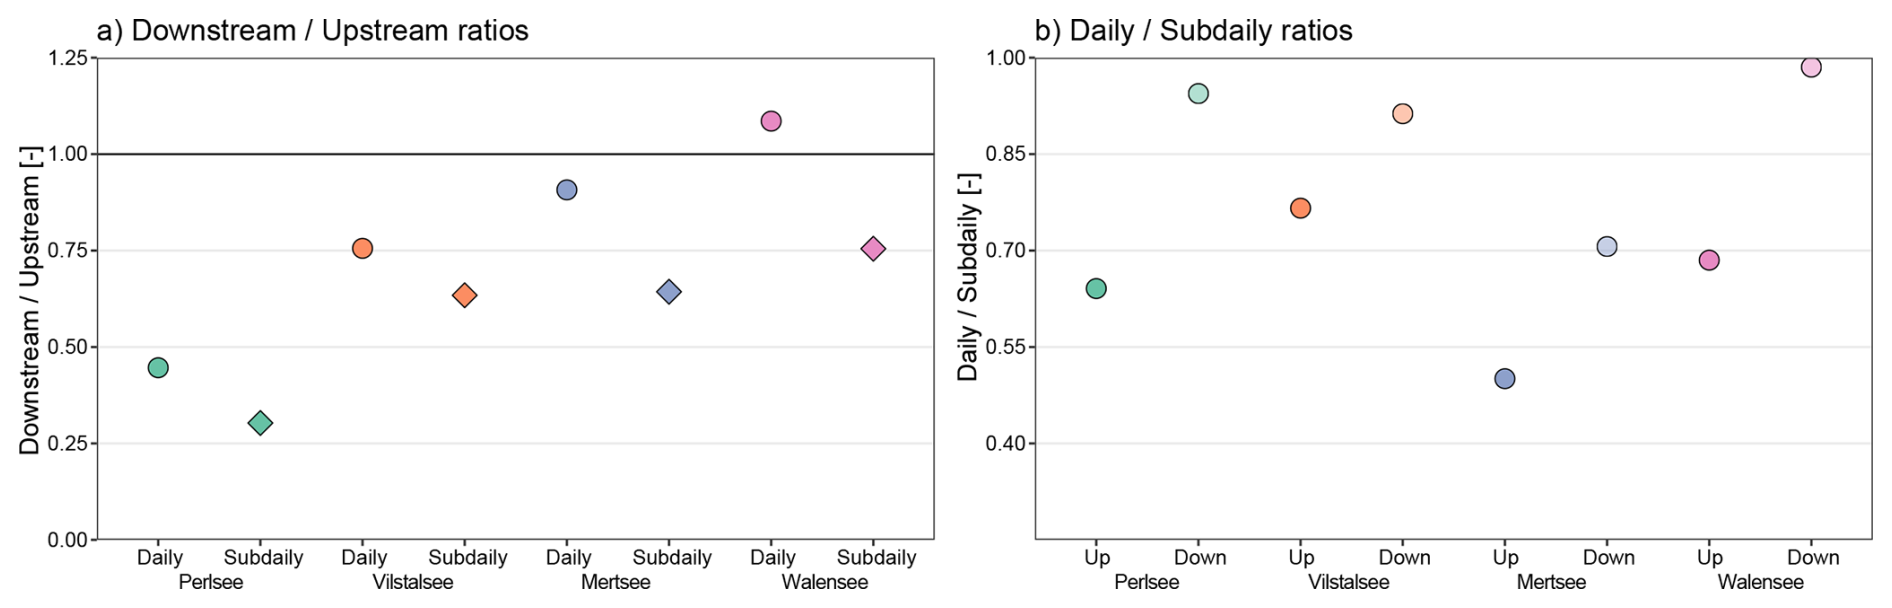
Figure 3Comparison of 10-yearly flood flows for the four case studies. (a) Ratio between downstream and upstream 10-yearly flows for daily and sub-daily ratio. Values below 1 indicate a dampening of flood flows by the water body. (b) Ratio between daily and sub-daily 10-yearly flows, shown for the up- and downstream location of each case study. The closer this ratio is to 1, the more similar are daily and sub-daily flows.
These comparisons of downstream with upstream flows for the four examples illustrate three effects of standing water bodies on high flows: (1) sub-daily and daily flows become more similar to each other (Fig. 2); (2) sub-daily flows decrease more strongly than daily flows (Fig. 3a) and (3) absolute extreme flows decrease (Fig. 2). To check whether these effects are generalizable to other cases and regions, we further investigate these effects for a large sample of catchments across Switzerland.
3.2 Large-sample approach
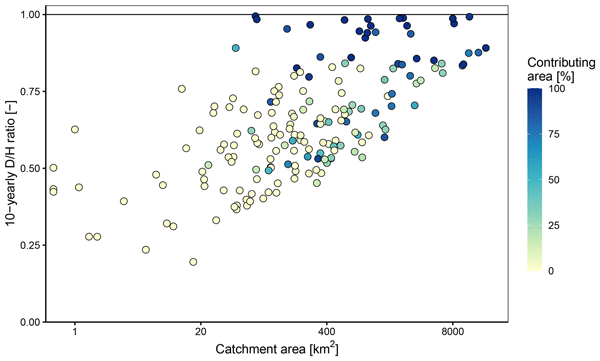
The large-sample analysis confirms that water bodies influence the relationship between daily and hourly flood estimates. The ratio between daily and hourly 10-yearly flood peaks increases with catchment area, meaning that sub-daily flows become more similar to daily flows in large as compared to small catchments (see Fig. 4). Additionally, it is close to 1 for the catchments that are strongly influenced by water-bodies. This means that large catchments and catchments in which the flow is strongly influenced by lakes and/or reservoirs have similar flood estimates at hourly and daily resolution, while small and less strongly influenced catchments show higher hourly than daily flood peaks. 28 out of 29 catchments with a contributing area above 70 % have a D H ratio above 0.85, which implies great similarity between daily and hourly high flows. These results are in line with those of the case study analysis, where 3 out of 4 catchments also showed ratios above 0.85 (Fig. 3b).
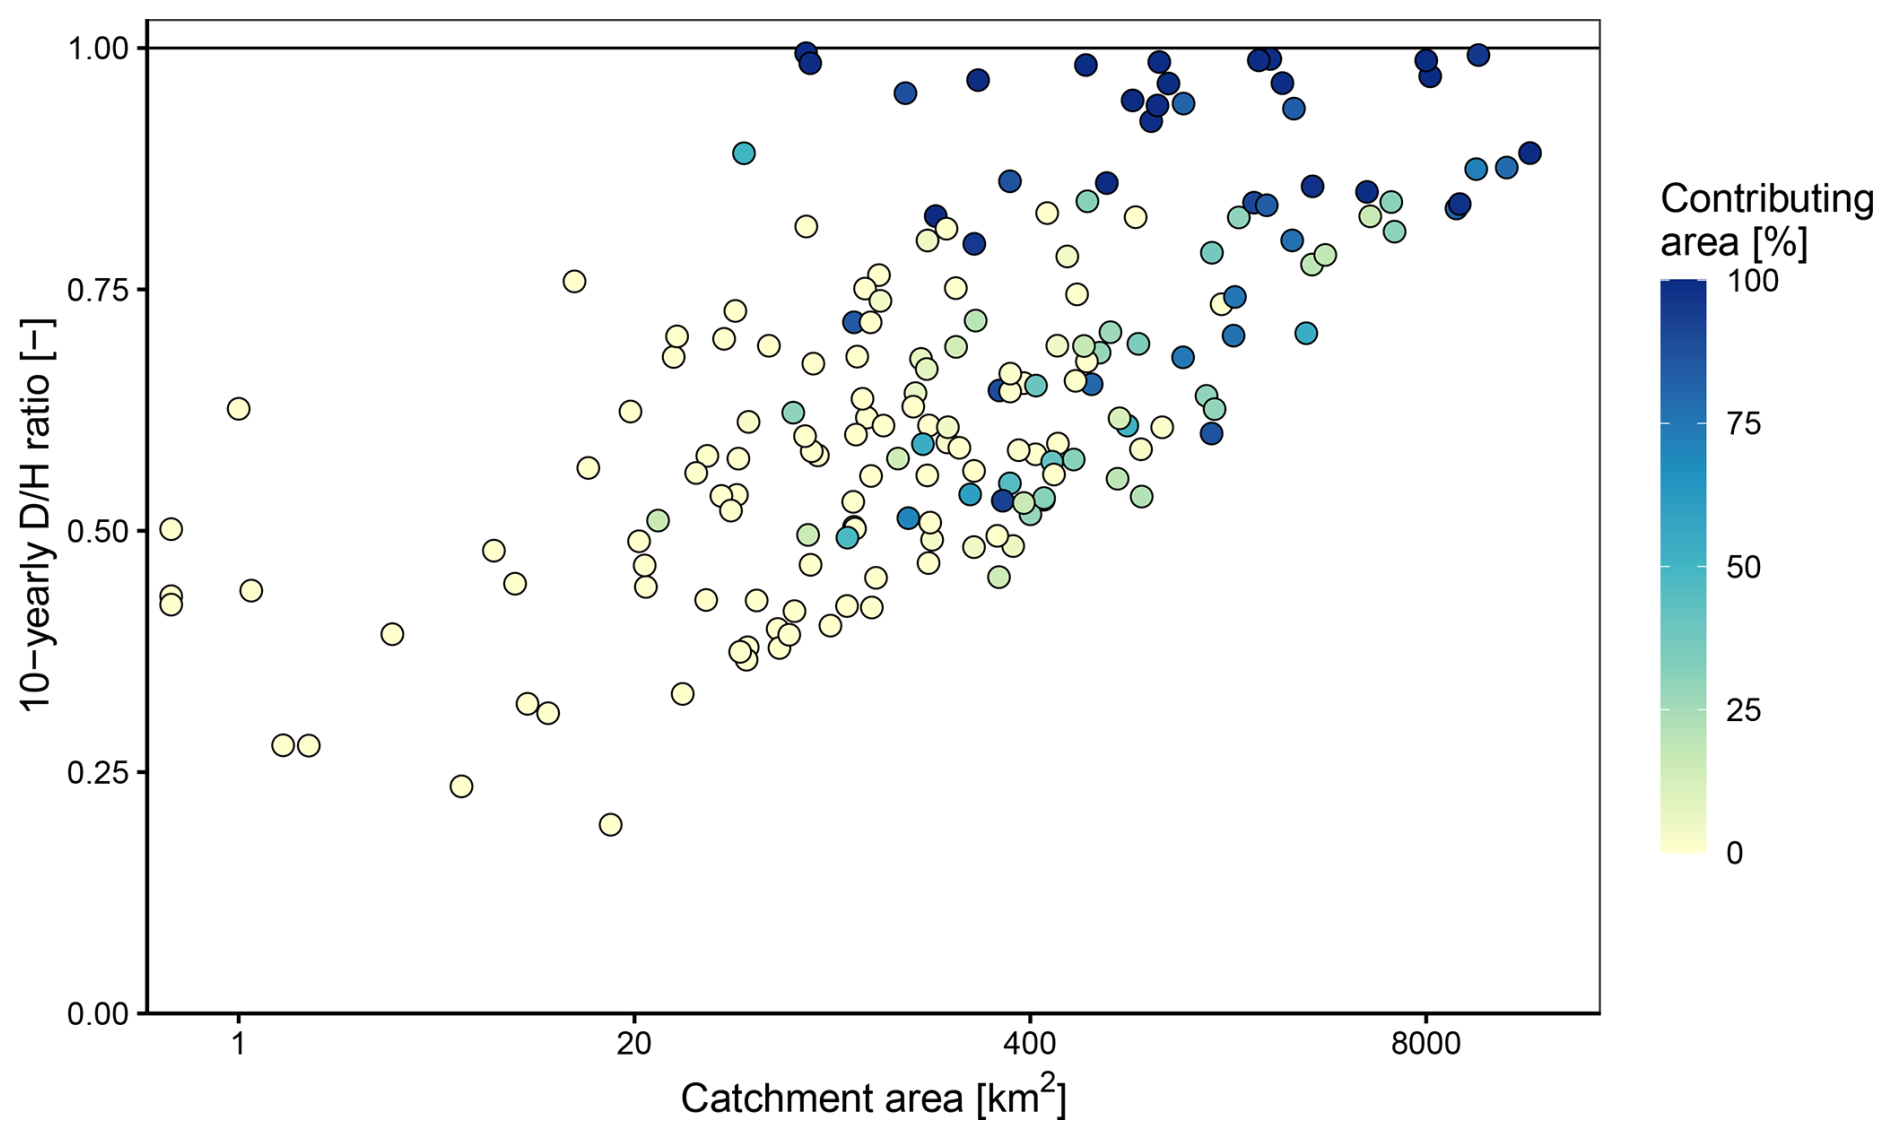
Figure 4Ratio between 10-yearly daily and hourly peak discharge and their dependence on catchment area and contributing area percentage for 183 Swiss catchments. A ratio close to 1 refers to similar daily and hourly peak discharge, while a low ratio highlights a large difference between the two. Note that the catchment area (x axis) is scaled logarithmically.
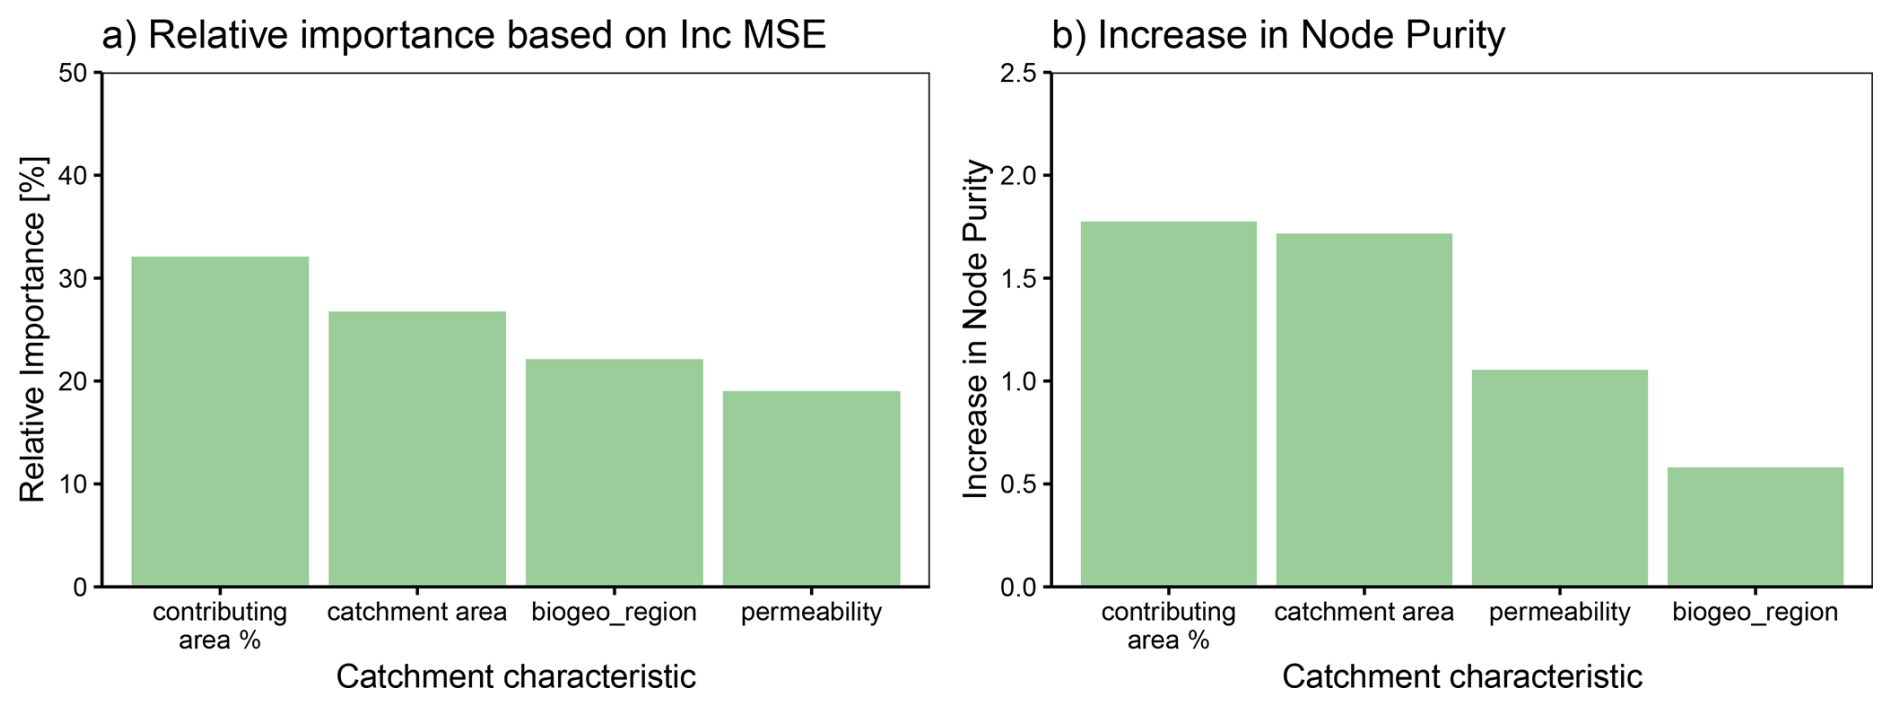
The previous results (Fig. 4) highlight that differences between daily and hourly flood estimates depend both on catchment area and contributing area percentage. To investigate how important these two factors are relative to each other for explaining the D H ratio related to the 10-yearly flood peak and to separate the water body influence from the one of catchment area, we set up a predictive random forest model for this ratio using different catchment characteristics as predictors (see Sect. 2.1.2). We get the best model performance explaining 67 % of the variability in the D H ratio, when using four predictors, namely, contributing area percentage, catchment area, geological permeability and the biogeographical region. Using additional catchment characteristics does only lead to marginal model improvements (68 % of the variability explained), which is why we continue to use the more parsimonious model version with only four input characteristics. This model identifies the contributing area percentage and catchment area as the most important characteristics to explain the D H ratio (Fig. 5), while it assigns less weight to the other two predictors, which are less detrimental to model performance. This would also be the case if considering the extended model (Fig. A2). Our further analyses focus on the influence of the two most important characteristics, namely, contributing area percentage and catchment area.
These two variables, catchment area and contributing area percentage, affect the D H ratio differently depending on their magnitude. The predicted D H ratios change only marginally below a contributing area percentage of 60 %, while they increase strongly at higher contributing area percentage (Fig. 6a). This means that water bodies are primarily important for reducing the difference between daily and hourly peak discharge if they cover a very large part of the catchment. Similarly, the catchment area does not influence the results much if small catchments (<100 km2) are considered (Fig. 6b). In contrast, for larger catchments, the predicted ratios increase with catchment area, highlighting the increasing similarity of daily and hourly peak discharge with increasing catchment area – an effect that is well documented in the literature (e.g. Fuller, 1914; Ellis and Gray, 1966; Bartens et al., 2024). In our case, this increase is seemingly leveling off at a catchment size of about 5000 km2 (Fig. 6b).
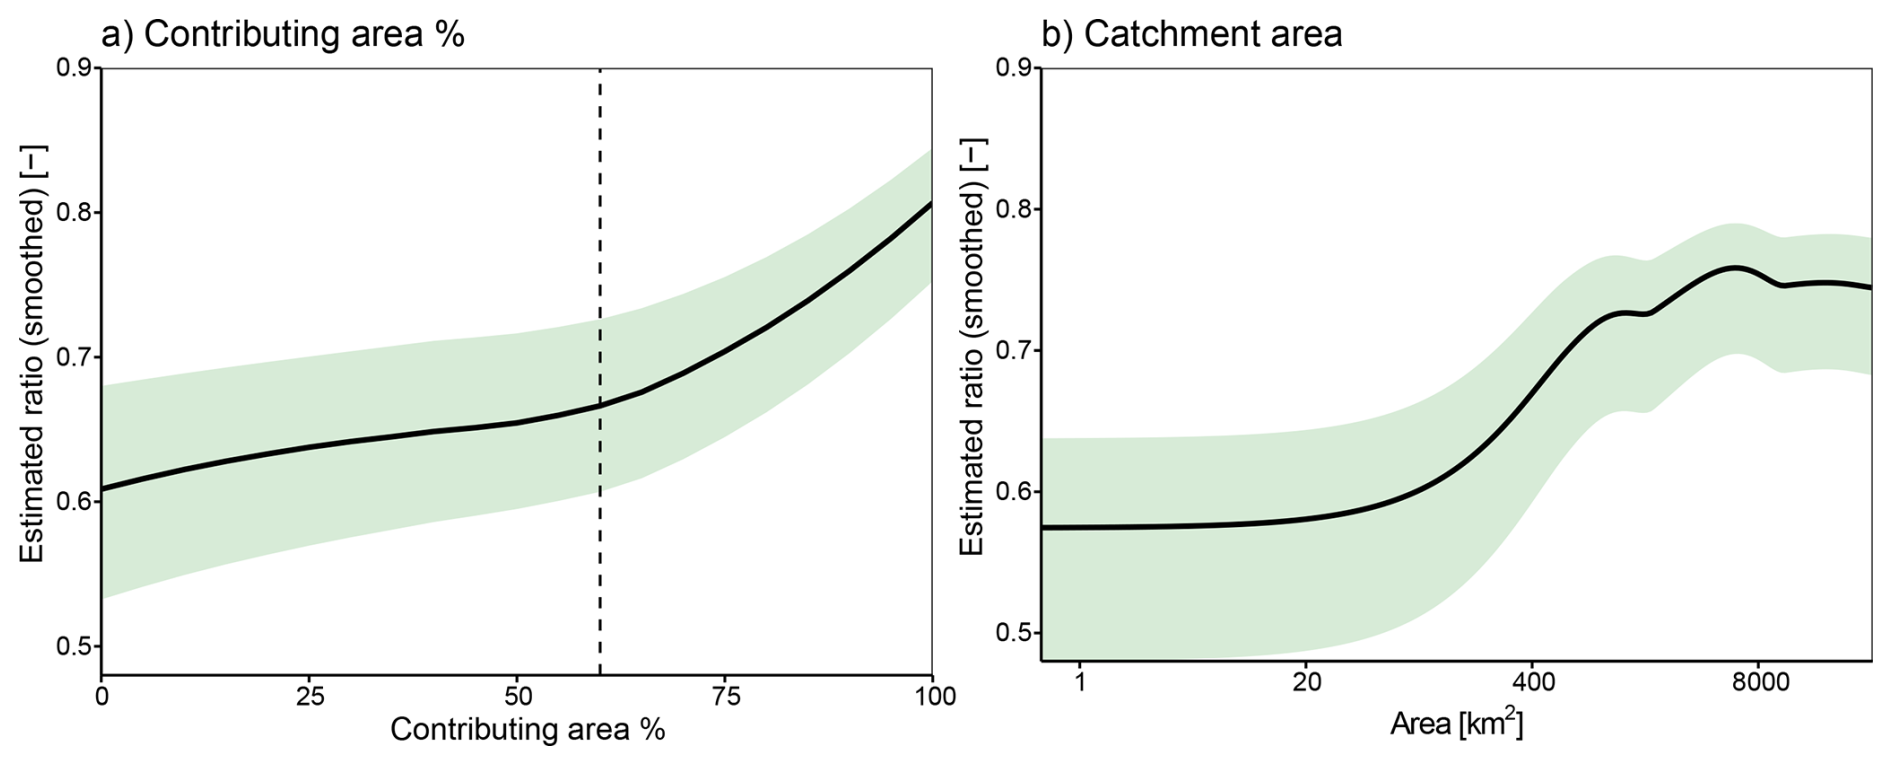
Figure 6Partial prediction of the D H ratios for the two variables (a) contributing area percentage and (b) catchment area. These partial plots show the model estimation of the D H ratios if all other inputs are averaged out. The coloured ribbons show the interquartile range of the estimated D H ratios, and the dashed line in (a) shows where the curve inflects. This inflection point (contributing area percentage = 60 %) is used to split the catchments into those that are weakly and strongly influenced by water bodies.
There are substantial differences in the D H ratio between weakly water-body-influenced (contributing area percentage below 60 %) and strongly water-body-influenced catchments (contributing area percentage above 60 %). To illustrate this, we build a D H ratio prediction model using the previously established input characteristics (see Fig. 5), excluding the water body fraction. We train this model on the weakly influenced catchments and attempt to predict the D H ratio of the strongly influenced catchments to highlight the importance of including water-body influence information to explain the D H ratio in regulated catchments. This model does a good job in predicting the D H ratios for the weakly water-body-influenced catchments and the estimated D H ratio is less than 0.1 off the observed values for 91 % of all catchments (brown line in Fig. 7). Using this model to also estimate the D H ratio in the strongly water-body-influenced catchments leads to a strong underestimation of the D H ratio, with 80 % of the catchments showing an underestimation of more than 0.1, and a median difference between predictions and observations of −0.20. This underestimation emphasizes that the D H ratio is much higher in water-body-influenced catchments than in weakly water-body-influenced catchments.
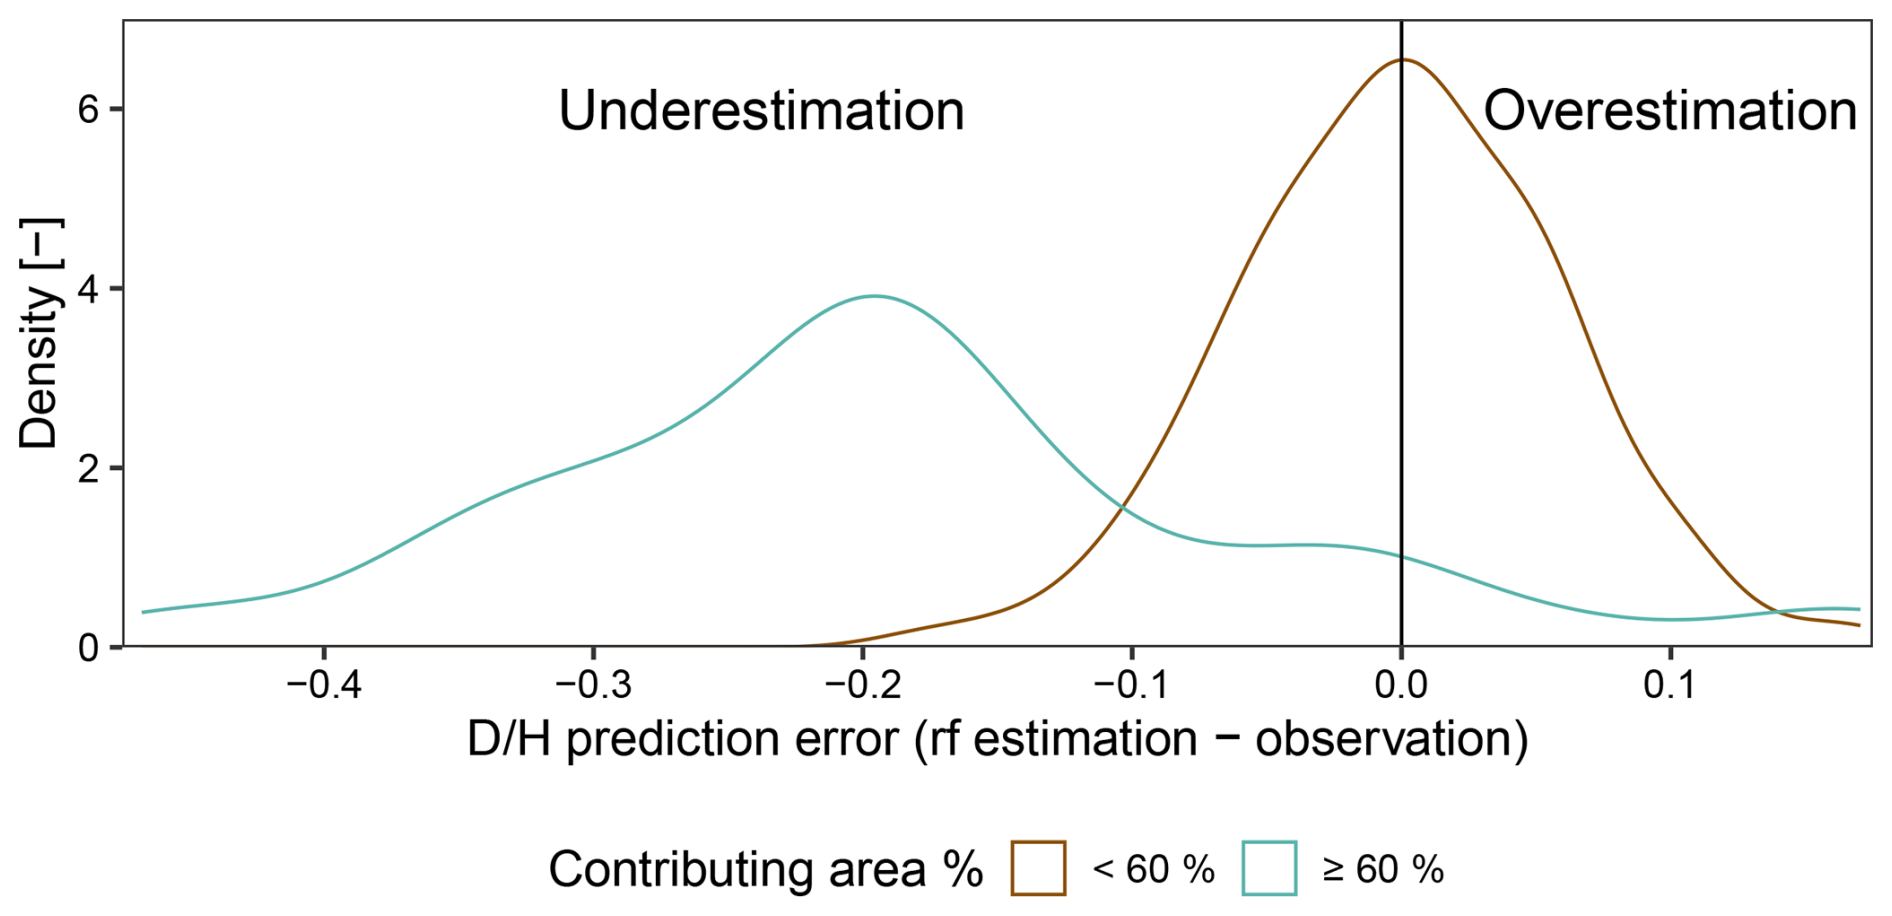
Figure 7Distribution of prediction error when using a D H random forest model trained on catchments with a contributing area percentage lower than 60 % to predict both, weakly (<60 %) and strongly (≥60 %) water-body-influenced catchments.
Our previous results (Figs. 2, 3a) strongly suggest that hourly peak discharge is more strongly dampened by water bodies than daily flows. To confirm this, we analyse the relationship between the absolute 10-yearly high flow estimates and catchment area for strongly water-body-influenced (contributing area percentage ≥60 %) vs. weakly water-body-influenced catchments (contributing area percentage <60 %). This relationship appears to be linear and can be described by a simple linear (proportional) model between the logs of the 10-yearly high flows and catchment area (Fig. 8).
The parameter of this model, i.e. the slope of the linear model, confirms that high flows are less pronounced in strongly water-body-influenced than in weakly water-body-influenced catchments, independently of the time resolution considered. That is, the regression coefficients for the strongly water-body-influenced catchments are lower than the corresponding slopes for catchments with weaker water-body-influence at both daily and hourly resolution. This difference is much larger for hourly peak discharge than for daily peak discharge confirming that flood magnitudes are lower in strongly water-body-influenced catchments compared to weakly water-body-influenced catchments, especially at the hourly resolution. Additionally, the slope is slightly lower for hourly flows in strongly water-body-influenced catchments than for daily flows in weakly water-body-influenced catchments. This means that the dampening of extreme hourly peak discharge by water bodies is large enough to reduce the hourly peaks to a level similar to that of extreme daily flows in weakly water-body-influenced catchments.
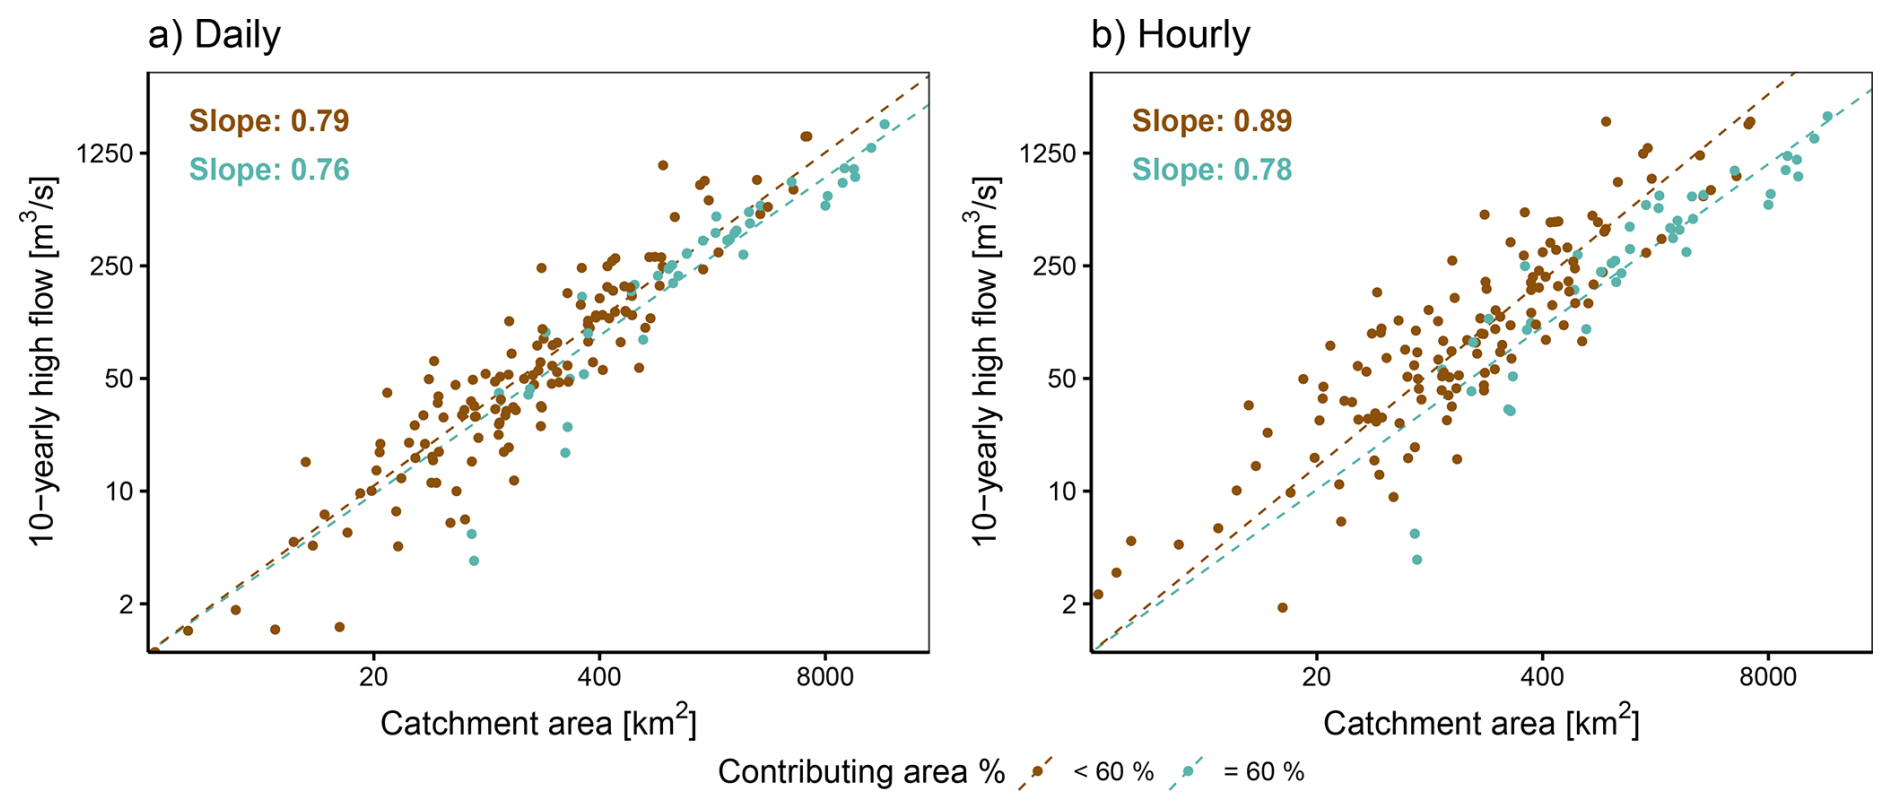
Figure 8Absolute high flow estimates corresponding to a 10-year return period derived using daily and hourly peak discharge. The dashed lines represent linear regression models without an intercept and are fitted to the log of the extreme flows and the log of the catchment area.
4.1 Water bodies dampen hourly flood peaks more strongly than daily flood peaks
Our results confirm the well-established principle that increasing the catchment area leads to peak ratios approaching values of 1, meaning that there is only little difference between daily and hourly flood flows in large catchments (see Fig. 4, Fuller, 1914; Ellis and Gray, 1966). Bartens et al. (2024) have shown that the difference between hourly and daily peak flows is less than 20 % for catchments with an area greater than 5000 km2. Our random forest-based results for catchments (Fig. 6b) of this size support this finding by indicating peak ratios close to 0.8, which corresponds to a 20 % difference. Therefore, we conclude that catchment area is a crucial factor influencing the peak ratio.
Our results also highlight another crucial factor shaping the relationship between daily and hourly peak discharge, which has not yet been considered in previous studies: water body influence. Even small catchments could have similar daily and sub-daily flood peaks if they are strongly influenced by water bodies (Fig. 4). This is because water bodies – both reservoirs and lakes – buffer flood peaks differently depending on the time scale considered, which reduces the difference between hourly and daily flood peaks. The local case studies, that is three managed reservoirs and one large unregulated lake, clearly show that flood peaks are greatly reduced by the presence of water bodies (up to 55 % for daily flood peaks and up to 70 % for sub-daily flood peaks, see Fig. 2). The dampening effect is stronger for hourly than daily peak flows, which leads to an alignment of hourly and daily flood peaks downstream of the water bodies (see Fig. 3). Similarly, the large-sample analysis shows that both daily and hourly flood peaks are dampened by water bodies and the damping effect is larger for hourly than daily peaks (Figs. 4 and 8). These findings suggests that daily flood peaks are a good proxy for hourly flood peaks in strongly regulated catchments. This means that in such catchments, instantaneous peak flows may be estimated from daily peak discharge in case sub-daily data is not available. However, the influence of water bodies on the observed peak ratio decreases when large parts of the catchment lie below the water body. We observed an overall increase in the peak ratio as the contributing area percentage increases (Fig. 6a). This is consistent with the findings of other studies which have found that the influence of water bodies on flood peaks decreases with increasing distance from the water body, including both lakes and reservoirs (Leach and Laudon, 2019; Volpi et al., 2018; Cipollini et al., 2025). Based on our sample of 183 catchments in Switzerland, we found that water bodies most notably influence the peak ratio when more than 60 % of the catchment area lies above them (Figs. 6a and 7). While catchment area and contributing area percentage are the most important predictors of the D H ratio, other predictors such as the biogeographical region, a metric for catchment similarity in terms of climate, geology, and vegetation, and other catchment characteristics such as permeability, an indicator for flashiness, only have limited predictive power (Fig. 5). This highlights that existing estimation approaches deriving instantaneous peak flows from daily data using catchment area and other catchment characteristics can profit from additionally including information on water body influence.
4.2 Representation and impact of water bodies in large-sample studies
The catchment fraction above water bodies is a characteristic mostly missing in large-sample datasets. These usually only provide spatially aggregated characteristics on the degree of water body influence, such as the total volume of reservoirs in a catchment or the total surface area of water bodies as a land cover type (e.g., Coxon et al., 2020; Höge et al., 2023; Loritz et al., 2024). As demonstrated by the contributing area percentage, considering information on the spatial organization and distribution of water bodies within a catchment is important (Volpi et al., 2018; Cipollini et al., 2025), and pure storage capacities can be misleading with regard to buffering capacity. Consider for example a large reservoir located high up in the headwater catchment. This reservoir's storage capacity may be very large, even when normalised against the average discharge far down the valley. However, its buffering capacity for a flood peak may be limited if its inflow area only covers a small part of the total catchment and discharge generating area. Lumped aggregation of catchment characteristics is a common issue in large-sample datasets, as highlighted recently by Tarasova et al. (2024) and requires a re-consideration of the catchment characteristics typically used in these datasets (Gnann et al., 2021). Among water bodies, both lakes and reservoirs are poorly represented in many large-sample studies, however, in different ways. Catchments with lakes are usually included in large-sample studies, albeit often without explicitly considering the lakes or describing them in a very simplistic way by only using the catchment-wide surface cover percentage. In contrast, reservoir-regulated catchments are often excluded from studies because they are considered “unnatural”. The unequal treatment of lake- and reservoir-influenced catchments is surprising and inconsistent because their effects on flood peaks is very similar (Fig. 3). In this study, we have clearly shown that the presence of lakes and reservoirs can override other influences on analysis outcomes, such as the peak ratio. Therefore, we argue that both types of water bodies should be considered in large-sample analyses, which aim to reveal spatial patterns that should not be obscured by the presence or absence of water bodies within individual catchments.
4.3 Limitations
We use the contributing area percentage as a simple indicator for the catchment fraction above water bodies. While this indicator proves to be the most important predictor for the peak ratio in our random forest model (Fig. 5), it also has its limitations. As can been seen in Fig. 4, there are some catchment outliers with a catchment size in the range of 200–2000 km2, which do not have a high peak ratio despite having a high fraction above water bodies. These catchments have small hydropower reservoirs with very limited storage potential. Hence, they cannot provide much flood protection, despite the reservoirs receiving a large fraction of the catchments' streamflow. This suggests that it is advisable to consider some additional characteristics, such as active storage capacity, to assess the potential buffering capacity of water bodies for flood peaks.
An alternative approach to quantify the influence of water bodies on flood peaks is the FARL index, which considers both, the inflow catchment of each water body and its storage potential, approximated by the area of the water body (Bayliss, 1999). Cipollini et al. (2022) have shown a weak performance of the FARL index when the ratio of the water body area to the inflow catchment is small and it's attenuation capacity is underrepresented. Such behavior is often found in Alpine catchments, where reservoirs have a larger depth to area ratio than for example in the UK where FARL was developed. Hence, we did not use this index in this study because Switzerland has many deep Alpine reservoirs for which the lake area is potentially not very indicative of its storage potential.
In this study, we used a sample of 183 catchments in Switzerland, which leads to some limitations regarding the generalizability of our results. Due to the geography of Switzerland, this dataset does not contain any large catchments that are not strongly influenced by water bodies. The largest catchments are located downstream of Lake Geneva and Lake Constance, which are two large lakes with significant flood peak attenuation. This makes it challenging to determine the exact impact of factors such as catchment area and contributing area percentage on the peak ratio, as the two samples of catchments with strong and weak water body influence do not cover the same range of catchment sizes. While this may affect the absolute quantification of our results, we do not believe that it affects the general pattern of the increase in peak ratio with catchment area, nor the substantial effects of water bodies on the attenuation of flood peaks within catchments of all sizes.
In this study, we have demonstrated that the dampening effect of water bodies (lakes and reservoirs) differs substantially between daily flood peaks and flood peaks observed on an hourly or sub-hourly (15 min) timescale. It is much stronger for flood peaks observed in high-resolution records, leading to strong similarities between daily and sub-daily flood peaks downstream of reservoirs. A particularly strong dampening effect and alignment between hourly and daily flood peaks is observed when a water body's catchment area accounts for more than 60 % of the respective river catchment area. This implies that daily flood peaks are a good proxy for hourly peaks in regulated catchments, especially when they are strongly regulated. This is even the case for small catchments that usually show sub-daily flood peaks clearly distinct from daily peaks. This suggests that information on the catchment area influenced by water bodies – information that can be derived even for large-sample studies where detailed information on water body regulation is lacking – can help improve the estimation of sub-daily flood peaks.
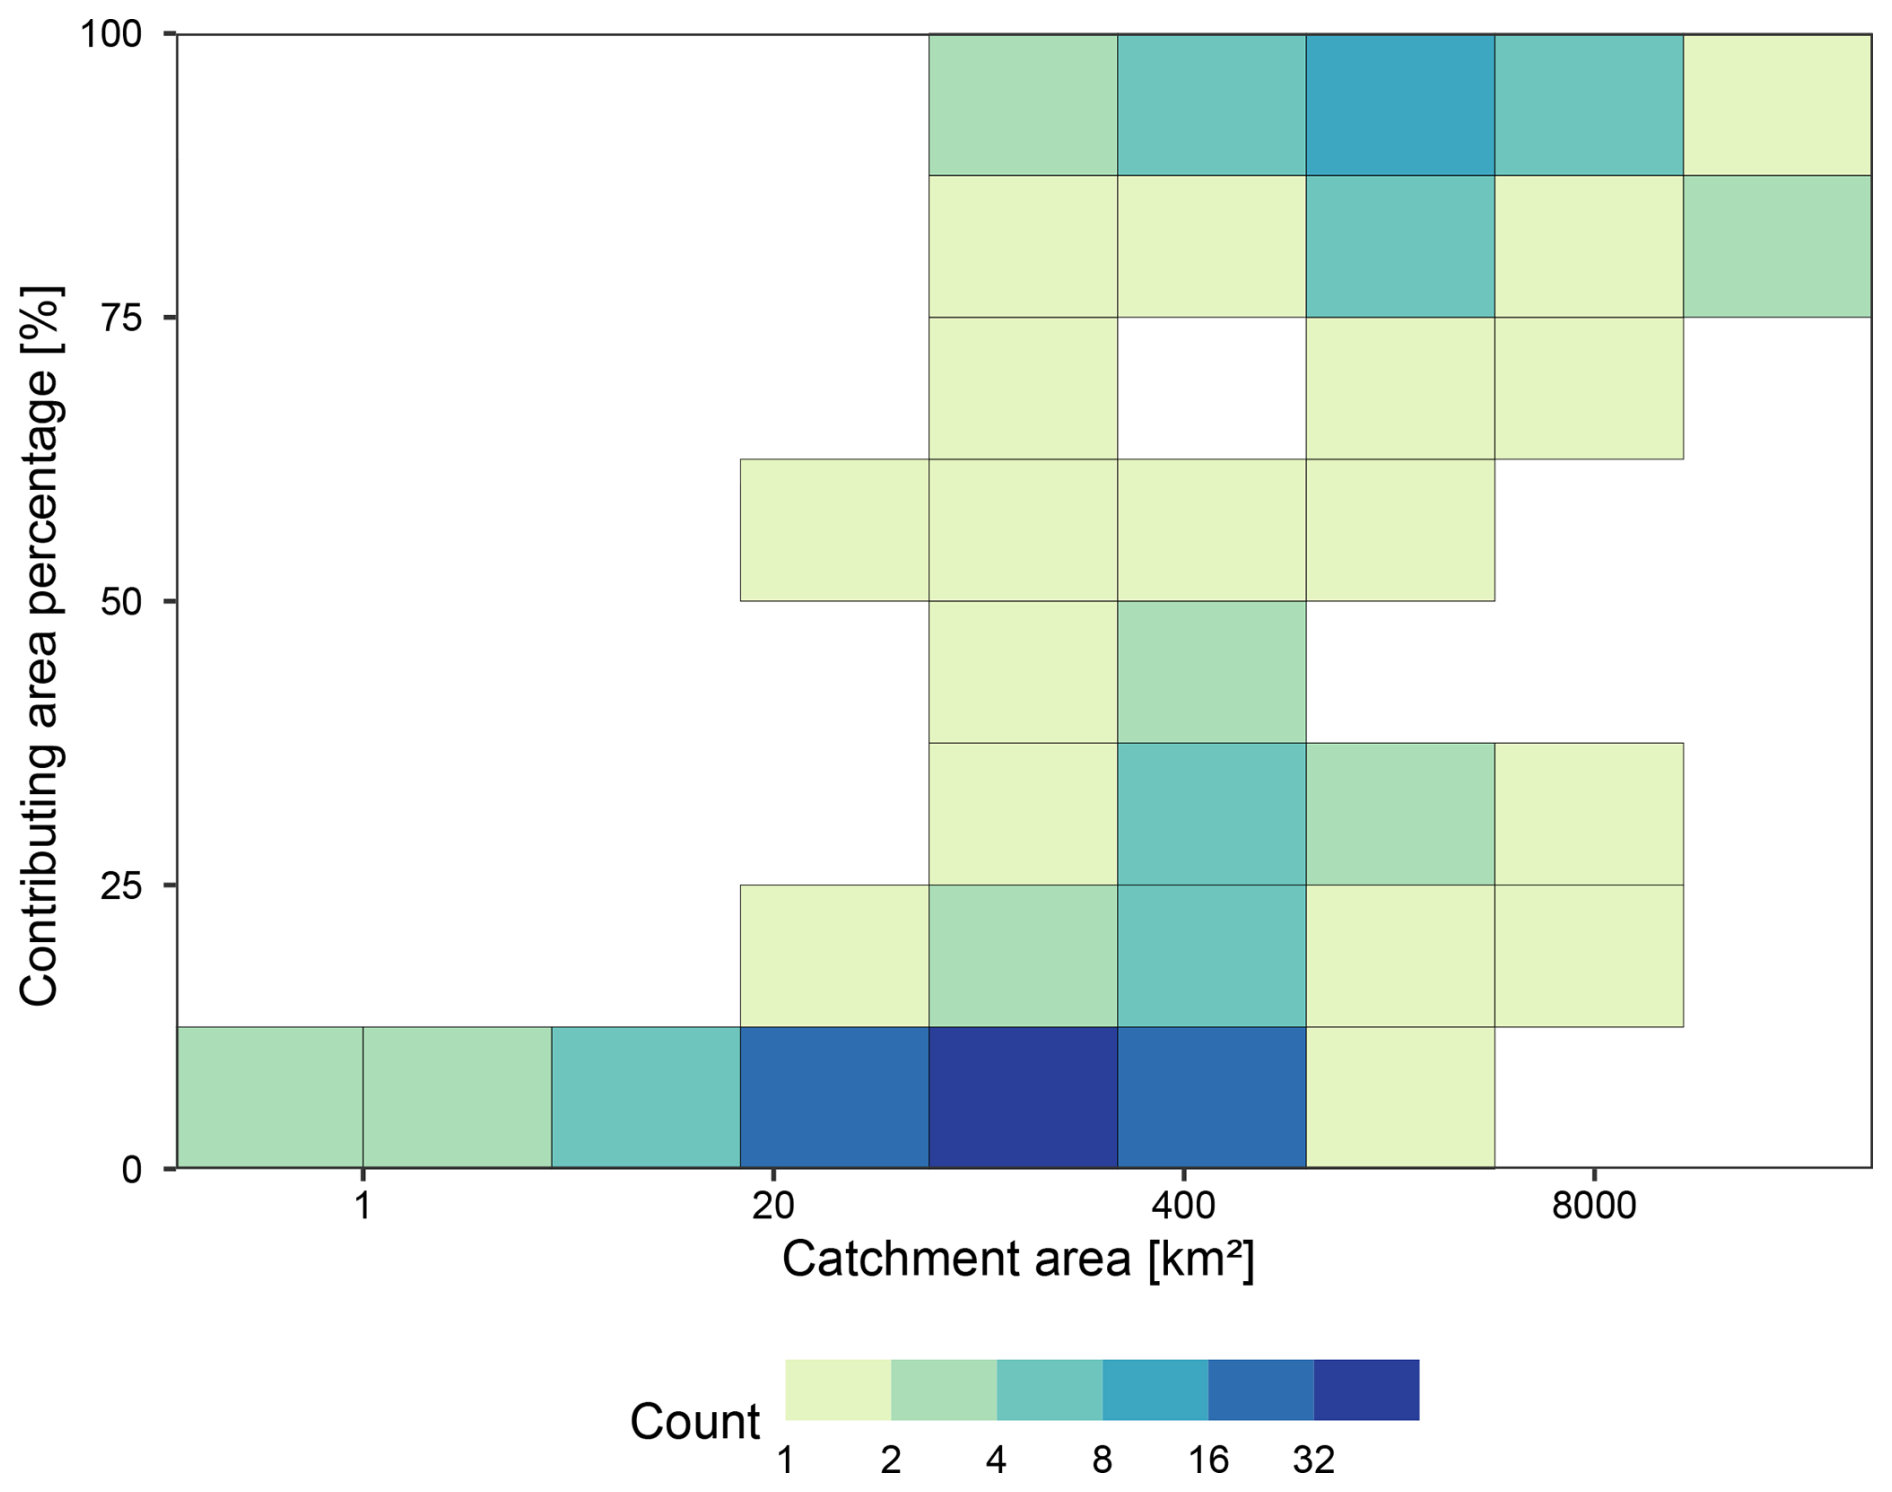
Figure A1Catchments analysed in the large-sample; grouped by catchment area and contributing area percentage.
Table A1Lakes outside of Switzerland included in the large-sample analysis, together with their estimated catchment sizes.
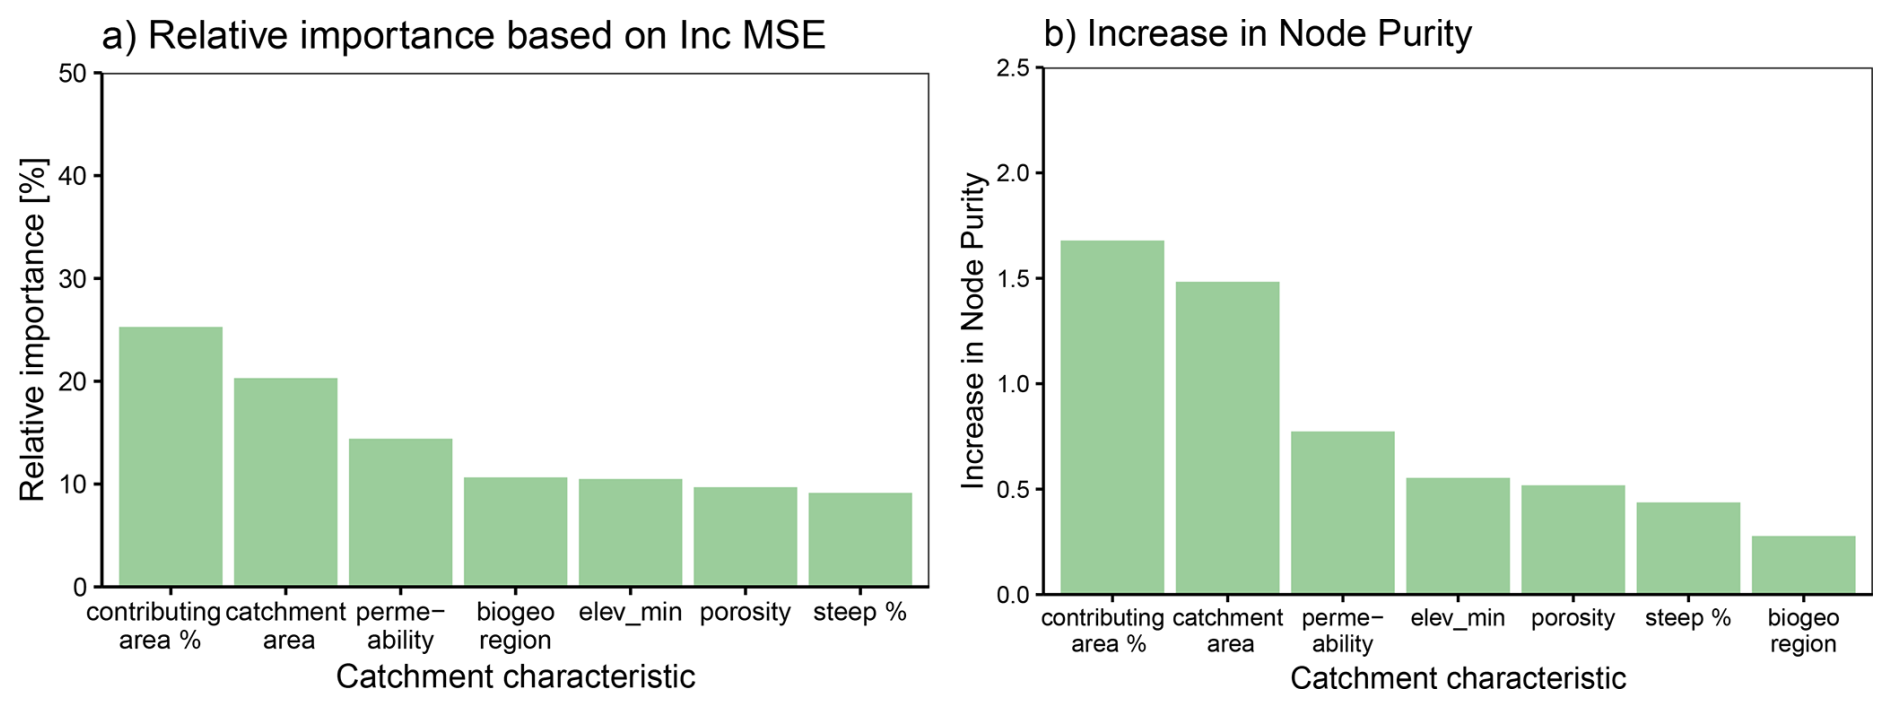
Figure A2Variable importance of different catchment characteristics for predicting the D H ratio.
The streamflow data for the large-sample approach is available from the Swiss Federal Office for the Environment (FOEN) and so are the water body catchment areas (https://data.geo.admin.ch/browser/index.html#/collections/ch.bafu.wasser-einzugsgebietsgliederung/items/wasser-einzugsgebietsgliederung?.language=en, 2021, FOEN, 2021). The data for the local case studies can be downloaded from https://www.gkd.bayern.de/de/ (LfU – Bayerisches Landesamt für Umwelt, 2025). The identified flood peaks and the additionally outlined water body catchment areas (Table A1) are available via HydroShare: https://doi.org/10.4211/hs.5bb63026c64548819185e9f201b57af7 (Götte and Brunner, 2026).
JG developed the general idea and conceptualized the study with MIB. JG compiled the data and performed the analyses. The first draft of the paper, including all of the figures, was written by JG with contributions from PA and MIB. MIB and PA revised and edited the document.
At least one of the (co-)authors is a member of the editorial board of Hydrology and Earth System Sciences. The peer-review process was guided by an independent editor, and the authors also have no other competing interests to declare.
Publisher's note: Copernicus Publications remains neutral with regard to jurisdictional claims made in the text, published maps, institutional affiliations, or any other geographical representation in this paper. The authors bear the ultimate responsibility for providing appropriate place names. Views expressed in the text are those of the authors and do not necessarily reflect the views of the publisher.
We thank Bailey Anderson and Massimiliano Zappa for fruitful discussions, the German Research Foundation DFG for funding this study through project “Trockenheits- und Hochwasserstatistiken in regulierten Einzugsgebieten: eine multivariate Perspektive (DFStaR)” (grant no. 465747089 granted to MIB), and the three reviewers for their constructive feedback.
This research has been supported by the Deutsche Forschungsgemeinschaft (grant no. 465747089).
This paper was edited by Damien Bouffard and reviewed by three anonymous referees.
Assani, A. A., Stichelbout, E., Roy, A. G., and Petit, F.: Comparison of impacts of dams on the annual maximum flow characteristics in three regulated hydrologic regimes in Québec (Canada), Hydrol. Process., 20, 3485–3501, https://doi.org/10.1002/hyp.6150, 2006. a
Ayalew, T., Krajewski, W., Mantilla, R., and Zimmerman, D.: Can floods in large river basins be predicted from floods observed in small subbasins?, J. Flood Risk Manage., 11, 331–338, https://doi.org/10.1111/jfr3.12327, 2017. a
Bartens, A., Shehu, B., and Haberlandt, U.: Flood frequency analysis using mean daily flows vs. instantaneous peak flows, Hydrol. Earth Syst. Sci., 28, 1687–1709, https://doi.org/10.5194/hess-28-1687-2024, 2024. a, b, c, d, e, f
Batalla, R. J., Gómez, C. M., and Kondolf, G.: Reservoir-induced hydrological changes in the Ebro River basin (NE Spain), J. Hydrol., 290, 117–136, https://doi.org/10.1016/j.jhydrol.2003.12.002, 2004. a
Bayliss, A. C.: Catchment descriptors, in: Flood Estimation Handbook, vol. 5, Institute of Hydrology, Wallingford, UK, ISBN 978-1-906698-05-8, 1999. a, b, c
Blöschl, G.: Flood generation: process patterns from the raindrop to the ocean, Hydrol. Earth Syst. Sci., 26, 2469–2480, https://doi.org/10.5194/hess-26-2469-2022, 2022. a
Breiman, L.: Random Forests, Mach. Learn., 45, 5–32, https://doi.org/10.1023/A:1010933404324, 2001. a
Brunner, M. I.: Reservoir regulation affects droughts and floods at local and regional scales, Environ. Res. Lett., 16, 124016, https://doi.org/10.1088/1748-9326/ac36f6, 2021. a
Brunner, M. I. and Fischer, S.: Snow-influenced floods are more strongly connected in space than purely rainfall-driven floods, Environ. Res. Lett., 17, 104038, https://doi.org/10.1088/1748-9326/ac948f, 2022. a
Canuti, P. and Moisello, U.: Relationship between the yearly maxima of peak and daily discharge for some basins in Tuscany, Hydrol. Sci. J., 27, 111–128, https://doi.org/10.1080/02626668209491094, 1982. a, b
Cipollini, S., Fiori, A., and Volpi, E.: A new physically based index to quantify the impact of multiple reservoirs on flood frequency at the catchment scale based on the concept of equivalent reservoir, Water Resour. Res., 58, https://doi.org/10.1029/2021WR031470, 2022. a
Cipollini, S., Pomarico, I., Volpi, E., and Fiori, A.: Limited role of Italy's large reservoirs in flood mitigation on a national scale, Geophys. Res. Lett., 52, e2025GL115861, https://doi.org/10.1029/2025GL115861, 2025. a, b, c, d
Coxon, G., Addor, N., Bloomfield, J. P., Freer, J., Fry, M., Hannaford, J., Howden, N. J. K., Lane, R., Lewis, M., Robinson, E. L., Wagener, T., and Woods, R.: CAMELS-GB: hydrometeorological time series and landscape attributes for 671 catchments in Great Britain, Earth Syst. Sci. Data, 12, 2459–2483, https://doi.org/10.5194/essd-12-2459-2020, 2020. a
Ding, J. and Haberlandt, U.: Estimation of instantaneous peak flow from maximum mean daily flow by regionalization of catchment model parameters, Hydrol. Process., 31, 612–626, https://doi.org/10.1002/hyp.11053, 2017. a
Ding, J., Haberlandt, U., and Dietrich, J.: Estimation of the instantaneous peak flow from maximum daily flow: a comparison of three methods, Hydrol. Res., 46, 671–688, https://doi.org/10.2166/nh.2014.085, 2015. a, b, c
Ding, J., Wallner, M., Müller, H., and Haberlandt, U.: Estimation of instantaneous peak flows from maximum mean daily flows using the HBV hydrological model, Hydrol. Process., 30, 1431–1448, https://doi.org/10.1002/hyp.10725, 2016. a
Ellis, W. and Gray, D.: Interrelationships between the peak instantaneous and average daily discharges of small prairie streams, Canadian Agricultural Engineering, 2–5, https://research-groups.usask.ca/hydrology/documents/pubs/papers/ellis_gray_1966.pdf (last access: 6 October 2025), 1966. a, b, c, d
Fill, H. D. and Steiner, A. A.: Estimating instantaneous peak flow from mean daily flow data, J. Hydrol. Eng., 8, 365–369, https://doi.org/10.1061/(ASCE)1084-0699(2003)8:6(365), 2003. a
FOEN: Topographical catchment areas of Swiss waterbodies, FOEN [data set], https://data.geo.admin.ch/browser/index.html#/collections/ch.bafu.wasser-einzugsgebietsgliederung/items/wasser-einzugsgebietsgliederung?.language=en (last access: 26 August 2025), 2021. a, b, c
Friedman, J. H.: Greedy function approximation: A gradient boosting machine, Ann. Stat., 29, https://doi.org/10.1214/aos/1013203451, 2001. a
Fuller, W. E.: Flood Flows, T. Am. Soc. Civ. Eng., 77, 564–617, https://doi.org/10.1061/taceat.0002552, 1914. a, b, c, d
Gnann, S. J., McMillan, H. K., Woods, R. A., and Howden, N. J. K.: Including regional knowledge improves baseflow signature predictions in large sample hydrology, Water Resour. Res., 57, e2020WR028354, https://doi.org/10.1029/2020WR028354, 2021. a
Götte, J. and Brunner, M.: Daily and subdaily flood peaks in Switzerland, HydroShare [data set], https://doi.org/10.4211/hs.5bb63026c64548819185e9f201b57af7 (last access: 25 September 2026), 2026. a
Götte, J., Schlemper, C., Zappa, M., and Brunner, M. I.: How do reservoirs influence streamflow extremes? Insights from a large-sample analysis in the Alpine Region, Environ. Res.-Water, 1, https://doi.org/10.1088/3033-4942/ae0151, 2025. a, b, c
Greenwell, B. M.: pdp: Partial Dependence Plots, Comprehensive R Archive Network, 0.8.2, https://doi.org/10.32614/CRAN.package.pdp, 2016. a
Gupta, V. K., Castro, S. L., and Over, T. M.: On scaling exponents of spatial peak flows from rainfall and river network geometry, J. Hydrol., 187, 81–104, https://doi.org/10.1016/S0022-1694(96)03088-0, 1996. a
Gupta, V. K., Mantilla, R., Troutman, B. M., Dawdy, D., and Krajewski, W. F.: Generalizing a nonlinear geophysical flood theory to medium‐sized river networks, Geophys. Res. Lett., 37, 2009GL041540, https://doi.org/10.1029/2009GL041540, 2010. a
Hayes, N. M., Deemer, B. R., Corman, J. R., Razavi, N. R., and Strock, K. E.: Key differences between lakes and reservoirs modify climate signals: A case for a new conceptual model, Limnol. Oceanogr. Lett., 2, 47–62, https://doi.org/10.1002/lol2.10036, 2017. a
Höge, M., Kauzlaric, M., Siber, R., Schönenberger, U., Horton, P., Schwanbeck, J., Floriancic, M. G., Viviroli, D., Wilhelm, S., Sikorska-Senoner, A. E., Addor, N., Brunner, M., Pool, S., Zappa, M., and Fenicia, F.: CAMELS-CH: hydro-meteorological time series and landscape attributes for 331 catchments in hydrologic Switzerland, Earth Syst. Sci. Data, 15, 5755–5784, https://doi.org/10.5194/essd-15-5755-2023, 2023. a, b, c, d
Kevic, M., Ortlepp, J., Mürle, U., and Robinson, C. T.: Effects of experimental floods in two rivers with contrasting valley morphologies, Fund. Appl. Limnol., 192, 145–160, https://doi.org/10.1127/fal/2018/1177, 2018. a
Leach, J. A. and Laudon, H.: Headwater lakes and their influence on downstream discharge, Limnol. Oceanogr. Lett., 4, 105–112, https://doi.org/10.1002/lol2.10110, 2019. a, b, c, d
Lehner, B. and Grill, G.: Global river hydrography and network routing: baseline data and new approaches to study the world's large river systems, Hydrol. Process., 27, 2171–2186, https://doi.org/10.1002/hyp.9740, 2013. a
LfU – Bayerisches Landesamt für Umwelt: Abfluss, https://www.gkd.bayern.de/de/ (last access: 7 July 2025), 2025. a, b
Liaw, A. and Wiener, M.: Classification and regression by randomForest, R News, 2, 18–22, 2002. a
Loritz, R., Dolich, A., Acuña Espinoza, E., Ebeling, P., Guse, B., Götte, J., Hassler, S. K., Hauffe, C., Heidbüchel, I., Kiesel, J., Mälicke, M., Müller-Thomy, H., Stölzle, M., and Tarasova, L.: CAMELS-DE: hydro-meteorological time series and attributes for 1582 catchments in Germany, Earth Syst. Sci. Data, 16, 5625–5642, https://doi.org/10.5194/essd-16-5625-2024, 2024. a, b
Medhi, H. and Tripathi, S.: On identifying relationships between the flood scaling exponent and basin attributes, Chaos, 25, 075405, https://doi.org/10.1063/1.4916378, 2015. a
Mei, X., Van Gelder, P. H. A. J. M., Dai, Z., and Tang, Z.: Impact of dams on flood occurrence of selected rivers in the United States, Front. Earth Sci., 11, 268–282, https://doi.org/10.1007/s11707-016-0592-1, 2017. a
Merz, R. and Blöschl, G.: Flood frequency hydrology: 1. Temporal, spatial, and causal expansion of information, Water Resour. Res., 44, 2007WR006744, https://doi.org/10.1029/2007WR006744, 2008. a
Quin, A. and Destouni, G.: Large‐scale comparison of flow‐variability dampening by lakes and wetlands in the landscape, Land Degrad. Dev., 29, 3617–3627, https://doi.org/10.1002/ldr.3101, 2018. a
Robinson, C. T., Siebers, A. R., and Ortlepp, J.: Long-term ecological responses of the River Spöl to experimental floods, Freshwater Sci., 37, 433–447, https://doi.org/10.1086/699481, 2018. a
Salwey, S., Coxon, G., Pianosi, F., Singer, M. B., and Hutton, C.: National-scale detection of reservoir impacts through hydrological signatures, Water Resour. Res., 59, e2022WR033893, https://doi.org/10.1029/2022WR033893, 2023. a, b
Sikorska-Senoner, A. E. and Seibert, J.: Flood-type trend analysis for alpine catchments, Hydrol. Sci. J., 65, 1281–1299, https://doi.org/10.1080/02626667.2020.1749761, 2020. a
Speckhann, G. A., Kreibich, H., and Merz, B.: Inventory of dams in Germany, Earth Syst. Sci. Data, 13, 731–740, https://doi.org/10.5194/essd-13-731-2021, 2021. a
Stecher, G. and Herrnegger, M.: Impact of hydropower reservoirs on floods: evidence from large river basins in Austria, Hydrol. Sci. J., 67, 2082–2099, https://doi.org/10.1080/02626667.2022.2130332, 2022. a, b
Stephenson, A. G.: evd: Extreme value distributions, R News, 2, 0, https://CRAN.R-project.org/doc/Rnews/ (last access: 9 February 2025), 2002. a
Tarasova, L., Gnann, S., Yang, S., Hartmann, A., and Wagener, T.: Catchment characterization: Current descriptors, knowledge gaps and future opportunities, Earth-Sci. Rev., 252, 104739, https://doi.org/10.1016/j.earscirev.2024.104739, 2024. a, b
Volpi, E., Di Lazzaro, M., Bertola, M., Viglione, A., and Fiori, A.: Reservoir effects on flood peak discharge at the catchment scale, Water Resour. Res., 54, 9623–9636, https://doi.org/10.1029/2018WR023866, 2018. a, b, c, d
Wantzen, K. M., Junk, W. J., and Rothhaupt, K.-O.: An extension of the floodpulse concept (FPC) for lakes, Hydrobiologia, 613, 151–170, https://doi.org/10.1007/s10750-008-9480-3, 2008. a
Xiong, B., Xiong, L., Xia, J., Xu, C.-Y., Jiang, C., and Du, T.: Assessing the impacts of reservoirs on downstream flood frequency by coupling the effect of scheduling-related multivariate rainfall with an indicator of reservoir effects, Hydrol. Earth Syst. Sci., 23, 4453–4470, https://doi.org/10.5194/hess-23-4453-2019, 2019. a