
the Creative Commons Attribution 4.0 License.
the Creative Commons Attribution 4.0 License.
 | 25 Sep 2026
Integrating coupled surface–subsurface modelling and field measurements in a degraded fen: water-balance dynamics and a framework for evaluating rewetting measures
Nariman Mahmoodi

Christoph Merz
Jürgen Pickert
Ottfried Dietrich
Peatlands play a crucial role in regional water balance and carbon dynamics but are often degraded due to drainage and agricultural use. In Germany, many drained peatlands have shifted from carbon sinks to CO2 sources. Rewetting these ecosystems is therefore essential to restore their ecological functions and mitigate greenhouse gas emissions. However, effective rewetting requires a detailed understanding of peatland hydrology and its response to climatic and management conditions. To address this need, this study employs a fully coupled surface–subsurface hydrological model (HydroGeoSphere) to analyze the complex hydrological functioning of a typical degraded fen peatland site (11.6 ha) in Brandenburg, Germany. The model-based quantification of hydrological fluxes is basis for assessing peatland vulnerability to climate variability and land use while providing a hydrological baseline for future evaluation of rewetting strategies. The studied peatland is connected to a regional aquifer and intensively drained by a system of ditches. Simulations used daily meteorological inputs and detailed field measurements from 2015 to 2023. Evapotranspiration (ET) was parameterized using field-measured vegetation dynamics (seasonal leaf area index and management schedules), while measured ditch water levels served as hydraulic boundary conditions. The site was spatially divided into different management units with distinct vegetation parameters. The peat profile was represented by two layers (a 0.3 m highly degraded surface peat overlying a 0.7 m less degraded layer) overlying sand (aquifer) and till (aquifer base). The model was evaluated from different angles against eddy covariance ET and groundwater table dynamics during a calibration period (2016–2020) and a validation period (2021–2023) using a multi-metric approach. The model successfully reproduced seasonal water-table fluctuations and ditch–peatland interactions, including ET-driven hydraulic gradient dynamics between summer and winter. Simulated ET closely matched eddy covariance measurements, with RMSE values of 64 mm yr−1, 10.2 mm month−1, and 1.01 mm d−1, and showed only minor biases during dry conditions, while over the year seasonal dynamics of ET were also well captured by the model. The model reproduced groundwater variations with sufficient accuracy, achieving KGE values of 0.80–0.85, NSE of 0.83–0.86, and RMSE of 0.15 m during calibration and validation. The analysis of seasonal and interannual water-storage changes showed pronounced shifts between hydrological surplus and deficit, demonstrating that drained fens are highly sensitive to evapotranspiration demand and prolonged drought. The modeling approach captured key hydrological processes with high robustness. The modelling framework provides a hydrological baseline and a basis for future assessment of peatland rewetting measures. These findings support ongoing restoration initiatives on drained peatlands in Europe.
- Article
(5774 KB) - Full-text XML
-
Supplement
(496 KB) - BibTeX
- EndNote


Peatlands rank among the most efficient terrestrial ecosystems for long-term carbon sequestration, holding nearly one-third of global soil carbon despite representing only about 3 % of the Earth's land surface. Around 10 % of Europe's land area, and approximately 5 % of Germany's land area are covered by peatlands (Page et al., 2011; Xu et al., 2018; Tanneberger et al., 2021; BMUV, 2022). The specific microclimatic conditions, organic-rich soils and high water tables within peatlands are the basis for a specific flora and fauna (Millar et al., 2018; Li et al., 2019). In Germany, peatlands have stored carbon amounts comparable to those in the country's forests. However, more than 90 % of these peatlands have been drained, and over 95 % are now considered degraded, primarily due to agricultural land use, making them significant sources of greenhouse gas emissions (Joosten et al., 2017; Tanneberger et al., 2021). The regional hydrological effects caused by peatland drainage are rarely quantified, despite their recognized importance for climate change mitigation and adaptation strategies. These drained ecosystems currently release an estimated 53 million tons of CO2-equivalents annually, corresponding to roughly 7 % of Germany's total anthropogenic emissions (BMUV, 2022). This hydrological degradation not only amplifies greenhouse gas emissions but also disrupts essential ecological functions. At the process level, biogeochemical cycles in peatlands are tightly linked to water-table dynamics which controls oxygen availability and drives organic matter decomposition (Tfaily et al., 2013; Khaledi et al., 2024). In addition to the carbon storage functions, peatlands play an essential role in regulating local and regional hydrological cycles. Some peatlands in Europe can help to maintain water tables, and to buffer hydrological extremes (Karimi et al., 2025). They influence groundwater discharge and streamflow dynamics through their water-retentive capacity. Despite the central role of water storage dynamics in controlling peatland functioning, quantitative assessments of seasonal and interannual storage change in peatlands remain rare (Bourgault et al., 2017). Most studies focus on water-table variability or individual flux components, while the full water-balance partitioning, including lateral exchanges with ditches and groundwater systems, has received limited attention. Besides drainage and land use, climate change, including rising temperatures and shifting precipitation patterns intensified peatland vulnerability. Simulations by McLaughlin and Packalen (2021) indicate that under severe warming scenarios, peatlands may lose a significant portion of their carbon sink capacity due to drying and enhanced peat decomposition. Swindles et al. (2025) demonstrate that higher summer temperatures across European peatlands increase decomposition and carbon release unless water tables are maintained near the surface, further highlighting the vulnerability of these systems under warming and water scarcity. Restoring the natural hydrological function of peatlands through rewetting has therefore become a central goal of environmental policy and research (Ekardt et al., 2020; Chen et al., 2023; Meyer-Jürshof et al., 2025).
Although climate variables, particularly precipitation, temperature and solar radiation (through evapotranspiration), are primary drivers of peatland hydrology, understanding and managing the hydrological behavior of drained and rewetted peatlands requires accurate, spatially explicit representations of surface–subsurface water interactions and boundary conditions of the water balance. However, modeling such ecosystems remains challenging due to several factors such as the high spatial variability in vegetation, water management and anthropogenic interventions (drainage, pumping, and water level regulators such as weir), complex feedback between evapotranspiration and shallow groundwater, seasonally shifting ditch–peatland interactions, and soil heterogeneity with compacted organic layers over mineral substrates. Recent lysimeter modeling in degraded peat has shown that ignoring such heterogeneity (e.g., by using unimodal parameterizations) leads to overestimation of water storage and dampened water-table dynamics, whereas dual-porosity representations better capture observed fluctuations (Davies et al., 2024). Modelling tools are essential for disentangling these drivers. Many previous studies have used statistical or conceptual models to relate water levels to meteorological variables (e.g., Okkonen and Klöve, 2010; Ballard, et al., 2011; Binet et al., 2013; Bertrand et al., 2021). While these models can predict typical seasonal fluctuations, they struggle to simulate extreme droughts or capture feedback among vegetation, soil hydraulics and surface water. Traditional physically based hydrological models often decouple surface and subsurface processes or oversimplify vegetation–atmosphere interactions, limiting their ability to simulate water dynamics in such complex settings (Paniconi and Putti, 2015). Hence, fully coupled surface–subsurface models are necessary to resolve the complex interactions governing peatland hydrology.
HydroGeoSphere (HGS) is a fully integrated, physically based model that simultaneously solves the three-dimensional Richards equation for variably saturated subsurface flow together with two-dimensional surface flow equations, enabling explicit representation of vertical heterogeneity, lateral exchanges with rivers or ditches, and spatially variable vegetation and management practices (Ala-aho et al., 2017; Hwang et al., 2018). Furthermore, HGS enables spatially distributed parameterization of vegetation and land cover, making it particularly suitable for peatlands where agricultural management practices such as mowing or grazing strongly influence evapotranspiration and soil moisture dynamics. Despite its strengths, HGS remains underutilized in peatland studies as its application requires long-term hydroclimatic data and high-resolution land use information for validation. Recently, Renaud et al. (2025), used a 2D cross-sectional transect to model water-table dynamics, which simplified the computational setup but inherently neglected three-dimensional fluxes parallel to the river. Moreover, vegetation parameters such as leaf-area index and root depth were not measured on site but derived from literature, so the model did not capture dynamic vegetation growth or land-management variations. By addressing these limitations through field-measured vegetation data and a fully parameterized 3D model setup, this study offers a more realistic simulation of peatland hydrological processes.
This study presents a coupled surface–subsurface hydrological model for a degraded fen peatland that provides a basis for future assessment of potential rewetting measures under different climatic and hydrological conditions. Our objectives are (i) providing optimized parametrization for a better understanding of peatland hydrological processes under different climate conditions and land management pressures (ii) considering all relevant water fluxes between groundwater, surface water and atmosphere within a fully-integrated modeling, and (iii) quantifying the specific contributions of precipitation, evapotranspiration, inflow, outflow and water storage change to the water balance of the peatland site. The insights support the design and adaptation of effective rewetting strategies in the context of a sustainable preservation of peatlands in the future.
2.1 Case Study
The study site represents a degraded fen peatland located near Paulinenaue in the federal state of Brandenburg, northeastern Germany (Fig. 1a). The peatland, including its surrounding drainage ditches, covers an area of approximately 11.6 ha. It has been extensively drained through a network of ditches that maintain water levels below the surface during the vegetation period for agricultural grassland production. The water levels and drainage rates in the ditches are controlled by small weirs.
The land cover is permanent grassland, composed primarily of a few grass species such Phalaris arundinacea, Elymus repens, Alopecurus pratensis, Poa spp., and Juncus spp., which were identified through botanical surveys. Vegetation dynamics and management patterns were characterized by in-situ Leaf Area Index (LAI) measurements collected seasonally from 2015 to 2020. The peatland is divided into eight management units, each with distinct mowing and grazing schedules (as an example, see Table S1 in Supplement, showing the management units and plant growth stages in year 2015). Groundwater levels inside and outside the study site have been recorded daily since 2015. Observations suggest that the peatland site and its surrounding groundwater are hydraulically connected to a larger regional aquifer system (Fig. 1c). An eddy covariance station in the middle of the study site has been operational since 2014 to measure land–atmosphere exchanges, including evapotranspiration (Fig. 1b).

Figure 1Location of the study site in northeastern Germany (a), and positions of the eddy covariance towers, piezometers, and ditch water level measurement within the site, and the order of management units (b), groundwater fluctuations in and outside of the study site since 2015 (c). Background satellite imagery: © Microsoft Bing Maps.
At the surface, the site is covered by a peat sequence consisting of a more compact, strongly decomposed upper layer underlain by a thicker layer of less degraded peat, both of which play a central role in regulating water storage and flow (Fig. 3). Beneath the peat, the topsoil consists of silt to fine sand, followed by a saturated zone of medium to coarse sand with an average thickness of about 10 m. According to the Brandenburg geological database (Geologischer Dienst, Landesamt für Bergbau, Geologie und Rohstoffe Brandenburg), the geological base (bedrock) is composed of till with clay lenses, which forms the lower hydrological boundary (Fig. 5).
Daily values of precipitation, net radiation, soil heat flux, temperature, wind speed, and relative air humidity were measured as part of the station eddy covariance2 at the study site (Fig. 1b, eastern site). The data were used for calculating the potential evapotranspiration (ET0) with the FAO Penman–Monteith method (Allen et al., 1998). Annual precipitation over the study period (2015–2023) ranged from a minimum of 299 mm in 2018 to a maximum of 640 mm in 2017 (Fig. 2). Annual ET0 averaged is roughly 710 mm, with the highest value of 829 mm in 2018 and the lowest of 594 mm in 2021 (Fig. 2). The pronounced water deficit in dry years (e.g., 2018, 2019, 2020, and 2022) reflects meteorological drought conditions where ET0 substantially exceeded precipitation during the growing season. Such deficits are known to promote peat desiccation, increase oxidation, and accelerate carbon losses. These climatic patterns are particularly critical for the hydrology of drained peatlands, as summer deficits exacerbate groundwater drawdown.

Figure 2Annual precipitation and potential evapotranspiration (ET0) highlighting water deficit.

Figure 3Cross-section of the model domain showing the main geological layers (Photo: © Axel Behrendt).
2.2 Eddy Covariance Tower
The eddy station on the study site (eddy covariance1 in Fig. 1b) is equipped with an Irgason CO2 H2O open path analyser (Campbell) for measuring the wind components and the water content of the air with a frequency of 10 Hz. A CNR4 sensor (Kipp & Zonen) measured the shortwave and longwave downwell and upwell radiation components so that the net radiation can be calculated as the difference between the components. Three soil heat flux plates (Huxeflux) measured the ground heat flux at 8 cm depth. The heat stored in the layer above the heat flux plates was calculated on the basis of the measured soil temperature and volumetric water content above the plates and soil properties (organic matter content, volumetric heat capacity) by the approach of de Vries (1963) described in Liebethal and Foken (2006). All data were stored on a CR3000 data logger (Campbell).
The software package TK3 was used for the post-processing of the 10 Hz raw data (Mauder and Foken, 2015). All data were checked for their quality and validity following the Foken evaluation system (Foken and Wichura, 1996; Foken, 2008a). The data were aggregated to 30 min values. Only data sets fulfilling the quality requirements were used in the following steps of the data processing. The gap of the energy balance as sum of net radiation, soil heat flux, latent and sensible heat flux was closed using the Bowen ratio method (Foken, 2008b; Foken et al., 2006; Mauder et al., 2018; Twine et al., 2000). At the end of the post-processing the data were aggregated to daily values and the actual evapotranspiration was calculated based on the latent heat flux. Eddy covariance estimates of evapotranspiration are subject to uncertainties arising from instrument accuracy, energy-balance closure issues, footprint variability, and gap-filling procedures (Foken, 2008b; Mauder et al., 2018). Data gaps were filled with data from a neighboring station (eddy covariance2 in Fig. 1b). The data of the neighboring station were processed in the same way as the data of station 1.
2.3 Leaf Area Index (LAI)
Leaf Area Index (LAI) measurements were collected in the study area using a SunScan Canopy Analysis System (Delta-T Devices, UK) at multiple locations within each of the eight management units. Measurements were taken across different months and seasons between 2015 and 2020 to capture seasonal vegetation dynamics and the influence of distinct management practices such as mowing and grazing. The resulting LAI time series provided spatially and temporally distributed information on canopy development, which was directly integrated into the HGS model to parameterize vegetation-dependent processes such as evapotranspiration and interception. LAI is a key variable in peatland hydrological modeling because it governs canopy resistance, influences transpiration rates, and modulates the partitioning of energy fluxes between latent and sensible heat. For the simulation period 2021–2023, when direct LAI measurements were unavailable, management schedules and seasonal patterns from the corresponding earlier years were assumed, based on consistent agricultural practices at the site.
2.4 Hydrologic Numerical Model
The HGS model was used to develop a fully integrated, physically based hydrological model of the fen peatland. HGS solves the three-dimensional Richards equation for variably saturated porous media together with the diffusion-wave approximation of the Saint-Venant equations for surface water flow, using a control-volume finite element approach (Therrien et al., 2010). This integration allows a dynamic representation of surface–subsurface exchanges, interception, infiltration, evapotranspiration, and lateral groundwater–ditch fluxes. The model domain represents the degraded fen peatland and its surrounding drainage ditches (Fig. 5). The vertical domain extends to a depth of nearly 12 m, representing three geological layers: (i) two peat layers showing different degrees of peat degradation (around 1 m), (ii) a middle to coarse sand layer (saturated/unsaturated), and (iii) glacial till with clay lenses as the geological base. The model mesh consisted of 2490 nodes and 4523 triangular elements with refined vertical discretization near the surface. Mesh quality indicators confirmed robustness, with aspect ratios (mean 1.6), edge ratios (mean 1.2), minimum internal angle (mean 30.8°, SD 2.6°) and maximum angle (mean 70.0°, SD 4.7°). Avoiding high aspect ratio and extreme angles is critical for numerical convergence in finite element modeling. At the land surface, daily precipitation and potential evapotranspiration (ET0) were applied as Neumann fluxes. Along the perimeter of the model domain, observed ditch water levels were imposed as fixed head (Dirichlet boundary) to represent the regionally controlled drainage network. Missing ditch-water-level observations were filled using linear interpolation between the nearest available observations. A no-flow condition was applied at the till–clay base, which acts as the lower geological boundary. To establish realistic initial states, the year 2015 was used as a spin-up phase to bring the model to hydrostatic equilibrium before the analysis period starts. Boundary and initial conditions are summarized in Table 1.
2.5 Hydraulic Properties of Peat Layers
Peat soils' hydraulic conditions differ markedly from mineral soils due to their high organic content, large pore space, and variable degree of decomposition. Intact peat typically has very high porosity and strong water-holding capacity, but drainage and agriculture use cause compaction and oxidation, which reduce porosity and saturated hydraulic conductivity. The soil profile in Paulinenaue is represented by two peat layers with contrasting degrees of degradation (Fig. 3). The upper degraded peat (≈ 30 cm depth) was parameterized with a lower porosity (θs=0.70) and reduced saturated conductivity ( m d−1; Kz=0.1 m d−1), reflecting compaction and reduced vertical flow pathways (Fig. 3). A relatively steep van Genuchten α (1.5 m−1) was applied to capture its rapid desaturation when the water table drops. In contrast, the less degraded lower peat layer was assigned a higher porosity (θs = 0.80) and higher conductivity ( m d−1; Kz=0.3 m d−1), consistent with its fibrous structure and larger pores. The van Genuchten α (0.75 m−1) and β (1.7) values represent its higher water retention capacity, keeping water available under moderate suctions (Fig. 4, ranges based on Wallor et al., 2018a, b; Liu and Lennartz, 2019; Renaud et al., 2025). Hydraulic properties of the peat layers are summarized in Table 2.
Table 1Boundary and initial conditions applied in the HydroGeoSphere model.

Table 2Peat hydraulic properties.

K: Hydraulic conductivity; Θs: Porosity; α: Van Genuchten parameter; β: Van Genuchten parameter.

Figure 4Soil water retention curves for upper degraded peat (α = 1.5, β = 1.2) and lower less degraded peat (α = 0.75, β = 1.7).
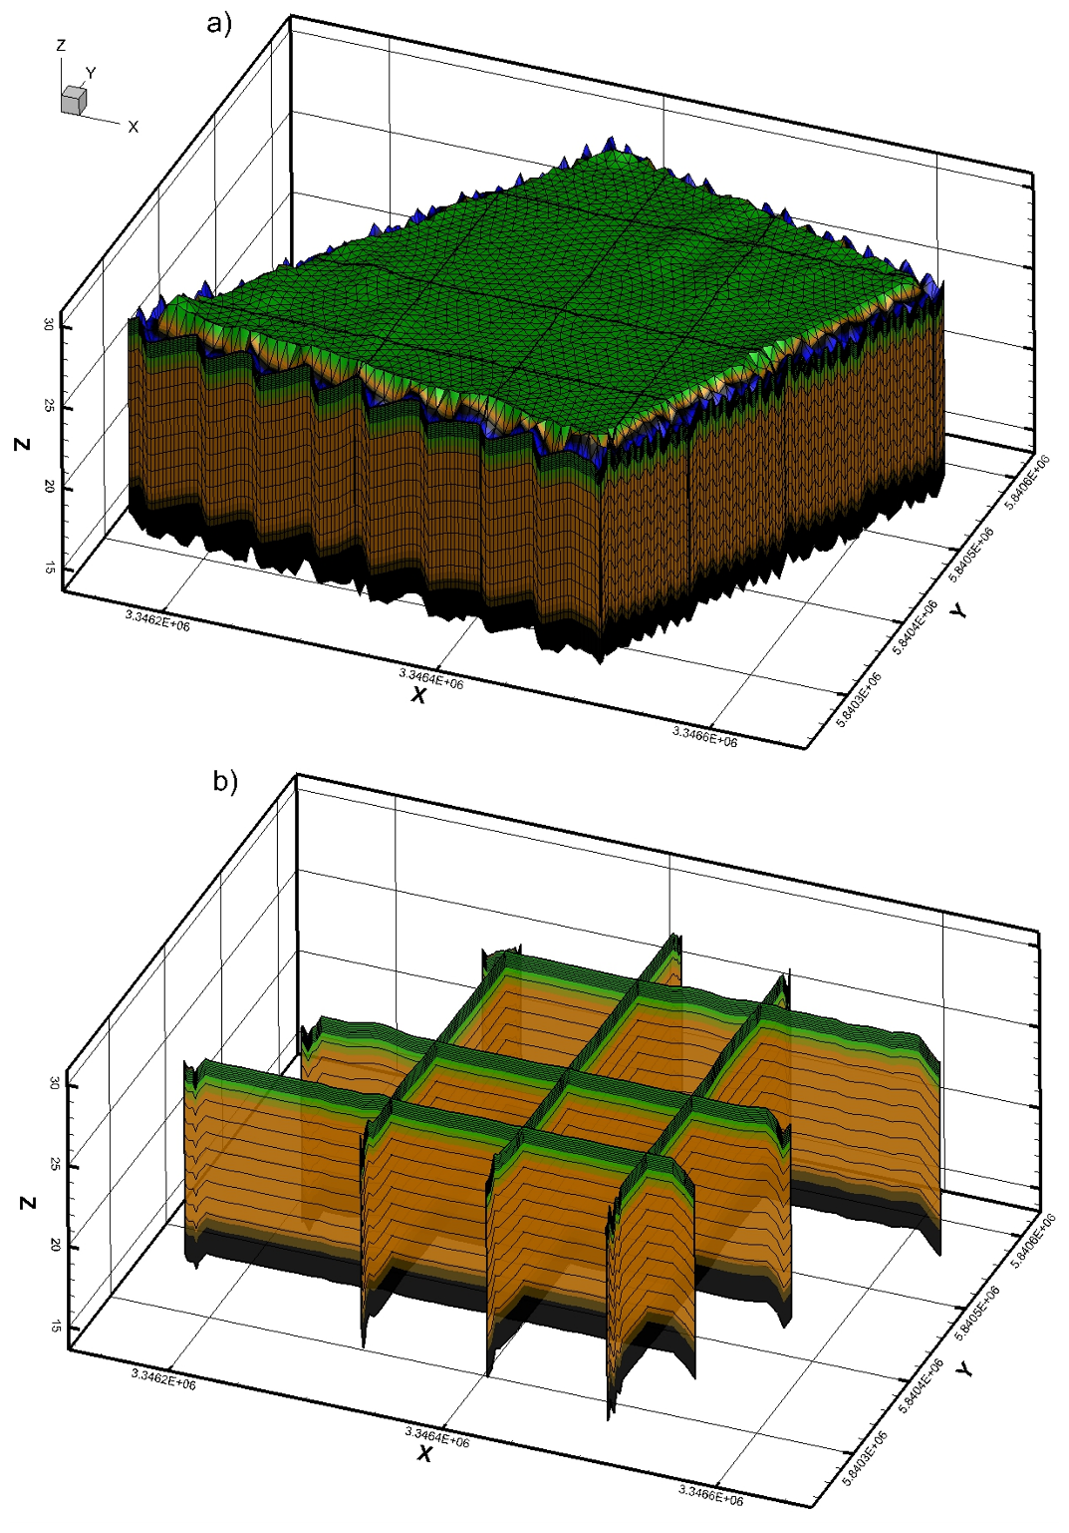
Figure 53D view of the HydroGeoSphere model domain. (a) Subset of the irregular triangular surface mesh representing the peatland topography, with colors indicating layers of different hydraulic properties. (b) Cross-sectional view of the model layers illustrating the internal mesh and geological structure.
2.6 Evapotranspiration Parameterization
Evapotranspiration in the model is represented through parameterizations for transpiration, evaporation, and interception processes. The evapotranspiration parameterization is summarized in Table 3. Transpiration was governed by three fitting constants (C1–C3) that control the ratio of actual to potential evapotranspiration () following the Kristensen and Jensen (1975) framework. With C1 = 0.4 and C2 = 0.10, increases linearly with LAI from a baseline of 0.10 and reaches 1.0 at LAI ≈2.3–2.5. Although the observed seasonal maximum LAI in the fen grassland is around 7, this parameterization reflects the assumption that full ET0 is typically achieved at moderate canopy densities and further increases in LAI do not substantially raise transpiration. C3 = 2.0 defines the soil moisture stress response, producing a gradual increase in between the wilting point (θ = 0.1) and field capacity (θ = 0.4), so that transpiration is reduced under drought but recovers smoothly after rewetting (Fig. 6). Transpiration limiting saturations were set to 0.1 (wilting point), 0.4 (field capacity), 0.95 (oxic limit), and 1.0 (anoxic limit), reflecting the ability of fen grasses to remain physiologically active in wet soils but to become constrained under both drought and oxygen stress. Evaporation limiting saturations were 0.1 (minimum) and 0.4 (maximum). Thus, evaporation is suppressed under dry conditions but occurs at full potential once the upper soil layer contains moisture. An evaporation depth of 0.40 m was specified, representing the active soil layer contributing to evaporation, while root uptake was parameterized with a maximum depth of 0.40 m and a quadratic decay function to simulate dense surface rooting and sparse rooting at depth. A canopy storage parameter of 0.01 and initial interception storage of 0.0 were included to account for short-term retention of precipitation on plant surfaces. This parameterization ensures that the model captures the interaction between vegetation structure, soil water availability, and atmospheric demand, while distinguishing between vegetation-driven transpiration, soil evaporation, and open-water evaporation from ditches.
Table 3Evapotranspiration parameterization used in the HydroGeoSphere model.

LAI: Leaf Area Index; ET: Evapotranspiration; AET: Actual Evaporation; ET0: Potential Evaporation; FC: Field Capacity.

Figure 6Reduction functions for used in HydroGeoSphere with C1 = 0.4, C2 = 0.10 and C3 = 2.0. Left: effect of LAI; Right: soil-moisture stress between wilting point (θ = 0.1) and field capacity (θ = 0.4).
2.7 Model calibration and validation
The HGS model was calibrated against observed groundwater levels and eddy covariance evapotranspiration measurements using an iterative manual calibration procedure. An automated calibration was not feasible because of the computational demands of the fully coupled HGS simulations. Model parameters were adjusted manually within physically realistic ranges reported in the literature for degraded and less degraded peat soils (Wallor et al., 2018a; Liu and Lennartz, 2019; Menberu et al., 2021; Renaud et al., 2025) until satisfactory agreement with the observed groundwater dynamics and evapotranspiration was achieved. The calibration focused primarily on peat hydraulic properties and evapotranspiration parameters. During the calibration process, peat porosity (θs) and the van Genuchten parameters α and β were identified as the most sensitive parameters controlling groundwater fluctuations and water-storage dynamics. These parameters strongly influence soil water-retention characteristics and therefore determine the availability of water for evapotranspiration and the response of groundwater levels to climatic forcing. Saturated hydraulic conductivity also influenced model results, particularly the timing of groundwater-level responses and lateral exchanges between the peatland and the surrounding ditch system. The period 2016–2020 was used for calibration because it encompassed a broad range of hydrological conditions, including both wet (2017) and dry years (2018), thereby providing a robust basis for parameter evaluation. The period 2021–2023 was subsequently used for model validation. Model performance was assessed using a multimeric framework including the Nash–Sutcliffe efficiency (NSE), Kling–Gupta efficiency (KGE), and root mean square error (RMSE), as each metric has a specific hydrologic focus (Guse et al., 2019). For the evapotranspiration parameterization, the Kristensen–Jensen coefficients (C1–C3) described in Sect. 2.6 were adjusted during calibration to reproduce observed evapotranspiration dynamics.
2.8 Water Storage Changes
HGS applies evapotranspiration as a fully distributed process, with contributions from surface and canopy evaporation as well as subsurface evaporation and transpiration acting on all nodal layers within the specified evaporation and rooting depths. Because AET is implemented across multiple depth intervals, the resulting water balance cannot be accurately derived from surface fluxes alone. Therefore, a volumetric, node-based accounting approach was applied to quantify all inflow, outflow, and storage terms consistently across the 3D model domain. Storage change (ΔS) was obtained from the nodal mass-balance output, which reports changes in fluid mass within each control volume at each time step. It is calculated as follows:
PCP: Precipitation; AET: Evapotranspiration; HI: Horizontal inflows; HO: Horizontal outflows; Resid: Nonlinear Newton residual.
The sum of all vertical inflow and outflows between all layers is zero. Cumulative storage changes were then calculated from these time-step values and plotted to evaluate seasonal and interannual storage dynamics. The volumetric fluxes were divided by the total contributing nodal-control-volume area to provide depth-equivalent units (i.e., mm d−1).
3.1 Actual Evapotranspiration
Figure 7a, b compares simulated AET from the HGS model with observations derived from eddy covariance measurements for the period 2015–2023 (excluding 2019 due to data gaps). At the annual scale, the model captures the interannual variability of AET reasonably well, with simulated values ranging between 515 and 757 mm yr−1 compared to measured values of 589–720 mm yr−1. Years with relatively high and low observed evapotranspiration (e.g., 2020 and 2022) are also reflected in the model output, resulting in a root mean square error (RMSE) of about 64 mm yr−1. At the monthly scale, the model reproduces both the magnitude and seasonal dynamics of AET, closely tracking the observed annual cycles with higher evapotranspiration during the growing season (May–September) and lower values during winter months. The agreement is strong (RMSE = 10.2 mm month−1, NSE = 0.91, and KGE, 0.88), indicating that the model adequately represents both seasonal variability and interannual differences in evapotranspiration, although slight underestimations are apparent in some autumn and winter months (e.g., year 2021). Notably, during the extremely dry year 2018 (annual precipitation around 300 mm yr−1), the largest discrepancies occurred in the summer months, with the model overestimating evapotranspiration relative to the eddy covariance observations.

Figure 7Comparison of simulated and observed actual evapotranspiration (AET) using HydroGeoSphere calculations and eddy covariance measurements: (a) annual values (2019 excluded due to missing observations), and (b) seasonal variability based on monthly data.
Figure 8 shows model results of monthly variations of main AET components which are transpiration and evaporation (from soil and canopy storage) for 2016–2023. Both components are lowest in winter and increase through spring, peaking in summer. Transpiration dominates the growing season, often reaching 80–100 mm month−1 in June–August, whereas evaporation is smaller (about 5–30 mm month−1) with short pulses after wet periods. Interannual variability is evident in the amplitude and timing of both components. The strongest summer transpiration occurs in 2018, consistent with warm, dry conditions and high canopy demand. The high precipitation in June and July of 2017 and winter of 2018 increased water availability into the following growing season and supported canopy development, with LAI around 7, yielding the highest transpiration rates in summer 2018. In contrast, 2021 shows subdued transpiration for much of the year and several moderate evaporation pulses, indicating wetter surface conditions. Evaporation peaks are most pronounced in early to mid-summer 2017 and in July 2021–2022, reflecting precipitation events and enhanced soil or canopy wetness. In 2017 precipitation totals were high and the water table often reached or exceeded the surface, indicating saturated peatland conditions; these conditions limited root aeration and reduced transpiration, while sustained soil and canopy wetness enhanced evaporation. Overall, actual evapotranspiration is transpiration-dominated in summer, while evaporation contributes a larger share during cooler or wetter months and immediately following rainfall.

Figure 8Seasonal dynamic of actual evapotranspiration components, (a) Transpiration, (b) Evaporation from soil water and canopy storage (interception).
3.2 Groundwater Level
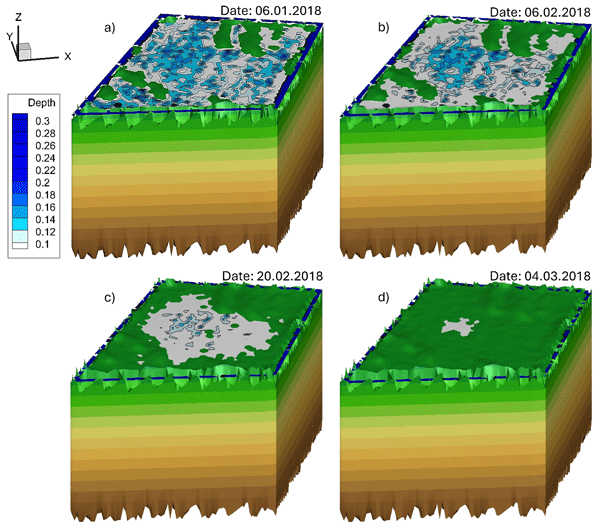
The HGS model successfully reproduced the daily dynamics of groundwater levels in the Paulinenaue fen site for the period 2015–2023 (Fig. 9). Simulated water levels closely followed observed groundwater levels in the central piezometer, capturing both seasonal fluctuations and interannual variability at daily resolution. The fit is strong, with model performance metrics of NSE = 0.83, KGE = 0.80, and RMSE = 0.15 m during calibration period (2016–2020), and NSE = 0.86, KGE = 0.85, and RMSE = 0.15 m, during validation (2021–2023). Observed ditch water levels were consistently higher than simulated peatland groundwater levels during summer months and slightly lower during winter, reflecting the seasonal inversion of hydraulic gradients between the ditch and peatland aquifer. This pattern was well reproduced by the model, which captured both the summer drawdown of the groundwater table caused by high evapotranspiration and the winter recharge-driven rise. In addition, during the flood years in summer 2017, in winter 2022, and in winter 2023, when water levels rose above the peat surface, the model correctly reproduced the occurrence of surface inundation, confirming its ability to simulate both groundwater and overland flow processes. Conversely, in summers where ditch water level data were unavailable and the boundary values were linearly interpolated (e.g., 2018), the simulated groundwater level deviated from observations, underlining the system's sensitivity to accurate ditch boundary conditions. This sensitivity is further illustrated in summer 2021, when two consecutive groundwater drawdowns occurred: the one with observed ditch data was captured better by the model than the one interpolated ditch data. These results demonstrate that the parameterization of evapotranspiration, ditch boundary conditions, and soil–surface coupling adequately represents the main hydrological controls on groundwater and surface water dynamics in this drained fen system. To demonstrate that model performance extends beyond the observation well, Fig. 10 shows the simulated spatial dynamics of surface inundation across the peatland during winter 2018. It captures the progression from widespread inundation in January (Fig. 10a) to its disappearance by March (Fig. 10b), confirming the model's ability to reproduce site-wide hydrological responses including the extent, depth, and temporal evolution of surface inundation, not just point-scale fluctuations. Figure 10 is interpreted as a physically consistent model prediction supported by groundwater observations for that specific time period, rather than as a validated inundation map.

Figure 9Observed and modeled dynamics of groundwater and ditch water levels in the Paulinenaue fen site for the period 2015–2023.

Figure 10Simulated water depth (m) dynamics on top of the peatland during winter 2018, showing gradual reduction of surface water extent and depth from (a) 6 January to (d) 4 March. The sequence illustrates initial flooding and the slow drop in water level over time.
Table 4Model performance in simulating groundwater dynamic for calibration (2016–2020) and validation period (2021–2023).

3.3 Water Fluxes
The year 2017 represents a wet year (precipitation 640 mm yr−1) and the year 2018 an extremely dry year (precipitation 299 mm yr−1) for the study region. Daily water fluxes (inflow, outflow, precipitation, and actual evapotranspiration) from 1 January 2017 to 31 December 2018 are shown in Fig. 11. Daily inflow and outflow show event-driven dynamics, with sharp outflow pulses after rainfall, especially in autumn and winter when evapotranspiration is low (Fig. 11a). Inflow occurs mainly during summer, when AET-driven water deficits create hydraulic gradients that generate flow from the ditches and adjacent aquifer into the peatland site. Outflow is higher and more frequent in 2017 and smaller in 2018. The positive netflow (inflow–outflow) indicates that lateral exchange via ditches and the aquifer supplied additional water to the domain during summer drawdown.
Simulated AET reproduces the timing and magnitude of the observed seasonal cycle, with summer maxima and winter minima (RMSE = 1.01 mm d−1, KGE = 0.70; Fig. 11b). The largest deviations occur during the extreme drought of 2018, when the model slightly overestimates summer AET.
Figure 11c shows both simulated and observed groundwater levels, allowing a direct interpretation of how flux variations shape water-table dynamics. Groundwater levels are well reproduced, with simulated heads closely tracking observations and capturing seasonal rises, recessions, and most event-scale fluctuations (RMSE = 0.12 m, KGE = 0.88, NSE = 0.92). During warm seasons, ditch water levels are generally higher than the peatland water table, reflecting AET-driven drawdown of the groundwater level; the gradient between ditch and groundwater level and the associated lateral inflow which are accurately captured by the model. During winter months the groundwater levels are higher than the ditch water levels and outflow from the site to the ditch occurs (Fig. 11a).

Figure 11Hydrologic dynamics of water balance components in extreme conditions (2017–2018): (a) lateral fluxes (HI – inflow, HO – outflow); (b) daily AET (sim vs. eddy covariance) and precipitation (PCP scaled by dividing by 10); (c) ditch and groundwater levels (simulations vs. observations).
Figure 12 illustrates the strong coupling between the seasonal characteristic of the meteorological components of the water balance and the water storage behavior of the study site reflected in groundwater dynamic. The wet periods (summer/autumn 2017, autumn 2023) and the dry summer 2018 deviate significantly from the average annual pattern. Within times with water levels above surface, inundated depressions act as important buffers providing short-term storage (Fig. 12a).

Figure 12Simulated water storage changes relative to the 1 January 2016 (a) observed and simulated groundwater hydrograph (b) and boxplot of the simulated monthly water storage changes between 2016 and 2023 (c).
The water storage of the site (Fig. 12a) follows this seasonal hydrological cycle. From December to February, water storage increases, as precipitation and inflow exceeds evapotranspiration and outflow. From April onward, water storage decreases, with the strongest decline in June–August (−60 to −120 mm month−1), reflecting high evaporative demand. Deviations from this normal behavior occur after periods of heavy rainfall. For example, the strongest positive storage pulses, reaching values up to +80 to +100 mm month−1, occurring during months with high precipitation (June/July 2017) resulted in an inundation of large parts of the site.
The groundwater hydrograph (Fig. 12b) reflects the dynamic of the water storage of the study site. It shows the same seasonal pattern as the water storage (Fig. 12a), with highest water levels occurring between December and February and the lowest levels typically in June–September. Winter water levels frequently rise above 28 m a.s.l., while summer minima often drop 0.5–1 m below the winter peak (e.g., see the variation in 2022). The deepest groundwater levels occur in the drought years of 2018 and 2022, whereas 2017, and 2023 show elevated water tables associated with wetter conditions.
The average monthly water storage changes across all years (Fig. 12c) highlights the consistency of this seasonal pattern. Autumn and winter months display predominantly positive storage changes with low variability, whereas spring and summer months exhibit consistently negative medians and a wide spread of values. June and July show the strongest negative extremes due to the high stochasticity of precipitation. While the other water balance components exhibit clear seasonal patterns, summer precipitation is irregular and dominated by long dry periods without any precipitation and heavy rainfall events, causing a wider spread of water storage changes in these months.
Water management measures can also lead to extreme water storage changes. For example, the pronounced negative water storage change in February is the result of water management operations. Following the heavy rainfall in June–July 2017, large parts of the study region remained inundated for several months. To reduce flooding, the water authority lowered the water level in the main drainage channel (Großer Havelländischer Hauptkanal), which subsequently caused a regional decline in groundwater levels. These effects are also well reflected by the model.
Figure 13 summarizes the annual values of all water balance components (AET, precipitation, inflow, outflow, and water storage change) for the period 2016–2023. Precipitation and inflow represent the water supply and AET and outflow the water consumption. A negative annual water-storage change indicates that end-of-year storage is lower than at the beginning, implying that stored water was used to supply dry-year conditions. In contrast, a positive storage change means that additional water was retained at the site, which typically occurs in wetter years. The results illustrate the clear contrasts between wet and dry years, reflecting the combined influence of precipitation, AET, and lateral exchange with the ditch–aquifer system. Years with above-average precipitation such as 2017 and 2023 resulted in positive annual storage changes, indicating that the peatland gained water over the hydrologic year and maintained elevated groundwater levels. In contrast, the consecutive dry years of 2016, 2018 and 2019 show negative annual storage, confirming a cumulative moisture deficit, progressive drying of the peat profile, and decline in the groundwater level consequently. The years 2020–2022 have a neutral annual water balance, as groundwater levels at the beginning and end of each year are nearly identical.

Figure 13Simulated annual sums of water balance components (AET: actual evapotranspiration, PCP: precipitation, inflow, and outflow, ΔS: water storage change).
AET represents the dominant annual loss term in all years and varies strongly between wet and dry years. Only in wet years like 2017 and 2023 do the precipitation have a similarly high level as AET. The highest AET totals occur in 2018, when atmospheric water demand was elevated. Although lateral inflow from the surrounding ditch–aquifer system partially counterbalances these losses during summer drawdown, it is insufficient to compensate for the large climatic deficits during extreme drought period. Conversely, in wet years, lateral outflow becomes more prominent as high groundwater levels and winter recharge promote export of water from the peatland. Comparison of inflow and outflow shows that the inflow is greater than the outflow. It underlines the dependency of the water balance of the site from its catchment. This is typically for peatland sites under similar climatic conditions as our study area.
4.1 Model performance and evapotranspiration dynamics
This study demonstrates that a fully coupled surface–subsurface model, based on extensive field measurements can reproduce and explain the hydrological behavior of a degraded fen peatland under varying climatic and management conditions. By calibrating and validating HGS over nine years of data, the model reproduced groundwater fluctuations and evapotranspiration dynamics with high accuracy. The integration of field-based Leaf Area Index (LAI) measurements and detailed land management schedules enhanced the realism of evapotranspiration parameterization. While vegetation parameterizations are increasingly incorporated into ecohydrological models, the use of field-based LAI measurements and management schedules remains relatively uncommon in fully coupled surface–subsurface hydrological simulations. The explicit representation of vegetation dynamics is therefore a distinctive aspect of this model setup. Nevertheless, slight seasonal mismatches occurred, particularly an overestimation of AET during the extremely dry summer of 2018. While uncertainties associated with eddy covariance evapotranspiration measurements may contribute to this discrepancy, the model generally reproduced observed evapotranspiration dynamics well. Potential causes of the 2018 mismatch and implications for future model development are discussed in Sect. 4.5.
The parametrization of transpiration in this study was tailored to reflect the behavior of fen grass species that tolerate high water tables and oxygen stress. By allowing plants to remain physiologically active under near-saturated conditions, the model reproduced a characteristic feature of peatland vegetation that is often absent in standard hydrological models, which typically reduce transpiration under such conditions. This was particularly evident in summer of 2017, when water levels were above the surface, yet transpiration still occurred, reflecting the ability of fen species to maintain activity under saturated conditions. The current evapotranspiration parametrization applied here works well for the existing vegetation composition and successfully reproduces observed fluxes under saturated conditions. However, if rewetting is sustained over the long term, vegetation composition may shift, as shown by Dietrich (2024) and Dietrich and Kaiser (2017), where wetter conditions favored the establishment of sedges with different evapotranspiration dynamics compared to grassland species. This indicates that future hydrological modeling should allow for updating or dynamic parametrization of vegetation to reflect such ecological changes and ensure that evapotranspiration feedback remain realistically represented under prolonged rewetting.
4.2 Influence of peat hydraulic properties
The two-layer representation of degraded versus less degraded peat was critical for simulating vertical water storage and fluxes and therefore groundwater dynamics. The compacted upper peat dried out quickly and drove rapid water-table fluctuations, while the deeper, less degraded layer buffered water losses and sustained groundwater levels during droughts. This pattern is consistent with field studies showing that the upper 20–30 cm of peat, which has been significantly altered by drainage, is associated with an increase in bulk density and a decrease in porosity, specific yield, and saturated hydraulic conductivity, while deeper peat often retains more of its original storage capacity (Price and Ketcheson, 2009; Menberu et al., 2021). If this vertical contrast is ignored, models tend to overestimate water storage in the surface layer and keep too much water available for plants, which leads to an underestimation of evapotranspiration sensitivity to drought. Similarly, homogeneous parameterizations often dampen simulated water-table rebounds, whereas layered or dual-reservoir approaches can reproduce the fast-rewetting response seen in drained peatlands after rainfall (Binet et al., 2013). This effect has also been observed in lysimeter-based modeling of degraded peat soils, where unimodal (homogeneous) parameterizations tended to overestimate soil water storage and dampen water-table fluctuations compared to bimodal approaches (Davies et al., 2024). Capturing this heterogeneity is therefore essential for realistically assessing evapotranspiration dynamics and the rewetting potential of degraded peatlands.
Another important consideration relates to peat degradation effects on hydraulic properties. In this study, anisotropic saturated hydraulic conductivity was implemented for both, the degraded upper and less degraded lower peat layers. These parameters were kept constant throughout the nine-year simulation period. While this approach is appropriate for capturing short- to medium-term dynamics, it is important to acknowledge that peat hydraulic properties are not static, as long-term use of agricultural machinery leads to soil compaction. In addition, numerous studies have shown that peat degradation processes – such as oxidation, compaction, and subsidence – lead as well to marked changes in bulk density, porosity, and saturated hydraulic conductivity over time (Sherwood et al., 2013; Morris et al., 2022). However, such changes generally occur much more slowly than the timescales considered in most peatland management and rewetting studies. Typical peat accumulation rates in Europe are approximately 1 mm yr−1 (Swindles et al., 2025), showing that significant recovery of peat-forming layers and associated hydraulic properties requires very long time.
4.3 Ditch-groundwater interactions and water balance
The study confirms that ditch water levels consistently exceed groundwater levels during summer, leading to a water flow from the ditch into the site. During winter, the direction of the gradient and consequently, the flow direction is often reversed, reflecting seasonal variability. Capturing these shifts is only possible if the parametrization of hydraulic exchange processes is appropriately implemented. The correct representation of ditch–aquifer connectivity determines whether the model can reproduce both summer and winter dynamics. In addition, evapotranspiration parametrization plays a central role in shaping these gradients over the year, since vegetation water use strongly influences groundwater levels during summer. Therefore, accurate representation of AET demand supports the model's ability to simulate seasonal shifts in ditch–groundwater interactions. These dynamics, including the occurrence of inundation during wet years, were well captured by the model. However, the sensitivity of simulations to ditch boundary conditions (e.g., during periods with interpolated ditch water level data in 2018 and 2021) underscores the importance of reliable monitoring networks. By quantifying inflow, outflow, and evapotranspiration, the model provided a detailed water budget. The results highlight the vulnerability of degraded peatlands to climatic water deficits, especially during consecutive drought years (2018–2020). Future rewetting strategies must account not only for precipitation variability but also for ditch–aquifer connectivity and vegetation-driven demand.
The modeled water balance shows that the hydrological functioning of the drained fen is highly sensitive to both seasonal and interannual climate variability. The system alternates between periods of net storage gain and net storage loss because of the balance between precipitation inputs, evaporative demand, and the hydraulic connections to the surrounding drainage network. Similar to observations in other degraded peatlands in Germany (e.g., Ahmad et al., 2021), evapotranspiration emerges as the dominant control on water-table drawdown during the growing season, even when groundwater levels remain shallow (e.g., April 2023). This strong atmospheric control creates persistent hydraulic gradients toward ditches that reinforce lateral inflows during dry periods. The fluctuations between hydrological surplus and deficit reflect a characteristic vulnerability of drained fens: their long-term water balance is not simply a function of annual precipitation, but of the interaction between evaporative demand, soil hydraulic properties (such as porosity), and drainage boundary conditions. As noted in previous studies (Price and Ketcheson, 2009; Sherwood et al., 2013), degraded surface peat with reduced specific yield intensifies water-table variability, amplifying seasonal drying and limiting the system's capacity to retain water during drought. This behavior underscores a key challenge for rewetting efforts such as raising ditch water levels that alone may not be sufficient to counterbalance increased evaporative demand under warmer climates, as also emphasized by Dietrich (2024) and Davies et al. (2024).
4.4 Implications for rewetting and future management
Effective rewetting strategies therefore require measures that reduce drainage and enhance local water retention, particularly during periods of high atmospheric demand. The validated modelling framework provides a physically based basis for future evaluation of peatland rewetting measures. Although no explicit rewetting scenarios were simulated in this study, the model captures the principal hydrological processes governing water-table dynamics, including evapotranspiration, groundwater–ditch interactions, and water-storage changes. The results indicate that successful rewetting is likely to depend not only on raising ditch water levels but also on maintaining sufficient water availability within the wider catchment and reducing drainage losses during dry periods. Consequently, the model provides a useful framework for future investigations of ditch management, water-retention measures, and climate-change adaptation strategies in degraded fen peatlands.
4.5 Model limitations and future developments
However, the model results also show that mesh quality and refinement influenced convergence and stability, especially in the heterogeneous peat–sand–till sequence. The finite element mesh avoided extreme aspect ratios, yet further adaptive refinement could improve representation of sharp hydraulic gradients at ditch–peat interfaces. Although topography in our peatland site remains largely stable, long-term degradation and compaction can lead to subsidence and localized depressions as a result of human activities. In such cases, applying dynamic meshing schemes, as recently proposed in HGS applications (Hwang et al., 2025), could be valuable. These approaches adjust the computational grid to evolving surface conditions and may therefore improve long-term peatland simulations by maintaining numerical stability and better capturing altered hydrological pathways caused by subsidence.
Another limitation relates to the evapotranspiration parameterization. Although the observed LAI of the fen grassland reached values of approximately 7 during peak growing seasons, the Kristensen–Jensen evapotranspiration formulation assumes that transpiration demand reaches its maximum at LAI values of about 2.3–2.5. Consequently, increases in canopy density above this threshold do not lead to further increases in simulated transpiration. This simplification may reduce the sensitivity of the model to interannual variations in vegetation development and canopy structure. However, under the climatic conditions of the study site, evapotranspiration appears to be constrained more strongly by water availability than by canopy density during extreme drought periods. For example, during the summer drought of 2018, groundwater levels declined substantially and the peat profile dried out, limiting root water uptake despite high vegetation productivity. Similar observations were reported by Dietrich et al. (2021), who found that actual evapotranspiration remained below atmospheric demand because of insufficient water availability. Therefore, the overestimation of AET in 2018 is more likely related to limitations in the representation of drought-induced water stress and plant-accessible water than to the LAI parameterization itself. Future studies could investigate alternative canopy-resistance formulations that maintain sensitivity to high LAI values while also improving the representation of drought stress under extreme conditions.
Additional uncertainty arises from the eddy covariance evapotranspiration measurements, peat hydraulic properties, and boundary-condition data. In particular, uncertainties associated with energy-balance closure, gap-filling procedures, and interpolated ditch-water-level observations may contribute to some discrepancies between simulated and observed values. Although the model reproduced groundwater and evapotranspiration dynamics well overall, these uncertainties should be considered when interpreting individual events and extreme drought periods. Future climate change may increase the importance of these limitations. While shallow groundwater currently supports high evapotranspiration rates in many fen systems, more frequent and prolonged droughts could result in deeper groundwater tables and stronger soil-moisture limitations. Under such conditions, accurate representation of plant-accessible water and drought-induced transpiration reduction may become more important than the representation of canopy density alone. Consequently, future rewetting and climate-change scenario analyses would benefit from improved representation of drought-induced water stress and plant-accessible water.
One of the model's great strengths is that it integrates all factors involved in the water balance of a peatland area into a single model. It takes into account evaporation processes by vegetation parameters, vertical and horizontal flow processes in the unsaturated and saturated soil zones, and the integration of water management facilities such as ditches. The direct coupling of ditches and groundwater makes the model ideal for scenario analyses of water management measures to improve water retention or peatland restoration.
While the model performed well at the field scale, scaling these insights to regional levels remains challenging due to computational demand and the need for site-specific data (LAI, peat properties, ditch management, groundwater dynamics). The approach nevertheless provides a benchmark for developing hybrid modeling frameworks that combine physically based simulations with machine learning to extend results across larger peatland landscapes.
This study applied a fully coupled HGS model to investigate the hydrological functioning of a degraded fen peatland under present climatic and management conditions. The model successfully reproduced groundwater fluctuations, evapotranspiration dynamics, and ditch–groundwater interactions, which represent the key hydrological processes governing the peatland water balance essential for accurately quantifying their contributions to the overall water budget. Key to this achievement is the optimized parametrization of evapotranspiration processes, which not only accounted for vegetation dynamics through measured LAI and management schedules but also incorporated the physiological behavior of peatland plant species, capable of maintaining growth and transpiration under fully saturated conditions. In addition, the explicit representation of the hydraulic properties of the layered peat structure (degraded and less degraded) plays an important role, which allowed the model to capture rapid water-table fluctuations and storage changes. The results emphasize that ditch–aquifer connectivity and water-consuming vegetation strongly shape the dominant seasonal gradients between surface water and groundwater. Therefore, correct parametrization of both exchange processes and evapotranspiration is essential to capture the observed seasonal reversals in hydraulic gradients. Moreover, the assessment of seasonal and interannual storage changes offers new insight into the long-term hydrological sensitivity of degraded fens. The marked alternation between water-storage gains in wet years and cumulative deficits during drought demonstrates the limited capacity of drained peatlands to buffer increases in evaporative demand, even when shallow groundwater and lateral inflow provide temporary support. This research provides a detailed framework for representing peatland hydrology and highlights the importance of integrating vegetation–water interactions to accurately quantify water balance components. The model establishes a robust hydrological modelling framework for future assessment of management interventions aimed at sustainable peatland rewetting.
The current version of the HGS model code will be available upon request. All data used to process, set up, and evaluate the HGS model are available at https://doi.org/10.4228/e68w-mv80 (Dietrich and Mahmoodi, 2026).
The supplement related to this article is available online at https://doi.org/10.5194/hess-30-6019-2026-supplement.
NM: data collection, methodology, software and model setup, model input–output analysis and visualization, writing (original draft, review, and editing). CM: methodology, writing (review and editing). JP: field work and providing LAI data, writing (review and editing). OD: data collection and computations, methodology, writing (review and editing).
The contact author has declared that none of the authors has any competing interests.
Publisher's note: Copernicus Publications remains neutral with regard to jurisdictional claims made in the text, published maps, institutional affiliations, or any other geographical representation in this paper. The authors bear the ultimate responsibility for providing appropriate place names. Views expressed in the text are those of the authors and do not necessarily reflect the views of the publisher.
The authors would like to thank the group technician, Niklas Jaenichen for implementing the piezometers and for several years of monitoring. We thank Kerstin Deetz and Axel Behrendt from the Experimental Infrastructure Platform in Paulinenaue for maintaining the eddy covariance stations. We would also like to thank the three anonymous reviewers for their constructive comments, which have helped to improve the quality of the manuscript. AI tools (ChatGPT) were partly used to support the editing of this article.
This work received support from the WetNetBB project (Management and Biomass Utilization of Wet Fens: Network of Model and Demonstration Projects in Peatland Regions of Brandenburg), funded by the Federal Ministry of Food and Agriculture through the Climate and Transformation Fund (FNR – Fachagentur Nachwachsende Rohstoffe 100619639).
This paper was edited by Nunzio Romano and reviewed by four anonymous referees.
Ahmad, S., Liu, H., Alam, S., Günther, A., Jurasinski, G., and Lennartz, B.: Meteorological controls on water table dynamics in fen peatlands depend on management regimes, Front. Earth Sci., 9, 630469, https://doi.org/10.3389/feart.2021.630469, 2021.
Ala-aho, P., Soulsby, C., Wang, H., and Tetzlaff, D.: Integrated surface–subsurface model to investigate the role of groundwater in headwater catchment runoff generation: a minimalist approach to parameterisation, J. Hydrol., 547, 664–677, https://doi.org/10.1016/j.jhydrol.2017.02.023, 2017.
Allen, R. G., Pereira, L. S., Raes, D., and Smith, M.: Crop evapotranspiration: Guidelines for computing crop water requirements, FAO Irrigation and Drainage Paper No. 56, Food and Agriculture Organization of the United Nations, Rome, Italy, 300 pp., ISBN 92-5-104219-5, 1998.
Bertrand, G., Alex, P., Pohl, B., Lhosmot, A., Steinmann, M., Johannet, A., Pinel, S., Çaldirak, H., Artigue, G., Binet, P., Bertrand, C., Collin, L., Magnon, G., Gilbert, D., Laggoun-Deffarge, F., and Toussaint, M.-L.: Statistical hydrology for evaluating peatland water table sensitivity to simple environmental variables and climate changes: application to the mid-latitude/altitude Frasne peatland (Jura Mountains, France), Sci. Total Environ., 754, 141931, https://doi.org/10.1016/j.scitotenv.2020.141931, 2021.
Binet, S., Gogo, S., and Laggoun-Défarge, F.: A water-table-dependent reservoir model to investigate the effect of drought and vascular plant invasion on peatland hydrology, J. Hydrol., 490, 132–139, https://doi.org/10.1016/j.jhydrol.2013.06.035, 2013.
Bourgault, M.-A., Larocque, M., and Garneau, M.: Quantification of peatland water storage capacity using the water table fluctuation method, Hydrol. Process., 31, 1184–1195, https://doi.org/10.1002/hyp.11116, 2017.
Chen, C., Loft, L., and Matzdorf, B.: Lost in action: climate-friendly use of European peatlands needs coherence and incentive-based policies, Environ. Sci. Policy, 145, 104–115, https://doi.org/10.1016/j.envsci.2023.05.004, 2023.
Davies, M. F., Dietrich, O., Gerke, H. H., and Merz, C.: Modeling water flow and volumetric water content in a degraded peat comparing unimodal with bimodal porosity and flux with pressure head boundary condition, Vadose Zone J., 23, e20328, https://doi.org/10.1002/vzj2.20328, 2024.
de Vries, D. A.: Thermal properties of soils, in: Physics of Plant Environment, edited by: van Wijk, W. R., North-Holland Publishing Company, Amsterdam, the Netherlands, 210–235, LCCN: 63023991/OCLC: 1660671, 1963.
Dietrich, O.: Auswirkungen von klimatischen Veränderungen auf den Wasserhaushalt von Feuchtgrünlandstandorten, Hydrol. Wasserbewirts., 68, 315–330, https://doi.org/10.5675/HyWa_2024.6_1, 2024.
Dietrich, O. and Kaiser, T.: Impact of groundwater regimes on water balance components of a site with a shallow water table, Ecohydrology, 10, e1867, https://doi.org/10.1002/eco.1867, 2017.
Dietrich, O., Behrendt, A., and Wegehenkel, M.: The water balance of wet grassland sites with shallow water table conditions in the north-eastern German lowlands in extreme dry and wet years, Water, 13, 2259, https://doi.org/10.3390/w13162259, 2021.
Ekardt, F., Jacobs, B., Stubenrauch, J., and Garske, B.: Peatland governance: the problem of depicting in sustainability governance, regulatory law, and economic instruments, Land, 9, 83, https://doi.org/10.3390/land9030083, 2020.
Federal Ministry for the Environment, Nature Conservation, Nuclear Safety and Consumer Protection (BMUV): National Peatland Protection Strategy, BMUV, Berlin, Germany, 2022, https://www.bmuv.de/en/publications (last access: 20 September 2026).
Foken, T.: Micrometeorology, Springer, Berlin, Heidelberg, Germany, 306 pp., ISBN: 978-3-540-74665-2, e-ISBN: 978-3-540-74666-9, 2008a.
Foken, T.: The energy balance closure problem: an overview, Ecol. Appl., 18, 1351–1367, https://doi.org/10.1890/06-0922.1, 2008b.
Foken, T. and Wichura, B.: Tools for quality assessment of surface-based flux measurements, Agric. For. Meteorol., 78, 83–105, https://doi.org/10.1016/0168-1923(95)02248-1, 1996.
Foken, T., Wimmer, F., Mauder, M., Thomas, C., and Liebethal, C.: Some aspects of the energy balance closure problem, Atmos. Chem. Phys., 6, 4395–4402, https://doi.org/10.5194/acp-6-4395-2006, 2006.
Guse, B., Pfannerstill, M., Kiesel, J., Strauch, M., Volk, M., and Fohrer, N.: Analysing spatio-temporal process and parameter dynamics in models to characterise contrasting catchments, J. Hydrol., 570, 863–874, https://doi.org/10.1016/j.jhydrol.2018.12.050, 2019.
Hwang, H. T., Park, Y. J., Sudicky, E. A., Berg, S. J., McLaughlin, R., and Jones, J. P.: Understanding the water balance paradox in the Athabasca River Basin, Canada, Hydrol. Process., 32, 729–746, https://doi.org/10.1002/hyp.11449, 2018.
Hwang, H. T., Park, Y. J., Berg, S. J., Jones, J. P., Miller, K. L., and Sudicky, E. A.: A dynamic meshing scheme for integrated hydrologic modeling to represent evolving landscapes, Sci. Total Environ., 976, 179129, https://doi.org/10.1016/j.scitotenv.2025.179129, 2025.
Joosten, H., Tanneberger, F., and Moen, A. (Eds.): Mires and Peatlands of Europe: Status, Distribution and Conservation, Schweizerbart, Stuttgart, Germany, ISBN 978-3-510-65383-6, 2017.
Karimi, S., Mosquera, V., Maher Hasselquist, E., Järveoja, J., and Laudon, H.: Does peatland rewetting mitigate flooding from extreme rainfall events?, Hydrol. Earth Syst. Sci., 29, 2599–2614, https://doi.org/10.5194/hess-29-2599-2025, 2025.
Khaledi, V., Baatz, R., Antonijević, D., Hoffmann, M., Dietrich, O., Lischeid, G., Davies, M. F., Merz, C., and Nendel, C.: Evaluating MONICA's capability to simulate water, carbon, and nitrogen fluxes in a wet grassland at contrasting water tables, Sci. Total Environ., 949, 174995, https://doi.org/10.1016/j.scitotenv.2024.174995, 2024.
Kristensen, K. J. and Jensen, S. E.: A model for estimating actual evapotranspiration from potential evapotranspiration, Hydrol. Res., 6, 170–188, https://doi.org/10.2166/nh.1975.0012, 1975.
Li, Z., Gao, P., and Lu, H.: Dynamic changes of groundwater storage and flows in a disturbed alpine peatland under variable climatic conditions, J. Hydrol., 575, 557–568, https://doi.org/10.1016/j.jhydrol.2019.05.001, 2019.
Liebethal, C. and Foken, T.: On the use of two repeatedly heated sensors in the determination of physical soil parameters, Meteorol. Z., 15, 293–300, https://doi.org/10.1127/0941-2948/2006/0125, 2006.
Liu, H. and Lennartz, B.: Hydraulic properties of peat soils along a bulk density gradient – a meta study, Hydrol. Process., 33, 101–114, https://doi.org/10.1002/hyp.13314, 2019.
Mauder, M. and Foken, T.: Documentation and instruction manual of the Eddy-Covariance Software Package TK3 (Update), Bayreuth, Germany, Univ. Bayreuth, Abt. Mikrometeorologie, 62 pp., ISSN 1614-8916, e-ISSN 1614-8924, 2015.
Mauder, M., Genzel, S., Fu, J., Kiese, R., Soltani, M., Steinbrecher, R., Zeeman, M., Banerjee, T., De Roo, F., and Kunstmann, H.: Evaluation of energy balance closure adjustment methods by independent evapotranspiration estimates from lysimeters and hydrological simulations, Hydrol. Process., 32, 39–50, https://doi.org/10.1002/hyp.11397, 2018.
McLaughlin, J. W. and Packalen, M. S.: Peat carbon vulnerability to projected climate warming in the Hudson Bay Lowlands, Canada: a decision support tool for land use planning in peatland dominated landscapes, Front. Earth Sci., 9, 650662, https://doi.org/10.3389/feart.2021.650662, 2021.
Menberu, M. W., Marttila, H., Ronkanen, A.-K., Haghighi, A. T., and Kløve, B.: Hydraulic and physical properties of managed and intact peatlands: application of the van Genuchten–Mualem models to peat soils, Water Resour. Res., 57, e2020WR028624, https://doi.org/10.1029/2020WR028624, 2021.
Meyer-Jürshof, M., Theilen, G. S., and Lakner, S.: Digging into complexity: the wicked problem of peatland protection, Adv. Sustain. Syst., 9, 2400380, https://doi.org/10.1002/adsu.202400380, 2025.
Millar, D. J., Cooper, D. J., and Ronayne, M. J.: Groundwater dynamics in mountain peatlands with contrasting climate, vegetation, and hydrogeological setting, J. Hydrol., 561, 908–917, https://doi.org/10.1016/j.jhydrol.2018.04.050, 2018.
Morris, P. J., Davies, M. L., Baird, A. J., Balliston, N., Bourgault, M. A., Clymo, R. S., Fewster, R. E., Furukawa, A. K., Holden, J., Kessel, E., and Ketcheson, S. J.: Saturated hydraulic conductivity in northern peats inferred from other measurements, Water Resour. Res., 58, e2022WR033181, https://doi.org/10.1029/2022WR033181, 2022.
Okkonen, J. and Kløve, B.: A conceptual and statistical approach for the analysis of climate impact on groundwater table fluctuation patterns in cold conditions, J. Hydrol., 388, 1–12, https://doi.org/10.1016/j.jhydrol.2010.02.015, 2010.
Page, S. E., Rieley, J. O., and Banks, C. J.: Global and regional importance of the tropical peatland carbon pool, Glob. Change Biol., 17, 798–818, https://doi.org/10.1111/j.1365-2486.2010.02279.x, 2011.
Paniconi, C. and Putti, M.: Physically based modeling in catchment hydrology at 50: survey and outlook, Water Resour. Res., 51, 7090–7129, https://doi.org/10.1002/2015WR017780, 2015.
Price, J. S. and Ketcheson, S. J.: Water relations in cutover peatlands, in: Carbon Cycling in Northern Peatlands, Geophysical Monograph Series, 184, edited by: Baird, A. J., Belyea, L. R., Comas, X., Reeve, A. S., and Slater, L. D., American Geophysical Union, Washington, DC, USA, 277–287, https://doi.org/10.1029/2008GM000827, 2009.
Renaud, A., Mügler, C., Durand, V., and Pessel, M.: Natural and anthropogenic drivers of the water table dynamics in a riparian fen peatland, J. Hydrol., 652, 132655, https://doi.org/10.1016/j.jhydrol.2024.132655, 2025.
Sherwood, J. H., Kettridge, N., Thompson, D. K., Morris, P. J., Silins, U., and Waddington, J. M.: Effect of drainage and wildfire on peat hydrophysical properties, Hydrol. Process., 27, 1866–1874, https://doi.org/10.1002/hyp.9820, 2013.
Swindles, G. T., Mullan, D. J., Brannigan, N. T., Fewster, R. E., Sim, T. G., Gallego-Sala, A., Blaauw, M., Lamentowicz, M., Jassey, V. E. J., Marcisz, K., Green, S. M., Roland, T. P., Loisel, J., Galloway, J. M., van der Linden, M., and Warner, B.: Climate and water-table levels regulate peat accumulation rates across Europe, PLoS One, 20, e0327422, https://doi.org/10.1371/journal.pone.0327422, 2025.
Tanneberger, F., Appulo, L., Ewert, S., Lakner, S., Ó Brolcháin, N., Peters, J., and Wichtmann, W.: The power of nature-based solutions: how peatlands can help us to achieve key EU sustainability objectives, Adv. Sustain. Syst., 5, 2000146, https://doi.org/10.1002/adsu.202000146, 2021.
Tfaily, M. M., Hamdan, R., Corbett, J. E., Chanton, J. P., Glaser, P. H., and Cooper, W. T.: Investigating dissolved organic matter decomposition in northern peatlands using complementary analytical techniques, Geochim. Cosmochim. Acta, 112, 116–129, https://doi.org/10.1016/j.gca.2013.03.002, 2013.
Therrien, R., McLaren, R., Sudicky, E., and Panday, S.: HydroGeoSphere: A three-dimensional numerical model describing fully-integrated subsurface and surface flow and solute transport, Tech. rep., Université Laval and University of Waterloo, https://doi.org/10.5194/hess-18-3121-2014, 2010.
Twine, T. E., Kustas, W. P., Norman, J. M., Cook, D. R., Houser, P., Meyers, T. P., Prueger, J. H., Starks, P. J., and Wesely, M. L.: Correcting eddy-covariance flux underestimates over a grassland, Agric. For. Meteorol., 103, 279–300, https://doi.org/10.1016/S0168-1923(00)00123-4, 2000.
Wallor, E., Herrmann, A., and Zeitz, J.: Hydraulic properties of drained and cultivated fen soils. Part II – model-based evaluation of generated van Genuchten parameters using experimental field data, Geoderma, 319, 208–218, https://doi.org/10.1016/j.geoderma.2017.12.012, 2018a.
Wallor, E., Rosskopf, N., and Zeitz, J.: Hydraulic properties of drained and cultivated fen soils. Part I – horizon-based evaluation of van Genuchten parameters considering the state of moorsh-forming process, Geoderma, 313, 69–81, https://doi.org/10.1016/j.geoderma.2017.10.026, 2018b.
Xu, J., Morris, P. J., Liu, J., and Holden, J.: PEATMAP: refining estimates of global peatland distribution based on a meta-analysis, Catena, 160, 134–140, https://doi.org/10.1016/j.catena.2017.09.010, 2018.