
the Creative Commons Attribution 4.0 License.
the Creative Commons Attribution 4.0 License.
 | 01 Sep 2026
Impacts of cascading check dams on sediment yield in the Middle Yellow River Basin: insights from 50 years of grid-cell-level simulation
Yanzhang Huang
Guangyao Gao

Lishan Ran
Yue Wang
Mingguo Zheng
Check dams, globally built for controlling soil erosion, form complex cascading systems that pose significant challenges for assessing spatiotemporal dynamics of Sediment Yield (SY) at large basin scale. This study proposed an integrative framework combining dynamic sediment trapping efficiency of cascading check dams with the Revised Universal Soil Loss Equation (RUSLE), Index of Connectivity (IC), and Sediment Delivery Ratio (SDR). This model was applied to evaluate grid-cell-based distribution of SY and sediment trapped by check dams during 1970–2020 in the Middle Yellow River Basin (with over 47 000 check dams). The Nash-Sutcliffe efficiency of proposed model increased to 0.71 compared to model ignoring sediment trapping of check dams (0.59). Check dams reduced the multi-year average SY by 50.01 % in dam-controlled areas. Totally 3.84 × 10⁹ t of sediment was trapped over the 50 years, constituting 41.49 % of designed storage capacity. The Sediment Reduction Contribution by check dams (SRCdam) exhibited considerable spatial heterogeneity, ranging from 41.3 % to 0.9 % among sub-basins, and the proportion of accumulated sediment to storage capacity of check dams (SARdam) varied from 78.1 % to 1.1 %. The SRCdam increased linearly with the share of area they controlled and check dam density (R2 = 0.80 and R2=0.76, respectively; P < 0.001), whereas SARdam increased logarithmically with SY from upstream of the check dams (R2 = 0.62; P < 0.001). A trade-off between SRCdam and SARdam provides diagnostic information for identifying sub-basins with high storage pressure or underused storage capacity, supporting optimized check-dam management. This study provides a practical and data-efficient method for assessing sediment trapping and reduction by cascading check dam systems in large basins, offering valuable insights for improving soil and water conservation strategies in erosion-prone regions.
- Article
(8568 KB) - Full-text XML
-
Supplement
(4606 KB) - BibTeX
- EndNote


Soil erosion, a critical material transport process in terrestrial ecosystems, is a major driver of global soil degradation (Borrelli et al., 2017; Lugato et al., 2018). It severely undermines the achievement of sustainable development goals related to food security (SDG2), water resources (SDG6), and ecosystems (SDG15) (Borrelli et al., 2021, 2023). Mitigating this crisis requires intervening in processes such as slope erosion and fluvial sediment transport to reduce the loss of soil (La Licata et al., 2025). These objectives can be achieved by modifying underlying surface characteristics through measures such as ecological restoration and channel-structure engineering (Maavara et al., 2020; Wang et al., 2025). Quantitatively assessing Sediment Yield (SY) due to erosion, particularly the interception of sediment by river engineering measures is an indispensable yet challenging component of ecological restoration and river management (Ke and Zhang, 2024).
Among various soil and water conservation measures, damming on river channels is one of the most effective and widely applied methods for trapping sediment and mitigating soil erosion (Esteban Lucas-Borja et al., 2021; Kondolf et al., 2014). These dams are typically defined as transverse structures constructed across riverbeds to control water flow and sediment transport (Abbasi et al., 2019). Numerous check dams have been constructed worldwide, especially in erosion-prone regions with high-density gullies (Sun and Wu, 2023). China has reported the construction of over 50 000 check dams on the Loess Plateau (Zeng et al., 2024). These high-density check dams are built along rivers, forming complex check dam networks (Gao et al., 2024; Li et al., 2022). The spatial interdependence of check dams within watershed networks presents significant challenges for assessing SY reduction. Cascading effects between upstream and downstream structures, where sediment trapping by upper dams directly influences lower ones, constitute a prevalent phenomenon (Pal et al., 2018; do Prado et al., 2024; Sun and Wu, 2023). The complexity of these cascading effects requires the development of computationally efficient approaches to simulate SY within the multi-cascade check dam systems.
Model simulations present a promising alternative for simulating soil erosion and SY (Borrelli et al., 2017). Most studies have evaluated changes in soil erosion by driving models with different input datasets, but without explicitly accounting for the effects of soil and water conservation measures, particularly check dams, on sediment transport (Lan et al., 2023; Schürz et al., 2020; Yin et al., 2025). A few studies have made localized attempts to quantify sediment trapping by check dams. For example, Yang et al. (2024) used a highly complex parametric Geomorphology-Based Ecohydrological Model to evaluate the contribution of check dams to sediment reduction in the Kuye River Basin on the northern Loess Plateau, but simplified the multiple check dams within each sub-basin into a single virtual structure. Sun and Wu (2023) integrated a check dam module into SWAT; however, their Hydrological Response Unit (HRU)-based semi-distributed modelling framework has deficiencies in positioning and simulation of check dams. Eekhout et al. (2024) assessed the sediment balance contribution of check dams in the Upper Taibilla catchment of Spain by integrating check dam trapping efficiency with an integration of the Morgan-Morgan-Finney soil erosion model into the SPHY hydrological model. This approach, however, requires detailed channel characteristics, which can be difficult to obtain in large catchments (Eekhout et al., 2024). More importantly, existing studies have focused on basin-scale aggregates rather than spatially explicit erosion-delivery-transport processes, and the grid-cell-level spatial patterns and temporal dynamics of SY reduction by cascading check dams remain poorly understood.
The SY process operates through three routing phases, i.e., soil erosion on hillslope, sediment delivery by overland flow, and sediment transport in channel (Yang et al., 2024), all governed by the overarching concept of sediment connectivity (Fabre et al., 2023). The Revised Universal Soil Loss Equation (RUSLE) can describe soil erosion on the slope (Nistor et al., 2025). DEM-based metrics such as the Index of Connectivity (IC) quantify only structural connectivity (the topographic and landscape configuration that defines potential sediment pathways) (Borselli et al., 2008; Najafi et al., 2021; Shi et al., 2025), whereas the Sediment Delivery Ratio (SDR) provides an empirical proxy for functional connectivity (the realized transfer of sediment driven by rainfall, geography, and vegetation dynamics) (Ke and Zhang, 2024; Shi et al., 2025). Therefore, the integration of RUSLE, IC and SDR, collectively termed the RUSLE-IC-SDR framework, provides a robust methodology for evaluating sediment dynamics across large spatial extents (Abebe et al., 2023; Huang et al., 2024; Vigiak et al., 2012). In highly engineered landscapes, check dams substantially influence connectivity by intercepting and storing sediment, and their influence can be quantified through sediment Trapping Efficiency (TE) (Fryirs, 2013; Verstraeten and Prosser, 2008). The TE characterizes the capacity of each dam to retain incoming sediment and can be spatially extrapolated as a measure of sediment trapping probability within dam-controlled catchments. Although some studies have combined RUSLE-IC-SDR with TE (Abebe et al., 2023; Zhao et al., 2020), most applications have not explicitly represented their spatiotemporal co-evolution, leaving the spatial distribution and temporal dynamics of sediment transfer and dam-induced retention still insufficiently resolved.
This study proposed an integrative model framework that synergizes the RUSLE-IC-SDR methodology with the check dam sediment trapping module. The framework uses a novel topological sorting strategy to establish the upstream-to-downstream routing order of individual check dam from grid-based flow direction, flow accumulation, and check dam-point locations, allowing basin-wide sediment trapping to be calculated. This improves computational efficiency, avoids double-counting in overlapping check dam-controlled areas, and preserves grid-cell-level spatial patterns of erosion, sediment yield, and check dam-induced sediment reduction. We evaluated spatiotemporal dynamics of grid-cell-based sediment reduction by check dams during 1970–2020 in the Middle Yellow River Basin (MYRB). This study aims to: (1) propose a model for describing sediment transport in complex check dam systems at large basin scales; (2) map the spatial distribution of sediment accumulation by check dams and sediment output from the basin; and (3) detect the factors controlling sediment reduction contribution by check dam. The findings will provide scientific information for optimizing the management and layout of soil and water conservation engineering measures within the basin.
2.1 Study area
The MYRB is located between the Toudaoguai hydrological station and the Huayuankou hydrological station in the Yellow River Basin, China (Fig. 1), covering an area of approximately 34.5 × 10⁴ km2, with an elevation above sea level ranging from 85 to 3917 m. The basin is influenced by a warm temperate monsoon climate. Precipitation is unevenly distributed over space and time, with an average annual rainfall of 320 mm in the northwest to 840 mm in the southwest, mostly occurring from May to September (Sun et al., 2020). The region is predominantly covered by the Loess Plateau, which is notable for its severe soil erosion and unprecedented soil and water conservation efforts. Consequently, this region serves as a major sediment source, contributing approximately 90 % of the total sediment in the Yellow River (Chang et al., 2022; Sun et al., 2020). Since the 1970s, the Chinese government and local farmers have extensively constructed check dams in the gullies across the region. According to Zeng et al. (2024), there are now over 40 000 check dams in the MYRB, with most located in hilly and gully areas. Furthermore, a series ecological restoration projects, especially the “Grain for Green” Program (conversion of cropland on slope to forestland and grassland), have been conducted to improve vegetation cover.
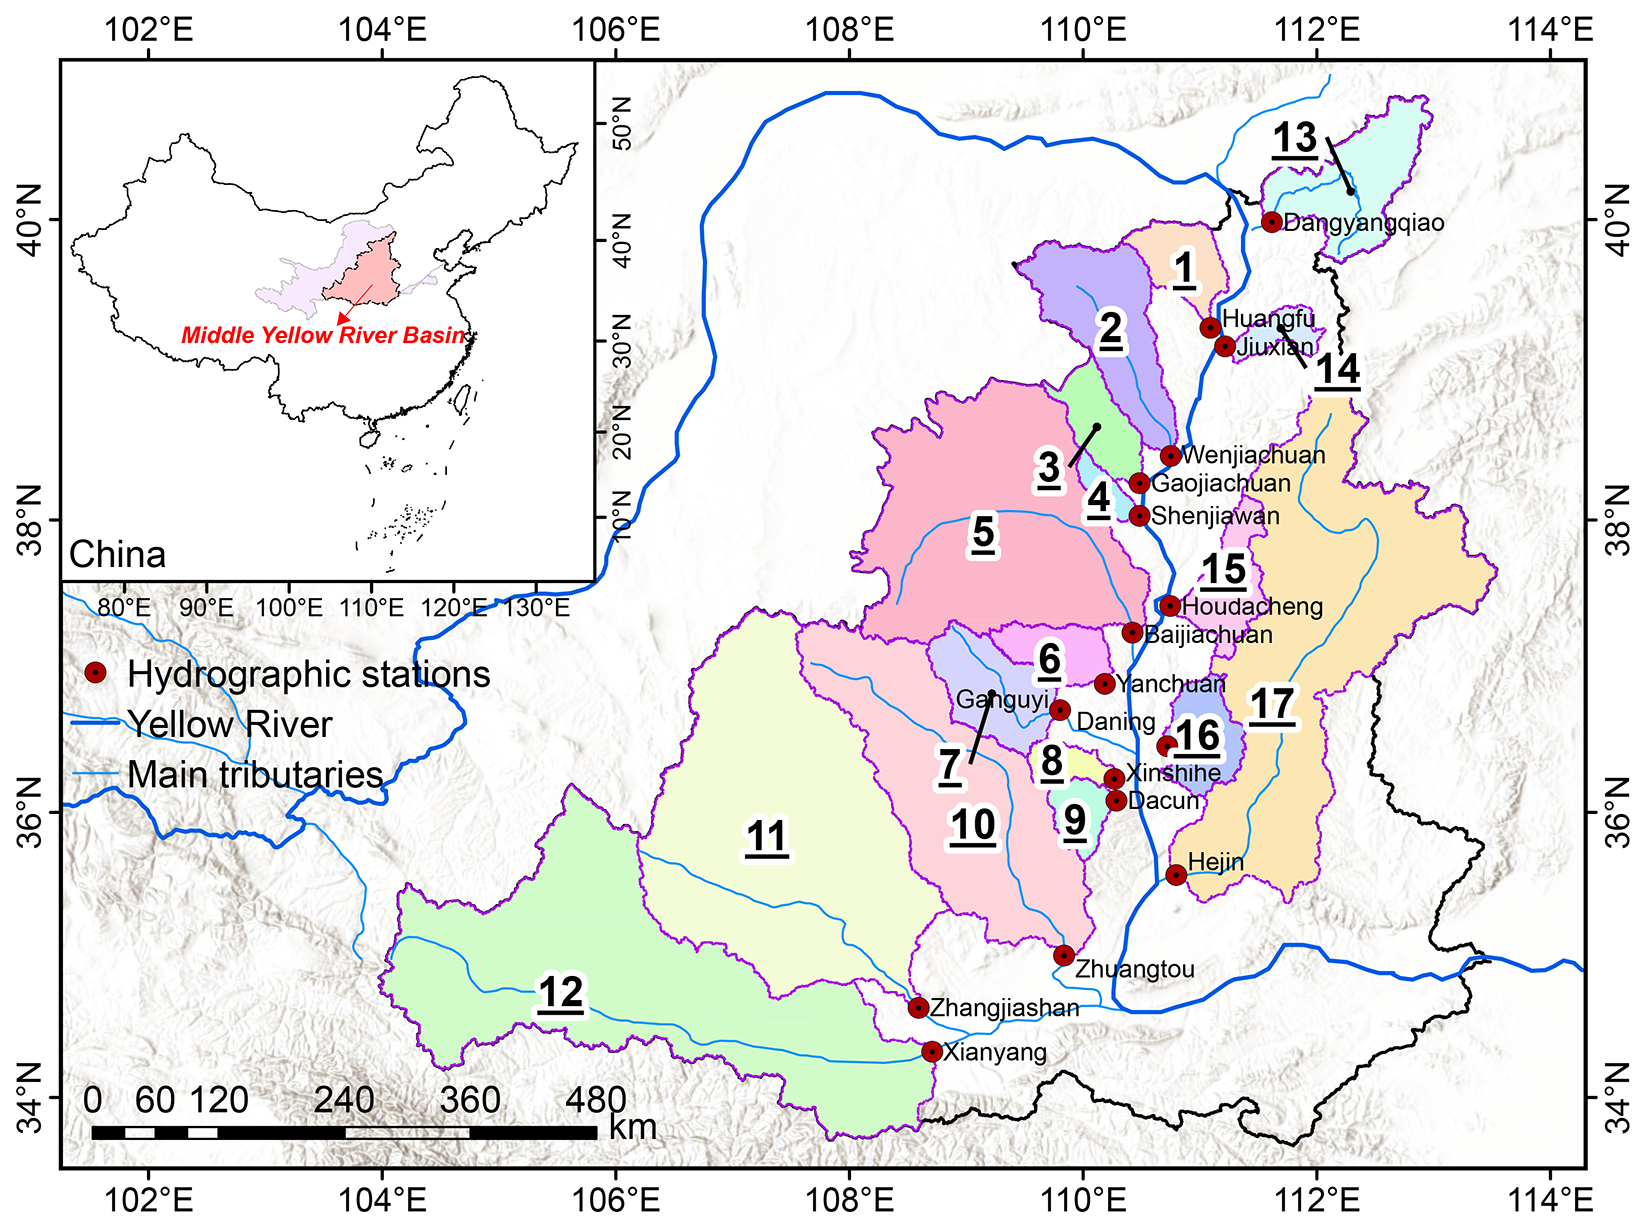
Figure 1Distribution map of sub-basins and hydrological stations in the Middle Yellow River Basin, with pink lines showing the sub-basins boundaries. The sub-basin IDs in the figure correspond to those listed in Table S1.
2.2 Datasets
In this study, we collected observed monthly SY data from 17 hydrological stations during 1970–2020 in the sub-basins of the MYRB from the Yellow River Conservancy Commission of the Ministry of Water Resources (YRCC) (Fig. 1; Table S1). The total area of the 17 sub-basins accounts for 67.9 % of the MYRB, and they have typical land cover, landform and hydrological characteristics of the region. The daily rainfall dataset at resolutions up to 0.1° sourced from a new high-quality gridded precipitation dataset (called CHM_PRE), which was developed by Han et al. (2023) using daily observations from 2839 gauges across China and surrounding areas (1970 to present). Soil data including soil organic carbon and soil particles such as sand, silt, and clay, was obtained from the SoilGrids dataset, produced by the International Soil Reference and Information Centre (ISRIC) with a resolution of 250 m (Poggio et al., 2021). The Digital Elevation Model (DEM) data, with a spatial resolution of 30 m, was sourced from the Shuttle Radar Topography Mission (SRTM-30 m) (Table 1).
The Normalized Difference Vegetation Index (NDVI) data were retrieved from two sources: the Global Inventory Modeling and Mapping Studies third-generation NDVI dataset (GIMMS-NDVI-3g) and the Terra Moderate Resolution Imaging Spectroradiometer (MODIS) Vegetation Indices (MOD13Q1). GIMMS-NDVI-3g, produced using the Advanced Very High Resolution Radiometer (AVHRR) sensor, provides NDVI data every 15 d with a spatial resolution of 8 km from 1982 to 2015 (Pinzon and Tucker, 2014). MOD13Q1 provides NDVI data every 16 d at 250 m spatial resolution from February 2000 to present. To extend time availability and ensure data comparability, the two NDVI datasets were harmonized based on overlapping periods (February 2000 to December 2015) using spatiotemporal stability analysis and statistical downscaling techniques (Huang et al., 2024) (Sect. S1). Because the purpose of this procedure was to construct a temporally consistent NDVI record, the full overlapping period was used for correction to maximize the use of available seasonal, interannual, and spatial variability. The corrected GIMMS-NDVI-3g was then assessed against MOD13Q1 during the same overlapping period. The corrected GIMMS-NDVI-3g showed good consistency with MOD13Q1 (R2=0.94, Root Mean Square Error (RMSE) = 0.053, Mean Absolute Error (MAE) = 0.038). Compared with the original GIMMS-NDVI-3g, RMSE and MAE of corrected GIMMS-NDVI-3g decreased by 46.9 % and 47.2 %, respectively (Fig. S1). These results support the use of the corrected GIMMS-NDVI-3g for deriving the C factor in RUSLE before MOD13Q1 became available in February 2000.
Land use data of five years (1975, 1990, 2000, 2010, and 2020) were obtained from the Institute of Remote Sensing and Digital Earth, Chinese Academy of Sciences, with a spatial resolution of 30 m. The overall accuracy of the land use data was 86 % (Wu et al., 2024). We reclassified land use into cropland, forest, grassland, built land, waterbody, and other land use types (Table S2). The 30 m-resolution terrace dataset across China for 2000, 2010, and 2020 was generated using a two-stage random forest classification framework that integrates time-series Landsat imagery with Copernicus DEM data (Zhang et al., 2025). This model utilized the texture features of terraces, achieving a classification accuracy of 91.7 %. The vectorized check dam dataset was sourced from YRCC and Zeng et al. (2024). The dataset integrates high-resolution (0.3–1 m) Google Earth imagery from May 2016 to 2020 and an object-based classification method, achieving an overall accuracy of 94.4 % (Zeng et al., 2024). This dataset comprises spatial location and storage capacity of check dams. Although the delineation relies on recent imagery, most terraces and check dams in the basin were constructed in the 1970s–1980s, as documented in regional conservation reports.
Table 1Summary of the datasets used in this study.
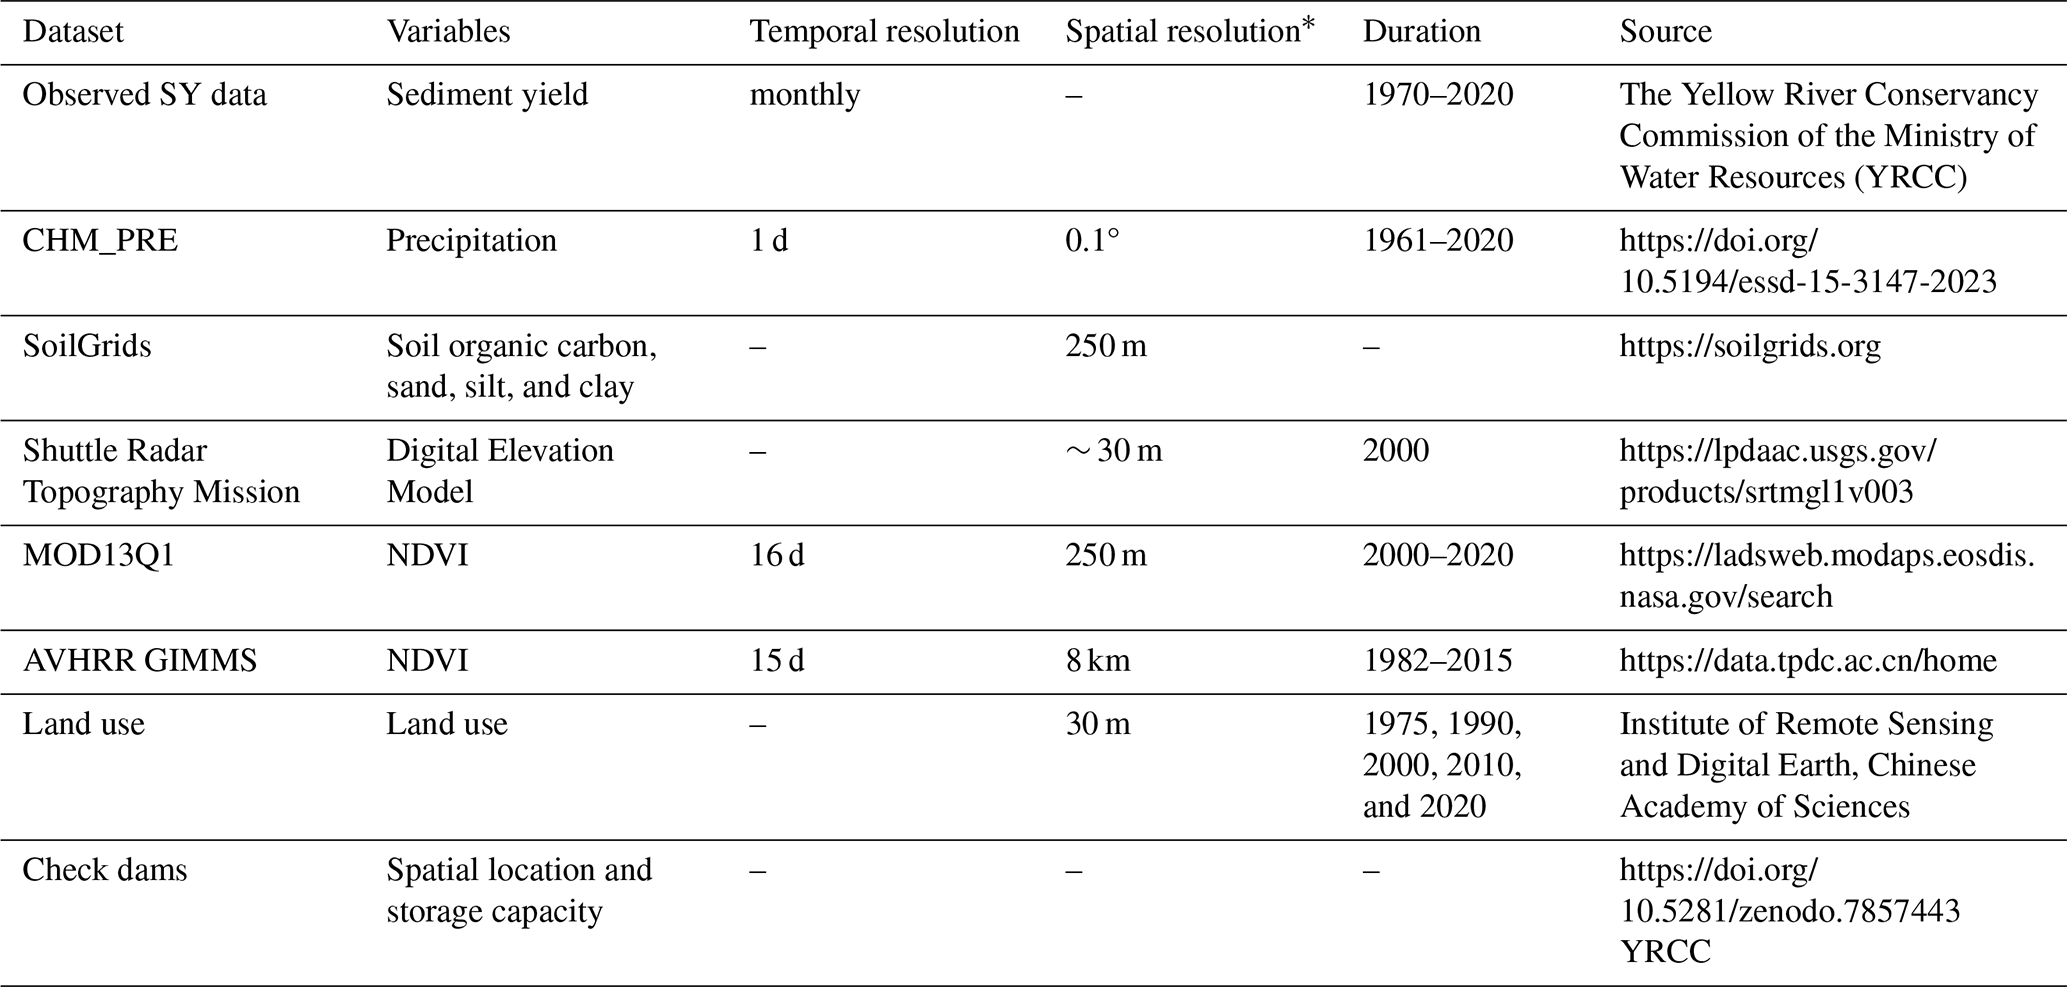
* The spatial resolutions listed in the table refer to the original datasets. The uniform resolution used for model calculation was on 100 m grid. All links in this table were accessed on 26 August 2026.
2.3 Model framework
The model simulates soil erosion, sediment delivery, and sediment trapping by check dams within watersheds through sequential processes. First, the RUSLE model was used to simulate soil erosion at a specific location on the hillslope. Second, the eroded sediment delivered to the river, namely SY, was estimated through the “RUSLE-IC-SDR” approach. Finally, in watersheds controlled by check dams, the sediment intercepted by cascading check dam systems was calculated based on the trapping efficiency (Fig. 2). On account for these processes, the watershed was divided into two parts: areas with and without check dam regulation. In areas with check dams, sediment interception is explicitly considered. In contrast, areas without check dams include only the erosion and sediment delivery processes (Fig. 2).
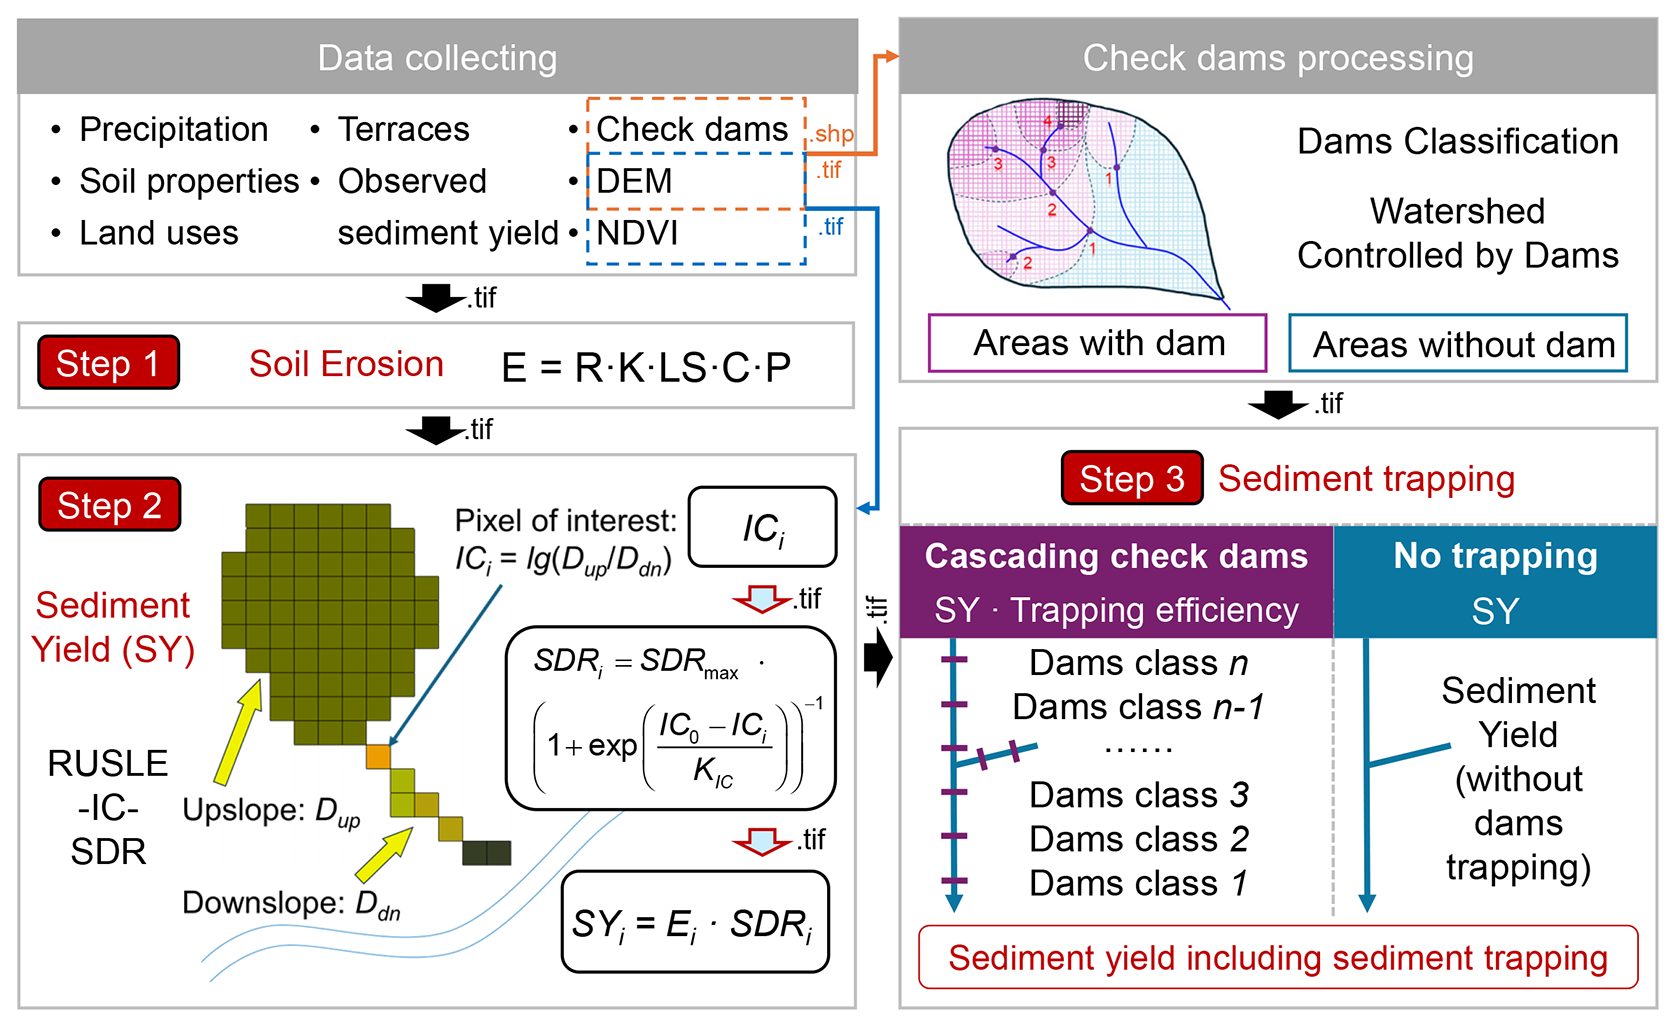
Figure 2Framework of the integrated model for simulating sediment yield in the basin with cascading check dams. Step 1 denotes the soil erosion module by RUSLE. Step 2 indicates the sediment yield module by “RUSLE-IC-SDR” method. Step 3 represents the sediment trapping module by check dam. IC represents the index of connectivity, and SDR denotes the sediment delivery ratio.
2.3.1 Soil erosion module
To improve the accuracy of erosion calculations, we first calculated the erosion rate on a monthly scale using the RUSLE model, and then summed these up to obtain the annual erosion rate (Alewell et al., 2019):
where Em is monthly soil erosion (t ha−1 m−1), Rm is monthly rainfall erosivity (MJ mm ha−1 h−1 m−1) obtained by summing daily rainfall erosivity (Rday) within month m, K is the soil erodibility (Mg ha h MJ−1 ha−1 mm−1) factor, L is the slope length factor, S is the slope steepness factor, Cm is monthly land cover and management factor, and P is the soil conservation or prevention practice factor. The annual soil erosion rate (Ey) was then calculated as: .
The R factor was calculated using the method of Xie et al., (2016) with the daily rainfall data of CHM_PRE. Daily rainfall erosivity was estimated using a power-law model with a sinusoidal monthly term to reflect seasonal variation in rainfall erosivity (Xie et al., 2016):
where Rday (MJ mm ha−1 h−1 d−1) is daily rainfall erosivity; j is the month of the year from 1 to 12; Pd (mm) is the daily effective rainfall (≥ 9.7 mm). Rm was calculated by summing Rday over the corresponding month.
The K factor was calculated according to the recommendations of the erosion-productivity impact calculator (EPIC) model (Sharpley and Williams, 1990).
where K (t ha h MJ−1 mm−1 ha−1) is the soil erodibility; San (%) is the sand content (0.05–2 mm); Sil (%) is the silt content (0.002–0.05 mm); Cla (%) is the clay content (< 0.002 mm); TOC (%) is the soil Total Organic Carbon content; and SN. For soil with soil organic matter (SOM) content (SOM = ) above 4 %, the upper limit of 4 % has been applied, to prohibit an underestimation of soil erodibility (Panagos et al., 2015; Wischmeier and Smith, 1978).
The LS factor was calculated using the method developed by Böhner and Selige (2006) in SAGA-Analyses and modelling applications. The calculation is based on specific catchment area and slope angle:
where CA (m2) defined as the discharge contributing upslope area of each grid cell; βCA (m m−1) is the weighted mean slope angle of the upslope area.
Firstly, DEM should be filled sinks in ArcGIS using Fill tool. Then Flow Accumulation tool is used to calculate Total Catchment Area (TCA) in ASGA, and Flow Width and Specific Catchment Area tool is used to calculate Specific Catchment Area (SCA). Finally, SAGA's LS Factor tool was used to calculate the LS factor (Schürz et al., 2020). To reduce topographic information loss from direct DEM coarsening, the LS factor was calculated at 30 m DEM and then aggregated to the 100 m grid using average resampling for subsequent RUSLE calculations. The C factor was derived from monthly NDVI using the exponential relationship proposed by van der Knijff et al. (2000):
where and β=1. The monthly NDVI-derived C factor captures temporal variations in vegetation cover and therefore reflects seasonal and interannual effects of vegetation cover on soil erosion (Benavidez et al., 2018). Thus, the vegetation-cover dynamics associated with ecological restoration, including the “Grain for Green” Program, can be represented by the C factor.
The P factor was assigned empirical values based on land use types, terraced distribution, and slope data (Table S2). In this study, the P factor was updated using five land-use time slices (1975, 1990, 2000, 2020, and 2020) and available terrace maps, and therefore mainly represents decadal-scale changes in land use change induced by the “Grain for Green” Program.
The gridded variables were resampled to the 100 m grid before model calculation. The 100 m resolution was selected as a compromise between retaining basin-scale spatial heterogeneity and maintaining computational feasibility for 50-year grid-cell-based simulations across the MYRB. Continuous variables (precipitation, soil properties, DEM, and NDVI) were resampled using the nearest neighbor assignment to preserve original pixel values without introducing interpolation artefacts. Categorical variables (land use and terraces) were resampled using majority resampling, which assigns each output cell the class most frequently occurring within its footprint. To ensure continuous temporal coverage for erosion model over 1970–2020, monthly NDVI for 1970–1981 was approximated using the mean monthly values from 1982–1989. Land use dynamics were represented using five time-slice maps: the 1975 map was applied to 1970–1980, the 1990 map to 1980–1990, the 2000 map to 1990–2000, the 2010 map to 2000–2010, and the 2020 map to 2010–2020.
2.3.2 Sediment yield module
The SDR, the ratio of SY to soil erosion, was applied to calculate the estimated net SY to the stream (Najafi et al., 2021). Vigiak et al. (2012) proposed that the SDR was calculated as a function of the IC:
where Dup and Ddn represent the upslope and downslope components of the connectivity, respectively. is the average weighting factor of the upslope contributing area (dimensionless). is the average slope gradient of the upslope contributing area (m m−1). Aup is the upslope contributing area (m2). di is the length of the flow path along the ith cell according to the steepest downslope direction (m). Wi is the weighting factor of the ith pixel (dimensionless), and the C factor in RUSLE was usually specified as the weighting factor (Zhao et al., 2020). Si is the slope gradient of the ith pixel (m m−1). SDRmax is the maximum theoretical SDR, which was assumed to be 1 at cell scale. SDRi is the sediment delivery ratio of the ith pixel. IC0 and KIC are landscape-independent and landscape-dependent calibration parameters, respectively, which define the shape of the sigmoid function of the SDR-IC relationship (La Licata et al., 2025; Vigiak et al., 2012). Physically, IC expresses the potential structural connection between a sediment source cell and the downstream channel. A higher IC value indicates stronger upslope sediment-supply potential and/or lower downslope impedance, meaning that eroded sediment is more likely to be delivered to the stream network. A lower IC value indicates weaker connectivity, longer or rougher transport pathways, and a higher probability of deposition before reaching the channel (Shi et al., 2025).
The IC was computed using the stand-alone SedInConnect Python scripts (Crema and Cavalli, 2018). Then, the SY (t ha−1 yr−1) could be estimated using soil erosion rates and the SDR (Huang et al., 2024):
where SYi (t ha−1 yr−1) is the off-site SY of the ith pixel, Ei is the soil erosion rate of the ith pixel.
2.3.3 Sediment trapping module by check dams
The sediment Trapping Efficiency (TE) of check dams refers to the proportion of incoming sediments that are deposited or captured behind dams. An empirical relationship that relates TE to the effective storage capacity and the watershed area controlled by check dams has been used widely (Verstraeten and Poesen, 2000):
where V denotes the remaining storge capacity (m3) of a check dam, Acca is the contributing catchment area (km2), and D is a value ranging from 0.046 to 1 (values of D=0.046, 0.1, and 1.0 can be used for fine, medium, and coarse sediments, respectively) suggested by Verstraeten and Poesen (2000). Because the Loess Plateau is dominated by fine-grained loess sediment, D=0.046 was used as the baseline value following Zhao et al. (2020). To evaluate the influence of sediment texture on trapping estimates, we further simulated sediment trapped by check dams under D=0.1 and D=1.0.
The presence of 47 391 check dams, along with interconnected and parallel check dam systems, posed a significant challenge to accurately calculate the sediment trapping capacity of check dams. To facilitate the acquisition of dam-controlled watershed areas, we utilized the “Feature To Point” tool in ArcGIS 10.2 to generate point for the check dams. Subsequently, the “Snap Pour Point” tool was employed to direct the check dam points within a 100 m distance towards the cells with the highest flow accumulation. A key methodological contribution of this study is the development of a systematic check dam classification and routing framework that allows sediment delivery and trapping to be computed sequentially along complex dam cascades without double-counting. (Fig. 3a). A dam assigned to class “n” represents a dam for which n dams occur along the downstream flow path to the cascade outlet (Fig. 3b); thus, the furthest upstream dam has the highest class number, while the terminal dam has class “1”. This classification enables sediment routing to be solved in a strictly upstream-to-downstream order, ensuring that sediment trapped in upstream dams is subtracted before calculating the sediment retained by any downstream dam (Fig. 3c). Compared with the HRU-based framework of Sun and Wu (2023), which groups areas with similar land use, soil, and slope conditions into semi-distributed units, our grid-cell-based method retains the explicit spatial location. This provides a more efficient and straightforward way to handle large and complex check dam systems.
To illustrate this procedure, Fig. 3b shows a typical watershed with multiple dams. For a downstream dam (e.g., dam 1), accurate estimation of its trapped sediment requires beginning with the furthest upstream dam (class n) and iteratively subtracting the sediment deposited in all upstream dams (class n, n−1, …, 2), as depicted in Fig. 3c. Algorithmically, this framework was implemented by combining flow direction, flow accumulation, and dam-point geometry in Python to determine the full topological ordering of dams. Once classified, individual dam-controlled watersheds were delineated using the “arcpy” package in Python (Fig. 3b), enabling the removal of overlapping contributing areas and preventing the artificial multiplication of TE where dam influence areas intersect. This step is essential because cascading check dams frequently generate overlapping control regions, and failing to separate them can lead to substantial overestimation of trapped sediment (Fig. 3b, c). After establishing the classification system and routing sequence, we implemented annual sediment routing and trapping computations for 1970–2020 using Python with “multiprocessing” and “joblib” to improve computational efficiency across 47 391 dams. All sediment routing and trapping calculations were conducted on an annual basis. For each year from 1970 to 2020, TE was calculated using the remaining storage capacity at the beginning of that year; trapped sediment was then subtracted from the remaining capacity and carried forward to the next year. The soil bulk density was set at 1.47 g cm−3 in this study, based on an average of 60 samples from six profiles (0–12 m) by Fang et al. (2023) on the Loess Plateau.
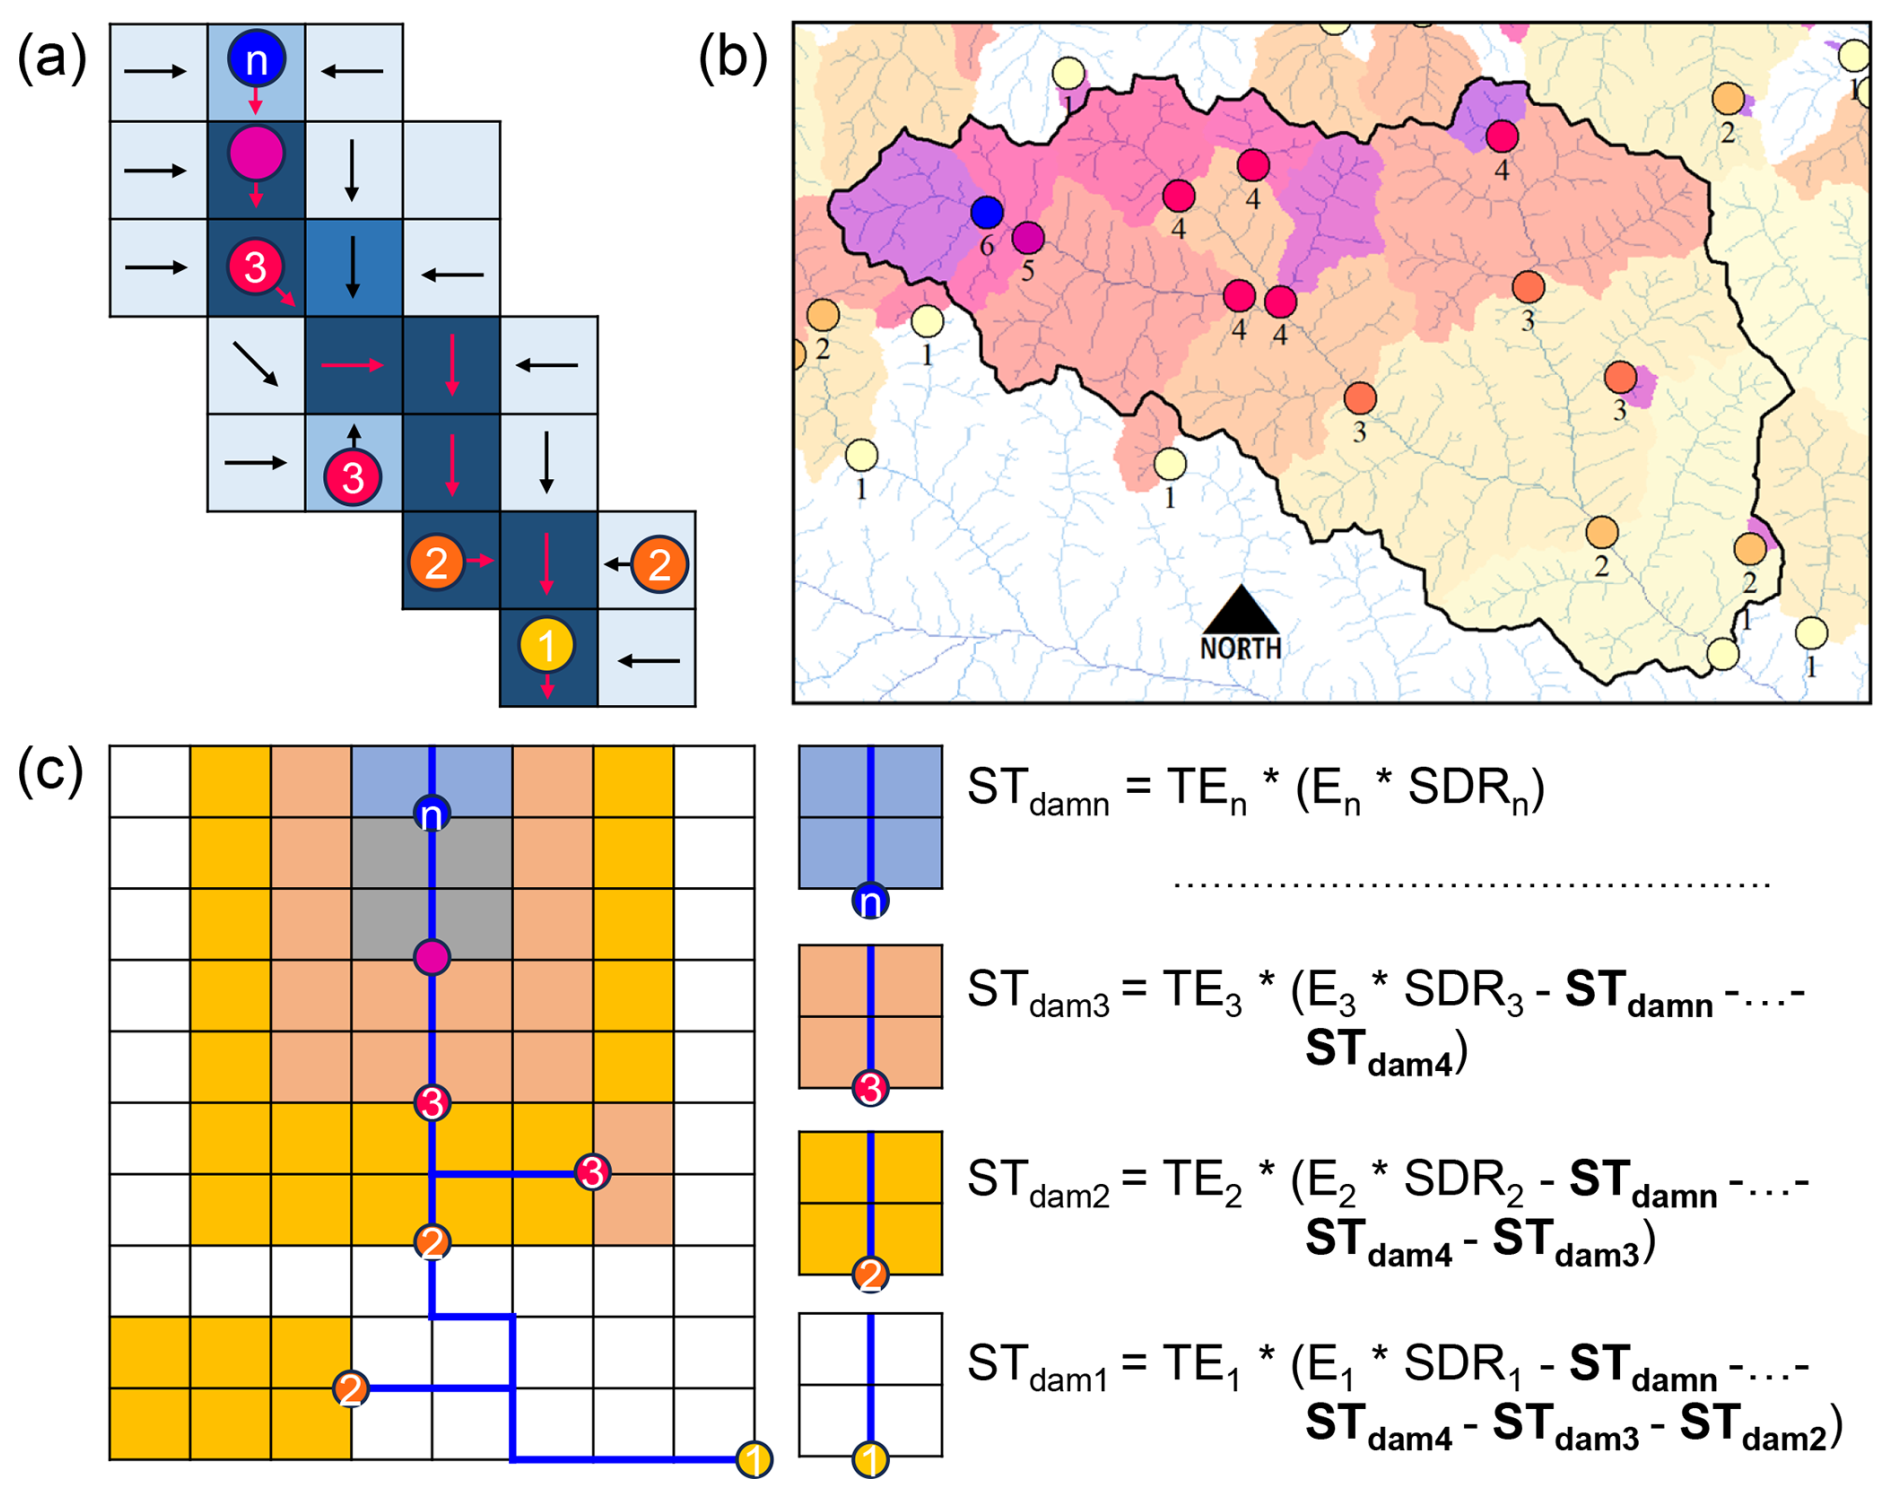
Figure 3The generalized process and conceptual diagram of sediment trapping by cascading check dam system. (a) An example of check dam classification based on flow direction data. (b) An example of cascading check dam distribution in a catchment. (c) Equations to describe Sediment Trapping by cascading check dams. STdamn, …, STdam3, STdam2, and STdam1 represent sediment trapped in the area controlled by check dam class n, …, 3, 2, and 1, respectively. TE represents the sediment trapping efficiency of the check dams; E and SDR refer to the pixel-based soil erosion rate and sediment delivery ratio, respectively.
2.4 Parameter calibration and simulation analysis
The conversion from IC to SDR requires calibrating the parameters IC0 and KIC. Due to variations in sub-basin characteristics such as topography, soil, and climate (Hao et al., 2022), the optimal combinations of IC0 and KIC differ across sub-basins. Each sub-basin was represented by 100 m grid cells, which served as the basic computational units for soil erosion, IC, SDR, and SY estimation. Sub-basins were used for calibration, goodness-of-fit assessment, and aggregation of grid-cell-level results. In this study, we conducted individual parameter calibration for 17 sub-basins controlled by hydrological stations. Initially, 70 combinations of IC0 and KIC were tested, with IC0 ranging from −7 to −1 (in steps of 1) and KIC from 0.5 to 5 (in steps of 0.5). Each parameter set was applied to the proposed integrated SY model in each sub-basin. This process was repeated for all the 70 combinations, yielding SY values with accounting for trapping of check dams. The observed and simulated SY were compared to evaluate the model's predictive capability using the Nash-Sutcliffe Efficiency coefficient (NSE) (Huang et al., 2024). If the optimal parameter combination fell outside the initial range, the parameter steps were adjusted based on the trend of NSE variation until the optimal combination was identified. For the remaining areas outside these 17 sub-basins, we used the average of the optimal parameters of nearby sub-basins to calculate SDR, which is used to complete the SY estimation for the entire MYRB. The simulated SY was compared with observations from 17 hydrological stations to evaluate whether the parameterized model could reproduce long-term SY dynamics at the sub-basin outlet scale. Model accuracy was quantified using NSE and R2 (Huang et al., 2024). Several SY outliers were identified using the Bonferroni-adjusted studentized residual test, Q-Q residual diagnostics, and Cook's distance, and they were excluded from the goodness-of-fit statistics. In addition, to independently assess the sediment trapping module, the simulated sediment accumulation was compared with field-surveyed sediment accumulation data from 61 check dams reported by Fang et al. (2023).
Previous applications of the traditional RUSLE-IC-SDR framework do not explicitly account for the sediment trapping of the dams (Lan et al., 2023; Schürz et al., 2020; Yin et al., 2025). Building on this context, the key focus of our study was the explicit incorporation of TE-based check dam trapping, which represents sediment interception and storage within each dam along cascading dam systems. To evaluate the impact of check dams trapping within the RUSLE-IC-SDR framework, we compared two model configurations. The first configuration activates the full TE-based trapping scheme, while the second follows the traditional RUSLE-IC-SDR setup in which sediment is routed through the landscape without sediment trapping by check dams. The combinations of IC0 and KIC in this scenario remained identical to that in the actual check dam-regulated scenario. This design ensures that the only difference between the two simulations is whether check dam trapping is represented. The resulting SYs are denoted as SYTrap (with sediment trapping) and SYnoTrap (without sediment trapping), and the Sediment Reduction Contribution by check dams (SRCdam) was computed as:
3.1 Performance of integrated model considering cascading check dams
The check dams were primarily distributed in the central part of the MYRB, forming highly complex cascading systems (Fig. 4). The area controlled by check dams is 4.68 × 10⁴ km2, accounting for 13.55 % of the MYRB. The total designed storage capacity of all check dams is 6.36 × 10⁹ m3, predominantly comprising small dams (< 10 × 104 m3), which account for 68.0 % of the total number (Fig. 4a). There was 68.78 % (n=32 595) of the check dams within a cascading system. Within these systems, ≥ 6-tier check dams constitute 16.65 % (n=7892) of the total count, while a subset of 0.56 % (n=265) exhibit exceptionally high class (16–27 tiers), indicating 16–27 sequentially constructed check dams along river channels from upstream to downstream (Fig. 4b).
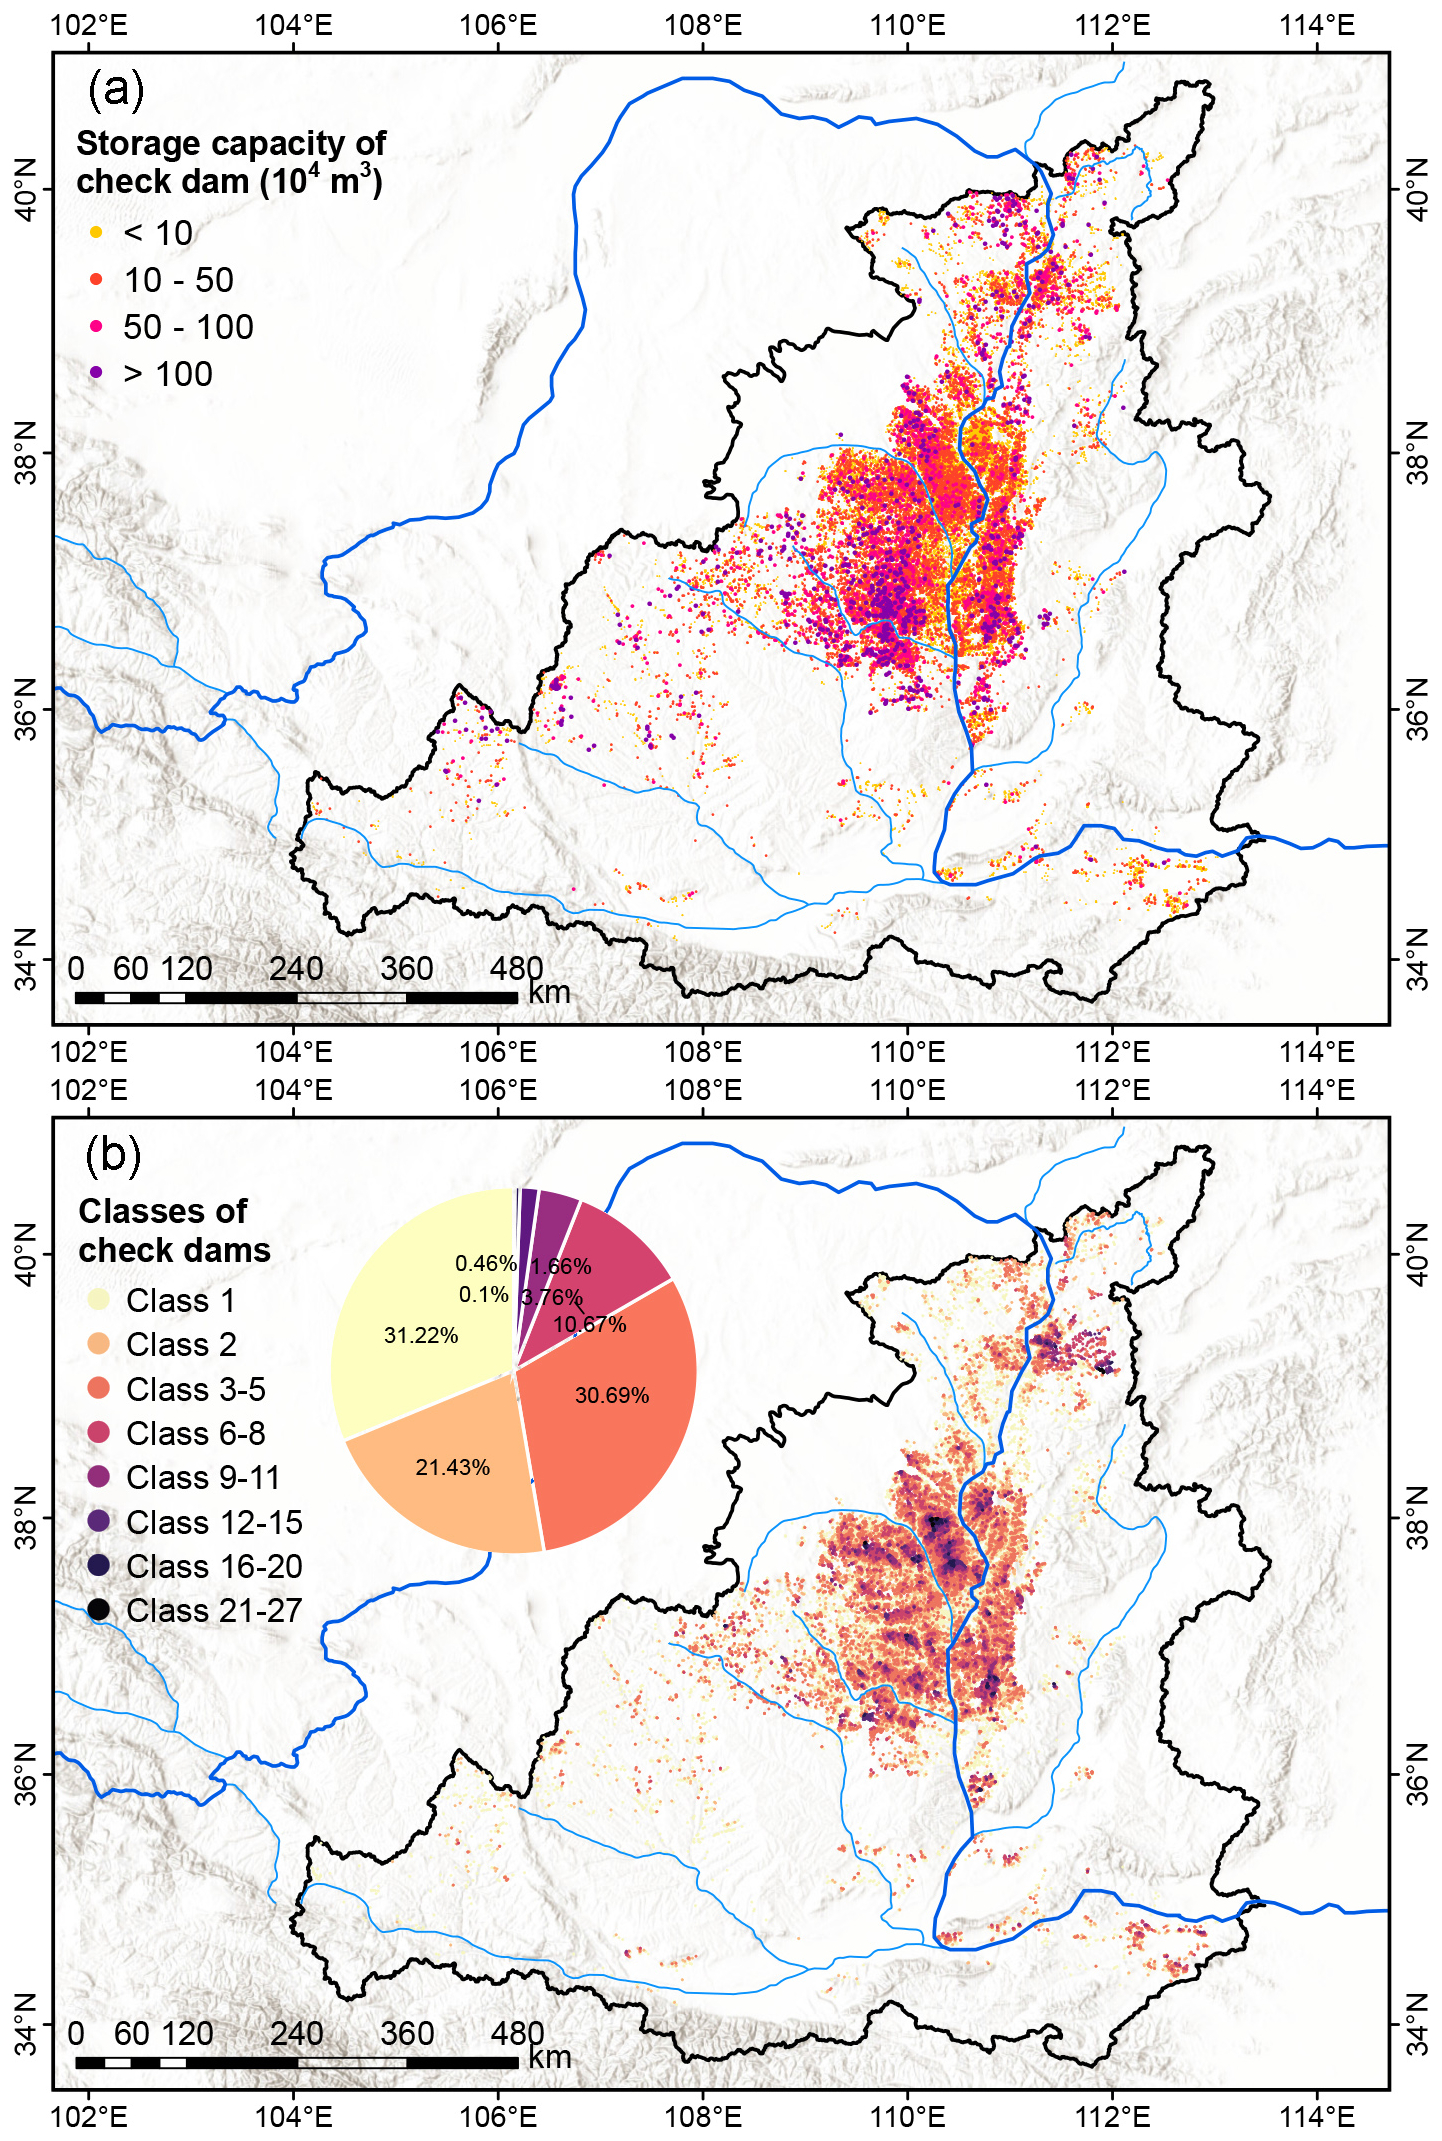
Figure 4Distribution map of (a) storage capacity of check dams, and (b) classification of check dams in the Middle Yellow River Basin. The pie chart shows the proportion of different classes of check dams. Class n indicates that there is n sequentially constructed check dams along river stream in the catchment.
The proposed model framework considered the effects of cascading check dams on SY. The optimal combinations of IC0 and KIC in the model varied across sub-basins (Fig. S2). Our analysis demonstrates that models incorporating check dam sediment trapping exhibit superior model performance compared to counterparts excluding check dams (Fig. 5). Model goodness-of-fit assessment using observed SY from 17 hydrological stations in the MYRB showed that incorporating the sediment trapping of check dams could improve the NSE to 0.713 (R2=0.71) (Fig. 5a), representing a 20.0 % improvement compared to the traditional model (NSE = 0.594, R2=0.72) (Fig. 5b). In addition, the simulated sediment trapping by check dams agreed well with the observations from field survey (NSE = 0.651, R2=0.75) (Fig. S3).
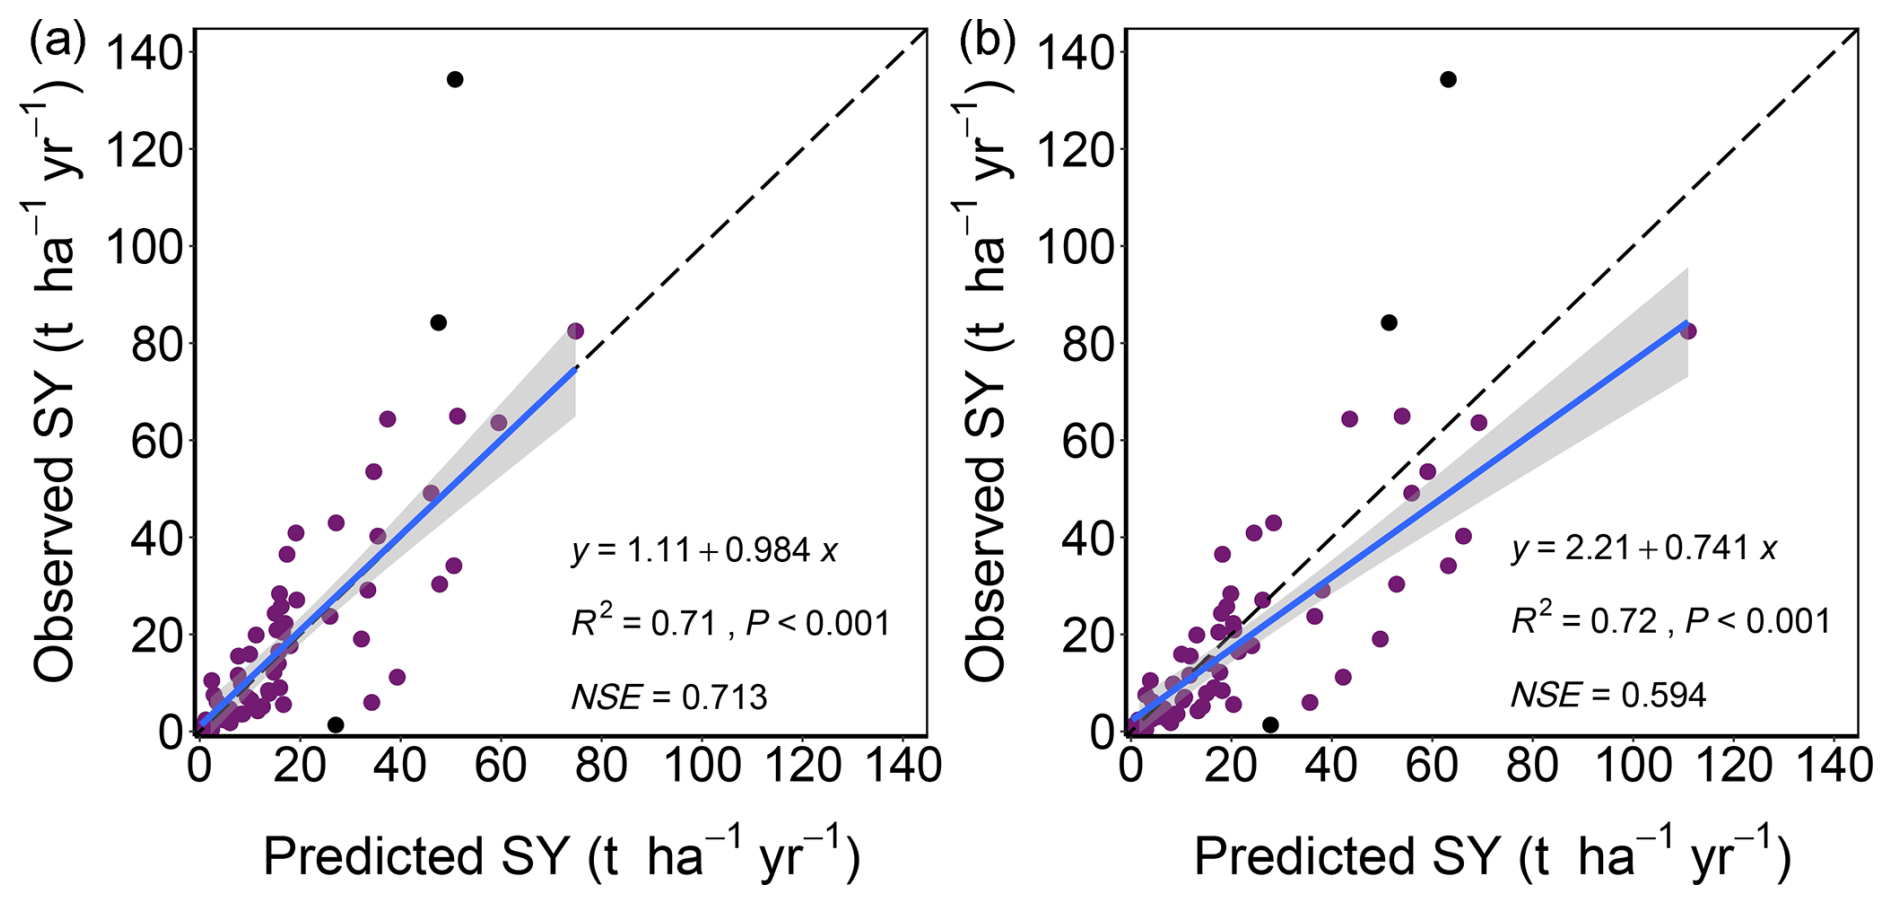
Figure 5Comparison between model-estimated and observed sediment yield (SY) (a) with and (b) without considering sediment trapping by check dams. The three black points in the figure are identified outliers that may be associated with artificial water and sediment regulation, and they were excluded from the goodness-of-fit statistics. The shaded areas indicate the 95 % confidence interval of the fitted regression lines. The dashed line indicates the 1:1 line.
3.2 Sediment yield under influences of check dams
From 1970 to 2020, decadal soil erosion rates in the MYRB were 52.65 ± 11.20, 56.46 ± 8.17, 52.11 ± 10.33, 47.61 ± 15.06, and 29.97 ± 7.54 t ha−1 yr−1 in 1970s, 1980s, 1990s, 2000s, and 2010s (Fig. S4). Overall, soil erosion rate decreased across 85.95 % of the basin. Among the 17 sub-basins, average soil erosion rates ranged from 21.19 (Zhujiachuan River basin) to 192.05 t ha−1 yr−1 (Qingjian River basin) (Fig. S5). The mean IC in the MYRB was −3.90 ± 1.45. IC is relatively high in the central basin, covering the hilly-gully regions (about −4 on slopes to around −2 in gullies). However, the hilly-gully region exhibited a rapid decline in IC ( yr−1) during 1970–2020. In contrast, the southern and eastern valley plains showed comparatively low IC (), and an increasing trend of IC was observed in some areas (Fig. S6). The SDR derived from optimal IC0–KIC combinations varied substantially among sub-basins. The Fen River basin exhibited the lowest average SDR (0.02), while the Kuye River basin (0.83) and the Huangfuchuan River basin (0.89) reported higher SDR values. Overall, SDR exhibited a declining trend (Fig. S7). In the densely dammed central basin, many check dam systems achieved a TE above 0.80. With the decreases of the effective storage capacity in these check dams, TE generally showed a declining trend (Fig. S8).
Check dams have effectively prevented sediment from being transported out of the watershed (Fig. 6). Under the influence of check dams, the 50-year average SY in MYRB was 15.42 ± 4.56 t ha−1 yr−1, which represents a 12.6 % reduction compared to scenario without sediment trapping by check dams (17.64 ± 5.55 t ha−1 yr−1) (Fig. 6). A comparison of Fig. 6a, b reveals that in the central and northern basin with relatively high SY, there are numerous patches characterized by lower SY (i.e., watersheds controlled by check dams) (Fig. S9). In these watershed areas controlled by check dams, the 50-year average SY was 16.38 ± 6.19 t ha−1 yr−1, representing a 50.01 % reduction compared to the scenario without sediment trapping by check dams (32.76 ± 11.97 t ha−1 yr−1) (Fig. 6).
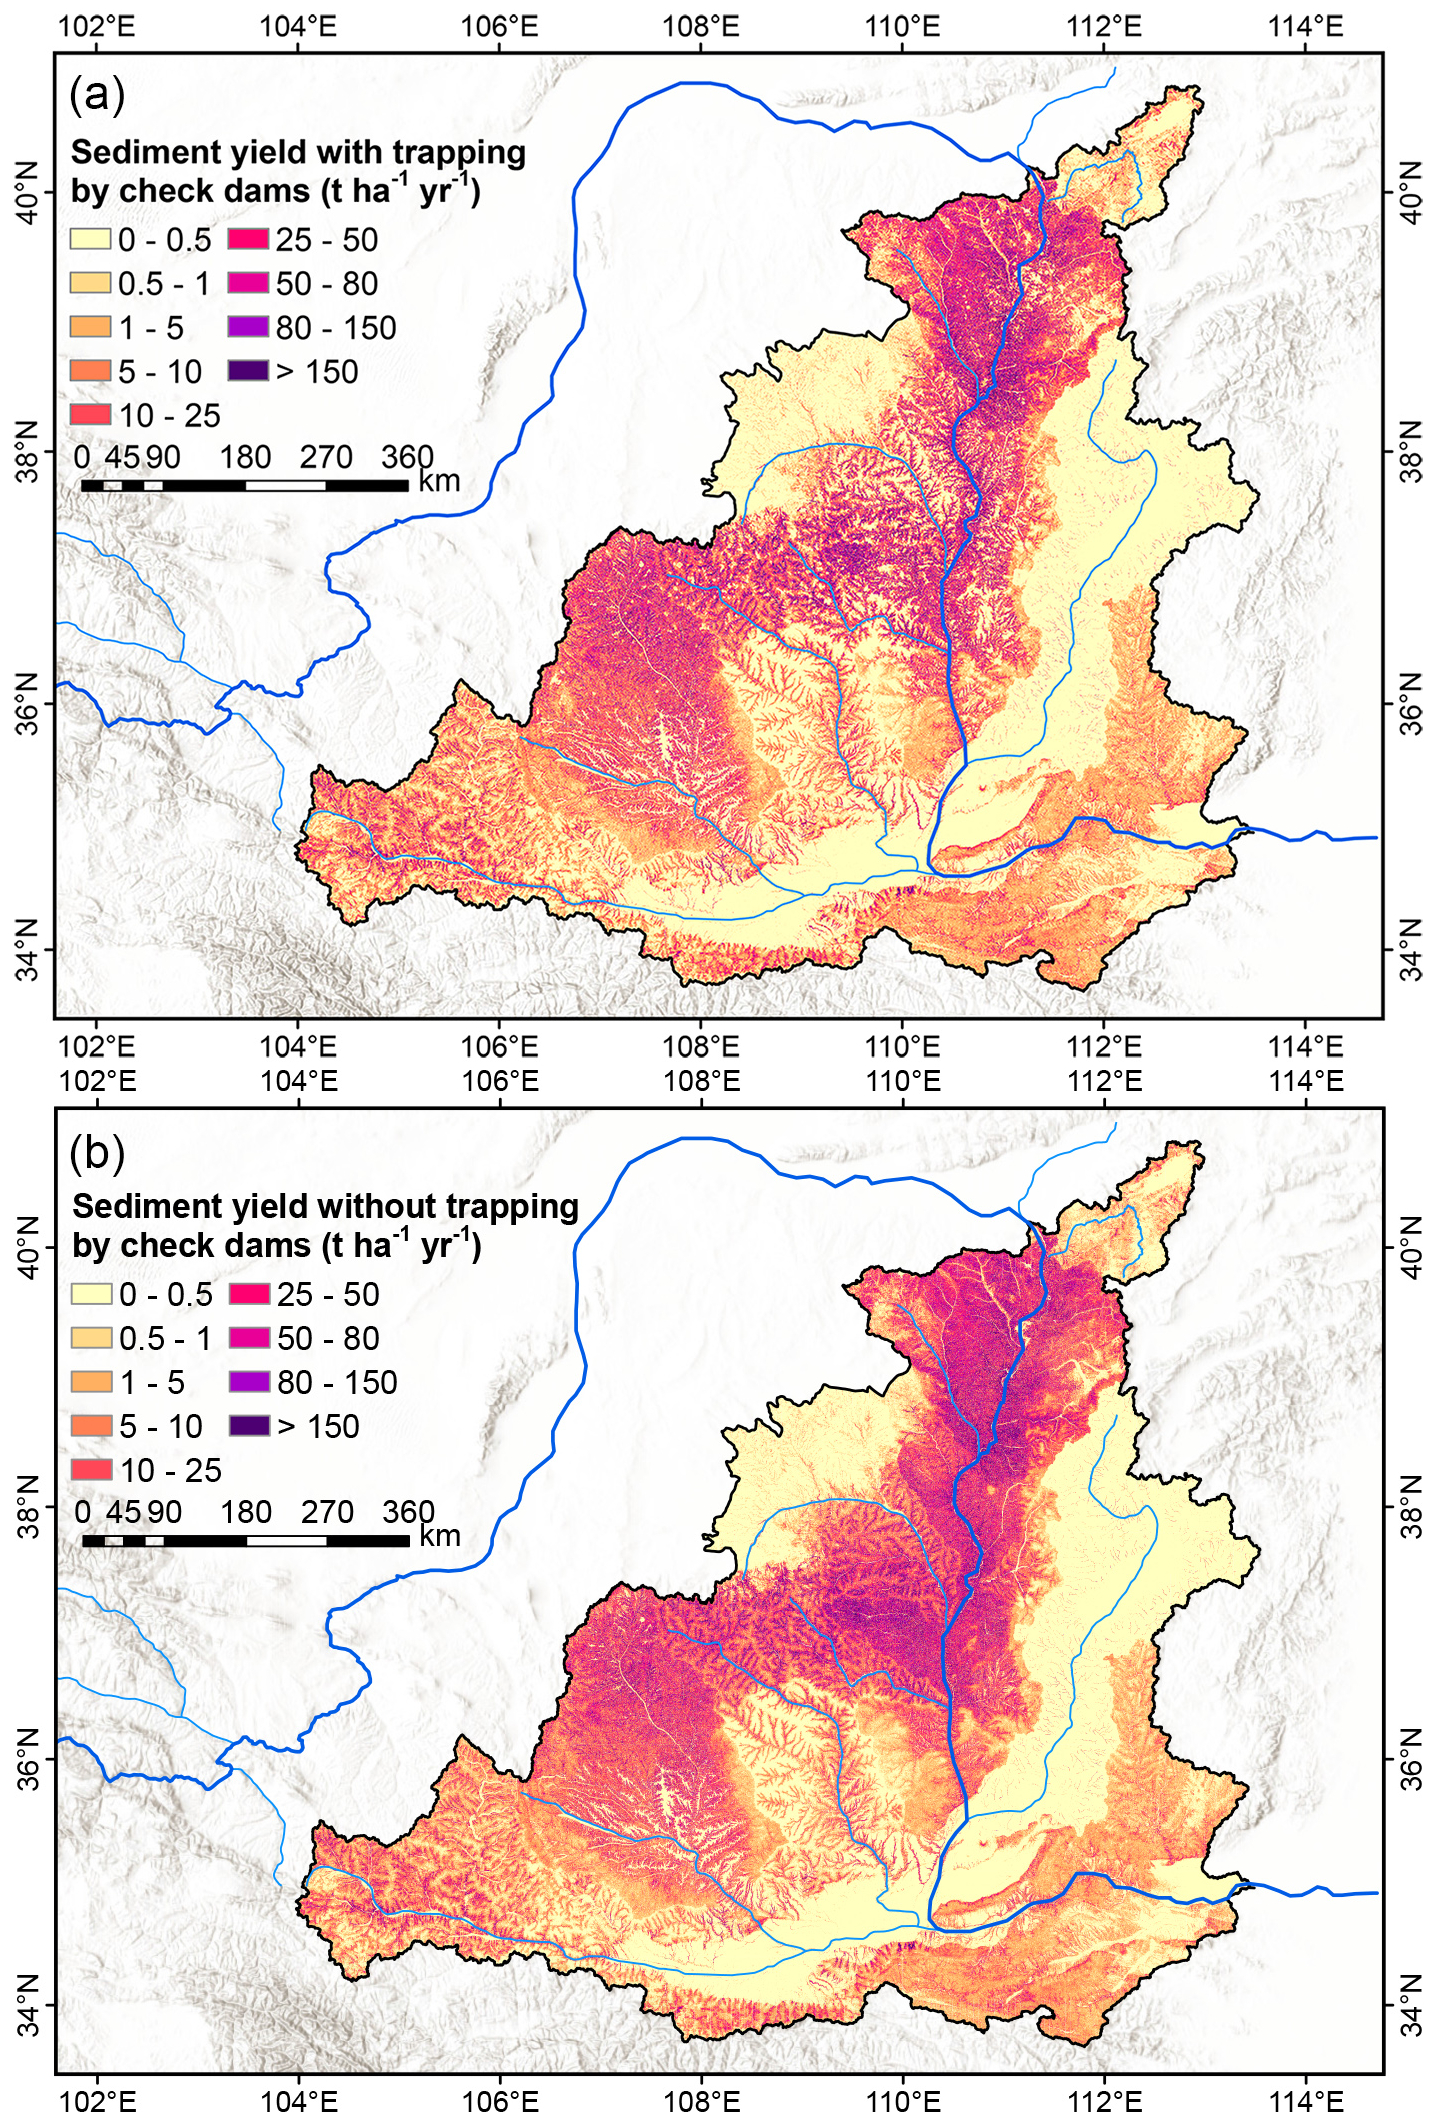
Figure 6Comparison of the spatial distribution of multi-year average sediment yield (a) with and (b) without considering sediment trapping by check dams during 1970–2020 in the Middle Yellow River Basin.
During 1970–2001, the multi-year average SY in MYRB was 17.41 ± 3.61 t ha−1 yr−1, showing no significant changing trend (P=0.184) (Fig. 7). After 2002, the average SY decreased to 11.89 ± 3.93 t ha−1 yr−1, representing a 31.71 % reduction compared to 1970–2001, with a statistically significant downward trend during 2002–2020 (P < 0.001) (Fig. 7). Furthermore, the difference in SY between scenarios with and without sediment trapping by check dams has been gradually narrowed, decreasing from 14.42 % during 1970–2001 to 7.45 % in the post-2001 period (Fig. 7).
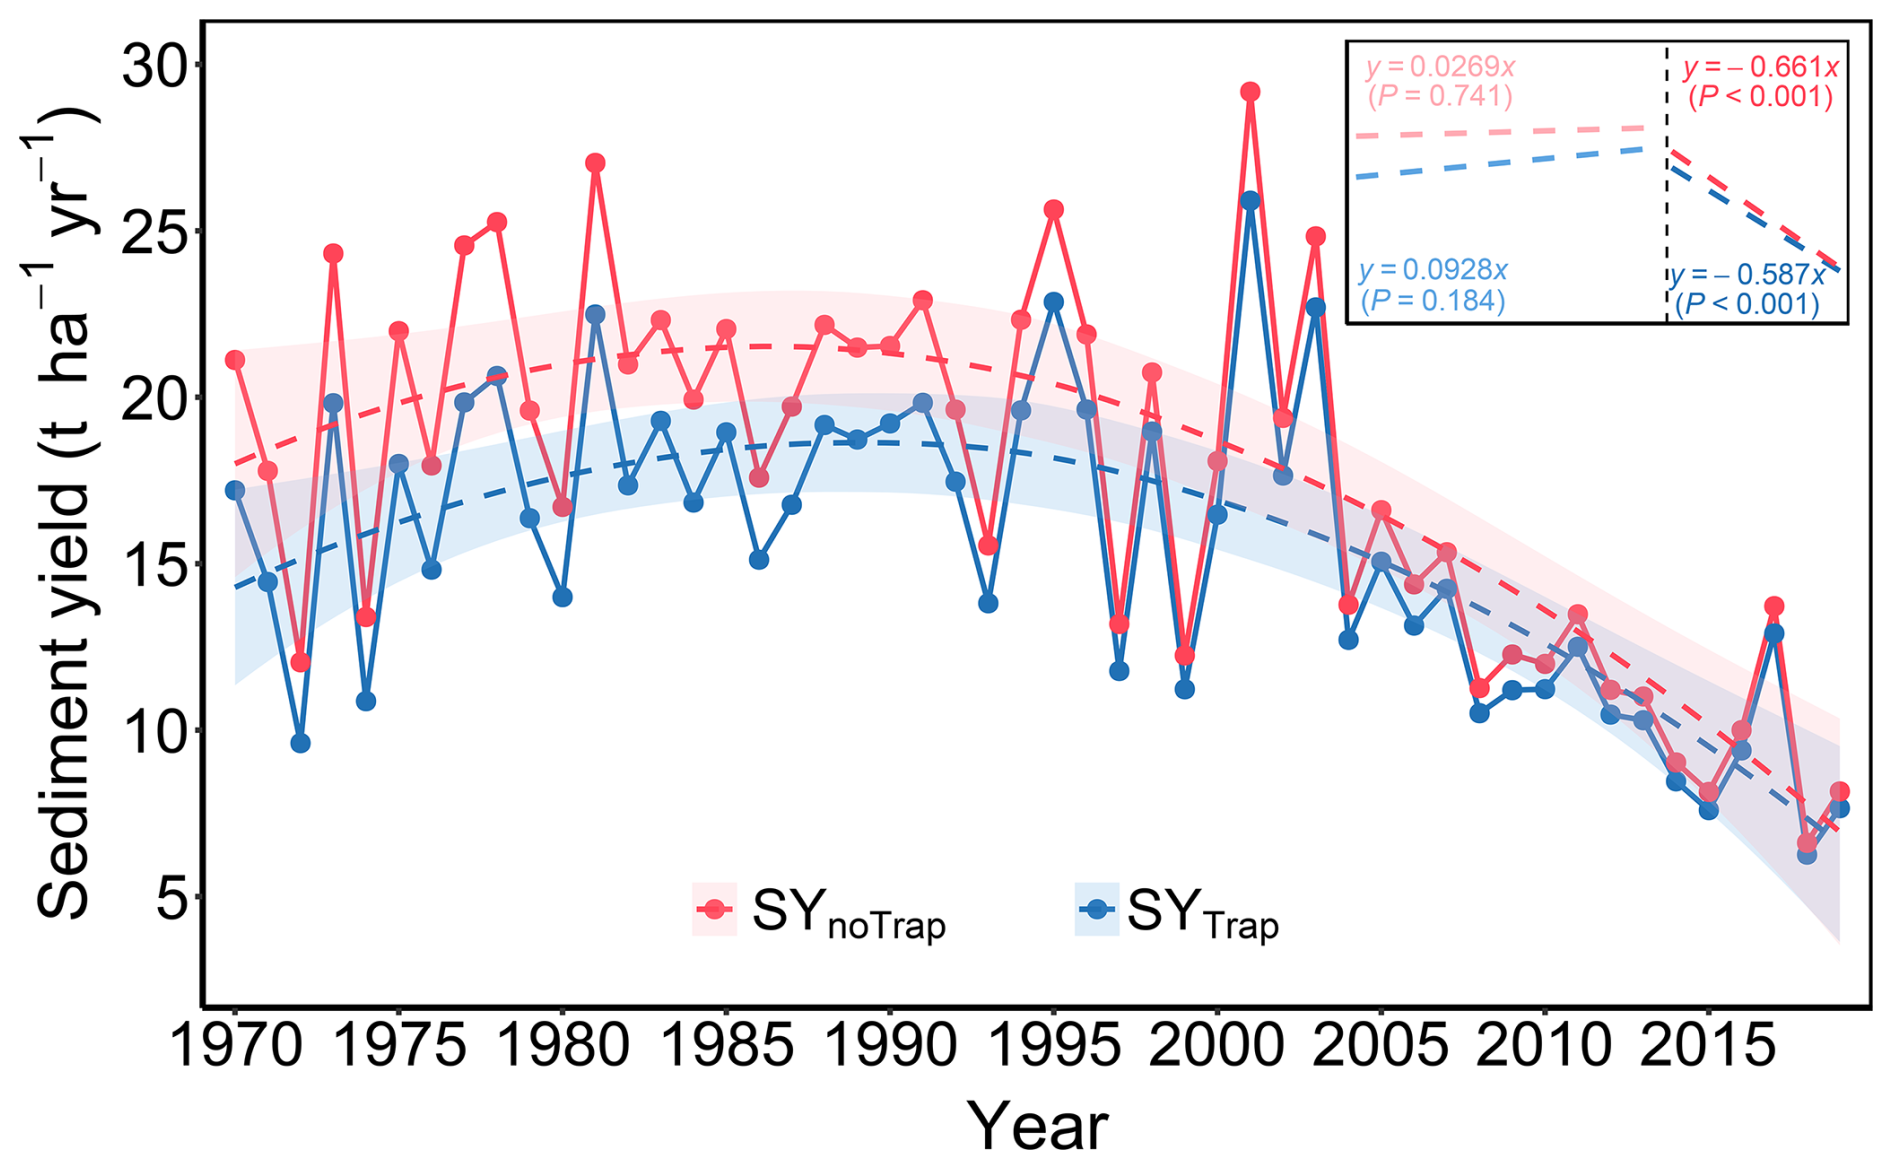
Figure 7Interannual variations in average sediment yield (SY) with (SYTrap) and without (SYnoTrap) sediment trapping by check dams during 1970–2020 in the Middle Yellow River Basin. The dashed line represents a fitted curve, with the shaded area indicating the 95 % confidence interval. The inset in the upper right displays the linear regression trend of SY before and after 2001.
3.3 Dynamics of sediment reduction and trapping by check dams
In the MYRB, the overall trend in sediment reduction contribution by check dams (SRCdam) showed a gradual decline, with a 50-year average value of 11.80 ± 4.56 % (Fig. 8). In the first decade (1970–1979), the SRCdam remained above 18 %. During 1980–2001, the SRCdam was 12.56 ± 2.62 %, whereas after 2002, it significantly declined to 7.17 ± 1.19 % (P < 0.001) (Fig. 8). The SRCdam varied widely across sub-basins, ranging from 1.00 % in Fen River basin to 52.46 % in Jialu River basin in the first decade (Fig. S10). During 1980–2001, SRCdam in sub-basins ranged from 0.91 % (Fen River basin) to 43.65 % (Jialu River basin). After 2002, the range of SRCdam narrowed to 0.93 % (Fen River basin) – 37.41 % (Fenchuan River basin).
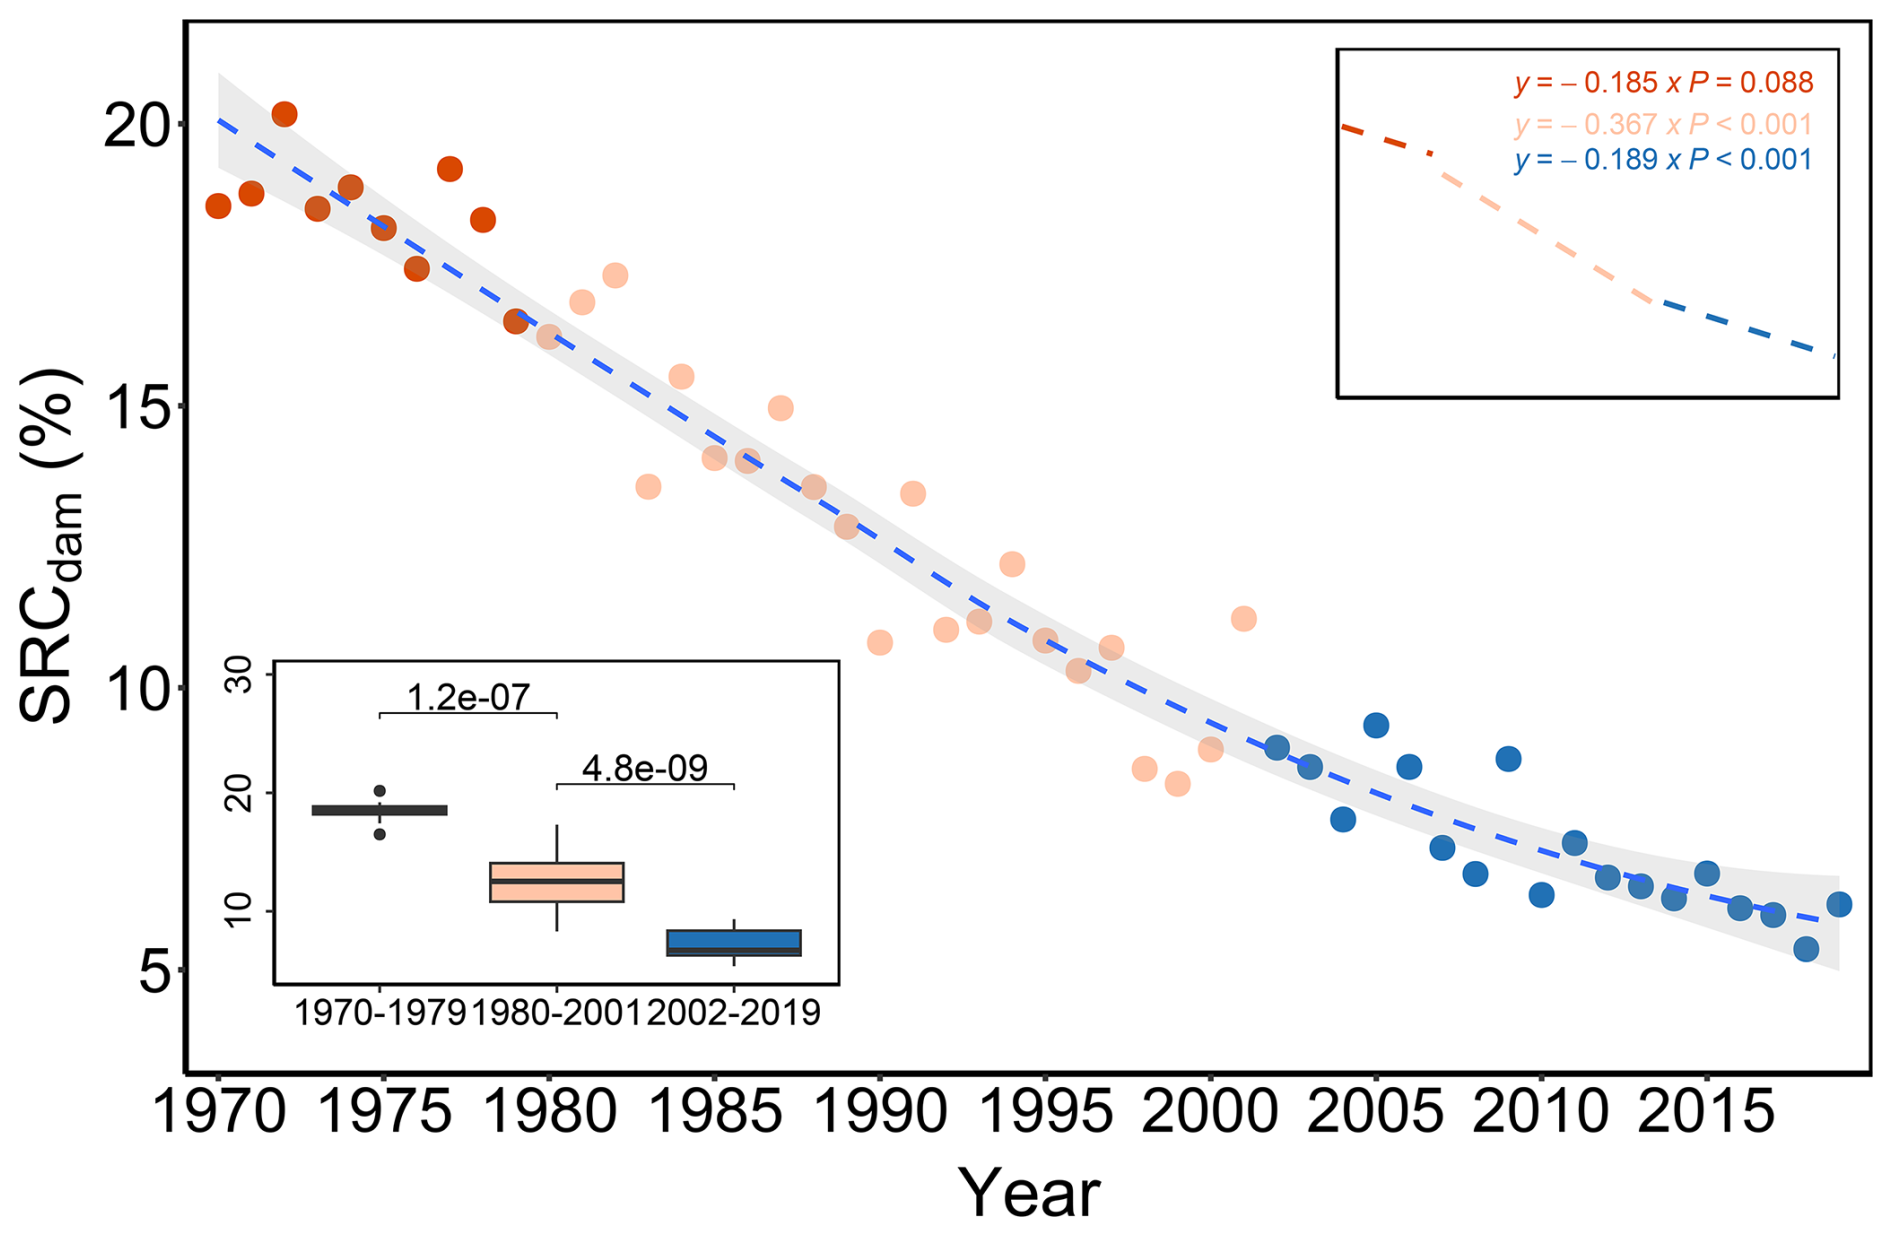
Figure 8Interannual variations in the Sediment Reduction Contribution of check dam (SRCdam) in the Middle Yellow River Basin. The inset in the lower left represents the average SRCdam during the 1970–1979, 1980–2001, and 2002–2020. The shaded area indicates the 95 % confidence interval.
The accumulated sediment trapped by all check dams in the MYRB over the past 50 years was 3.84 × 10⁹ t, occupying 41.49 % of the total designed storage capacity (Fig. 9). During the first decade, sediment accumulation rates in check dams were highest, averaging 126.24 × 10⁶ t yr−1, accounting for 13.62 % of the total storage capacity (Fig. 9). Between 1980–2001 and post-2001, the average sediment accumulation rates decreased to 90.29 × 10⁶ and 33.03 × 10⁶ t yr−1, respectively. Accumulated sediment during these two periods represented 21.44 % and 6.42 % of the total storage capacity, respectively (Fig. 9).
In the first decade (1970–1979), check dams were filled rapidly, with only 27.13 % of check dams retaining more than 95 % of their storage capacity, while 8.30 % had already lost over 90 %. By 2001, sediment accumulation further reduced storage capacity, with just 9.48 % of check dams maintaining over 95 % capacity and 29.92 % experiencing losses of exceeding 90 % capacity (Fig. 9). Until 2020, 55.08 % of the check dams lost more than 50 % of their storage capacity due to sediment deposition (Fig. 9). Among these, 37.47 % of the check dams lost over 90 % of their storage capacity, and only 7.43 % of the check dams accumulated less than 5 % capacity (Fig. 9).
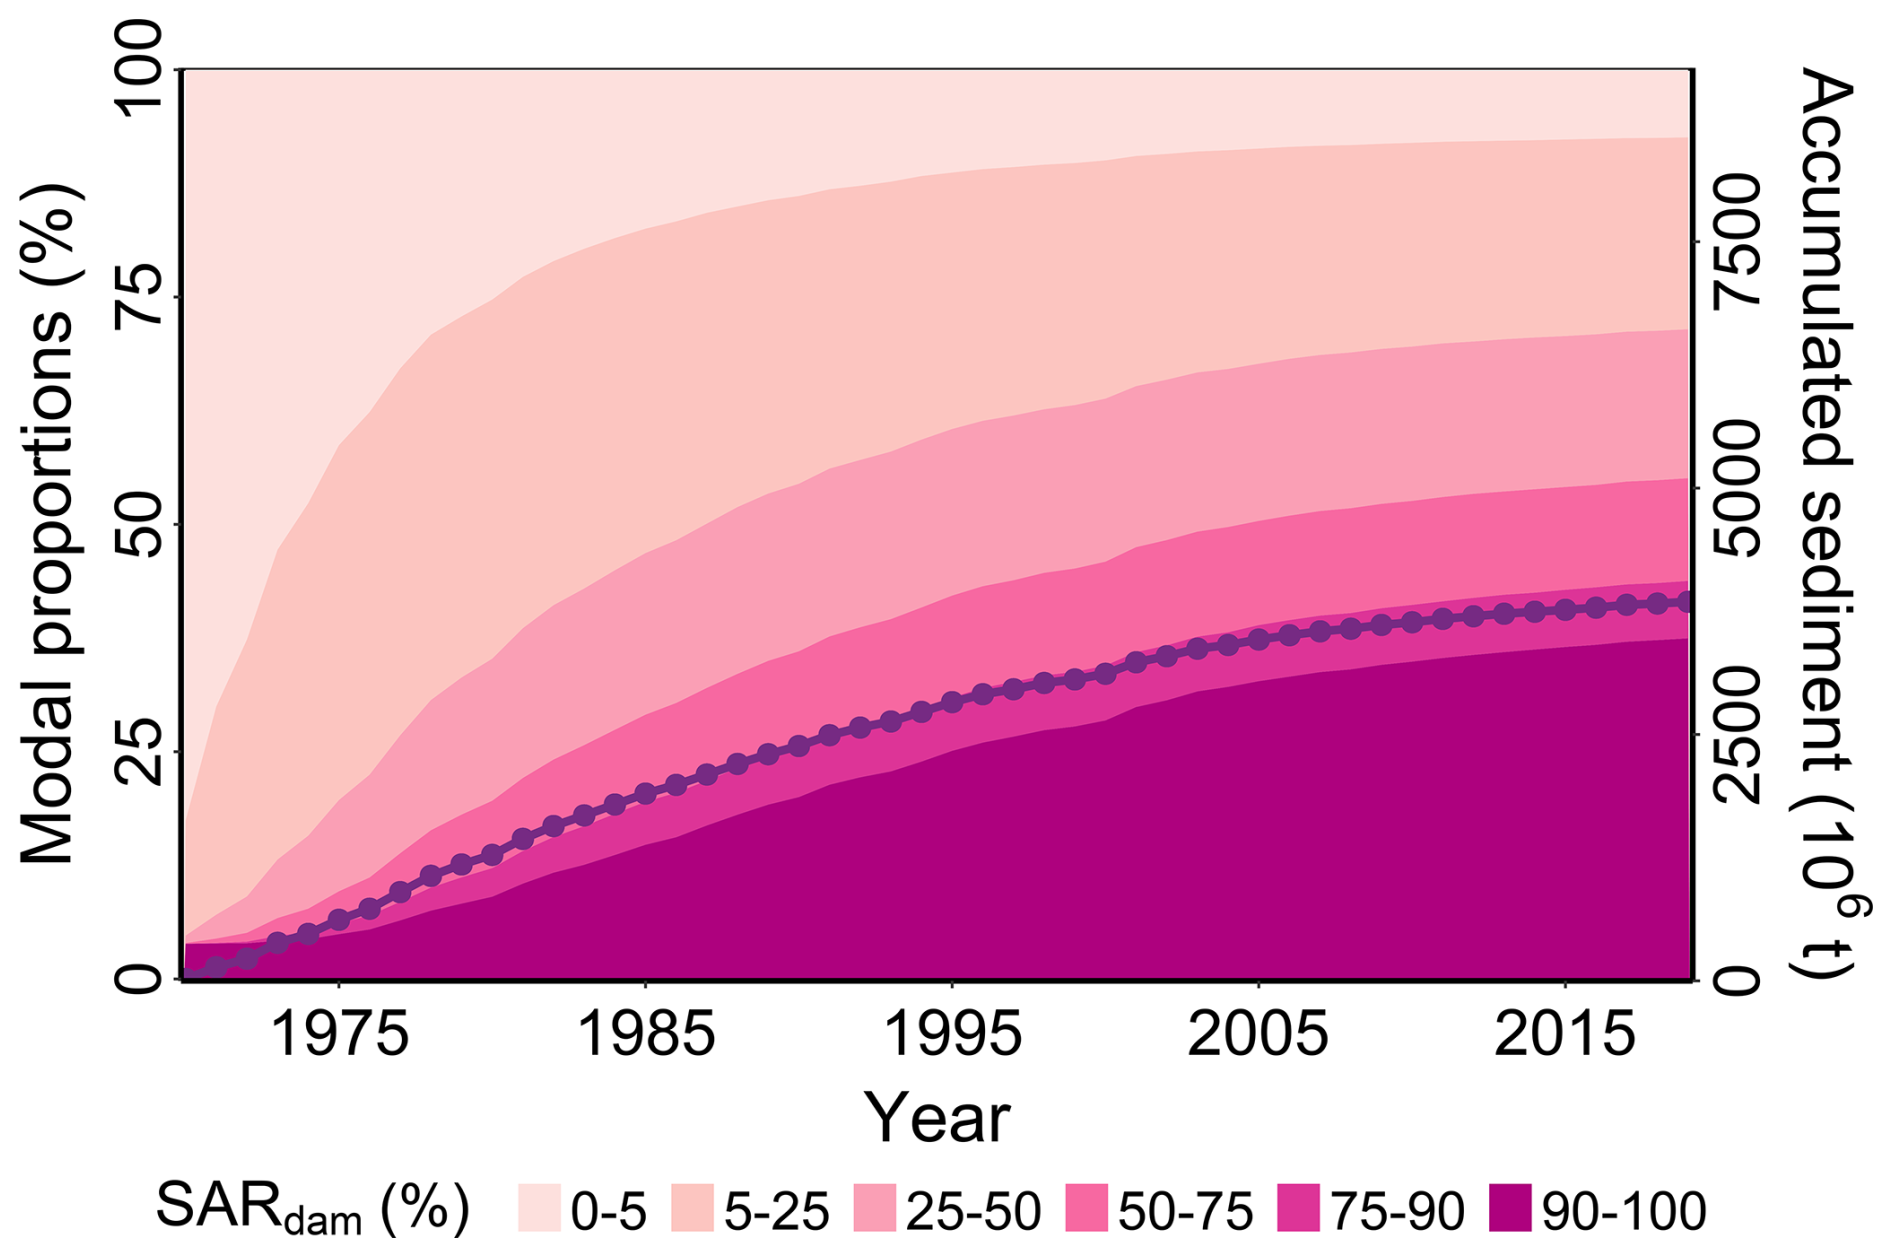
Figure 9Modal proportions of check dams characterized by different proportions of accumulated sediment relative to total storage capacity (SARdam) (colored fill), alongside annual changes in accumulated sediment in check dams (purple dotted line) in the Middle Yellow River Basin.
The degree of sediment accumulation in check dams varied across different sub-basins in the MYRB (Fig. S11). Over the past 50 years, the total sediment accumulation in check dams across the 17 sub-basins ranged from 1.06 % (Fen River basin) to 78.12 % (Huangfuchuan River basin) of the total storage capacity (Coefficient of Variation, CV = 63.89 %) (Fig. S11). Additionally, within these sub-basins, 0.54 % (Qingjian River basin) to 87.94 % (Fen River basin) (CV = 135.55 %) of check dams experienced less than 5 % losses of storage capacity, while 2.78 % (Zhujiachuan River basin) to 76.39 % (Kuye River basin) (CV = 75.12 %) of check dams suffered exceeding 90 % storage capacity losses (Fig. S11).
4.1 Factors controlling sediment reduction and trapping by check dams
The temporal dynamics of SRCdam were influenced by check dam characteristics (such as number, density, controlled area, and storage capacity) and sediment yielding status (such as the magnitude of SY and its spatial distribution) (Bai et al., 2020; Sun and Wu, 2023). Prior to the implementation of vegetation restoration projects, the vegetation coverage was only 25.08 % during 1980s in the MYRB (Zhang et al., 2022), and severe soil erosion occurred in the basin (Fig. S4). The resulting high SY, combined with the initially high effective storage capacity of newly check dams, jointly contributed to a high SRCdam (Verstraeten and Poesen, 2000). As sediment accumulates in check dams, their effective storage capacity diminishes, resulting in a decreasing TE (Fig. S8b) and SRCdam (Fig. 8). With the implementation of “Grain for Green” program since 2000, the vegetation coverage has increased to 58.68 % recently (Zhang et al., 2022). The improved vegetation has significantly curbed hillslope soil erosion by intercepting rainfall, enhancing infiltration, and consolidating the soil (Ebabu et al., 2022). As a result, SY has markedly decreased, leading to a more stable and further lower SRCdam over time (Sun et al., 2020).
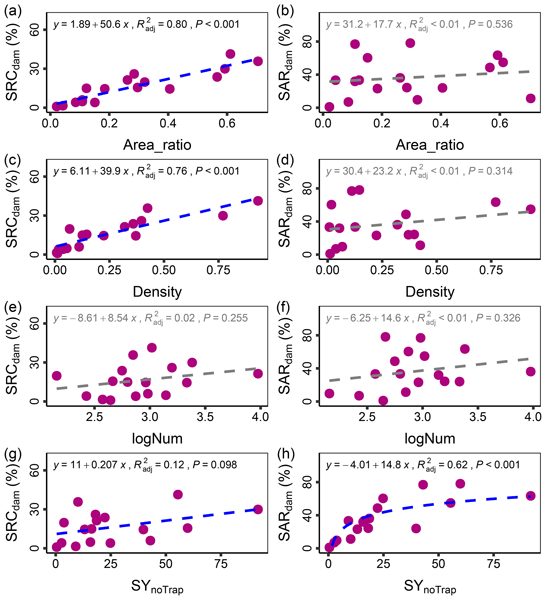
The SRCdam and proportion of accumulated sediment to storage capacity of check dams (SARdam) differed substantially among 17 sub-basins (Figs. S10 and S11). Figure 10 shows the relationships of SRCdam and SARdam with check dam related factors (number of check dams, check dam density, the proportion of the watershed area controlled by check dams to the total basin area (Area_ratio)) and SYnoTrap. The SRCdam displayed a significant linear relationship with Area_ratio (R2 = 0.80, P < 0.001) and check dam density (R2=0.76, P < 0.001) (Fig. 10a, b). In contrast, the SARdam was only significantly correlated with sub-basin SYnoTrap (R2=0.62, P < 0.001) (Fig. 10h), but not closely tied to factors associated with check dams. This means that sediment reduction contribution of check dams is mainly controlled by their distribution characteristics, whereas the sediment accumulation efficiency was primarily affected by the sediment yield from upstream of the check dams.
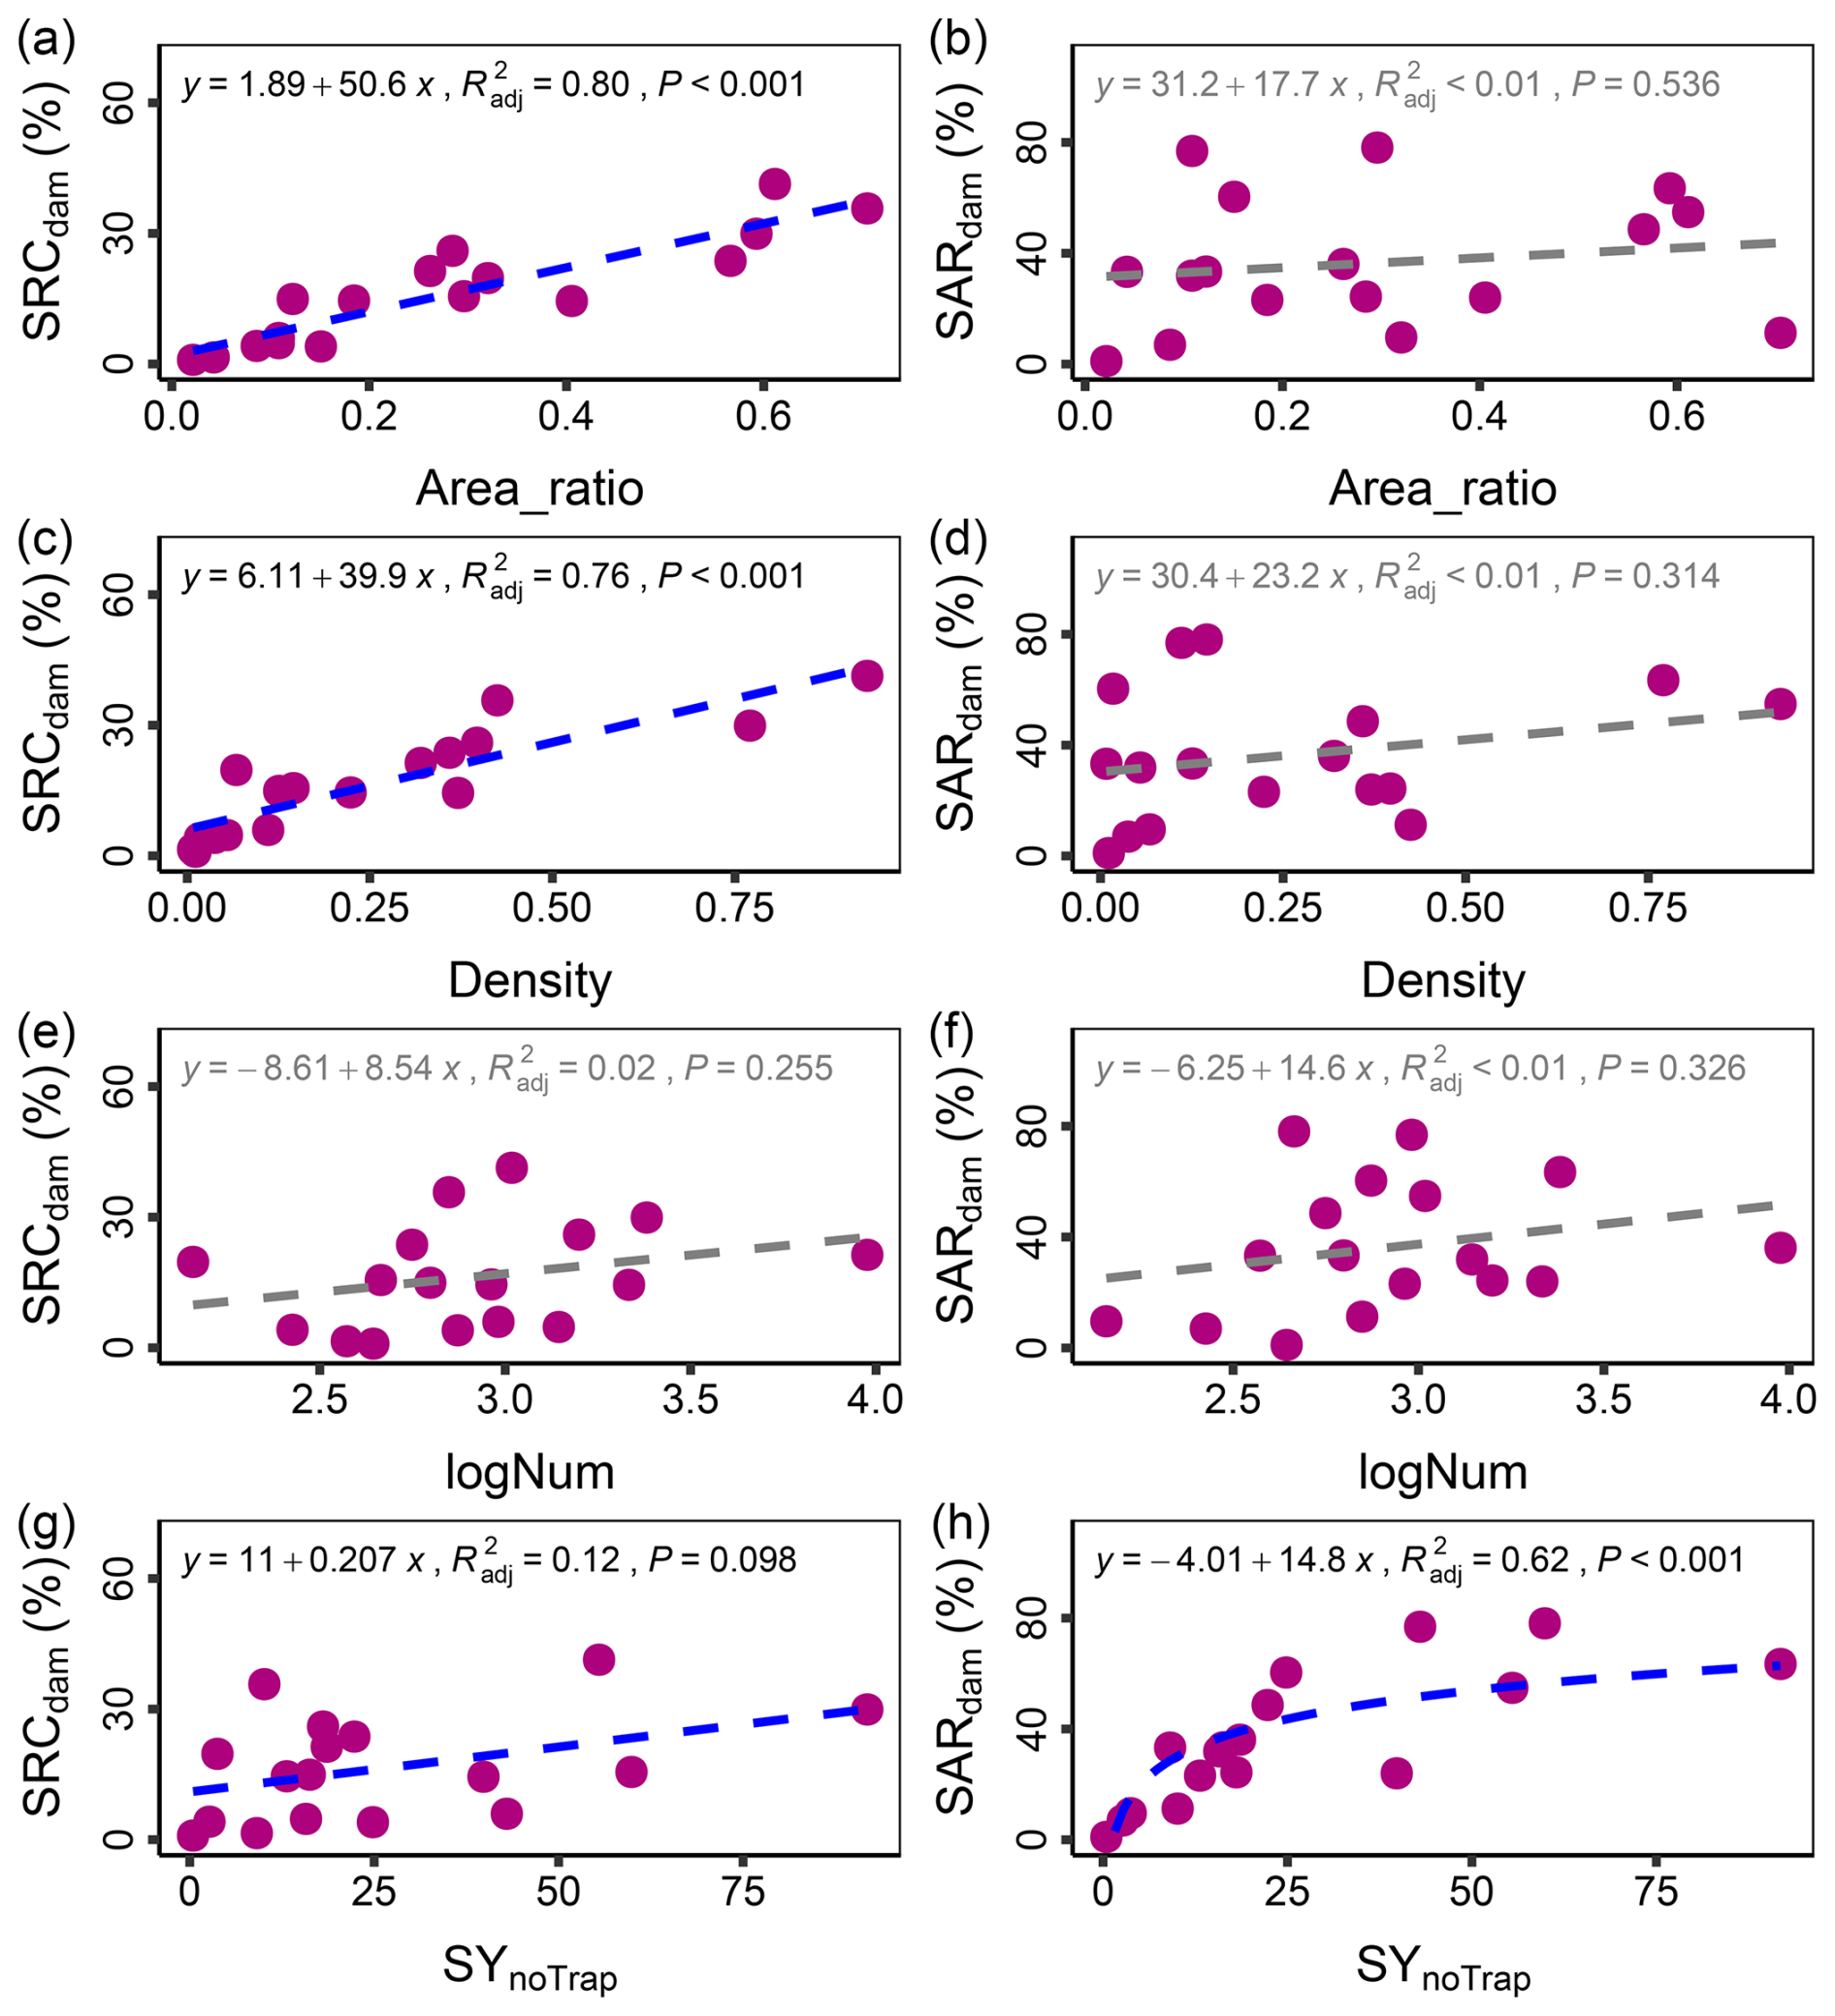
Figure 10Correlations of Sediment Reduction Contribution of check dams (SRCdam) and proportion of accumulated sediment relative to total storage capacity (SARdam) with the proportion of area controlled by check dams to the total basin area (Area_ratio) (a, b), check dam density (Density) (c, d), logarithm of the number of check dams (logNum) (e, f), and average sediment yield without sediment trapping by check dams (SYnoTrap) in sub-basins (g, h).
4.2 Sediment trapping efficiency of check dam distribution
Check dams play an important role in sediment trapping within channels (Abbasi et al., 2019; Esteban Lucas-Borja et al., 2021; Piton et al., 2017). From 1970 to 2020, sediment accumulation in check dams of the MYRB reached peak rates in the 1980s and slowed significantly thereafter (Fig. 9). This was due to the rapid decline in erosion rates or the improper construction of check dams (Gao et al., 2024). The conversion of slopes to terraces and the “Grain for Green” program in 1999 significantly increased vegetation cover, leading to a significant reduction in hillslope soil erosion (Lan et al., 2023). Additionally, enhanced vegetation cover has also reduced hydrologic connectivity (Fig. S6b), consequently lowering the SDR (Abebe et al., 2023; Borselli et al., 2008; Zhao et al., 2020) (Fig. S7b). These changes decreased sediment delivered from hillslopes to channels by reducing both the sediment source and transport capacity. This facilitates sediment deposition, further regulating sediment transport processes (Piton and Recking, 2017).
We used the trade-off between SRCdam and SARdam as a diagnostic indicator to compare sediment reduction effectiveness and storage occupation among sub-basins (Sect. S2). This comparison can provide useful information for the management of check dams. A relatively high SARdam combined with a low SRCdam, as observed in the Kuye River, Huangfuchuan River, and Jing River basins, indicates high storage pressure and limited current sediment reduction effectiveness (Fig. 11). This pattern may be associated with dam age, reduced remaining capacity, high upstream sediment supply, construction history, maintenance conditions, or spatial placement. Therefore, these sub-basins should be prioritized for further field assessment, capacity restoration, desilting, maintenance, or optimized dam placement. In contrast, the Fenchuan River basin showed relatively high SRCdam but low SARdam, suggesting that check dams still have available storage capacity and maintain effective sediment reduction under current sediment supply conditions (Fig. 11). For these basins, future efforts may no longer need to focus on check dam construction. Instead, great emphasis should be placed on hillslope soil and water conservation measures, such as vegetation restoration.
Sub-basins with both high SRCdam and high SARdam, such as the Jialu River basin (Fig. 11), indicate that check dams have contributed substantially to sediment reduction but have also consumed a large proportion of storage capacity, suggesting a need for maintenance and capacity restoration. In contrast, sub-basins with both low SRCdam and low SARdam, such as the Fen River basin (Fig. 11), show limited sediment reduction effectiveness and low storage occupation, which may reflect low sediment supply, limited dam-controlled area, spatial mismatch between check dams and sediment source areas, or suboptimal dam placement. These patterns should therefore be used as diagnostic indicators for further field assessment and management optimization.
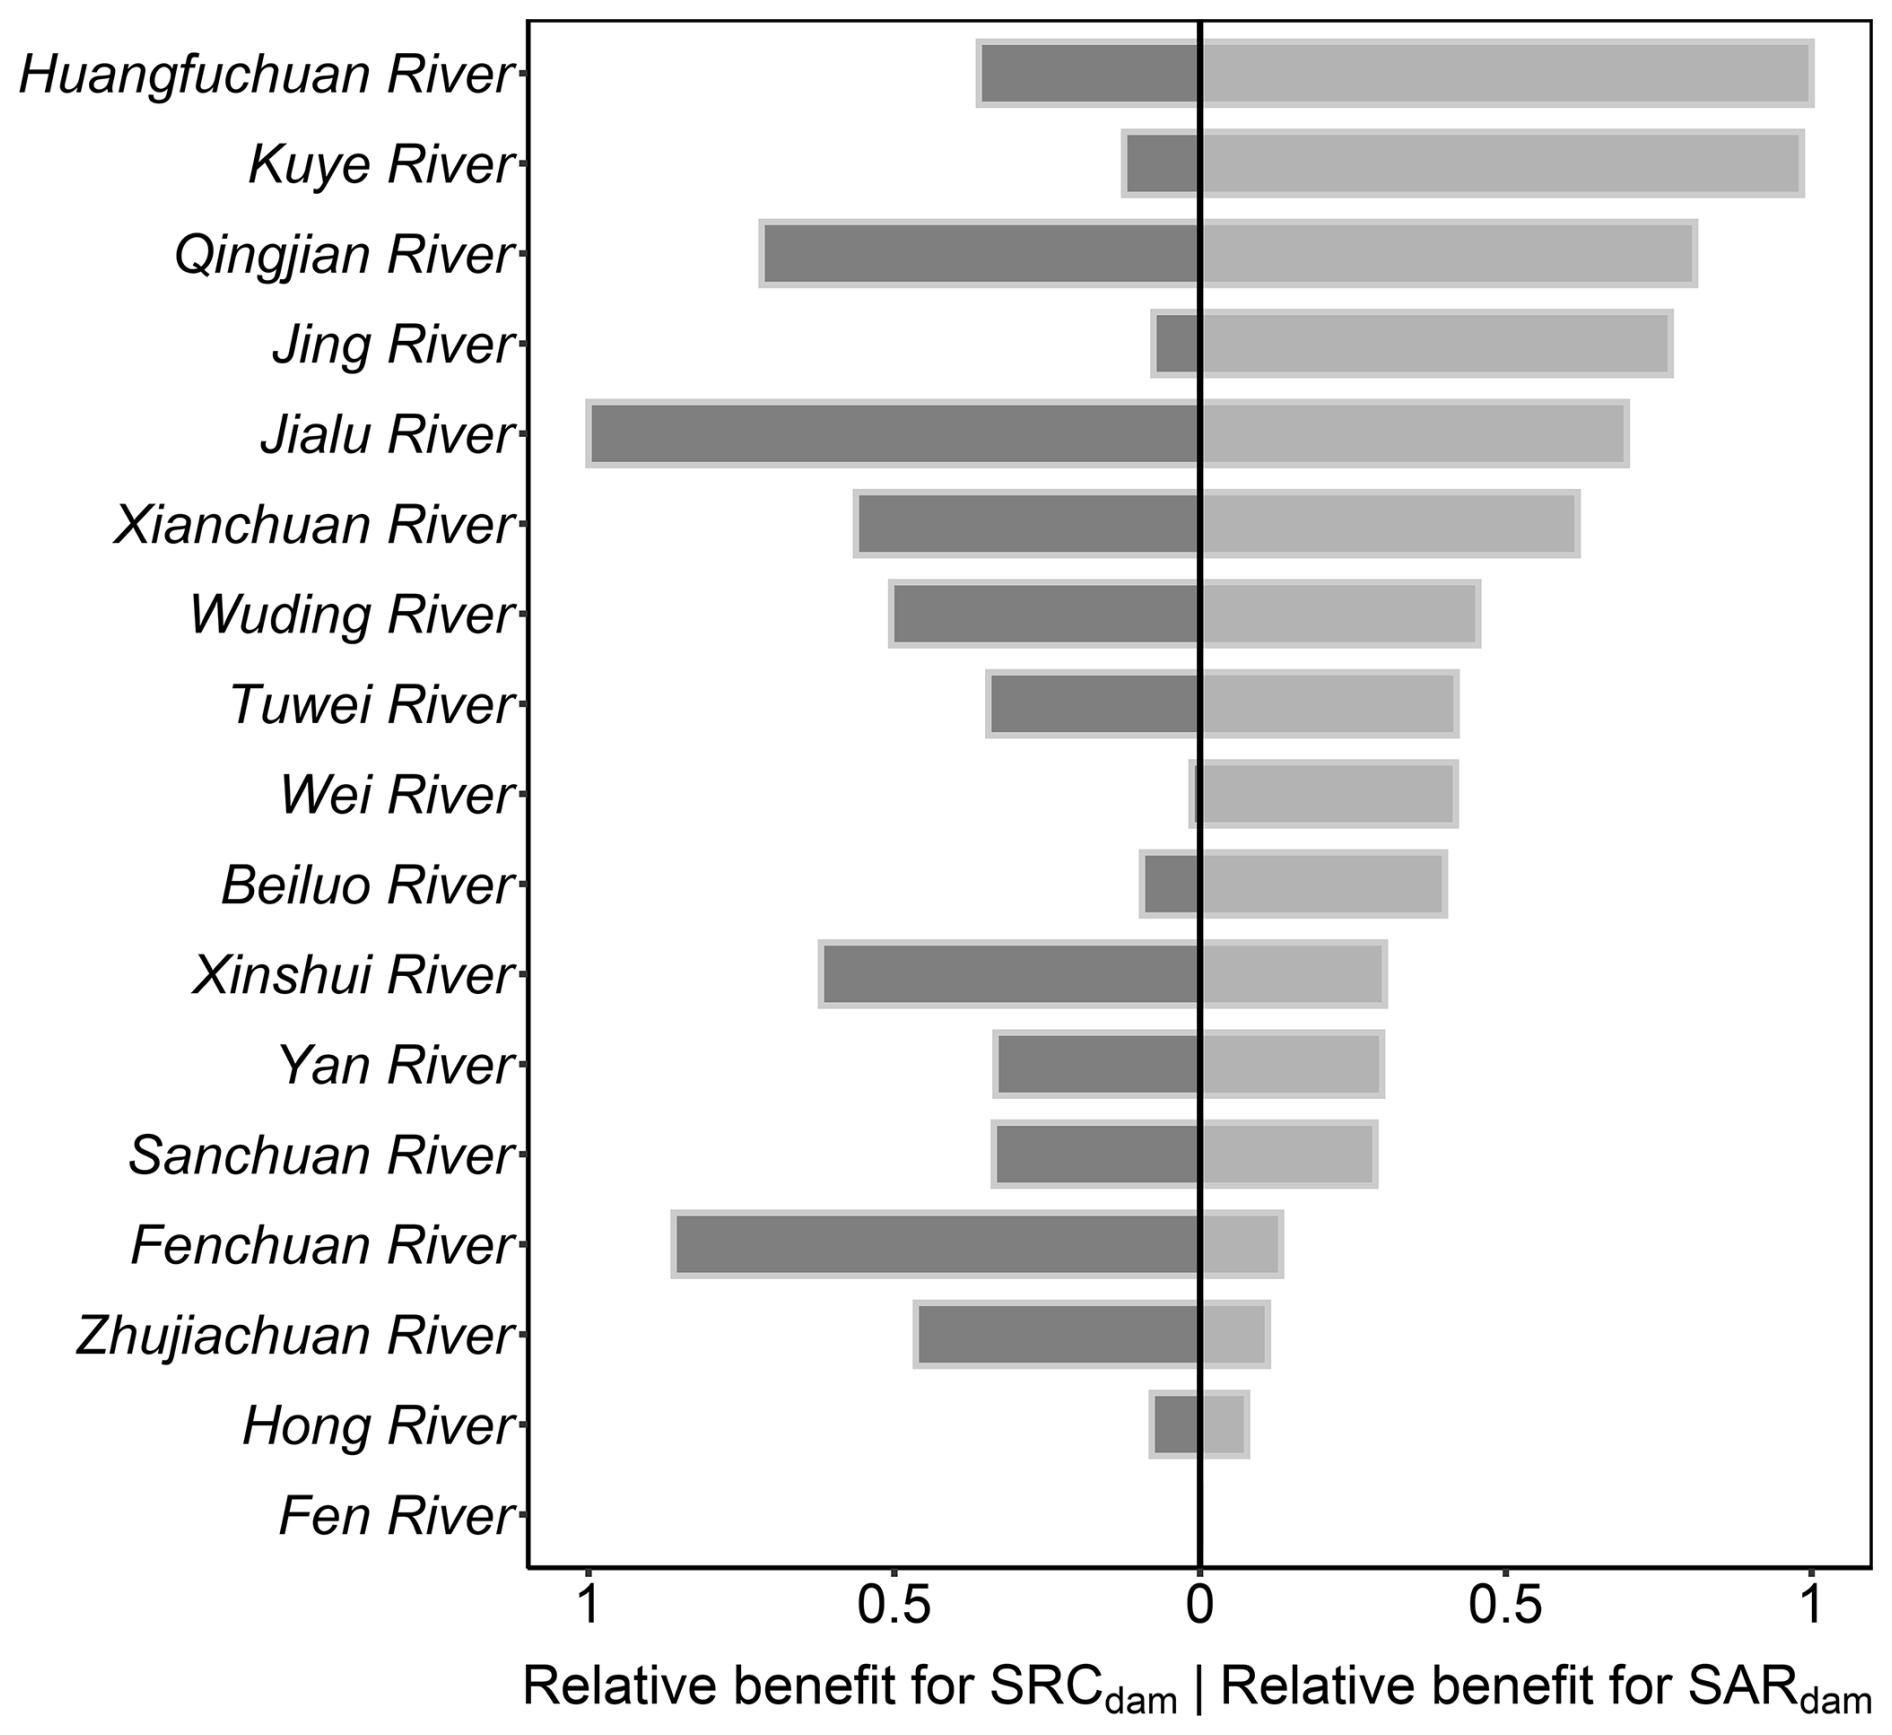
Figure 11The trade-off relationship between Sediment Reduction Contribution of check dams (SRCdam) and proportion of accumulated sediment relative to total storage capacity of check dams (SARdam) for the sub-basins in the Middle Yellow River Basin. The x-axis shows normalized relative benefits of SRCdam and SARdam, with values ranging from 0 to 1.
4.3 Model advantages and further study
By integrating the RUSLE-IC-SDR with the TE of cascading check dams, this study provided a straightforward and practical method to quantify sediment delivery from hillslopes to channels and trapping by check dams in the basin. This method can be easily applied in other regions worldwide. This study focuses on the temporal dynamics and spatial patterns of sediment trapping and reduction by cascading check dam systems. Using the RUSLE-IC-SDR method, SY hotspot in the basin can be identified. By comparing the potential SY of the areas controlled by planned check dam sites with the designed storage capacity of the check dams, we can evaluate the rationality of planned check dam systems. This method enables precise assessment of sediment retention in complex check dam systems and optimal spatial configuration of the check dam system.
Several limitations related to spatial resolution and empirical parameterization should be noted. DEM resolution may introduce uncertainty into LS factor in RUSLE and SY estimates (Lu et al., 2020). Coarser DEMs can smooth steep gullies and small channels, whereas overly fine DEMs may increase data noise, storage requirements, and computational costs (Li et al., 2025). Therefore, DEM resolution should be selected according to study scale, terrain complexity, research objectives, and available computing resources (Bircher et al., 2019; Lu et al., 2020; Dile et al., 2024). Although the simulated SY was calibrated and evaluated using records from 17 hydrological stations, fine-scale erosion and deposition patterns may still be affected by DEM resolution. Future work should conduct multi-resolution sensitivity analyses for LS, IC, SDR, and SY in representative sub-basins. The coefficient D is another uncertainty source because it reflects sediment texture and may vary with rainfall and sediment-source conditions in TE calculation (Verstraeten and Poesen, 2000). Our further analysis showed that larger D values increased long-term simulated sediment accumulation (Fig. S12). Moreover, the influence of D on TE depends on the ratio of remaining storage capacity to contributing catchment area (), with a comparatively limited effect for those with higher ratios. During extreme rainstorms, enhanced erosion may deliver more coarse particles to check dams (Zhu et al., 2024), increasing the effective D value and causing a fixed fine-sediment value to underestimate TE, particularly for check dams with low . Extreme events may also rapidly reduce remaining storage capacity, accelerate TE decline (Chen et al., 2025), and increase overtopping or failure risks (Bai et al., 2020; Esteban Lucas-Borja et al., 2021). Future work should incorporate event scale particle size and hydrodynamic observations to develop time-varying TE parameterization.
Check dams are well known to rapidly halt channel incision and stabilize gully beds, yet these geomorphic adjustments are not directly captured by the current model structure (Piton et al., 2017). Future research should focus on incorporating gully erosion, bank erosion, and bed incision modules to better represent the full suite of geomorphic processes influenced by check dams (He et al., 2026). In addition, human water-sediment regulation may introduce uncertainty into SY simulation. Regulated runoff and sediment processes may affect observed sediment yield but are not fully represented in the current model. Future work should incorporate human water-sediment regulation to better separate natural erosion and sediment delivery dynamics from management induced sediment changes. Considering the growing interest in carbon burial in dammed sediments, coupling sediment retention modelling with carbon dynamics is another important direction (Yao et al., 2022). Despite the above limitations, the proposed framework substantially improves the ability to diagnose sediment dynamics in large, highly engineered basins and provides a foundation for more comprehensive modelling of cascading check dam networks.
In this study, we proposed a framework coupling RUSLE-IC-SDR and TE, to simulate the spatial distribution of SY over past 50 years in the MYRB under the influences of complex check dam networks. The findings show that the check dams reduced the multi-year average SY by 50.01 % in dam-controlled areas. The SY reduction contribution by check dams exhibited considerable spatial heterogeneity, ranging from 41.3 % to 0.9 % among sub-basins. Over the study period, check dams retained total sediment of 3.84 × 10⁹ t, filling 41.49 % of their designed storage capacity, with the accumulation rate decreasing considerably from 126.14 × 10⁶ t yr−1 in the initial stage to 33.03 × 10⁶ t yr−1 in recent decade. The SY reduction contribution by check dams was more strongly associated with dam-specific parameters, such as check dam density and the proportion of area controlled by check dams to the total basin area, whereas the sediment accumulation efficiency was primarily affected by the sediment yield from upstream of the check dams. Further, an evident trade-off between SY reduction contribution and storage occupation of check dams in some sub-basins, indicating contrasting management conditions such as high storage pressure, limited sediment reduction effectiveness, or underused storage capacity. Overall, this study provides a practical and data-efficient method for assessing sediment trapping and reduction by cascading check dam systems in large basins, offering valuable insights for improving soil and water conservation strategies in erosion-prone regions.
The observed sediment yield, land use, simulated sediment yield, and codes related to this research are openly available on figshare (Huang et al., 2025) at https://doi.org/10.6084/m9.figshare.29400029. The high-quality gridded precipitation dataset (called CHM_PRE) is available on figshare (Han and Miao, 2022) at https://doi.org/10.6084/m9.figshare.21432123.v4. The SoilGrids dataset can be downloaded from ISRIC (2021) at https://soilgrids.org (last access: 26 August 2026). SRTM DEM can be downloaded from NASA Jet Propulsion Laboratory (2013) at https://doi.org/10.5067/MEASURES/SRTM/SRTMGL1.003. The MODIS NDVI can be downloaded from NASA LP DAAC (Didan, 2021) at https://doi.org/10.5067/MODIS/MOD13Q1.061.
The GIMMS-NDVI-3g dataset from NOAA (2018) is available for download from the National Tibetan Plateau Data Center at https://data.tpdc.ac.cn/en/data/9775f2b4-7370-4e5e-a537-3482c9a83d88 (last access: 26 August 2026). The vectorized check dam dataset is available on Zenodo (Zeng et al., 2023) at https://doi.org/10.5281/zenodo.7857443.
The supplement related to this article is available online at https://doi.org/10.5194/hess-30-5473-2026-supplement.
GG and YH originally conceived the idea for this paper. YH, LR, and YW developed the model code and performed the simulations. YH, MZ, and YW performed the analysis. YH, GG, and YW developed the visualizations and created the figures. YH wrote the manuscript with support from all co-authors.
The contact author has declared that none of the authors has any competing interests.
Publisher's note: Copernicus Publications remains neutral with regard to jurisdictional claims made in the text, published maps, institutional affiliations, or any other geographical representation in this paper. The authors bear the ultimate responsibility for providing appropriate place names. Views expressed in the text are those of the authors and do not necessarily reflect the views of the publisher.
We wish to thank Yanzheng Yang for his assistance in multi-process code. Comments from three anonymous reviewers substantially improved the manuscript.
This research has been supported by the National Natural Science Foundation of China (grant nos. U2243231, 42041004, 42222062, and 42277348).
This paper was edited by Hongkai Gao and reviewed by three anonymous referees.
Abbasi, N. A., Xu, X., Lucas-Borja, M. E., Dang, W., and Liu, B.: The use of check dams in watershed management projects: Examples from around the world, Sci. Total Environ., 676, 683–691, https://doi.org/10.1016/j.scitotenv.2019.04.249, 2019.
Abebe, N., Eekhout, J., Vermeulen, B., Boix-Fayos, C., de Vente, J., Grum, B., Hoitink, T., and Baartman, J.: The potential and challenges of the `RUSLE-IC-SDR' approach to identify sediment dynamics in a Mediterranean catchment, Catena, 233, 107480, https://doi.org/10.1016/j.catena.2023.107480, 2023.
Alewell, C., Borrelli, P., Meusburger, K., and Panagos, P.: Using the USLE: Chances, challenges and limitations of soil erosion modelling, Int. Soil Water Conserv. Res., 7, 203–225, https://doi.org/10.1016/j.iswcr.2019.05.004, 2019.
Bai, L., Wang, N., Jiao, J., Chen, Y., Tang, B., Wang, H., Chen, Y., Yan, X., and Wang, Z.: Soil erosion and sediment interception by check dams in a watershed for an extreme rainstorm on the Loess Plateau, China, Int. J. Sediment Res., 35, 408–416, https://doi.org/10.1016/j.ijsrc.2020.03.005, 2020.
Benavidez, R., Jackson, B., Maxwell, D., and Norton, K.: A review of the (Revised) Universal Soil Loss Equation ((R)USLE): With a view to increasing its global applicability and improving soil loss estimates, Hydrol. Earth Syst. Sci., 22, 6059–6086, https://doi.org/10.5194/hess-22-6059-2018, 2018.
Bircher, P., Liniger, H. P., and Prasuhn, V.: Comparing different multiple flow algorithms to calculate RUSLE factors of slope length (L) and slope steepness (S) in Switzerland, Geomorphology, 346, 106850, https://doi.org/10.1016/j.geomorph.2019.106850, 2019.
Böhner, J. and Selige, T.: Spatial prediction of soil attributes using terrain analysis and climate regionalisation, Göttinger Geogr. Abhandlungen, 115, 13–28, 2006.
Borrelli, P., Robinson, D. A., Fleischer, L. R., Lugato, E., Ballabio, C., Alewell, C., Meusburger, K., Modugno, S., Schütt, B., Ferro, V., Bagarello, V., Oost, K. Van, Montanarella, L., and Panagos, P.: An assessment of the global impact of 21st century land use change on soil erosion, Nat. Commun., 8, 2013, https://doi.org/10.1038/s41467-017-02142-7, 2017.
Borrelli, P., Alewell, C., Alvarez, P., Anache, J. A. A., Baartman, J., Ballabio, C., Bezak, N., Biddoccu, M., Cerdà, A., Chalise, D., Chen, S., Chen, W., De Girolamo, A. M., Gessesse, G. D., Deumlich, D., Diodato, N., Efthimiou, N., Erpul, G., Fiener, P., Freppaz, M., Gentile, F., Gericke, A., Haregeweyn, N., Hu, B., Jeanneau, A., Kaffas, K., Kiani-Harchegani, M., Villuendas, I. L., Li, C., Lombardo, L., López-Vicente, M., Lucas-Borja, M. E., Märker, M., Matthews, F., Miao, C., Mikoş, M., Modugno, S., Möller, M., Naipal, V., Nearing, M., Owusu, S., Panday, D., Patault, E., Patriche, C. V., Poggio, L., Portes, R., Quijano, L., Rahdari, M. R., Renima, M., Ricci, G. F., Rodrigo-Comino, J., Saia, S., Samani, A. N., Schillaci, C., Syrris, V., Kim, H. S., Spinola, D. N., Oliveira, P. T., Teng, H., Thapa, R., Vantas, K., Vieira, D., Yang, J. E., Yin, S., Zema, D. A., Zhao, G., and Panagos, P.: Soil erosion modelling: A global review and statistical analysis, Sci. Total Environ., 780, 146494, https://doi.org/10.1016/j.scitotenv.2021.146494, 2021.
Borrelli, P., Panagos, P., Alewell, C., Ballabio, C., de Oliveira Fagundes, H., Haregeweyn, N., Lugato, E., Maerker, M., Poesen, J., Vanmaercke, M., and Robinson, D. A.: Policy implications of multiple concurrent soil erosion processes in European farmland, Nat. Sustain., 6, 103–112, https://doi.org/10.1038/s41893-022-00988-4, 2023.
Borselli, L., Cassi, P., and Torri, D.: Prolegomena to sediment and flow connectivity in the landscape: A GIS and field numerical assessment, Catena, 75, 268–277, https://doi.org/10.1016/j.catena.2008.07.006, 2008.
Chang, Y., Lei, H., Zhou, F., and Yang, D.: Spatial and temporal variations of rainfall erosivity in the middle Yellow River Basin based on hourly rainfall data, Catena, 216, 106406, https://doi.org/10.1016/j.catena.2022.106406, 2022.
Chen, J., Wang, X., Chen, H., Zhao, W., Wang, C., and Chen, X.: Feedback mechanism between gully landforms and sediment trapping efficiency in a check dam, Int. Soil Water Conserv. Res., 13, 134–144, https://doi.org/10.1016/j.iswcr.2024.07.003, 2025.
Crema, S. and Cavalli, M.: SedInConnect: a stand-alone, free and open source tool for the assessment of sediment connectivity, Comput. Geosci., 111, 39–45, https://doi.org/10.1016/j.cageo.2017.10.009, 2018.
Didan, K.: MODIS/Terra Vegetation Indices 16-Day L3 Global 250m SIN Grid V061, NASA Land Processes Distributed Active Archive Center [data set], https://doi.org/10.5067/MODIS/MOD13Q1.061, 2021.
Dile, Y. T., Bayabil, H. K., Ayana, E. K., Worqlul, A. W., Srinivasan, R., Lefore, N., and Berihun, M. L.: Evaluating the effects of DEM and soil data resolution on streamflow and sediment yield simulations in the Upper Blue Nile basin, Environ. Monit. Assess., 196, 71, https://doi.org/10.1007/s10661-023-12189-3, 2024.
do Prado, A. H., Mair, D., Garefalakis, P., Schmidt, C., Whittaker, A., Castelltort, S., and Schlunegger, F.: Check dam impact on sediment loads: example of the Guerbe River in the Swiss Alps – a catchment scale experiment, Hydrol. Earth Syst. Sci., 28, 1173–1190, https://doi.org/10.5194/hess-28-1173-2024, 2024.
Ebabu, K., Tsunekawa, A., Haregeweyn, N., Tsubo, M., Adgo, E., Fenta, A. A., Meshesha, D. T., Berihun, M. L., Sultan, D., Vanmaercke, M., Panagos, P., Borrelli, P., Langendoen, E. J., and Poesen, J.: Global analysis of cover management and support practice factors that control soil erosion and conservation, Int. Soil Water Conserv. Res., 10, 161–176, https://doi.org/10.1016/j.iswcr.2021.12.002, 2022.
Eekhout, J. P. C., Jódar-Abellán, A., Carrillo-López, E., Boix-Fayos, C., and de Vente, J.: Assessing the hillslope-channel contributions to the catchment sediment balance under climate change, Environ. Model. Softw., 171, 105890, https://doi.org/10.1016/j.envsoft.2023.105890, 2024.
Esteban Lucas-Borja, M., Piton, G., Yu, Y., Castillo, C., and Antonio Zema, D.: Check dams worldwide: Objectives, functions, effectiveness and undesired effects, Catena, 204, 105390, https://doi.org/10.1016/j.catena.2021.105390, 2021.
Fabre, C., Wei, X., Sauvage, S., Le, T. P. Q., Ouillon, S., Orange, D., Herrmann, M., and Sánchez-Pérez, J.-M.: Assessing fluvial organic carbon flux and its response to short climate variability and damming on a large-scale tropical Asian river basin, Sci. Total Environ., 903, 166589, https://doi.org/10.1016/j.scitotenv.2023.166589, 2023.
Fang, N., Zeng, Y., Ran, L., Wang, Z., Lu, X., Wang, Z., Yang, X., Jian, J., Yu, Q., Ni, L., Liu, C., Yue, C., and Shi, Z.: Substantial role of check dams in sediment trapping and carbon sequestration on the Chinese Loess Plateau, Commun. Earth Environ., 4, 65, https://doi.org/10.1038/s43247-023-00728-2, 2023.
Fryirs, K.: (Dis)Connectivity in catchment sediment cascades: a fresh look at the sediment delivery problem, Earth Surf. Process. Landforms, 38, 30–46, https://doi.org/10.1002/esp.3242, 2013.
Gao, H., Wang, M., and Hao, X.: Check dams in the Yellow River basin: Sediment reduction efficiency and future development, L. Degrad. Dev., 35, 4042–4054, https://doi.org/10.1002/ldr.5202, 2024.
Han, J. and Miao, C.: A new daily gridded precipitation dataset for the Chinese mainland based on gauge observations, figshare [data set], https://doi.org/10.6084/m9.figshare.21432123.v4, 2022.
Han, J., Miao, C., Gou, J., Zheng, H., Zhang, Q., and Guo, X.: A new daily gridded precipitation dataset for the Chinese mainland based on gauge observations, Earth Syst. Sci. Data, 15, 3147–3161, https://doi.org/10.5194/essd-15-3147-2023, 2023.
Hao, R., Huang, X., Cai, Z. W., Xiao, H. B., Wang, J., and Shi, Z. H.: Incorporating sediment connectivity index into MUSLE model to explore soil erosion and sediment yield relationships at event scale, J. Hydrol., 614, 128579, https://doi.org/10.1016/j.jhydrol.2022.128579, 2022.
He, X., Yuan, X., He, C., Clubb, F. J., and Shen, X.: Climate‐driven strath terrace formation revealed by a fluvial erosion‐deposition model considering channel widths, J. Geophys. Res. Earth Surf., 131, e2025JF008594, https://doi.org/10.1029/2025JF008594, 2026.
Huang, Y., Xin, Z., Gao, G., Lu, X., Ran, L., Wang, Y., and Zhang, Z.: Increasing lateral transport of soil and carbon on the Tibetan Plateau, Catena, 239, 107901, https://doi.org/10.1016/j.catena.2024.107901, 2024.
Huang, Y., Gao, G., Ran, L., Wang, Y., and Fu, B.: Datasets and codes for an integrative model framework for simulating sediment yield in large basins with check dam networks: Application to the Middle Yellow River Basin, China, figshare [data set], https://doi.org/10.6084/m9.figshare.29400029, 2025.
ISRIC: SoilGrids250m version 2.0, SOIL grids [data set], https://soilgrids.org (last access: 26 August 2026), 2021.
Ke, Q. and Zhang, K.: Scale issues in runoff and sediment delivery (SIRSD): A systematic review and bibliometric analysis, Earth-Science Rev., 251, 104729, https://doi.org/10.1016/j.earscirev.2024.104729, 2024.
Kondolf, G. M., Gao, Y., Annandale, G. W., Morris, G. L., Jiang, E., Zhang, J., Cao, Y., Carling, P., Fu, K., Guo, Q., Hotchkiss, R., Peteuil, C., Sumi, T., Wang, H., Wang, Z., Wei, Z., Wu, B., Wu, C., and Yang, C. T.: Sustainable sediment management in reservoirs and regulated rivers: Experiences from five continents, Earth's Futur., 2, 256–280, https://doi.org/10.1002/2013ef000184, 2014.
Lan, X., Liu, Z., Yang, T., Cheng, L., Wang, X., Wei, W., Ge, Y., Chen, X., Lin, K., Zhao, T., Zhang, X., and Zhou, G.: Land-use intensity reversed the role of cropland in ecological restoration over the world's most severe soil erosion region, Earth's Future, 11, e2022EF003388, https://doi.org/10.1029/2022EF003388, 2023.
Li, W., Li, P., Yan, L., Hu, J., Wang, L., Li, D., Dan, Y., Huang, L., and Zhao, G.: Impacts of spatial resolutions of UAV-LiDAR-derived DEMs on erosion modelling in the hilly and gully Loess Plateau, Catena, 255, 109059, https://doi.org/10.1016/j.catena.2025.109059, 2025.
Li, Z., Li, P., Yu, Y., Shi, P., and Piton, G.: Check dam construction for sustainable watershed management and planning, edited by: Li, Z., Li, P., Yu, Y., Shi, P., and Piton, G., Wiley, https://doi.org/10.1002/9781119742449, 2022.
La Licata, M., Bosino, A., Sadeghi, S. H., De Amicis, M., Mandarino, A., Terret, A., and Maerker, M.: HOTSED: A new integrated model for assessing potential hotspots of sediment sources and related sediment dynamics at watershed scale, Int. Soil Water Conserv. Res., 13, 80–101, https://doi.org/10.1016/j.iswcr.2024.06.002, 2025.
Lu, S., Liu, B., Hu, Y., Fu, S., Cao, Q., Shi, Y., and Huang, T.: Soil erosion topographic factor (LS): Accuracy calculated from different data sources, Catena, 187, 104334, https://doi.org/10.1016/j.catena.2019.104334, 2020.
Lugato, E., Smith, P., Borrelli, P., Panagos, P., Ballabio, C., Orgiazzi, A., Fernandez-Ugalde, O., Montanarella, L., and Jones, A.: Soil erosion is unlikely to drive a future carbon sink in Europe, Sci. Adv., 4, eaau3523, https://doi.org/10.1126/sciadv.aau3523, 2018.
Maavara, T., Chen, Q., van Meter, K., Brown, L. E., Zhang, J., Ni, J., and Zarfl, C.: River dam impacts on biogeochemical cycling, Nat. Rev. Earth Environ., 1, 103–116, https://doi.org/10.1038/s43017-019-0019-0, 2020.
Najafi, S., Dragovich, D., Heckmann, T., and Sadeghi, S. H.: Sediment connectivity concepts and approaches, Catena, 196, 104880, https://doi.org/10.1016/j.catena.2020.104880, 2021.
NASA Jet Propulsion Laboratory: NASA Shuttle Radar Topography Mission Global 1 arc second, NASA Land Processes Distributed Active Archive Center [data set], https://doi.org/10.5067/MEASURES/SRTM/SRTMGL1.003, 2013
Nistor, C., Săvulescu, I., Ioana-Toroimac, G., and Carablaisă, S.: Exploring soil erosion and reservoir sedimentation through the RUSLE model and bathymetric survey, Int. Soil Water Conserv. Res., 13, 235–247, https://doi.org/10.1016/j.iswcr.2024.10.005, 2025.
NOAA: Global GIMMS NDVI3g v1 dataset (1981–2015), NOAA [data set], https://data.tpdc.ac.cn/en/data/9775f2b4-7370-4e5e-a537-3482c9a83d88 (last access: 26 August 2026), 2018.
Pal, D., Galelli, S., Tang, H., and Ran, Q.: Toward improved design of check dam systems: A case study in the Loess Plateau, China, J. Hydrol., 559, 762–773, https://doi.org/10.1016/j.jhydrol.2018.02.051, 2018.
Panagos, P., Borrelli, P., Poesen, J., Ballabio, C., Lugato, E., Meusburger, K., Montanarella, L., and Alewell, C.: The new assessment of soil loss by water erosion in Europe, Environ. Sci. Policy, 54, 438–447, https://doi.org/10.1016/j.envsci.2015.08.012, 2015.
Pinzon, J. E. and Tucker, C. J.: A non-stationary 1981-2012 AVHRR NDVI3g time series, Remote Sens., 6, 6929–6960, https://doi.org/10.3390/rs6086929, 2014.
Piton, G. and Recking, A.: Effects of check dams on bed-load transport and steep-slope stream morphodynamics, Geomorphology, 291, 94–105, https://doi.org/10.1016/j.geomorph.2016.03.001, 2017.
Piton, G., Carladous, S., Recking, A., Tacnet, J. M., Liébault, F., Kuss, D., Quefféléan, Y., and Marco, O.: Why do we build check dams in Alpine streams? An historical perspective from the French experience, Earth Surf. Process. Land., 42, 91–108, https://doi.org/10.1002/esp.3967, 2017.
Poggio, L., De Sousa, L. M., Batjes, N. H., Heuvelink, G. B. M., Kempen, B., Ribeiro, E., and Rossiter, D.: SoilGrids 2.0: Producing soil information for the globe with quantified spatial uncertainty, Soil, 7, 217–240, https://doi.org/10.5194/soil-7-217-2021, 2021.
Schürz, C., Mehdi, B., Kiesel, J., Schulz, K., and Herrnegger, M.: A systematic assessment of uncertainties in large-scale soil loss estimation from different representations of USLE input factors-a case study for Kenya and Uganda, Hydrol. Earth Syst. Sci., 24, 4463–4489, https://doi.org/10.5194/hess-24-4463-2020, 2020.
Sharpley, A. N. and Williams, J. R.: EPIC: The erosion-productivity impact calculator, http://agris.fao.org/agris-search/search.do?recordID=US9403696 (last access: 26 August 2026), 1990.
Shi, C., Liang, Y., Qin, W., Ding, L., Cao, W., Zhang, M., and Zhang, Q.: Review of sediment connectivity: Conceptual connotations, characterization indicators, and their relationships with soil erosion and sediment yield, Earth-Sci. Rev., 264, 105091, https://doi.org/10.1016/j.earscirev.2025.105091, 2025.
Sun, P. and Wu, Y.: Dynamic modeling framework of sediment trapped by check-dam networks: A case study of a typical watershed on the Chinese Loess Plateau, Engineering, 27, 209–221, https://doi.org/10.1016/j.eng.2021.12.015, 2023.
Sun, P., Wu, Y., Gao, J., Yao, Y., Zhao, F., Lei, X., and Qiu, L.: Shifts of sediment transport regime caused by ecological restoration in the Middle Yellow River Basin, Sci. Total Environ., 698, 134261, https://doi.org/10.1016/j.scitotenv.2019.134261, 2020.
van der Knijff, J. M., Jones, R. J. A., and Montanarella, L.: Soil Erosion Risk Assessment in Europe, https://esdac.jrc.ec.europa.eu/ESDB_Archive/pesera/pesera_cd/pdf/ereurnew2.pdf (last access: 26 August 2026), 2000.
Verstraeten, G. and Poesen, J.: Estimating trap efficiency of small reservoirs and ponds: methods and implications for the assessment of sediment yield, Prog. Phys. Geogr. Earth Environ., 24, 219–251, https://doi.org/10.1177/030913330002400204, 2000.
Verstraeten, G. and Prosser, I. P.: Modelling the impact of land-use change and farm dam construction on hillslope sediment delivery to rivers at the regional scale, Geomorphology, 98, 199–212, https://doi.org/10.1016/j.geomorph.2006.12.026, 2008.
Vigiak, O., Borselli, L., Newham, L. T. H., McInnes, J., and Roberts, A. M.: Comparison of conceptual landscape metrics to define hillslope-scale sediment delivery ratio, Geomorphology, 138, 74–88, https://doi.org/10.1016/j.geomorph.2011.08.026, 2012.
Wang, S., Song, S., Zhang, H., Yu, L., Jiao, C., Li, C., Wu, X., Zhao, W., Best, J., Roberts, P., and Fu, B.: Anthropogenic impacts on the Yellow River Basin, Nat. Rev. Earth Environ., 6, 656–671, https://doi.org/10.1038/s43017-025-00718-2, 2025.
Wischmeier, W. H. and Smith, D. D.: Predicting rainfall erosion losses: A guide to conservation planning, Agriculture Handbook No. 537, U.S. Department of Agriculture, https://www.govinfo.gov/content/pkg/GOVPUB-A-PURL-gpo31516/pdf/GOVPUB-A-PURL-gpo31516.pdf (last access: 26 August 2026), 1978.
Wu, B., Fu, Z., Fu, B., Yan, C., Zeng, H., and Zhao, W.: Dynamics of land cover changes and driving forces in China's drylands since the 1970s, Land Use Pol., 140, 107097, https://doi.org/10.1016/j.landusepol.2024.107097, 2024.
Xie, Y., Yin, S., Liu, B., Nearing, M. A., and Zhao, Y.: Models for estimating daily rainfall erosivity in China, J. Hydrol., 535, 547–558, https://doi.org/10.1016/j.jhydrol.2016.02.020, 2016.
Yang, H., Wang, T., Yang, D., Yan, Z., Wu, J., and Lei, H.: Runoff and sediment effect of the soil-water conservation measures in a typical river basin of the Loess Plateau, Catena, 243, 108218, https://doi.org/10.1016/j.catena.2024.108218, 2024.
Yao, Y., Song, J., and Wei, X.: The fate of carbon in check dam sediments, Earth-Sci. Rev., 224, 103889, https://doi.org/10.1016/j.earscirev.2021.103889, 2022.
Yin, C., Bai, C., Zhu, Y., Shao, M., Han, X., and Qiao, J.: Future soil erosion risk in China: differences in erosion driven by general and extreme precipitation under climate change, Earth's Future, 13, e2024EF005390, https://doi.org/10.1029/2024EF005390, 2025.
Zeng, Y., Jing, T., Xu, B., Yang, X., Jian, J., Zong, R., Wang, B., Dai, W., Deng, L., Fang, N., and Shi, Z.: Vectorized dataset of silted land formed by check dams on the Chinese Loess Plateau, Zenodo [data set], https://doi.org/10.5281/zenodo.7857443, 2023.
Zeng, Y., Jing, T., Xu, B., Yang, X., Jian, J., Zong, R., Wang, B., Dai, W., Deng, L., Fang, N., and Shi, Z.: Vectorized dataset of silted land formed by check dams on the Chinese Loess Plateau, Sci. Data, 11, 348, https://doi.org/10.1038/s41597-024-03198-z, 2024.
Zhang, E., Chen, Y., Wei, S., Liu, C., Wang, H., Deng, B., Lin, H., Yang, X., Li, Y., and Duan, X.: A 30 m resolution dataset of soil and water conservation terraces across China for 2000, 2010, and 2020, Earth Syst. Sci. Data, 17, 6315–6330, https://doi.org/10.5194/essd-17-6315-2025, 2025.
Zhang, X., Song, J., Wang, Y., Sun, H., and Li, Q.: Threshold effects of vegetation coverage on runoff and soil loss in the Loess Plateau of China: A meta-analysis, Geoderma, 412, 115720, https://doi.org/10.1016/j.geoderma.2022.115720, 2022.
Zhao, G., Gao, P., Tian, P., Sun, W., Hu, J., and Mu, X.: Assessing sediment connectivity and soil erosion by water in a representative catchment on the Loess Plateau, China, Catena, 185, 104284, https://doi.org/10.1016/j.catena.2019.104284, 2020.
Zhu, Q., Liu, J., Qi, X., Cheng, X., and Zhou, Z.: Estimating sediment transport capacity on sloping farmland on the Loess Plateau considering soil particle size characteristics, Geoderma, 446, 116906, https://doi.org/10.1016/j.geoderma.2024.116906, 2024.