
the Creative Commons Attribution 4.0 License.
the Creative Commons Attribution 4.0 License.
 | 27 Aug 2026
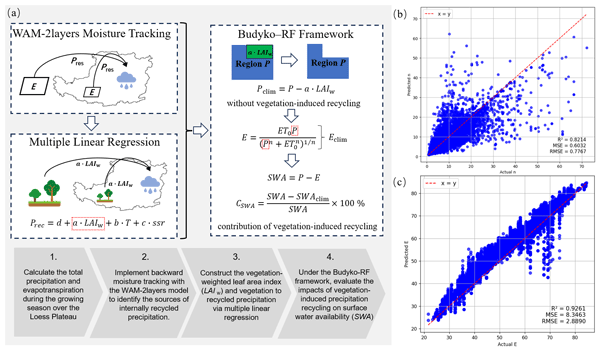
Hydrological implications of vegetation-associated precipitation recycling during peak growing season over the Loess Plateau
Jiaxiang Deng
Quan Quan
Shuangcheng Tang
Hanbo Yang
Xiaoyu Song
Vegetation restoration on the Loess Plateau has raised an important question of whether enhanced land–atmosphere coupling can alleviate regional water scarcity in this water-limited environment. In this study, we integrate the WAM-2layers atmospheric moisture-tracking model with a random forest–enhanced Budyko framework and introduced a vegetation-weighted leaf area index (LAIw) to examine vegetation-associated precipitation recycling and its hydrological effects during the peak growing season (July–August during 2000–2022). Results show that precipitation is dominated by terrestrial moisture sources (86.5 %), while oceanic contributions account for 13.5 %. Internal moisture recycling contributes 14.4 % of total precipitation but exhibits a trend of −0.073 mm yr−1. At the regional mean scale, vegetation-associated recycled precipitation has a limited effect on precipitation, evapotranspiration, and surface water availability (0.059 %, 0.02 %, and 0.107 %, respectively), reflecting strong compensation between positive and negative vegetation effects and the limited fraction of internal recycling. However, a clear regime shift emerges along the LAIw gradient, from weakly positive effects under low vegetation density to increasingly negative effects under high vegetation density. These findings suggest that under water-limited conditions, enhanced vegetation–atmosphere coupling does not necessarily increase surface water availability, but instead reflects a constrained redistribution of water within a monsoon–continental transition system characterized by nonlinear vegetation density–dependent regime shifts.
- Article
(3924 KB) - Full-text XML
- BibTeX
- EndNote


Water scarcity and ecological fragility are major constraints on sustainable development in arid and semi-arid regions worldwide (Kummu et al., 2016; He et al., 2021a). Climate warming has intensified the hydrological cycle by altering evaporation and precipitation processes, thereby reshaping regional water availability and increasing hydroclimatic risks, especially in water-limited environments (Giorgi et al., 2014; Huang et al., 2016; Wang et al., 2023; Zhang et al., 2023). Although enhanced moisture recycling may partly mitigate water stress by returning evapotranspired water to the land surface as precipitation, the extent to which this process can effectively alleviate regional water limitation remains insufficiently understood.
Atmospheric moisture transport plays a fundamental role in regulating regional precipitation and water availability (Dominguez et al., 2020; He et al., 2021b). Precipitation over a given region may originate either from evapotranspiration within the region through internal moisture recycling or from moisture advected from upwind source areas (van der Ent et al., 2010; Tuinenburg et al., 2022; Cui et al., 2022). The balance between these internal and external moisture sources is particularly important in arid and semi-arid regions, where water availability is highly sensitive to both land–atmosphere coupling and atmospheric circulation (Te Wierik et al., 2022; Li et al., 2021; Zhang et al., 2022b). Therefore, quantifying the contribution of local evapotranspiration to regional precipitation is essential for understanding whether land-surface changes can meaningfully influence regional water resources.
The Loess Plateau (LP) of China is a representative water-limited region that has experienced severe ecological degradation and long-term water stress (Huang et al., 2016; Huang et al., 2017). Since the implementation of large-scale ecological restoration programs around 2000, vegetation cover and ecosystem productivity have increased substantially across the region (Li et al., 2021, 2022). However, the hydrological consequences of vegetation restoration remain debated. On the one hand, vegetation recovery can increase evapotranspiration, intensify soil moisture depletion, and reduce runoff, thereby aggravating water scarcity (Feng et al., 2016; Deng et al., 2020; Zhang et al., 2018). On the other hand, stronger evapotranspiration may enhance land–atmosphere coupling, promote atmospheric moisture recycling, and potentially increase precipitation (Yosef et al., 2018; Zhang et al., 2022a; Wei and Dirmeyer, 2019). These processes occur within a monsoon-dominated climatic system, where large-scale moisture transport and land–atmosphere interactions jointly regulate the evolution of atmospheric water vapor along its pathway. These competing effects raise a key but unresolved question: under water-limited conditions, can vegetation-associated precipitation recycling provide a meaningful hydrological benefit, or is it largely offset by the additional water consumption associated with vegetation growth?
The seasonal timing of moisture recycling analysis requires careful consideration in dryland regions. While the full growing season on the Loess Plateau spans June to September, previous studies indicate that vegetation–atmosphere coupling intensity varies substantially within this period. July and August represent the peak growing season, when leaf area index reaches its annual maximum, solar radiation is strongest, and soil moisture remains favorable for active evapotranspiration (Wang et al., 2019; Li et al., 2024). During this period, transpiration accounts for the dominant fraction of evapotranspiration, and land–atmosphere moisture exchange is most pronounced (Guo et al., 2025). Consequently, focusing on July–August allows targeted assessment of vegetation-associated hydrological effects when they are expected to be strongest. This approach follows established practices in moisture recycling research where seasonal subsets are analyzed to isolate specific process periods (Zemp et al., 2014).
Addressing this question requires linking vegetation dynamics, evapotranspiration, atmospheric moisture tracking, and regional water balance within a unified framework. Existing studies have provided important insights into either the hydrological costs of revegetation or the climatic effects of land–atmosphere feedbacks, but quantitative assessments that explicitly connect vegetation-associated moisture recycling to regional water availability remain limited. In particular, few studies have integrated atmospheric moisture tracking with water-balance analysis to evaluate whether the precipitation returned through vegetation-associated recycling is large enough to compensate for the accompanying evapotranspiration increase in dryland ecosystems.
The Budyko framework provides a widely used basis for evaluating climatic controls on water partitioning between evapotranspiration and runoff (Budyko, 1974). However, its conventional form generally assumes long-term equilibrium conditions and fixed catchment characteristics, which may be insufficient for regions such as the Loess Plateau, where hydroclimatic conditions are spatially heterogeneous and land-surface properties have changed substantially under ecological restoration (Yang et al., 2009; Yokoo et al., 2008; Woods, 2003; Yang et al., 2015). To better capture these variations, it is necessary to allow the effective catchment parameter to vary with vegetation, soil moisture, and meteorological conditions.
In this study, we develop an integrated framework that combines the WAM-2layers atmospheric moisture tracking model with a random forest–enhanced Budyko approach to quantify vegetation-associated precipitation recycling and its hydrological implications over the Loess Plateau during the peak growing season (July–August) from 2000 to 2022. We further introduce a vegetation-weighted indicator, LAIw, as a diagnostic measure that combines vegetation structure with relative evapotranspiration intensity in order to represent vegetation conditions more closely related to land–atmosphere moisture exchange. Specifically, this study aims to (1) characterize the spatiotemporal patterns of growing-season moisture recycling and water availability over the Loess Plateau, (2) quantify the vegetation-associated component of recycled precipitation, and (3) evaluate whether this recycled precipitation meaningfully offsets evapotranspiration-induced water losses under different vegetation-density conditions. By doing so, this study seeks to clarify the hydrological limits of vegetation-associated precipitation recycling in a water-constrained dryland region.
2.1 Study area and climatic characteristics
The Loess Plateau (LP) is located in the middle reaches of the Yellow River basin (33°43′–41°16′ N, 104°54′–114°33′ E) and represents a typical arid and semi-arid region in northern China (Fig. 1). The region covers an area of approximately 640 000 km2 and is characterized by complex topography, with elevation generally decreasing from northwest to southeast and an overall elevation range exceeding 3000 m. The Loess Plateau is dominated by a temperate continental monsoon climate. The mean annual air temperature and precipitation are approximately 9.4 °C and 593.7 mm, respectively. Precipitation exhibits strong seasonality, with about 60 %–70 % of the annual total occurring between June and September, whereas winter precipitation is limited and contributes negligibly to the annual water budget (Wang et al., 2023). Under the influence of the East Asian monsoon system, precipitation is primarily driven by large-scale moisture transport, which is subsequently modified by regional land–atmosphere recycling processes. Precipitation over the Loess Plateau also shows pronounced interannual variability, with wet years receiving several times more precipitation than dry years and extreme rainfall events occurring frequently (Liu et al., 2025a).
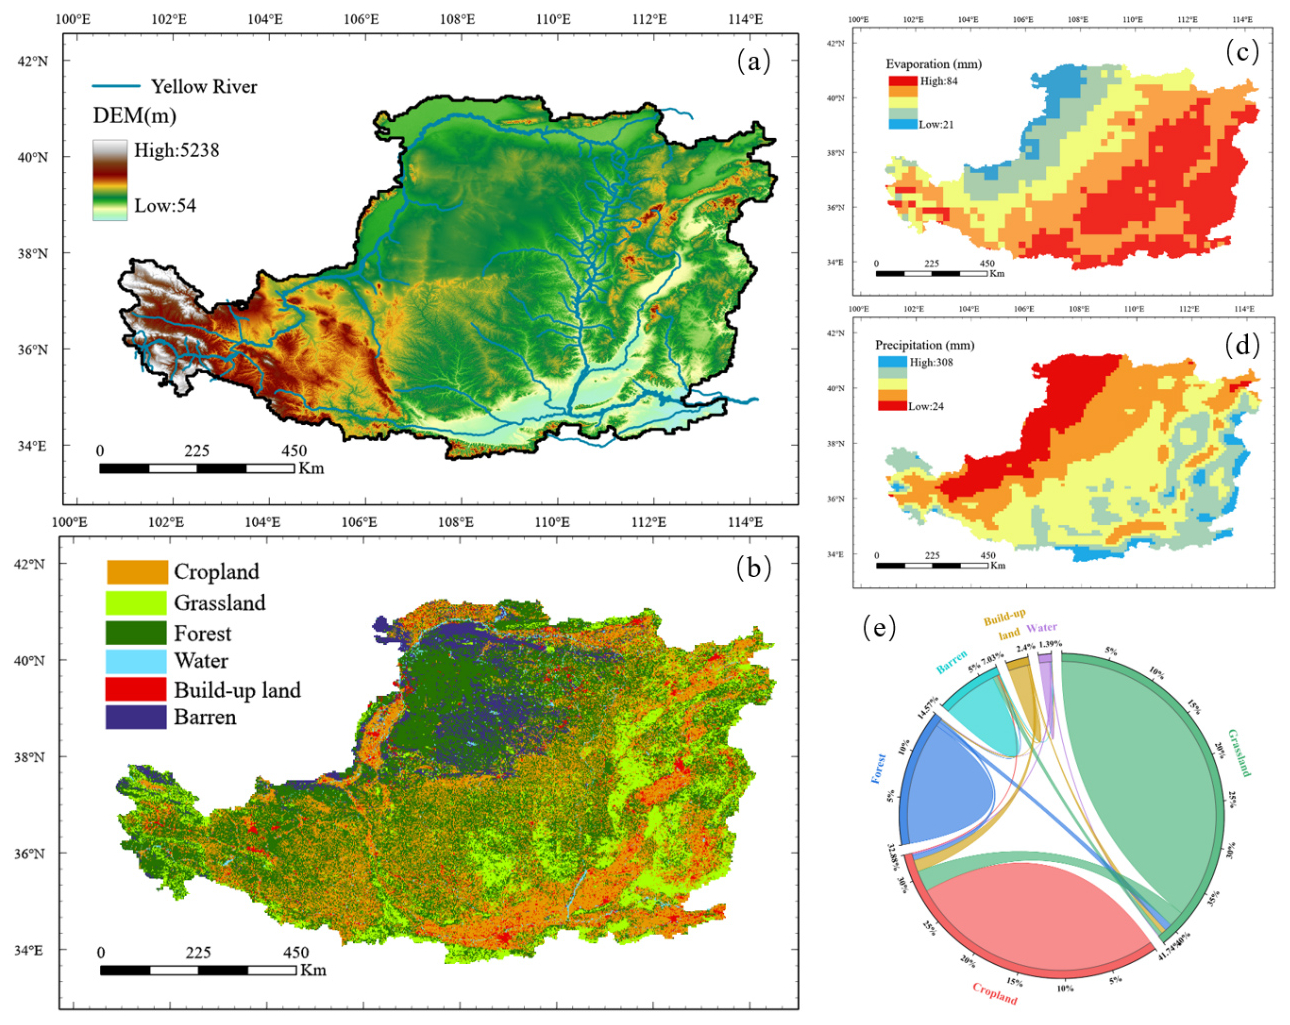
Figure 1Study area and key characteristics, including (a) topography and river network, (b) land cover, (c) evaporation, (d) precipitation, and (e) land-cover conversions.
Given the strong seasonality of both precipitation and vegetation activity, this study focuses on July and August as the primary analysis period. These two months correspond to the peak growing season on the Loess Plateau, during which leaf area index (LAI) and fractional vegetation cover generally reach their annual maxima, solar radiation is relatively strong, and soil moisture conditions remain favorable for active land–atmosphere exchange. As a result, evapotranspiration and vegetation–atmosphere interactions are most pronounced during this period (Wang et al., 2019; Li et al., 2024; Guo et al., 2025). Focusing on July and August therefore allows this study to better capture the period when vegetation-associated moisture recycling is expected to be strongest, providing a targeted basis for evaluating vegetation-associated hydrological effects during the peak growing season in this water-limited region. This seasonal focus is intended to isolate the period of strongest vegetation–atmosphere coupling rather than to represent the full annual water balance.
2.2 Data
Monthly evapotranspiration (ET) and potential evapotranspiration (ET0) data for July and August during 2000–2022 were obtained from the Global Land Evaporation Amsterdam Model (GLEAM, v3.6a) dataset, with a spatial resolution of 0.25° (Martens et al., 2017). GLEAM ET has been extensively evaluated against eddy covariance (EC) observations across China and shows good agreement at the monthly scale, with an average correlation coefficient of 0.86 (Yang et al., 2017).
Monthly precipitation data for July and August during 2000–2022 were derived from the ERA5 reanalysis dataset at a spatial resolution of 0.25° (Hersbach et al., 2020). ERA5 precipitation has been shown to capture the annual and seasonal variability of observed precipitation over China reasonably well (Jiao et al., 2021) and exhibits a strong correlation (r=0.92) with official national statistics at the 99 % confidence level (An et al., 2025). Before subsequent analyses, the ERA5 precipitation and GLEAM ET datasets were temporally aligned for July–August during 2000–2022 and resampled to a common 0.25° grid using nearest-neighbor interpolation to ensure spatial consistency.
For atmospheric moisture tracking, hourly meteorological variables from the ERA5 dataset were collected for June–August during 2000–2022. These variables included air temperature, precipitation, specific humidity, wind components, surface pressure, dew-point temperature, total column water vapor, and surface evaporation. Specific humidity and wind fields were extracted for 17 vertical pressure levels ranging from 1000 to 100 hPa, all at a spatial resolution of 0.25°. ERA5 data have been widely used in previous moisture-tracking studies over China and have shown robust performance (An et al., 2025; Xie et al., 2024; Zhang et al., 2024). Considering the atmospheric residence time of water vapor (van der Ent et al., 2013), meteorological data from June were included as auxiliary input to enable more complete tracking of the moisture contributing to precipitation in July and August.
Vegetation conditions were characterized using the High-Quality Leaf Area Index (HiQ-LAI) dataset, a globally consistent LAI product derived from MODIS LAI Collection 6.1 using a spatiotemporal information compositing algorithm (STICA) (Yan et al., 2024). Compared with the original MODIS LAI product, HiQ-LAI improves temporal stability and spatial consistency by integrating pixel-level quality information and spatiotemporal correlations while preserving the underlying radiative transfer framework. The dataset provides global coverage at an 8 d temporal resolution and a spatial resolution of 5 km for 2000–2022, and has been validated against ground-based observations, showing reduced noise and improved phenological consistency relative to the original MODIS LAI. In this study, HiQ-LAI data for July and August were extracted and aggregated to characterize vegetation conditions during the peak growing season over the Loess Plateau. The HiQ-LAI dataset is publicly available via Zenodo (Yan et al., 2024).
Additional variables used in the random forest modeling of the Budyko parameter n were derived from the ERA5-Land and ERA5 reanalysis datasets. Four-layer soil water content (swvl1–swvl4), near-surface wind components (u and v), and surface temperature were obtained from ERA5-Land at a spatial resolution of 0.1°. Surface runoff (src) and surface shortwave radiation (ssr) were obtained from the ERA5 hourly single-level dataset at a spatial resolution of 0.25°. Vegetation cover (VC) was characterized using the China regional fractional vegetation cover (FVC) dataset at 250 m resolution (Gao et al., 2022). All variables were spatially aggregated to a common 0.25° grid to maintain consistency with the Budyko framework.
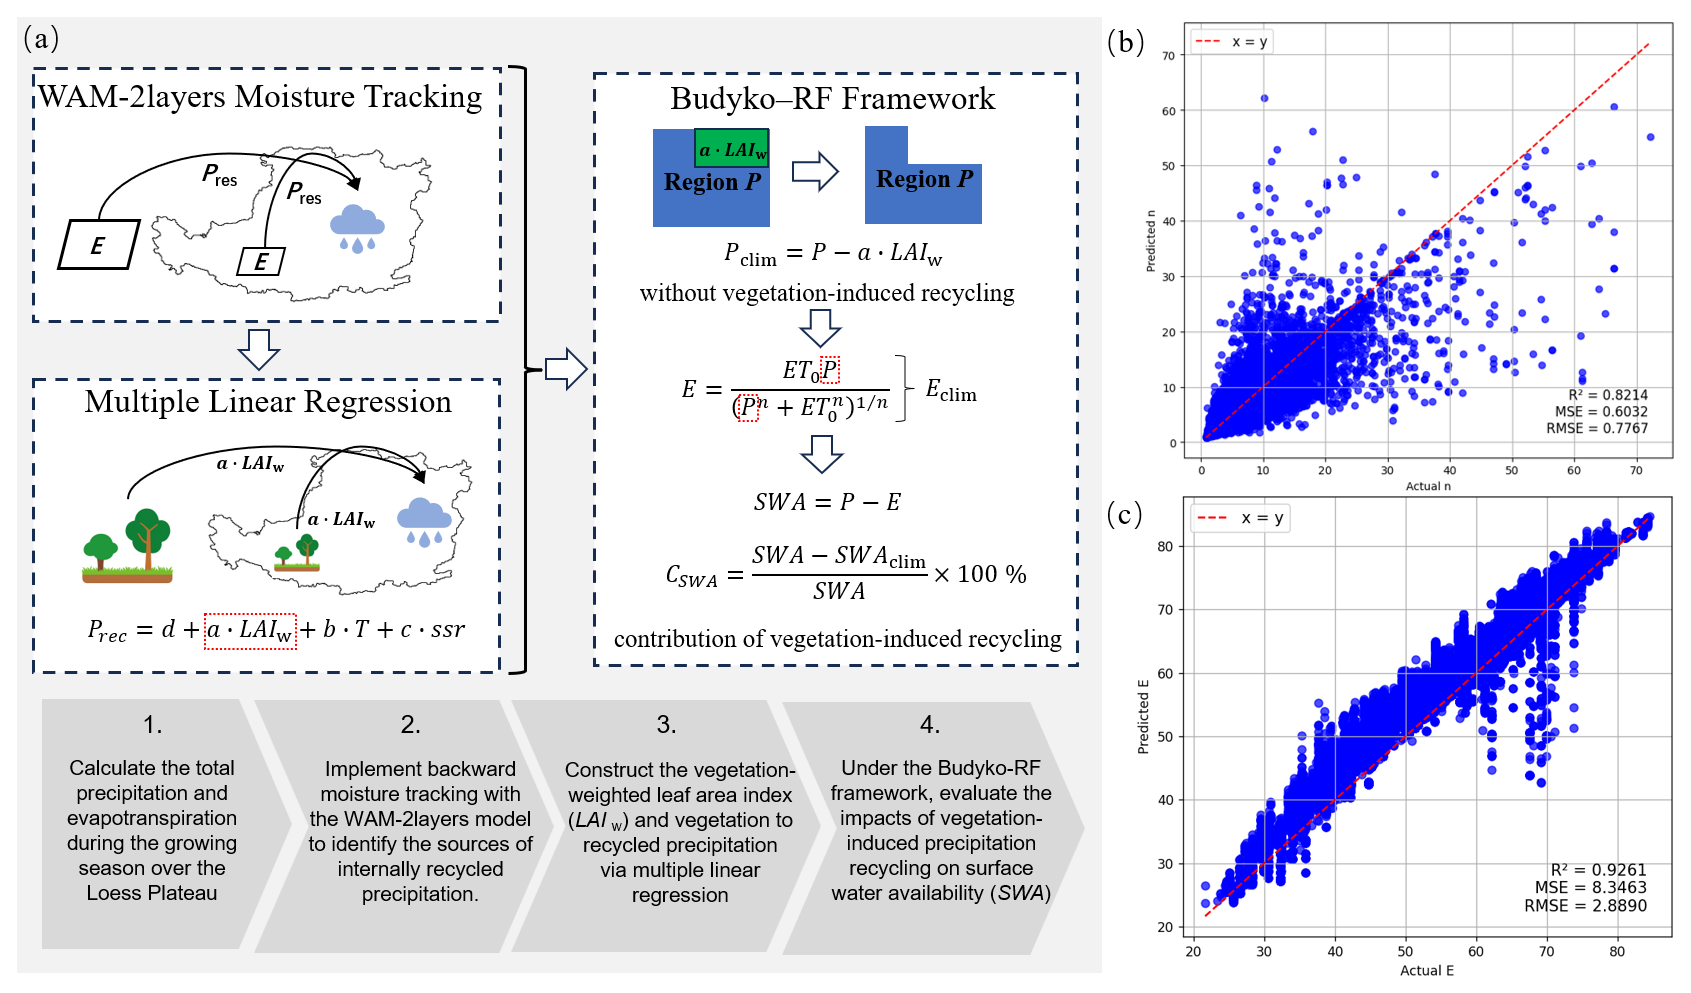
Figure 2Methodological framework and model validation results, including (a) schematic diagram of the methodological framework, (b) scatter plot of predicted n values from the random forest model versus observed n values in the test set, and (c) scatter plot of evapotranspiration estimated by the Budyko–RF framework versus observed evapotranspiration.
2.3 Methodology
This study employs an integrated framework combining atmospheric moisture tracking, vegetation-based diagnostics, and hydrological modeling to examine vegetation-associated precipitation recycling and its hydrological implications over the Loess Plateau during the peak growing season (Fig. 2a).
2.3.1 Moisture tracking and precipitation source attribution
To identify the moisture sources of precipitation over the Loess Plateau (LP) and to separate the contributions from internal recycling and external advection, we employed the Eulerian moisture-tracking model WAM-2layers v3 (Kalverla et al., 2025; van der Ent et al., 2013, 2014). The model partitions the atmosphere into two layers, namely a lower layer (k=1) below approximately 812 hPa and an upper layer (k=0) representing the free atmosphere, and assumes that moisture is well mixed within each layer. In the model, tagged moisture is defined as , where c is the tagged moisture concentration. Its spatiotemporal evolution is governed by the tagged moisture budget equation:
where S* is tagged moisture storage, , , and are the tagged moisture fluxes in the zonal, meridional, and vertical directions, respectively, and E* and P* are the tagged evaporation and precipitation terms. In WAM-2layers, tagged horizontal fluxes are assumed to be proportional to total moisture fluxes, whereas the vertical tagged flux includes an additional dispersion term to enhance interlayer mixing. The vertical transport term is treated as a closure term representing exchange at the interface between the two layers.
For the two-layer implementation, evaporation is assigned entirely to the lower layer, whereas precipitation is partitioned between the upper and lower layers according to their relative moisture contents. The resulting upper- and lower-layer equations can be written as:
and
where A is grid-cell area, SijT is total column moisture, and kvf is the vertical dispersion coefficient. This two-layer formulation improves the representation of vertical moisture exchange relative to single-layer models, particularly under strong vertical wind shear.
In this study, WAM-2layers was run in backward-tracking mode to trace the sources of precipitation over the LP during July–August for 2000–2022. Considering the atmospheric residence time of water vapor, June meteorological inputs were also included, and the tracking period was set to July–August to ensure more complete tracing of moisture contributing to July–August precipitation. Hourly ERA5 variables were temporally interpolated to a 10 min time step and simulated at 0.25° spatial resolution. This configuration follows the model recommendation that moisture transport within a time step should not exceed one grid cell, thereby maintaining numerical stability under the Courant-Friedrichs-Lewy criterion.
Based on the tracking results, precipitation over the LP was decomposed into internally recycled and externally advected components, and the relative contributions of land and ocean source regions were quantified. The recycling ratio α is defined as (van der Ent et al., 2010):
where Pv is the total precipitation over the LP during the tracking period, and Pv0 is the amount of precipitation over the LP that originates from evaporation within the LP and subsequently returns to the LP through atmospheric moisture transport.
2.3.2 Construction of LAIw and vegetation-associated component of recycled precipitation
To characterize vegetation conditions that are more directly related to land–atmosphere moisture exchange, a vegetation-weighted index, denoted as LAIw, was constructed in this study. The purpose of this index is not to define a new physical state variable, but to provide a diagnostic indicator that better links vegetation structure to the evaporative conditions under which atmospheric moisture recycling occurs.
Leaf area index (LAI) is widely used to represent vegetation canopy structure, but LAI alone does not fully reflect the extent to which vegetation is actively coupled to atmospheric moisture exchange. Under dryland conditions, the hydrological role of vegetation depends not only on canopy density, but also on the contemporaneous evaporative intensity associated with available water and energy. Grid cells with similar LAI may therefore contribute differently to moisture recycling if their evapotranspiration rates differ substantially. To account for this combined control, LAI was weighted by normalized actual evapotranspiration, so that vegetation in grid cells with stronger evapotranspiration receives greater emphasis in the subsequent diagnosis of recycled precipitation.
For each grid cell, the mean leaf area index during the peak growing season (July–August) was derived from the HiQ-LAI dataset. Actual evapotranspiration during the same period, denoted as Eobs, was used to represent the evaporative strength associated with local vegetation and hydroclimatic conditions. The vegetation-weighted index is defined as:
where Eobs is the observed evapotranspiration at the grid scale, and is the spatial mean of Eobs over the Loess Plateau, used for normalization. This formulation preserves the structural information represented by LAI while moderately increasing the relative weight of vegetation in grid cells with stronger evapotranspiration. Accordingly, LAIw is intended as a diagnostic measure of vegetation conditions that are more closely associated with land–atmosphere moisture exchange than LAI alone.
It should be noted that LAIw is a derived indicator rather than a directly observed physical quantity. Its role in this study is therefore diagnostic rather than strictly mechanistic. The weighting does not imply that evapotranspiration is solely controlled by vegetation, nor that LAIw should be interpreted as an independent biophysical property. Instead, it is used to describe vegetation conditions under which structural canopy effects and evaporative activity jointly influence the likelihood of moisture returning to the study region as recycled precipitation.
At the grid scale, a multiple linear regression was then applied to estimate the vegetation-associated component of recycled precipitation over the Loess Plateau:
where Prec represents the grid-based recycled precipitation, defined as the amount of precipitation over the Loess Plateau originating from evaporation at a given grid cell and returning to the plateau through atmospheric moisture transport. T and ssr denote near-surface air temperature and surface shortwave radiation, which are included to account for major thermodynamic controls on moisture recycling. The coefficient a represents the statistical sensitivity of recycled precipitation to LAIw, conditional on T and ssr.
Based on the estimated coefficient a, the vegetation-associated contribution to recycled precipitation is defined as:
where P0 represents the component of recycled precipitation statistically associated with vegetation conditions as characterized by LAIw. Here, P0 should be interpreted as a vegetation-associated diagnostic term rather than as a strictly causal estimate derived from process-based perturbation experiments. This term is subsequently used to construct precipitation scenarios with the vegetation-associated recycling effect removed.
The use of LAIw instead of the original LAI is intended to better capture the joint role of vegetation structure and evapotranspiration intensity in regulating recycled precipitation during the peak growing season. However, to avoid over-interpreting the weighting scheme, the robustness of this diagnostic formulation was further evaluated by repeating the key analytical steps using unweighted LAI as an alternative vegetation predictor. This comparison was used to assess whether the major results depend strongly on the specific construction of LAIw, or whether they primarily reflect the broader vegetation pattern itself.
2.3.3 Budyko–RF framework for assessing hydrological impacts of vegetation-associated precipitation recycling
The Budyko framework was originally developed for long-term water balance analysis, but recent advances have extended its application to sub-annual timescales by incorporating dynamic storage effects and time-varying parameters (Yang et al., 2026; Liu et al., 2025b). At the monthly scale, explicitly accounting for soil water storage change can substantially improve the performance of Budyko-type equations, thereby supporting the feasibility of such approaches beyond traditional annual mean applications (Yang et al., 2026).
In this study, the Budyko framework is applied as a comparative diagnostic tool for the peak growing season (July–August), rather than as a process-based simulator of the full land–atmosphere system. Unlike climate model (GCM/RCM) approaches, which explicitly resolve coupled vegetation–atmosphere interactions through dynamic representations of radiation, convection, and moisture transport, the Budyko framework provides a constraint-based diagnostic description of surface water balance under observed hydroclimatic conditions. This distinction implies that vegetation–precipitation feedbacks in this study are not simulated dynamically, but are instead quantified through their contribution to the observed precipitation–evapotranspiration balance.
The framework is used to isolate the first-order hydrological effects of vegetation-associated precipitation recycling under consistent land surface and atmospheric conditions. This seasonal application is conceptually consistent with previous monthly Budyko studies that emphasize the importance of parameter variability under changing hydroclimatic conditions (Chen et al., 2013).
To better represent sub-annual variability in land-surface and hydroclimatic conditions, the key Budyko parameter n was allowed to vary across grid cells and years through a Random Forest (RF) model (Breiman, 2001). This treatment is conceptually consistent with previous monthly Budyko studies that emphasize the importance of storage effects and parameter variability under changing hydroclimatic and land-surface conditions. By linking n to vegetation, soil moisture, and meteorological conditions, this Budyko–RF framework was used to evaluate the hydrological implications of vegetation-associated precipitation recycling.
Actual evapotranspiration (E) simulated by the Budyko framework was calculated using the Mezentsev–Choudhury–Yang equation:
where P is precipitation, ET0 is potential evapotranspiration, and n is a dimensionless parameter characterizing integrated land surface properties.
Because n is affected by vegetation conditions, soil water status, and atmospheric forcing, an RF regression model was used to estimate n for each grid cell:
where VC is vegetation cover; swvl1–swvl4 represent soil moisture in four layers; u and v are wind components; T is near-surface air temperature; src is surface runoff; and ssr is surface shortwave radiation.
To evaluate the performance of the Budyko–RF framework at the analysis scale used in this study, a two-step validation was performed. First, 80 % of the samples were used for model training and the remaining 20 % for testing. The RF model showed good predictive skill for n in the test set (Fig. 2b, R2=0.82), indicating that the effective Budyko parameter can be reasonably estimated from vegetation associated, hydrological, and meteorological predictors. Second, evapotranspiration estimated by the Budyko–RF framework was compared with observed evapotranspiration at the grid scale. The comparison showed strong agreement (Fig. 2c, R2=0.93), suggesting that the framework can satisfactorily reproduce actual evapotranspiration during the study period.
To further quantify the hydrological impacts of vegetation-associated precipitation recycling, a counterfactual precipitation scenario was constructed by removing the vegetation-associated recycled component from regional mean precipitation while keeping other climatic controls unchanged. For each year t, the study domain contains Nt valid grid cells, and regional mean precipitation and potential evapotranspiration are denoted by and , respectively. Based on the grid-scale vegetation-associated recycled precipitation , the total contribution associated with a given set of grid cells S is expressed as:
The precipitation scenario without vegetation-associated recycling is then defined at the regional mean scale as:
This formulation represents the removal of the vegetation-associated recycling component as a uniform perturbation to regional mean precipitation, allowing direct comparison among years and among vegetation subsets.
Hydrological responses to the counterfactual precipitation were evaluated within the Budyko framework. For each year t, the Budyko parameter nt was held constant when comparing the baseline and counterfactual scenarios, so that changes in evapotranspiration could be attributed solely to differences in precipitation. Accordingly, regional mean evapotranspiration under baseline and counterfactual conditions is given by:
where β (⋅) denotes the Budyko mapping.
The vegetation-associated component of regional evapotranspiration associated with precipitation recycling is quantified by scenario differencing:
The regional aridity index is introduced to further characterize the regional hydroclimatic conditions, defined as:
Here, AI is used as a diagnostic hydroclimatic index defined as , rather than the conventional PET-based aridity index.
The regional surface water availability is defined as the difference between precipitation and evapotranspiration:
with the corresponding value under the counterfactual precipitation scenario given by:
The relative contribution of vegetation-associated precipitation recycling to regional surface water availability is finally expressed as:
This framework provides a consistent attribution of vegetation-associated precipitation recycling effects on regional evapotranspiration and surface water availability, and can be applied uniformly to the entire study domain as well as to vegetation subsets defined by LAIw magnitude or long-term LAIw trends.
3.1 Spatiotemporal characteristics and sources of recycled precipitation over the Loess Plateau
Atmospheric moisture tracking based on WAM-2layers for the peak growing season (July–August) during 2000–2022 shows that precipitation over the Loess Plateau (LP) is sustained by both external moisture advection and internal moisture recycling. The mean amount of precipitation originating from evaporation at individual grid cells and returning to the LP (Pv0) is 2.05 mm, indicating that terrestrial evaporation contributes measurably to regional precipitation. The dominant moisture transport pathways supplying precipitation to the LP exhibit a clear bimodal pattern (Fig. 3a). One pathway is associated with the mid-latitude westerlies, through which moisture from Central and Western Asia is transported eastward toward the LP. The other is related to southerly transport driven by the southwest and southeast monsoons, which carries moisture from the Indian and Pacific Oceans northward into the study region.
Quantitative source attribution further shows that land-sourced moisture dominates the precipitation supply to the LP. On average, terrestrial moisture contributes approximately 71.0 mm of precipitation, accounting for 86.5 % of total growing-season precipitation, whereas oceanic moisture contributes about 11.1 mm, corresponding to 13.5 % (Fig. 3b). This land-sourced moisture signal reflects moisture that has undergone substantial transformation through repeated evaporation–precipitation cycles during inland transport, rather than exclusively locally generated evaporation. Such a pattern suggests progressive modification of monsoon-derived moisture along continental transport pathways within a monsoon–inland transition zone, where ocean-origin vapor is continuously mixed with terrestrial evapotranspiration inputs before reaching the Loess Plateau.
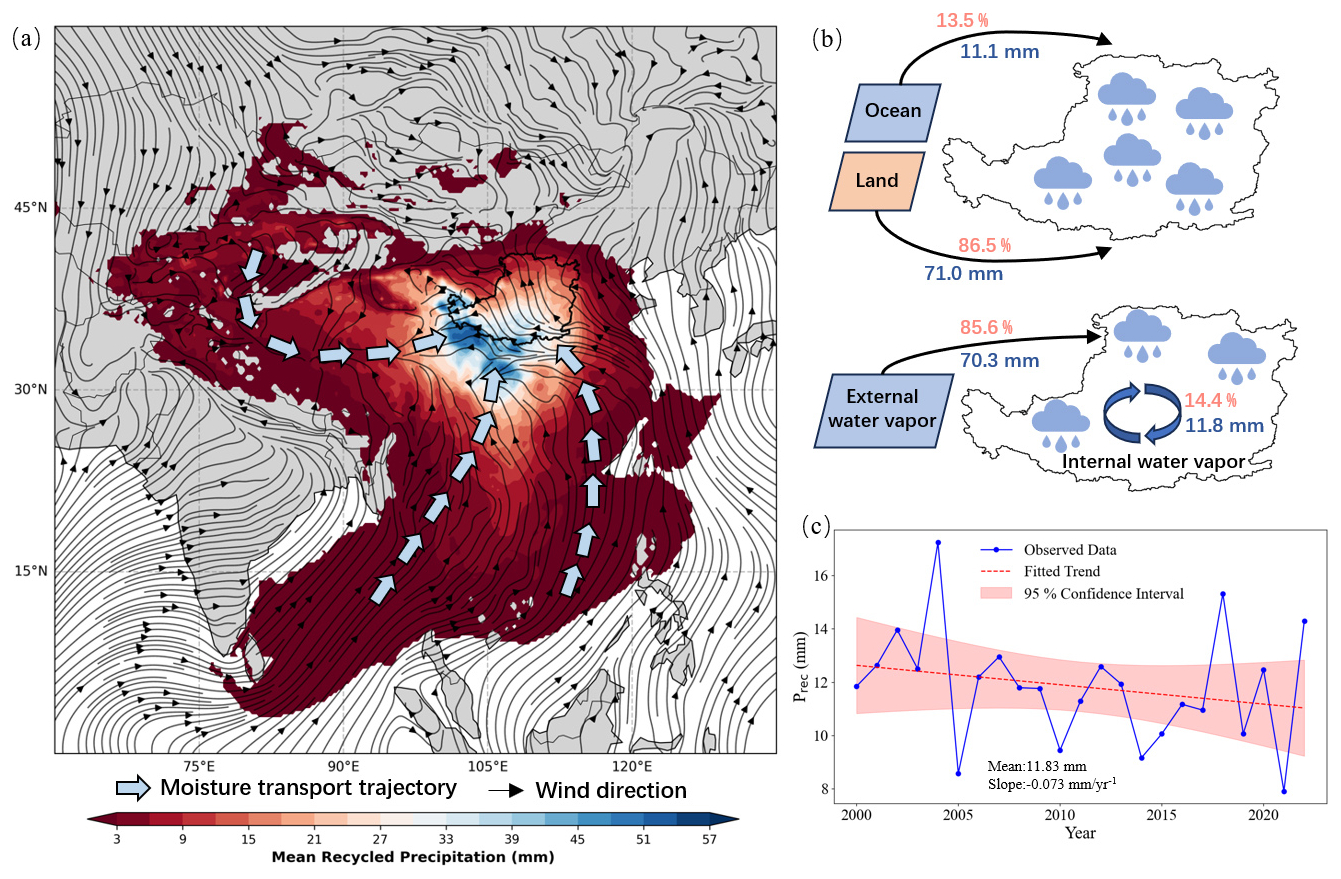
Figure 3Recycled precipitation over the Loess Plateau during the growing season (July–August, 2000–2022). (a) Spatial distribution of mean recycled precipitation and moisture transport. (b) Contributions of oceanic and terrestrial moisture sources and the partitioning between external and internal recycling. (c) Interannual variation of internally recycled precipitation.
In terms of recycling pathways, externally advected precipitation accounts for 70.3 mm (85.6 %), while internally recycled precipitation contributes 11.8 mm, representing 14.4 % of total precipitation over the LP. During the study period, internally recycled precipitation shows a trend of −0.073 mm yr−1 (Fig. 3c). This result indicates a gradual weakening of the contribution of internal moisture recycling to growing-season precipitation over the LP.
3.2 Vegetation-weighted patterns and contributions to recycled precipitation
To characterize the spatial patterns of vegetation conditions relevant to moisture recycling over the Loess Plateau, the vegetation-weighted index LAIw was analyzed at the grid scale. The spatial distribution and temporal trends of LAIw are shown in Fig. 4a–b. The multi-year mean LAIw over the Loess Plateau is 0.45, and approximately 90.6 % of grid cells exhibit LAIw values lower than 1, mainly in the northwestern part of the plateau where vegetation cover is relatively sparse. In contrast, grid cells with LAIw values greater than 4 account for only 2.9 % of the region and are concentrated in localized areas of the southeastern Loess Plateau. At the regional scale, 48.7 % of grid cells show increasing trends in LAIw, whereas 26.5 % show decreasing trends. Spatially, increases in LAIw are mainly located in areas that already exhibit relatively high LAIw values (Fig. 4b).
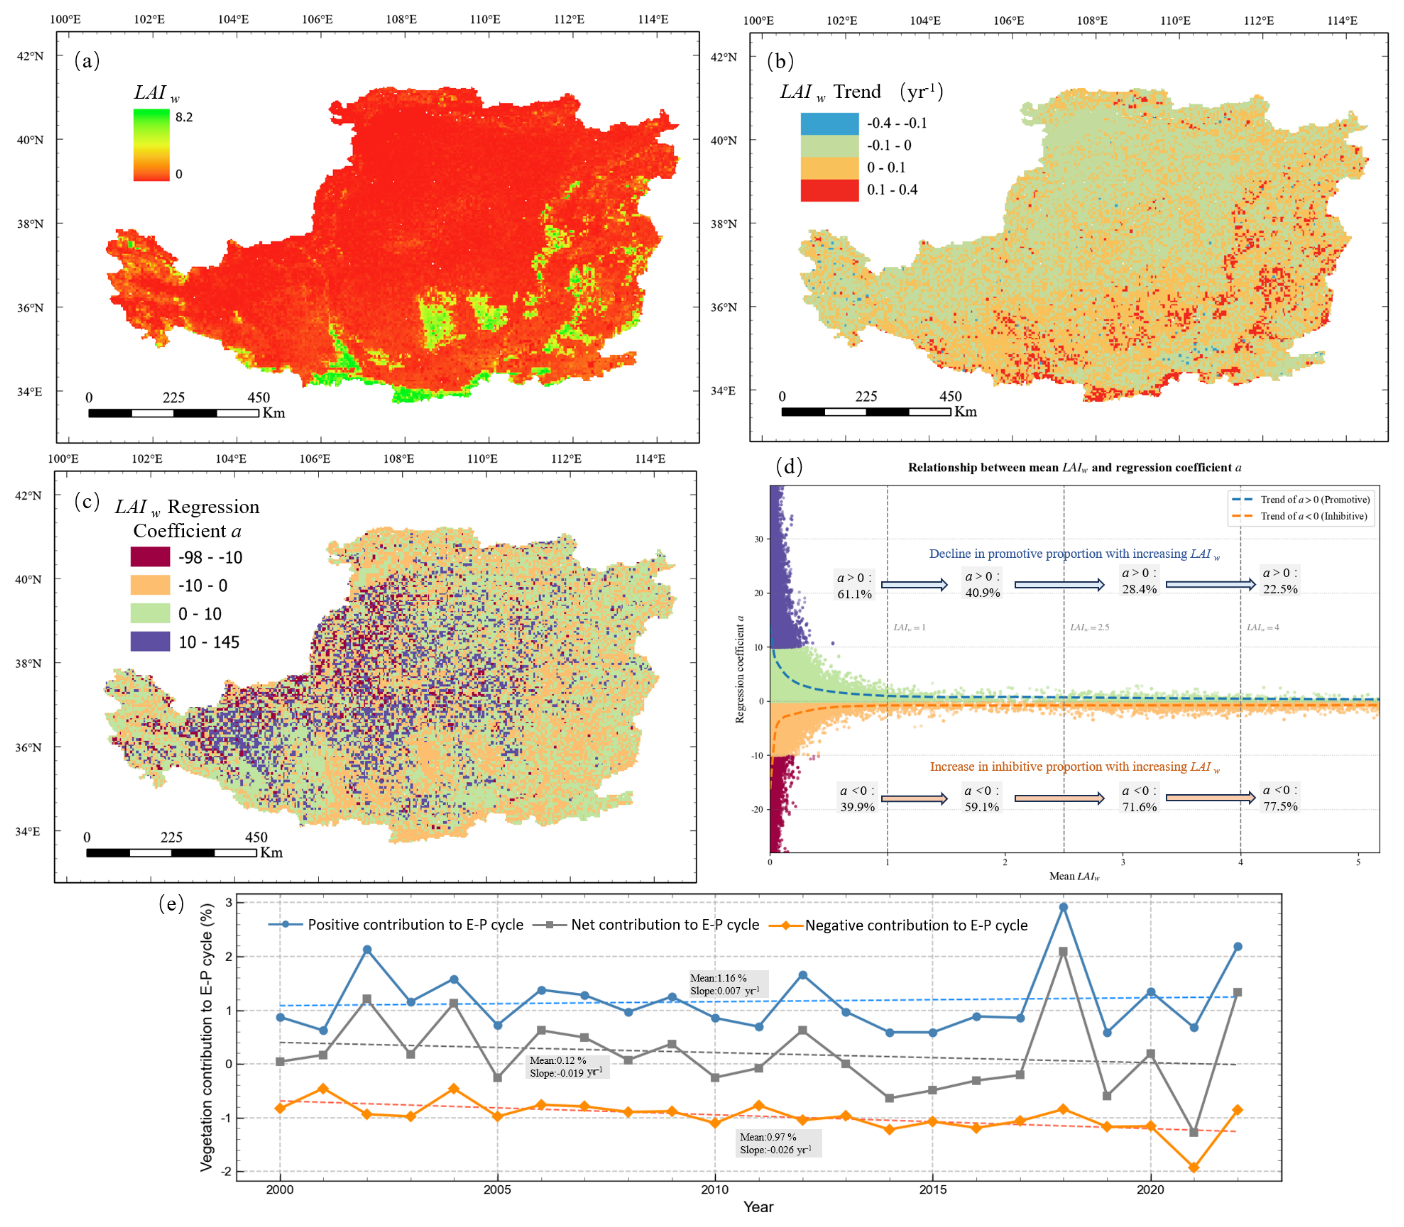
Figure 4Spatial patterns and effects of vegetation-weighted index LAIw over the Loess Plateau. (a) Spatial distribution of mean LAIw during the growing season. (b) Spatial patterns of linear trends in LAIw. (c) Spatial distribution of the regression coefficient a. (d) Relationship between mean LAIw and the regression coefficient a. (e) Interannual variation of vegetation contributions to the evaporation–precipitation cycle.
To further evaluate the statistical association between vegetation conditions and recycled precipitation, a grid-based multiple linear regression was performed with recycled precipitation (Prec) as the dependent variable and LAIw, near-surface air temperature, and surface shortwave radiation as explanatory variables. Here, Prec represents the amount of precipitation over the Loess Plateau that originates from evaporation at a given grid cell and subsequently returns to the plateau through atmospheric moisture transport. The regional mean of the sensitivity coefficient of LAIw (a) is 2.34, and 57.5 % of grid cells exhibit positive a values, indicating that higher LAIw is statistically associated with greater recycled precipitation across much of the study area (Fig. 4c–d).
Figure 4e shows the interannual evolution of the vegetation-associated contribution to the evaporation–precipitation (E–P) cycle, decomposed into positive, negative, and net components. Over the study period, the mean positive contribution is 1.16 %, with a weak increasing trend of 0.007 % yr−1. In contrast, the mean negative contribution is −0.97 %, with a trend of −0.026 % yr−1. As a combined result of these opposing components, the net vegetation-associated contribution to the E–P cycle remains small, with a mean value of 0.12 % and a slight trend of −0.019 % yr−1. Overall, these results show that positive and negative vegetation-associated influences on internal moisture recycling largely offset each other at the regional scale.
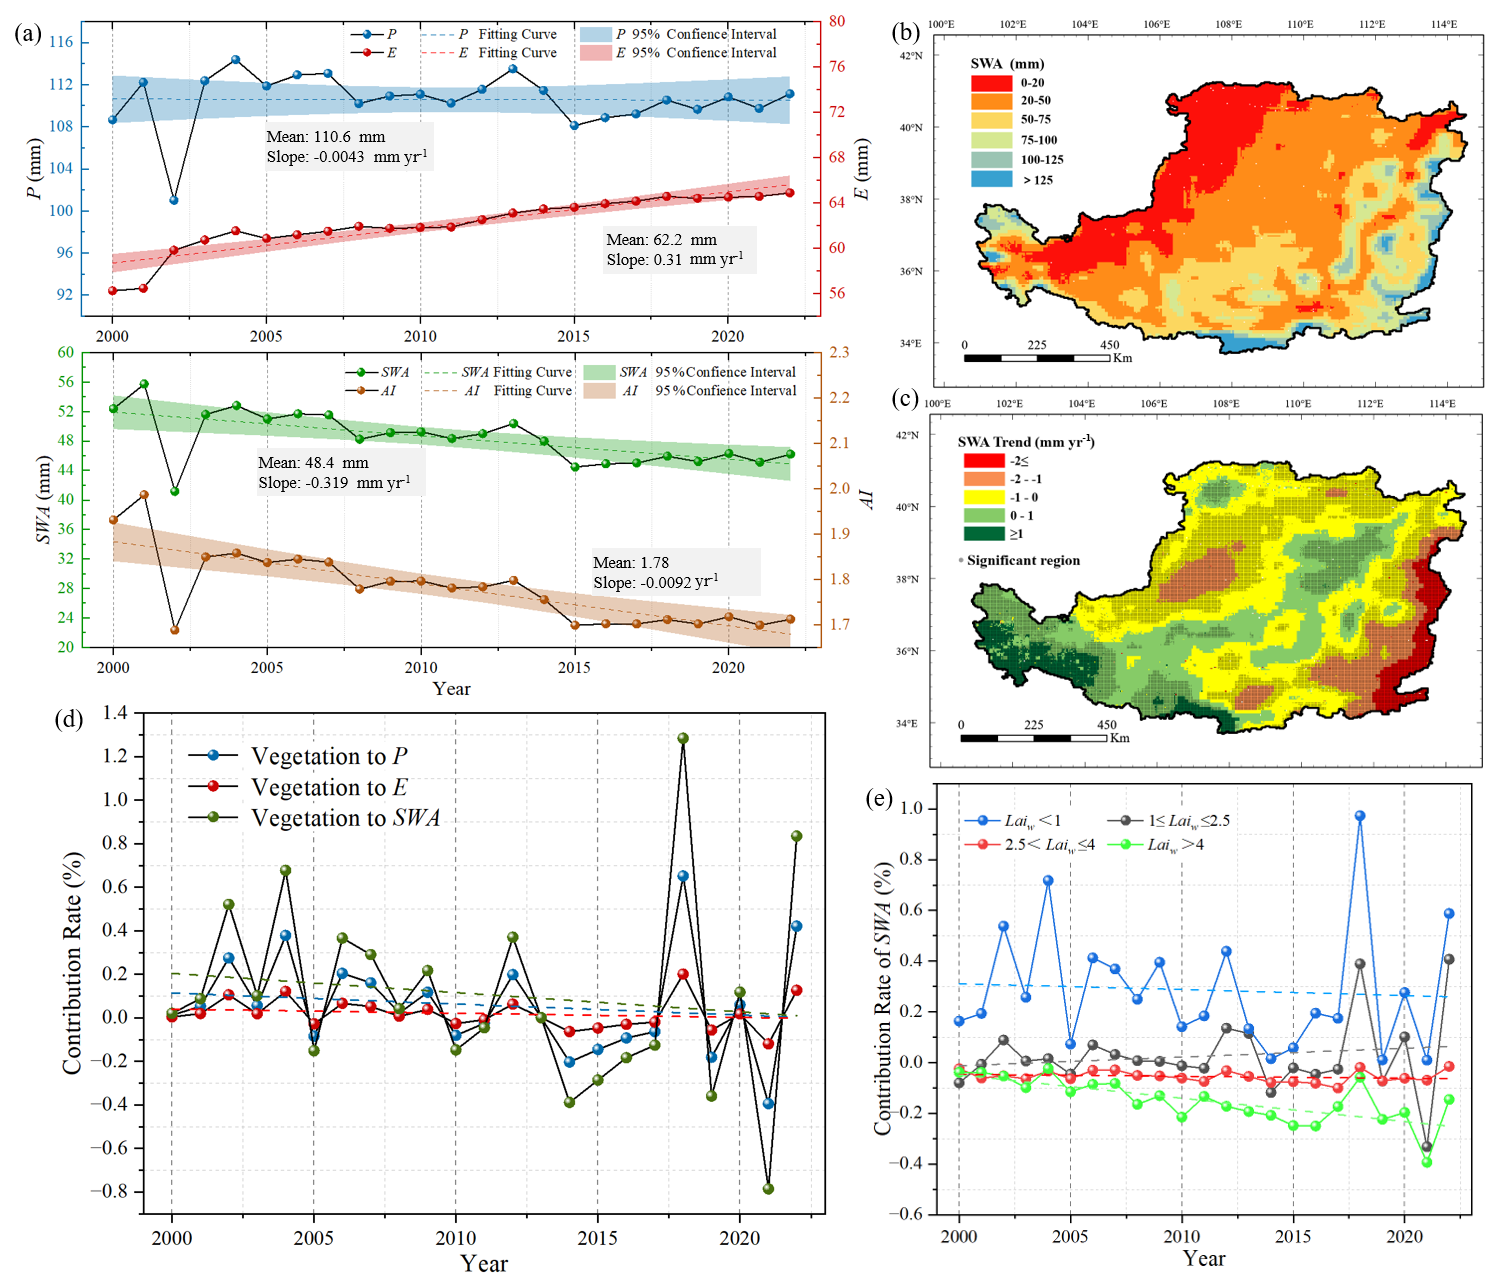
Figure 5Vegetation-associated impacts on precipitation, evapotranspiration, and surface water availability over the Loess Plateau. (a) Interannual variations of growing-season P, E, SWA, and AI. (b) Spatial distribution of SWA. (c) Spatial patterns of SWA trends. (d) Interannual contribution rates of vegetation to P, E, and SWA. (e) Contribution rates of vegetation to SWA under different LAIw classes.
3.3 Declining surface water availability and hydrological implications of vegetation-associated precipitation recycling
A pronounced drying tendency is observed over the Loess Plateau during the growing season from 2000 to 2022 (Fig. 5a). Interannual variations in precipitation (P), evapotranspiration (E), surface water availability (SWA), and the aridity index (AI) show that regional precipitation exhibits a non-significant trend of −0.0043 mm yr−1, whereas evapotranspiration shows a significant increasing trend of 0.31 mm yr−1. The contrasting changes in precipitation and evapotranspiration correspond to increasingly dry hydroclimatic conditions over the study period. Although the interannual variations in SWA and AI generally follow the temporal pattern of precipitation, both indices exhibit significant downward trends under increasing evapotranspiration, with SWA decreasing at a rate of 0.34 mm yr−1 and AI decreasing at a rate of 0.008 yr−1.
The spatial distribution of mean SWA and its temporal trends also show clear heterogeneity across the Loess Plateau (Fig. 5b–c). Higher SWA values are mainly distributed in the southeastern part of the region, whereas persistently low SWA values characterize the northwestern arid areas. Declining SWA trends occur in both relatively high-SWA and low-SWA regions, whereas increasing trends are mainly concentrated in the southwestern Loess Plateau. Although 51 % of grid cells show increasing trends in SWA and 49 % show decreasing trends, the pattern becomes asymmetric when statistical significance is considered. Among the 56.6 % of grid cells with significant SWA trends (P<0.05), 40 % exhibit significant declines, whereas only 16.6 % show significant increases. This indicates that the most robust regional signal is a widespread decline in SWA.
To quantify the hydrological implications of vegetation-associated recycled precipitation (P0), the P0 term estimated in Sect. 3.2 was subtracted from total precipitation and the resulting water-balance components were evaluated within the Budyko–RF framework. The results (Fig. 5d) show that the mean relative contributions of vegetation-associated recycled precipitation to P, E, and SWA are 0.059 %, 0.02 %, and 0.107 %, respectively. A consistent response pattern is observed across the study region: grid cells with positive P0 contributions to precipitation also show higher E and SWA, whereas negative P0 contributions are accompanied by concurrent reductions in both E and SWA. Overall, the positive hydrological contribution of P0 is relatively more evident in drier areas with lower SWA.
Figure 5e further shows a systematic dependence of the SWA contribution associated with vegetation-associated recycled precipitation on LAIw. Under low-LAIw conditions (LAIw<1), the contribution to SWA remains consistently positive, with a mean value of 0.2855 % and no negative values across all years, although it shows a trend of −0.0023 % yr−1. As LAIw increases, this positive contribution diminishes and gradually shifts toward negative values. For intermediate LAIw conditions (), the mean contribution is close to zero (0.02565 %) and shows substantial interannual variability, with negative values occurring in 11 years; however, a modest positive trend (0.0035 % yr−1) is still observed. In contrast, high-LAIw conditions (LAIw≥2.5) are characterized by persistently negative contributions to SWA, with mean values of −0.0361 % for and −0.1495 % for LAIw>4, and the strongest negative trend (−0.0092 % yr−1) occurs in the highest-LAIw class. Overall, these results indicate a systematic shift from weakly positive to increasingly negative SWA contributions along the LAIw gradient.
4.1 Hydroclimatic constraints and precipitation recycling over the Loess Plateau
Recent global studies show that surface water availability (SWA) has increased over much of the terrestrial surface. This is mainly because precipitation has risen faster than evapotranspiration across more than 53 % of global land areas (Cui et al., 2022). In contrast, our results show a decline in SWA over the Loess Plateau during the study period (Fig. 5a). In this arid and semi-arid region, evapotranspiration increased faster than precipitation, reducing available surface water. Similar drying trends have been widely reported in dryland. Climate warming is expected to increase drought frequency and severity (Stevenson et al., 2022; Tabari et al., 2021). In addition, limited precipitation and enhanced evaporation often lead to declining regional water resources (Lai et al., 2022). Together, these findings indicate that water availability in in drylands is strongly constrained by low precipitation and high evaporative demand.
Under this hydroclimatic background, precipitation over the Loess Plateau is strongly controlled by large-scale monsoon moisture transport. It is continuously modified by land–atmosphere exchanges along its inland pathway. The WAM-2layers results show that Central China is the predominantly continental-influenced moisture source for precipitation over the Loess Plateau (Fig. 3a). This is consistent with previous Lagrangian studies. These studies indicate that summer moisture mainly comes from Central–Eastern China and northwestern continental Asia. In contrast, direct oceanic contributions from the East China Sea, South China Sea, Bay of Bengal, and Arabian Sea are minor, together accounting for only about 10 % of total precipitation (Hu et al., 2018).
The dominance of continental moisture sources reflects progressive changes in monsoon vapor during inland transport. Along this pathway, repeated evaporation–precipitation cycles and boundary layer recycling gradually reshape the original oceanic moisture signal. Recent studies also show that vegetation greening enhances evapotranspiration and strengthens regional moisture recycling (Cao et al., 2024). In this process, the land surface acts both as a moisture source and an intermediate contributor to atmospheric moisture through evapotranspiration and recycling processes. This reinforces the continental component in the monsoon–land coupled system. Therefore, the high fraction of land-sourced precipitation (86.5 %) should not be interpreted as a weak oceanic influence. Instead, it reflects the combined effects of monsoon moisture transport and terrestrial recycling. The East Asian monsoon provides the initial moisture input, while continental recycling determines the final precipitation composition over the Loess Plateau.
Within this externally controlled system, internal precipitation recycling contributes about 14.4 % of total precipitation during the study period (Fig. 3b–c). This value is higher than those reported in some previous studies, such as 7 % from the UTrack Lagrangian moisture-tracking model (Wang et al., 2023) and 9.16±0.35 % to 10.18±0.28 % from the Dynamic Precipitation Recycling Method (Tian et al., 2022). These differences mainly reflect methodological approaches and climatic context rather than physical inconsistency. Most previous studies use annual or long-term averages. In contrast, this study focuses on July–August, when vegetation activity, evapotranspiration, and land–atmosphere coupling are strongest over the Loess Plateau (Li et al., 2024; Guo et al., 2025).
This seasonal amplification agrees with recent findings that vegetation and land use changes regulate atmospheric moisture recycling by affecting evapotranspiration and atmospheric moisture residence time (Wang et al., 2023). In this framework, precipitation recycling is not a fixed ratio. It responds dynamically to land surface conditions and atmospheric moisture supply. Similarly, afforestation has been shown to strengthen land–atmosphere coupling and increase both external and internal moisture contributions to precipitation (Tian et al., 2022). Therefore, the relatively high recycling ratio in this study reflects enhanced seasonal coupling during the peak growing season, rather than overestimation. These results indicate that precipitation over the Loess Plateau is jointly controlled by monsoon moisture transport and terrestrial recycling processes.
4.2 Conditional and nonlinear vegetation-associated effects on surface water availability
Under water-limited conditions, vegetation affects regional water cycling through two competing pathways. First, enhanced vegetation activity increases evapotranspiration and strengthens land–atmosphere coupling. This can promote the return of locally evaporated moisture as precipitation (Sterling et al., 2013). Second, vegetation growth increases terrestrial water consumption. This reduces soil moisture and limits water availability for surface and subsurface hydrological processes (Piao et al., 2020). These two pathways coexist. As a result, vegetation-associated effects on internal moisture recycling do not translate into a uniformly positive impact on surface water availability.
Recent work by Tian et al. (2026) provides a complementary system-level view. They show that vegetation greening can enhance precipitation efficiency through albedo-driven energy feedbacks. These feedbacks increase surface radiation, atmospheric instability, and moisture-to-precipitation conversion efficiency. Their results also indicate that greening can simultaneously increase evapotranspiration and streamflow in semi-arid regions. This suggests a coupled energy–moisture mechanism that intensifies the atmospheric water cycle. The results are broadly consistent with the energy–moisture coupling perspective proposed by Zhang (2025), particularly in terms of enhanced atmospheric moisture recycling under greening conditions. We observe strengthened land–atmosphere coupling and enhanced internally recycled moisture. However, the effect on surface water availability depends on temporal scale and hydrological closure assumptions.At the regional scale, vegetation-associated effects on the evaporation–precipitation cycle largely cancel out over the long term. Vegetation can enhance precipitation during active growth periods. However, this is accompanied by increased evapotranspiration. As also suggested by Tian et al. (2026), this represents a redistribution of water within the system rather than a net gain in water resources. Consequently, the net effect on regional water availability is very small (Figs. 4e, 5d). This small value should be interpreted carefully. Here, we only quantify the vegetation contribution to precipitation generated from local evaporation and recycled within the Loess Plateau. Internally recycled precipitation accounts for only 14.4 % of total growing-season precipitation (Fig. 3c). Therefore, even a detectable vegetation effect on this component becomes strongly diluted when expressed relative to total precipitation and total surface water availability.
In addition, the regional mean signal reflects strong compensation between positive and negative vegetation effects. The strongest positive and negative contributions reach 12.2 % and −32.2 % of the internally recycled precipitation, respectively (Figs. 3c and 6a). Thus, the small net effect results not only from the limited share of internal recycling, but also from strong cancellation across vegetation conditions. This compensation is consistent with the nonlinear energy–moisture coupling described by Tian et al. (2026). In that framework, enhanced moisture conversion efficiency coexists with increased evaporative demand. This leads to spatially heterogeneous hydrological responses rather than uniform changes.
A small net effect does not imply that vegetation–atmosphere feedbacks are negligible. Instead, it indicates that under the dry conditions in the Loess Plateau, additional precipitation generated through recycling is generally insufficient to offset increased evapotranspiration caused by vegetation growth. As a result, vegetation does not substantially increase net surface water availability. Instead, it primarily reflects a redistribution of water within a tightly constrained land–atmosphere system.
In this context, the hydrological benefit of vegetation-associated recycling is strongly limited by background hydroclimatic conditions. This is different from humid or energy-limited regions, where vegetation-associated recycling more easily translates into net water gains (Cui et al., 2022; Meier et al., 2021). The comparison highlights the key role of climate setting in regulating vegetation–water coupling efficiency. It also suggests that small mean effects should not be interpreted as hydrological irrelevance. Rather, they reflect strong compensatory feedbacks under water-limited conditions.More importantly, vegetation effects on surface water availability show a clear nonlinear pattern along the LAIw gradient. Two lines of evidence support this. First, the contribution of vegetation-associated recycled precipitation shifts from positive under low-LAIw to negative under high-LAIw. This indicates that the hydrological benefit of recycling is mainly limited to sparse vegetation. It weakens when vegetation density exceeds a moderate level (Figs. 5e and 6a). Second, the temporal evolution of positive and negative components shows asymmetric behavior. Positive contributions are small and intermittent, while negative contributions become more persistent with increasing LAIw (Figs. 4e, 5e and 6b). This pattern is consistent with the limited water storage capacity and strong evaporative sensitivity in the Loess Plateau.
Within the broader framework of Tian et al. (2026), this nonlinear behavior reflects a trade-off between enhanced precipitation efficiency and increased evaporative demand under higher vegetation density. Under such conditions, further vegetation growth is more likely to intensify water consumption than to produce sustained gains in surface water availability. Therefore, the key scientific value of the small regional mean effect lies not in its magnitude, but in revealing the conditions under which vegetation-associated recycling shifts from weakly beneficial to increasingly negative under higher LAIw conditions.
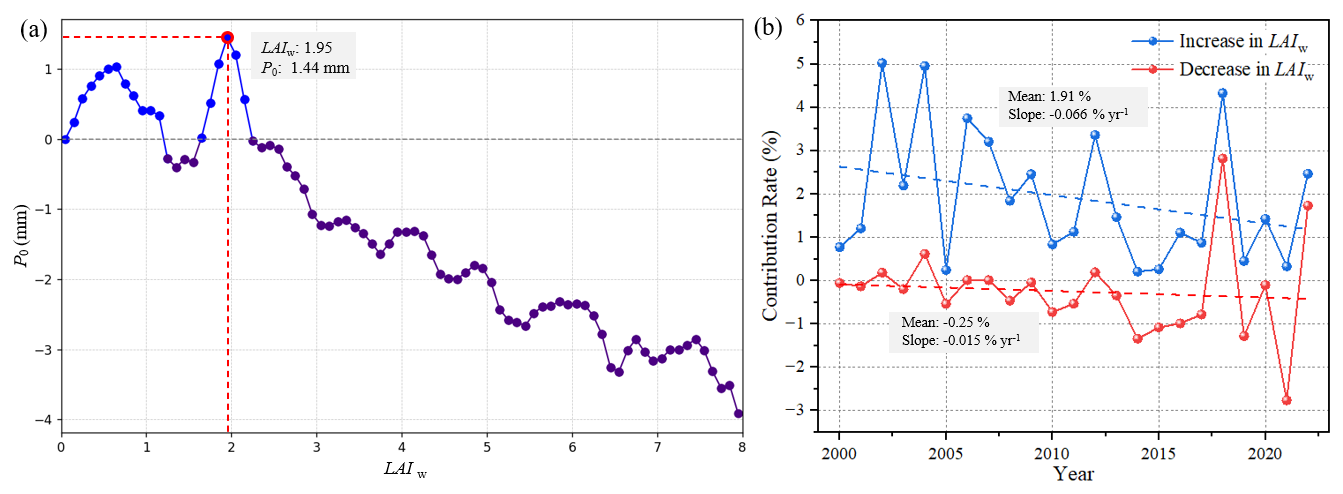
Figure 6Vegetation-associated variations in recycled precipitation and surface water availability: (a) recycled precipitation along the LAIw gradient, (b) Contribution rates of vegetation to SWA under increasing and decreasing LAIw conditions.
4.3 Robustness of the LAIw diagnostic framework
Because LAIw is a derived diagnostic indicator rather than a directly observed physical variable, its formulation may raise concerns about whether the identified hydrological patterns depend on the weighting scheme. In particular, weighting LAI by normalized actual evapotranspiration could, in principle, influence the apparent strength of vegetation–hydrological coupling and thereby affect the inferred threshold-like behavior.
To test this, we repeated the full analytical workflow using the original, unweighted peak-growing-season LAI instead of LAIw. This parallel analysis included the multiple linear regression for Prec and the Budyko-based attribution of hydrological effects. We then compared vegetation contributions to surface water availability (CSWA) between the LAI-based and LAIw-based frameworks at both the regional mean scale and across vegetation classes defined in Sect. 3.3.
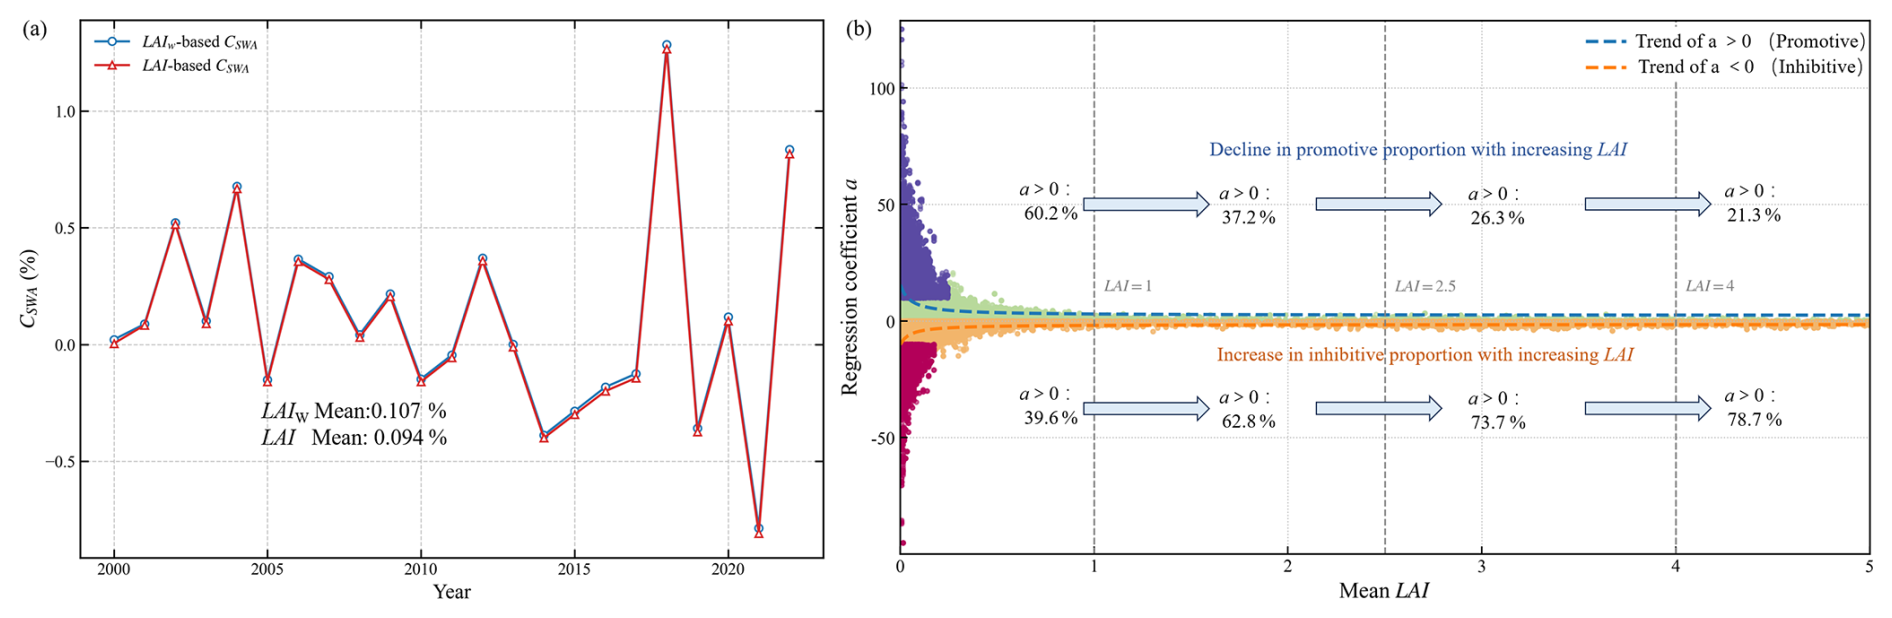
Figure 7Vegetation-associated variations in surface water availability and vegetation contribution under LAI and LAIw conditions: (a) interannual variations in vegetation-associated CSWA estimated from LAI and LAIw, (b) contribution rates of vegetation to SWA under promotive and inhibitive conditions along the mean LAI gradient.
The results show that the main findings are highly robust to the choice of vegetation indicator. Interannual variations in P0 and CSWA are nearly identical between the two frameworks, with Pearson correlation coefficients of 0.99996 and 0.99995, respectively (Fig. 7). The multi-year mean values also show only minor differences, with an absolute difference of 0.013 %. This high consistency indicates that the observed hydrological response is not an artifact of the LAIw weighting scheme. Instead, LAIw mainly acts as a diagnostic rescaling of the vegetation gradient under different evaporative conditions. The dominant signal is still controlled by vegetation structure.
Importantly, the threshold-like behavior should be interpreted as a real regime transition driven by the interaction between vegetation density and evaporative demand. It is not produced by the LAIw formulation. Rather, LAIw helps to reveal how vegetation effects on moisture recycling and surface water availability change under different atmospheric conditions. This suggests that vegetation–water interactions in the Loess Plateau operate within a constrained hydrological regime. The system shifts from a weakly coupled state with slight positive effects to a strongly evaporative-dominated state with negative effects. This transition reflects limited water storage capacity and high evaporative sensitivity in the region.
From a management perspective, this shift implies an implicit water-limited carrying capacity for vegetation restoration. Beyond this level, further increases in vegetation density are more likely to increase evapotranspiration than to enhance surface water availability. However, this should not be interpreted as a fixed threshold for restoration. Instead, it represents a context-dependent response governed by hydroclimatic conditions in dryland environments.
4.4 Limitations and Research Prospects
This study provides a quantitative assessment of vegetation-associated precipitation recycling and its contribution to surface water availability during the peak growing season over the Loess Plateau. Several limitations should be acknowledged.
First, the seasonal focus on July–August. This period represents a peak-coupling stage within the monsoon-dominated growing season from June to September. The growing season accounts for 60 %–70 % of annual precipitation and coincides with the annual maxima of precipitation, evapotranspiration, and land–atmosphere coupling (Liang et al., 2015; Zhang et al., 2018, 2022b). During July–August, vegetation is fully developed and atmospheric moisture exchange is strong. In contrast, coupling is weaker in early summer because vegetation is not yet fully developed. It also weakens in late summer because of soil moisture depletion (Feng et al., 2016; Liang et al., 2015). Therefore, our analysis captures the period of strongest vegetation–atmosphere interaction rather than a full-season or annual mean state. The identified recycling signals should thus be interpreted as the upper bound of seasonal coupling intensity. Annual-scale water balance assessments, by contrast, reflect integrated hydrological responses across multiple seasonal phases (Wang et al., 2016).
Second, the analysis is limited to local hydrological responses within the Loess Plateau. It does not explicitly consider downwind effects caused by vegetation-induced moisture export. Vegetation-enhanced evapotranspiration may reduce local water availability. At the same time, it may contribute to precipitation in downstream regions through atmospheric transport (Greve et al., 2025). A more complete assessment would require a coupled local–downwind framework. Such a framework could quantify the broader hydroclimatic footprint of vegetation-induced moisture redistribution.
Third, uncertainty arises from both the input datasets and the attribution framework. Recycled precipitation and hydrological responses were derived from multiple reanalysis and remote-sensing products. These uncertainties may propagate through the moisture-tracking analysis and the Budyko–RF attribution framework. In addition, LAIw is a diagnostic indicator rather than a directly observed physical variable. The P0 term also represents a statistical attribution of vegetation-associated recycled precipitation, rather than a strictly causal estimate from perturbation experiments. Therefore, the counterfactual analysis isolates a first-order hydrological effect. It does not resolve secondary feedbacks involving soil moisture, vegetation dynamics, or atmospheric circulation responses.
Future work should address these limitations in three ways. First, the analysis should be extended from the peak growing season to full seasonal and annual scales. Second, downwind moisture transport should be explicitly incorporated to capture the broader hydroclimatic footprint of vegetation. Third, uncertainty characterization should be improved for both input datasets and diagnostic attribution frameworks. Together, these efforts would help clarify how vegetation–atmosphere feedbacks evolve across spatial gradients and temporal scales in water-limited environments.
The Loess Plateau is a water-limited region in arid and semi-arid northern China. Large-scale vegetation restoration has raised an important question: can vegetation-associated precipitation recycling meaningfully alleviate regional water scarcity? To address this question, this study combined a WAM-2layers Eulerian atmospheric moisture-tracking model with a random forest–enhanced Budyko framework. We examined peak growing season water cycling over the Loess Plateau in July and August during 2000–2022, a period when vegetation–atmosphere coupling is expected to be strongest.
The results show that growing-season precipitation over the Loess Plateau is dominated by land-derived moisture. Terrestrial evaporation contributes 86.5 % of total precipitation, while oceanic sources contribute 13.5 %. Internal moisture recycling contributes 11.83 mm on average, accounting for 14.4 % of total precipitation. It also shows a trend of −0.073 mm yr−1 during the study period. Vegetation-associated processes strengthen land–atmosphere coupling, but their net contribution to the evaporation–precipitation cycle remains small, at about 0.12 %. Positive effects (1.16 %) are largely offset by negative effects (−0.97 %).
During the same period, the Loess Plateau shows a clear drying tendency. Evapotranspiration increases at 0.31 mm yr−1, while surface water availability decreased at 0.34 mm yr−1. At the regional mean scale, the hydrological contribution of vegetation-associated recycled precipitation is limited. It accounts for only 0.059 % of precipitation and 0.107 % of surface water availability. This weak mean signal is partly explained by two factors. The first is that only the vegetation-associated component of internally recycled precipitation is isolated, which is itself a small fraction of total growing-season precipitation. The second is the partial cancellation between positive and negative vegetation effects. However, the response is not uniform. A threshold-like pattern emerges along the LAIw gradient. Under low-LAIw conditions (LAIw<1), vegetation-associated recycling shows a weak but consistently positive contribution to surface water availability, with a mean contribution of about 0.29 %. Under high-LAIw conditions (LAIw≥2.5), the contribution becomes persistently negative, reaching about −0.15 % on average and becoming more negative over time.
Overall, these results suggest that under the water-limited conditions of the Loess Plateau, stronger vegetation–atmosphere coupling does not necessarily lead to increased surface water availability. Instead, vegetation mainly reshapes the internal partitioning of water fluxes within a constrained land–atmosphere system governed by monsoon–continental transition dynamics. The core contribution of this work lies not in quantifying mean changes in water availability, but in revealing the hydroclimatic conditions under which vegetation effects shift from weakly positive to persistently negative. These findings emphasize that the hydrological consequences of dryland vegetation restoration must be evaluated in the context of climatic constraints, nonlinear feedbacks, and vegetation density-dependent regime shifts, with the caveat that these conclusions are specific to the peak growing season and that seasonal hydroclimatic boundaries should be factored into restoration assessments.
The ERA5 and ERA5-Land reanalysis data used in this study are publicly available from the European Centre for Medium-Range Weather Forecasts (ECMWF) Climate Data Store (https://doi.org/10.24381/cds.bd0915c6, Copernicus Climate Change Service, 2023). The GLEAM v3.6a evapotranspiration data are publicly available from the GLEAM project (Martens et al., 2017). The HiQ-LAI dataset is publicly available via Zenodo (https://doi.org/10.5281/zenodo.8296768, Yan et al., 2023), and the fractional vegetation cover dataset is available from the National Tibetan Plateau Data Center (https://doi.org/10.11888/Terre.tpdc.300330, Gao et al., 2022). The WAM-2layers model used for atmospheric moisture tracking is available from the corresponding published source (Kalverla et al., 2025). The code used for data processing, statistical analysis, and figure generation in this study is available from the corresponding author upon reasonable request.
JD conducted the formal analysis, processed the data, and prepared the original manuscript draft. QQ conceived and designed the study, supervised the research, and revised the manuscript. ST contributed to the methodology, interpretation of the results, and manuscript revision. HY contributed to the methodology and interpretation of the results. XS contributed to data curation and manuscript revision. All authors discussed the results and approved the final manuscript.
The contact author has declared that none of the authors has any competing interests.
Publisher's note: Copernicus Publications remains neutral with regard to jurisdictional claims made in the text, published maps, institutional affiliations, or any other geographical representation in this paper. The authors bear the ultimate responsibility for providing appropriate place names. Views expressed in the text are those of the authors and do not necessarily reflect the views of the publisher.
We thank the ECMWF Climate Data Store, National Tibetan Plateau Data Center and Zenodo for providing the open access datasets used in this study. We are grateful to the anonymous reviewers and the editor for their constructive comments and suggestions, which greatly improved the quality of this manuscript.
The authors acknowledge the financial support from the National Key Research and Development Program of China (grant no. 2024YFF1306901) and the Open Research Fund Program of State Key Laboratory of Water Engineering Ecology and Environment in Arid Area (grant no. 2025KFKT-10).
This paper was edited by Lixin Wang and reviewed by two anonymous referees.
An, Q., Liu, L., Cheng, Y., Liu, J., Staal, A., and Huang, G.: Unraveling the role of moisture recycling in water consumption across different ecosystems in China, J. Hydrol., 662, 134020, https://doi.org/10.1016/j.jhydrol.2025.134020, 2025.
Breiman, L.: Random forests, Mach. Learn., 45, 5–32, https://doi.org/10.1023/A:1010933404324, 2001.
Budyko, M. I.: Climate and Life, Academic Press, New York and London, 1974.
Cao, M., Wang, W., Wei, J., Forzieri, G., Fetzer, I., and Wang-Erlandsson, L.: Revegetation Impacts on Moisture Recycling and Precipitation Trends in the Chinese Loess Plateau, Water Resour. Res., 60, e2024WR038199, https://doi.org/10.1029/2024WR038199, 2024.
Chen, X., Wang, D., Liu, Y., and Yang, S.: Modeling interannual variability of seasonal evaporation and storage change based on the extended Budyko framework, Water Resour. Res., 49, 5070–5083, https://doi.org/10.1002/wrcr.20493, 2013.
Copernicus Climate Change Service (C3S): ERA5 hourly data on pressure levels from 1940 to present, Copernicus Climate Change Service Climate Data Store (CDS) [data set], https://doi.org/10.24381/cds.bd0915c6 (last access: 10 August 2025), 2023.
Cui, J., Lian, X., Huntingford, C., Gimeno, L., Wang, T., Ding, J., He, M., Xu, H., Chen, A., Gentine, P., and Piao, S.: Global water availability boosted by vegetation-driven changes in atmospheric moisture transport, Nat. Geosci., 15, 982–988, https://doi.org/10.1038/s41561-022-01061-7, 2022.
Deng, Y., Wang, S., Bai, X., Luo, G., Wu, L., Chen, F., Wang, J., Li, C., Yang, Y., Hu, Z., Tian, S., and Lu, Q.: Vegetation greening intensified soil drying in some semi-arid and arid areas of the world, Agric. For. Meteorol., 292–293, 108103, https://doi.org/10.1016/j.agrformet.2020.108103, 2020.
Dominguez, F., Hu, H., and Martinez, J. A.: Two-Layer Dynamic Recycling Model (2L-DRM): Learning from Moisture Tracking Models of Different Complexity, J. Hydrometeorol., 21, 3–16, https://doi.org/10.1175/JHM-D-19-0101.1, 2020.
Feng, X., Fu, B., Piao, S., Wang, S., Ciais, P., Zeng, Z., Lü, Y., Zeng, Y., Li, Y., Jiang, X., and Wu, B.: Revegetation in China's Loess Plateau is approaching sustainable water resource limits, Nat. Clim. Change, 6, 1019–1022, https://doi.org/10.1038/nclimate3092, 2016.
Gao, J., Shi, Y., Zhang, H., Chen, X., Zhang, W., Shen, W., Xiao, T., and Zhang, Y.: China regional 250 m fractional vegetation cover data set (2000–2024), National Tibetan Plateau/Third Pole Environment Data Center [data set], https://doi.org/10.11888/Terre.tpdc.300330, 2022.
Giorgi, F., Coppola, E., and Raffaele, F.: A consistent picture of the hydroclimatic response to global warming from multiple indices: Models and observations, J. Geophys. Res.-Atmos., 119, 11695–11708, https://doi.org/10.1002/2014JD022238, 2014.
Greve, P., Schmitt, A. U., Miralles, D. G., McDermid, S., Findell, K. L., García-García, A., and Peng, J.: Observational evidence of increased afternoon rainfall downwind of irrigated areas, Nat. Commun, 16, 3415, https://doi.org/10.1038/s41467-025-58729-y, 2025.
Guo, J., Fan, L., Feng, P., Sun, X., and Xue, S.: Response of vegetation evapotranspiration to landscape pattern changes in an arid region: A case study of the Loess Plateau, China, CATENA, 252, 108878, https://doi.org/10.1016/j.catena.2025.108878, 2025.
He, C., Liu, Z., Wu, J., Pan, X., Fang, Z., Li, J., and Bryan, B. A.: Future global urban water scarcity and potential solutions, Nat. Commun, 12, 4667, https://doi.org/10.1038/s41467-021-25026-3, 2021a.
He, Y., Tian, W., Huang, J., Wang, G., Ren, Y., Yan, H., Yu, H., Guan, X., and Hu, H.: The Mechanism of Increasing Summer Water Vapor Over the Tibetan Plateau, J. Geophys. Res.-Atmos., 126, e2020JD034166, https://doi.org/10.1029/2020JD034166, 2021b.
Hersbach, H., Bell, B., Berrisford, P., Hirahara, S., Horányi, A., Muñoz-Sabater, J., Nicolas, J., Peubey, C., Radu, R., Schepers, D., Simmons, A., Soci, C., Abdalla, S., Abellan, X., Balsamo, G., Bechtold, P., Biavati, G., Bidlot, J., Bonavita, M., De Chiara, G., Dahlgren, P., Dee, D., Diamantakis, M., Dragani, R., Flemming, J., Forbes, R., Fuentes, M., Geer, A., Haimberger, L., Healy, S., Hogan, R. J., Hólm, E., Janisková, M., Keeley, S., Laloyaux, P., Lopez, P., Lupu, C., Radnoti, G., de Rosnay, P., Rozum, I., Vamborg, F., Villaume, S., and Thépaut, J.-N.: The ERA5 global reanalysis, Q. J. Roy. Meteor. Soc., 146, 1999–2049, https://doi.org/10.1002/qj.3803, 2020.
Hu, Q., Jiang, D., Lang, X., and Xu, B.: Moisture sources of the Chinese Loess Plateau during 1979–2009, Palaeogeogr. Palaeocl., 509, 156–163, https://doi.org/10.1016/j.palaeo.2016.12.030, 2018.
Huang, J., Yu, H., Guan, X., Wang, G., and Guo, R.: Accelerated dryland expansion under climate change, Nat. Clim. Change, 6, 166–171, https://doi.org/10.1038/nclimate2837, 2016.
Huang, J., Li, Y., Fu, C., Chen, F., Fu, Q., Dai, A., Shinoda, M., Ma, Z., Guo, W., Li, Z., Zhang, L., Liu, Y., Yu, H., He, Y., Xie, Y., Guan, X., Ji, M., Lin, L., Wang, S., and Wang, G.: Dryland Climate Change: Recent Progress and Challenges: Dryland Climate Change, Rev. Geophys., 55, https://doi.org/10.1002/2016RG000550, 2017.
Jiao, D., Xu, N., Yang, F., and Xu, K.: Evaluation of spatial-temporal variation performance of ERA5 precipitation data in China, Sci. Rep., 11, 17956, https://doi.org/10.1038/s41598-021-97432-y, 2021.
Kalverla, P., Benedict, I., Weijenborg, C., and van der Ent, R. J.: Atmospheric moisture tracking with WAM2layers v3, Geosci. Model Dev., 18, 4335–4352, https://doi.org/10.5194/gmd-18-4335-2025, 2025.
Kummu, M., Guillaume, J. H. A., de Moel, H., Eisner, S., Flörke, M., Porkka, M., Siebert, S., Veldkamp, T. I. E., and Ward, P. J.: The world's road to water scarcity: shortage and stress in the 20th century and pathways towards sustainability, Sci. Rep., 6, 38495, https://doi.org/10.1038/srep38495, 2016.
Lai, J., Li, Y., Chen, J., Niu, G.-Y., Lin, P., Li, Q., Wang, L., Han, J., Luo, Z., and Sun, Y.: Massive crop expansion threatens agriculture and water sustainability in northwestern China, Environ. Res. Lett., 17, 034003, https://doi.org/10.1088/1748-9326/ac46e8, 2022.
Li, C., Fu, B., Wang, S., Stringer, L. C., Wang, Y., Li, Z., Liu, Y., and Zhou, W.: Drivers and impacts of changes in China's drylands, Nat. Rev. Earth Environ., 2, 858–873, https://doi.org/10.1038/s43017-021-00226-z, 2021.
Li, R., Fan, B., Jin, Z., Hao, M., Liu, H., Zhang, Y., Jiang, Y., Yao, H., Lin, K., and Guo, L.: Divergent rainfall infiltration patterns on the Chinese Loess Plateau between growing and non-growing seasons after long-term revegetation, J. Hydrol., 641, 131816, https://doi.org/10.1016/j.jhydrol.2024.131816, 2024.
Li, Z., Wang, S., Li, C., Ye, C., Gao, D., and Chen, P.: The trend shift caused by ecological restoration accelerates the vegetation greening of China's drylands since the 1980s, Environ. Res. Lett., 17, https://doi.org/10.1088/1748-9326/ac6002, 2022.
Liang, W., Bai, D., Wang, F., Fu, B., Yan, J., Wang, S., Yang, Y., Long, D., and Feng, M.: Quantifying the impacts of climate change and ecological restoration on streamflow changes based on a Budyko hydrological model in China's Loess Plateau, Water Resour. Res., 51, 6500–6519, https://doi.org/10.1002/2014WR016589, 2015.
Liu, R., Yang, L., Shi, Z., and Xing, M.: Assessment of the applicability of multi-satellite precipitation products on the Loess Plateau over the past four decades, Int. J. Appl. Earth Obs., 141, 104634, https://doi.org/10.1016/j.jag.2025.104634, 2025a.
Liu, W., Liu, P., Cheng, L., Zhang, X., and Zhou, L.: Identification of time-varying parameters of a monthly Budyko function in US MOPEX catchments and its implications, J. Hydrol.: Reg. Stud., 59, 102348, https://doi.org/10.1016/j.ejrh.2025.102348, 2025b.
Martens, B., Miralles, D. G., Lievens, H., van der Schalie, R., de Jeu, R. A. M., Fernández-Prieto, D., Beck, H. E., Dorigo, W. A., and Verhoest, N. E. C.: GLEAM v3: satellite-based land evaporation and root-zone soil moisture, Geosci. Model Dev., 10, 1903–1925, https://doi.org/10.5194/gmd-10-1903-2017, 2017.
Meier, R., Schwaab, J., Seneviratne, S. I., Sprenger, M., Lewis, E., and Davin, E. L.: Empirical estimate of forestation-induced precipitation changes in Europe, Nat. Geosci., 14, 473–478, https://doi.org/10.1038/s41561-021-00773-6, 2021.
Piao, S., Wang, X., Park, T., Chen, C., Lian, X., He, Y., Bjerke, J. W., Chen, A., Ciais, P., Tømmervik, H., Nemani, R. R., and Myneni, R. B.: Characteristics, drivers and feedbacks of global greening, Nat. Rev. Earth Environ., 1, 14–27, https://doi.org/10.1038/s43017-019-0001-x, 2020.
Sterling, S. M., Ducharne, A., and Polcher, J.: The impact of global land-cover change on the terrestrial water cycle, Nat. Clim. Change, 3, 385–390, https://doi.org/10.1038/nclimate1690, 2013.
Stevenson, S., Coats, S., Touma, D., Cole, J., Lehner, F., Fasullo, J., and Otto-Bliesner, B.: Twenty-first century hydroclimate: A continually changing baseline, with more frequent extremes, P. Natl. Acad. Sci. USA, 119, e2108124119, https://doi.org/10.1073/pnas.2108124119, 2022.
Tabari, H., Hosseinzadehtalaei, P., Thiery, W., and Willems, P.: Amplified Drought and Flood Risk Under Future Socioeconomic and Climatic Change, Earth's Future, 9, e2021EF002295, https://doi.org/10.1029/2021EF002295, 2021.
Te Wierik, S. A., Keune, J., Miralles, D. G., Gupta, J., Artzy-Randrup, Y. A., Gimeno, L., Nieto, R., and Cammeraat, L. H.: The Contribution of Transpiration to Precipitation Over African Watersheds, Water Resour. Res., 58, e2021WR031721, https://doi.org/10.1029/2021WR031721, 2022.
Tian, L., Zhang, B., Chen, S., Wang, X., Ma, X., and Pan, B.: Large-Scale Afforestation Enhances Precipitation by Intensifying the Atmospheric Water Cycle Over the Chinese Loess Plateau, J. Geophys. Res.-Atmos., 127, e2022JD036738, https://doi.org/10.1029/2022JD036738, 2022.
Tian, L., Yang, Y., Feng, J., Li, Y., and Zhang, B.: Energy-mediated feedbacks of vegetation greening enhance precipitation efficiency and sustain water yield in global semi-arid regions, Nat. Water, 4, 559–570, https://doi.org/10.1038/s44221-026-00631-y, 2026.
Tuinenburg, O. A., Bosmans, J. H. C., and Staal, A.: The global potential of forest restoration for drought mitigation, Environ. Res. Lett., 17, 034045, https://doi.org/10.1088/1748-9326/ac55b8, 2022.
van der Ent, R. J., Savenije, H. H. G., Schaefli, B., and Steele-Dunne, S. C.: Origin and fate of atmospheric moisture over continents, Water Resour. Res., 46, https://doi.org/10.1029/2010WR009127, 2010.
van der Ent, R. J., Tuinenburg, O. A., Knoche, H.-R., Kunstmann, H., and Savenije, H. H. G.: Should we use a simple or complex model for moisture recycling and atmospheric moisture tracking?, Hydrol. Earth Syst. Sci., 17, 4869–4884, https://doi.org/10.5194/hess-17-4869-2013, 2013.
van der Ent, R. J., Wang-Erlandsson, L., Keys, P. W., and Savenije, H. H. G.: Contrasting roles of interception and transpiration in the hydrological cycle – Part 2: Moisture recycling, Earth Syst. Dynam., 5, 471–489, https://doi.org/10.5194/esd-5-471-2014, 2014.
Wang, S., Fu, B., Piao, S., Lü, Y., Ciais, P., Feng, X., and Wang, Y.: Reduced sediment transport in the Yellow River due to anthropogenic changes, Nat. Geosci., 9, 38–41, https://doi.org/10.1038/ngeo2602, 2016.
Wang, X., Wang, B., and Xu, X.: Effects of large-scale climate anomalies on trends in seasonal precipitation over the Loess Plateau of China from 1961 to 2016, Ecol. Indic., 107, 105643, https://doi.org/10.1016/j.ecolind.2019.105643, 2019.
Wang, X., Zhang, Z., Zhang, B., Tian, L., Tian, J., Arnault, J., Kunstmann, H., and He, C.: Quantifying the Impact of Land Use and Land Cover Change on Moisture Recycling With Convection-Permitting WRF-Tagging Modeling in the Agro-Pastoral Ecotone of Northern China, J. Geophys. Res.-Atmos., 128, e2022JD038421, https://doi.org/10.1029/2022JD038421, 2023.
Wei, J. and Dirmeyer, P. A.: Sensitivity of land precipitation to surface evapotranspiration: a nonlocal perspective based on water vapor transport, Geophys. Res. Lett., 46, 12588–12597, https://doi.org/10.1029/2019GL085613, 2019.
Woods, R.: The relative roles of climate, soil, vegetation and topography in determining seasonal and long-term catchment dynamics, Adv. Water Resour., 26, 295–309, https://doi.org/10.1016/S0309-1708(02)00164-1, 2003.
Xie, D., Zhang, Y., Zhang, M., Tian, Y., Cao, Y., Mei, Y., Liu, S., and Zhong, D.: Hydrological impacts of vegetation cover change in China through terrestrial moisture recycling, Sci. Total Environ., 915, 170015, https://doi.org/10.1016/j.scitotenv.2024.170015, 2024.
Yan, K., Wang, J., Weiss, M., and Myneni, R. B.: A High-Quality Reprocessed MODIS Leaf Area Index Dataset (HiQ-LAI) (Version 1), Zenodo [data set], https://doi.org/10.5281/zenodo.8296768 (last access: 30 August 2025), 2023.
Yan, K., Wang, J., Peng, R., Yang, K., Chen, X., Yin, G., Dong, J., Weiss, M., Pu, J., and Myneni, R. B.: HiQ-LAI: a high-quality reprocessed MODIS leaf area index dataset with better spatiotemporal consistency from 2000 to 2022, Earth Syst. Sci. Data, 16, 1601–1622, https://doi.org/10.5194/essd-16-1601-2024, 2024.
Yang, D., Shao, W., Yeh, P. J.-F., Yang, H., Kanae, S., and Oki, T.: Impact of vegetation coverage on regional water balance in the nonhumid regions of China, Water Resour. Res., 45, https://doi.org/10.1029/2008WR006948, 2009.
Yang, X., Yong, B., Ren, L., Zhang, Y., and Long, D.: Multi-scale validation of GLEAM evapotranspiration products over China via ChinaFLUX ET measurements, Int. J. Remote Sens., 38, 5688–5709, https://doi.org/10.1080/01431161.2017.1346400, 2017.
Yang, Y., Donohue, R. J., McVicar, T. R., and Roderick, M. L.: An analytical model for relating global terrestrial carbon assimilation with climate and surface conditions using a rate limitation framework, Geophys. Res. Lett., 42, 9825–9835, https://doi.org/10.1002/2015GL066835, 2015.
Yang, Z., Dong, Q., Zhang, X., Fang, L., Zhu, X., Chen, K., and Mendiondo, E. M.: Interpretable Budyko-constrained machine learning framework for monthly runoff attribution in U.S. CAMELS basins, J. Hydrol., 670, 135209, https://doi.org/10.1016/j.jhydrol.2026.135209, 2026.
Yokoo, Y., Sivapalan, M., and Oki, T.: Investigating the roles of climate seasonality and landscape characteristics on mean annual and monthly water balances, J. Hydrol., 357, 255–269, https://doi.org/10.1016/j.jhydrol.2008.05.010, 2008.
Yosef, G., Walko, R., Avisar, R., Tatarinov, F., Rotenberg, E., and Yakir, D.: Large-scale semi-arid afforestation can enhance precipitation and carbon sequestration potential, Sci. Rep., 8, 996, https://doi.org/10.1038/s41598-018-19265-6, 2018.
Zemp, D. C., Schleussner, C.-F., Barbosa, H. M. J., van der Ent, R. J., Donges, J. F., Heinke, J., Sampaio, G., and Rammig, A.: On the importance of cascading moisture recycling in South America, Atmos. Chem. Phys., 14, 13337–13359, https://doi.org/10.5194/acp-14-13337-2014, 2014.
Zhang, B.: Albedo-driven hydroclimatic impacts of large-scale vegetation restoration should not be overlooked, Nat. Water, 3, 358–359, https://doi.org/10.1038/s44221-025-00422-x, 2025.
Zhang, B., Tian, L., Yang, Y., and He, X.: Revegetation Does Not Decrease Water Yield in the Loess Plateau of China, Geophys. Res. Lett., 49, e2022GL098025, https://doi.org/10.1029/2022GL098025, 2022a.
Zhang, J., Wang, S., He, Y., Ren, Y., and Huang, J.: Contribution of the Precipitation-Recycling Process to the Wetting Trend in Xinjiang, China, J. Geophys. Res.-Atmos., 127, e2021JD036407, https://doi.org/10.1029/2021JD036407, 2022b.
Zhang, S., Yang, D., Yang, Y., Piao, S., Yang, H., Lei, H., and Fu, B.-J.: Excessive Afforestation and Soil Drying on China's Loess Plateau, J. Geophys. Res.-Biogeo., 123, https://doi.org/10.1002/2017JG004038, 2018.
Zhang, Y., Li, C., Chiew, F. H. S., Post, D. A., Zhang, X., Ma, N., Tian, J., Kong, D., Leung, L. R., Yu, Q., Shi, J., and Liu, C.: Southern Hemisphere dominates recent decline in global water availability, Science, 382, 579–584, https://doi.org/10.1126/science.adh0716, 2023.
Zhang, Y., Zhao, X., Gong, J., Luo, F., and Pan, Y.: Effectiveness and driving mechanism of ecological restoration efforts in China from 2009 to 2019, Sci. Total Environ., 910, 168676, https://doi.org/10.1016/j.scitotenv.2023.168676, 2024.