
the Creative Commons Attribution 4.0 License.
the Creative Commons Attribution 4.0 License.
 | 10 Aug 2026
Declining Sensitivity and Increasing Resistance Time of Ecosystem Water Use Efficiency to Meteorological Drought
Zijun Wang
Rong Wu
Yangyang Liu
Zhaoying Zhang
Zhongming Wen
Zhenqian Wang
Stephen Sitch
Wenping Yuan
Drought is a dominant factor influencing terrestrial ecosystem water-use efficiency (WUE). However, the coupling relationship between WUE and drought remains insufficiently understood. Currently, the coupling relationship is primarily assessed using correlation coefficients or linear regression slopes. However, the optimal drought timescale at which WUE responds to drought has largely been overlooked. Therefore, this study investigated the spatiotemporal patterns of the WUE – meteorological drought coupling relationship across global terrestrial ecosystems from 1982 to 2018 with satellite- derived and model-simulated WUE, together with the Standardized Precipitation-Evapotranspiration Index (SPEI), and explored the potential causal mechanisms. Within the framework of WUE-SPEI coupling, the maximum correlation coefficient between WUE and SPEI represents the sensitivity of WUE to meteorological drought (Rmax), whereas the corresponding optimal drought timescale represents its resistance time (Topt). The results indicated that the sensitivity of WUE to meteorological drought decreased at a rate of −0.0003 yr−1 (p< 0.01), while the resistance time increased at a rate of 0.0155 month yr−1 (p< 0.01), indicating a weakening of the coupling between WUE and meteorological drought. Attribution analysis indicated that CO2 fertilization was the primary factor contributing to the weakening of the coupling relationship. Surface soil moisture was the most critical hydrometeorological driver, exhibiting nearly opposite effects and significant threshold effects on Rmax and Topt. Peter & Clark Momentary Conditional Independence (PCMCI+) algorithm was further employed to construct a causality diagnosis framework for identifying the relationships between WUE-drought coupling and temperature, precipitation, radiation, wind speed, vapor pressure deficit, and surface and root-zone soil moisture. The results showed that the decrease in the Rmax had direct negative causal effects on precipitation, temperature, and radiation. In contrast, the increase in the Topt was primarily driven by a negative causal effect of radiation. This study highlights the weakened coupling between WUE and meteorological drought, suggesting that vegetation's carbon-water trade-off is evolving toward drought adaptation, which is crucial for understanding the adaptive strategies of vegetation in response to climate change.
- Article
(10431 KB) - Full-text XML
-
Supplement
(7360 KB) - BibTeX
- EndNote


Ecosystem water use efficiency (WUE) is defined as the ratio of carbon assimilation to ecosystem water evapotranspiration (Beer et al., 2009). High WUE indicates that an ecosystem can more effectively carry out photosynthesis and growth under limited water resources (Wang et al., 2022). Therefore, the WUE is widely used to characterize the trade-off between carbon uptake and water loss within ecosystems (Xue et al., 2022). Meteorological drought, as characterized by the Standardized Precipitation Evapotranspiration Index (SPEI), is one of the most common and destructive natural hazards (Li et al., 2026). The SPEI combines sensitivity to atmospheric evaporative demand, as captured by the Palmer Drought Severity Index (PDSI), with the multi-scalar characteristics of the Standardized Precipitation Index (SPI) (Vicente-Serrano et al., 2010). Therefore, the SPEI is widely regarded as an effective index for capturing the impacts of drought on terrestrial ecosystem carbon-water cycles (Vicente-Serrano et al., 2012, 2013). Against the backdrop of global climate change, the frequency, duration, and intensity of meteorological drought are projected to continue increasing in the future (Mokhtar et al., 2021; Trenberth et al., 2014; Chen et al., 2023), which will have increasingly profound effects on terrestrial ecosystems. Therefore, understanding the impacts of meteorological drought on terrestrial carbon-water dynamics is of great significance for ecosystem sustainability (Wang et al., 2026a).
Previous studies have shown that WUE responses to drought exhibit significant spatiotemporal heterogeneity. Across aridity gradients, WUE exhibits a negative response to drought in arid ecosystems, whereas it shows a positive response in humid ecosystems (Huang et al., 2017). From a temporal perspective of drought development, WUE decreases during summer droughts but increases during autumn droughts (Ma et al., 2019). Furthermore, WUE demonstrates a two-phase relationship with drought intensity: increasing under moderate drought but declining under severe drought (Lu and Zhuang, 2010). The timing of drought occurrence also plays a crucial role in regulating both the direction and magnitude of WUE responses, as ecosystem physiological and physical processes exhibit varying sensitivities to water stress across different growth stages (Huang et al., 2021; Wang et al., 2021).
However, these studies remain limited, as they have largely been conducted at specific or fixed drought timescales, thereby neglecting the cumulative and lagged effects of drought on vegetation dynamics. In fact, plants can uptake water stored from past precipitation in deeper unsaturated soil layers or groundwater to maintain carbon–water balance (Zhang et al., 2026). In other words, drought not only impacts vegetation growth synchronously but also exhibits lagged and cumulative effects, where past drought conditions influence current vegetation growth (Huang et al., 2018; Kannenberg et al., 2020). Vicente-Serrano et al. (2013) emphasized that vegetation responses to drought are inherently multi-timescale in nature. Longer timescales imply stronger memory effects, which may buffer the impacts of recent drought events and thereby reduce vegetation drought sensitivity (Seddon et al., 2016). In contrast, shorter timescales indicate more rapid vegetation responses to moisture deficits, reflecting higher drought sensitivity (Jiao et al., 2021). Therefore, neglecting the role of timescales in assessing WUE-drought coupling may hinder our understanding of how WUE responds to drought. Although increasing attention has been paid to the optimal timescale of ecosystem responses to drought (Guo et al., 2026; Yuan et al., 2024; Xing et al., 2026), most existing studies identify a single fixed optimal drought timescale over the entire study period, thereby primarily revealing its spatial distribution patterns. For example, Yuan et al. (2024) used Spearman correlation analysis to reveal the lagged and legacy effects of meteorological drought on the Normalized Difference Vegetation Index (NDVI) in northern China during 1982–2022. However, the optimal drought timescale is not static; under climate change, its temporal evolution can indirectly indicate changes in ecosystem resistance and sensitivity to drought. Thus, it remains unclear whether the response duration of WUE to drought has lengthened or shortened, whether such temporal changes indicate a weakening or strengthening of WUE-drought coupling, and which environmental or physiological factors dominate these changes. Therefore, incorporating time-varying optimal drought timescales into analyses of WUE-drought coupling is essential for a more comprehensive and accurate understanding of vegetation carbon-water trade-offs under drought stress.
Therefore, we calculated the coupling relationship between WUE and SPEI across time scales ranging from 1 to 24 months, including the maximum correlation coefficient (Rmax) and optimal drought timescale (Topt). Specifically, the Rmax represents the sensitivity of WUE to meteorological drought, whereas the Topt represents its resistance time. Subsequently, we utilized Dynamic Global Vegetation Models from TRENDY project to quantify the contributions of CO2, climate change (CLI), and land-use change (LCC) to this coupling relationship. To further explore the impact of climate change, we employed the eXtreme Gradient Boosting (XGBoost) algorithm combined with SHapley Additive Explanations (SHAP) to identify both the relative importance and modes of influence of key hydrothermal factors in shaping the coupling relationship between WUE and drought. Finally, we employed Peter-Clark Momentary Conditional Independence Plus (PCMCI+) to uncover the complex causal network between hydrothermal factors, Rmax, and Topt. These findings are expected to enhance our understanding of the vulnerability of terrestrial ecosystems to drought and provides valuable insights for supporting ecosystem sustainability under climate change.
2.1 GPP and ET data
Three widely used GPP datasets were employed in this study: FLUXCOM GPP, GLASS GPP, and NIRv GPP. FLUXCOM GPP, which is derived from a machine learning-based integration of eddy covariance measurements and remote sensing data, offers global coverage with monthly temporal resolution and a spatial resolution of 0.5°. The GLASS GPP product, generated using a light use efficiency model in conjunction with AVHRR reflectance data, provides 8 d composite estimates with a spatial resolution of 0.5° from 1982–2018. To aggregate the 8 d time-scale GPP data into monthly values, the maximum value method was utilized. NIRv GPP, a recently developed satellite-derived index based on near-infrared reflectance of vegetation, features a monthly temporal resolution and a 0.05° spatial resolution, and exhibits a strong correlation with tower-based GPP measurements. These datasets collectively represent distinct methodological approaches to quantifying terrestrial carbon uptake while maintaining complementary spatiotemporal characteristics suitable for cross-comparison analysis.
Three widely used ET datasets were analyzed in this study: ERA5 ET, GLASS ET, and GLEAM ET. ERA5 ET, produced by the European Centre for Medium-Range Weather Forecasts through atmospheric reanalysis modeling, provides monthly temporal resolution at a 0.25° spatial grid, incorporating land-atmosphere interaction processes. The AVHRR-based GLASS ET data employs the Bayesian Model Averaging method, which merges five process-based ET algorithms to improve ET estimation. It provides ET data spanning from 1981 to 2022 with an 8 d temporal resolution and a 0.5° spatial resolution. In GLEAM, multiplicative evaporative stress factors are applied to convert the estimated potential evapotranspiration values of three land components – bare soil, high-canopy, and short-canopy – into bare soil evaporation (Eb) and transpiration (Et). Interception loss (Ei) is calculated separately using an analytical model driven by precipitation and vegetation characteristics. The actual evapotranspiration is estimated as the sum of these three components. GLEAM ET provides data with a monthly temporal resolution and a 0.25° spatial resolution. These datasets collectively represent diverse retrieval approaches (reanalysis, hybrid model, and observation-driven algorithm) while maintaining spatially and temporally complementary resolutions, enabling robust intercomparison of terrestrial water flux patterns across multiple scales.
2.2 FLUXNET data
To validate the reliability of WUE data observed from multi-source satellite products, this study collected flux data from FLUXNET 2015 (https://fluxnet.org/, last access: 14 January 2025). To ensure the long-term reliability of WUE observations, we selected sites with continuous observation records of more than 5 years and with complete and valid records were selected. Based on this criterion, 85 flux stations were ultimately selected for analysis at the monthly scale (Fig. S1, Table S1 in the Supplement). Among these sites, only high-quality gap-filled data (QC > 0.8) were retained (Guan et al., 2025). Additionally, to ensure the accuracy of ET estimates, the energy balance closure criterion was applied: when the energy imbalance (net radiation minus the sum of latent heat flux, sensible heat flux, and soil heat flux) exceeded 50 % of the available energy, the latent heat flux (LE) was treated as missing (Knauer et al., 2018). GPP was estimated using the nighttime respiration allocation method (“GPP_NT_VUT_REF”) to ensure consistency across sites.
2.3 TRENDY v12 multi-model simulated GPP and ET data
The latest version TRENDY v12 (Trends in Net Land-Atmosphere Carbon Exchange) is a collaborative initiative that integrates multiple Dynamic Global Vegetation Models (DGVMs) (are available on request to Stephen Sitch (s.a.sitch@exeter.ac.uk) and Pierre Friedlingstein (p.friedlingstein@exeter.ac.uk)), aimed at quantifying global carbon budgets using forcing data on carbon dioxide concentrations, climate variables, and land use changes (Friedlingstein et al., 2023). All models utilize the same forcing data, with historical climate fields derived from the CRUv.4.07 and CRU-JRA55 datasets, and global atmospheric CO2 concentrations obtained from a combination of ice core records and atmospheric observations. Each DGVM model runs four simulation scenarios: S0 (no changes in CO2, climate, or land cover), S1 (changes in CO2, static climate conditions, and static land use), S2 (changes in CO2 and climate conditions, static land use), and S3 (changes in CO2, climate conditions, and land use).
2.4 SPEI data
The SPEI is commonly used to assess climate drought conditions. By incorporating regional precipitation, potential evapotranspiration, and temperature, the SPEI quantifies the hydrological balance over a specific period and provides an objective method for comparing drought severity across different regions and time periods. It is of considerable importance for monitoring and predicting the impact of climate change on water resources and ecosystems. To ensure consistency with the climate data version used in the TRENDY model (CRU TS 4.07), we selected the SPEI version 2.9 dataset, which is derived from CRU TS 4.07 (https://spei.csic.es/spei_database, last access: 15 January 2025). This dataset has a spatial resolution of 0.5° × 0.5° and covers timescales ranging from 1 to 24 months (Beguería et al., 2014).
2.5 Hydrometeorological factors data
Since CRU climate data (CRUts4.07 and CRU-JRA55) is widely used as climate forcing in DGVMs, we adopt the same climate factor data in this study to ensure consistency with these models. Specifically, we collected monthly mean temperature (Temp), precipitation (Pre), and actual vapor pressure data (Vap) from the CRUts4.07 climate product, as well as downward shortwave radiation (Rad) and wind speed (WS) data from the CRU Japanese Reanalysis (CRU JAR) (https://crudata.uea.ac.uk/, last access: 15 January 2025). Soil moisture data for the surface layer (0–10 cm, SMsurf) and root zone (10–100 cm, SMroot) were obtained from the Global Land Evaporation Amsterdam Model (GLEAM) (https://www.gleam.eu/, last access: 3 October 2024). Additionally, the vapor pressure deficit (VPD) was calculated based on monthly average temperature and actual vapor pressure using the following equation (Wang et al., 2025):
Where, Ew represents the saturated vapor pressure. and Vap represents the actual vapor pressure. The constants used are as follows: , , , , C5=0.78614, , . Additionally, T1=273.16 K (the triple point temperature of water), and T= 276.15 +t (K), where t is the air temperature in Celsius.
2.6 Land use types data
This study utilizes the annual HLDA+ Global Land Use Change dataset (https://doi.org/10.1594/PANGAEA.921846, Winkler et al., 2020), which includes six general land use/cover categories: urban areas, croplands, pastures/rangelands, Forest, unmanaged grasslands/shrublands, and sparse/bare soils. We excluded pixels with land use types of “urban areas” and “sparse/bare soils” to define permanent vegetation areas (Winkler et al., 2021), and all subsequent studies were conducted within these permanent vegetation areas (Fig. S4).
2.7 Aridity index data
Using the third edition of the Global Aridity Index and Potential Evapotranspiration dataset (Global-AI-PET-v3, https://doi.org/10.6084/m9.figshare.7504448.v5), the globe is classified into four aridity gradients based on the following thresholds: AI < 0.2 as arid (AR), 0.2 ≤ AI < 0.5 as semi-arid (SAR), 0.5 ≤ AI < 0.65 as dry sub-humid (DSH), and AI > 0.65 as humid (HU) (Fig. S3).
2.8 Pre-processing
All datasets were resampled to a spatial resolution of 0.25° using bilinear interpolation (Li et al., 2022b). Moreover, seasonal cycles and long-term trends in WUE and SPEI data may lead to spurious correlations (Boulton et al., 2022). Therefore, it is essential to perform deseasonalization and detrending on WUE and SPEI prior to subsequent calculations (Smith and Boers, 2023). This study employed the Seasonal and Trend decomposition using Loess (STL) method to decompose WUE and SPEI time series of each grid cell into the overall trend, seasonal component, and residual component, as implemented using the stl() function in the “stats” package in R (v4.2.1). The STL residual component, which represents the deseasonalized and detrended WUE and SPEI time series, were utilized for further analysis (Wang et al., 2023).
3.1 Definition of WUE
The grid-scale ecosystem WUE was calculated as the ratio of GPP to ET according to Eq. (3):
Where, the unit of WUE is g C m−2 month−1, the unit of GPP is g C m−2 month−1, and the unit of ET is mm−1 month−1. In this study, based on these three independent sets of GPP products and three sets of ET products, we first computed WUE for each GPP-ET product combination. Then, we integrated the results of the nine WUE combinations using an arithmetic mean, ultimately generating a multi-product averaged WUE. This approach effectively reduces the impact of systematic errors from individual products, thereby enhancing the robustness of the estimated results (Wu et al., 2025).
Representative long-term scale sites from different land use types were selected to validate the satellite products. In the calculation of site-scale ecosystem WUE, GPP can be directly obtained, while ET is computed using Eq. (4):
where ET represents actual evapotranspiration (mm month−1), LE (W m−2) represents latent heat flux, and T (°C) is the air temperature. The validation results indicated a high correlation between satellite-based WUE and the flux-based WUE (R= 0.62, Fig. S2), implying that satellite-based WUE results were highly reliable.
3.2 Calculation of coupling relationship between WUE and drought
The coupling relationship was defined as the maximum correlation coefficient (Rmax) and optimal lag time (Topt) between WUE and SPEI. In general, WUE decreases with increasing drought severity, whereas it tends to be higher under mild or non-drought conditions (Li et al., 2025), indicating an overall positive correlation between WUE and SPEI. Accordingly, Rmax was defined as the maximum (non-absolute) correlation coefficient between SPEI at different time scales and WUE, representing the maximum sensitivity of WUE to SPEI (Vicente-Serrano et al., 2013). SPEI typically exhibits a lagged effect on WUE, whereby past drought conditions influence current WUE (Huang et al., 2018; Kannenberg et al., 2020). Therefore, Topt was defined as the SPEI time scale corresponding to Rmax, representing the resistance time of WUE to SPEI (Li et al., 2024).
3.3 Trend analysis
An 18-year moving window was employed to investigate the temporal variations in Rmax and Topt over the past four decades. Then, we utilized a combination of Theil-Sen slope estimation and the Mann-Kendall (MK) test to identify and analyze trends in long-term time series data. The Theil-Sen method was applied to calculate robust linear trends, with p-values that remain resilient to the influence of outliers (Gocic and Trajkovic, 2013). At the same time, the non-parametric MK test was employed to assess the significance of monotonic trends by evaluating their slope values (Ma et al., 2020). To ensure the robustness of the identified temporal trends, we further examined the trends of Rmax and Topt using 16-year and 20-year moving windows.
3.4 Attribution analysis and causality diagnosis of WUE-drought coupling relationship
We compared the coupling relationships derived from the simulation results of all DGVMs under the S3 scenario with those calculated from remote sensing observations, and ultimately retained only the seven models that were consistent with the remote sensing results: E3SM, EDv3, JSBACH, JULES, LPJ-GUESS, SDGVM, and VISIT (Zeng et al., 2022). We not only computed WUE for each individual model but also calculated the multi-model mean WUE under the S1, S2, and S3 scenarios (Fig. S6). Furthermore, we derived Rmax and Topt to examine the relationship between WUE and SPEI. Considering that the coupling relationship under the S1 scenario can only represent the effects of CO2 changes, we also computed the coupling relationships for the (S2–S1) and (S3–S2) scenarios to quantify the contributions of CLI and LCC to the changes in Rmax and Topt.
Machine learning models are capable of effectively capturing the nonlinear relationships between multidimensional predictors and target variables (Yan et al., 2025b). With the advancement of interpretability techniques such as SHapley Additive Explanations (SHAP), machine learning has gradually evolved from a black-box paradigm into an explainable artificial intelligence framework. In this study, “threshold effects” refer to nonlinear transition points at which the marginal contribution of a driving factor to Rmax or Topt changes markedly. Specifically, a threshold was interpreted as the point where the SHAP value showed a transition between positive and negative contributions (Chen et al., 2026). To avoid overinterpreting unstable patterns, only thresholds that appeared within the main distribution range of the predictor and showed consistent response patterns were discussed. Therefore, to complement our understanding of CLI, this study selected a series of hydrometeorological factors – including VPD, SMsurf, SMroot, Temp, Pre, WS, and Rad – and employed the XGBoost algorithm to quantify their respective influences on Rmax and Topt (Piao et al., 2020). To increase the sample size, all time-series data from each grid cell were extracted. The dataset was divided into training and test subsets at a ratio of 80:20. Bayesian optimization combined with five-fold cross-validation was used for hyperparameter tuning. For the Rmax model, the learning rate was set to 0.06, the number of trees to 1431, and the maximum depth to 4. For the Topt model, the learning rate was set to 0.07, the number of trees to 1287, and the maximum depth to 4. The model performance was evaluated using the mean coefficient of determination (R2) and root mean square error (RMSE) obtained through five-fold cross-validation (Fig. S19).
This study further employed the improved Peter-Clark Momentary Conditional Independence plus algorithm (PCMCI+) (Runge et al., 2019; Runge, 2020) to investigate the causal mechanisms between Rmax and Topt, and hydrometeorological factors. These factors included VPD, SMsurf, SMroot, Temp, Pre, WS, and Rad. The time series of all variables were detrended and converted into anomalies to satisfy the stationarity requirements of time-series analysis. The causal diagnostic analysis was then implemented using the PCMCI+ algorithm in the Python package Tigramite (https://github.com/jakobrunge/tigramite, last access: 20 April 2025). PCMCI+ iteratively identifies directed causal associations among variables through conditional independence tests. To reduce uncertainty in causal inference, we constrained the network to physically plausible associations consistent with established mechanisms. Instead of the conventional ParCorr method, a Gaussian process-based nonlinear conditional independence test (GPDC) was applied, and p-values were computed through permutation testing (500 bootstrap iterations), with significance determined using an FDR-corrected threshold of p< 0.05. Compared with structural equation modeling, PCMCI+ does not require a prespecified model and can automatically infer causal structures from time-series data (Poppe Terán et al., 2023). A detailed methodological description of the PCMCI+ algorithm is provided by Runge (2020).
4.1 Spatiotemporal Characteristics of Rmax and Topt
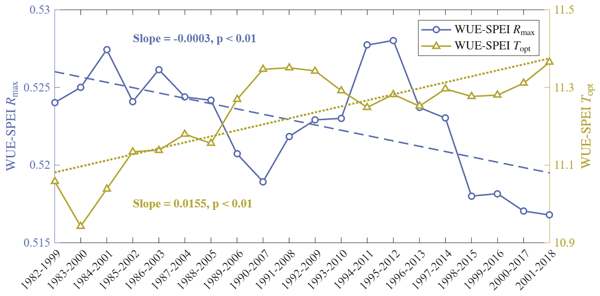
Based on remote sensing observations and the TRENDY multi-model ensemble, we computed the Rmax and Topt trends between ecosystem WUE and drought (Fig. 1). The results indicated that the Rmax derived from both datasets declined significantly at a rate of −0.0003 yr−1 (p< 0.01). Furthermore, the Topt calculated from remote sensing observations and the TRENDY multi-model ensemble increased at rates of 0.0155 month yr−1 and 0.0222 month yr−1 (p< 0.01), respectively. Notably, the Rmax derived from the TRENDY multi-model ensemble were approximately 0.02 lower than those from remote sensing observations, whereas the Topt were about 0.5 months higher; however, both datasets exhibited nearly identical temporal trends.
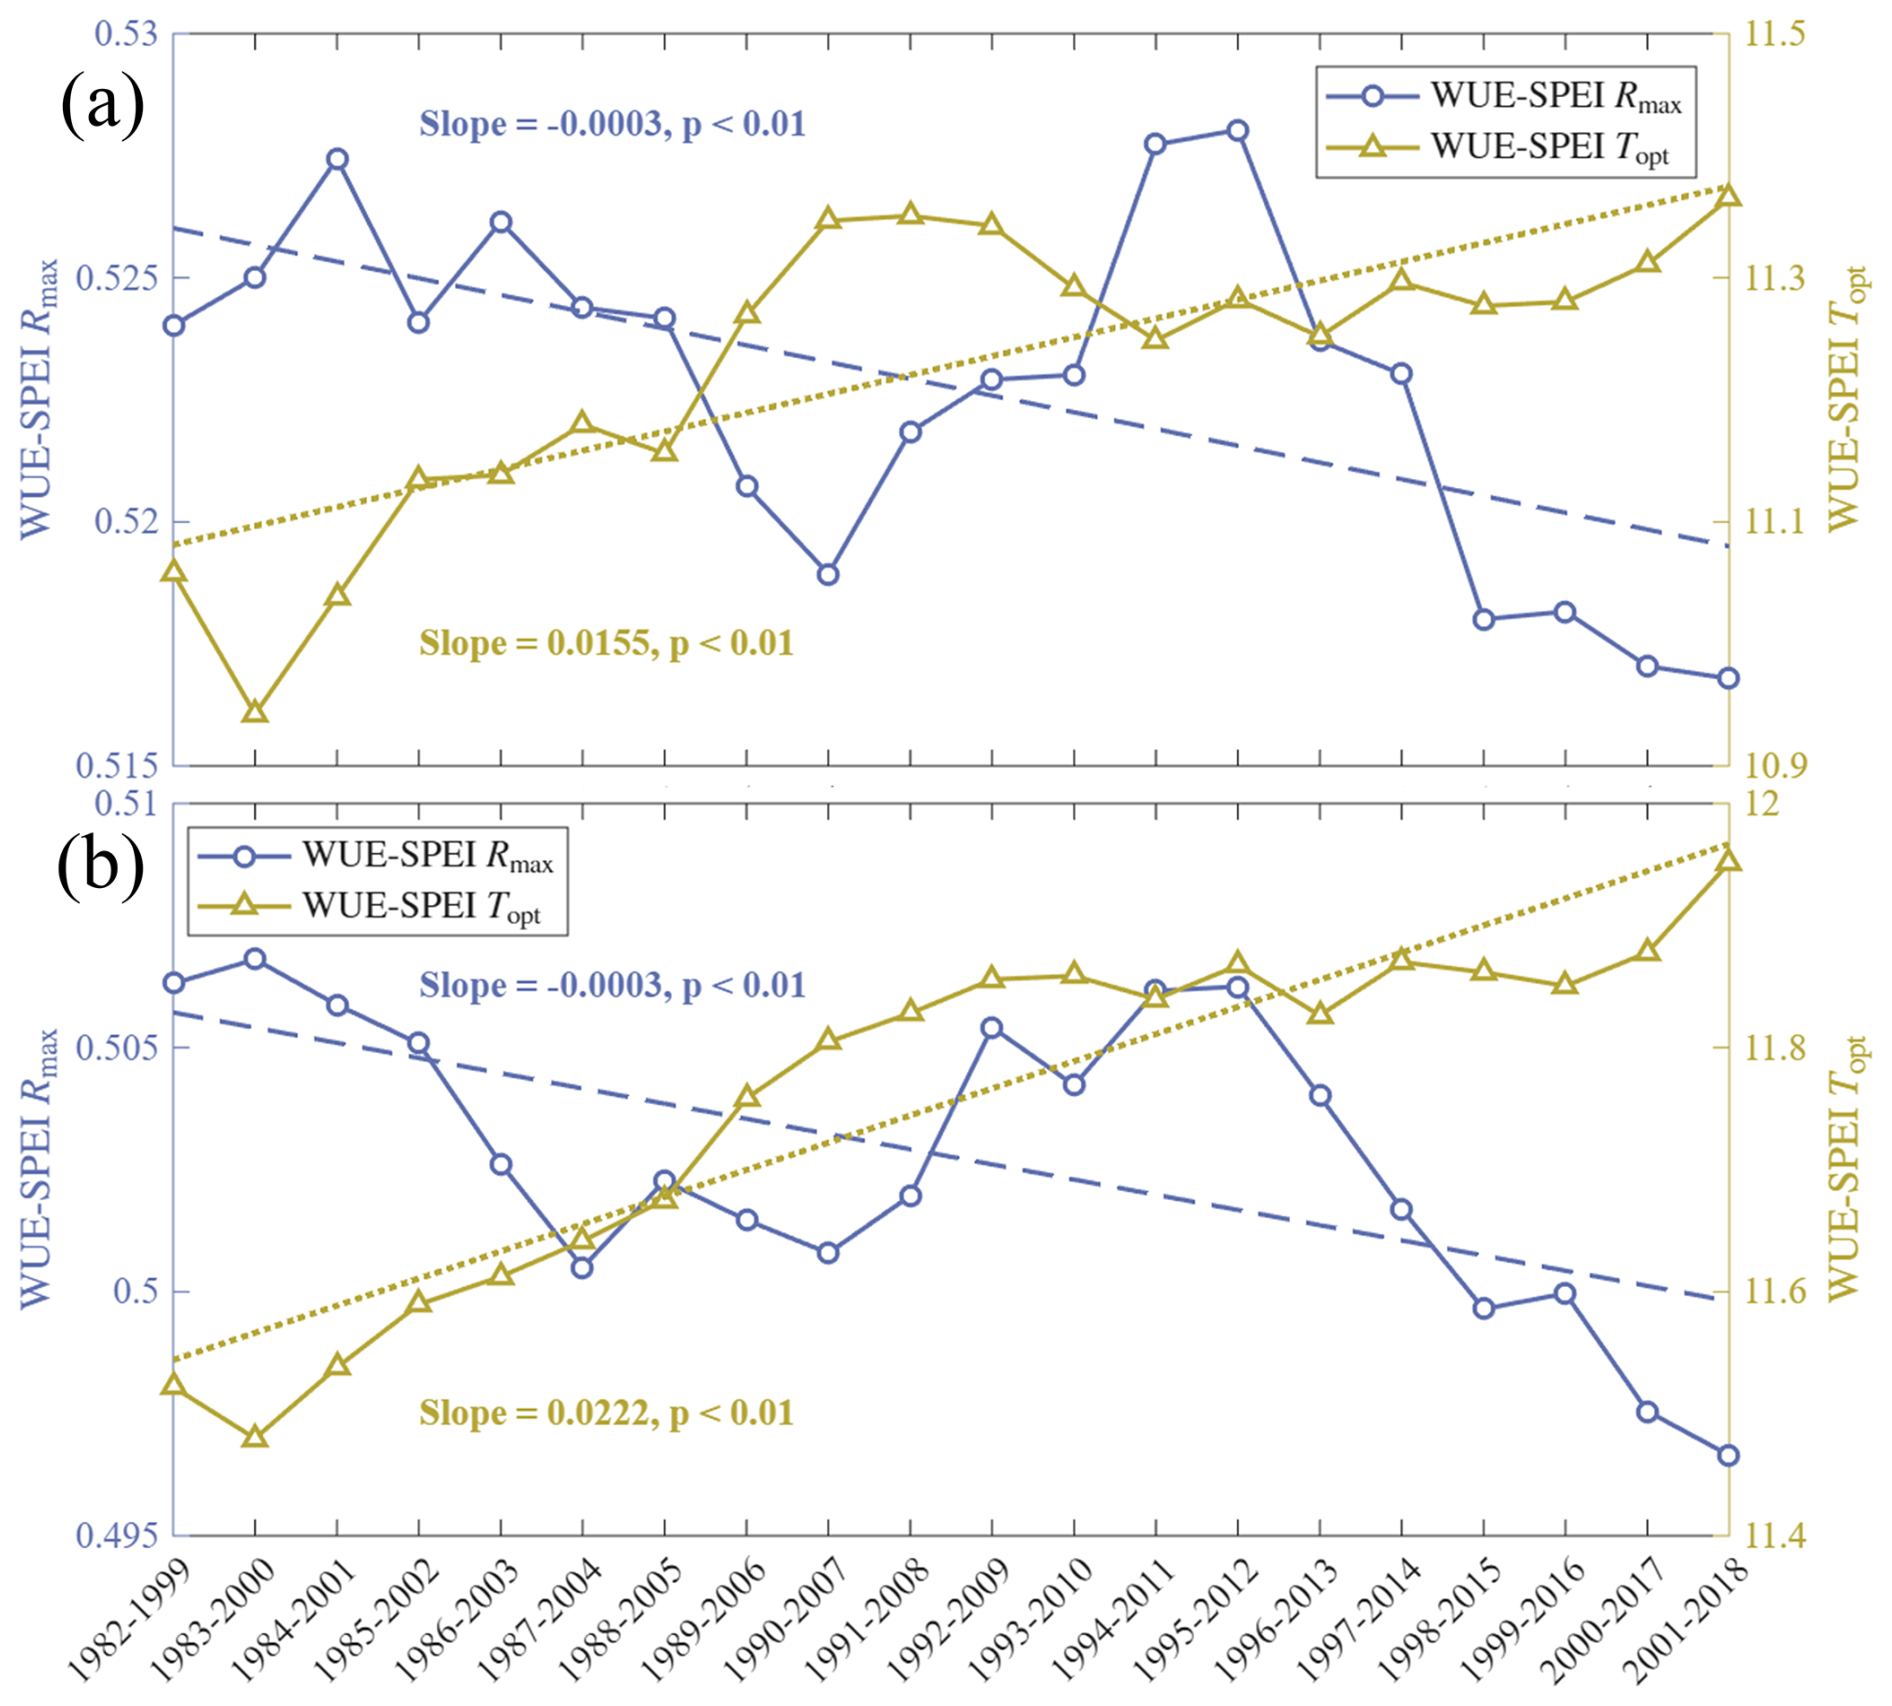
Figure 1Temporal trends of the Rmax and Topt between global WUE and SPEI calculated from (a) the remote sensing observations and (b) the TRENDY multi-model ensemble using an 18-year moving window.
The spatial patterns of the multi-year mean values and trends of Rmax and Topt were generally consistent, although the Rmax derived from the TRENDY multi-model ensemble was smaller and the Topt was larger than those obtained from remote sensing observations (Fig. 2). It was also noteworthy that the absolute values of the Rmax and Topt trends estimated from remote sensing observations were slightly larger than those derived from the TRENDY multi-model ensemble. Specifically, in the high-latitude regions of the Northern Hemisphere, the Rmax generally showed a decreasing trend, with the exception of the western Siberia, and central North America. Notably, the decrease was most pronounced in the central Siberian. In contrast, the Southern Hemisphere exhibited more regions where the Rmax have increased, particularly in areas such as the central-northern Africa, southern Africa, northern Australia, and the Amazon Basin, where the increasing rate was notably high. The Topt exhibited an opposite trend to the Rmax, showing a clear increase between 30 and 60° N, while the remaining regions primarily exhibited a decreasing trend.
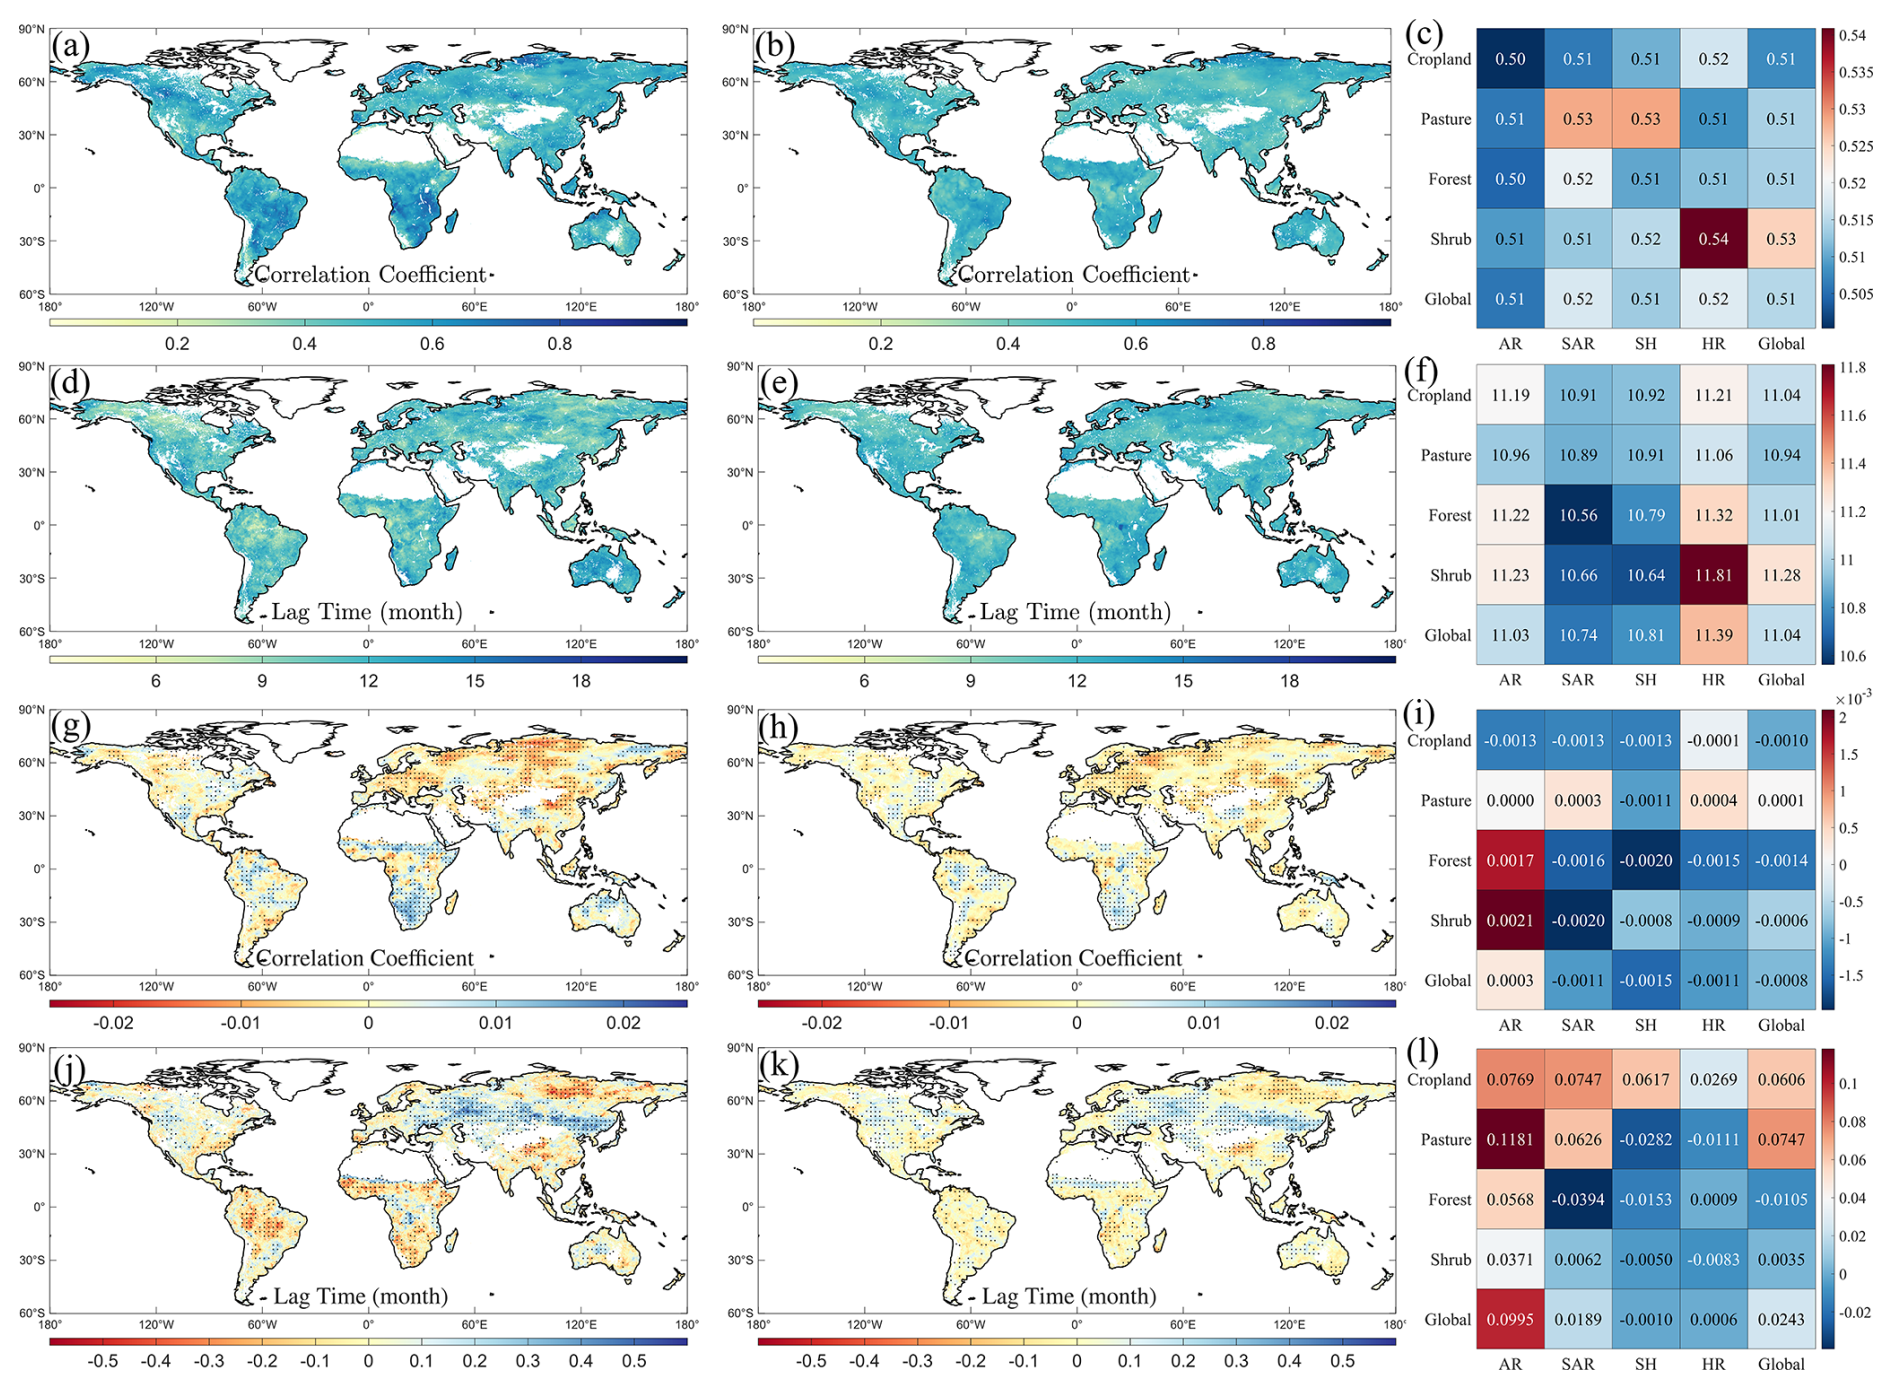
Figure 2Spatial distribution of the mean and change rates of Rmax and Topt calculated from the remote sensing observations and the TRENDY multi-model ensemble using an 18-year moving window. From left to right, the three columns represent remote sensing observations, the TRENDY multi-model ensemble and statistics across different vegetation types and aridity gradients. Points indicate statistically significant trends (p< 0.01).
From the perspectives of vegetation type and drought gradient, the mean values of Rmax and Topt showed relatively small differences, whereas their trends exhibited pronounced heterogeneity across these two dimensions (Fig. 2c). Specifically, the mean Rmax varied little across aridity gradients but differed among vegetation types, with Shrub showing higher mean values than other vegetation types, particularly Shrub in HR, which reached 0.54. The mean characteristics of Topt were consistent with those of Rmax, with the highest mean Topt observed in HR across aridity gradients and among shrubs across vegetation types. In terms of the rate of change, Rmax showed an overall decreasing trend globally but increased in AR, with the highest growth rates observed in Forest and Shrub, at 0.0017 and 0.0021 yr−1, respectively. Across vegetation types, Rmax also tended to increase in Pasture. In contrast, the rate of change in Topt showed marked regional differences across aridity gradients, with higher increasing rates in AR, reaching up to 0.1181 month yr−1 in Pasture, while SH showed a decreasing trend at −0.0010 month yr−1. Across vegetation types, Topt increased more rapidly in Cropland and Pasture, whereas Forest displayed a decreasing trend, with the largest decline occurring in Forest within SAR at −0.0394 month yr−1.
4.2 Separation of the Driving Factors of the changes in Rmax and Topt
Since the spatial distributions simulated by individual DGVM exhibited certain deviations (Figs. S9–S11), this study adopted TRENDY multi-model ensemble to separate the effects of CO2 fertilization, CLI, and LCC on Rmax and Topt. The results from the TRENDY multi-model ensemble indicated that the negative effect of CO2 on the Rmax and the positive effect on Topt were primarily concentrated in the high-latitude regions of the Northern Hemisphere. However, the opposite contributions were observed in the central-southern North America, central and eastern Siberia, as well as southern Central Asia and the Tibetan Plateau. In the Southern Hemisphere, CO2 exerted a predominantly positive effect on the Rmax and a negative effect on Topt, revealing an overall opposite spatial pattern. In comparison to CO2, the contributions of CLI and LCC were relatively smaller. The negative contribution of CLI to the Rmax was mainly distributed in the southern Europe, western Siberia, and the Amazon Basin, while the negative contribution of LCC was primarily concentrated in the eastern Europe and central-northern Africa. Both factors showed an overall opposite spatial distribution pattern for their contributions to Topt relative to the Rmax (Fig. 3).
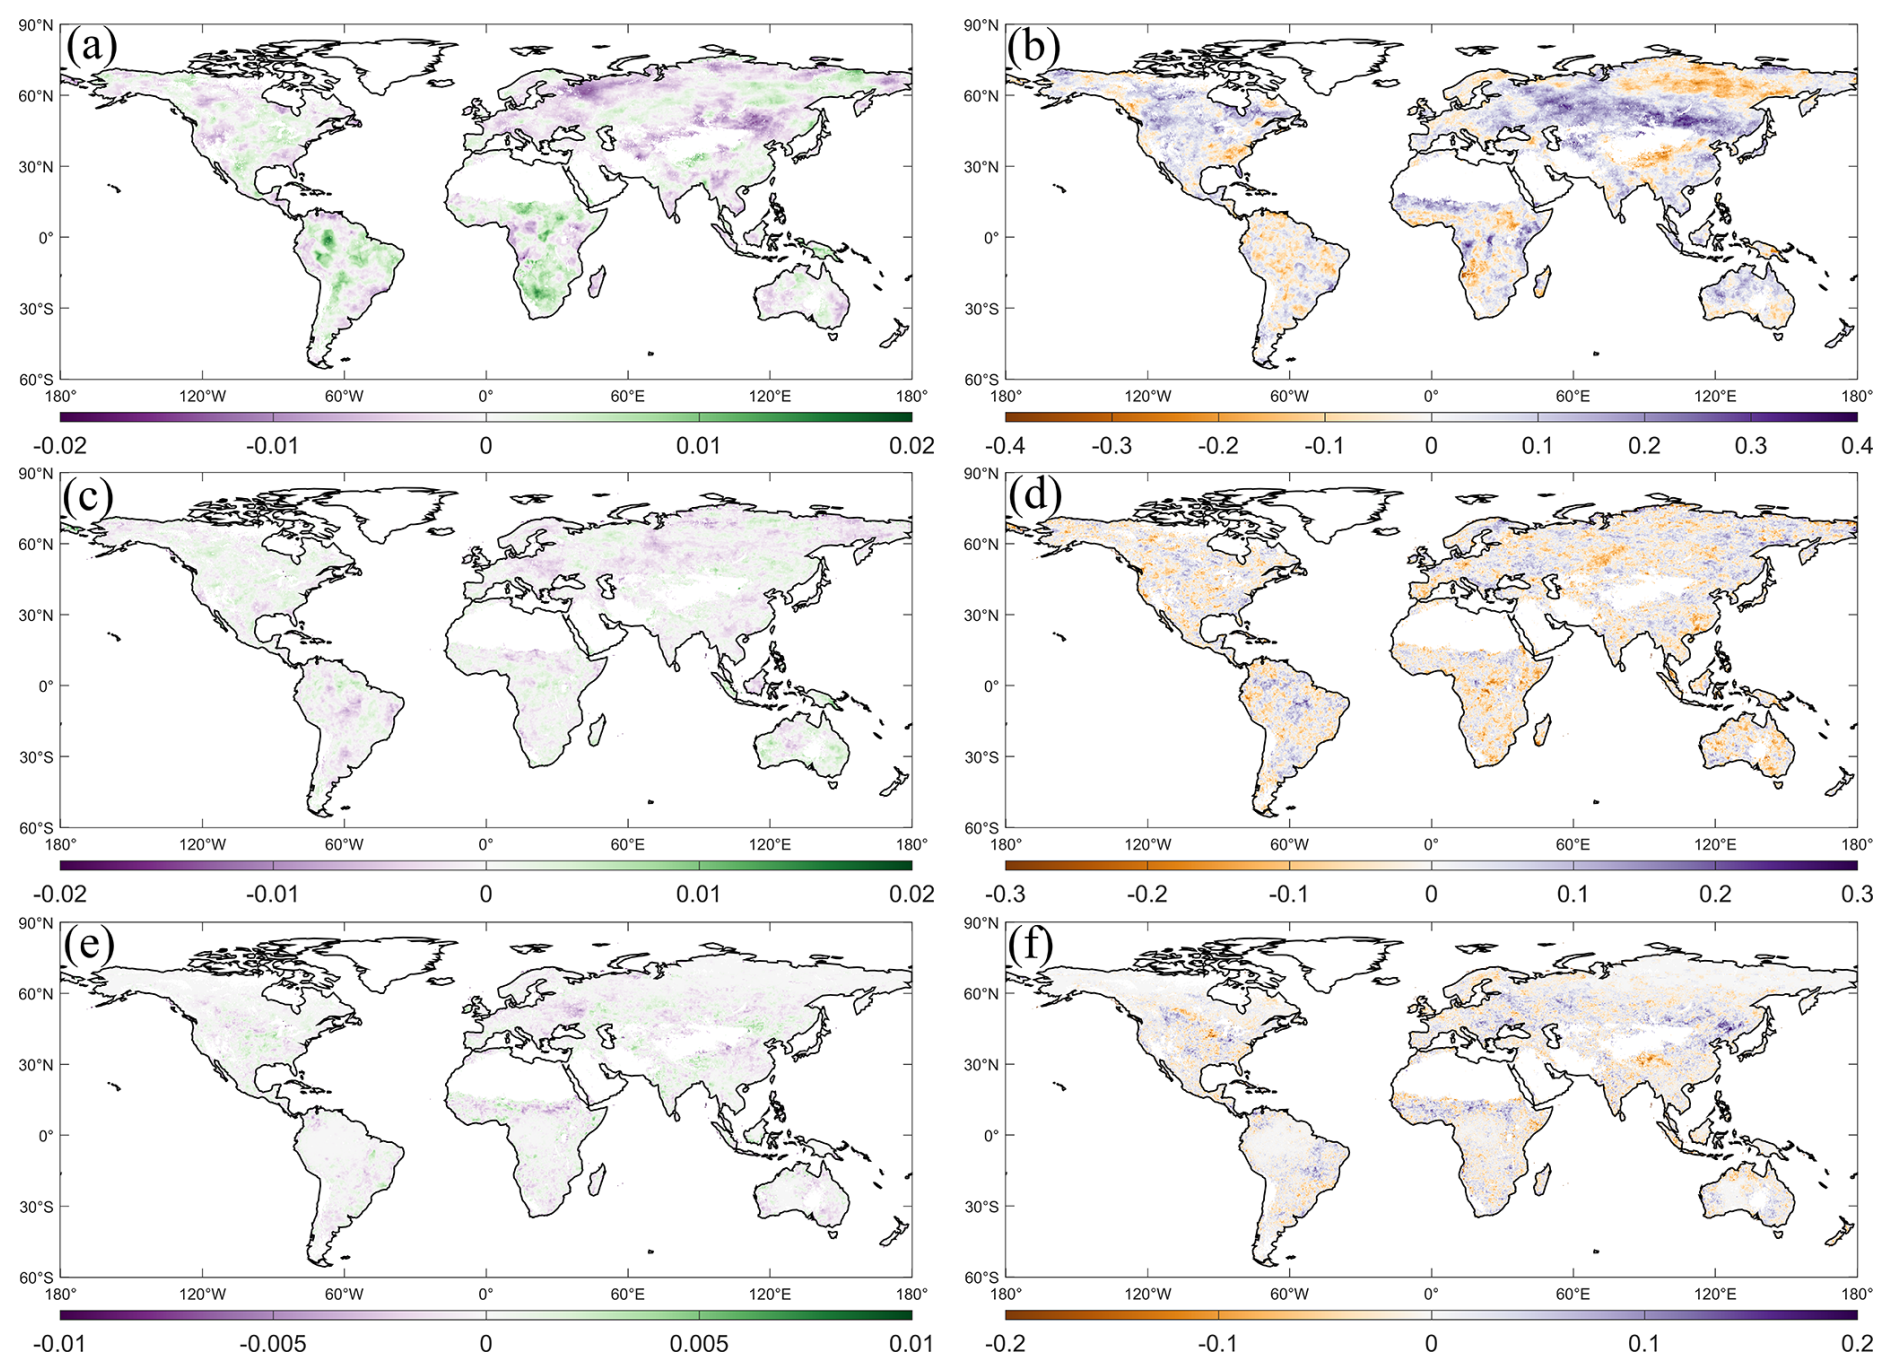
Figure 3The contributions of CO2, CLI, and LCC to the Rmax and Topt under an 18-year moving window. (The left and right columns represented the contributions of variables to the Rmax and Topt, respectively, with the contributions of CO2, CLI, and LCC shown from top to bottom.)
At the global scale, the contribution of CO2 to the Rmax was approximately yr−1, while the contributions of LCC and CLI were approximately and yr−1, respectively. The contributions of CO2, LCC, and CLI to Topt were 2.3, 0.2, and month yr−1, respectively (Fig. 4). Further analysis across vegetation types and drought gradients revealed that CO2 generally exerted a negative contribution to Rmax, with substantial variation among vegetation types. The strongest negative contribution occurred in Cropland, particularly in Cropland within AR ( yr−1). Conversely, Forest and Shrub in AR and Pasture in HR exhibited relatively high positive contributions of 0.8, 1.2, and 1.3 yr−1. In contrast, the contribution of LCC to Rmax was negligible, with an absolute magnitude less than 0.1 yr−1. The contribution of CLI to Rmax was strongly dependent on drought gradients, with its negative effect gradually intensifying from AR to HR. For Topt, the contributions of LCC and CO2 exhibited broadly consistent patterns across vegetation types and drought gradients. Across drought gradients, the largest contributions of CO2 and LCC occurred in AR, while across vegetation types, their effects were much greater in cropland and pasture, with the maximum observed in pastures within AR, where the contributions of CO2 and LCC reached 0.0815 and 0.0196 month yr−1, respectively. The contribution of CLI to Topt was predominantly negative in AR and SAR but positive in more humid regions (SH and HR). Specifically, the strongest negative contribution of CLI to Topt occurred in pastures within AR (−0.0196 month yr−1), whereas the strongest positive contribution was observed in pastures within SH.
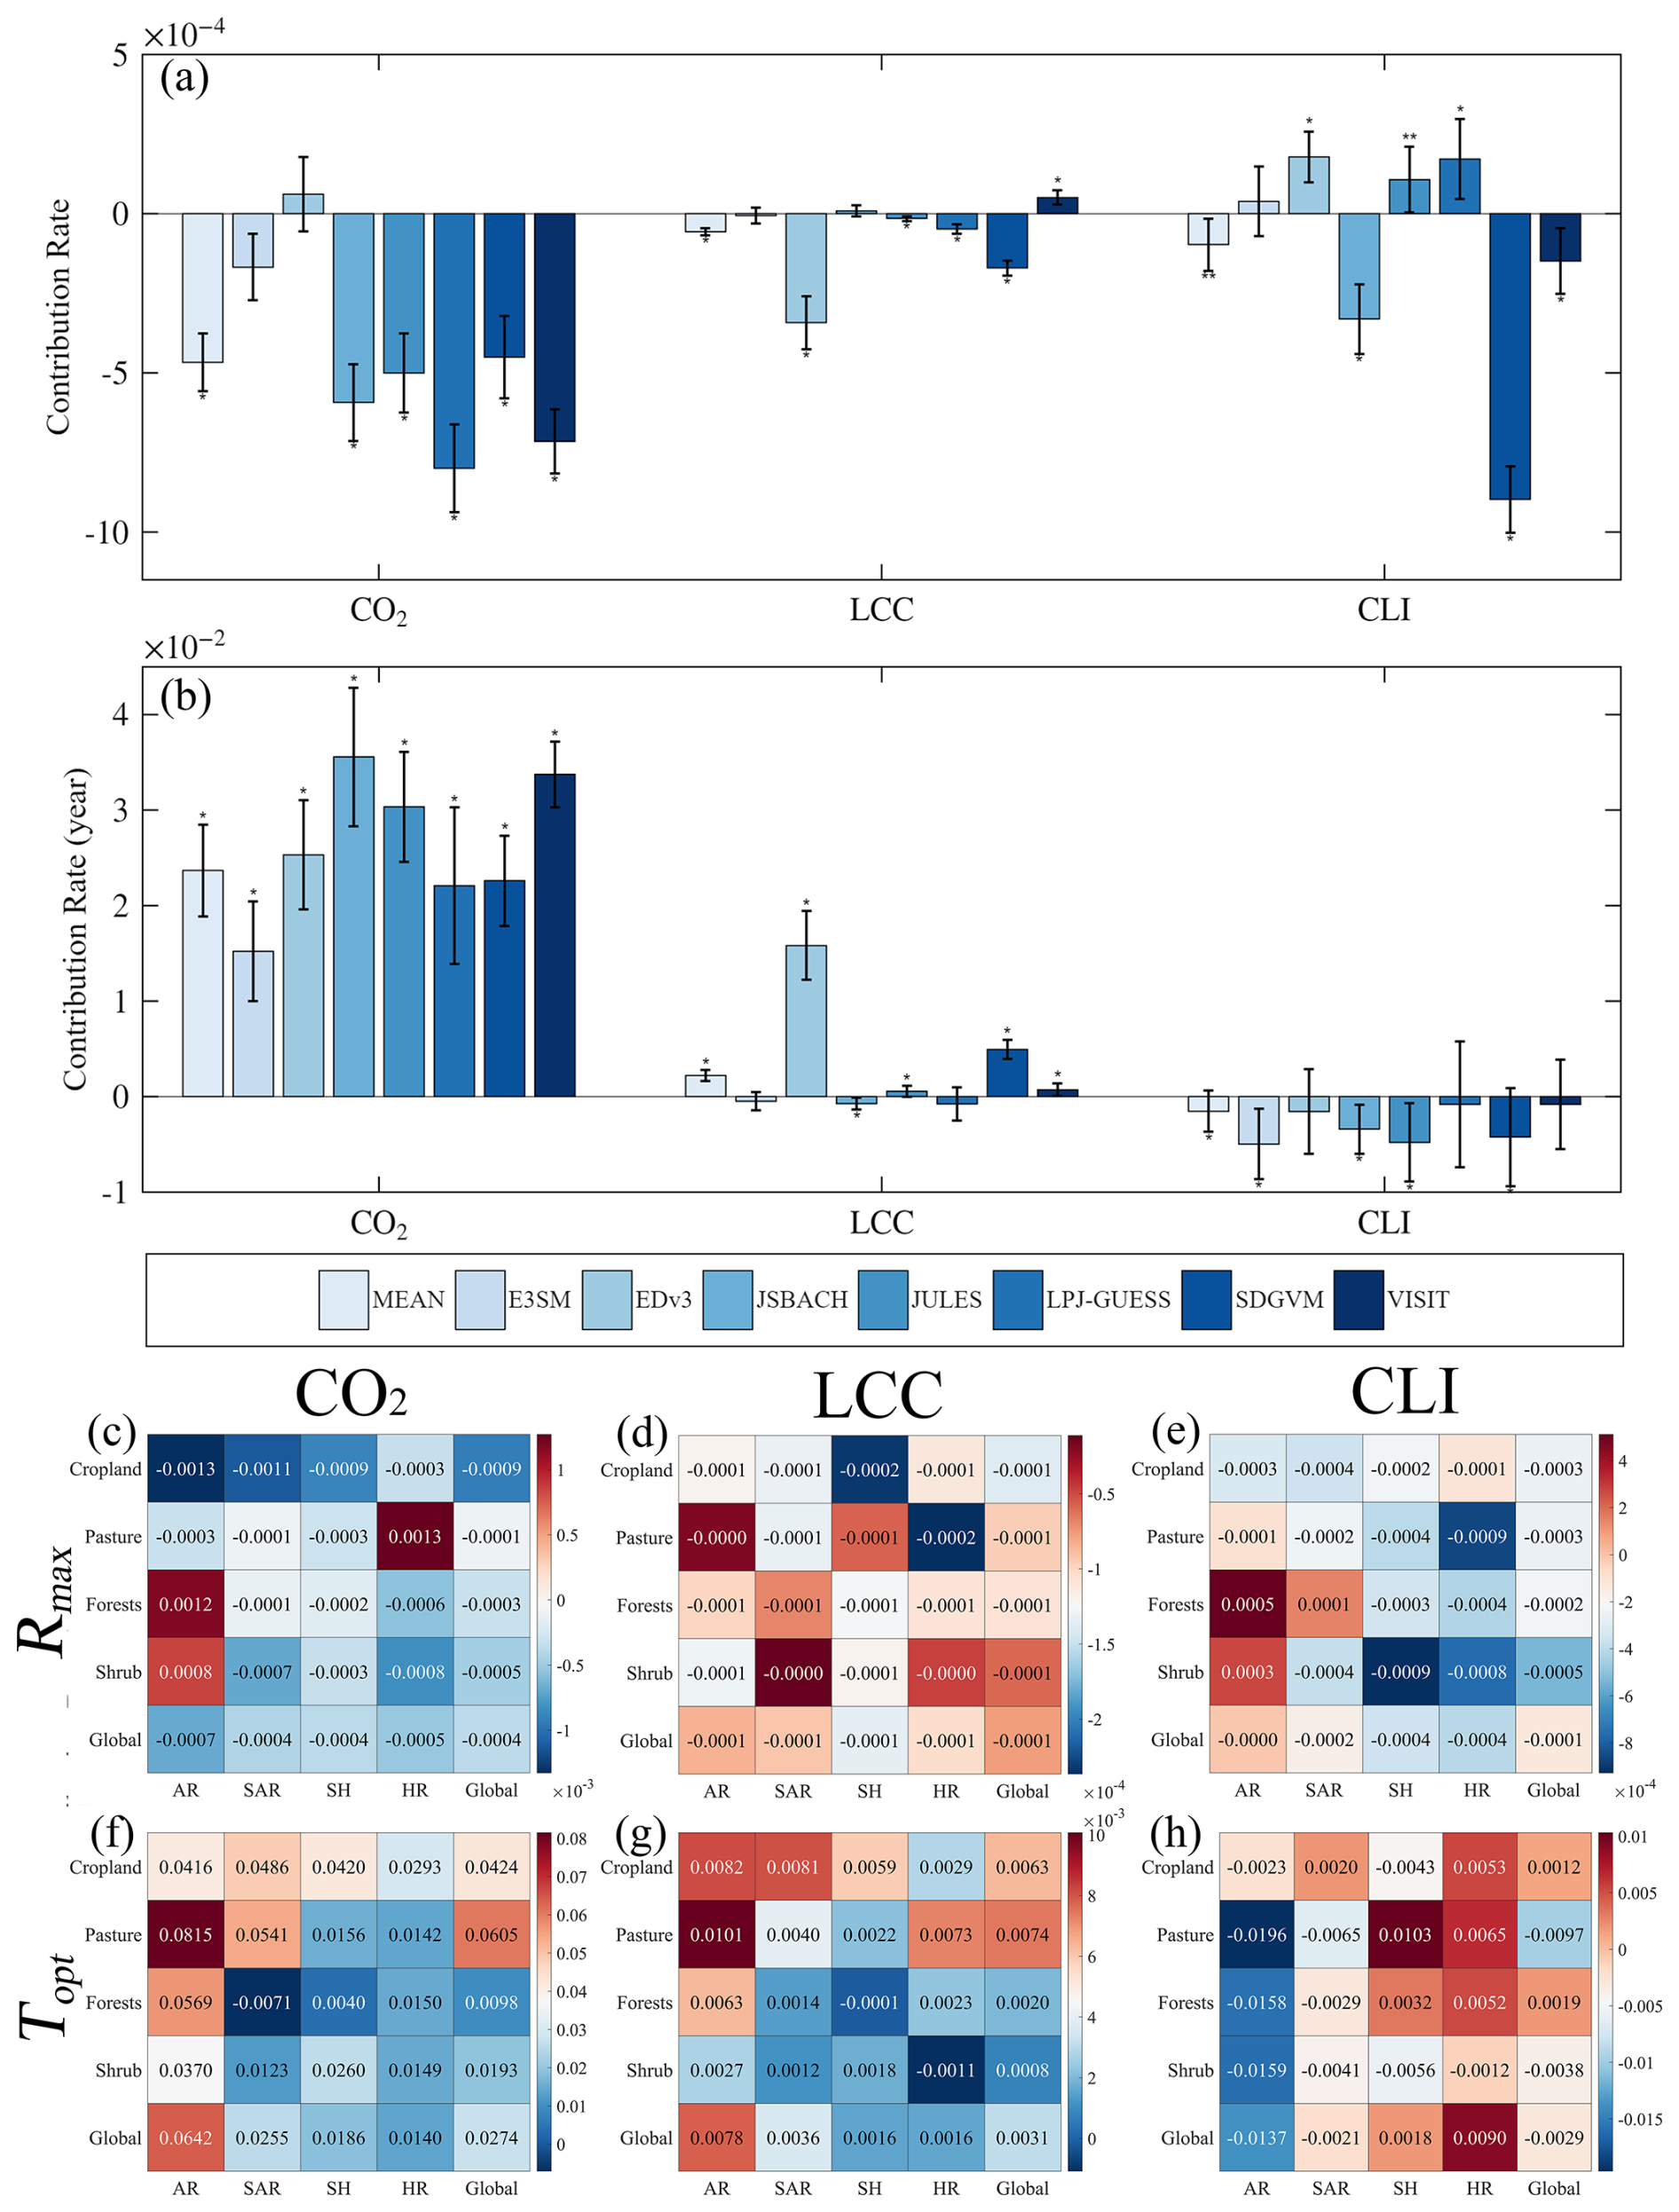
Figure 4The contributions separated by DGVMs under an 18-year moving window, along with statistical plots for different vegetation types and drought gradients.
Based on the independent contributions of CO2, LCC and CLI, their spatially dominant regions were further identified (Fig. 5). The results indicated that, for both Rmax and Topt, CO2 dominated the largest area, followed by CLI, while LCC accounted for the smallest proportion. For Rmax, the regions dominated by negative CO2 contributions accounted for 27.3 % of the total area and were mainly distributed across the eastern Europe, western Siberia, Central Asia, southeastern South America, central and eastern Africa, and Australia. Regions dominated by positive CO2 contributions covered a slightly smaller proportion (approximately 25.0 %), mainly concentrated in the central and eastern Siberia, south-central Africa, and eastern South America. Regions dominated by CLI accounted for 34.5 % of the total area and were mainly distributed along the margins of the CO2-dominated zones, whereas those dominated by LCC accounted for only 13.2 %. For Topt, regions dominated by positive CO2 contributions accounted for 38.2 % of the total area and were concentrated between 30 and 60° N. In contrast, regions dominated by negative CO2 contributions accounted for 20.2 % and were mainly distributed in high-elevation regions such as the eastern Siberia, the Tibetan Plateau, and central-southern North America. The regions dominated by CLI and LCC were relatively scattered.
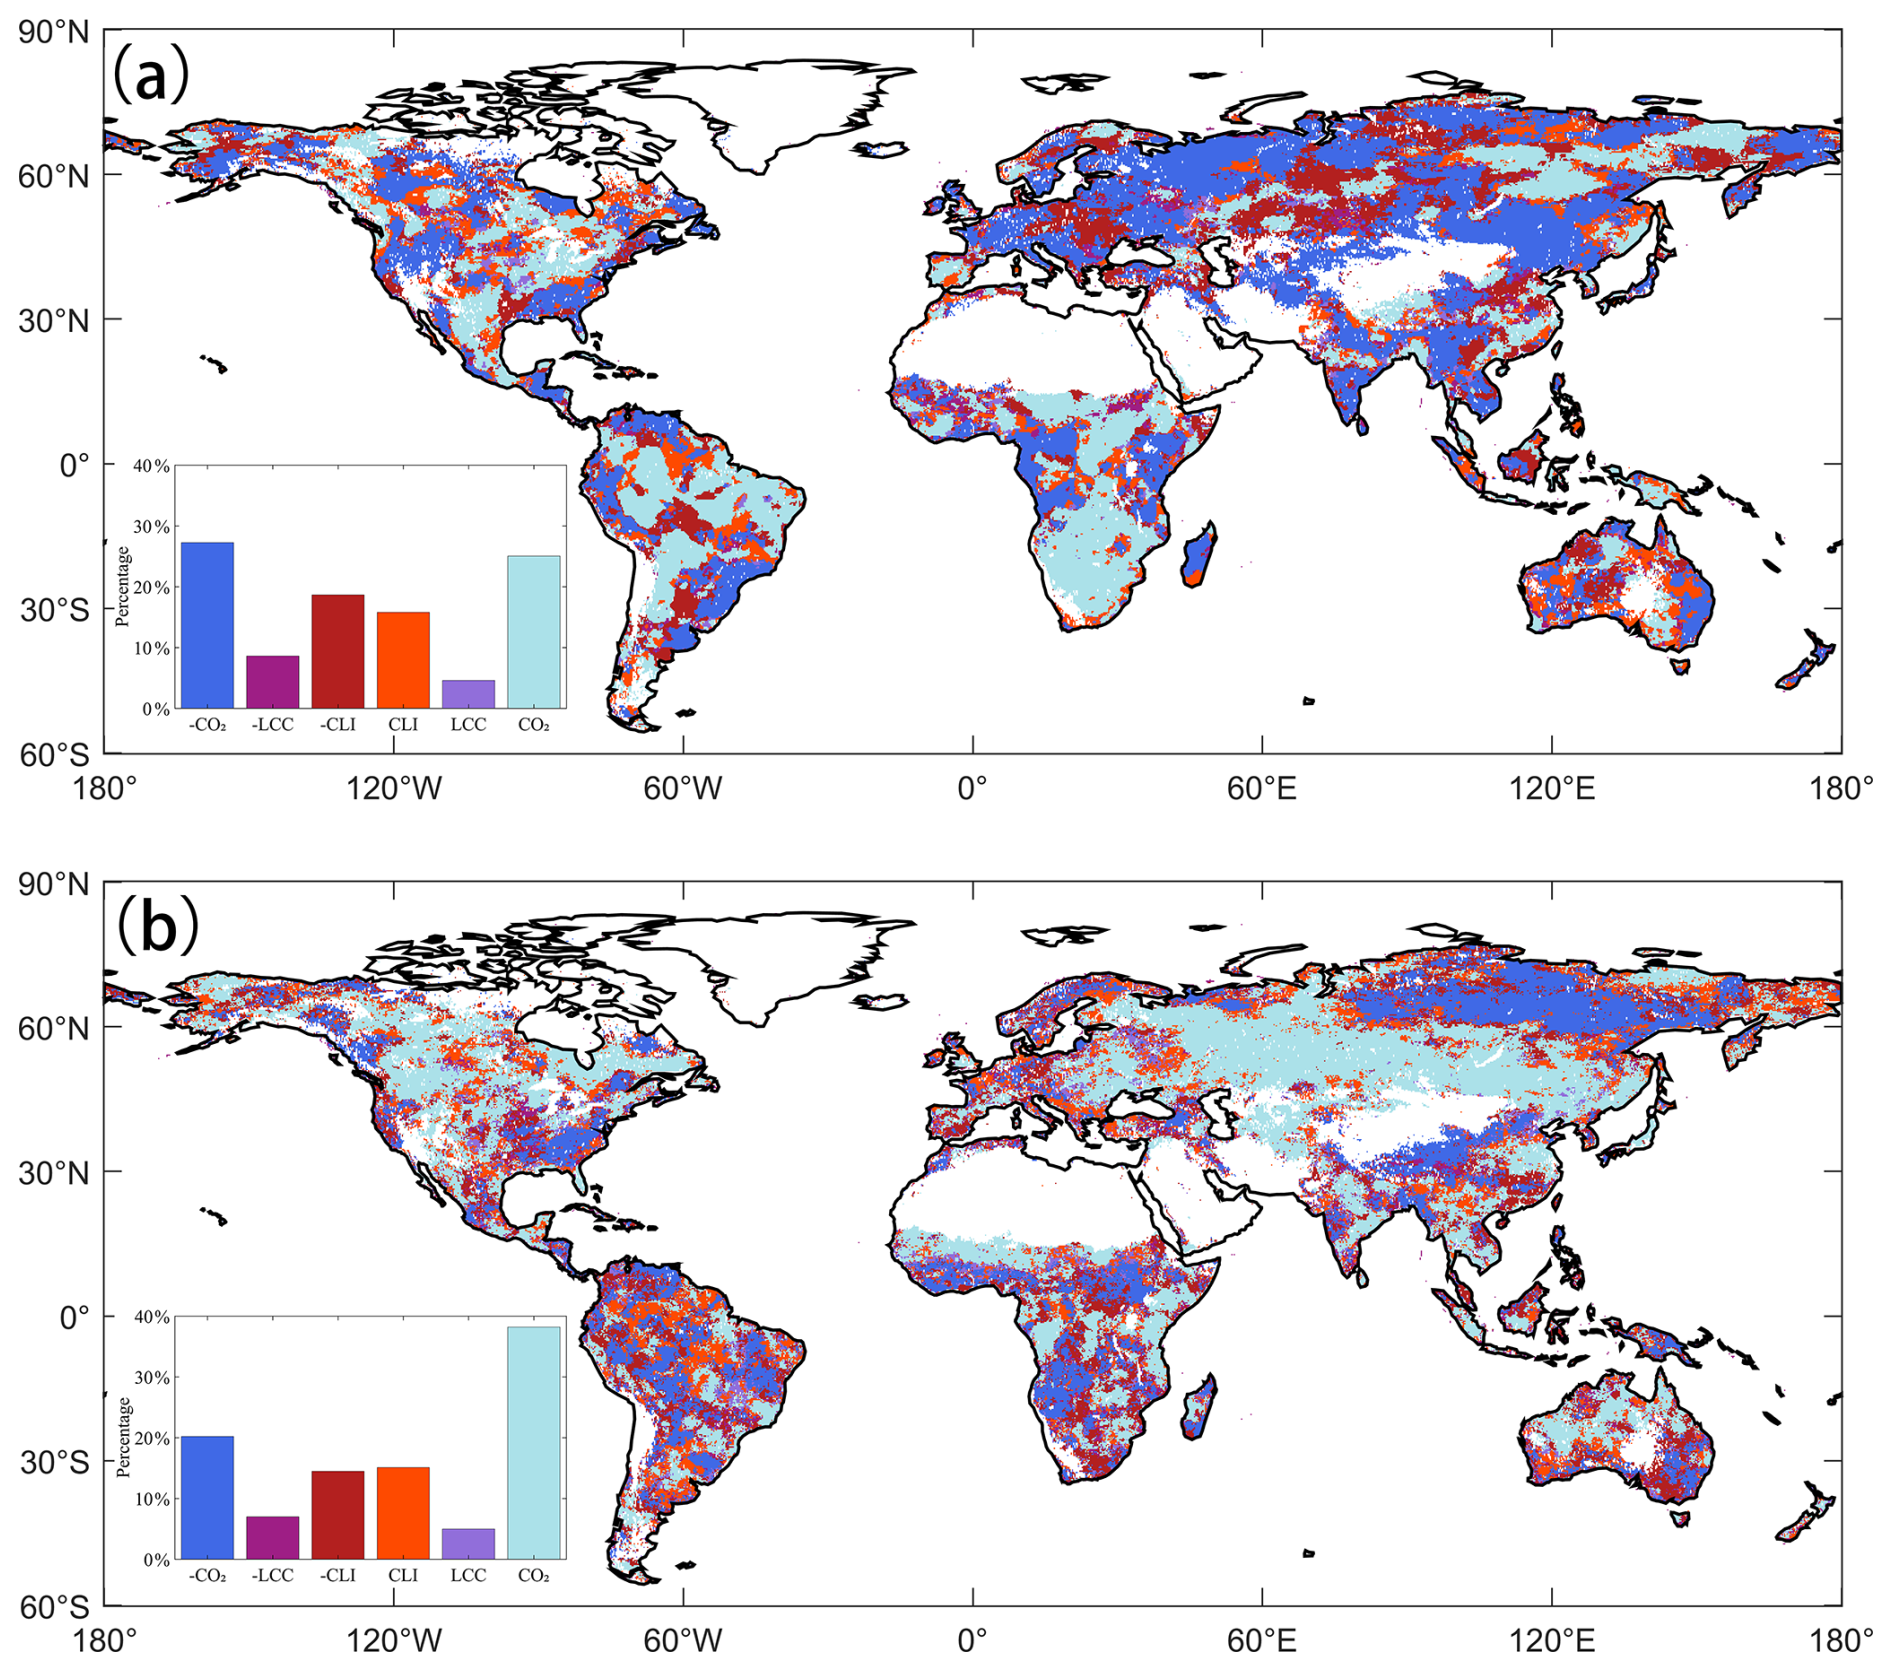
Figure 5Spatial distribution of the dominant factors of CO2, LCC, and CLI on (a) the Rmax and (b) Topt under an 18-year moving window. The bar chart shows the proportions of the dominant areas of CO2, LCC, and CLI.
4.3 The effects of hydrometeorological factors on the WUE-drought coupled relationship
Using XGBoost and SHAP, we quantified the contributions of hydrometeorological factors to the coupling relationship between WUE and drought (Fig. 6). From a global perspective, SMsurf was identified as the most important driving factor for both Rmax and Topt, yet it exhibited nearly opposite influence patterns. Specifically, the effect of SMsurf on Rmax displayed a unimodal pattern: it reduced Rmax when SMsurf was below 0.22 m3 m−3, promoted Rmax between 0.22 and 0.44, and peaked around 0.35 m3 m−3. SMsurf showed a significant nonlinear negative relationship with Topt: as SMsurf increased, its effect on Topt shifted from positive to negative at approximately 0.25 m3 m−3. The effects of SMroot on Rmax and Topt were opposite to those of SMsurf, although the relative importance of SMroot was lower. Another key driving factor for both Rmax and Topt was Temp, ranking third and second in relative importance, respectively. Specifically, Temp promoted Rmax at temperatures below 5.01 °C, inhibited it between 5.01 and 18.38 °C with a local minimum near 12 °C, and again exerted a positive effect above 18.38 °C. For Topt, Temp exerted predominantly negative effects below 1.66 and above 22.80 °C, while showing positive effects between these thresholds. Other hydrometeorological factors also exhibited nonlinear patterns and threshold effects in their influences on Rmax and Topt.
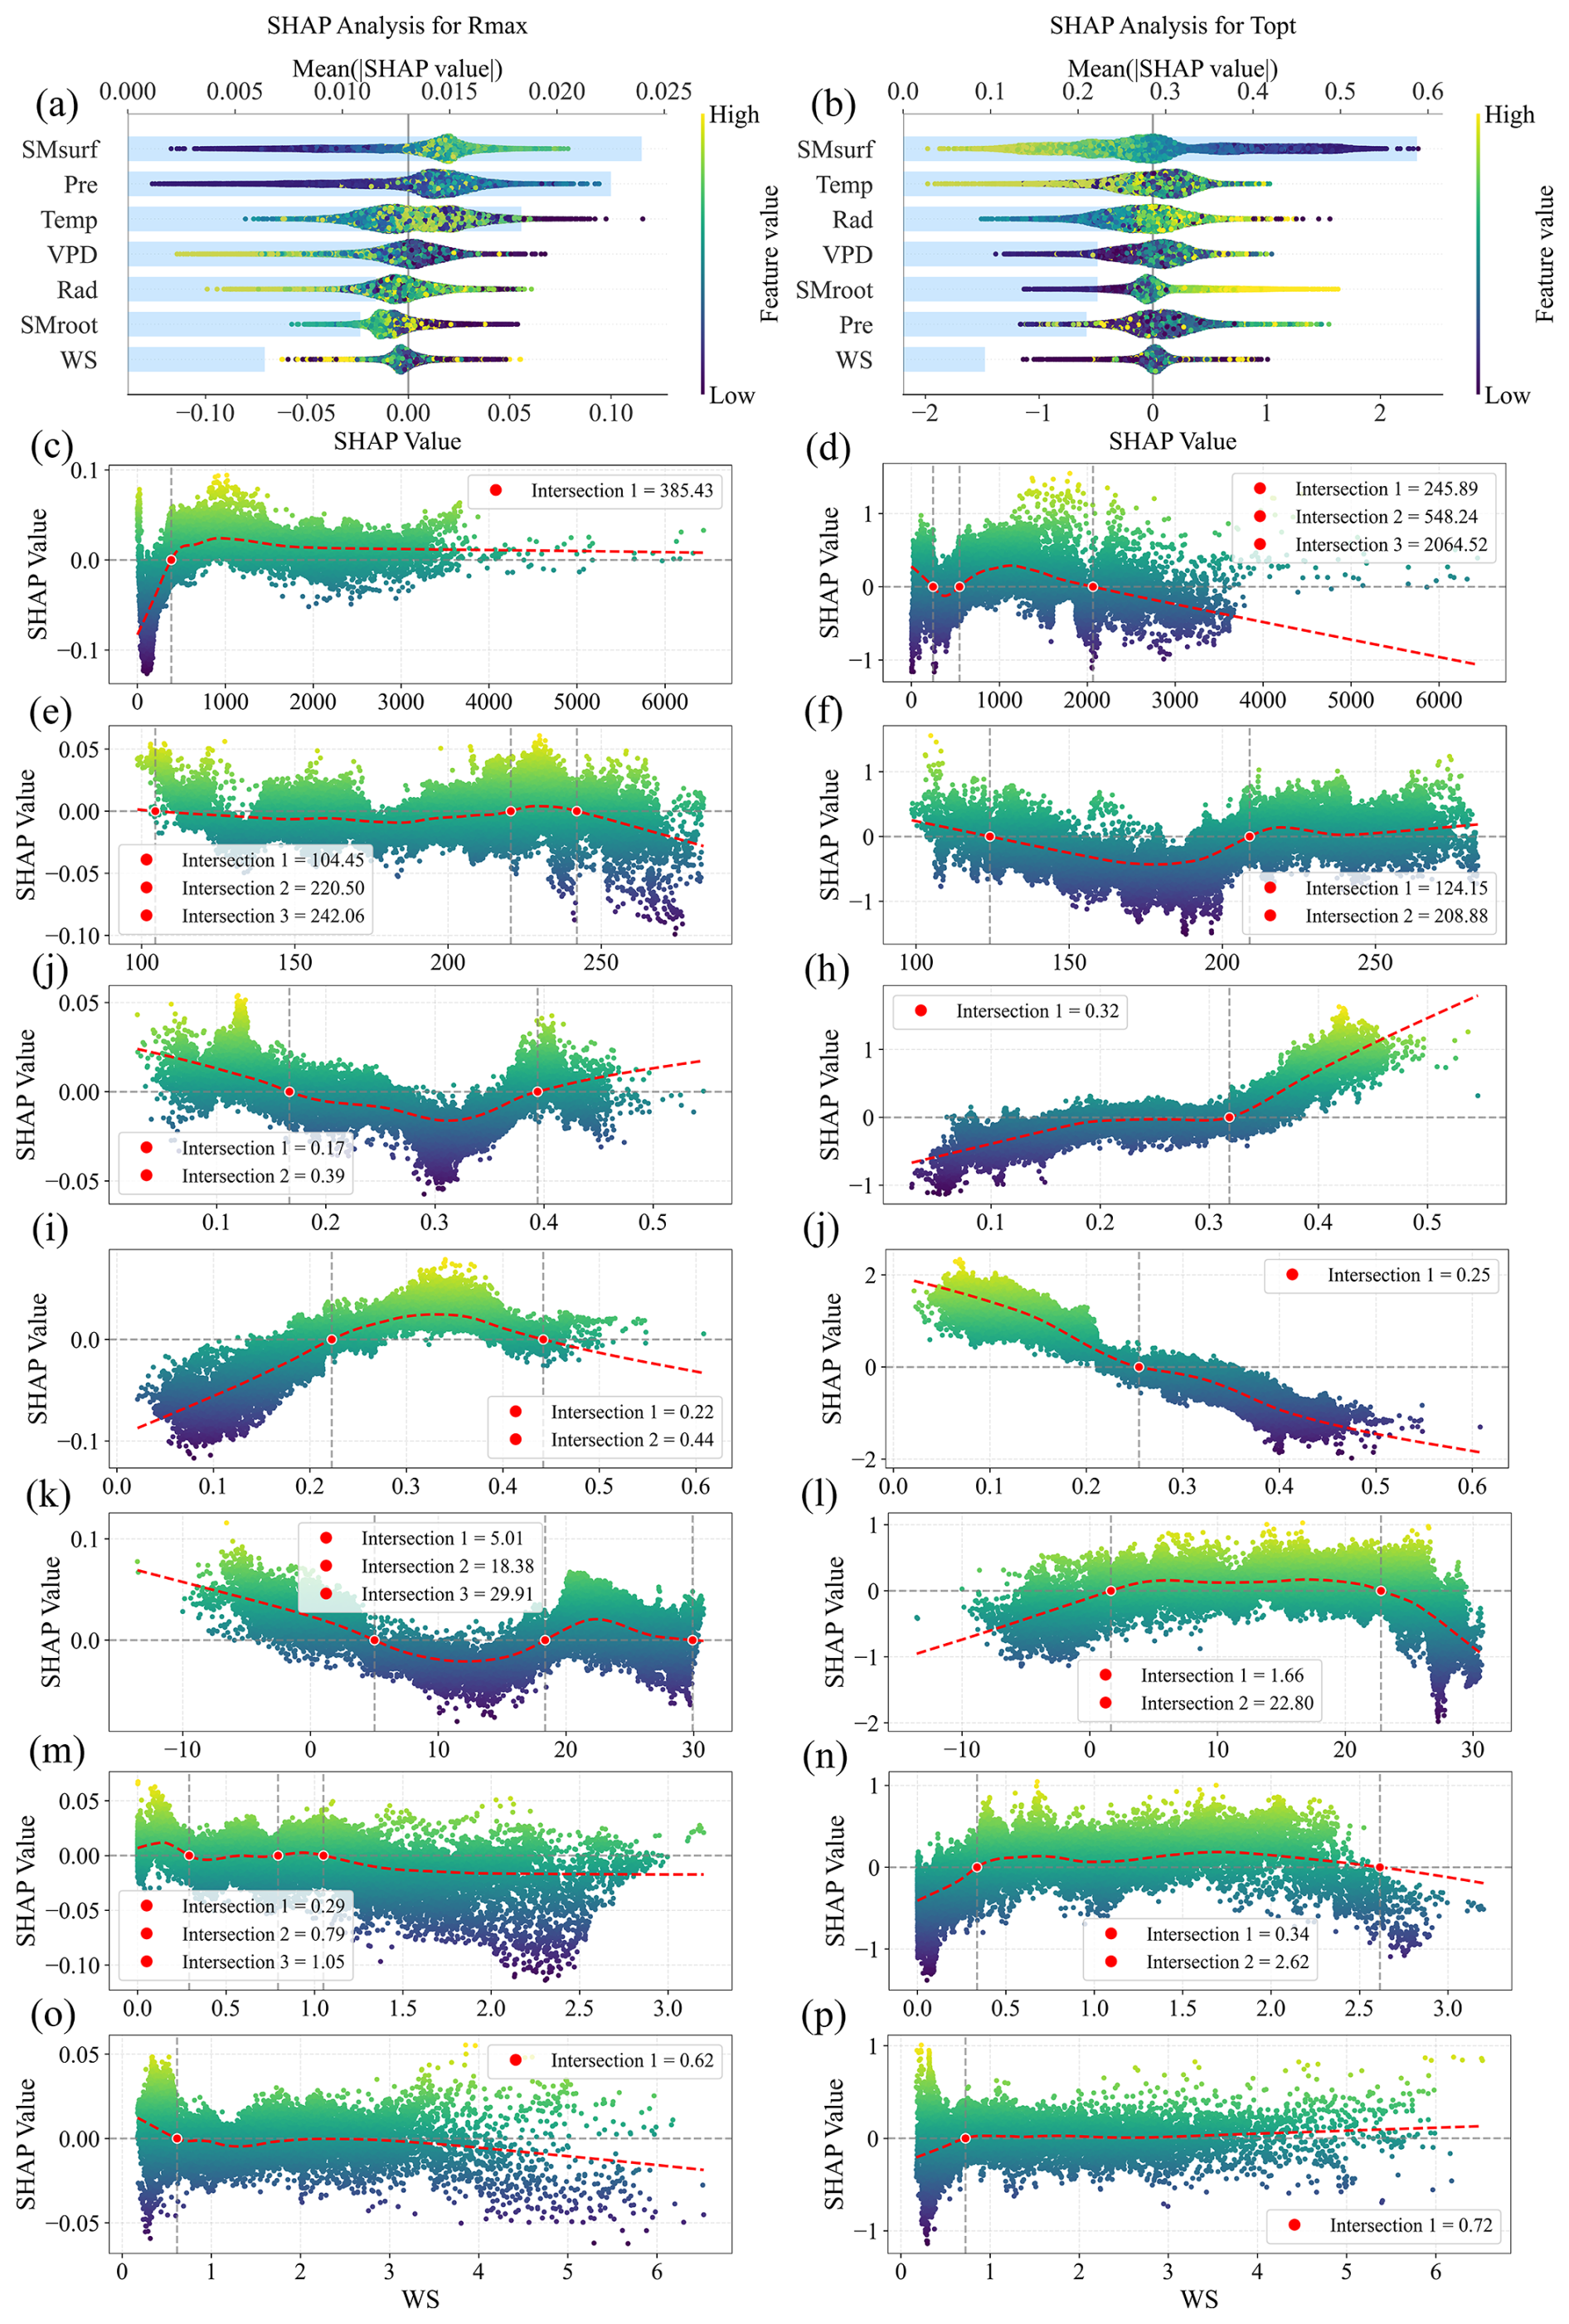
Figure 6Global and local SHAP analyses of the contributions of hydrothermal factors to (a) Rmax and (b) Topt. In the local SHAP analysis, the variables from top to bottom are Pre, Rad, SMroot, SMsurf, Temp, VPD and WS on Rmax and Topt.
The relative importance rankings and influence mechanisms of hydrothermal factors on Rmax and Topt varied slightly across vegetation types and drought gradients (Figs. S20–S27). In Cropland, VPD was the most important driver of Rmax, exhibiting a single-threshold effect: VPD exerted a negative influence when exceeding 1.13 hPa and a positive influence when below this threshold. Rad was the dominant driver of Topt, showing two distinct thresholds: Rad promoted Topt below 145.69 W m−2, inhibited it between 145.69 and 204.51 W m−2, and promoted it again above 204.51 W m−2, with a local SHAP maximum at 204.51 W m−2. For Forest, Temp was the most important factor for both Rmax and Topt. Temp reduced Rmax between 2.23 and 18.65 °C, with the strongest inhibition near 10 °C, whereas it increased Topt between −0.99 and 22.00 °C, showing the strongest promotion around 10 °C. For Pasture, Pre and SMsurf were the most critical factors influencing Rmax and Topt, respectively. Pre decreased Rmax when below 438.46 mm but increased it above this value, while SMsurf promoted Topt below 0.24 m3 m−3 and inhibited it above. For Shrub, SMsurf was the most important driver for both Rmax and Topt with thresholds of 0.23 and 0.20 m3 m−3, respectively, showing opposite effects across the thresholds.
Across drought gradients, Pre and SMsurf were the most important drivers of Rmax and Topt, respectively, in AR. The effect of Pre on Rmax shifted from negative to positive at 245.03 mm, while that of SMsurf on Topt changed from positive to negative at 0.12 m3 m−3. In SAR, Temp and Rad were the most critical drivers of Rmax and Topt, respectively. The influence of Temp on Rmax exhibited pronounced nonlinearity: Temp decreased Rmax below 16.91 °C (with a local minimum near 13 °C) but promoted Topt above 16.91 °C, showing a local maximum near 23 °C. Rad inhibited Topt below 206.65 W m−2 but promoted it above this threshold. In SH, VPD and Rad were the dominant drivers of Rmax and Topt, respectively; VPD increased Rmax when exceeding 0.58 hPa, while lower VPD values reduced it, and the positive effects of Rad on Topt were concentrated between 598.44 and 1472.70 W m−2. In HR, Temp was the most critical driver for both Rmax and Topt, with their partial dependence plots exhibiting nearly opposite patterns.
The results derived from PCMCI+ revealed a complex causal network between hydrothermal factors, Rmax, and Topt (Fig. 7). At the global scale, WS exhibited a negative causal relationship with Rmax, while Rmax, in turn, negatively influenced Pre, Rad, and Temp. Although many factors did not exert a direct causal effect on Rmax, they influenced it indirectly through various pathways. For instance, VPD affected Rmax indirectly via WS, while Rad influenced Temp, which subsequently impacted WS and ultimately affected Rmax. For Topt, Rad and WS exhibited direct negative and positive causal relationships, respectively. Conversely, Topt exerted a direct positive causal effect on Pre and a direct negative effect on Temp. Additionally, SMroot and SMsurf were causally linked to Topt, though the direction of their influence remained unclear.
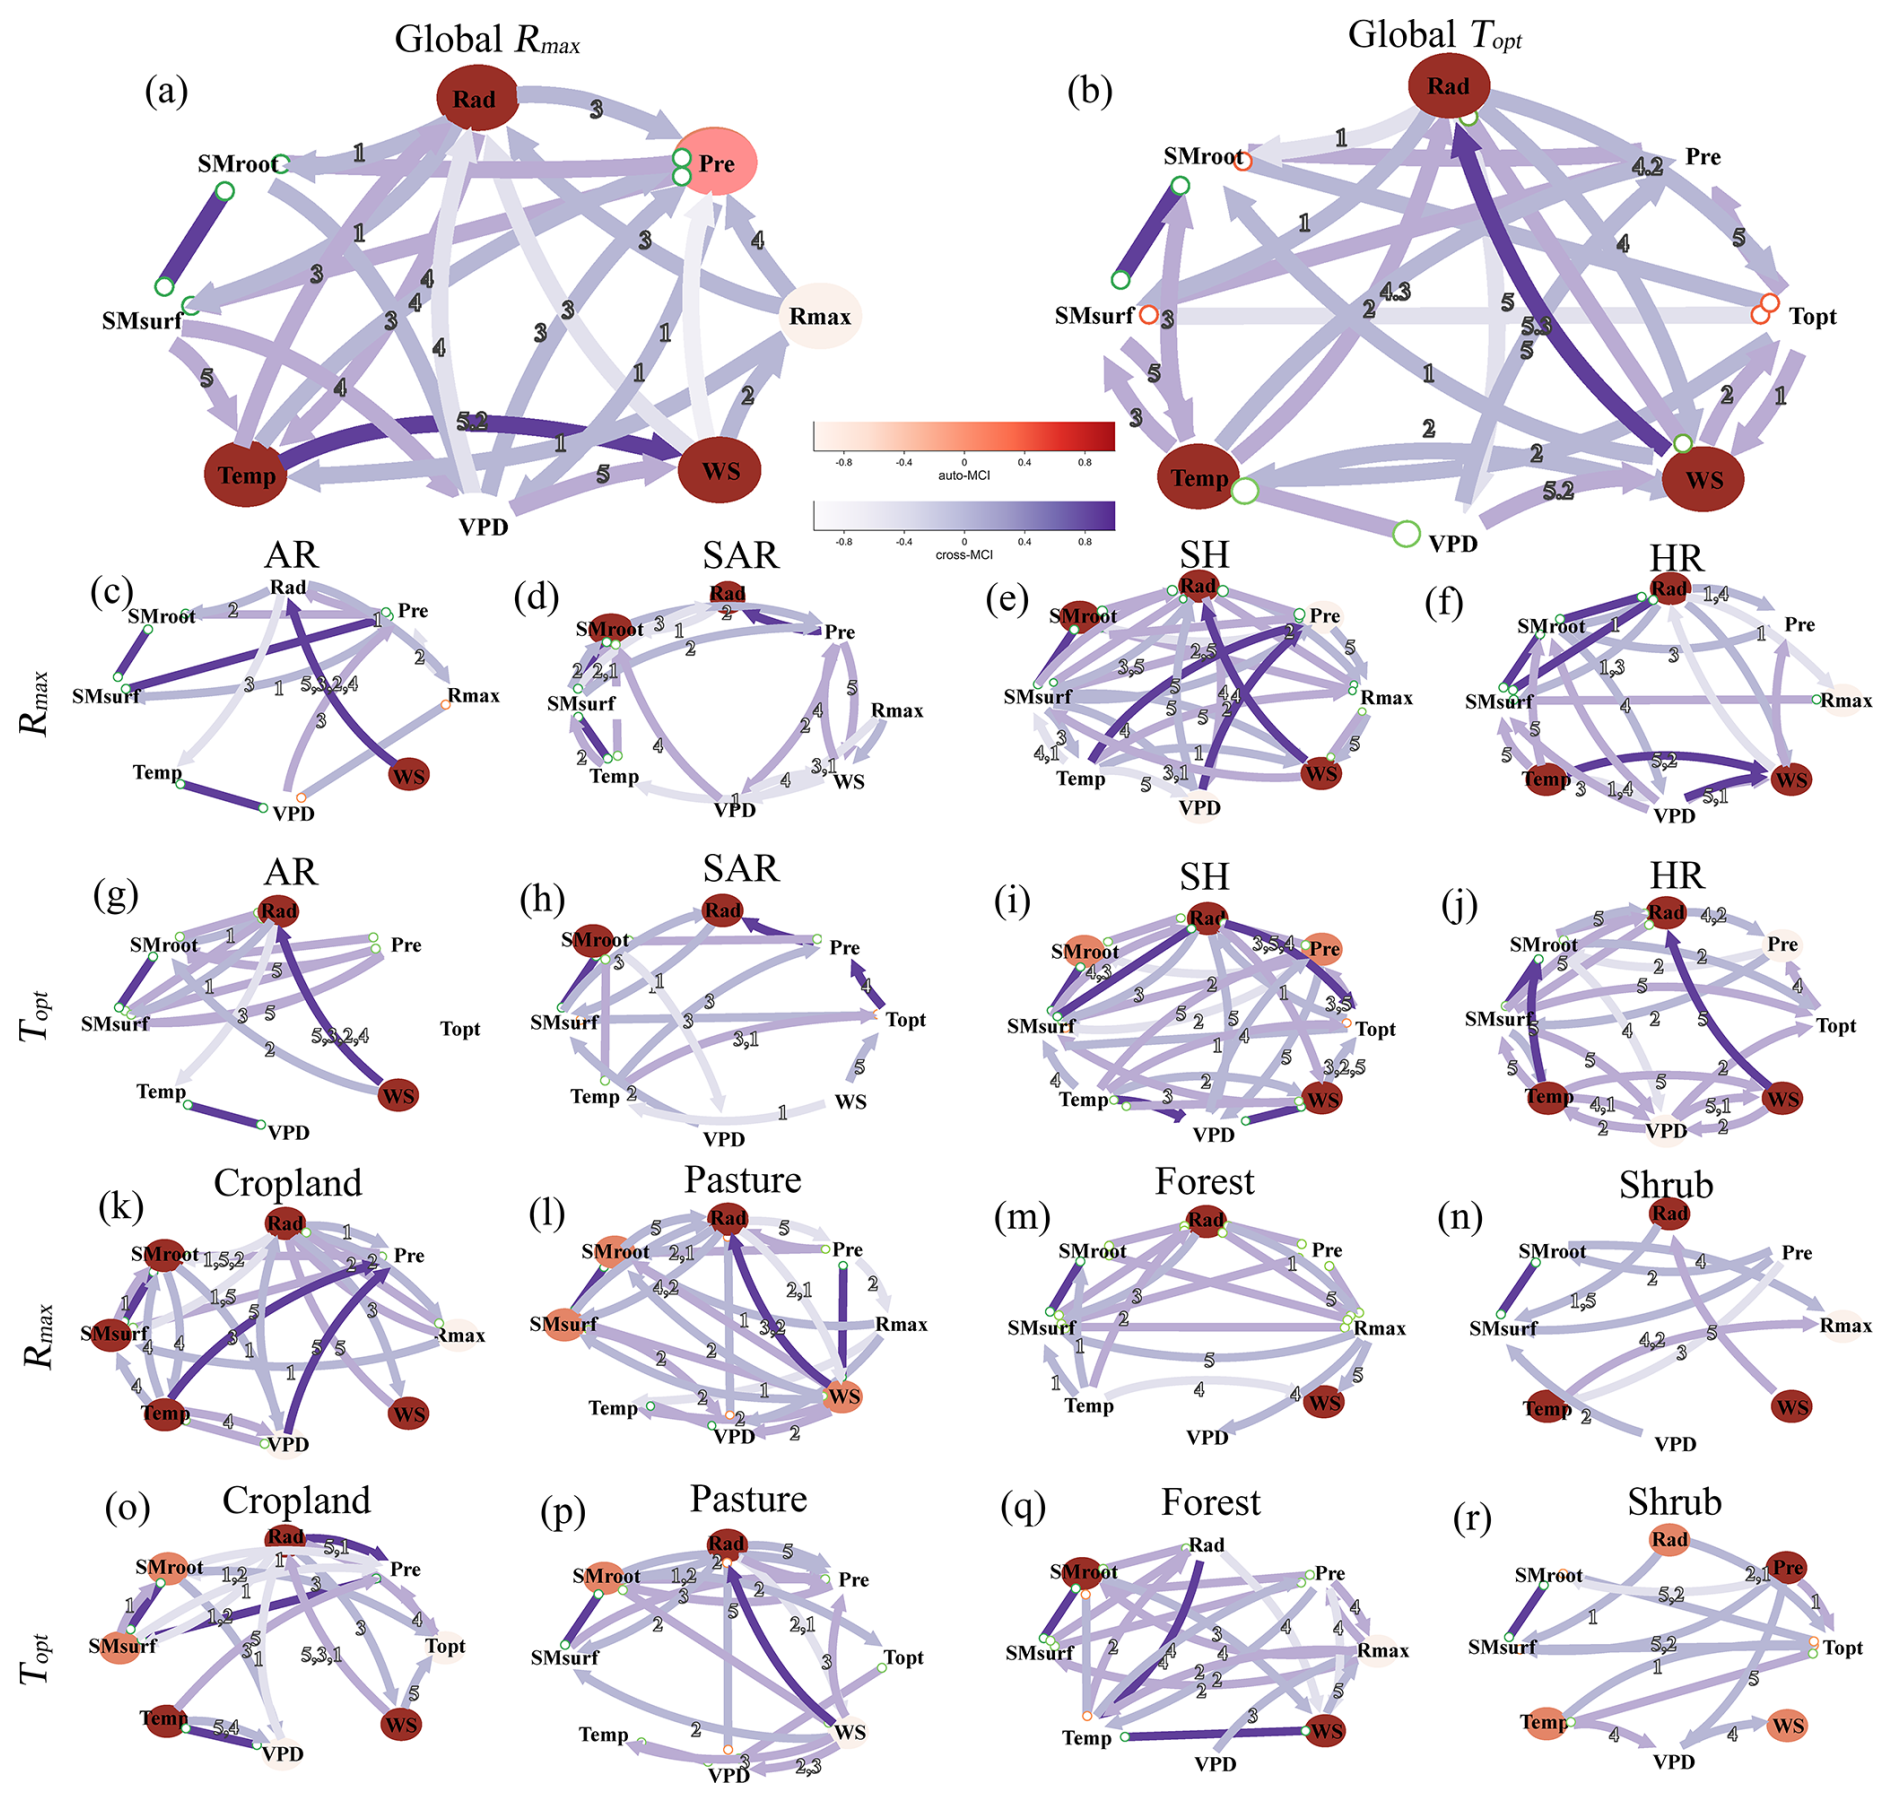
Figure 7Causal network diagram of hydrothermal factors, Rmax, and Topt across different vegetation types, drought gradients, and the global scale.
To further explore the causal network under different vegetation types and drought gradients, we conducted an in-depth statistical analysis, examining interactions within overlapping regions of vegetation type and drought gradient (Figs. S28–S31). In terms of drought gradients, the causal network structures in AR and SAR were relatively simple. In AR, Rmax was directly influenced by Rad, while Topt showed little causal linkage with other hydrothermal factors. In SAR, Rmax was not directly affected by hydrothermal factors but exhibited direct causal relationships with VPD and WS. Meanwhile, Topt was positively influenced by Temp and Pre, negatively influenced by WS, and had an undefined negative causal relationship with SMsurf. Conversely, the causal relationships in SH and HR were considerably more intricate. Beyond the complex interactions among hydrothermal factors and their indirect effects on Rmax and Topt, hydrothermal factors also directly influenced Rmax and Topt through multiple pathways. For example, in SH, both Pre and Rad exerted direct negative causal effects on Rmax, while Temp had a direct positive influence. From the perspective of vegetation types, the causal networks in Cropland, Pasture, and Forest were relatively complex, whereas Shrub exhibited a simpler structure. In Cropland, Rmax was directly and negatively influenced by Rad, while Topt was directly and positively affected by Rad but negatively impacted by SMroot and WS. In Pasture, Rmax was negatively influenced by Pre, while Topt was negatively affected by SMroot. In Forest, Rmax was negatively influenced by Rad, whereas Topt was negatively influenced by VPD and WS but positively affected by Pre and Temp. In Shrub, SMroot exerted a direct negative influence on Rmax, while Temp had a direct positive effect. Topt, on the other hand, was mainly influenced by Pre through a direct positive causal relationship and was negatively influenced by SMsurf and Temp.
5.1 Robustness of the results
To ensure the robustness of the remotely sensed WUE observations, we averaged three sets of GPP and ET products and validated the results against data from 85 FLUXNET 2015 sites (Fig. S1, Table S1). The results indicated a high consistency between the multi-product average WUE from remote sensing and the site data (R= 0.62, Fig. S2). To confirm the alignment of the selected DGVMs with the remote sensing observations, we performed calculations for all models within TRENDY v12 and identified seven models whose trends under the S3 scenarios were consistent with the remote sensing observations. As shown in the Taylor diagram, the multi-model ensemble results exhibited high correlation with the remote sensing observations and lower standard deviation, supporting the credibility of the separated contributions of CO2, LCC, and CLI (Fig. S6). To mitigate the impact of interannual variations on trend significance, all calculations were performed within an 18-year moving window. To test the robustness of the Rmax and Topt under different window choices, we repeated all calculations using 16 and 20-year windows, which yielded similar conclusions (Figs. S7–S17). Therefore, we considered our results to be highly reliable.
5.2 Spatiotemporal variation characteristics of the coupling relationship
This study pioneers the identification of optimal time scale for WUE response to drought coupling, demonstrating significant spatiotemporal heterogeneity. Temporally, the optimal WUE-drought response scale exhibited an upward trend (Fig. 1), indicating a delayed WUE response to drought and, consequently, an enhanced buffering capacity of vegetation against drought has been enhanced (Peters et al., 2018; Frank et al., 2015). This phenomenon likely stems from climate change-driven drought intensification, compelling vegetation to utilize slow-response water sources like deep soil moisture or groundwater (Miguez-Macho and Fan, 2012). However, Tang et al. (2024) employed GPP as a proxy for vegetation and found that vegetation sensitivity to drought increased and its response time shortened, which appears to contradict our findings. However, that study focused only on single indicators such as GPP, which reflect vegetation photosynthesis, whereas WUE likely plays a more complex role in regulating water and carbon dynamics. In addition, differences in the definition of sensitivity, data sources, methods, research periods, and research areas might lead to different conclusions. Different types of droughts might also result in different outcomes. Therefore, our findings did not necessarily refute previous views. However, we firmly believe that considering the time scale in the response of WUE to drought is a crucial step in revealing the dynamic relationship between WUE and SPEI.
Across drought gradients, the optimal drought scale in arid regions was significantly shorter than in humid regions. This phenomenon could be explained by the resource limitation hypothesis (Huxman et al., 2004) , which posited that in humid regions, plant growth was generally limited by light or nutrient availability, whereas in arid regions, it was primarily constrained by water scarcity (Maurer et al., 2020; Knapp et al., 2024). Larger Topt were mainly concentrated in humid, energy-limited regions, where drought conditions caused by insufficient precipitation were often accompanied by high temperatures and intense solar radiation, thereby enhancing the resistance of WUE to drought (Gentine et al., 2019; Walther et al., 2019). For instance, Miller et al. (2023) reported a sustained increase in plant photosynthesis during spring droughts across most vegetated areas of the Northern Hemisphere. Similarly, during recent drought events such as those in Europe in 2018 and 2022, several energy-limited ecosystems also exhibited enhanced plant activity (Bastos et al., 2020). Differences in vegetation adaptation strategies along drought gradients might also have led to distinct response times. Vegetation in arid regions optimized water use through stomatal dynamics, whereas humid ecosystems buffered drought effects via deep rooting systems and canopy shading (Klein et al., 2011). A shorter response time might indirectly indicate higher sensitivity (Vicente-Serrano et al., 2013); thus, our findings also supported previous conclusions that vegetation in arid regions exhibited stronger drought sensitivity (De Keersmaecker et al., 2015; Seddon et al., 2016). However, we found that this pattern was shifting between arid and humid regions. Specifically, the optimal drought scale in arid regions showed the most rapid increase, whereas the rate of change in humid regions was much smaller or even declined. We attributed this discrepancy in the consideration of time scales.
From the perspective of vegetation types, the optimal drought scale increased rapidly in Cropland and Pasture, increased slightly in Shrub, but decreased in Forest. This pattern might result from the stronger influence of human activities on Cropland and Pasture, where irrigation and fertilization altered the water and nutrient conditions of these ecosystems (Jaramillo et al., 2018). On the one hand, irrigation maintained adequate soil moisture at all times. On the other hand, sufficient nitrogen supply ensured high photosynthetic nitrogen-use efficiency in crop leaves, indicating that even under partial stomatal closure and limited intercellular CO2 concentration, leaves were still able to efficiently utilize the available CO2 for photosynthesis. In contrast, Shrub and Forest were mostly subject to natural conditions. The slight increase in Topt observed in Shrub might have reflected their conservative, isohydric water-use strategy (Yang et al., 2016). The decrease in Topt in Forest might have been attributed to continued transpiration under water stress, which persisted due to their extensive canopies and residual hydraulic function, thereby shortening the response time to drought (Novick et al., 2016). These findings collectively reveal vegetation-drought coupling as a nonlinear outcome of climate forcing, ecological adaptation, and anthropogenic intervention, necessitating multi-scale models and sustained monitoring to unravel critical thresholds (Reichstein et al., 2013).
It is also important to emphasize that drought is a continuously evolving process, and the transition from one type of drought to another is referred to as drought propagation (Zhou et al., 2021). Drought generally begins as meteorological drought caused by reduced precipitation or increased potential evapotranspiration and may subsequently result in soil drought (Ma and Yuan, 2024). However, this propagation does not occur instantaneously because the soil water-storage capacity can buffer and delay the response of WUE to meteorological drought. Therefore, the decoupling of WUE from meteorological drought is closely linked to the propagation of meteorological drought into soil drought. Nevertheless, further research is required to investigate the coupling relationship between soil drought and WUE and to determine how soil drought regulates the coupling between meteorological drought and WUE.
5.3 Influencing factors of coupling relationship
TRENDY multi-model simulations identified CO2 fertilization as the dominant driver weakening WUE-SPEI coupling, as evidenced by a decrease in the maximum correlation coefficient and an increase in the optimal drought timescale (Fig. 4). On the one hand, elevated atmospheric CO2 enhances the carboxylation efficiency of Rubisco, thereby directly promoting GPP and enabling vegetation to maintain relatively high carbon assimilation without increased water supply; consequently, the synchrony between decreases in GPP and SPEI is weakened. On the other hand, elevated atmospheric CO2 induces partial stomatal closure, thereby reducing transpiration water loss (Keenan et al., 2013). These mechanisms play a critical role in preventing rapid declines in WUE under drought conditions, thereby directly reducing its sensitivity to meteorological drought. Moreover, the CO2 fertilization effect promotes deeper root distribution and adaptive changes in hydraulic traits, leading plants to increasingly rely on water stored from past precipitation in deeper unsaturated soil layers or groundwater to maintain carbon-water balance under drought stress (Zhang et al., 2026). This enhances the ecohydrological buffering capacity of vegetation against short-term meteorological drought, as reflected by an increase in the optimal drought timescale. Theoretically, these processes occur at the leaf scale, enhancing intrinsic water use efficiency (Li et al., 2025), however, cross-scale dependencies allow these effects to propagate to the ecosystem scale. Land-use changes exert secondary but critical impacts, including tropical deforestation, forest degradation, and afforestation programs, all of which gradually altered global vegetation patterns. In addition, agricultural management practices such as irrigation, fertilization, and crop modification did not change vegetation cover types but still influenced vegetation adaptability to environmental conditions. Chen et al. (2019) found that human land-use practices might have contributed to more than one-third of the global vegetation increase, particularly in extensive cropland regions – most notably in China (25 %) and India (6.8 %). Therefore, we reasonably inferred that LCC driven by human interventions enhanced ecosystem resilience to drought and other extreme events, particularly in croplands. This was manifested in our results as LCC contributed a negative effect in Rmax and a positive effect in Topt.
Although TRENDY multi-model simulations indicated that the influence of climate change was minimal, this study employed XGBoost and SHAP to reveal how meteorological factors affected the WUE–SPEI coupling relationship. SMsurf was identified as the most important driving factor, exhibiting nearly opposite effects on Rmax and Topt and a significant threshold response (Fig. 6). In fact, this remained closely associated with increased atmospheric CO2. Previous studies suggested that although elevated atmospheric CO2 could reduce plant water loss by decreasing stomatal conductance – thereby theoretically slowing soil moisture depletion (Gray et al., 2016) – the elevated CO2 was accompanied by increased leaf temperature and accelerated evaporation from shallow soils, which offset this water-saving effect (Wilson et al., 1999), ultimately promoting soil moisture depletion (Kellner et al., 2019). As the direct “water reservoir” for vegetation, surface soil moisture limited plant water supply and reduced photosynthesis, thereby exerting a profound influence on the WUE–SPEI coupling relationship (Liu et al., 2020; Martínez-Vilalta et al., 2014). Along the drought gradient, precipitation was the most important factor influencing the WUE–SPEI coupling in arid regions, with SMsurf ranking third in importance. In contrast, in humid regions, temperature and radiation were the dominant factors, while SMsurf ranked fifth and sixth in importance for Rmax and Topt, respectively (Figs. S23, S26), consistent with previous findings. Vegetation in arid regions was typically water-limited, and precipitation, as its direct water source, played a crucial regulatory role in drought response (Li et al., 2022a). In contrast, in humid regions with sufficient water supply, vegetation responses to drought were primarily controlled by energy-related factors such as temperature and radiation (Liu et al., 2025). Across vegetation types, the dominant factors influencing the WUE–SPEI coupling were more clearly defined in Forest and Shrub, being temperature and surface soil moisture, respectively, which were closely related to their rooting patterns and drought-resistance strategies (Yang et al., 2025). In contrast, the dominant factors in Pasture and Cropland were more complex, likely resulting from vegetation structural diversity and intensive human interventions (Liu et al., 2018).
5.4 Limitations and future prospects
This study provides valuable insights into the dynamic coupling between WUE and meteorological drought; however, several limitations remain. Among various drought types, meteorological drought is the most prevalent, which is why SPEI was selected in this study (Zhou et al., 2024). Previous studies have demonstrated that other drought types are closely linked to meteorological drought, often triggered by precipitation anomalies and exhibiting certain lag effects; in contrast, heatwaves typically precede meteorological drought, indicating that heatwave-drought events evolve dynamically through a sequential triggering process (Yan et al., 2025a). Different drought types operate through distinct mechanisms and exert varying impacts on WUE. For example, soil drought is more directly associated with root-zone water availability for vegetation, whereas atmospheric drought affects WUE by regulating stomatal aperture. Furthermore, this study focuses solely on WUE at the ecosystem scale, while the coupling relationships between drought and WUE at the leaf and canopy scales remain unclear (Wang et al., 2026b). Therefore, future studies should further investigate the dynamic coupling between WUE across multiple scales and different types of heatwaves and droughts, as WUE at different scales responds differently across various stages of heatwave-drought propagation. The relatively short study period represents an additional limitation of this study. Although extending the analysis to more recent years would improve the timeliness and relevance of the results, such an extension was limited by the temporal coverage and consistency of available long-term GPP and ET datasets. Nevertheless, future studies should extend the analysis to more recent years as longer, more reliable, and temporally consistent datasets become available. Future research should also incorporate Coupled Model Intercomparison Project (CMIP) datasets to investigate projected changes in WUE-drought coupling and their driving mechanisms under different development scenarios. Such efforts will facilitate a more comprehensive understanding of vegetation responses to drought and provide a stronger theoretical foundation for evaluating carbon-water cycles under climate change.
Understanding the coupling relationship between WUE and drought is crucial for assessing the impact of drought on terrestrial ecosystem carbon-water cycles. To this end, we investigated the spatiotemporal patterns of the WUE-SPEI coupling relationship from 1982 to 2018 globally. Using the DGVMs, we separated the contributions of CO2 fertilization, CLI, and LCC to the changes in WUE-drought coupling relationship. Furthermore, the XGBoost combined with SHAP and PCMCI+ were employed to elucidate the mechanisms and influencing pathways of hydrothermal factors on the coupling relationship. Our key findings included the following:
-
Rmax decreased at a rate of −0.0003 yr−1 (p< 0.01), while Topt increased at a rate of 0.0155 month yr−1 (p< 0.01), indicating the buffer capacity of WUE against drought was enhanced. The rates of change in Rmax and Topt varied substantially across drought gradients and vegetation types. Rmax increased most rapidly in Shrub within AR at 0.0021 yr−1 (p< 0.01), whereas the largest decreases occurred in Shrub within SAR and Forest within SH, both at −0.0020 yr−1 (p< 0.01). Topt increased most rapidly in Pasture within AR at 0.1181 month yr−1 (p< 0.01), while it decreased most markedly in Forest within SAR at −0.0394 month yr−1 (p< 0.01).
-
CO2 fertilization was identified as the primary cause for the weakening of the coupling relationship. SMsurf was identified as the most critical driver, exhibiting nearly opposite effects and significant threshold effects on Rmax and Topt.
-
At the global scale, WS exhibited a direct negative causal relationship with Rmax, while Rad and WS had direct negative and positive causal effects on Topt, respectively. The complex causal networks under different vegetation types and drought gradients were also revealed.
Overall, our findings highlighted an enhanced resistance of WUE to drought, manifested as a reduced correlation and a delayed response time. Moreover, vegetation under different drought gradients gradually adjusted its water-use strategies to maintain WUE stability. These findings encourage a reassessment of the WUE–drought relationship, offering new insights to support the sustainable development of ecosystems under climate change.
The datasets that support the findings of this study are publicly available. The GLASS GPP dataset is available at https://glass.hku.hk/download.html (last access: 15 January 2025). The FluxCom Gpp dataset is available at http://fluxcom.org/CF-Download/ (last access: 15 January 2025). The NIRv Gpp dataset is at https://data.tpdc.ac.cn/zh-hans/data/d6dff40f-5dbd-4f2d-ac96-55827ab93cc5 (last access: 15 January 2025). The ERA5-Land ET dataset is available at https://cds.climate.copernicus.eu/datasets/reanalysis-era5-pressure-levels-monthly-means?tab=overview (last access: 15 January 2025). The GLASS ET dataset is available at https://glass.hku.hk/download.html (last access: 15 January 2025). The GLEAM ET is available at https://www.gleam.eu (last access: 3 October 2024; Miralles et al., 2011). CRU ts4.07 is available at https://crudata.uea.ac.uk/cru/data/hrg/cru_ts_4.07/ (last access: 15 January 2025). Collection of CRU JRA forcing datasets of gridded land surface blend of Climatic Research Unit (CRU) and Japanese reanalysis (JRA) data (CRU JAR) is available at https://data-search.nerc.ac.uk/geonetwork/srv/api/records/863a47a6d8414b6982e1396c69a9efe8 (last access: 15 January 2025). The HIstoric Land Dynamics Assessment+ (HILDA+) is available at https://doi.org/10.1594/PANGAEA.921846 (Winkler et al., 2020). Global Aridity Index and Potential Evapotranspiration (ET0) Database: Version 3 is available at https://figshare.com/articles/dataset/Global_Aridity_Index_and_Potential_Evapotranspiration_ET0_Climate_Database_v2/7504448/5 (last access: 15 January 2025); FLUXNET2015 Dataset is available at https://fluxnet.org/data/fluxnet2015-dataset/ (last access: 14 January 2025). Simulations from TRENDY land surface models are available on request to Stephen Sitch (s.a.sitch@exeter.ac.uk) and Pierre Friedlingstein (p.friedlingstein@exeter.ac.uk). Code will be made available on request.
The supplement related to this article is available online at https://doi.org/10.5194/hess-30-4985-2026-supplement.
Conceptualization and supervision: Z. W. and Y. L.; Design and methodology: Z. W., R. W., and Y. L.; Data analysis: Z. W., R. W., S. S., Z. Y., and W. Y.; Data curation: Z. W., Z. W., and H. S.; Writing-original draft preparation: Z. W. and Y. L.; Writing-review and editing: S. S. and W. Y.
The contact author has declared that none of the authors has any competing interests.
Publisher's note: Copernicus Publications remains neutral with regard to jurisdictional claims made in the text, published maps, institutional affiliations, or any other geographical representation in this paper. The authors bear the ultimate responsibility for providing appropriate place names. Views expressed in the text are those of the authors and do not necessarily reflect the views of the publisher.
We acknowledge for the data support from “Loess plateau science data center, National Earth System Science Data Sharing Infrastructure, National Science and Technology Infrastructure of China, National Tibetan Plateau Scientific Data Center”.
This work was supported by National Natural Science Foundation of China (grant no. 42477522), the Science and Technology Plan Project of the Tibet Autonomous Region (grant no. XZ202501ZY0045), the Inner Mongolia Autonomous Region Science and Technology Plan (grant no. 2025YFHH0224), and the Shanxi Key Laboratory of Earth Surface Processes and Resource Ecology Security in Fenhe River Basin (grant no. FHKF202402).
This paper was edited by Xing Yuan and reviewed by two anonymous referees.
Bastos, A., Ciais, P., Friedlingstein, P., Sitch, S., Pongratz, J., Fan, L., Wigneron, J. P., Weber, U., Reichstein, M., Fu, Z., Anthoni, P., Arneth, A., Haverd, V., Jain, A. K., Joetzjer, E., Knauer, J., Lienert, S., Loughran, T., McGuire, P. C., Tian, H., Viovy, N., and Zaehle, S.: Direct and seasonal legacy effects of the 2018 heat wave and drought on European ecosystem productivity, Science Advances, 6, https://doi.org/10.1126/sciadv.aba2724, 2020.
Beer, C., Ciais, P., Reichstein, M., Baldocchi, D., Law, B. E., Papale, D., Soussana, J.-F., Ammann, C., Buchmann, N., Frank, D., Gianelle, D., Janssens, I. A., Knohl, A., Köstner, B., Moors, E., Roupsard, O., Verbeeck, H., Vesala, T., Williams, C. A., and Wohlfahrt, G.: Temporal and among-site variability of inherent water use efficiency at the ecosystem level, Global Biogeochem. Cy., 23, https://doi.org/10.1029/2008GB003233, 2009.
Beguería, S., Vicente-Serrano, S. M., Reig, F., and Latorre, B.: Standardized precipitation evapotranspiration index (SPEI) revisited: parameter fitting, evapotranspiration models, tools, datasets and drought monitoring, Int. J. Climatol., 34, 3001–3023, https://doi.org/10.1002/joc.3887, 2014.
Boulton, C. A., Lenton, T. M., and Boers, N.: Pronounced loss of Amazon rainforest resilience since the early 2000s, Nat. Clim. Change, 12, 271–278, https://doi.org/10.1038/s41558-022-01287-8, 2022.
Chen, C., Park, T., Wang, X., Piao, S., Xu, B., Chaturvedi, R. K., Fuchs, R., Brovkin, V., Ciais, P., Fensholt, R., Tømmervik, H., Bala, G., Zhu, Z., Nemani, R. R., and Myneni, R. B.: China and India lead in greening of the world through land-use management, Nature Sustainability, 2, 122–129, https://doi.org/10.1038/s41893-019-0220-7, 2019.
Chen, T., Wang, Y., and Peng, L.: Advanced time-lagged effects of drought on global vegetation growth and its social risk in the 21st century, J. Environ. Manage., 347, 119253, https://doi.org/10.1016/j.jenvman.2023.119253, 2023.
Chen, Y., Qu, W., Zohner, C. M., Peñuelas, J., and Wu, C.: Increased artificial illumination delays urban autumnal foliar senescence, Nat. Commun., 17, 1526, https://doi.org/10.1038/s41467-025-68246-7, 2026.
De Keersmaecker, W., Lhermitte, S., Tits, L., Honnay, O., Somers, B., and Coppin, P.: A model quantifying global vegetation resistance and resilience to short-term climate anomalies and their relationship with vegetation cover, Global Ecol. Biogeogr., 24, 539–548, https://doi.org/10.1111/geb.12279, 2015.
Frank, D. C., Poulter, B., Saurer, M., Esper, J., Huntingford, C., Helle, G., Treydte, K., Zimmermann, N. E., Schleser, G. H., Ahlström, A., Ciais, P., Friedlingstein, P., Levis, S., Lomas, M., Sitch, S., Viovy, N., Andreu-Hayles, L., Bednarz, Z., Berninger, F., Boettger, T., D`Alessandro, C. M., Daux, V., Filot, M., Grabner, M., Gutierrez, E., Haupt, M., Hilasvuori, E., Jungner, H., Kalela-Brundin, M., Krapiec, M., Leuenberger, M., Loader, N. J., Marah, H., Masson-Delmotte, V., Pazdur, A., Pawelczyk, S., Pierre, M., Planells, O., Pukiene, R., Reynolds-Henne, C. E., Rinne, K. T., Saracino, A., Sonninen, E., Stievenard, M., Switsur, V. R., Szczepanek, M., Szychowska-Krapiec, E., Todaro, L., Waterhouse, J. S., and Weigl, M.: Water-use efficiency and transpiration across European forests during the Anthropocene, Nat. Clim. Change, 5, 579–583, https://doi.org/10.1038/nclimate2614, 2015.
Friedlingstein, P., O'Sullivan, M., Jones, M. W., Andrew, R. M., Bakker, D. C. E., Hauck, J., Landschützer, P., Le Quéré, C., Luijkx, I. T., Peters, G. P., Peters, W., Pongratz, J., Schwingshackl, C., Sitch, S., Canadell, J. G., Ciais, P., Jackson, R. B., Alin, S. R., Anthoni, P., Barbero, L., Bates, N. R., Becker, M., Bellouin, N., Decharme, B., Bopp, L., Brasika, I. B. M., Cadule, P., Chamberlain, M. A., Chandra, N., Chau, T.-T.-T., Chevallier, F., Chini, L. P., Cronin, M., Dou, X., Enyo, K., Evans, W., Falk, S., Feely, R. A., Feng, L., Ford, D. J., Gasser, T., Ghattas, J., Gkritzalis, T., Grassi, G., Gregor, L., Gruber, N., Gürses, Ö., Harris, I., Hefner, M., Heinke, J., Houghton, R. A., Hurtt, G. C., Iida, Y., Ilyina, T., Jacobson, A. R., Jain, A., Jarníková, T., Jersild, A., Jiang, F., Jin, Z., Joos, F., Kato, E., Keeling, R. F., Kennedy, D., Klein Goldewijk, K., Knauer, J., Korsbakken, J. I., Körtzinger, A., Lan, X., Lefèvre, N., Li, H., Liu, J., Liu, Z., Ma, L., Marland, G., Mayot, N., McGuire, P. C., McKinley, G. A., Meyer, G., Morgan, E. J., Munro, D. R., Nakaoka, S.-I., Niwa, Y., O'Brien, K. M., Olsen, A., Omar, A. M., Ono, T., Paulsen, M., Pierrot, D., Pocock, K., Poulter, B., Powis, C. M., Rehder, G., Resplandy, L., Robertson, E., Rödenbeck, C., Rosan, T. M., Schwinger, J., Séférian, R., Smallman, T. L., Smith, S. M., Sospedra-Alfonso, R., Sun, Q., Sutton, A. J., Sweeney, C., Takao, S., Tans, P. P., Tian, H., Tilbrook, B., Tsujino, H., Tubiello, F., van der Werf, G. R., van Ooijen, E., Wanninkhof, R., Watanabe, M., Wimart-Rousseau, C., Yang, D., Yang, X., Yuan, W., Yue, X., Zaehle, S., Zeng, J., and Zheng, B.: Global Carbon Budget 2023, Earth Syst. Sci. Data, 15, 5301–5369, https://doi.org/10.5194/essd-15-5301-2023, 2023.
Gentine, P., Green, J. K., Guérin, M., Humphrey, V., Seneviratne, S. I., Zhang, Y., and Zhou, S.: Coupling between the terrestrial carbon and water cycles – a review, Environ. Res. Lett., 14, 083003, https://doi.org/10.1088/1748-9326/ab22d6, 2019.
Gocic, M. and Trajkovic, S.: Analysis of changes in meteorological variables using Mann-Kendall and Sen's slope estimator statistical tests in Serbia, Global Planet. Change, 100, 172–182, https://doi.org/10.1016/j.gloplacha.2012.10.014, 2013.
Gray, S. B., Dermody, O., Klein, S. P., Locke, A. M., McGrath, J. M., Paul, R. E., Rosenthal, D. M., Ruiz-Vera, U. M., Siebers, M. H., Strellner, R., Ainsworth, E. A., Bernacchi, C. J., Long, S. P., Ort, D. R., and Leakey, A. D. B.: Intensifying drought eliminates the expected benefits of elevated carbon dioxide for soybean, Nat. Plants, 2, 16132, https://doi.org/10.1038/nplants.2016.132, 2016.
Guan, X., Li, Y., Chen, J. M., Ma, Y., and Shen, H.: A process model-guided transfer learning framework for mapping global gross primary production, Agr. Forest Meteorol., 372, 110678, https://doi.org/10.1016/j.agrformet.2025.110678, 2025.
Guo, X., Zhang, Z., Zhang, X., and Feng, S.: The inclusion of time-lag response reveals contrasting effects of meteorological and agricultural drought on agroecosystem water use efficiency in Africa, J. Hydrol., 664, 134346, https://doi.org/10.1016/j.jhydrol.2025.134346, 2026.
Huang, L., He, B., Han, L., Liu, J., Wang, H., and Chen, Z.: A global examination of the response of ecosystem water-use efficiency to drought based on MODIS data, Sci. Total Environ., 601–602, 1097–1107, https://doi.org/10.1016/j.scitotenv.2017.05.084, 2017.
Huang, M., Wang, X., Keenan, T. F., and Piao, S.: Drought timing influences the legacy of tree growth recovery, Glob. Change Biol., 24, 3546–3559, https://doi.org/10.1111/gcb.14294, 2018.
Huang, M., Zhai, P., and Piao, S.: Divergent responses of ecosystem water use efficiency to drought timing over Northern Eurasia, Environ. Res. Lett., 16, 045016, https://doi.org/10.1088/1748-9326/abf0d1, 2021.
Huxman, T. E., Smith, M. D., Fay, P. A., Knapp, A. K., Shaw, M. R., Loik, M. E., Smith, S. D., Tissue, D. T., Zak, J. C., Weltzin, J. F., Pockman, W. T., Sala, O. E., Haddad, B. M., Harte, J., Koch, G. W., Schwinning, S., Small, E. E., and Williams, D. G.: Convergence across biomes to a common rain-use efficiency, Nature, 429, 651–654, https://doi.org/10.1038/nature02561, 2004.
Jaramillo, F., Licero, L., Åhlen, I., Manzoni, S., Rodríguez-Rodríguez, J. A., Guittard, A., Hylin, A., Bolaños, J., Jawitz, J., Wdowinski, S., Martínez, O., and Espinosa, L. F.: Effects of Hydroclimatic Change and Rehabilitation Activities on Salinity and Mangroves in the Ciénaga Grande de Santa Marta, Colombia, Wetlands, 38, 755–767, https://doi.org/10.1007/s13157-018-1024-7, 2018.
Jiao, W., Wang, L., Smith, W. K., Chang, Q., Wang, H., and D'Odorico, P.: Observed increasing water constraint on vegetation growth over the last three decades, Nat. Commun., 12, 3777, https://doi.org/10.1038/s41467-021-24016-9, 2021.
Kannenberg, S. A., Schwalm, C. R., and Anderegg, W. R. L.: Ghosts of the past: how drought legacy effects shape forest functioning and carbon cycling, Ecol. Lett., 23, 891–901, https://doi.org/10.1111/ele.13485, 2020.
Keenan, T. F., Hollinger, D. Y., Bohrer, G., Dragoni, D., Munger, J. W., Schmid, H. P., and Richardson, A. D.: Increase in forest water-use efficiency as atmospheric carbon dioxide concentrations rise, Nature, 499, 324–327, https://doi.org/10.1038/nature12291, 2013.
Kellner, J., Houska, T., Manderscheid, R., Weigel, H. J., Breuer, L., and Kraft, P.: Response of maize biomass and soil water fluxes on elevated CO2 and drought-From field experiments to process-based simulations, Glob. Change Biol., 25, 2947–2957, https://doi.org/10.1111/gcb.14723, 2019.
Klein, T., Cohen, S., and Yakir, D.: Hydraulic adjustments underlying drought resistance of Pinus halepensis, Tree Physiol., 31, 637–648, https://doi.org/10.1093/treephys/tpr047, 2011.
Knapp, A. K., Condon, K. V., Folks, C. C., Sturchio, M. A., Griffin-Nolan, R. J., Kannenberg, S. A., Gill, A. S., Hajek, O. L., Siggers, J. A., and Smith, M. D.: Field experiments have enhanced our understanding of drought impacts on terrestrial ecosystems – But where do we go from here?, Funct. Ecol., 38, 76–97, https://doi.org/10.1111/1365-2435.14460, 2024.
Knauer, J., Zaehle, S., Medlyn, B. E., Reichstein, M., Williams, C. A., Migliavacca, M., De Kauwe, M. G., Werner, C., Keitel, C., Kolari, P., Limousin, J.-M., and Linderson, M.-L.: Towards physiologically meaningful water-use efficiency estimates from eddy covariance data, Glob. Change Biol., 24, 694–710, https://doi.org/10.1111/gcb.13893, 2018.
Li, D., An, L., Zhong, S., Shen, L., and Wu, S.: Declining coupling between vegetation and drought over the past three decades, Glob. Change Biol., 30, https://doi.org/10.1111/gcb.17141, 2024.
Li, F., Xin, Q., Yi, C., Kannenberg, S. A., Green, J. K., Migliavacca, M., Moore, D. J. P., Kemanian, A. R., Gentine, P., Stoy, P. C., Zhang, F., Xiong, Y., and Fu, Z.: Limited Regulation of Canopy Water Use Efficiency by Stomatal Behavior Under Drought Propagation, Glob. Change Biol., 31, https://doi.org/10.1111/gcb.70381, 2025.
Li, F., Xin, Q., Green, J. K., Yi, C., Kemanian, A. R., Kannenberg, S. A., Stoy, P. C., Yang, Y., Lei, H., Xiong, Y., and Fu, Z.: Event-Specific Meteorological Drivers Shape Diverse Water-Use Efficiency Trajectories Under Drought Propagation, Glob. Change Biol., 32, https://doi.org/10.1111/gcb.70690, 2026.
Li, W., Migliavacca, M., Forkel, M., Denissen, J. M. C., Reichstein, M., Yang, H., Duveiller, G., Weber, U., and Orth, R.: Widespread increasing vegetation sensitivity to soil moisture, Nat. Commun., 13, 3959, https://doi.org/10.1038/s41467-022-31667-9, 2022a.
Li, X. Y., Zou, L., Xia, J., Dou, M., Li, H. W., and Song, Z. H.: Untangling the effects of climate change and land use/cover change on spatiotemporal variation of evapotranspiration over China, J. Hydrol., 612, https://doi.org/10.1016/j.jhydrol.2022.128189, 2022b.
Liu, D., Yu, C., and Zhao, F.: Response of the water use efficiency of natural vegetation to drought in Northeast China, J. Geogr. Sci., 28, 611–628, https://doi.org/10.1007/s11442-018-1494-9, 2018.
Liu, J., Wang, Q., Zhan, W., Lian, X., and Gentine, P.: When and where soil dryness matters to ecosystem photosynthesis, Nat. Plants, 11, 1390–1400, https://doi.org/10.1038/s41477-025-02024-7, 2025.
Liu, L., Gudmundsson, L., Hauser, M., Qin, D.-h., Li, S., and Seneviratne, S. I.: Soil moisture dominates dryness stress on ecosystem production globally, Nat. Commun., 11, 4892, https://doi.org/10.1038/s41467-020-18631-1, 2020.
Lu, X. and Zhuang, Q.: Evaluating evapotranspiration and water-use efficiency of terrestrial ecosystems in the conterminous United States using MODIS and AmeriFlux data, Remote Sens. Environ., 114, 1924–1939, https://doi.org/10.1016/j.rse.2010.04.001, 2010.
Ma, F. and Yuan, X.: Vegetation Greening and Climate Warming Increased the Propagation Risk From Meteorological Drought to Soil Drought at Subseasonal Timescales, Geophys. Res. Lett., 51, https://doi.org/10.1029/2023GL107937, 2024.
Ma, J., Jia, X., Zha, T., Bourque, C. P. A., Tian, Y., Bai, Y., Liu, P., Yang, R., Li, C., Li, C., Xie, J., Yu, H., Zhang, F., and Zhou, C.: Ecosystem water use efficiency in a young plantation in Northern China and its relationship to drought, Agr. Forest Meteorol., 275, 1–10, https://doi.org/10.1016/j.agrformet.2019.05.004, 2019.
Ma, W., Li, G., Wu, J., Xu, G., and Wu, J.: Response of soil labile organic carbon fractions and carbon-cycle enzyme activities to vegetation degradation in a wet meadow on the Qinghai–Tibet Plateau, Geoderma, 377, 114565, https://doi.org/10.1016/j.geoderma.2020.114565, 2020.
Martínez-Vilalta, J., Poyatos, R., Aguadé, D., Retana, J., and Mencuccini, M.: A new look at water transport regulation in plants, New Phytol., 204, 105–115, 10.1111/nph.12912, 2014.
Maurer, G. E., Hallmark, A. J., Brown, R. F., Sala, O. E., and Collins, S. L.: Sensitivity of primary production to precipitation across the United States, Ecol. Lett., 23, 527–536, https://doi.org/10.1111/ele.13455, 2020.
Miguez-Macho, G. and Fan, Y.: The role of groundwater in the Amazon water cycle: 1. Influence on seasonal streamflow, flooding and wetlands, J. Geophys. Res.-Atmos., 117, https://doi.org/10.1029/2012JD017539, 2012.
Miller, D. L., Wolf, S., Fisher, J. B., Zaitchik, B. F., Xiao, J., and Keenan, T. F.: Increased photosynthesis during spring drought in energy-limited ecosystems, Nat. Commun., 14, 7828, https://doi.org/10.1038/s41467-023-43430-9, 2023.
Miralles, D. G., Holmes, T. R. H., De Jeu, R. A. M., Gash, J. H., Meesters, A. G. C. A., and Dolman, A. J.: Global land-surface evaporation estimated from satellite-based observations, Hydrol. Earth Syst. Sci., 15, 453–469, https://doi.org/10.5194/hess-15-453-2011, 2011.
Mokhtar, A., Jalali, M., He, H., Al-Ansari, N., Elbeltagi, A., Alsafadi, K., Abdo, H. G., Sammen, S. S., Gyasi-Agyei, Y., and Rodrigo-Comino, J.: Estimation of SPEI Meteorological Drought Using Machine Learning Algorithms, IEEE Access, 9, 65503–65523, 2021.
Novick, K. A., Ficklin, D. L., Stoy, P. C., Williams, C. A., Bohrer, G., Oishi, A. C., Papuga, S. A., Blanken, P. D., Noormets, A., Sulman, B. N., Scott, R. L., Wang, L., and Phillips, R. P.: The increasing importance of atmospheric demand for ecosystem water and carbon fluxes, Nat. Clim. Change, 6, 1023–1027, https://doi.org/10.1038/nclimate3114, 2016.
Peters, W., van der Velde, I. R., van Schaik, E., Miller, J. B., Ciais, P., Duarte, H. F., van der Laan-Luijkx, I. T., van der Molen, M. K., Scholze, M., Schaefer, K., Vidale, P. L., Verhoef, A., Wårlind, D., Zhu, D., Tans, P. P., Vaughn, B., and White, J. W. C.: Increased water-use efficiency and reduced CO2 uptake by plants during droughts at a continental scale, Nat. Geosci., 11, 744–748, https://doi.org/10.1038/s41561-018-0212-7, 2018.
Piao, S., Wang, X., Park, T., Chen, C., Lian, X., He, Y., Bjerke, J. W., Chen, A., Ciais, P., Tømmervik, H., Nemani, R. R., and Myneni, R. B.: Characteristics, drivers and feedbacks of global greening, Nat. Rev. Earth Environ., 1, 14–27, https://doi.org/10.1038/s43017-019-0001-x, 2020.
Poppe Terán, C., Naz, B. S., Graf, A., Qu, Y., Hendricks Franssen, H.-J., Baatz, R., Ciais, P., and Vereecken, H.: Rising water-use efficiency in European grasslands is driven by increased primary production, Commun. Earth Environ., 4, 95, https://doi.org/10.1038/s43247-023-00757-x, 2023.
Reichstein, M., Bahn, M., Ciais, P., Frank, D., Mahecha, M. D., Seneviratne, S. I., Zscheischler, J., Beer, C., Buchmann, N., Frank, D. C., Papale, D., Rammig, A., Smith, P., Thonicke, K., van der Velde, M., Vicca, S., Walz, A., and Wattenbach, M.: Climate extremes and the carbon cycle, Nature, 500, 287–295, https://doi.org/10.1038/nature12350, 2013.
Runge, J.: Discovering contemporaneous and lagged causal relations in autocorrelated nonlinear time series datasets, in: Proceedings of the 36th Conference on Uncertainty in Artificial Intelligence (UAI), PMLR, 124, 1388–1397, ISSN: 2640-3498, 2020.
Runge, J., Bathiany, S., Bollt, E., Camps-Valls, G., Coumou, D., Deyle, E., Glymour, C., Kretschmer, M., Mahecha, M. D., Muñoz-Marí, J., van Nes, E. H., Peters, J., Quax, R., Reichstein, M., Scheffer, M., Schölkopf, B., Spirtes, P., Sugihara, G., Sun, J., Zhang, K., and Zscheischler, J.: Inferring causation from time series in Earth system sciences, Nat. Commun., 10, 2553, https://doi.org/10.1038/s41467-019-10105-3, 2019.
Seddon, A. W. R., Macias-Fauria, M., Long, P. R., Benz, D., and Willis, K. J.: Sensitivity of global terrestrial ecosystems to climate variability, Nature, 531, 229–232, https://doi.org/10.1038/nature16986, 2016.
Smith, T. and Boers, N.: Global vegetation resilience linked to water availability and variability, Nat. Commun., 14, 498, https://doi.org/10.1038/s41467-023-36207-7, 2023.
Tang, J., Niu, B., Hu, Z., and Zhang, X.: Increasing susceptibility and shortening response time of vegetation productivity to drought from 2001 to 2021, Agr. Forest Meteorol., 352, 110025, https://doi.org/10.1016/j.agrformet.2024.110025, 2024.
Trenberth, K. E., Dai, A., van der Schrier, G., Jones, P. D., Barichivich, J., Briffa, K. R., and Sheffield, J.: Global warming and changes in drought, Nat. Clim. Change, 4, 17–22, https://doi.org/10.1038/nclimate2067, 2014.
Vicente-Serrano, S. M., Beguería, S., and López-Moreno, J. I.: A Multiscalar Drought Index Sensitive to Global Warming: The Standardized Precipitation Evapotranspiration Index, J. Climate, 23, 1696–1718, 2010.
Vicente-Serrano, S. M., Beguería, S., Lorenzo-Lacruz, J., Camarero, J. J., López-Moreno, J. I., Azorin-Molina, C., Revuelto, J., Morán-Tejeda, E., and Sanchez-Lorenzo, A.: Performance of Drought Indices for Ecological, Agricultural, and Hydrological Applications, Earth Interact., 16, 1–27, https://doi.org/10.1175/2012EI000434.1, 2012.
Vicente-Serrano, S. M., Gouveia, C. M., Camarero, J. J., Beguería, S., Trigo, R. M., López-Moreno, J. I., Azorín-Molina, C., Pasho, E., Lorenzo-Lacruz, J., Revuelto, J., Morán-Tejeda, E., and Sanchez-Lorenzo, A.: Response of vegetation to drought time-scales across global land biomes, P. Natl. Acad. Sci. USA, 110, 52–57, https://doi.org/10.1073/pnas.1207068110, 2013.
Walther, S., Duveiller, G., Jung, M., Guanter, L., Cescatti, A., and Camps-Valls, G.: Satellite Observations of the Contrasting Response of Trees and Grasses to Variations in Water Availability, Geophys. Res. Lett., 46, 1429–1440, https://doi.org/10.1029/2018GL080535, 2019.
Wang, C., Min, L., Zhang, J., Li, Y., Liu, X., Lü, Y., Feng, X., and Fu, B.: Vegetation restoration dominates increase in water use efficiency in drylands of China, Ecol. Indic., 145, 109703, https://doi.org/10.1016/j.ecolind.2022.109703, 2022.
Wang, M., Ding, Z., Wu, C., Song, L., Ma, M., Yu, P., Lu, B., and Tang, X.: Divergent responses of ecosystem water-use efficiency to extreme seasonal droughts in Southwest China, Sci. Total Environ., 760, 143427, https://doi.org/10.1016/j.scitotenv.2020.143427, 2021.
Wang, X., Fu, Z., Ciais, P., Peñuelas, J., Xiao, J., Li, X., Luo, X., Chen, C., Xia, H., Zhou, T., Stoy, P. C., Green, J. K., and Zhang, F.: Multi-satellite derived data reveals spatiotemporal dynamics of carbon-water coupling and its drivers in tropical ecosystems, Remote Sens. Environ., 334, 115242, https://doi.org/10.1016/j.rse.2026.115242, 2026a.
Wang, X., Fu, Z., Ciais, P., Wang, L., Buchmann, N., Keenan, T. F., De Kauwe, M., Peñuelas, J., Chen, G., Gong, X., Xiao, J., Li, X., Xie, Q., Stoy, P. C., Makowski, D., Smith, W. K., Wang, H., Wang, S., Zhang, F., and Niu, S.: Global distribution and changes of leaf-level intrinsic water use efficiency and their responses to water stress, Nat. Commun., 17, 1530, https://doi.org/10.1038/s41467-025-68252-9, 2026b.
Wang, Z., Fu, B., Wu, X., Li, Y., Feng, Y., Wang, S., Wei, F., and Zhang, L.: Vegetation resilience does not increase consistently with greening in China's Loess Plateau, Commun. Earth Environ., 4, 336, https://doi.org/10.1038/s43247-023-01000-3, 2023.
Wang, Z., Wu, R., Li, J., Liu, Y., Cui, C., and Liu, J.: Discriminating the impact of soil moisture and vapor pressure deficit on vegetation greening over multiple time scales, Global Planet. Change, 255, 105111, https://doi.org/10.1016/j.gloplacha.2025.105111, 2025.
Wilson, K. B., Carlson, T. N., and Bunce, J. A.: Feedback significantly influences the simulated effect of CO2 on seasonal evapotranspiration from two agricultural species, Glob. Change Biol., 5, 903–917, https://doi.org/10.1046/j.1365-2486.1999.00280.x, 1999.
Winkler, K., Fuchs, R., Rounsevell, M. D. A., Herold, M.: HILDA+ Global Land Use Change between 1960 and 2019, PANGAEA [data set], https://doi.org/10.1594/PANGAEA.921846, 2020.
Winkler, K., Fuchs, R., Rounsevell, M., and Herold, M.: Global land use changes are four times greater than previously estimated, Nat. Commun., 12, 2501, https://doi.org/10.1038/s41467-021-22702-2, 2021.
Wu, R., Wang, Z., Meng, F., Liu, Y., and Shi, H.: Strengthening Coupling Between Vegetation and Soil-Atmosphere Compound Drought Over the Past Two Decades, Earth's Future, 13, https://doi.org/10.1029/2025EF006311, 2025.
Xing, Y., Wang, S., Wang, A., and Wang, D.: Spatiotemporal dynamics of meteorological and groundwater droughts in Southwest China and their cumulative and lagged impacts on vegetation, J. Hydrol., 669, 135086, https://doi.org/10.1016/j.jhydrol.2026.135086, 2026.
Xue, Y., Liang, H., Zhang, B., and He, C.: Vegetation restoration dominated the variation of water use efficiency in China, J. Hydrol., 612, 128257, https://doi.org/10.1016/j.jhydrol.2022.128257, 2022.
Yan, W., Zhou, J., Lin, H., Luo, J., Duan, X., and Wu, R.: Drivers of the pre-season drought thresholds triggering earlier autumn foliar senescence in the Northern Hemisphere, Nat. Commun., 16, 7568, https://doi.org/10.1038/s41467-025-62847-y, 2025a.
Yan, Y., Li, B., Dechant, B., Xu, M., Luo, X., Qu, S., Miao, G., Leng, J., Shang, R., Shu, L., Jiang, C., Wang, H., Jeong, S., Ryu, Y., and Chen, J. M.: Plant traits shape global spatiotemporal variations in photosynthetic efficiency, Nat. Plants, 11, 924–934, https://doi.org/10.1038/s41477-025-01958-2, 2025b.
Yang, S., Zhang, J., Han, J., Bai, Y., Xun, L., Zhang, S., Cao, D., and Wang, J.: The ratio of transpiration to evapotranspiration dominates ecosystem water use efficiency response to drought, Agr. Forest Meteorol., 363, 110423, https://doi.org/10.1016/j.agrformet.2025.110423, 2025.
Yang, Y., Guan, H., Batelaan, O., McVicar, T. R., Long, D., Piao, S., Liang, W., Liu, B., Jin, Z., and Simmons, C. T.: Contrasting responses of water use efficiency to drought across global terrestrial ecosystems, Sci. Rep., 6, 23284, https://doi.org/10.1038/srep23284, 2016.
Yuan, B., Guo, S., Zhang, X., Mu, H., Cao, S., Xia, Z., Pan, X., and Du, P.: Quantifying the drought sensitivity of vegetation types in northern China from 1982 to 2022, Agr. Forest Meteorol., 359, 110293, https://doi.org/10.1016/j.agrformet.2024.110293, 2024.
Zeng, X., Hu, Z., Chen, A., Yuan, W., Hou, G., Han, D., Liang, M., Di, K., Cao, R., and Luo, D.: The global decline in the sensitivity of vegetation productivity to precipitation from 2001 to 2018, Glob. Change Biol., 28, 6823–6833, https://doi.org/10.1111/gcb.16403, 2022.
Zhang, H., Zhang, Y., Miralles, D. G., Tai, X., Koppa, A., Yang, H., Sitch, S., and O'Sullivan, M.: Increase in plant reliance on past precipitation associated with greening and drying, Nat. Ecol. Evol., https://doi.org/10.1038/s41559-026-02997-4, 2026.
Zhou, Z., Shi, H., Fu, Q., Ding, Y., Li, T., Wang, Y., and Liu, S.: Characteristics of Propagation From Meteorological Drought to Hydrological Drought in the Pearl River Basin, J. Geophys. Res.-Atmos., 126, https://doi.org/10.1029/2020JD033959, 2021.
Zhou, Z., Wang, P., Li, L., Fu, Q., Ding, Y., Chen, P., Xue, P., Wang, T., and Shi, H.: Recent development on drought propagation: A comprehensive review, J. Hydrol., 645, 132196, https://doi.org/10.1016/j.jhydrol.2024.132196, 2024.