
the Creative Commons Attribution 4.0 License.
the Creative Commons Attribution 4.0 License.
 | 08 Jul 2026
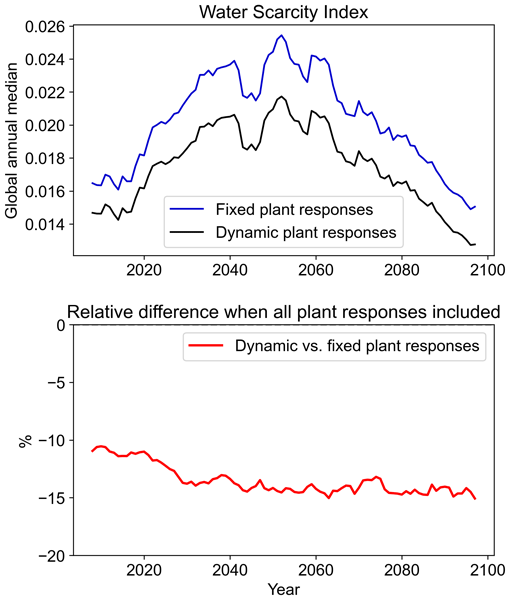
Future global water scarcity partially moderated by vegetation responses to rising CO2
Jessica Stacey
Richard A. Betts
Andrew Hartley
Lina M. Mercado
Nicola Gedney
Most studies of future water scarcity rely on hydrological models that often neglect the effects of plant physiological responses to rising CO2, such as reduced stomatal opening, which can decrease transpiration and enhance water availability over large scales. To evaluate how such vegetation responses to rising CO2 and subsequent climate change affect water scarcity in typical impact studies, we replicate their experimental design by driving an offline land surface model with Earth system model output. Under a high-emission climate scenario, our simulations suggest that water scarcity is projected to worsen in many regions. However, combined vegetation stomatal and structural responses increase overall water supply and partially alleviate water scarcity in most regions, mainly because of CO2-induced reduced stomatal opening. In contrast, CO2-driven increases in vegetation cover and leaf area exacerbate water scarcity in certain regions, particularly arid and already water-scarce areas. For the period 2076–2095, incorporating all vegetation structural and stomatal responses to CO2 and climate change reduces global median Water Scarcity Index (WSI) by 12 %. Across 291 river basins, substantially more show reductions than increases in median WSI; decreases of 10 %–70 % occur in 139 basins, representing 80 % of the global population, and increases of 10 %–60 % occur in 11 basins, representing 0.2 % of the population. Overall, these findings highlight the importance of considering vegetation stomatal and structural responses to rising CO2 in water scarcity assessments.
- Article
(7211 KB) - Full-text XML
-
Supplement
(1564 KB) - BibTeX
- EndNote


Throughout this manuscript, we use the following terminology.
-
Stomatal (physiological) response: Changes in plant water-use efficiency due to adjustments in stomatal aperture.
-
Vegetation structural response: Changes in vegetation structure, including leaf area and canopy coverage.
Accurately predicting future water scarcity, where water demand exceeds available supply, remains a complex but vital task for informing long-term adaptation strategies (Caretta et al., 2022). Current impact studies on future water scarcity are typically based on output from hydrological models driven by climate model outputs (e.g., Dolan et al., 2021; Gosling and Arnell, 2016; Greve et al., 2018; Haddeland et al., 2014). While hydrological models are powerful tools for understanding, managing, and planning water resources, they often lack a representation of vegetation response to rising levels of CO2 and subsequent climate change. In this study, we investigate the influence that these vegetation responses have on water scarcity projections.
Water scarcity is a complex and multifaceted issue influenced by water availability, demand, and quality. Nearly half of the global population already faces severe water scarcity at some point each year, and as both population and consumption rates rise, water demand is escalating (Caretta et al., 2022; Ripple et al., 2017). Water availability, crucial for meeting this rising demand, depends on the balance between land precipitation and evapotranspiration, both of which are strongly affected by human activities, including climate change. Climate change is altering precipitation patterns and near-surface meteorological conditions, driving more frequent hydrological extremes and higher evaporative demand (Seneviratne et al., 2021). Human interventions – such as groundwater over-abstraction, dam construction, and water diversion – further disrupt water supply, while pollution threatens the availability of clean water. Many future water scarcity projections rely on standalone hydrological models driven by global climate model outputs (e.g., Dolan et al., 2021; Gosling and Arnell, 2016; Greve et al., 2018; Haddeland et al., 2014; Schewe et al., 2013). These studies generally project worsening water scarcity in many regions due to both climate change and rising demand, with the most affected areas including parts of northern and southern Africa, south and southeast Asia, Australia, parts of Europe, the Middle East and the western United States. However, these hydrological models often do not account for vegetation responses to rising atmospheric CO2 and climate change.
Vegetation plays a crucial role within the global water cycle and thus impacts water availability for humans. Large-scale changes in vegetation type and coverage are already occurring due to climate change and human activities, such as deforestation. Vegetation plays a key role in precipitation generation, with approximately 60 % of terrestrial precipitation originating from land via evapotranspiration – primarily through plant transpiration (Schneider et al., 2017; Wei et al., 2017). Vegetation also influences other hydrological processes, including infiltration, interception, and runoff (Caretta et al., 2022). Climate change continues to alter vegetation types and coverage globally, with increased vegetation growth in many regions (Xu et al., 2017; Yu et al., 2018; Zhu et al., 2016), but greater plant stress and mortality due to droughts and heatwaves in others (Parmesan et al., 2022).
Rising atmospheric CO2 also impact the water cycle by altering plant physiology. Plants continuously adjust the widths of their stomatal openings to maximise photosynthesis while minimising water loss (Cowan, 1978). Under higher atmospheric CO2, plants typically reduce their stomatal openings, as they can maintain higher rates of photosynthesis at increased leaf-level water-use efficiency, thereby decreasing transpiration (Battipaglia et al., 2013; Field et al., 1995; Norby and Zak, 2011). As less water is lost through transpiration, more water remains in the soil and at the surface, contributing to increased runoff and soil moisture levels (Fowler et al., 2019; Gedney et al., 2006). However, higher CO2 generally enhances photosynthesis, known as the CO2 fertilisation effect, which promotes vegetation growth. This expansion in leaf area can increase canopy transpiration through a greater number of stomata, even though stomatal openings are individually reduced (Betts et al., 1997). At the canopy-scale, the resulting increase in vegetation water demand can offset, or even reverse, the runoff increases associated with reduced stomatal openings (Cowling and Field, 2003; Piao et al., 2007; Ukkola et al., 2016). The net effect on canopy transpiration thus depends on the balance between reduced stomatal openings and increased vegetation growth, which varies among plant species and climatic biomes (Norby and Zak, 2011).
Better understanding of vegetation-water-atmosphere interactions, in both historical observations and under future climate change scenarios (e.g., Betts et al., 2007; Gedney et al., 2006) has been made possible with the introduction of Land Surface Models (LSMs). LSMs simulate complex interactions between the atmosphere, land surface, and sub-surface, including energy and water fluxes, carbon cycling, and soil processes. Dynamic vegetation schemes in LSMs have been made increasingly realistic over the past few decades (Fisher and Koven, 2020). They typically simulate vegetation coverage, canopy height and leaf area index for a limited number of generalised plant functional types, driven by carbon fluxes and vegetation competition. Including dynamic vegetation in climate models is essential for capturing critical changes in land surface and plant physiology that influence the climate system and hydrological cycle. Yet these schemes are still absent from many hydrological models.
Advances in LSMs have improved understanding of how plant stomatal and structural responses to rising CO2 impact the water cycle. An early study by Wigley and Jones (1985) was one of the first to link CO2-driven changes in plant evapotranspiration (ET) to runoff. As land surface and climate models have advanced, effects of CO2-induced vegetation growth on the water cycle have also been analysed alongside stomatal closure. Betts et al. (1997) projected that increased vegetation cover could partially offset the projected reduction in ET due to increased stomatal closure. Gedney et al. (2006) attributed rising historical continental river runoff records to CO2-induced stomatal closure. However, Piao et al. (2007) suggested that when CO2-induced leaf area increases were also considered global runoff reduced from 1901 to 1999. Subsequent modelling studies have also concluded that CO2-induced stomatal closure and leaf area increases together generally increase projected global runoff in the current generation of models. For instance, doubling CO2 in climate models led to global mean runoff increases of 6 % (Betts et al., 2007) and 8 %–9 % (Cao et al., 2010) relative to preindustrial levels; increases that are comparable to that simulated in response to radiatively forced climate change in both studies. Stomatal and structural responses to rising CO2 affect the water cycle differently around the globe. Across much of the globe, CO2-induced stomatal closure is projected to increase runoff and streamflow, especially in the tropics (Davie et al., 2013; Fowler et al., 2019; Lemordant et al., 2018; Yang et al., 2019), thereby reducing drought severity (Swann et al., 2016) but increasing flood risk (Kooperman et al., 2018). Conversely, studies have suggested that CO2-induced vegetation structural responses exacerbate drying in more arid locations, including the mid-latitudes, in modelling projections (Fowler et al., 2019; Lemordant et al., 2018; Mankin et al., 2019) and observations (Ukkola et al., 2016). Moreover, observed streamflow shows limited sensitivity to the stomatal and structural responses to increased CO2 (Wei et al., 2024). However, at the global scale, studies typically suggest that CO2-induced stomatal responses have a greater influence on runoff and streamflow than CO2-induced vegetation structural responses, particularly in future climate projections (e.g., Betts et al., 2007; Cao et al., 2010; Lemordant et al., 2018).
Only a limited number of studies have investigated how CO2-induced stomatal and structural responses affect water scarcity metrics. Wiltshire et al. (2013a, b) suggested that including this response could reduce the global population living under high water stress by approximately 200 million by 2100. Furthermore, a multi-model assessment by Wang and Sun (2023) found that vegetation–CO2 feedbacks introduce systematic biases in projected extreme drought frequency, leading to underestimations of exposed population (5.25 %) and GDP (6.07 %) in the 2030s, but overestimations of ∼ 3–9 % for population and ∼ 3–7 % for GDP by the 2050s. Together, these findings highlight the important influence of CO2-induced vegetation responses on the socioeconomic impacts of water scarcity.
This study is the first to quantify these influences by replicating the design of typical hydrological impact studies – running a standalone impact model driven by climate model output – and adjusting the different vegetation responses to rising CO2 and climate change. This approach allows us to estimate how incorporating these vegetation responses alters estimates of water scarcity in conventional impact studies.
2.1 Experimental design
The experimental setup is designed to replicate the framework commonly used in water-related impact studies, in which a hydrological model is run standalone and driven by climate model output. This framework is widely adopted because it is much more computationally efficient than running fully coupled Earth System Models, enabling higher resolution simulations and experiments in which specific processes can be systematically switched on and off. We apply this framework using the Joint UK Land Environment Simulator (JULES; Best et al., 2011; Clark et al., 2011), which includes both a global hydrological cycle and a dynamic vegetation scheme (Cox, 2001), allowing us to isolate vegetation stomatal and structural responses to rising CO2 and climate change and assess their influence on water scarcity projections. However, running models offline can introduce inconsistencies with the driving climate model, as discussed in Sect. 4.
For this study, JULES has been driven by the bias-adjusted (following Lange, 2019) Earth system climate model HadGEM2-ES (Hadley Centre Global Environment Model version 2; Jones et al., 2011) resampled to 0.5° × 0.5° horizontal resolution as part of the bias correction. We use the historic simulation from 1861 to 2005 and the “future” period 2006 to 2100 using Representative Concentration Pathway (RCP) 6.0. The earth system configuration JULES-ES is used following the setup for the Inter-Sectoral Impact Model Intercomparison Project (ISIMIP; https://www.isimip.org/, last access: 2 June 2026) version 2b; details of the setup can be found in Mathison et al. (2023).
Four JULES simulations were performed by selectively fixing or allowing variation in the following two components:
-
Atmospheric CO2: Fixed (in JULES only) to 277ppm to represent preindustrial levels following protocol of the TRENDY project (Sitch et al., 2024).
-
Vegetation structure: The spatial and temporal vegetation distribution, including Leaf Area Index (LAI; the ratio of leaf to ground area), fixed in JULES to its initial state.
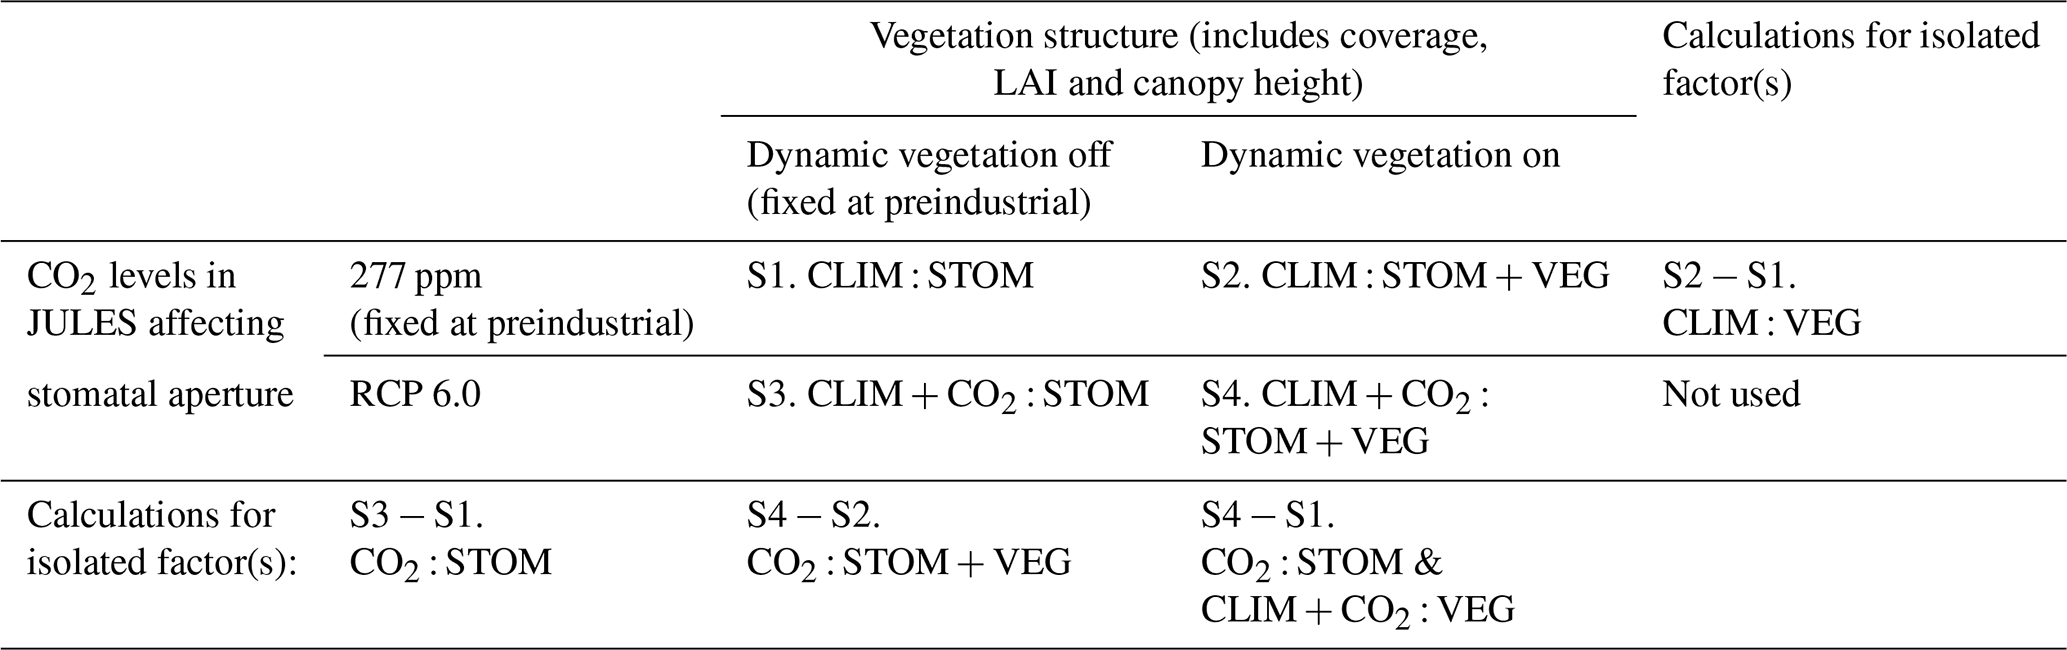
Simulations follow the naming convention < forcing > : < response >, where CLIM denotes climate changes, CO2 atmospheric CO2 changes, STOM stomatal responses, and VEG vegetation cover and leaf area responses (Table 1; see Table A1 in the Appendix for full details). S1 (CLIM : STOM) includes climate-driven stomatal responses only and is the closest to representing a typical offline hydrological model configuration. S2 (CLIM : STOM + VEG) additionally includes climate-driven vegetation structural responses. S3 (CLIM + CO2 : STOM) includes both climate- and CO2-driven stomatal responses, while S4 (CLIM + CO2 : STOM + VEG) includes all climate- and CO2-driven stomatal and structural responses, approximating a fully coupled Earth system model.
Table 1Details of vegetation responses included in each of the simulations and simulation combinations.
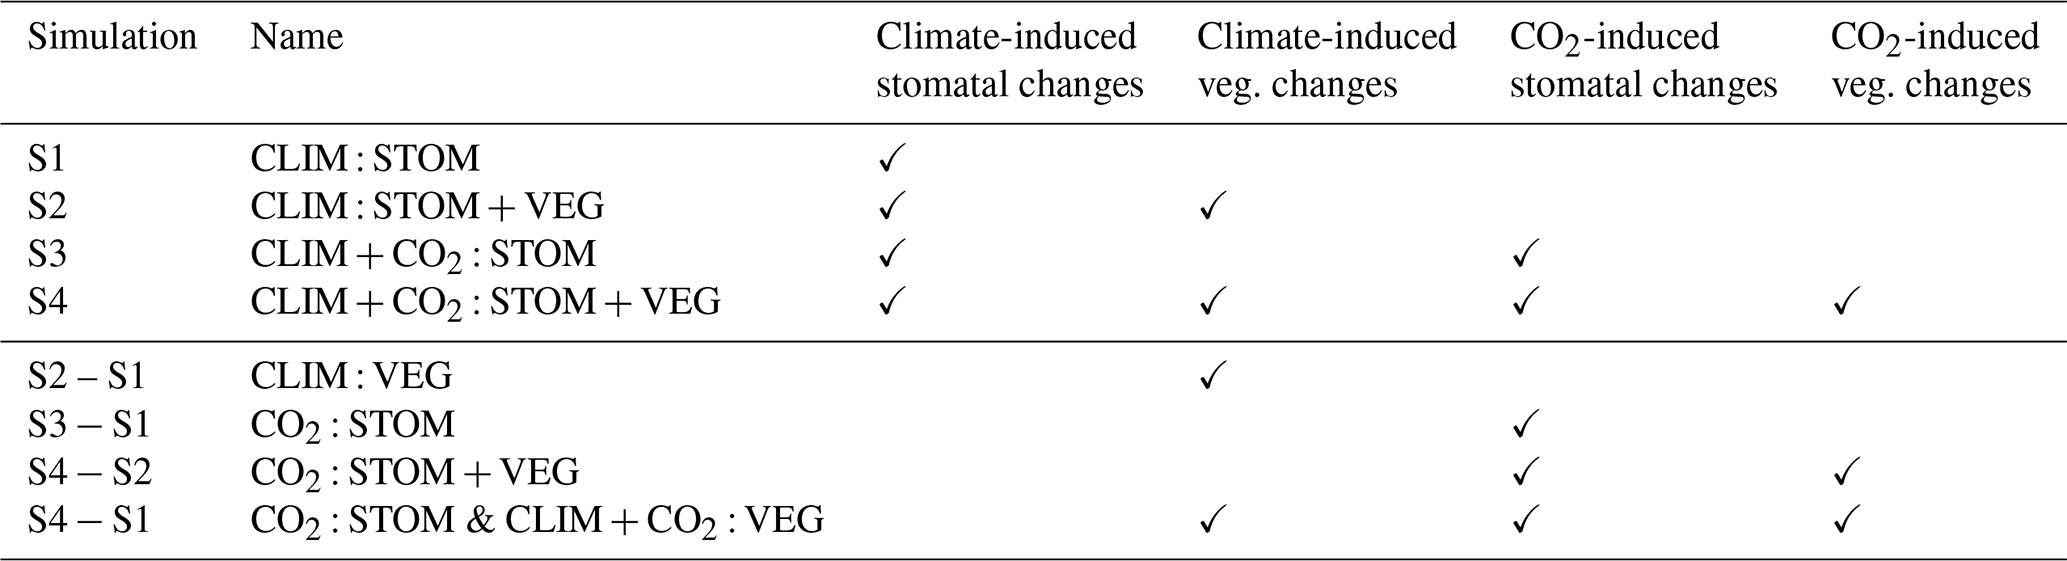
From these four simulations, the different vegetation responses are diagnosed by calculating the differences between simulations. CLIM : VEG (S2 − S1) represents climate-induced structural vegetation response, CO2 : STOM (S3 − S1) represents CO2-induced stomatal response, CO2 : STOM + VEG (S4 − S2) represents CO2-induced stomatal and structural responses, and CO2 : STOM & CLIM + CO2 : VEG (S4 − S1) represents the total of CO2-induced stomatal response plus climate- and CO2-induced vegetation structural responses. The final factor (S4 − S1) represents the difference between a typical hydrological impact study and fully coupled Earth system model. Relative differences (Figs. 2, 4, 8 and 9) are calculated as (b−a) a. Note that we do not analyse the influence of climate change alone in this study.
For all simulations, the atmospheric CO2 and meteorological input variables such as radiation, temperature, precipitation and windspeed, are identical, since they come from the driving climate model HadGEM2-ES output, as would be the case for a typical hydrological study. Furthermore, all simulations use atmospheric CO2 concentrations from the driving climate model (RCP 6.0). In simulations where CO2 is fixed at pre-industrial levels, this constraint is applied within JULES only, while the driving climate data use CO2 concentrations consistent with RCP 6.0. Note that anthropogenic disturbance of land is not included in any of the simulations, so vegetation can be affected by changes in climate and CO2 only. Some of the meteorological inputs from HadGEM2-ES are shown in Fig. 1.
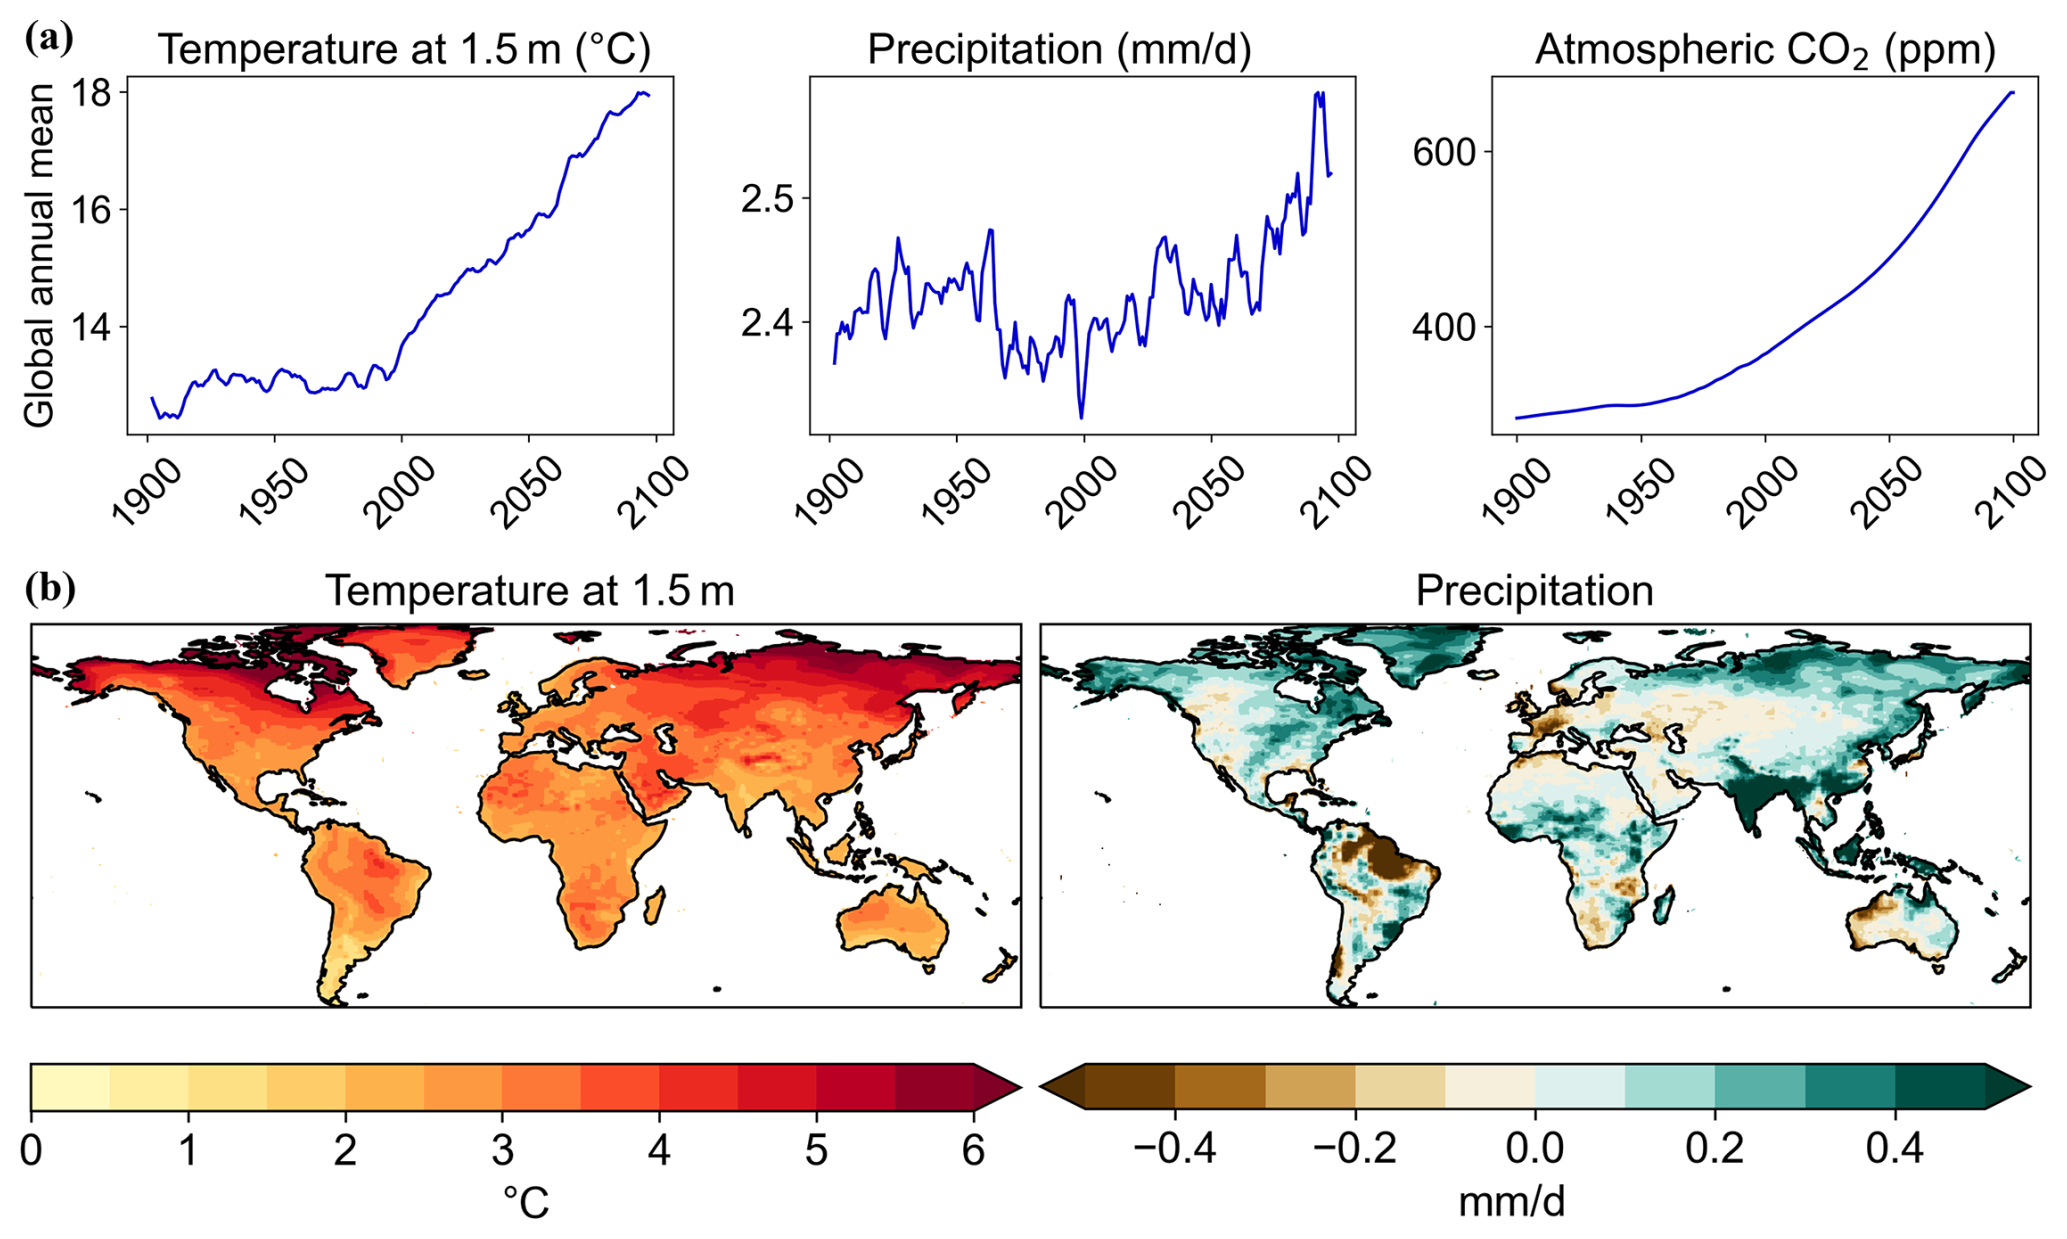
Figure 1(a) Global annual mean timeseries (rolling 5-year mean for precipitation and temperature) and (b) mean changes from 2006–2025 to 2076–2095 from the driving climate model data used to force the JULES simulations.
Water Scarcity Index (WSI) is calculated as the ratio of water demand to water supply (Falkenmark et al., 1989). The WSI has been chosen as it is a simple and widely used indicator of water scarcity. WSI of 0.2–0.4 indicates mild or emerging water scarcity, and WSI ≥ 0.4 indicates severe water scarcity, in line with Raskin and Gleick (1997) and Greve et al. (2018). Runoff is used as a proxy for water supply because it represents the fraction of precipitation that is not lost to evapotranspiration and is therefore available for water resources. Total runoff is taken from the output of the simulations and includes both surface (overland flow generated when precipitation exceeds infiltration capacity or soil saturation) and sub-surface runoff (lateral drainage through the soil column) at the grid box scale. Water demand has been downloaded from the ISIMIP database (https://data.isimip.org/, last access: 2 June 2026), specifically ISIMIP2b from the global water sector (Gosling et al., 2023). The hydrological model used is H08 (Hanasaki et al., 2008a, b, 2018) driven by HadGEM2-ES, RCP 6.0 and shared socioeconomic pathway SSP2, which represents population and gross domestic product for the “middle of the road” scenario (Riahi et al., 2017). Total water demand is represented by summing water withdrawal for irrigation (assuming unlimited water supply), domestic use and manufacturing.
Different approaches can be used to calculate the average WSI over space and time, which can considerably influence the results. Mostly, we have chosen to calculate WSI at the most granular spatial and temporal scale, which is monthly and by grid-box. The exception is when analysing by river basins in Figs. 8 and 9, where the sum of total supply and demand is computed for each basin before calculating WSI. The rationale is that, generally, all water within a river basin could ideally be used for all the population within that basin, noting in real life this is not always the case.
Since WSI is calculated as water demand divided by water supply, it can yield extremely high values where supply values are very low relative to demand. To moderate the impact of these extreme values, the median WSI is used for spatial and temporal averaging in this study, as it provides a more robust measure less influenced by outliers. Additionally, median WSI is calculated over larger spatial areas. Firstly, by the climate regions outlined in the Intergovernmental Panel on Climate Change (IPCC) Sixth Assessment Report (AR6), consisting of 46 land regions based on a combination of geographic, climatic, and socio-economic criteria (Fig. S2 in the Supplement; Iturbide et al., 2020). Secondly, by Hydrosheds river basins (https://www.hydrosheds.org/products/hydrobasins, last access: 2 June 2026; Lehner and Grill, 2013).
Finally, population projections are for SSP2 from the ISIMIP2b data library (Piontek and Geiger, 2017), plotted in Fig. S1, which are gridded at 0.5° × 0.5° resolution. These have been used to calculate projected population numbers by river basin in Fig. 9.
2.2 The Joint UK Land Environment Simulator (JULES)
JULES is a process-based model simulating fluxes of carbon, water, energy and momentum between the land surface and atmosphere. JULES is used as either an integral part of an Earth System Model such as UKESM1 (Sellar et al., 2019) or as an independent land surface model driven by input data from observations or atmospheric models; in this study it is used in the latter manner. JULES does not represent the same level of hydrological and water management detail as typically included in hydrological models; however, it does use a river routing scheme (Falloon et al., 2007), and, importantly for this study, has a dynamic vegetation model. The dynamic vegetation model predicts changes in leaf area and the fractional coverage of 13 different Plant Functional Types (PFTs; Harper et al., 2016) where each PFT is categorised by specific physiological traits, and surface fluxes are calculated separately for each PFT. JULES uses a coupled canopy conductance and photosynthesis model (Cox et al., 1998), based on Leuning (1995), and TOPMODEL-type scheme to calculate soil moisture and runoff; more details on both are in Appendix B.
3.1 Vegetation and water cycle variables
The global mean time series for water cycle and vegetation variables (Fig. 2) reveal substantial divergence among simulations. The largest relative differences are associated with the CO2-induced stomatal response, as indicated by simulations including CO2 : STOM, whose influence strengthens throughout the 21st century. When the CO2-induced stomatal response is included in simulations S3 and S4, by 2100, total runoff increases by 10 %–12 % (Fig. 2e), soil-moisture increases by approximately 6 % coinciding with reductions of approximately 20 % in both transpiration and stomatal conductance (Fig. 2l, m). CO2-driven stomatal closure appears to dominate over the drying effect of CO2-driven increases in leaf area. In CO2 : STOM + VEG, runoff continues to rise even with a ∼ 30 % increase in LAI (Fig. 2e, n). In contrast, climate-driven vegetation structural changes alone (CLIM : VEG) reduce LAI by ∼ 20 % (Fig. 2n), leading to a modest 3 %–5 % reduction in transpiration (Fig. 2l) and only a slight enhancement in runoff (Fig. 2e).
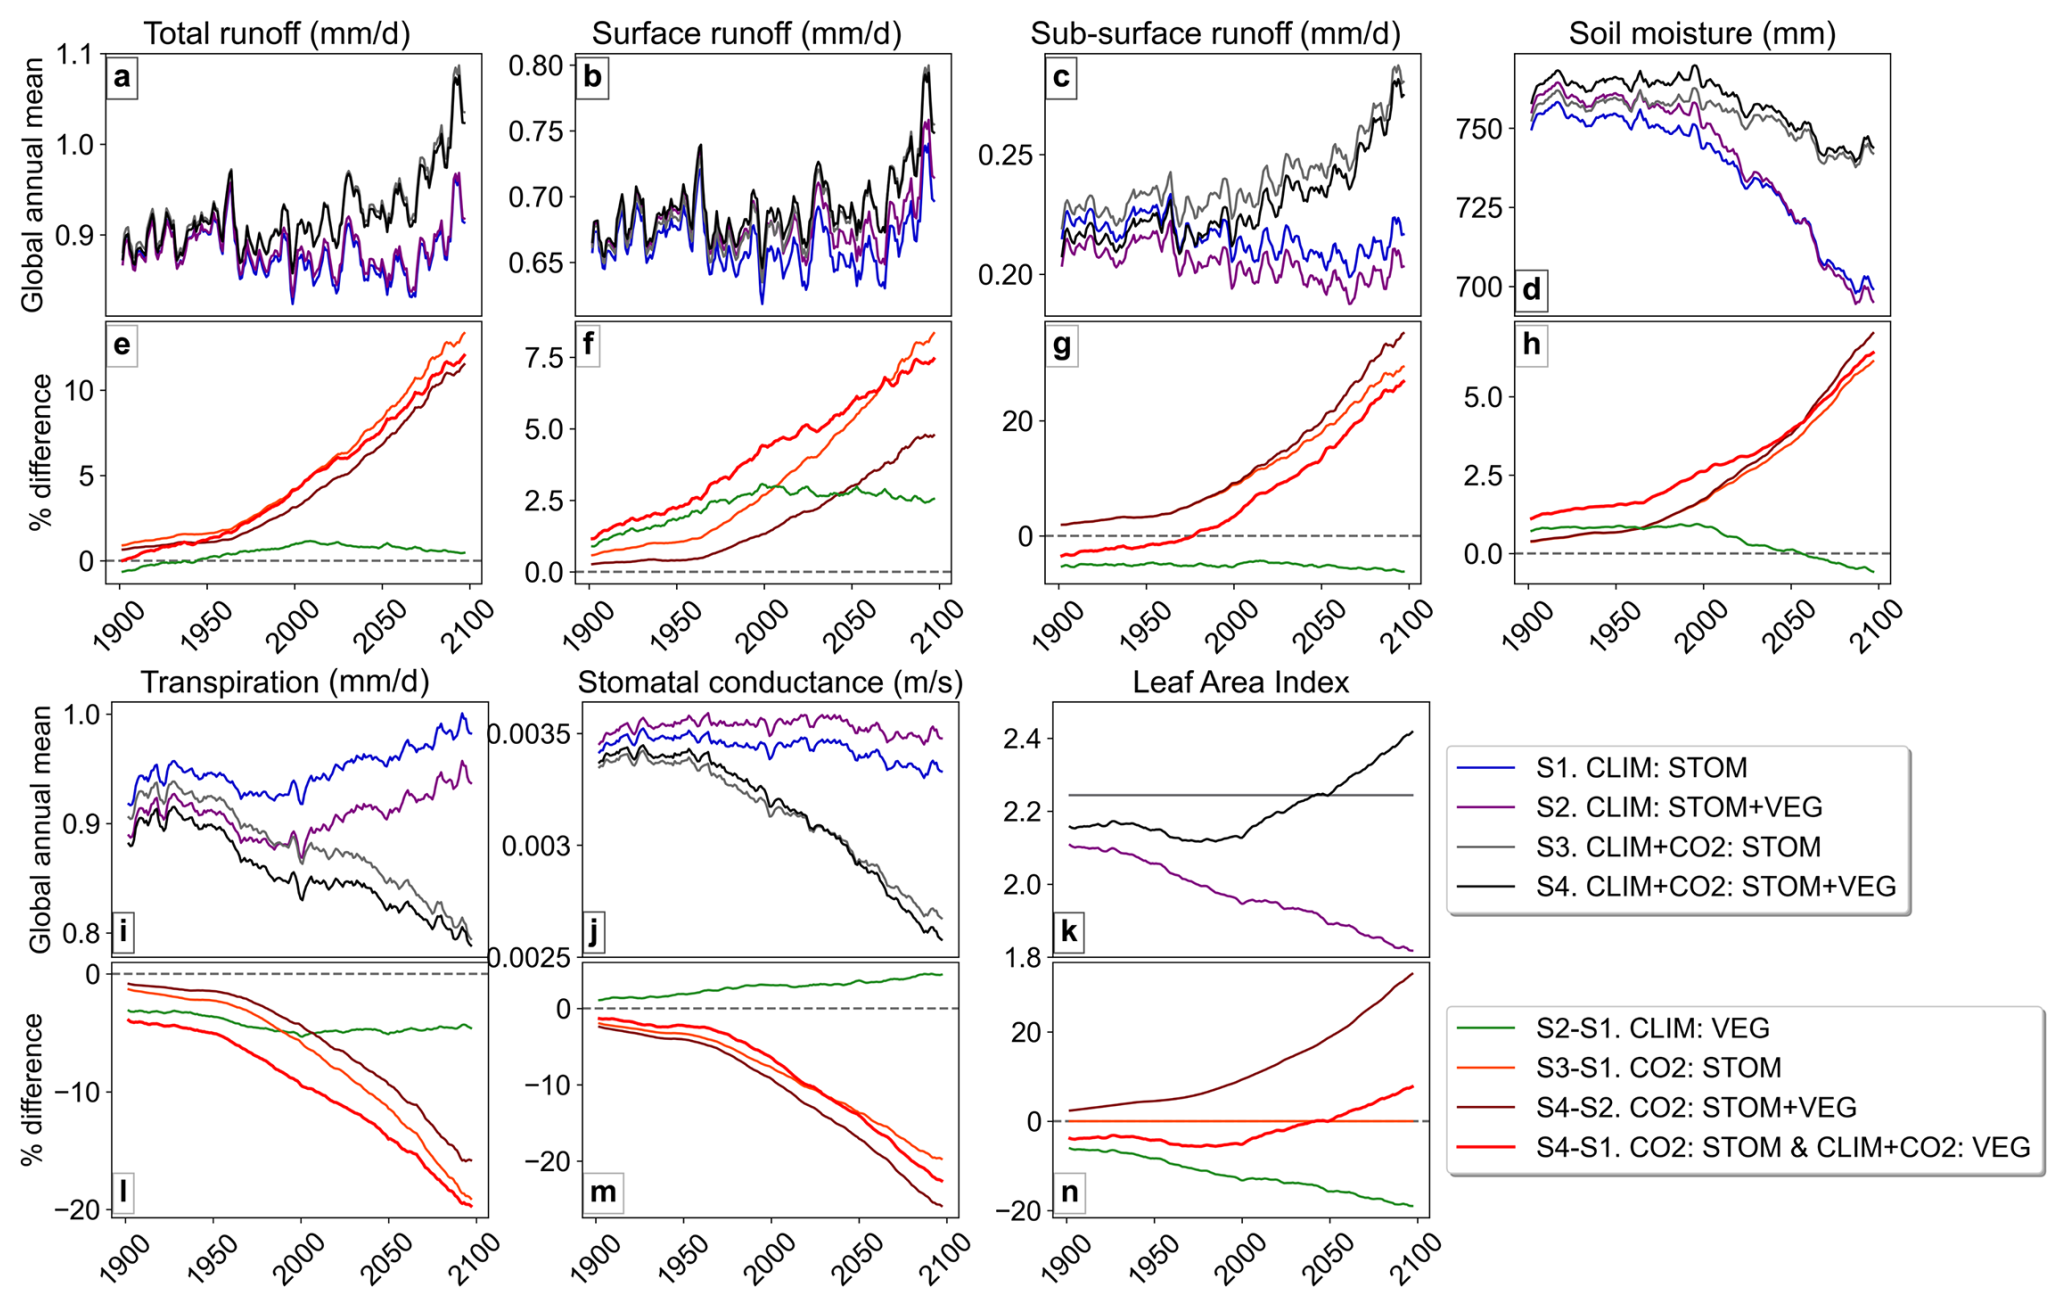
Figure 2Global annual mean timeseries (rolling 5-year mean) in water cycle and vegetation variables in each simulation and the relative (%) difference between simulations.
While the CO2-induced stomatal response contributes to overall surface wetting at the global scale (Fig. 2), its influence exhibits considerable spatial heterogeneity. Climate-driven runoff changes from the present (2006–2025) to the future (2076–2095) period are highly variable in both magnitude and direction (Fig. 3a) generally aligning with precipitation changes (Fig. 1b). When all vegetation responses are included in S4, the overall runoff and soil moisture pattern remain broadly similar to the climate-only simulation S1 (Fig. 3a, b, e, f) though increases are more evident in some regions, particularly the tropics, largely due to CO2-induced stomatal closure. For instance, in CO2 : STOM + VEG, runoff increases are projected in many regions (Fig. 3i), especially the tropics and high northern latitudes, corresponding with transpiration decreases (Fig. 3k). In areas with projected runoff decreases under climate forcing alone (Fig. 3a), such as in the Amazon, parts of the USA, northern and eastern Europe, the stomatal response mitigates drying and, in places such as central Africa, even reverses runoff decreases to increases (Fig. 3e).
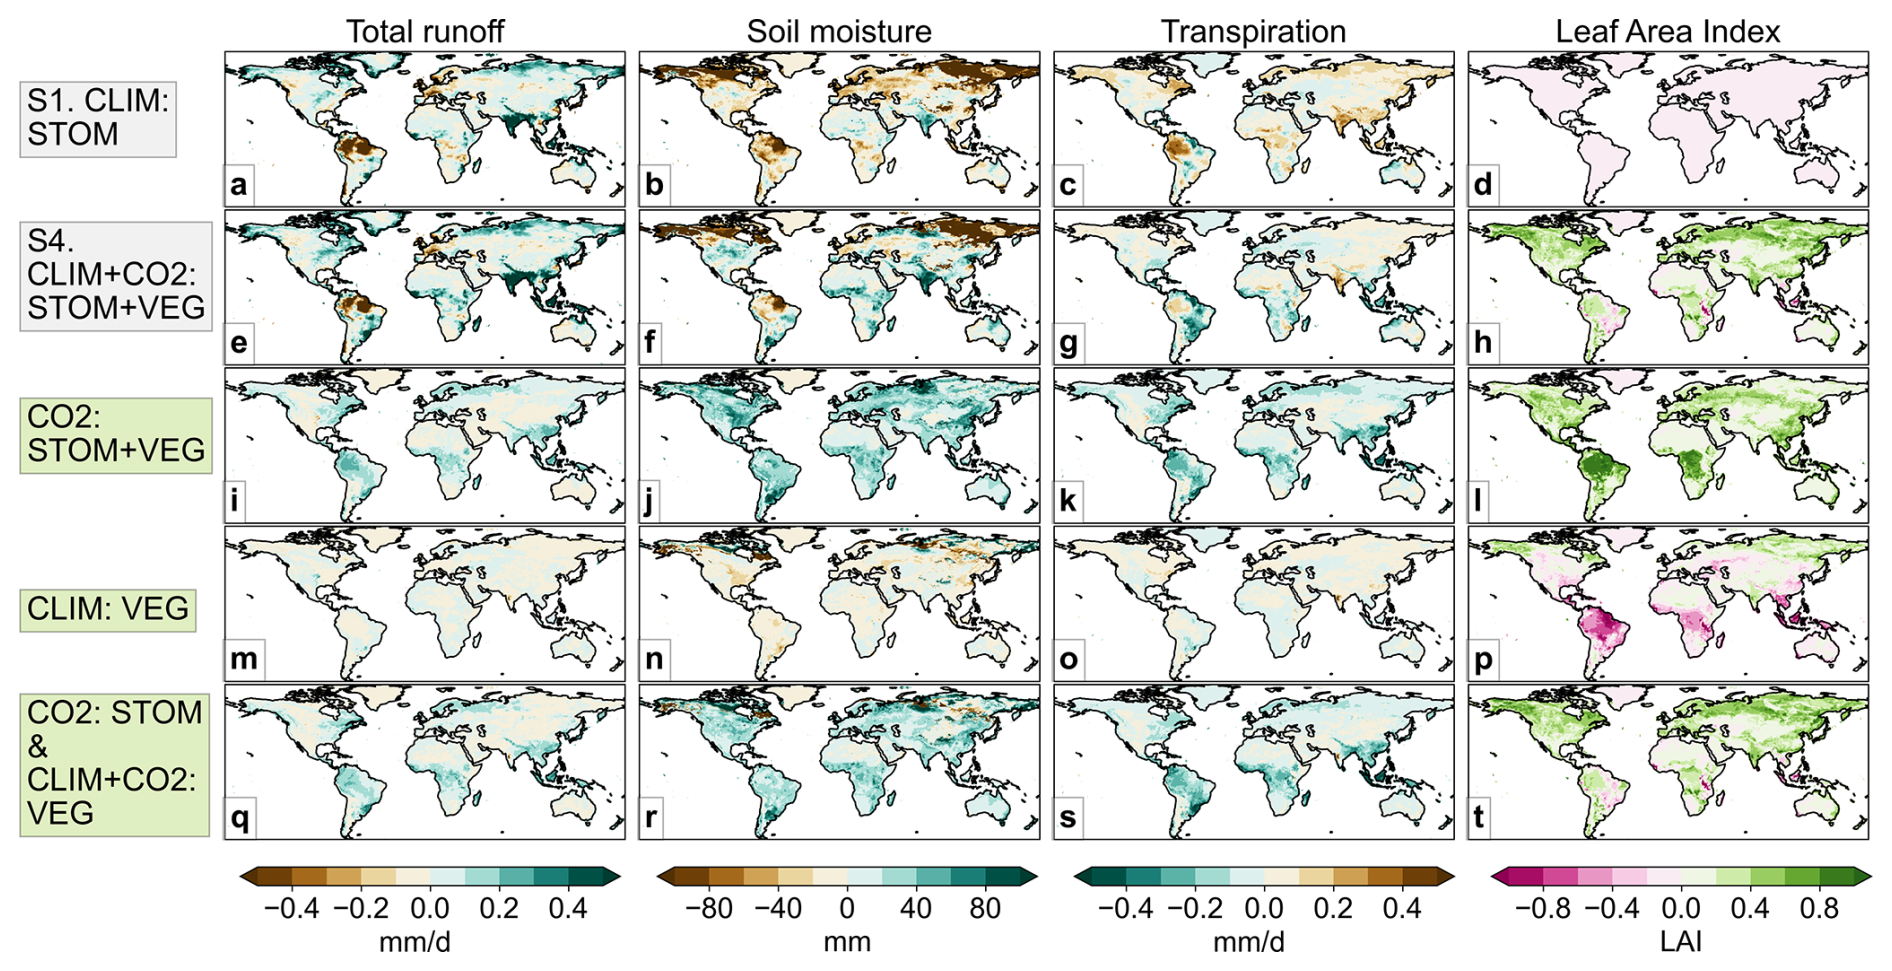
Figure 3Global mean changes from present (2006–2025) to future (2076–2095) period in the simulations without (a–d) and with (e–h) all the combined vegetation responses, and the absolute difference when the various vegetation responses are included.
In many regions, the CO2-induced combined vegetation response is driving runoff increases (Fig. 3i) despite CO2-induced LAI increases (Fig. 3l), suggesting that stomatal closure outweighs the drying effect of enhanced leaf area. However, the LAI increases appear to drive slight runoff reductions across some areas, particularly in semi-arid and arid climates such as the Middle East and western USA (Fig. 3i, l). Although considerably smaller than the increases, these small runoff reductions could cause significant impacts in already water-stressed areas. In contrast, climate-driven vegetation structural changes (CLIM : VEG) have relatively limited impact on runoff, soil moisture and transpiration, despite notable LAI changes in parts of the tropics and high latitudes (Fig. 3m–p).
3.2 Water demand, supply and the Water Scarcity Index
Global median water demand, supply, and WSI are projected to increase over the coming decades under SSP2 and RCP 6.0 (Fig. 4a–c). However, while water demand and WSI peak and subsequently decline later in the century, JULES projects a continued rise in global water supply, particularly in simulations S3 and S4 that include CO2 effects on stomata (Fig. 4b). When including the CO2-induced stomatal response (CO2 : STOM), global median water supply is approximately 30 % higher by 2100, and even when CO2-induced structural responses are also included in CO2 : VEG + STOM, supply is around 20 % higher by 2100 (Fig. 4d). In contrast, the climate effects on vegetation have a comparatively small influence on global median water supply, and this influence diminishes further in the coming decades (Fig. 4d; CLIM : VEG).
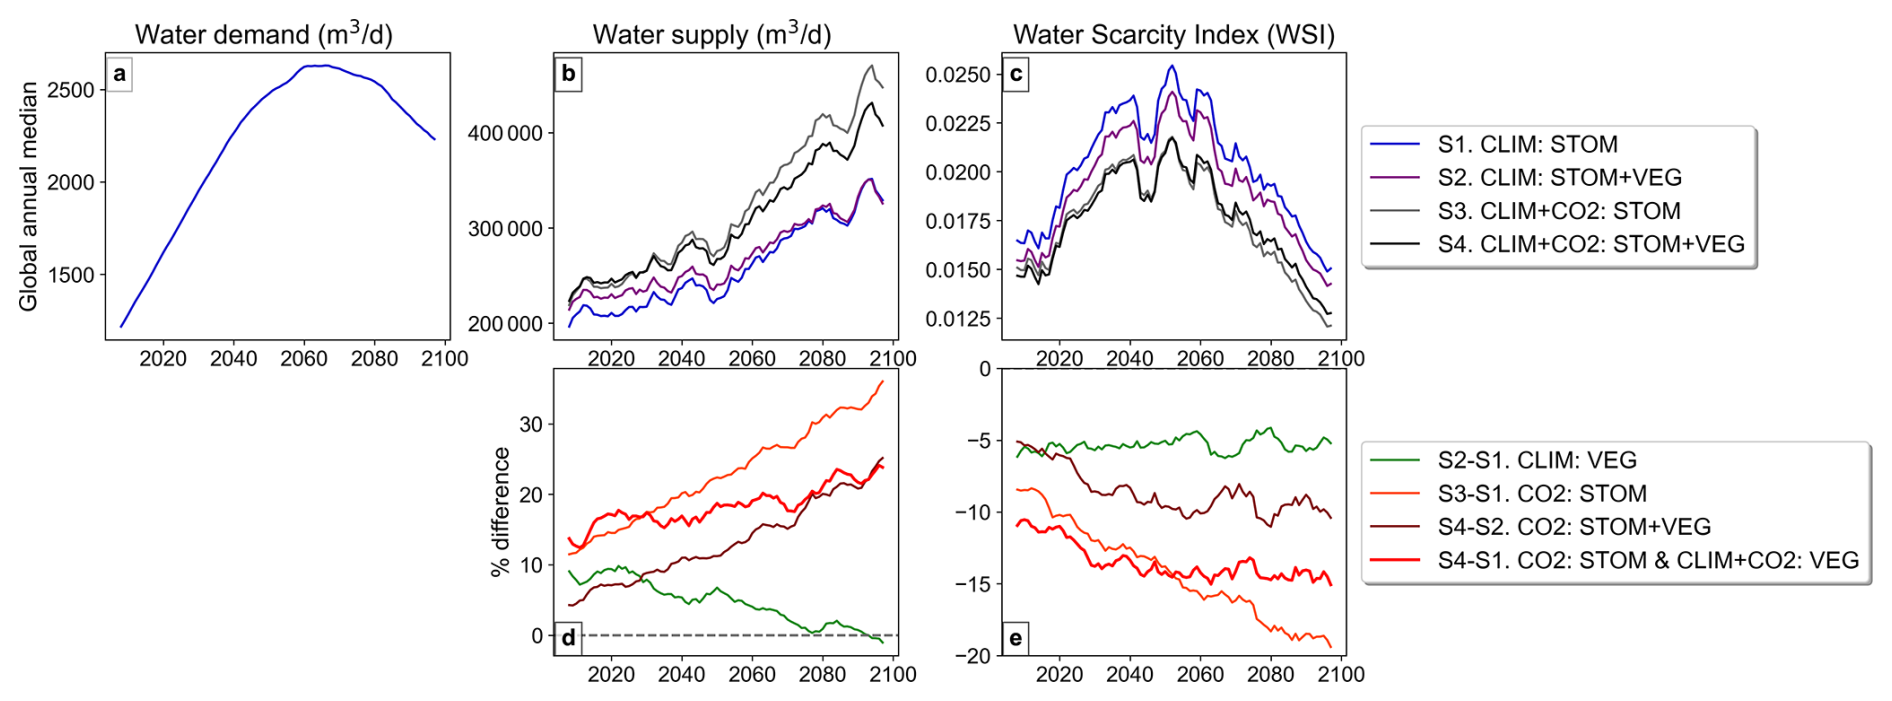
Figure 4Annual global-median timeseries (rolling 5-year mean) of (a) water demand, (b) water supply, (c) WSI in the four simulations and the % difference in (d) supply and (e) WSI due to the various vegetation responses. Note, water demand is the same across all simulations.
The water supply increases driven by the CO2-induced stomatal response corresponds with consistent projected reductions in global median WSI throughout the century (Fig. 4c, e), reducing it by 15 %–20 % toward the century-end shown by CO2 : STOM (Fig. 4e). However, when CO2-induced LAI increases are also allowed in CO2 : STOM + VEG, the reduction in WSI is notably less at 8 %–10 % in the second half of the century. Climate-induced vegetation changes also reduce global median WSI by around 5 %, remaining consistent throughout the period. When all processes are included, the combined influence shown by S4 − S1 (Fig. 4e) results in a 10 %–15 % reduction in WSI throughout the century.
Under RCP 6.0 and SSP2, water demand for the present period is high in much of Europe, South and Southeast Asia and the USA (Fig. 5a). Water demand is projected to increase in most places, especially in the highly populated and developing regions of South Asia, as well as parts of Africa, but decreases are also seen for parts of Europe and China (Fig. 6a). Regions experiencing severe water scarcity (WSI ≥ 0.4; Raskin, et al., 1997) in the present period (2006–2025), include most of India, the Middle East, eastern China and parts of South Africa, USA, and Europe (Fig. 5c). Large swathes of northern Africa are also experiencing severe water scarcity despite low demand (Fig. 5a). Even though global median WSI reduces later this century in Fig. 4c, many of the already water scarce regions are projected to become even more water scarce by the future period (2076–2095; Fig. 6c), as the demand grows, including in highly populated regions such as India.
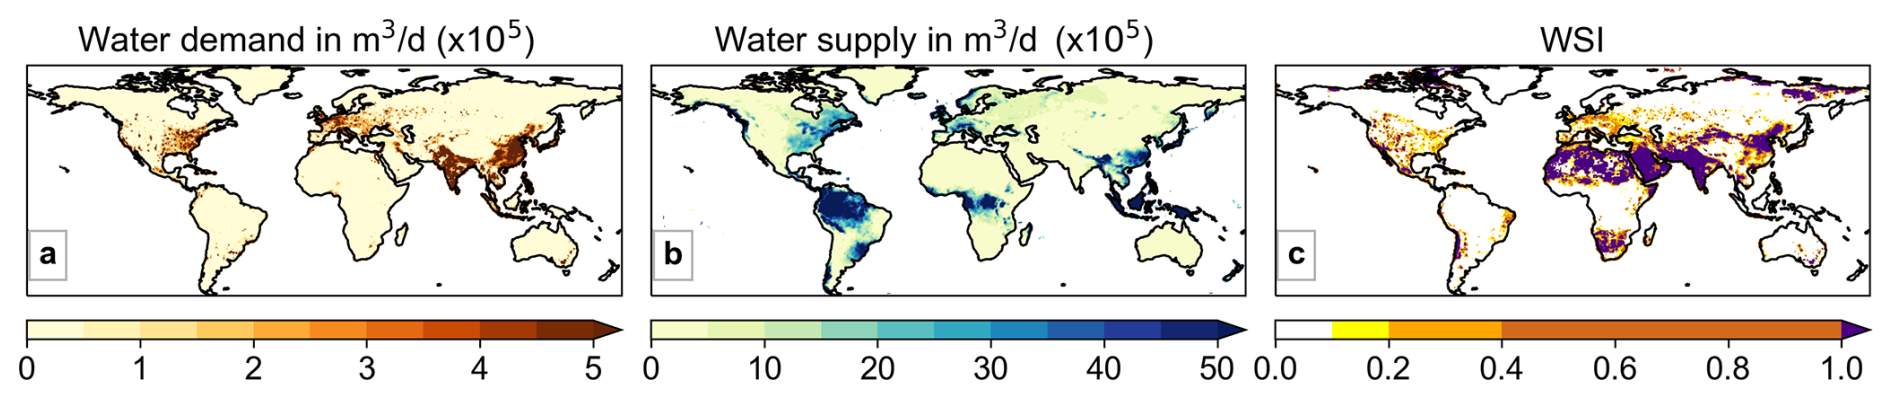
Figure 5Median (a) water demand, (b) supply and (c) Water Scarcity Index (WSI) for the period 2006–2025 in S1. CLIM : STOM.
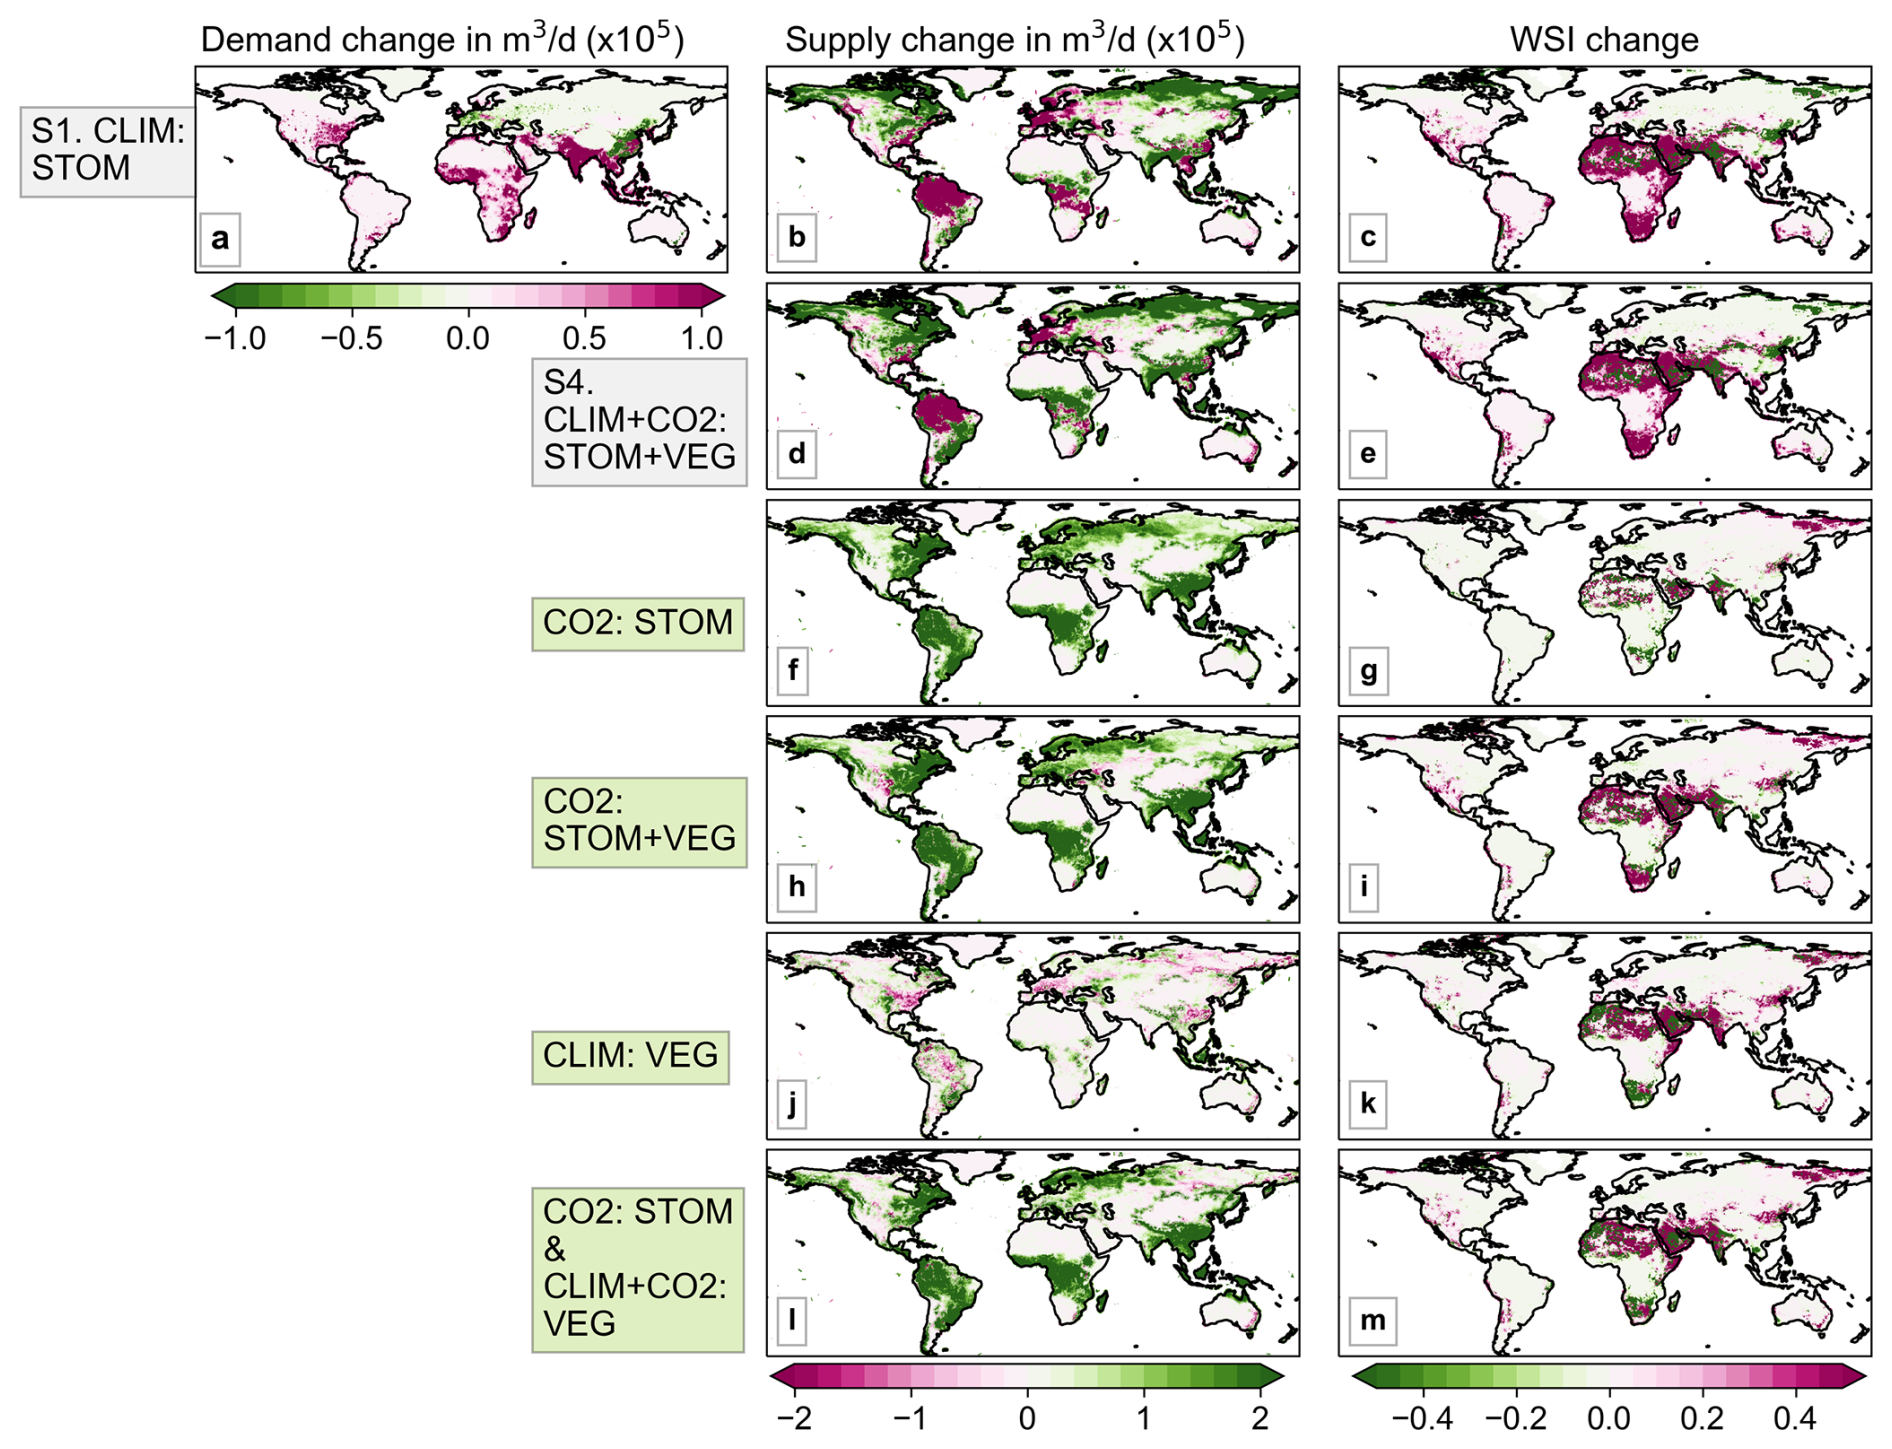
Figure 6Median water demand, supply and Water Scarcity Index (WSI) change from the present (2006–2025) to future (2076–2095) period in simulations S1 and S4 (a–e), and the difference in supply and WSI when including the various vegetation responses (f–m).
The plots comparing the change in median WSI from the present (2006–2025) to the future (2076–2095) under scenarios with and without plant processes (Fig. 6c, e) appear quite similar, suggesting that water demand and meteorological factors driving water supply are the primary influences on WSI. Interestingly, the changes in supply between the S1 and S4 simulations (Fig. 6b, d) show greater difference than those for WSI, since the supply differences mainly occur in areas with low levels of water scarcity, and therefore have less impact on WSI.
Despite the visual similarities between simulations with (Fig. 6e) and without (Fig. 6c) the combined vegetation responses to CO2 and climate change, the effect of plant responses on WSI is not negligible. The CO2-induced stomatal response increases water supply in most regions, especially in the tropics (Fig. 6f), resulting in corresponding reductions in WSI (Fig. 6g). When CO2-induced vegetation structural changes are also included in the CO2 : STOM + VEG simulations (Fig. 6h, i), overall supply still increases, as the supply reductions associated with CO2-driven structural vegetation expansion are relatively small and less apparent in the plots. However, these modest reductions translate into substantial increases in WSI in arid regions such as the Middle East and northern and southern Africa (Fig. 6i), where baseline water supply is already low. Climate-induced vegetation changes shown in CLIM : VEG appear to have minimal impact on supply (Fig. 6j), yet there are substantial changes in WSI in some areas, with increases in western India, and decreases in parts of southern and northern (Fig. 6k). Finally, when all processes are combined in CO2 : STOM & CLIM + CO2 : VEG, supply predominantly increases (Fig. 6l), even though WSI increases in many arid and semi-arid regions.
The 25 IPCC AR6 climate regions with the highest monthly median WSI between 2076–2095 are shown in Fig. 7. The Arabian Peninsula region is projected to experience the highest median WSI, and South Asia is predicted to have the second highest (Fig. 7; left panel). Comparing with the 2006–2025 present period (Fig. S3), nearly all these regions are projected to increase in median WSI by the end of the century, with the largest increases in the East and West Southern Africa and Western Africa regions.
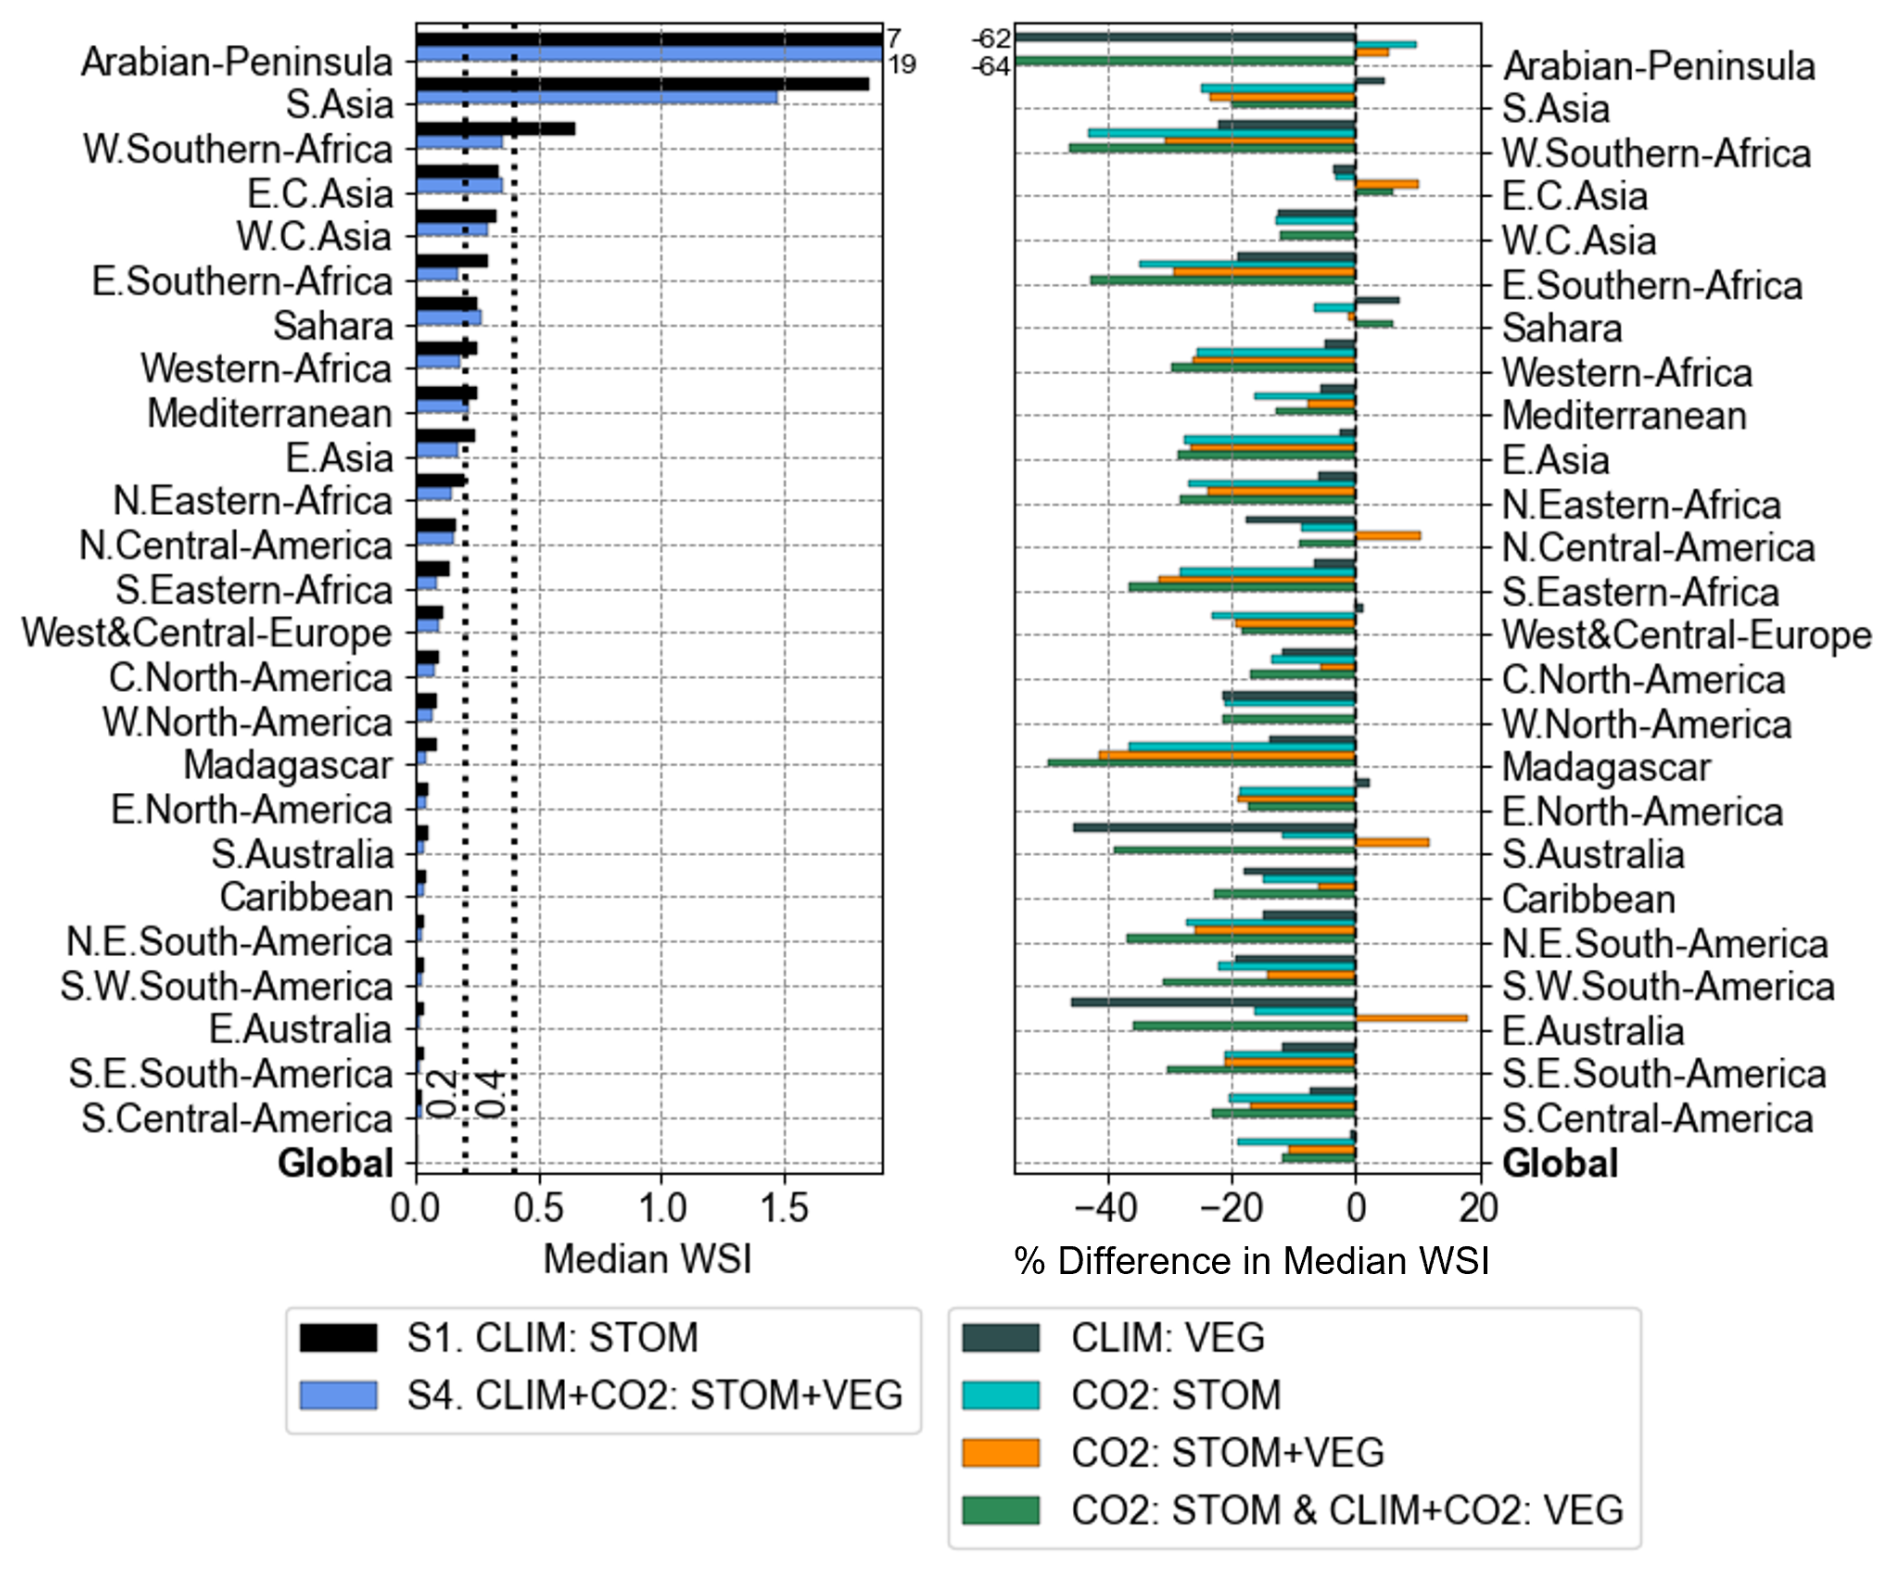
Figure 7Median monthly WSI in simulations S1 and S4 (left) and % difference of median WSI when including the various vegetation responses (right) by IPCC AR6 regions for the future period 2076–2095. The grey dashed lines (left) indicate the thresholds for mild water scarcity (WSI ≥ 0.2) and severe water scarcity (WSI ≥ 0.4). Only the 25 regions with the highest median WSI, according to the S1. CLIM : STOM simulation, are shown, sorted from the most water scarce region (top) to the least (bottom). The global median is also presented at the bottom. Out-of-range values for the Arabian-Peninsula are printed at the top.
When all vegetation structural and stomatal responses are included in S4, there is a reduction in median WSI for all regions, except for East Central Asia and the Sahara, when compared with S1 (Fig. 8; left). The CO2-induced stomatal response appears to be driving the largest reductions in WSI, indicated by CO2 : STOM and CO2 : STOM + VEG (Fig. 8, right). Reductions of 30 %–40 % are projected for Madagascar, East Southern Africa, and South-Eastern Africa regions, and 20 %–30 % reductions in Western Africa, Northeast South America, and South and East Asia. These regions are predominantly in tropical climates, aligning with the areas of increased water supply shown in Fig. 6b. However, CO2 : STOM + VEG also indicates increases in median WSI, potentially due to CO2-induced vegetation growth in regions like North Central America, East Central Asia, and South and East Australia. Climate-induced vegetation changes (CLIM : VEG) appear to drive WSI reductions in almost all regions, perhaps due to decreased leaf area and vegetation coverage requiring less water in these regions. These reductions are considerable in some areas, with ∼ 45 % decreases in East and South Australia. Including all vegetation structural and stomatal responses (CO2 : STOM & CLIM + CO2 : VEG) leads to reductions for many of the most water scarce regions by 20 %–40 %, and a reduction in the global median by 12 %.
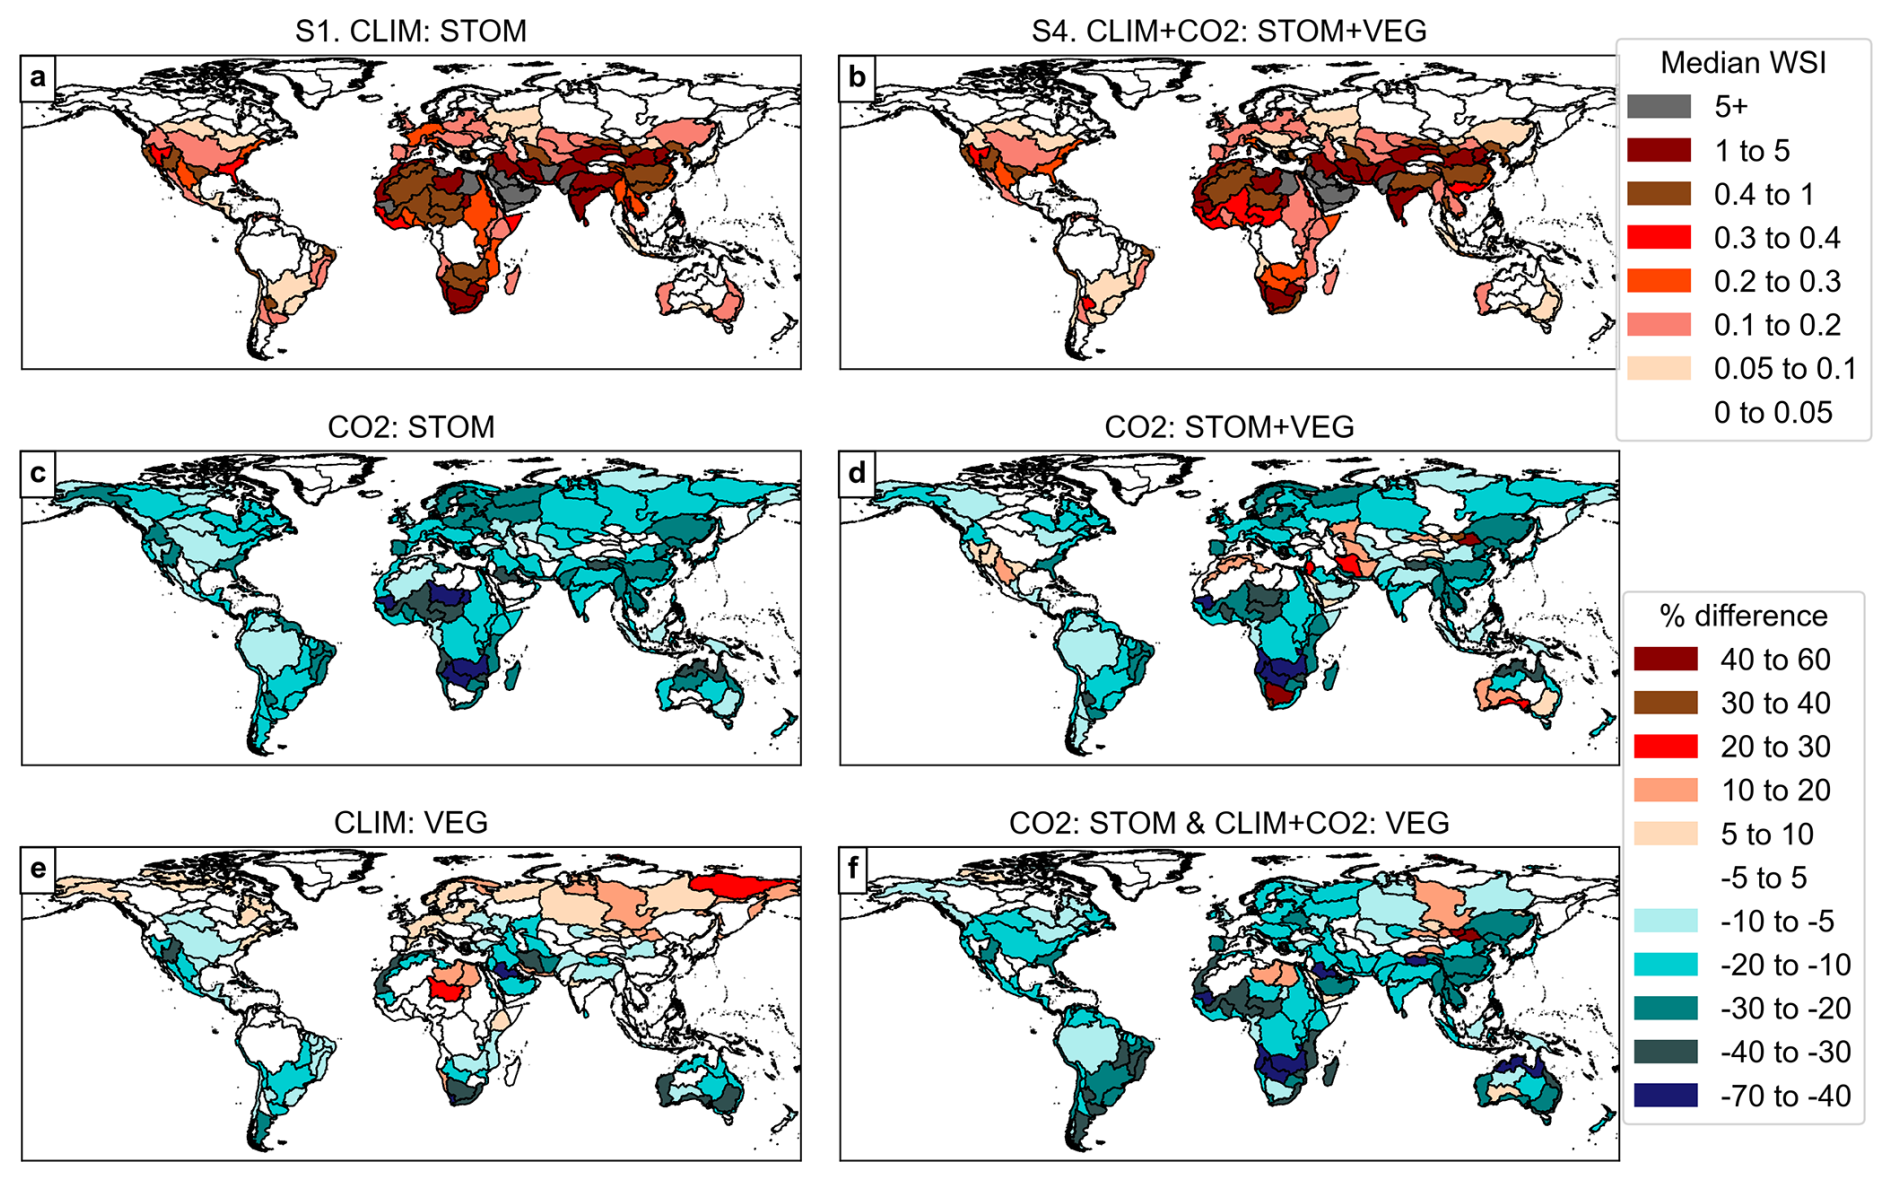
Figure 8Median WSI in simulations S1 and S4 (top row) and the relative (%) difference in median WSI when including the various vegetation responses by river basin for the future period 2076–2095.
These results are reinforced by alternative WSI measures; both the number of severely water scarce months (Fig. S4) and % area in severe water scarcity (Fig. S5), indicate that incorporating all the vegetation responses to CO2 and climate leads to a reduction in both the temporal and spatial extent of water scarcity for most regions. These reductions are also primarily driven by the CO2-induced reduction in stomatal aperture, particularly in the tropical regions such as East Asia and South-Eastern Africa.
When analysing median WSI by river basins for the future period (2076–2095; Fig. 8), the findings become clearer compared to the grid-cell analysis in Fig. 6. Consistent with the bar plots in Fig. 7, comparing simulations S1 and S4 in Fig. 8a and b suggests limited influence from the combined CO2- and climate-induced vegetation responses on median WSI categories. However, WSI category shifts are shown for several basins, including in central, southern, and northern Africa, Southeast Asia, and eastern Australia. Despite this, CO2-induced stomatal responses contribute to percentage reductions in median WSI across many basins (Fig. 8c, d, f). Median WSI is at least 20 % lower in numerous basins, including in Europe, central and southern Africa, and South and East Asia, and at least 40 % lower in basins in part of Africa. When CO2 effects on vegetation structure are also included in CO2 : STOM + VEG, median WSI increases by more than 10 % in 18 basins (Table 2) including in the Middle East, Australia, Southern and Northwestern Africa, and the western USA (Fig. 8d), potentially due to CO2-induced vegetation structural increases enhancing drying. However, the supply increases from stomatal responses due to enhanced CO2 appear to dominate, resulting in WSI reductions by at least 10 % in 122 basins (Table 2).
The effects of climate-induced vegetation structural changes are more varied with modest increases in WSI (> 10 %) in much of Europe and larger increases (10 %–30 %) in central-northern Africa. However, reductions are more common, particularly around arid and semi-arid regions (Fig. 8e), also supported by Table 2, which suggests more increases than decreases in median WSI across all the thresholds.
Table 2Number of river basins and percentage of the global population experiencing increases (≥ threshold) and decreases (≤ threshold) in median WSI under different vegetation responses for 2076–2095.
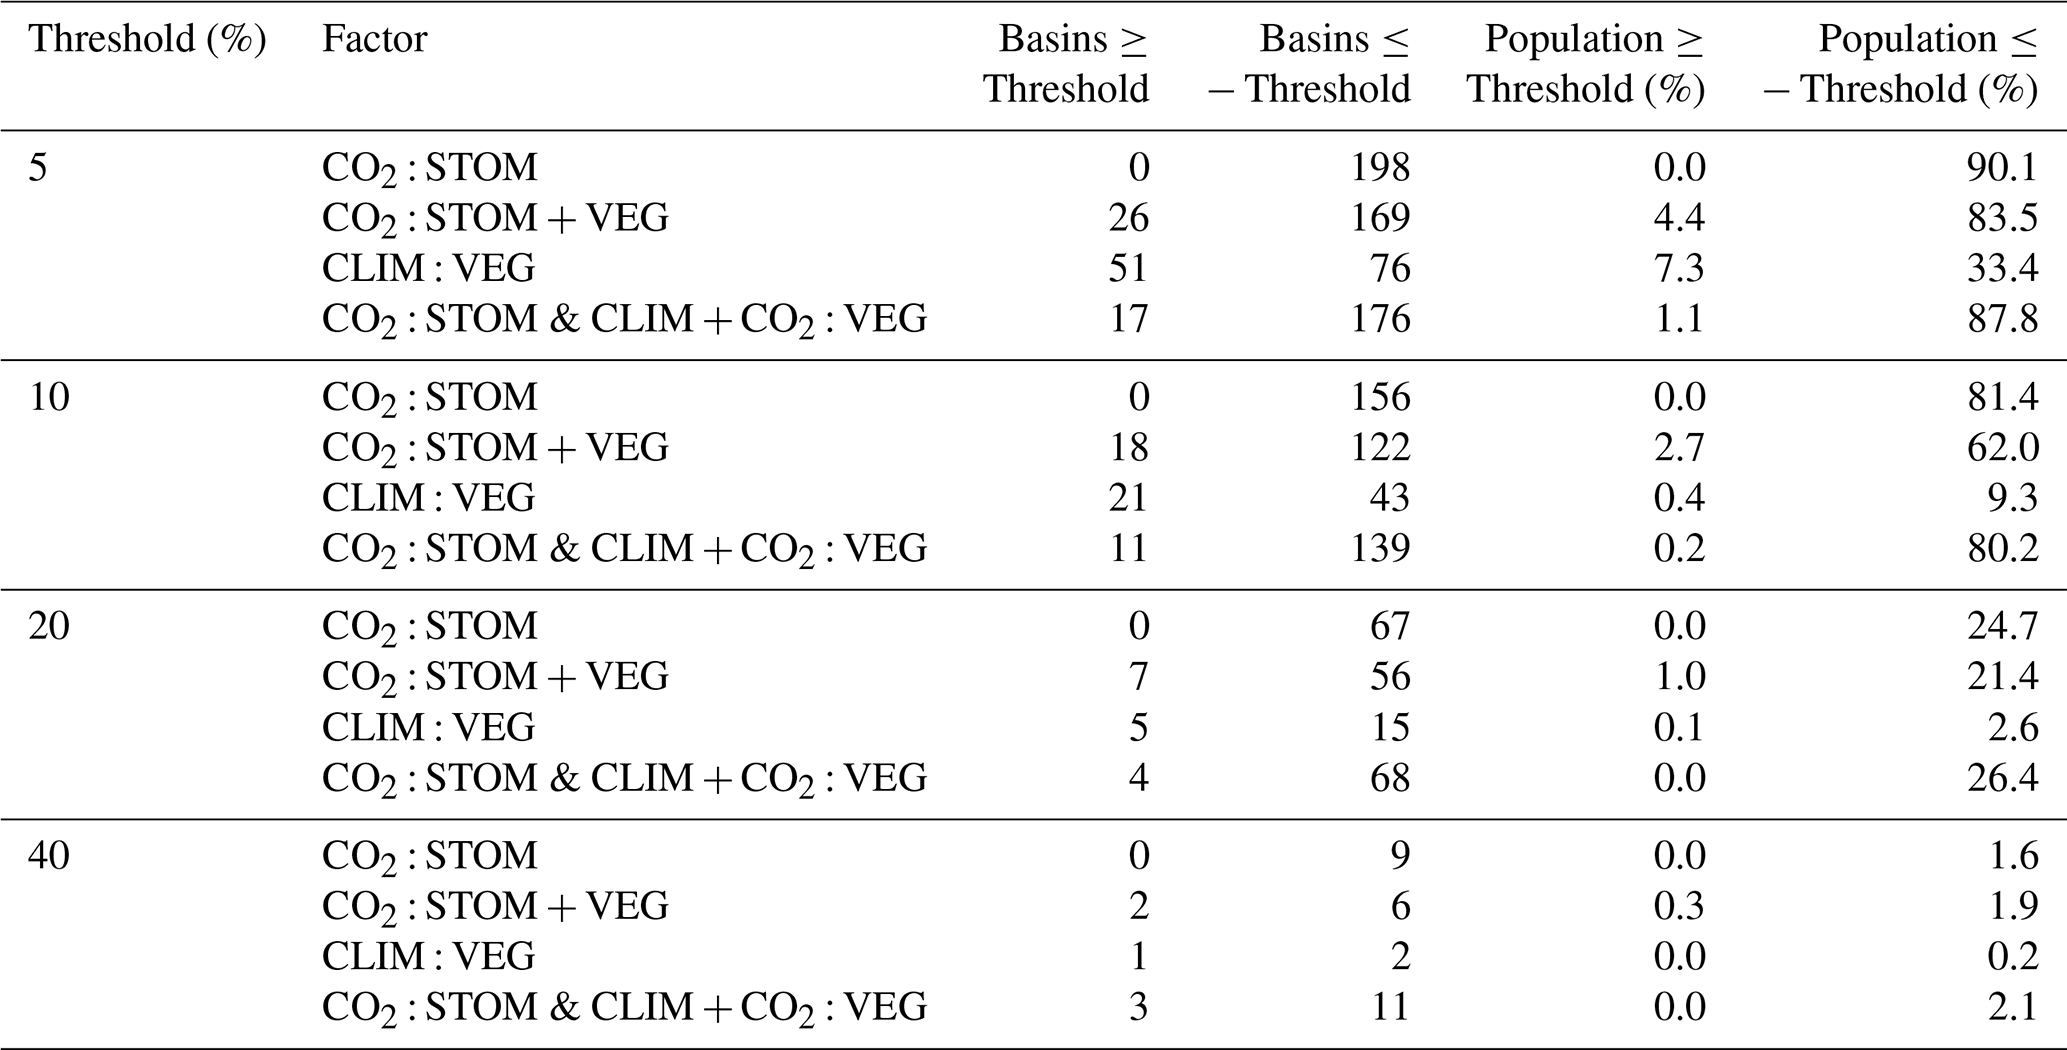
Considering all factors combined (CO2 : STOM & CLIM + CO2 : VEG), decreases in WSI outweigh increases (Fig. 8f, Table 2). Out of 291 basins, 139 show reductions of at least 10 % (maximum 67 %), affecting 80 % of the global population, while only 11 basins see increases over 10 % (maximum 59 %), affecting just 0.2 % of the population (Table 2). When all processes are included in CO2 : STOM & CLIM + CO2 : VEG, median WSI will reduce by at least 5 % for 88 % of the population and reduce by at least 40 % for 2 % of the population.
Figure S6 shows the number of months in severe water scarcity (WSI ≥ 0.4), with the CO2-induced stomatal response again driving small reductions of mainly 1 to 2 months in many basins, in similar regions to those seen in Fig. 8f, including southern South America, central and southern Africa southeast Asia and coastal Australia. The results are also consistent when dividing into seasons, which show overwhelming reductions in median WSI across all seasons in the future period (Fig. S7).
The annual cycles of median WSI for the period 2076 to 2095 across several major river basins are illustrated in Fig. 9, along with the relative differences when the different vegetation responses are included. These basins were selected based on their population and water scarcity levels, ensuring a fair geographic distribution across all continents (excluding the poles).
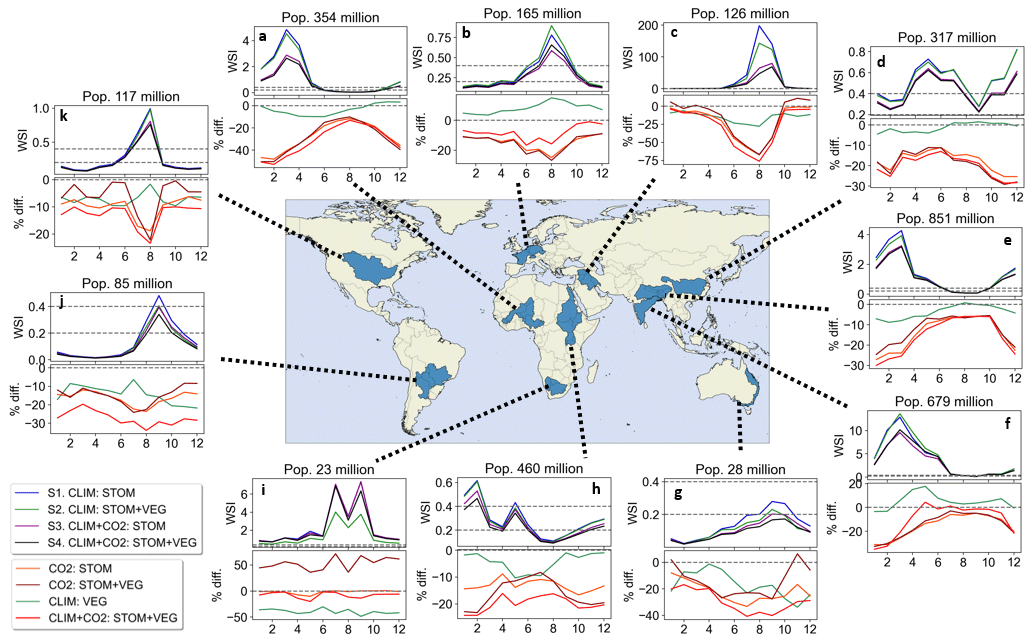
Figure 9Annual cycles of median WSI and the relative (%) difference in median WSI when including the various vegetation responses for river basins for period 2076–2095. Total population of the basin is included above each plot.
All basins experience periods of water scarcity during parts of the year. Consistent with previous findings, the inclusion of the CO2-induced stomatal response mitigates WSI in all basins throughout the year, and especially during water-scarce periods. In some basins, this effect reduces WSI by over 40 % during certain times of the year. For instance, in the northwest Africa and Tigris-Euphrates basins (Fig. 9a, c), the WSI is projected to be at least 50 % lower during the most water-scarce periods.
The basin in southern Africa presents contrasting results to the other basins and to our existing results; when including the CO2-induced vegetation structural increases in CO2 : STOM + VEG, median WSI is 50 % higher, which is the case for much of the year. Interestingly, climate-induced vegetation structural changes drive 40 %–50 % reduction in WSI over the year. These two processes appear to be balancing one another out, as the combined effect of all processes results in minimal net change in WSI.
Overall, including all vegetation responses to CO2 and climate change in S4, consistently mitigates WSI across the year in most basins, with the magnitude of these effects varying across the year. These findings suggest that the combined vegetation responses have the most substantial impact during periods of water scarcity, highlighting their importance in future water scarcity projections.
Existing studies on the socioeconomic impacts of water scarcity are typically based on hydrological models that do not include vegetation stomatal or structural responses to rising CO2 and climate change (e.g., Dolan et al., 2021; Gosling and Arnell, 2016; Greve et al., 2018; Haddeland et al., 2014; Schewe et al., 2013). By replicating the common approach, i.e., driving a standalone impacts model with climate model output, this study investigates the influence of incorporating these plant responses in such analyses.
Numerous observational and modelling studies have demonstrated the impact of the CO2-induced stomatal and structural responses on the water cycle. In line with many of these studies (e.g., Betts et al., 2007; Cao et al., 2010; Gedney et al., 2006), our results suggest that, for the overall global mean, rising CO2 decreases stomatal conductance and transpiration, leading to higher soil moisture and increased runoff (Figs. 2 and 3). Projected total runoff increases of 10 %–12 % by the end of the century (Fig. 2e) are analogous with the global mean values suggested in Betts et al. (2007) and Cao et al. (2010). The runoff increases from the stomatal response are most pronounced in the tropics (Fig. 3i), corroborating the findings of several studies (e.g., Davie et al., 2013; Fowler et al., 2019; Lemordant et al., 2018; Yang et al., 2019). Furthermore, also supported by these studies, our results suggest that global mean LAI increases with rising CO2 (Fig. 2k, n), but, at the global scale, any reductions in runoff due to increased vegetation cover and LAI is outweighed by the increases in runoff due to the CO2-induced stomatal response, since CO2 : STOM + VEG shows relative increases for global mean runoff and soil moisture (Fig. 2e–h). However, CO2- and climate-induced vegetation increases are still projected to drive small decreases in runoff across large areas of the globe, especially semi-arid and arid regions, west USA, parts of mid-latitudes and Australia, supported by several studies (e.g., Piao et al., 2007; Ukkola et al., 2016). Even though these decreases appear negligible in number, water supply is already low in many of these regions and therefore a small decrease can greatly exacerbate water scarcity in these areas.
The increase in global runoff and thus water supply when all the plant responses are included in our simulations translates to reductions in global median WSI. Our results suggest that the wetting effect of the stomatal response to rising CO2 has the dominating influence over the drying effect of increased vegetation structural response in most places, especially when aggregated by IPCC climate regions and river basins. Under RCP 6.0 and SSP2 “middle-of-the-road” scenarios, global median WSI increases until mid-century and then declines (Fig. 4c), although many places will still experience worsening water scarcity throughout the century (Fig. 6c). Water scarcity projections with and without CO2- and climate-induced vegetation responses (Figs. 6–8) do not present drastic differences, but the influence of plant responses, particularly the stomatal response to rising CO2, still have a noticeable effect when the results are collated over larger areas. In most IPCC AR6 regions and river basins, median WSI is lower when all plant responses are included in CO2 : STOM & CLIM + CO2 : VEG (Figs. 7–8; Table 2). Although CO2-induced stomatal closure substantially increases water supply by ∼ 35 % (Fig. 4d), it reduces WSI by only ∼ 20 % (Fig. 4e) by 2100. The smaller influence on WSI arises because the largest supply increases are due to the CO2-induced stomatal response, which has most influence in non-water scarce regions with abundant water supply, such as tropical regions like the Amazon and Southeast Asia (Fig. 6f, g), which contribute less to WSI values.
Notable differences emerge when computing WSI at different spatial scales. At the grid-box level, median WSI is often much higher (Fig. 6), as local demand, particularly in urban areas, can substantially exceed local supply, as runoff from surrounding grid-boxes is not accounted for. In contrast, at larger spatial scales, WSI values are lower (Figs. 7 to 9), as aggregating supply and demand across broader areas reduces these imbalances. For river basins, total runoff is assumed to be accessible to all inhabitants within the basin, which smooths out local imbalances. While neither approach fully captures the complexity of water distribution and accessibility, this is not a critical limitation for this study, which is to assess the relative influence of vegetation responses on WSI rather than produce precise estimates.
Furthermore, our findings may overestimate WSI in places, as our proxy for water supply is total runoff estimated using JULES, which does not include some sources which can supplement water supply, such as groundwater extraction. Another source of potential overestimation arises from irrigation demand being derived from hydrological model “H08”, which, like many other hydrological models, does not account for vegetation structural or stomatal responses to rising CO2 and climate change. In reality, rising atmospheric CO2 can increase crops water-use efficiency, lowering water required for irrigation, and thus potentially alleviating water scarcity.
The HadGEM2-ES climate data driving JULES in this study has been bias-corrected following the ISIMIP2b protocol, although some residual biases remain in the JULES version used (Mathison et al., 2023). For 1980–2006, their evaluation indicates negligible runoff biases for most river basins. However, slight runoff underestimations in China and the northern high latitudes translate to overestimations in WSI in our study. Conversely, slight runoff overestimations in eastern USA translate to underestimations in WSI in our study. To assess the influence of plant responses, we take the difference between two simulations that share similar biases, and thus this minimises overall biases. Non-linear biases may persist when comparing simulations with differing plant responses, but these are expected to be relatively small compared with other uncertainties inherent in such modelling studies.
JULES uses parameterisation schemes to represent hydrological and biophysical processes. For example, the stomatal conductance scheme (see Appendix B) simplifies a complex process which varies across species, ecosystems, and climates (Norby and Zak, 2011). Evaluating the accuracy of such parameterisation schemes on a global scale is a major challenge, primarily due to limited observational data. Experiments such as Free Air CO2 Enrichment (FACE) have provided valuable insights into plant physiological responses to elevated CO2, which are crucial for land surface model developments, but are currently at a small number of point locations. Model-data comparison studies suggest mixed performance at simulating CO2 effects on water-use efficiency, with models performing well for some sites and species but poorly for others (De Kauwe et al., 2013; Walker et al., 2014). Although JULES has not yet been comprehensively assessed in these studies, its behaviour is expected to be broadly comparable to the models evaluated. Furthermore, some studies suggest that the magnitude of the CO2-effect on river runoff records in JULES is reasonable within uncertainty bounds (Gedney et al., 2006, 2014).
Since only one land surface model was assessed in this study, further work could test additional models to examine the sensitivity of the results. We would anticipate broadly consistent outcomes across LSMs when testing the stomatal response, as many LSMs employ stomatal conductance parameterisation schemes derived from similar formulations. However, we would expect a wider spread of responses in LSMs when testing vegetation structural responses, given that different Dynamic Global Vegetation Models apply alternative approaches to dynamic vegetation compared with the TRIFFID scheme used in JULES (Sitch et al., 2008).
Finally, we recognise that to mimic typical hydrological impact studies, JULES was run standalone driven by climate model output without feedbacks to the driving climate model. For example, disabling the stomatal response to rising CO2 in JULES typically increases transpiration (Fig. 2), which typically enhances atmospheric moisture affecting humidity, temperature, and precipitation. Such feedbacks could amplify differences in water scarcity projections between simulations with and without vegetation responses. Assessing the importance of these missing interactions could highlight the value of using hydrological models coupled to the atmosphere for water scarcity assessments.
Our results suggest that including plant stomatal and structural responses to rising CO2 and climate change in JULES partially moderates water scarcity in many regions throughout this century. CO2-induced stomatal closure enhances water-use efficiency and thus increases water availability, particularly in the tropics, which leads to reductions in WSI in many regions. However, the largest gains occur in already wet regions, so globally averaged reductions in WSI are smaller than the corresponding increases in water supply. Our projections also indicate increases in WSI in certain semi-arid and arid regions, attributed to CO2- and climate-induced expansions in vegetation cover and leaf area, reducing water availability in already water-limited areas. When averaged across IPCC climate regions and river basins, incorporating of all vegetation responses partially reduces projected WSI for most of the global population.
Modelling the complex interactions between the biosphere and hydrosphere under changing climate involves inherent limitations. The results presented here rely on assumptions and parameterisations in the JULES land surface model. Further research, particularly using improved representations of plant responses to elevated CO2 and climate change, supported by observational data, is needed. Gathering large-scale empirical evidence on the strength of plant responses to CO2 at large scales will address modelling uncertainties and improve the reliability of future water scarcity projections for policymakers and water resource managers.
A1 The four JULES simulations and the combinations that isolate the different vegetation responses
Table A1The four JULES simulations driven by identical climate model output, and a combination of fixing plant CO2 and structural vegetation responses.
B1 Stomatal Conductance Scheme used in JULES
The version of JULES used in this study uses a coupled canopy conductance and photosynthesis model (Cox et al., 1998) where stomatal conductance to water vapour gs (m s−1) is based on:
where A is the net photosynthetic rate (mol CO2 m−2 s−1), R is the universal gas constant (J K−1 mol−1), T∗ is the leaf surface temperature (K), ci the internal CO2 partial pressure (Pa), ca the leaf surface CO2 partial pressure (Pa) and factor of 1.6 accounting for molecular diffusivity differences between water and CO2. Vapour deficit at the leaf surface (D, kg kg−1) affects stomatal conductance through the gradient between ca and ci is based on the equation by Jacobs (1994):
where Γ∗ is the photorespiration compensation point (Pa) and Dcrit and f0 are PFT-specific calibration parameters, which are directly related to the parameters from the Leuning (1995) model (for details see Cox et al., 1998). Potential non-stressed leaf level photosynthesis is calculated in JULES using the C3 and C4 photosynthesis models of Collatz et al. (1991) and Collatz et al. (1992) respectively.
The Jacobs formulation is a simplified version of the Leuning (1995) model, which in turn is based on the (Ball et al., 1987) model but depends on humidity deficit at the leaf surface instead of relative humidity.
B2 Runoff processes in JULES
In this version of JULES, soil is divided into 4 layers, each with its own water content, which is determined by considering the inputs, such as precipitation, and outputs such as evapotranspiration and infiltration. The moisture content of each soil layer influences water movement, affecting how much percolates downward to deeper layers or moves horizontally as lateral flow. Additionally, in this version of JULES a TOPMODEL-type scheme is included, based on Clark and Gedney (2008) and Gedney and Cox (2003). This accounts for the influence of topography on soil moisture and runoff, enhancing JULES's ability to simulate the sub-grid spatial variability. Surface runoff is generated when precipitation exceeds the soil's infiltration capacity, when the soil becomes fully saturated, or when sub-grid scale inundation occurs. In TOPMODEL-based schemes, sub-surface runoff, or “baseflow”, occurs with lateral flow below the water table, and its magnitude is influenced by soil moisture and soil type.
Python has been used to conduct our analysis. Code is available on GitHub at https://github.com/jessica-stacey/water-scarcity-plants-jules (last access: 2 June 2026).
The processed output from the JULES simulations is publicly available from Zenodo at https://doi.org/10.5281/zenodo.20826090 (Stacey, 2026). Water demand data is available from the ISIMIP database (e.g., https://data.isimip.org/search/query/amanww/tree/ISIMIP2b/OutputData/water_global/h08/hadgem2-es/, last access: 23 June 2026). Population data is also available from the ISIMIP database (https://data.isimip.org/datasets/6eee7c61-4baa-4b1d-aa81-d854f217f07e/, last access: 23 June 2026).
The supplement related to this article is available online at https://doi.org/10.5194/hess-30-4225-2026-supplement.
JS: Conceptualisation, investigation, methodology, formal analysis, visualisation, writing draft. RAB: Conceptualisation, methodology, supervision, writing (review and editing). AH: Supervision, methodology, validation, writing (review and editing). LMM: Supervision, writing (review and editing). NG: Writing (review and editing).
The contact author has declared that none of the authors has any competing interests.
Publisher's note: Copernicus Publications remains neutral with regard to jurisdictional claims made in the text, published maps, institutional affiliations, or any other geographical representation in this paper. The authors bear the ultimate responsibility for providing appropriate place names. Views expressed in the text are those of the authors and do not necessarily reflect the views of the publisher.
The authors would like to thank Dr Camilla Mathison and Dr Eleanor Burke for their dedicated effort in setting up the JULES ISIMIP2b suite and their guidance for getting it running. We are also thankful to Dr Chantelle Burton for her technical support to JS on the project. We would like to thank Dr Peter Greve for his support in providing early-stage data (ultimately not used in this study), guidance on obtaining monthly water demand data and discussions on calculating the Water Scarcity Index. Finally, we would like to express our gratitude to the ISIMIP (Inter-Sectoral Impact Model Intercomparison Project) team for maintaining high-quality datasets and fostering collaboration across the scientific community which have greatly contributed to the advancement of climate impact research. Also, we acknowledge the use of OpenAI's ChatGPT to enhance the clarity and accessibility of text drafted by JS, and GitHub's Copilot to refine code developed by JS for data analysis and visualisation. All outputs were meticulously reviewed, verified, and edited by JS to ensure accuracy, relevance, and adherence to scientific standards.
JS, RAB, AH and NG were supported by the Met Office Hadley Centre Climate Programme funded by the UK Department of Science, Innovation and Technology. NG, JS and RAB were additionally supported by the AmazonFACE programme funded by the UK Foreign, Commonwealth and Development Office and AH, NG and JS were further supported by the Climate Science for Service Partnership Brazil project funded by DSIT. LMM acknowledges funding by UK Natural Environment Research Council grant no. NE/W004895/1.
This paper was edited by Elham R. Freund and reviewed by two anonymous referees.
Ball, J. T., Woodrow, I. E., and Berry, J. A.: A Model Predicting Stomatal Conductance and its Contribution to the Control of Photosynthesis under Different Environmental Conditions, in: Progress in Photosynthesis Research: Volume 4, Proceedings of the VIIth International Congress on Photosynthesis Providence, Rhode Island, USA, August 10–15, 1986, edited by: Biggins, J., Springer Netherlands, Dordrecht, 221–224, https://doi.org/10.1007/978-94-017-0519-6_48, 1987.
Battipaglia, G., Saurer, M., Cherubini, P., Calfapietra, C., Mccarthy, H. R., Norby, R. J., and Francesca Cotrufo, M.: Elevated CO2 increases tree-level intrinsic water use efficiency: Insights from carbon and oxygen isotope analyses in tree rings across three forest FACE sites, New Phytol., 197, 544–554, https://doi.org/10.1111/nph.12044, 2013.
Best, M. J., Pryor, M., Clark, D. B., Rooney, G. G., Essery, R. L. H., Ménard, C. B., Edwards, J. M., Hendry, M. A., Porson, A., Gedney, N., Mercado, L. M., Sitch, S., Blyth, E., Boucher, O., Cox, P. M., Grimmond, C. S. B., and Harding, R. J.: The Joint UK Land Environment Simulator (JULES), model description – Part 1: Energy and water fluxes, Geosci. Model Dev., 4, 677–699, https://doi.org/10.5194/gmd-4-677-2011, 2011.
Betts, R. A., Cox, P. M., Lee, S. E., and Woodward, F. I.: Contrasting physiological and structural vegetation feedbacks in climate change simulations, Nature, 387, 796–799, https://doi.org/10.1038/42924, 1997.
Betts, R. A., Boucher, O., Collins, M., Cox, P. M., Falloon, P. D., Gedney, N., Hemming, D. L., Huntingford, C., Jones, C. D., Sexton, D. M. H., and Webb, M. J.: Projected increase in continental runoff due to plant responses to increasing carbon dioxide, Nature, 448, 1037–1041, https://doi.org/10.1038/nature06045, 2007.
Cao, L., Bala, G., Caldeira, K., Nemani, R., and Ban-Weiss, G.: Importance of carbon dioxide physiological forcing to future climate change, Proc. Natl. Acad. Sci. USA, 107, 9513–9518, https://doi.org/10.1073/pnas.0913000107, 2010.
Caretta, M. A., Mukherji, A., Arfanuzzaman, M., Betts, R. A., Gelfan, A., Hirabayashi, Y., Lissner, T. K., Liu, J., Gunn, E. L., Morgan, R., Mwanga, S., Supratid, S., Pörtner, H.-O., Roberts, D. C., Tignor, M., Poloczanska, E. S., Mintenbeck, K., Alegría, A., Craig, M., Langsdorf, S., Löschke, S., Möller, V., Okem, A., and Rama, B.: 2022: Water, in: Climate Change 2022: Impacts, Adaptation, and Vulnerability, Contribution of Working Group II to the Sixth Assessment Report of the Intergovernmental Panel on Climate Change, 551–712, https://doi.org/10.1017/9781009325844.006, 2022.
Clark, D. B. and Gedney, N.: Representing the effects of subgrid variability of soil moisture on runoff generation in a land surface model, J. Geophys. Res. Atmos., 113, https://doi.org/10.1029/2007JD008940, 2008.
Clark, D. B., Mercado, L. M., Sitch, S., Jones, C. D., Gedney, N., Best, M. J., Pryor, M., Rooney, G. G., Essery, R. L. H., Blyth, E., Boucher, O., Harding, R. J., Huntingford, C., and Cox, P. M.: The Joint UK Land Environment Simulator (JULES), model description – Part 2: Carbon fluxes and vegetation dynamics, Geosci. Model Dev., 4, 701–722, https://doi.org/10.5194/gmd-4-701-2011, 2011.
Collatz, G. J., Ball, J. T., Grivet, C., and Berry, J. A.: Physiological and environmental regulation of stomatal conductance, photosynthesis and transpiration: a model that includes a laminar boundary layer, Agric. For. Meteorol., 54, 107–136, https://doi.org/10.1016/0168-1923(91)90002-8, 1991.
Collatz, G., Ribas-Carbo, M., and Berry, J.: Coupled Photosynthesis-Stomatal Conductance Model for Leaves of C4 Plants, Funct. Plant Biol., 19, 519–538, https://doi.org/10.1071/PP9920519, 1992.
Cowan, I. R.: Stomatal Behaviour and Environment, Adv. Bot. Res., 4, 117–228, https://doi.org/10.1016/S0065-2296(08)60370-5, 1978.
Cowling, S. A. and Field, C. B.: Environmental control of leaf area production: Implications for vegetation and land-surface modeling, Global Biogeochem. Cycles, 17, 7-1-7-14, https://doi.org/10.1029/2002GB001915, 2003.
Cox, P. M., Huntingford, C., and Harding, R. J.: A canopy conductance and photosynthesis model for use in a GCM land surface scheme, J. Hydrol., 213, 79–94, https://doi.org/10.1016/S0022-1694(98)00203-0, 1998.
Cox, P.M.: Description of the TRIFFID dynamic global vegetation model, Hadley Centre Technical Note 24, Met Office Hadley Centre, 2001.
Davie, J. C. S., Falloon, P. D., Kahana, R., Dankers, R., Betts, R., Portmann, F. T., Wisser, D., Clark, D. B., Ito, A., Masaki, Y., Nishina, K., Fekete, B., Tessler, Z., Wada, Y., Liu, X., Tang, Q., Hagemann, S., Stacke, T., Pavlick, R., Schaphoff, S., Gosling, S. N., Franssen, W., and Arnell, N.: Comparing projections of future changes in runoff from hydrological and biome models in ISI-MIP, Earth Syst. Dyn., 4, 359–374, https://doi.org/10.5194/esd-4-359-2013, 2013.
De Kauwe, M. G., Medlyn, B. E., Zaehle, S., Walker, A. P., Dietze, M. C., Hickler, T., Jain, A. K., Luo, Y., Parton, W. J., Prentice, I. C., Smith, B., Thornton, P. E., Wang, S., Wang, Y.-P., Wårlind, D., Weng, E., Crous, K. Y., Ellsworth, D. S., Hanson, P. J., Seok Kim, H.-, Warren, J. M., Oren, R., and Norby, R. J.: Forest water use and water use efficiency at elevated: a model-data intercomparison at two contrasting temperate forest FACE sites, Glob. Chang. Biol., 19, 1759–1779, https://doi.org/10.1111/gcb.12164, 2013.
Dolan, F., Lamontagne, J., Link, R., Hejazi, M., Reed, P., and Edmonds, J.: Evaluating the economic impact of water scarcity in a changing world, Nat Commun., 12, 1–10, https://doi.org/10.1038/s41467-021-22194-0, 2021.
Falkenmark, M., Lundqvist, J., and Widstrand, C.: Macro-scale water scarcity requires micro-scale approaches. Aspects of vulnerability in semi-arid development, Nat. Resour. Forum, 13, 258–267, https://doi.org/10.1111/j.1477-8947.1989.tb00348.x, 1989.
Falloon, P., Betts, R., and Bunton, C.: A new global river routing scheme in the Unified Model, Hadley Centre Technical Note 72, Met Office Hadley Centre, 2007.
Field, C. B., Jackson, R. B., and Mooney, H. A.: Stomatal responses to increased CO2: implications from the plant to the global scale, Plant Cell Environ., 18, 1214–1225, https://doi.org/10.1111/j.1365-3040.1995.tb00630.x, 1995.
Fisher, R. A. and Koven, C. D.: Perspectives on the Future of Land Surface Models and the Challenges of Representing Complex Terrestrial Systems, J. Adv. Model. Earth Syst., 12, e2018MS001453, https://doi.org/10.1029/2018MS001453, 2020.
Fowler, M. D., Kooperman, G. J., Randerson, J. T., and Pritchard, M. S.: The effect of plant physiological responses to rising CO2 on global streamflow, Nat. Clim. Chang., 9, 873–879, https://doi.org/10.1038/s41558-019-0602-x, 2019.
Gedney, N. and Cox, P. M.: The Sensitivity of Global Climate Model Simulations to the Representation of Soil Moisture Heterogeneity, J. Hydrometeorol., 4, 1265–1275, https://doi.org/10.1038/nature04504, 2003.
Gedney, N., Cox, P. M., Betts, R. A., Boucher, O., Huntingford, C., and Stott, P. A.: Detection of a direct carbon dioxide effect in continental river runoff records, Nature, 439, 835–838, https://doi.org/10.1038/nature04504, 2006.
Gedney, N., Huntingford, C., Weedon, G. P., Bellouin, N., Boucher, O., and Cox, P. M.: Detection of solar dimming and brightening effects on Northern Hemisphere river flow, Nat. Geosci., 7, 796–800, https://doi.org/10.1038/ngeo2263, 2014.
Gosling, S. N. and Arnell, N. W.: A global assessment of the impact of climate change on water scarcity, Clim. Change, 134, 371–385, https://doi.org/10.1007/s10584-013-0853-x, 2016.
Gosling, S. N., Müller Schmied, H., Burek, P., Chang, J., Ciais, P., Döll, P., Eisner, S., Fink, G., Flörke, M., Franssen, W., Grillakis, M., Hagemann, S., Hanasaki, N., Koutroulis, A., Leng, G., Liu, X., Masaki, Y., Mathison, C., Mishra, V., Ostberg, S., Portmann, F., Qi, W., Sahu, R.-K., Satoh, Y., Schewe, J., Seneviratne, S., Shah, H. L., Stacke, T., Tao, F., Telteu, C., Thiery, W., Trautmann, T., Tsanis, I., Wanders, N., Zhai, R., Büchner, M., Schewe, J., and Zhao, F.: ISIMIP2b Simulation Data from the Global Water Sector, ISIMIP [data set], https://doi.org/10.48364/ISIMIP.626689, 2023.
Greve, P., Kahil, T., Mochizuki, J., Schinko, T., Satoh, Y., Burek, P., Fischer, G., Tramberend, S., Burtscher, R., Langan, S., and Wada, Y.: Global assessment of water challenges under uncertainty in water scarcity projections, Nat. Sustain., 1, 486–494, https://doi.org/10.1038/s41893-018-0134-9, 2018.
Haddeland, I., Heinke, J., Biemans, H., Eisner, S., Flörke, M., Hanasaki, N., Konzmann, M., Ludwig, F., Masaki, Y., Schewe, J., Stacke, T., Tessler, Z. D., Wada, Y., and Wisser, D.: Global water resources affected by human interventions and climate change, Proc. Natl. Acad. Sci. USA, 111, 3251–3256, https://doi.org/10.1073/pnas.1222475110, 2014.
Hanasaki, N., Kanae, S., Oki, T., Masuda, K., Motoya, K., Shirakawa, N., Shen, Y., and Tanaka, K.: An integrated model for the assessment of global water resources – Part 1: Model description and input meteorological forcing, Hydrol. Earth Syst. Sci., 12, 1007–1025, https://doi.org/10.5194/hess-12-1007-2008, 2008a.
Hanasaki, N., Kanae, S., Oki, T., Masuda, K., Motoya, K., Shirakawa, N., Shen, Y., and Tanaka, K.: An integrated model for the assessment of global water resources – Part 2: Applications and assessments, Hydrol. Earth Syst. Sci., 12, 1027–1037, https://doi.org/10.5194/hess-12-1027-2008, 2008b.
Hanasaki, N., Yoshikawa, S., Pokhrel, Y., and Kanae, S.: A global hydrological simulation to specify the sources of water used by humans, Hydrol. Earth Syst. Sci., 22, 789–817, https://doi.org/10.5194/hess-22-789-2018, 2018.
Harper, A. B., Cox, P. M., Friedlingstein, P., Wiltshire, A. J., Jones, C. D., Sitch, S., Mercado, L. M., Groenendijk, M., Robertson, E., Kattge, J., Bönisch, G., Atkin, O. K., Bahn, M., Cornelissen, J., Niinemets, Ü., Onipchenko, V., Peñuelas, J., Poorter, L., Reich, P. B., Soudzilovskaia, N. A., and Bodegom, P. V.: Improved representation of plant functional types and physiology in the Joint UK Land Environment Simulator (JULES v4.2) using plant trait information, Geosci. Model Dev., 9, 2415–2440, https://doi.org/10.5194/gmd-9-2415-2016, 2016.
Iturbide, M., Gutiérrez, J. M., Alves, L. M., Bedia, J., Cerezo-Mota, R., Cimadevilla, E., Cofiño, A. S., Di Luca, A., Faria, S. H., Gorodetskaya, I. V., Hauser, M., Herrera, S., Hennessy, K., Hewitt, H. T., Jones, R. G., Krakovska, S., Manzanas, R., Martínez-Castro, D., Narisma, G. T., Nurhati, I. S., Pinto, I., Seneviratne, S. I., van den Hurk, B., and Vera, C. S.: An update of IPCC climate reference regions for subcontinental analysis of climate model data: definition and aggregated datasets, Earth Syst. Sci. Data, 12, 2959–2970, https://doi.org/10.5194/essd-12-2959-2020, 2020.
Jacobs, C. M. J.: Direct Impact of Atmospheric CO2 Enrichment on Regional Transpiration, Wageningen Agricultural University, PhD Thesis, 1994.
Jones, C. D., Hughes, J. K., Bellouin, N., Hardiman, S. C., Jones, G. S., Knight, J., Liddicoat, S., O'Connor, F. M., Andres, R. J., Bell, C., Boo, K.-O., Bozzo, A., Butchart, N., Cadule, P., Corbin, K. D., Doutriaux-Boucher, M., Friedlingstein, P., Gornall, J., Gray, L., Halloran, P. R., Hurtt, G., Ingram, W. J., Lamarque, J.-F., Law, R. M., Meinshausen, M., Osprey, S., Palin, E. J., Parsons Chini, L., Raddatz, T., Sanderson, M. G., Sellar, A. A., Schurer, A., Valdes, P., Wood, N., Woodward, S., Yoshioka, M., and Zerroukat, M.: The HadGEM2-ES implementation of CMIP5 centennial simulations, Geosci. Model Dev., 4, 543–570, https://doi.org/10.5194/gmd-4-543-2011, 2011.
Kooperman, G. J., Fowler, M. D., Hoffman, F. M., Koven, C. D., Lindsay, K., Pritchard, M. S., Swann, A. L. S., and Randerson, J. T.: Plant Physiological Responses to Rising CO2 Modify Simulated Daily Runoff Intensity With Implications for Global-Scale Flood Risk Assessment, Geophys. Res. Lett., 45, 12457–12466, https://doi.org/10.1029/2018GL079901, 2018.
Lange, S.: Trend-preserving bias adjustment and statistical downscaling with ISIMIP3BASD (v1.0), Geosci. Model Dev., 12, 3055–3070, https://doi.org/10.5194/gmd-12-3055-2019, 2019.
Lehner, B. and Grill, G.: Global river hydrography and network routing: baseline data and new approaches to study the world's large river systems, Hydrol. Process., 27, 2171–2186, https://doi.org/10.1002/hyp.9740, 2013.
Lemordant, L., Gentine, P., Swann, A. S., Cook, B. I., and Scheff, J.: Critical impact of vegetation physiology on the continental hydrologic cycle in response to increasing CO2, Proc. Natl. Acad. Sci. USA, 115, 4093–4098, https://doi.org/10.1073/pnas.1720712115, 2018.
Leuning, R.: A critical appraisal of a combined stomatal-photosynthesis model for C3 plants, Plant Cell Environ., 18, 339–355, https://doi.org/10.1111/j.1365-3040.1995.tb00370.x, 1995.
Mankin, J. S., Seager, R., Smerdon, J. E., Cook, B. I., and Williams, A. P.: Mid-latitude freshwater availability reduced by projected vegetation responses to climate change, Nat. Geosci., 12, 983–988, https://doi.org/10.1038/s41561-019-0480-x, 2019.
Mathison, C., Burke, E., Hartley, A. J., Kelley, D. I., Burton, C., Robertson, E., Gedney, N., Williams, K., Wiltshire, A., Ellis, R. J., Sellar, A. A., and Jones, C. D.: Description and evaluation of the JULES-ES set-up for ISIMIP2b, Geosci. Model Dev., 16, 4249–4264, https://doi.org/10.5194/gmd-16-4249-2023, 2023.
Norby, R. J. and Zak, D. R.: Ecological lessons from free air carbon enhancement (FACE) experiments, Annu. Rev. Ecol. Evol. Syst., 42, https://doi.org/10.1146/annurev-ecolsys-102209-144647, 2011.
Parmesan, C., Morecroft, M. D., Trisurat, Y., Adrian, R., Anshari, G. Z., Arneth, A., Gao, Q., Gonzalez, P., Harris, R., Price, J., Stevens, N., and Talukdar, G. H.: Terrestrial and freshwater ecosystems and their services, in: Climate Change 2022: Impacts, Adaptation and Vulnerability, Contribution of Working Group II to the Sixth Assessment Report of the Intergovernmental Panel on Climate Change, edited by: Pörtner, H.-O., Roberts, D. C., Tignor, M., Poloczanska, E. S., Mintenbeck, K., Alegría, A., Craig, M., Langsdorf, S., Löschke, S., Möller, V., Okem, A., and Rama, B., Cambridge University Press, Cambridge, UK, and New York, NY, USA, 197–377, https://doi.org/10.1017/9781009325844.004, 2022.
Piao, S., Friedlingstein, P., Ciais, P., De Noblet-Ducoudré, N., Labat, D., and Zaehle, S.: Changes in climate and land use have a larger direct impact than rising CO2 on global river runoff trends, Proc. Natl. Acad. Sci. USA, 104, 15242–15247, https://doi.org/10.1073/pnas.0707213104, 2007.
Piontek, F. and Geiger, T.: ISIMIP2b secondary population input data (1.0), ISIMIP [data set], https://doi.org/10.48364/ISIMIP.432399, 2017.
Raskin, P. and Gleick, P. H.: Water Futures: Assessment of Long-range Patterns and Problems, Stockholm Environment Institute, Stockholm, 1997.
Riahi, K., van Vuuren, D. P., Kriegler, E., Edmonds, J., O'Neill, B. C., Fujimori, S., Bauer, N., Calvin, K., Dellink, R., Fricko, O., Lutz, W., Popp, A., Cuaresma, J. C., KC, S., Leimbach, M., Jiang, L., Kram, T., Rao, S., Emmerling, J., Ebi, K., Hasegawa, T., Havlik, P., Humpenöder, F., Da Silva, L. A., Smith, S., Stehfest, E., Bosetti, V., Eom, J., Gernaat, D., Masui, T., Rogelj, J., Strefler, J., Drouet, L., Krey, V., Luderer, G., Harmsen, M., Takahashi, K., Baumstark, L., Doelman, J. C., Kainuma, M., Klimont, Z., Marangoni, G., Lotze-Campen, H., Obersteiner, M., Tabeau, A., and Tavoni, M.: The Shared Socioeconomic Pathways and their energy, land use, and greenhouse gas emissions implications: An overview, Glob. Environ. Change, 42, 153–168, https://doi.org/10.1016/j.gloenvcha.2016.05.009, 2017.
Ripple, W. J., Wolf, C., Newsome, T. M., Galetti, M., Alamgir, M., Crist, E., Mahmoud, M. I., Laurance, W. F., and 15,364 scientist signatories from 184 countries: World Scientists' Warning to Humanity: A Second Notice, BioScience, 67, 1026–1028, https://doi.org/10.1093/biosci/bix125, 2017.
Schewe, J., Heinke, J., Gerten, D., Haddeland, I., Arnell, N. W., Clark, D. B., Dankers, R., Eisner, S., Fekete, B. M., Colón-González, F. J., Gosling, S. N., Kim, H., Liu, X., Masaki, Y., Portmann, F. T., Satoh, Y., Stacke, T., Tang, Q., Wada, Y., Wisser, D., Albrecht, T., Frieler, K., Piontek, F., Warszawski, L., and Kabat, P.: Multimodel assessment of water scarcity under climate change, Proc. Natl. Acad. Sci. USA, 111, 3245–3250, https://doi.org/10.1073/pnas.1222460110, 2013.
Schneider, U., Finger, P., Meyer-Christoffer, A., Rustemeier, E., Ziese, M., and Becker, A.: Evaluating the hydrological cycle over land using the newly-corrected precipitation climatology from the Global Precipitation Climatology Centre (GPCC), Atmosphere, 8, https://doi.org/10.3390/atmos8030052, 2017.
Sellar, A. A., Jones, C. G., Mulcahy, J. P., Tang, Y., Yool, A., Wiltshire, A., O'Connor, F. M., Stringer, M., Hill, R., Palmieri, J., Woodward, S., de Mora, L., Kuhlbrodt, T., Rumbold, S. T., Kelley, D. I., Ellis, R., Johnson, C. E., Walton, J., Abraham, N. L., Andrews, M. B., Andrews, T., Archibald, A. T., Berthou, S., Burke, E., Blockley, E., Carslaw, K., Dalvi, M., Edwards, J., Folberth, G. A., Gedney, N., Griffiths, P. T., Harper, A. B., Hendry, M. A., Hewitt, A. J., Johnson, B., Jones, A., Jones, C. D., Keeble, J., Liddicoat, S., Morgenstern, O., Parker, R. J., Predoi, V., Robertson, E., Siahaan, A., Smith, R. S., Swaminathan, R., Woodhouse, M. T., Zeng, G., and Zerroukat, M.: UKESM1: Description and Evaluation of the UK Earth System Model, J. Adv. Model. Earth Syst., 11, 4513–4558, https://doi.org/10.1029/2019MS001739, 2019.
Seneviratne, S. I., Zhang, X., Adnan, M., Badi, W., Dereczynski, C., Luca, A. D., Ghosh, S., Iskandar, I., Kossin, J., Lewis, S., Otto, F., Pinto, I., Satoh, M., Vicente-Serrano, S. M., Wehner, M., Zhou, B., and Allan, R.: Weather and climate extreme events in a changing climate, Climate Change 2021: The Physical Science Basis: Working Group I contribution to the Sixth Assessment Report of the Intergovernmental Panel on Climate Change, Cambridge University Press, 1513–1766, https://doi.org/10.1017/9781009157896.013, 2021.
Sitch, S., Huntingford, C., Gedney, N., Levy, P. E., Lomas, M., Piao, S. L., Betts, R., Ciais, P., Cox, P., Friedlingstein, P., Jones, C. D., Prentice, I. C., and Woodward, F. I.: Evaluation of the terrestrial carbon cycle, future plant geography and climate-carbon cycle feedbacks using five Dynamic Global Vegetation Models (DGVMs), Glob. Chang. Biol., 14, 2015–2039, https://doi.org/10.1111/j.1365-2486.2008.01626.x, 2008.
Sitch, S., O'Sullivan, M., Robertson, E., Friedlingstein, P., Albergel, C., Anthoni, P., Arneth, A., Arora, V. K., Bastos, A., Bastrikov, V., Bellouin, N., Canadell, J. G., Chini, L., Ciais, P., Falk, S., Harris, I., Hurtt, G., Ito, A., Jain, A. K., Jones, M. W., Joos, F., Kato, E., Kennedy, D., Klein Goldewijk, K., Kluzek, E., Knauer, J., Lawrence, P. J., Lombardozzi, D., Melton, J. R., Nabel, J. E. M. S., Pan, N., Peylin, P., Pongratz, J., Poulter, B., Rosan, T. M., Sun, Q., Tian, H., Walker, A. P., Weber, U., Yuan, W., Yue, X., and Zaehle, S.: Trends and Drivers of Terrestrial Sources and Sinks of Carbon Dioxide: An Overview of the TRENDY Project, Global Biogeochem. Cycles, 38, e2024GB008102, https://doi.org/10.1029/2024GB008102, 2024.
Stacey, J.: jules_processed_output_water_scarcity_vegetation, Zenodo [data set], https://doi.org/10.5281/zenodo.20826090, 2026.
Swann, A. L. S., Hoffman, F. M., Koven, C. D., and Randerson, J. T.: Plant responses to increasing CO2 reduce estimates of climate impacts on drought severity, Proc. Natl. Acad. Sci. USA, 113, 10019–10024, https://doi.org/10.1073/pnas.1604581113, 2016.
Ukkola, A. M., Prentice, I. C., Keenan, T. F., Van Dijk, A. I. J. M., Viney, N. R., Myneni, R. B., and Bi, J.: Reduced streamflow in water-stressed climates consistent with CO2 effects on vegetation, Nat. Clim. Change, 6, 75–78, https://doi.org/10.1038/NCLIMATE2831, 2016.
Walker, A. P., Hanson, P. J., De Kauwe, M. G., Medlyn, B. E., Zaehle, S., Asao, S., Dietze, M., Hickler, T., Huntingford, C., Iversen, C. M., Jain, A., Lomas, M., Luo, Y., McCarthy, H., Parton, W. J., Prentice, I. C., Thornton, P. E., Wang, S., Wang, Y.-P., Warlind, D., Weng, E., Warren, J. M., Woodward, F. I., Oren, R., and Norby, R. J.: Comprehensive ecosystem model-data synthesis using multiple data sets at two temperate forest free-air CO2 enrichment experiments: Model performance at ambient CO2 concentration, J. Geophys. Res. Biogeosciences, 119, 937–964, https://doi.org/10.1002/2013JG002553, 2014.
Wang, T. and Sun, F.: Socioeconomic exposure to drought under climate warming and globalization: The importance of vegetation-CO2 feedback, Int. J. Climatol., https://doi.org/10.1002/joc.8174, 2023.
Wei, H., Zhang, Y., Huang, Q., Chiew, F. H. S., Luan, J., Xia, J., and Liu, C.: Direct vegetation response to recent CO2 rise shows limited effect on global streamflow, Nat. Commun., 15, 9423, https://doi.org/10.1038/s41467-024-53879-x, 2024.
Wei, Z., Yoshimura, K., Wang, L., Miralles, D. G., Jasechko, S., and Lee, X.: Revisiting the contribution of transpiration to global terrestrial evapotranspiration, Geophys. Res. Lett., 44, 2792–2801, https://doi.org/10.1002/2016GL072235, 2017.
Wigley, T. M. L. and Jones, P. D.: Influences of precipitation changes and direct CO2 effects on streamflow, Nature, 314, 149–152, https://doi.org/10.1038/314149a0, 1985.
Wiltshire, A., Gornall, J., Booth, B., Dennis, E., Falloon, P., Kay, G., McNeall, D., McSweeney, C., and Betts, R.: The importance of population, climate change and CO2 plant physiological forcing in determining future global water stress, Glob. Environ. Change, 23, 1083–1097, https://doi.org/10.1016/j.gloenvcha.2013.06.005, 2013a.
Wiltshire, A. J., Kay, G., Gornall, J. L., and Betts, R. A.: The impact of climate, CO2 and population on regional food and water resources in the 2050s, Sustainability (Switzerland), 5, 2129–2151, https://doi.org/10.3390/su5052129, 2013b.
Xu, H., Wang, X., and Yang, T.: Trend shifts in satellite-derived vegetation growth in Central Eurasia, 1982–2013, Sci. Total Environ., 579, 1658–1674, https://doi.org/10.1016/j.scitotenv.2016.11.182, 2017.
Yang, H., Huntingford, C., Wiltshire, A., Sitch, S., and Mercado, L.: Compensatory climate effects link trends in global runoff to rising atmospheric CO2 concentration, Environ. Res. Lett., 14, 124075, https://doi.org/10.1088/1748-9326/ab5c6f, 2019.
Yu, T., Sun, R., Xiao, Z., Zhang, Q., Liu, G., Cui, T., and Wang, J.: Estimation of Global Vegetation Productivity from Global Land Surface Satellite Data, Remote Sens., 10, 327, https://doi.org/10.3390/rs10020327, 2018.
Zhu, Z., Piao, S., Myneni, R. B., Huang, M., Zeng, Z., Canadell, J. G., Ciais, P., Sitch, S., Friedlingstein, P., Arneth, A., Cao, C., Cheng, L., Kato, E., Koven, C., Li, Y., Lian, X., Liu, Y., Liu, R., Mao, J., Pan, Y., Peng, S., Peuelas, J., Poulter, B., Pugh, T. A. M., Stocker, B. D., Viovy, N., Wang, X., Wang, Y., Xiao, Z., Yang, H., Zaehle, S., and Zeng, N.: Greening of the Earth and its drivers, Nat. Clim. Change, 6, 791–795, https://doi.org/10.1038/nclimate3004, 2016.