the Creative Commons Attribution 4.0 License.
the Creative Commons Attribution 4.0 License.
 | 01 Jul 2026
Assessment of SWOT water surface elevations for flood monitoring of a narrow river ( < 50 m width)
Amal Mzoughi
Mélanie Trudel
Pascale M. Biron
Guénolé Choné
Gabriela L. Siles
Floods are among the most frequent and damaging natural hazards worldwide, and reliable observations of water surface elevation (WSE) are essential for improving flood modelling and risk management. The Surface Water and Ocean Topography (SWOT) satellite, launched in 2022, offers new opportunities to monitor river hydrodynamics from space, but its performance in relatively narrow rivers (< 50 m width) remains poorly documented. This study evaluates the potential of SWOT WSEs for flood monitoring through a site-specific hydraulic application by comparing them with in situ observations as well as simulations from an existing large-scale hydraulic model (LISFLOOD-FP) on the Du Gouffre River (width ≈ 40 m), located in Quebec, Canada. The L2_HR_RiverSP (RiverSP) SWOT product Version D, derived from a priori database (SWORD-version 17b), was first compared with one-minute WSE measurements from a tidal gauge located downstream the Du Gouffre River in the St. Lawrence River. This comparison, based on in situ reference measurements, confirmed the overall quality of the SWOT data in this area, with a Root Mean Square Error (RMSE) of 0.25 m. Then, a major flood event (with a return period of about 60 years) which occurred on 1 May 2023, during the SWOT's calibration orbit, was used to conduct a daily analysis of the entire flood event. Eleven observation cycles, covering the period from 25 April to 7 May 2023, were analysed. Limited ground-based observations were available along the studied reach during the flood, highlighting the added value of SWOT observations in this data-scarce context. The 1D/2D hydraulic model LISFLOOD-FP was run for the discharges corresponding to eleven SWOT cycles. Comparisons between SWOT-derived WSEs and model-simulated WSEs yielded biases ranging from −0.30 to 0.43 m and RMSE values between 0.22 and 0.54 m, indicating generall consistent behavior between observed and simulated WSEs across the analyzed cycles. During the flood peak on 1 May, larger discrepancies were observed, reflecting uncertainties in upstream discharge estimates under extreme flow conditions. In this context, SWOT-derived WSEs provided complementary information that helped diagnose discharge underestimation during the peak event. These results are not intended as an independent validation of SWOT measurement accuracy but are specific to the river and flood event under study and demonstrate the practical usefulness of SWOT observations for hydraulic studies in narrow rivers. They highlight the potential contribution of SWOT data for flood monitoring and hydraulic modelling in similar data-scarce contexts, particularly under extreme hydrological conditions.
- Article
(3793 KB) - Full-text XML
- BibTeX
- EndNote


As floods are the most significant and costly natural hazard, efforts are underway around the world to improve how we assess, forecast, and map floods and their impacts (Barendrecht et al., 2017). Hydraulic modelling is the most widely used method for flood mapping to facilitate risk assessment (Teng et al., 2017). A hydraulic model allows the simulation of the spatio-temporal evolution of a river's hydraulic variables such as water surface elevation (WSE) and flow velocity, as well as the flooded area, through the application of mass and momentum conservation equations. It requires information on discharge, boundary conditions of the study domain, and characteristics of the area under study (river shape, roughness). The validation of a hydraulic model mainly depends on the quantity, quality, and type of observed WSE. However, hydraulic models require extensive data, which poses significant challenges (Teng et al., 2017). Given the decline in hydrometric stations (Grimaldi et al., 2016; Mishra and Coulibaly, 2009), their limited spatial and temporal coverage and the limited accessibility of measurement sites, especially during flood periods, observations are not always available or sufficient, which complicates the validation of hydraulic models and affects the reliability of simulations.
In this context, the integration of remotely sensed variables such as WSE (Domeneghetti et al., 2021) and flood extents (Wood et al., 2016) into flood hydraulic modelling could potentially provide valuable information for model validation. Flood extents are usually derived from optical (Huang et al., 2018) or synthetic aperture radar (SAR) sensors (Landuyt et al., 2018). Radar can measure regardless of illumination or weather conditions, whereas optical sensors cannot. This can significantly influence the ability to continuously monitor water, particularly during floods. By overlaying the water extent extracted onto a digital elevation model (DEM), it is possible to retrieve the WSE (Grimaldi et al., 2016), although the accuracy of the WSE value is affected by the resolution of the DEM. Laser and radar altimeters have also been used to measure river WSEs directly (Cretaux et al., 2018). Nielsen et al. (2022) worked with data from several altimetric missions in rivers with widths ranging from a few hundred meters to around 3 km, whereas Li et al. (2023) evaluated how well ICESat-2 laser altimetry could measure WSE in rivers ranging from medium-width (around 1000 m wide) to narrower ones (under 50 m). These findings revealed that, despite advances, getting reliable measurements for rivers narrower than 30 m and sometimes even those up to 90 m wide, remains challenging (Li et al., 2023).
The Surface Water and Ocean Topography (SWOT) mission, led by the National Aeronautics and Space Administration (NASA) and the Centre National d'Études Spatiales (CNES), in collaboration with the Canadian Space Agency (CSA) and the UK Space Agency (UKSA), was launched in December 2022 to address these gaps (Biancamaria et al., 2016; Fu et al., 2024). The Ka-band Radar Interferometer (KaRIn), combined with SWOT's low near-nadir incidence angles, enables the satellite to observe at least 90 % of the world's rivers wider than 50–100 m, as well as lakes, reservoirs, and wetlands larger than 250 m × 250 m (Biancamaria et al., 2016). The expected vertical accuracy of WSE is 10 cm when pixels are averaged over 1 km2 (Peral et al., 2024). The satellite was initially deployed on a 1-day calibration/validation (CAL/VAL) orbit covering only a certain portion of the Earth between April and July 2023. It was then moved to its nominal 21-day orbit.
To study the potential of the SWOT mission to monitor floods with its 21-day orbit, some studies have been conducted using synthetic SWOT data generated by the CNES large-scale hydrology simulator (SWOT simulator) prior to the mission launch. Frasson et al. (2019) estimated that SWOT would have provided at least one measurement of 55 % of the floods recorded between 1985 and 2018 by the Dartmouth Flood Observatory. According to Frasson et al. (2019), SWOT's ability to observe floods mainly depends on the site's latitude and the duration of the event. Indeed, long-duration floods are more likely to be observed more than once. Sites located between 20° S and 20° N will be observed once or twice per 21-day cycle, while higher latitudes will generally be observed two or more times per cycle. Following the satellite's launch, Laipelt et al. (2025) confirm the usefulness of SWOT data for flood studies with a very strong relationship (R2= 0.99) between actual SWOT observations of WSE variations and in situ measurements during an extreme flood that occurred in southern Brazil in 2024.
Subsequent validation studies have shown that the reported accuracy of SWOT WSE measurements varies with the study region, river width, and product type (PIXC, RiverSP node, and RiverSP reach), with errors decreasing because of spatial averaging. At the global scale, based on a worldwide evaluation including rivers of diverse width and hydrological conditions and using satellite-based WSE reference datasets such as Hydroweb (https://www.theia-land.fr/blog/product/hauteur-des-lacs-et-rivieres/, last access: 4 June 2026) and G-REALM (https://ipad.fas.usda.gov/cropexplorer/global_reservoir/, last access: 4 June 2026), the average measurement error is estimated to be below 0.15 m (Yu et al., 2024), which is consistent with the expected order of magnitude of the mission's performance. At the subcontinental scale, validation over India based on more than 14 000 observations across 419 hydrometrics stations showed relative errors of about 0.18 m for rivers wider than 100 m and about 0.26 m for narrower rivers, based on node-level evaluations, highlighting a clear dependence of SWOT WSE accuracy on river width (Patidar et al., 2025). These results consistently indicate that node-level SWOT WSE accuracy decreases for narrower rivers, while remaining within the range of typical in situ measurement uncertainties. At finer spatial scales, a watershed-scale assessment evaluated satellite performance using node-level WSE data. The SWOT Science Requirements are defined for reach-scale products, whereas the present assessment relies on node-level observations. Comparison with the mission requirements is therefore not appropriate. During the CAL/VAL orbit, validation against United States Geological Survey (USGS) gauging records, based on 39 stations, showed a median unbiased Root Mean Square Error (ubRMSE) of about 0.25 m, even for rivers narrower than 100 m and in some cases below 50 m (Jiang et al., 2025). This level of agreement is consistent with typical uncertainties in ground-based WSE measurements used in flood applications in the United States, which are commonly on the order of 0.15 to 0.30 m according to USGS guidelines (NOAA, 2011). In contrast to global-scale evaluations based on reach-averaged products, the present analysis relies on node-level WSEs, for which error metrics are expected to be larger due to the averaging over a smaller number of pixels. Nevertheless, studies specifically addressing SWOT performance in narrow rivers remain limited, particularly during a flood event. Moreover, most existing assessments rely on earlier versions of the SWOT products (Version C), while a more recent Version D is now available. These assessments primarily evaluate relative errors, in which potential systematic biases between SWOT WSE and reference observations are removed.
In this context, the present study investigates the ability of SWOT observations to support the analysis of hydraulic consistency and the calibration and validation of hydraulic models in a narrow river, using the most recent RiverSP Version D product. The analysis focuses on the Du Gouffre River (Quebec, Canada; ≈ 40 m wide), which experienced a major flood in May 2023 with an estimated return period of 60 years, based on three-hour averaged flows (Gouvernement du Québec, 2023), and for which a LISFLOOD-FP model (Bates and De Roo, 2000) was available. This rare and extreme event offers a valuable opportunity to assess SWOT performance under flood conditions in a narrow river through a concrete hydraulic case study. The Du Gouffre River sector was covered by the SWOT CAL/VAL orbit, enabling daily observations of the flood event. Unlike most previous studies, the evaluation is based on the smoothed WSE variable (wse_sm) from Version D and relies on a direct comparison of absolute WSEs, ensured through a consistent geoid conversion between SWOT observations and model outputs.
2.1 Study Area
The Du Gouffre River (Fig. 1) is located around 100 km north-east of Quebec City (Quebec, Canada). It is a dynamic meandering river, that crosses the municipalities of Saint-Urbain and Baie-Saint-Paul before joining the St. Lawrence River. The floodplain is between 300 and 400 m wide, with an average active channel width of about 40 m. The upstream sector of Saint-Urbain is characterized by a slope of 0.30 %, which decreases to 0.11 % in the sector of Baie-Saint-Paul. The downstream parts of the Du Gouffre River valley are influenced by the tides of the St. Lawrence River. The watershed of the Du Gouffre River covers an area of about 991 km2 . Among the main tributaries, the Bras du Nord Ouest River (100 km2) and the Des Mares River (115 km2) also represent important sub-watersheds within the Du Gouffre watershed (Fig. 1). The region is subject to frequent flooding (Gouvernement du Québec, 2023), especially in the Baie-Saint-Paul area, where the Du Gouffre River and the Bras du Nord-Ouest River meet within an urban perimeter. Three types of flooding can occur on the Du Gouffre River: open water flooding caused by heavy rainfall or snowmelt, ice jam flooding, and flooding caused by the overflow of the St. Lawrence River along the Baie-Saint-Paul shoreline during high tides and strong winds.
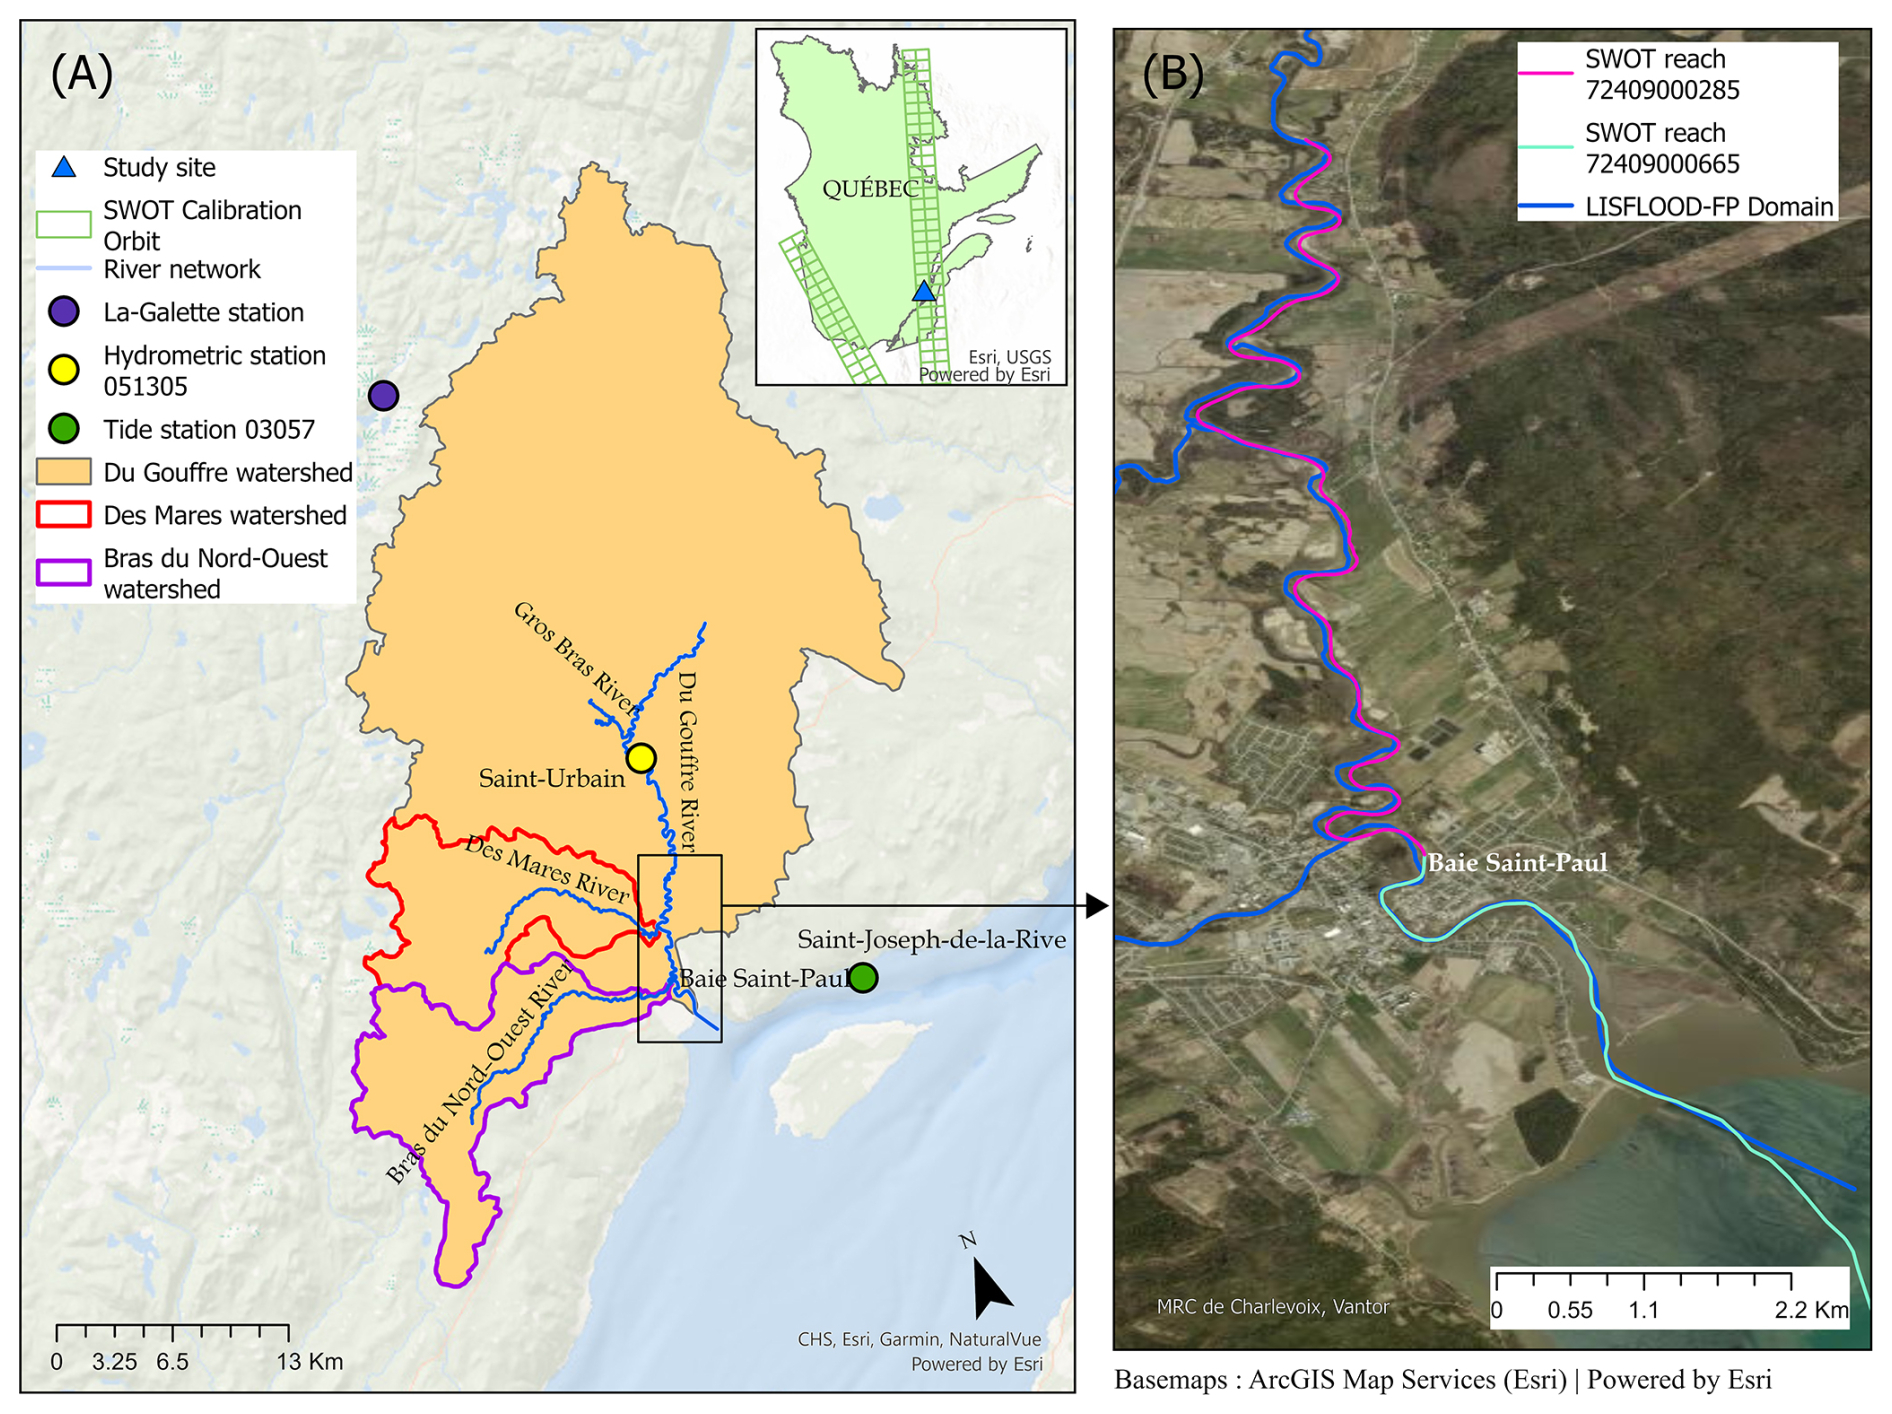
Figure 1Study area and spatial context of the Du Gouffre River in Québec, Canada. (A) Location of the Du Gouffre watershed and its main tributaries (Gros Bras River, Des Mares River, and Bras du Nord-Ouest River), together with the SWOT calibration orbit coverage. The positions of the hydrometric station Saint-Urbain (051305), the tide station Saint-Joseph-de-la-Rive (03057), and the La-Galette station are indicated. The inset map shows the location of the study area within the province of Québec. (B) Detailed view of the river reaches analyzed in this study near Baie-Saint-Paul, showing the SWOT river reaches and the LISFLOOD-FP model domain.
2.2 Flood Event
On 1 May 2023, an exceptional flood occurred in the Du Gouffre watershed. It was preceded by two weeks of spring snowmelt, during which approximately 170 mm of water from the snowpack flowed into the basin. This situation was exacerbated by the heavy rainfall between 30 April and 2 May 2023, totalling 95 mm at the centre of the watershed at Saint-Urbain, with up to 142 mm of rain recorded at the La-Galette station, located at the head of the watershed (Fig. 1), including almost 100 mm in the space of just 12 h (Gouvernement du Québec, 2023). These rainfall amounts, far exceeding the monthly averages for May (around 81 mm at La-Galette and 88 mm at Saint-Urbain), were intensified by a strong orographic effect in the high-altitude areas (Gouvernement du Québec, 2023). The river flow thus increased from 75 to 500 m3 s−1 in the span of 12 h, peaking around 12:30 (local time: UTC−4) on 1 May (Fig. 2). The recurrence of this flood at the hydrometric station 051305 (MELCCFP, 2025) in Saint-Urbain corresponds to a return period of 60 years for the maximum three-hour discharge, and 150 years for the daily average discharge. In the lower part of the river, near Baie-Saint-Paul, tidal fluctuations can also influence WSE and may contribute to worsening flood conditions when coinciding with river discharge peak. The SWOT satellite captured the 1 May flood through 13 acquisitions made before, during, and after the event (Fig. 2). For this study, the comparison with SWOT observations focuses on the period from 25 April to 7 May 2023, excluding cycles 504 and 505 due to invalid data.
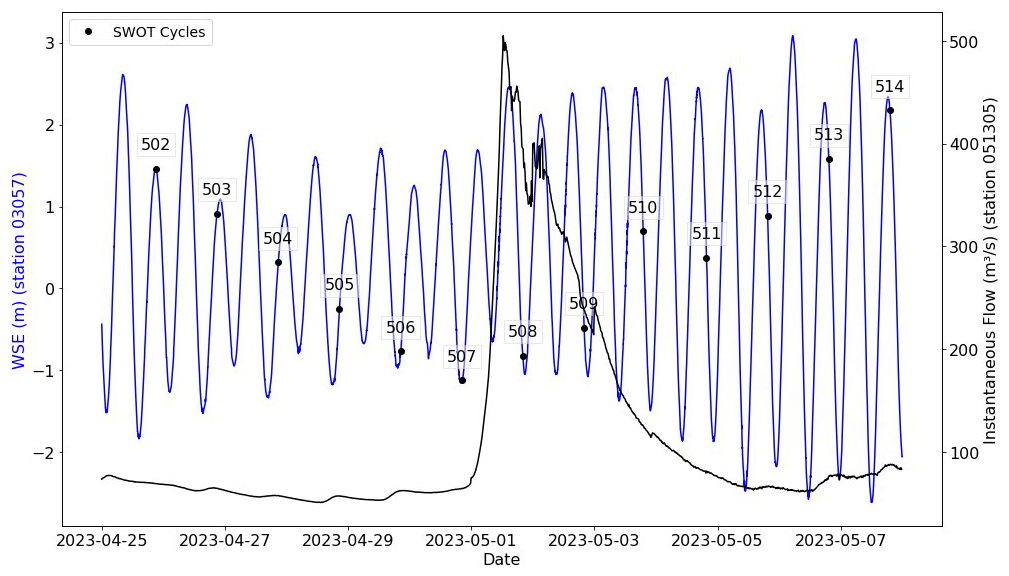
Figure 2Instantaneous discharge (black curve) measured at hydrometric station 051305, and the WSE (blue curve) recorded at the tide gauge station 03057, from 25 April to 7 May 2023. Vertical dashed lines indicate the dates of SWOT satellite acquisitions during the calibration orbit, with cycle numbers labeled. The flood peak occurred on 1 May 2023 at approximately 12:30 local time, reaching a discharge close to 500 m3 s−1.
2.3 Hydraulic Modelling: LISFLOOD-FP
An existing LISFLOOD-FP 1D-2D hydraulic model was used to simulate WSE and flooded areas in the Du Gouffre River between Saint-Urbain and Baie-Saint-Paul. This model, described in Choné et al. (2021, 2024), had been applied prior to the 2023 flood in this area as part of a large-scale modelling project based on high-resolution LiDAR (Light Detection And Ranging) data.
Unlike conventional hydraulic models such as HEC-RAS, which are typically site-specific, strongly calibrated, and reliant on extensive in situ datasets, LISFLOOD-FP was explicitly designed for large-scale floodplain applications where such detailed data are often unavailable. It employs a simplified raster-based framework with an estimated, thereby reducing both computational costs and input data requirements (Bessar et al., 2021; Horritt and Bates, 2001; Moghim et al., 2023). It uses an approach that solves the Saint-Venant equations on a 2D grid corresponding to the provided DEM for overbank flow and a 1D representation of in-channel flow, neglecting the advection term in the momentum equation, following the simplified approach proposed by Bates et al. (2010). The model is fed solely by remote-sensed data, incorporating an inverse hydraulic model to estimate bed elevation from LiDAR water surfaces, using the known discharge value on the LiDAR day of acquisition(Choné et al., 2021, 2024). While a constant Manning's roughness coefficient is prescribed over the study area, the adjustment of bed elevation constitutes the main calibration step of the hydraulic model.
Model boundary conditions include instantaneous discharge series applied at several domain entry points, as well as downstream WSEs provided by the tidal gauging station (Fisheries and Oceans Canada, 2025, Fig. 2). Tide data were initially provided at map datum (ZC), then corrected by −3.311 m to convert them to the Canadian Geodetic Vertical Datum of 1928 (CGVD28, epoch 1997) to ensure consistency of WSEs with the rest of the data used in the modelling.
The May 2023 flood modified the geomorphology of the Du Gouffre River and altered the historical relationships between WSE and discharge at the Saint-Urbain hydrometric station (MELCCFP, 2025). To take these changes into account, a new rating curve was developed by using the Baratinage software (INRAE, 2023), based on the available observations and their associated uncertainties. By interpolating the relationships between WSE and discharge, we were able to associate each WSE value with an average, a minimum and a maximum discharge. Since the Saint-Urbain station is located 11.6 km upstream of the SWOT study area, a drainage area transfer was applied across the LISFLOOD domain to account for spatial differences. The drainage area at Saint-Urbain is 632 km2 , compared with 889 km2 at Baie-Saint-Paul, and this scaling was used consistently to derive discharges at all input points of the model, therefore assuming a constant specific discharge.
Unlike the other cycles, during the peak flood of 1 May (cycle 508), the drainage-area-based transfer applied across the LISFLOOD-FP domain was not sufficient to capture the actual hydraulic conditions. The transposed discharge at the Saint-Urbain station (357 m3 s−1) was lower than the maximum value of 505 m3 s−1 recorded only a few hours before the SWOT overpass (Fig. 2). Given the 11.6 km distance between the station and the upstream limit of the SWOT-observed reach, it is plausible that the true discharge was higher at the time of acquisition. Furthermore, tributaries originating from the Nord-Ouest Massif, particularly the Des Mares River, contributed significant additional inflows during the event. The transposed discharge for this tributary was 82 m3 s−1, whereas Geneviève Marquis et al. (unpublished data, 2024) suggests that actual peak flows may have ranged between 150 and 200 m3 s−1. Radar-based analyses suggest that rainfall over the Nord-Ouest Massif was significantly more intense than recorded at available stations, potentially exceeding 240 mm according to Geneviève Marquis et al. (unpublished data, 2024), which further supports the hypothesis of underestimated discharges. Consequently, a specific discharge adjustment was performed for the Des Mares tributary, with tested inflows up to 240 m3 s−1, while the main channel discharge was constrained by the maximum value observed at Saint-Urbain (505 m3 s−1). In addition, sensitivity analyses were performed to assess the influence of key modelling assumptions on the simulated WSEs during the flood peak. In particular, the Manning's roughness coefficient and the downstream boundary condition were varied within physically plausible ranges (0.027, 0.028 and 0.029). These tests showed that such variations had a limited impact on the simulated WSEs and did not significantly reduce the discrepancies observed between LISFLOOD-FP simulations and SWOT-derived WSEs during cycle 508. Moreover, parameter adjustments that slightly improved agreement during the flood peak systematically led to a deterioration of model-SWOT consistency for the other cycles. This indicates that uncertainties related to channel roughness or downstream WSEs alone are insufficient to explain the observed mismatch at peak flow and supports the interpretation that the adjustment of tributary inflow was the primary factor contributing to the improved consistency between the hydraulic model and SWOT observations for this event.
This calibration, supported by SWOT observations, provided a more realistic hydraulic representation of the flood conditions for cycle 508 than that solely based on a drainage area ratio from the St-Urbain gauging station.
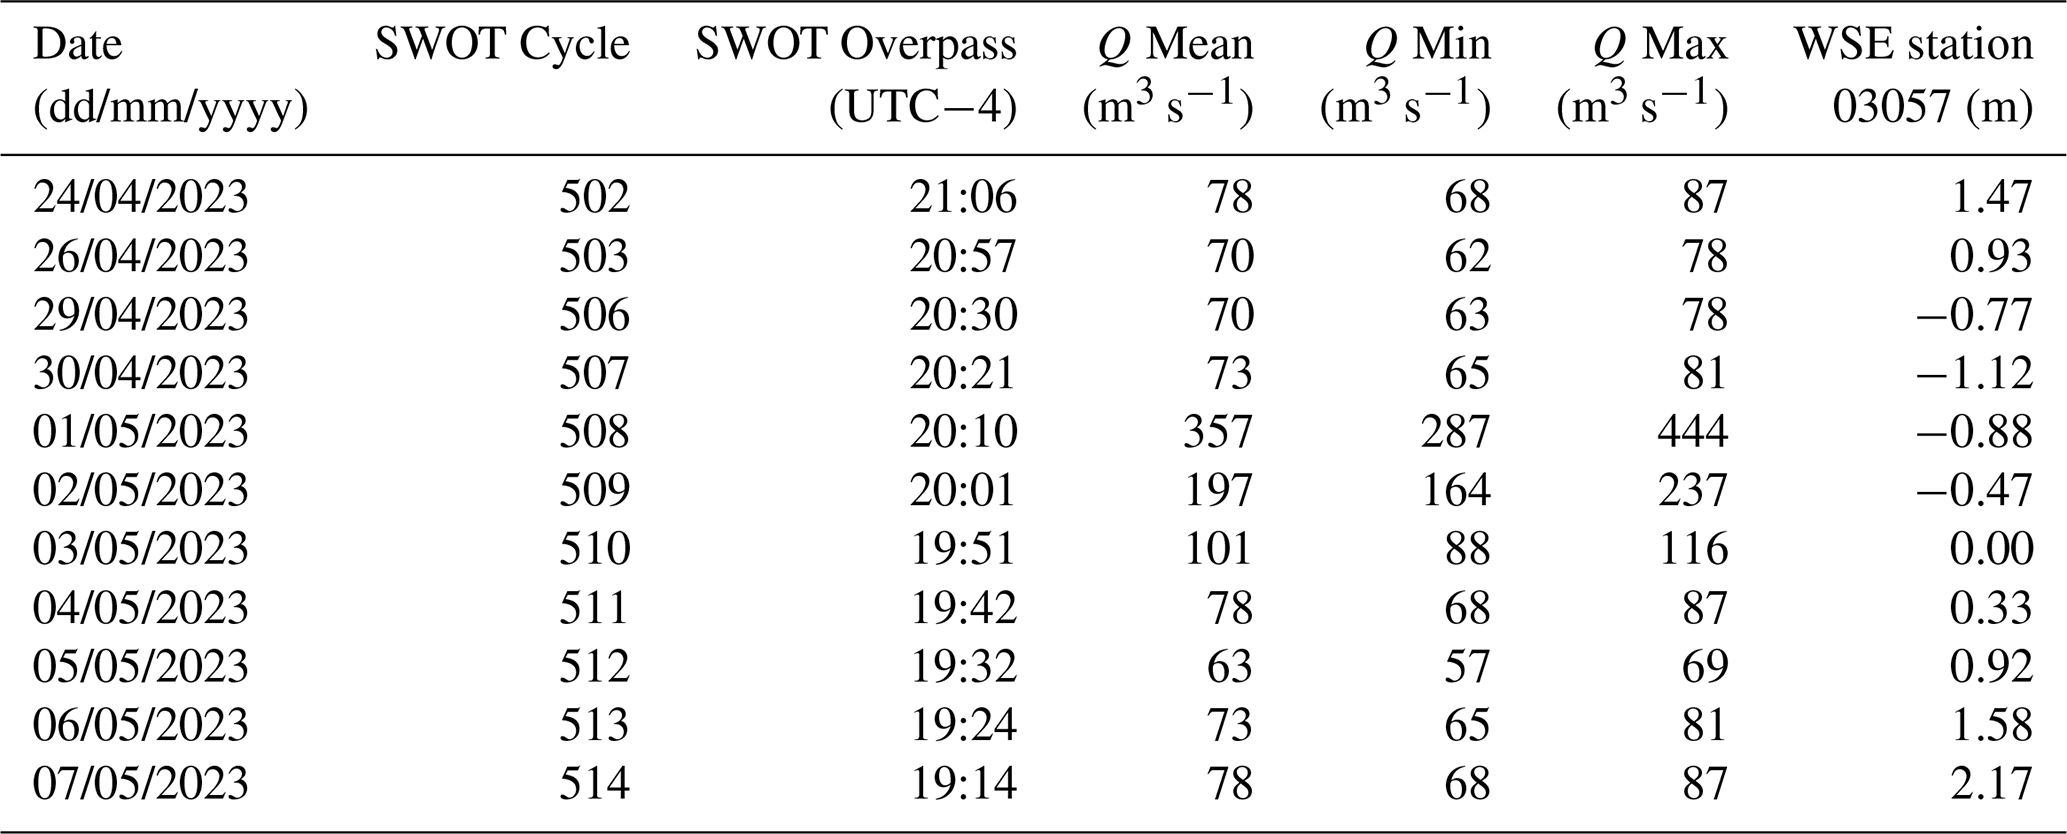
Table 1 summarizes the discharges derived from the rating curve of the Saint-Urbain gauging station (MELCCFP, 2025) for each SWOT overpass. These discharges served as the reference for drainage-area transposition across the LISFLOOD-FP domain. Downstream WSE correspond to observations at the Saint-Joseph station (Fisheries and Oceans Canada, 2025).
Table 1Discharges derived from the Saint-Urbain rating curve during SWOT overpasses, used in LISFLOOD-FP (prior to discharge calibration for cycle 508).
Following Choné et al. (2021, 2024), a constant Manning's roughness coefficient (n) of 0.03 was applied to the channel, whereas the Manning's n in the floodplain was based on land-use data following Chow (1959).
2.4 SWOT data analysis
The SWOT River data processing chain begins with the L2_HR_PIXC product (PIXC), a pixel cloud in NetCDF format containing, among other attributes, ellipsoidal heights, geographic coordinates, surface classification (water, near-water, near-land, and land), pixel area, and quality flags. The RiverObs algorithm, available at GitHub (https://github.com/SWOTAlgorithms/RiverObs, last access: 4 June 2026) then takes the PIXC product as input, along with the SWORD (Surface Water and Ocean Topography River Database), which structures rivers into segments (reaches) of about 10 km, themselves subdivided into nodes spaced approximately 200 m apart (Altenau et al., 2021). As a first step, RiverObs generates the L2_HR_PIXCVEC product (PIXCVEC), which filters and vectorizes valid water pixels to reduce noise and improve geometric accuracy and ensure proper geolocation. Using PIXCVEC and the SWORD river geometry, RiverObs produces the final L2_HR_RiverSP product (RiverSP), in which water pixels are associated with their nearest node or reach, and hydrological attributes are aggregated accordingly (Stuurman et al., 2023).
The RiverSP (Single-Pass) product is distributed in shapefile format, with separate files for reaches (line features) and nodes (point features). These include aggregated attributes such as WSE, surface width, water surface area, as well as quality flags associated with each node. Estimated discharge (not available at the time of this study) and slope are provided at the reach level only. In this study, only the WSE values from the node product are used, with the aim of comparing them to the WSEs simulated by the LISFLOOD-FP hydraulic model. In SWOT products, WSE refers to the elevation of the inland water surface relative to the geoid, after removing tide effects (NASA, 2025). Version D (PGD0) of the SWOT RiverSP product, which includes the wse_sm attribute, was used in this study, as this smoothed variable reduces noise and ensures better spatial continuity between nodes, making it more suitable for hydraulic comparisons (Stuurman et al., 2025).
SWOT node data were filtered to eliminate unreliable observations. Two quality flag fields were used: node_q and xovr_cal_q. The node_q field, is a summary quality indicator for the node, derived from the aggregation of PIXC product pixels assigned to the corresponding node, indicates the overall quality of the observation at the node level and can take the following values: 0 (good), 1 (suspect), 2 (degraded), and 3 (bad). In parallel, the xovr_cal_q flag was selected because it is the only indicator that specifically assesses the reliability of the cross-over calibration (see Peral et al., 2024, for details on the cross-over calibration). It takes three values: 0 (nominal measurement), 1 (suspect measurement), and 2 (bad measurement). Only nodes with a node_q value less than or equal to 2 and a xovr_cal_q value equal to 0 or 1 were retained to limit the influence of points with known anomalies. The other quality flags should be the subject of further investigation before being used for data filtering.
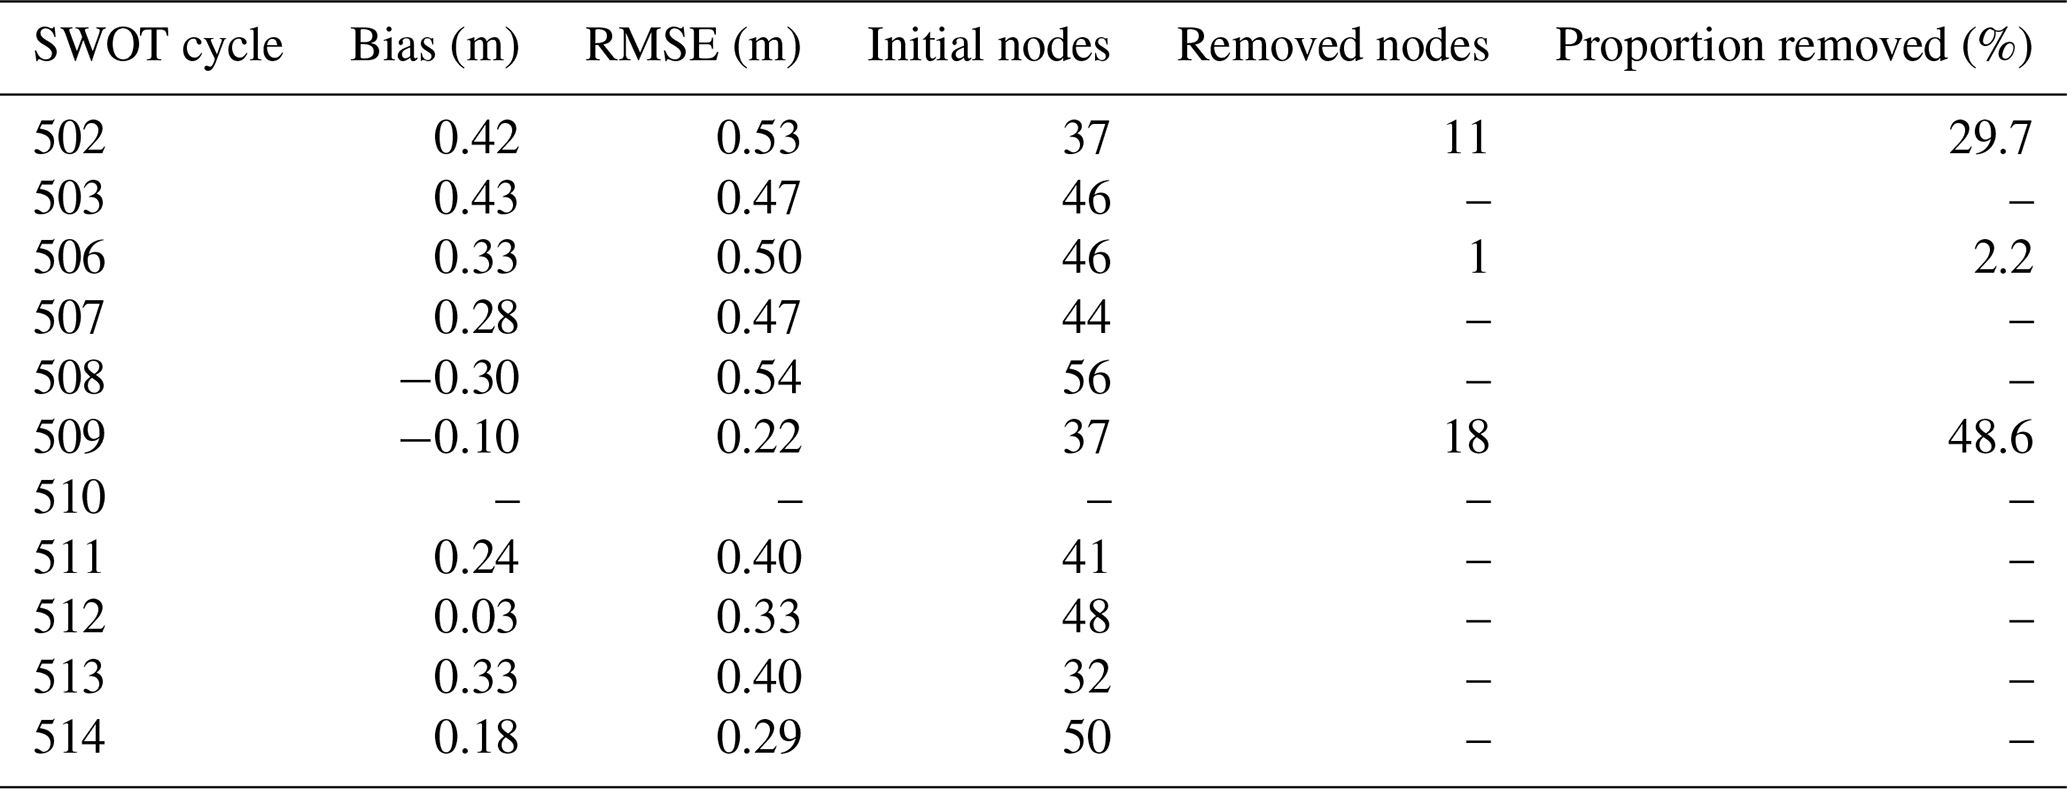
In addition, manual node removal was applied only for three SWOT cycles (Table 2), following an objective consistency criterion. Specifically, nodes were excluded when the absolute difference between SWOT-derived WSE and the corresponding LISFLOOD-FP simulated WSE exceeded 1 m, while neighboring upstream and downstream nodes exhibited much smaller discrepancies and remained consistent with the expected longitudinal water surface profile. This procedure was applied to remove isolated outliers that were inconsistent with both the modeled WSE and the local spatial continuity of the river profile.
Table 2Comparison of WSEs observed by SWOT with the results of the LISFLOOD-FP model, for each SWOT cycle, together with a summary of manual SWOT node filtering. Initial nodes correspond to the number of nodes retained after automatic quality filtering, removed nodes indicate additional exclusions after the manual consistency filter, and the proportion removed represents the percentage of excluded nodes relative to the initial node count. Cycles 504–505 lack valid data and Cycle 510 was excluded after filtering.
The WSEs provided in the SWOT product are expressed in the ITRF2014 reference frame, based on the WGS84 ellipsoid and associated with the EGM2008 geoid. The adopted ITRF realization is referenced to the epoch of the measurements (NASA, 2025). To ensure compatibility with the WSEs simulated by the LISFLOOD-FP model, all SWOT observations were converted to the Canadian Spatial Reference System (CSRS). In this study the NAD83 (CSRS) reference frame (epoch 1997.0) and the CGVD28 vertical datum were used. The conversion was performed using the TRX and GPS-H tools provided by Natural Resources Canada (https://ressources-naturelles.canada.ca/carte-outils-publications/donnees, last access: 4 June 2026). This step aimed to place all data in a common reference frame, to make SWOT observations directly comparable to the results simulated by the hydraulic model.
For each SWOT node retained after filtering, the corresponding WSE simulated by the LISFLOOD-FP model was extracted from the WSE raster. When the node did not coincide exactly with a valid raster cell, the value of the nearest cell was used. This method ensured full spatial correspondence between SWOT observations and the model results over the entire study period. To compare WSE from SWOT observations and hydraulic modelling, two statistical indicators were calculated for each overpass date: Root Mean Square Error (RMSE), used to assess consistency between the values produced by the LISFLOOD-FP hydraulic model and those measured by the SWOT satellite, both subject to uncertainty, and the bias, which highlights any systematic trends of overestimation or underestimation. The SWOT mission requirements are expressed using the 1-sigma metric, which is the 68th percentile of the absolute error between SWOT and the observations. This metric is therefore used to compare WSE SWOTs with observations at stations.
The extracted WSEs from SWOT products (PGD0) were first compared with measurements (at one-minute intervals) from tide gauge station 03057 (Saint-Joseph-de-la-Rive, Fig. 1A) for all satellite passes between April 2023 and August 2025, during ice-free period. Figure 3a shows the probability that the absolute WSE error is less than or equal to a given value (Likelihood of occurrence), indicating that the 68th percentile (corresponding to the 1-sigma metric defined in the SWOT requirements) is 0.24 m, with an RMSE of 0.25 m. The boxplot (Fig. 3b) complements this probabilistic analysis by illustrating the distribution of absolute WSE errors (m), with a median of 0.16 m. It shows a low median and a relatively limited interquartile range, indicating that the errors are well centred and not dominated by systematic bias or by extreme deviations in the error distribution. The SWOT observations used are of good quality (node_q < 3 et xovr_cal_q < 2). The obtained values meet the WSE accuracy requirement defined by the SWOT mission, which specifies a 1-sigma accuracy of 0.25 m or better for water bodies whose surface area is between 250 m2 and 1 km2 (Desai, 2018). At the spatial scale relevant to the Du Gouffre River, the 68th-percentile absolute error of 0.24 m therefore falls within the applicable 0.25 m threshold.
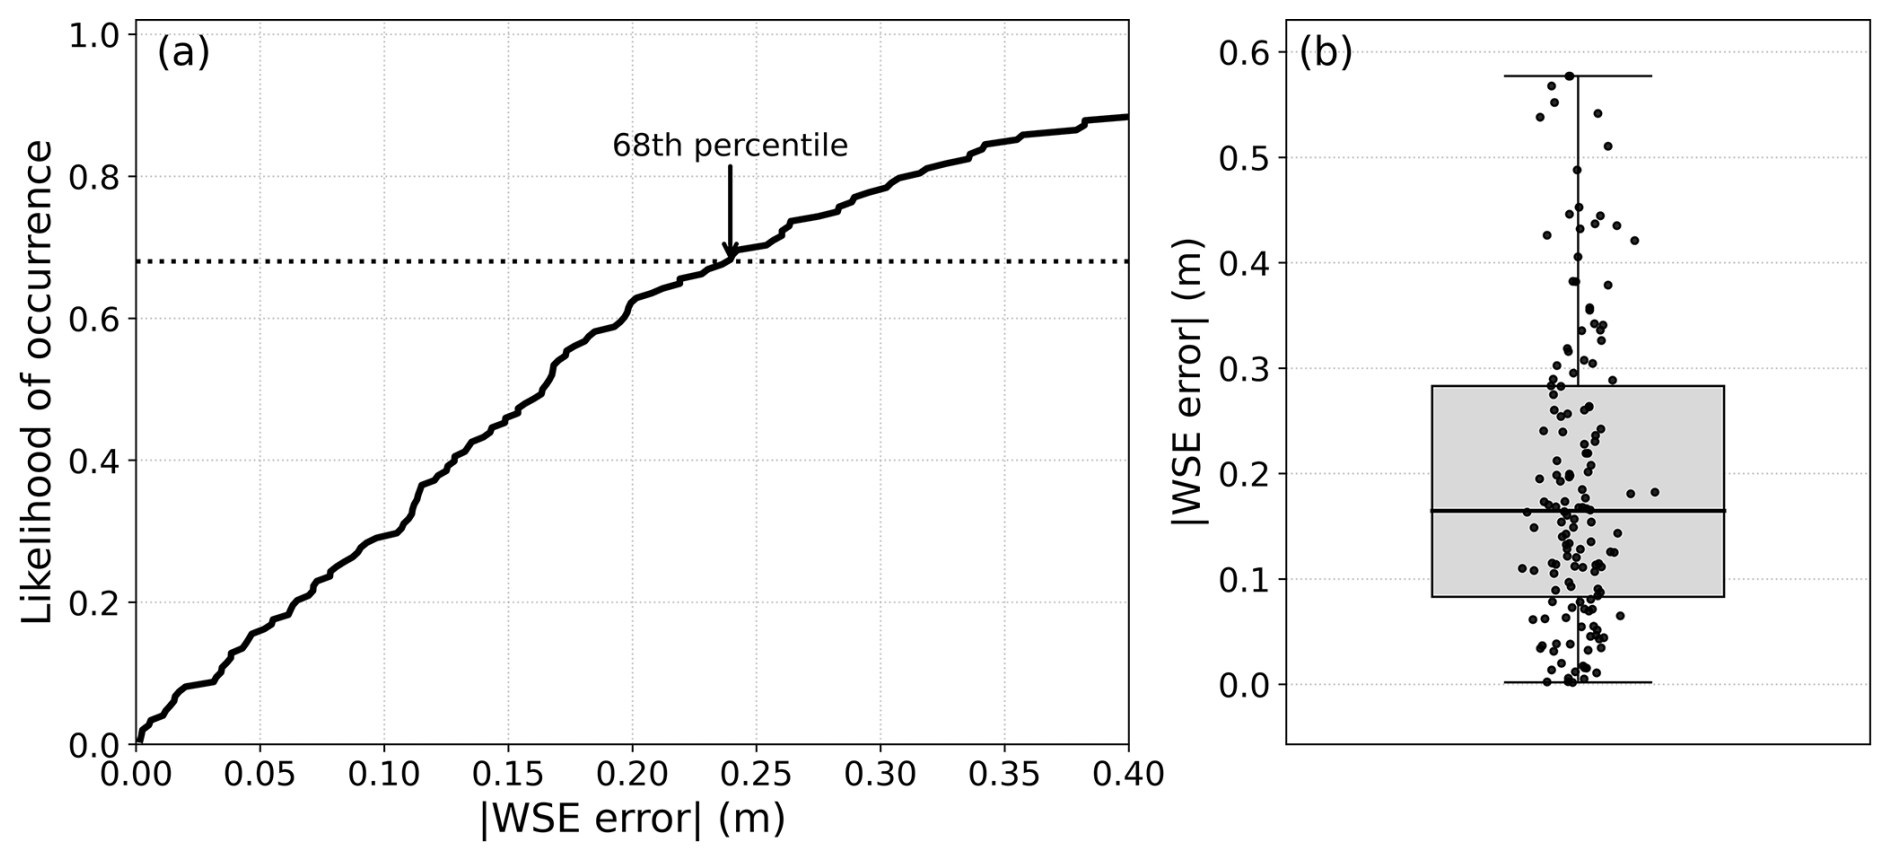
Figure 3(a) Likelihood of occurrence of absolute WSE errors between SWOT observations and measurements at the Saint-Joseph-de-la-Rive tide gauge station. The black curve represents the empirical cumulative distribution function of the absolute WSE errors. The horizontal dotted line indicates the 68th percentile of the distribution. (b) The boxplot illustrates the dispersion of absolute WSE errors.
The consistency of the SWOT WSEs with LISFLOOD-FP simulations was assessed by comparing the corresponding nodes, which represents the core of this study. SWOT observations were thus compared with the results of the LISFLOOD-FP hydraulic model for eleven observation cycles between 25 April and 7 May 2023 (Table 2). The differences between the two sources remain relatively small, with bias values ranging from −0.30 to 0.43 m and RMSE values between 0.22 and 0.54 m. Detailed bias and RMSE values are shown in Table 2.
The observed flood is covered by cycles 508, 509, and 510, with cycle 508 corresponding to the flood peak on 1 May. For cycle 508, a comparison between SWOT-derived WSEs and LISFLOOD-FP simulations prior to any adjustment of the Des Mares tributary inflow shows a bias of 1.30 m and an RMSE of −1.21 m. To investigate the origin of this discrepancy, a discharge adjustment was performed for the Des Mares tributary using SWOT-derived WSEs. Increasing the tributary inflow to 240 m3 s−1 results in a bias of −0.30 m and an RMSE of 0.54 m (Fig. 4). The comparison before and after the adjustment highlights an improvement in model-SWOT consistency during the flood peak. Because SWOT observations are used to inform the tributary discharge adjustment for this cycle, this comparison is not interpreted as an independent validation of SWOT measurement accuracy, but rather as an assessment of consistency between the adjusted hydraulic simulation and SWOT-derived WSEs. For cycle 508, no discharge uncertainty is considered, as the value of 240 m3 s−1 corresponds to the calibrated flow used in the simulation.
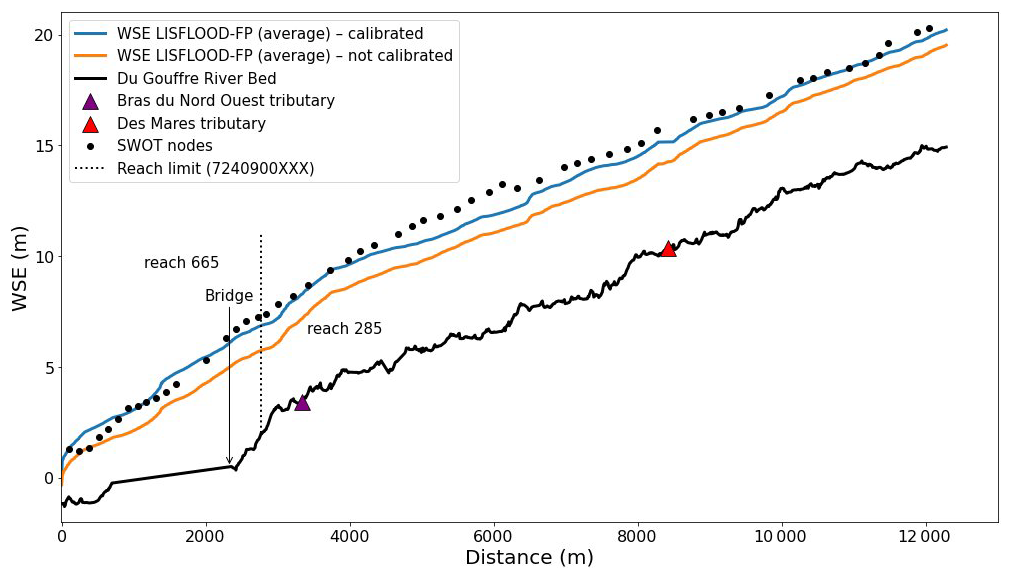
Figure 4Longitudinal profile of WSE along the Du Gouffre River during the flood peak observed by SWOT (cycle 508, 1 May 2023). Black dots represent SWOT node-level WSE observations. The blue and orange lines show WSE simulated by the LISFLOOD-FP model using the calibrated and non-calibrated configurations, respectively. The black line corresponds to the riverbed elevation. The locations of the Bras du Nord-Ouest and Des Mares tributaries are indicated by colored symbols. Vertical dotted lines denote the limits between SWOT river reaches, and the location of a bridge structure is indicated.
The following cycle, 509, shows a good agreement between the two sources. The SWOT points generally align well with the simulated WSEs (Fig. 5). The bias is −0.10 m and the RMSE is 0.22 m. Unlike cycle 508, the discharges for this overpass were well constrained and did not involve significant tributary inputs, which likely contributed to the good consistency between the two datasets.
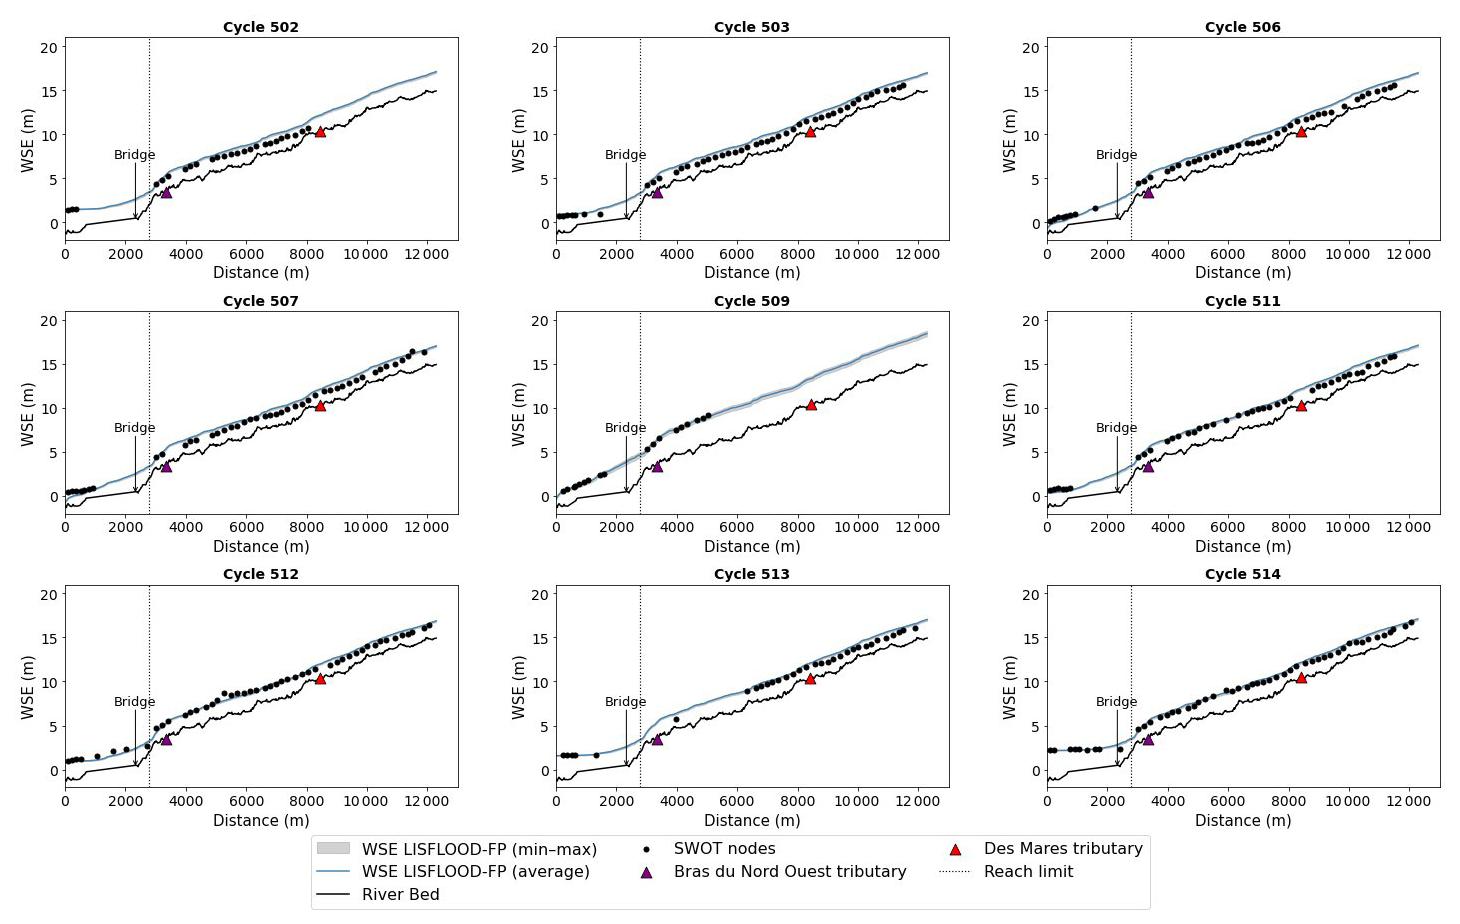
Figure 5Longitudinal profiles of WSE along the Du Gouffre River for all SWOT overpasses before and after the 1 May 2023 flood peak, excluding cycle 508. For each cycle, SWOT node-level WSE observations (black dots) are compared with LISFLOOD-FP simulated WSEs, including the profile (blue line) and the envelope defined by the minimum and maximum discharges derived from rating-curve uncertainty (shaded area). The riverbed elevation is shown by the black line. The locations of the Bras du Nord-Ouest and Des Mares tributaries, the bridge structure, and the limits between SWOT reaches are indicated.
SWOT data corresponding to cycle 510 could not be used. In this case, all nodes were associated with a xovr_cal_q value equal to 2, indicating a cross-over calibration that was considered unreliable. By applying the quality filters defined above, all these observations were discarded.
Cycles 502, 503, 506 and 507 precede the flood peak. The discrepancies between SWOT and the model are slightly more pronounced than those observed during the recession phase. Biases range from 0.28 to 0.43 m, and RMSEs from 0.47 to 0.53 m. During the recession phase, covered by cycles 511, 512, 513 and 514, the discrepancies are smaller; the biases do not exceed 0.33 m and the RMSE values range are from 0.29 to 0.40 m.
The interpretation of the results must be placed within the context of limited ground-based observations available along the studied reach, corresponding to the SWOT RiverSP reaches 7240900665 and 7240900285, which constitute the focus of this analysis. Aside from a downstream tidal gauge and a single upstream hydrometric station, no spatially distributed in situ WSE measurements were available during the flood event. Despite this limitation, preliminary comparisons provide useful independent benchmarks that help contextualize the analysis. First, the comparison between SWOT-derived WSEs and one-minute observations at the downstream tidal gauge shows good agreement, with a 68th percentile absolute error of 0.05 m and an RMSE of 0.24 m (Fig. 3), consistent with the SWOT mission accuracy requirements. In addition, an upstream comparison between LISFLOOD-FP simulations and in situ WSE at the Saint-Urbain hydrometric station yield a bias of 0.07 m and an RMSE of 0.12 m for all cycles except the flood peak, supporting the overall consistency of the hydraulic model outside peak-flow conditions.
Within this constrained observational context, the present study is therefore framed as a site-specific case study that explores the practical use of SWOT observations to support hydraulic analysis during a rare and extreme flood event, rather than as a rigorous assessment of SWOT measurement accuracy. The following discussion focuses on how SWOT-derived WSEs can complement sparse in situ data and contribute to the evaluation of hydraulic consistency and discharge dynamics in a narrow river under extreme flow conditions.
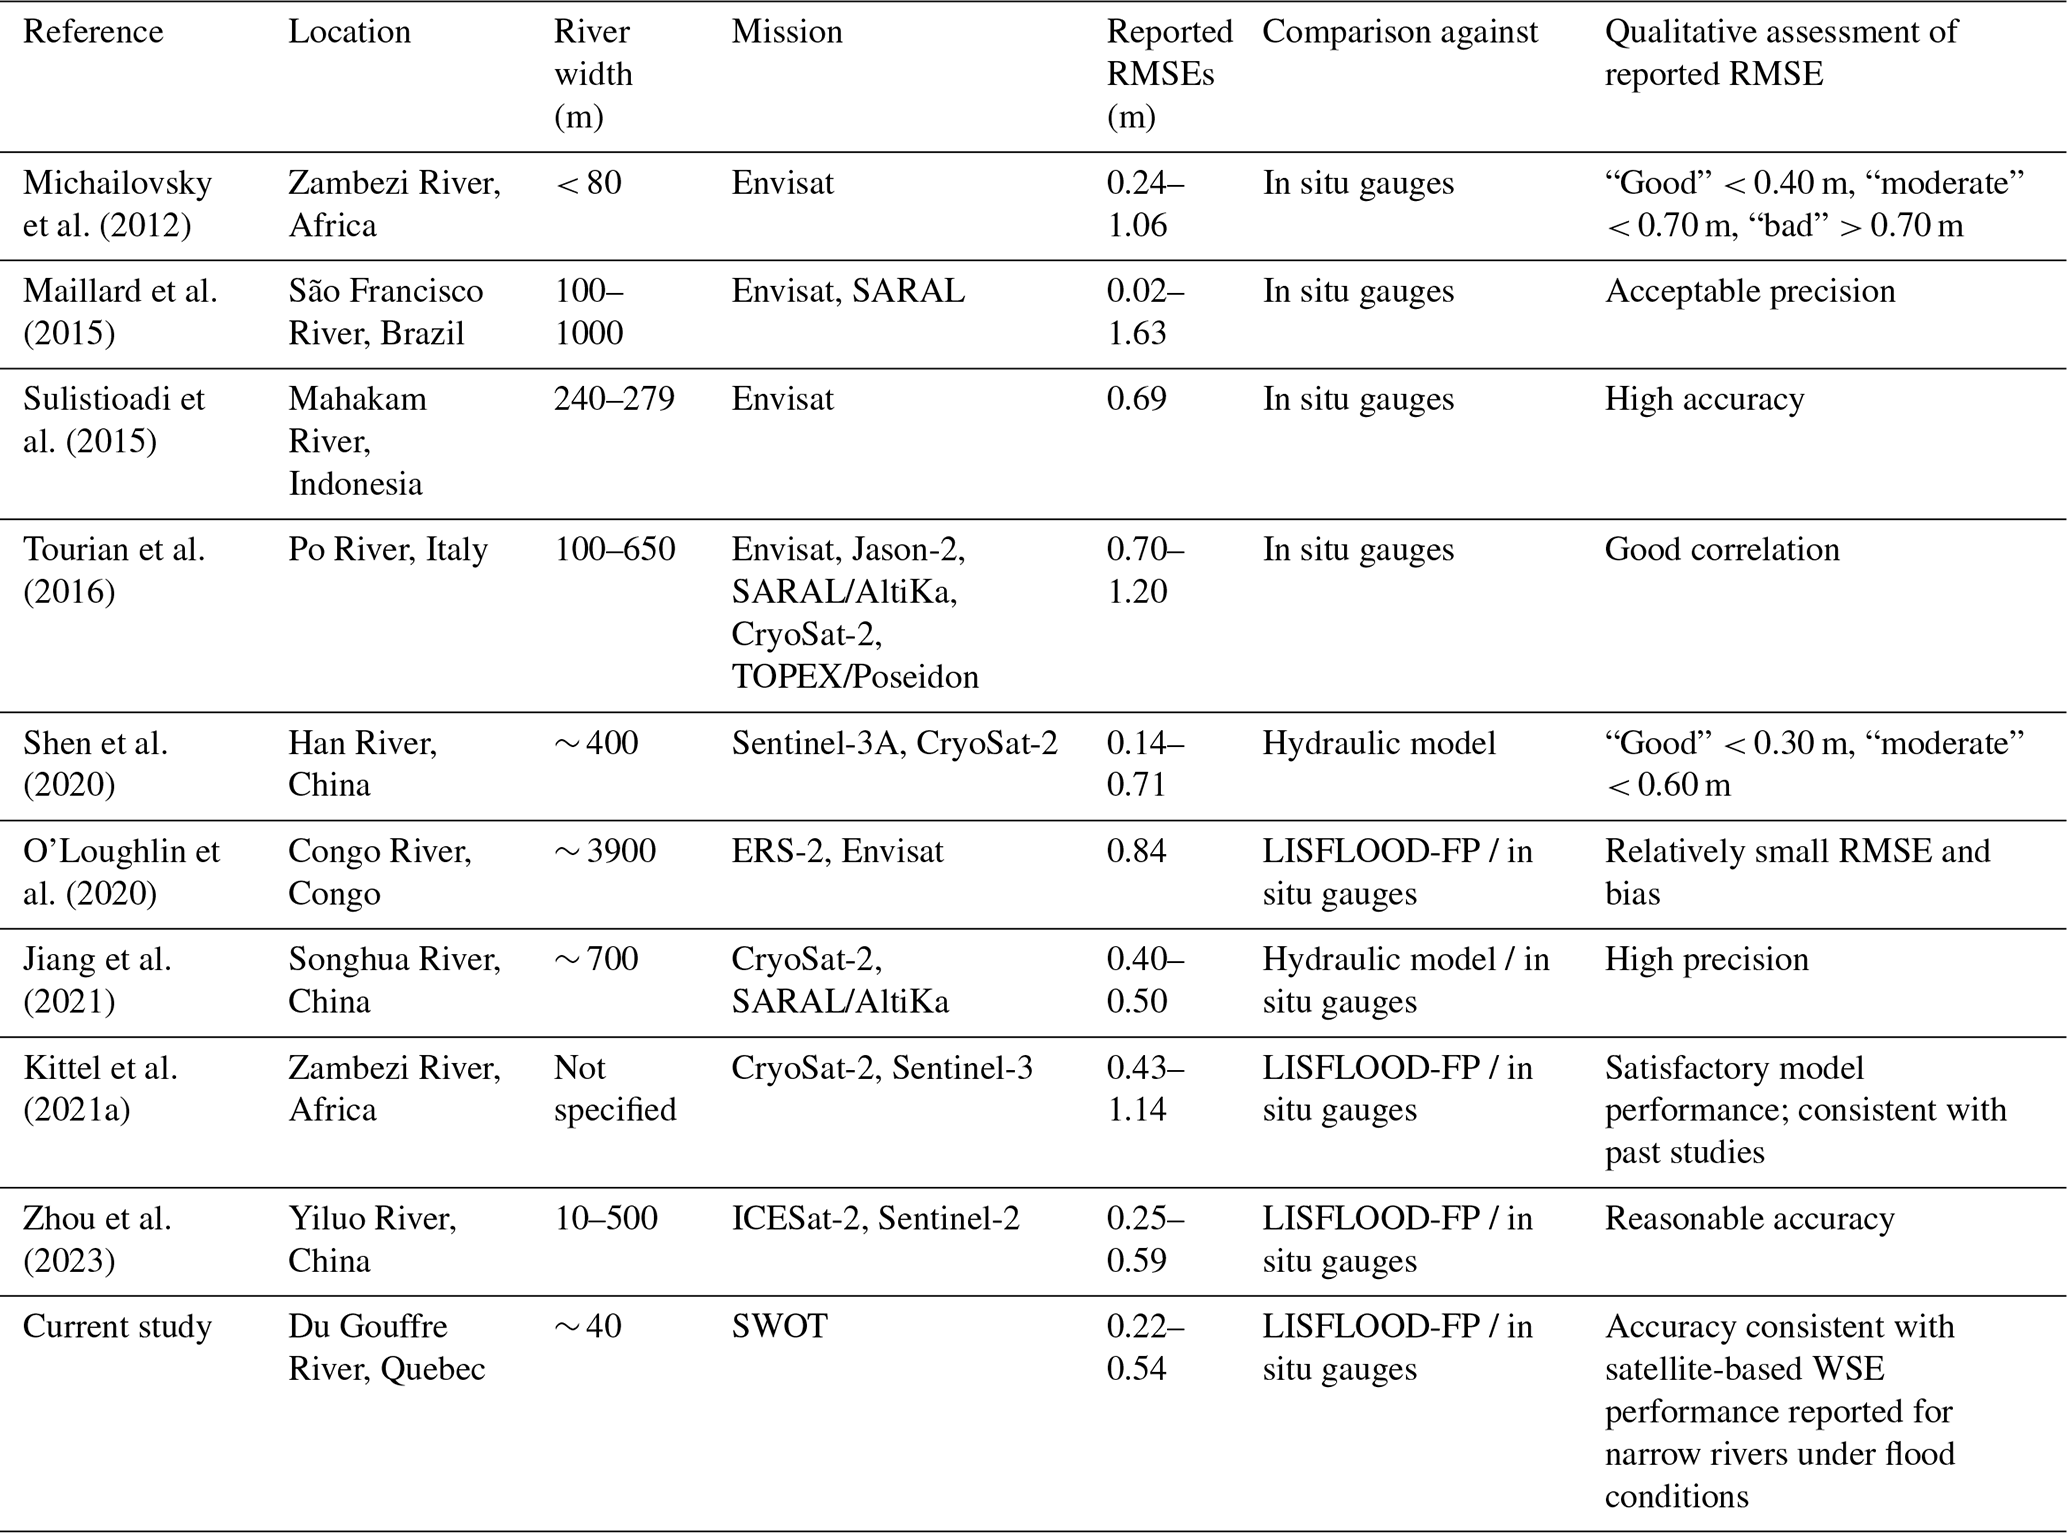
The results indicate a general consistency between SWOT observations and the WSEs simulated by the LISFLOOD-FP model across most of the analyzed cycles. The RMSE values, ranging from 0.22 to 0.54 m, with biases between −0.30 and 0.43 m were obtained, for river reaches with an average width of approximately 40 m. This width is significantly smaller than those investigated in most previous SWOT and radar altimetry validation studies (Table 3), which typically focused on rivers wider than 100 m and, in some cases, several kilometers wide. As reported by Domeneghetti et al. (2018), the performance of satellite-derived WSEs generally decreases as river width decreases, highlighting the challenging nature of the present case study.
Table 3Summary of relevant studies evaluating the performance of satellite-derived river WSE observations.
When interpreted relative to the hydrological signal of the event, the magnitude of the errors remains moderate. During the flood, WSE varied by approximately 2 m along the studied reach. In this context, the maximum RMSE of 0.54 m represents about 27 % of the flood-stage amplitude, while the maximum bias of 0.42 m corresponds to approximately 22 %. These values therefore remain limited when compared to the overall flood dynamics.
Beyond this event-specific perspective, the obtained WSE differences are consistent with those commonly reported in the literature for satellite-based river WSE observations and their application in hydraulic modelling. A selection of relevant studies summarized in Table 3 shows that satellite-derived river WSE errors, as quantified by RMSE, generally remain hydraulically informative for model evaluation and calibration across a range of observational accuracies.
For instance, Villadsen et al. (2016) synthesized past satellite missions performance and proposed accuracy thresholds whereby errors below 0.30 m are considered “good” and values between 0.30 and 0.60 m considered “moderate”. These criteria were subsequently adopted by Kittel et al. (2021b), who relied on the same benchmarks to assess the usefulness of satellite-derived WSEs for large-scale hydraulic modelling. Shen et al. (2020) later applied this framework in a river case study to interpret RMSE values and demonstrated that satellite-based WSE observations with good to moderate accuracy can effectively support hydraulic model evaluation and calibration. More recently, Zhou et al. (2023) showed that ICESat-2 and Sentinel-2-derived WSEs with RMSE values ranging from 0.25 to 0.59 m enabled successful hydraulic model calibration, yielding validation RMSE values of approximately 0.36 m.
Importantly, the present results were obtained during an extreme flood event, a period during which uncertainties related to floodplain roughness (Pappenberger et al., 2005), inundation extent (Bates et al., 2014; Aitken et al., 2024), and channel-floodplain interactions (Croke et al., 2013) are expected to be highest. These challenges are further exacerbated in narrow rivers, where satellite altimetry measurements are inherently more difficult to interpret.
Achieving WSE differences comparable to those reported in the literature under such conditions, and for a narrow river under the nominal detection limits of SWOT, further supports the hydraulic relevance of SWOT observations in this context. Overall, these findings indicate that, for the present case study, SWOT-derived WSEs provide hydraulically meaningful information for the evaluation of flood dynamics and hydraulic model performance, even in a narrow river and under high-flow conditions.
During the flood peak on 1 May (cycle 508), the initial comparison between SWOT-derived WSEs and LISFLOOD-FP simulations showed a pronounced discrepancy. After adjusting the inflow of the Des Mares tributary, the agreement improved, yielding a bias of −0.30 m and an RMSE of 0.54 m. Compared with the pre-adjustment simulations, this result indicates an improved consistency between the simulated WSEs and the SWOT observations during peak-flow conditions. As the tributary inflow is adjusted using SWOT-derived WSEs for this cycle, the resulting improvement should not be interpreted as an independent assessment of SWOT measurement accuracy. Rather, within the context of this site-specific case study, it illustrates how SWOT observations can provide complementary information to diagnose discharge underestimation in a poorly gauged tributary and to enhance the internal consistency of hydraulic model inputs during an extreme flood event. Similar conclusions were drawn by Diouf et al. (2025), who showed that SWOT observations (using the L2_HR_PIXC product) can support hydraulic model calibration in poorly instrumented environments by constraining hydraulic parameters and improving the representation of WSE dynamics in areas lacking in situ measurements.
At the same time, the need for such adjustment underscores the inherent challenge of determining an accurate discharge representation in hydraulic models under conditions of spatial rainfall variability. Spatial variability in rainfall strongly influences flood runoff, they can alter the volume, timing, and peak flow of the hydrograph (Khakbaz et al., 2012). Discharge estimates that may become available in future versions of SWOT products (and already for some reaches in version D) will be particularly valuable in such situations, as they could help refine the discharge inputs used in hydraulic models.
Additional qualitative validation elements confirm the reliability of SWOT observations during the flood peak. Drone imagery acquired on 1 May (cycle 508) (Fig. A1 in the Appendix) illustrates the extent of the flooding observed in the field. The extent of the flooded areas visible in these images is consistent with the WSEs measured by the satellite, thus providing an independent validation for the SWOT observations.
This agreement is further supported by the analysis of two internal quality indicators provided in the SWOT River SP product (Fig. 6). The first, wse_u (Fig. 6A), represents the total uncertainty (random and systematic) of the WSE at each node (in meters), while the second, dark_frac (Fig. 6B), corresponds to the fraction of “dark water” pixels used in the retrieval, expressed as a unitless ratio between 0 and 1. Dark water results from signal attenuation, which can be caused by rainfall or by a smooth water surface (e.g., in the absence of wind). This raises the question of whether dark water occurs more frequently during flood events. For cycle 508, most wse_u values are tightly clustered between 0.09 and 0.24 m, with a median around 0.13 m, indicating a generally low total uncertainty for most nodes. Only a few outliers exceed 0.3 m, reaching up to 0.76 m, but these remain exceptions. Regarding dark_frac, almost all nodes have values equal to 0, with only three points above zero (≤ 0.3 m). When compared with the remaining cycles (Fig. 6A), the distribution of wse_u values is similarly concentrated, with a median of 0.15 m. Similarly, dark_frac, values remain consistently close to 0 for all cycles, confirming the robustness of water detection throughout the study period. Taken together, these indicators show that the SWOT observations during the flood peak were of sufficient quality to ensure reliable WSE estimates. This case study demonstrates that the combination of SWOT observations with LISFLOOD-FP modelling provides valuable insights into discharge dynamics in poorly gauged reaches, particularly under extreme flood events where tributary contributions and hydraulic uncertainties are most pronounced.
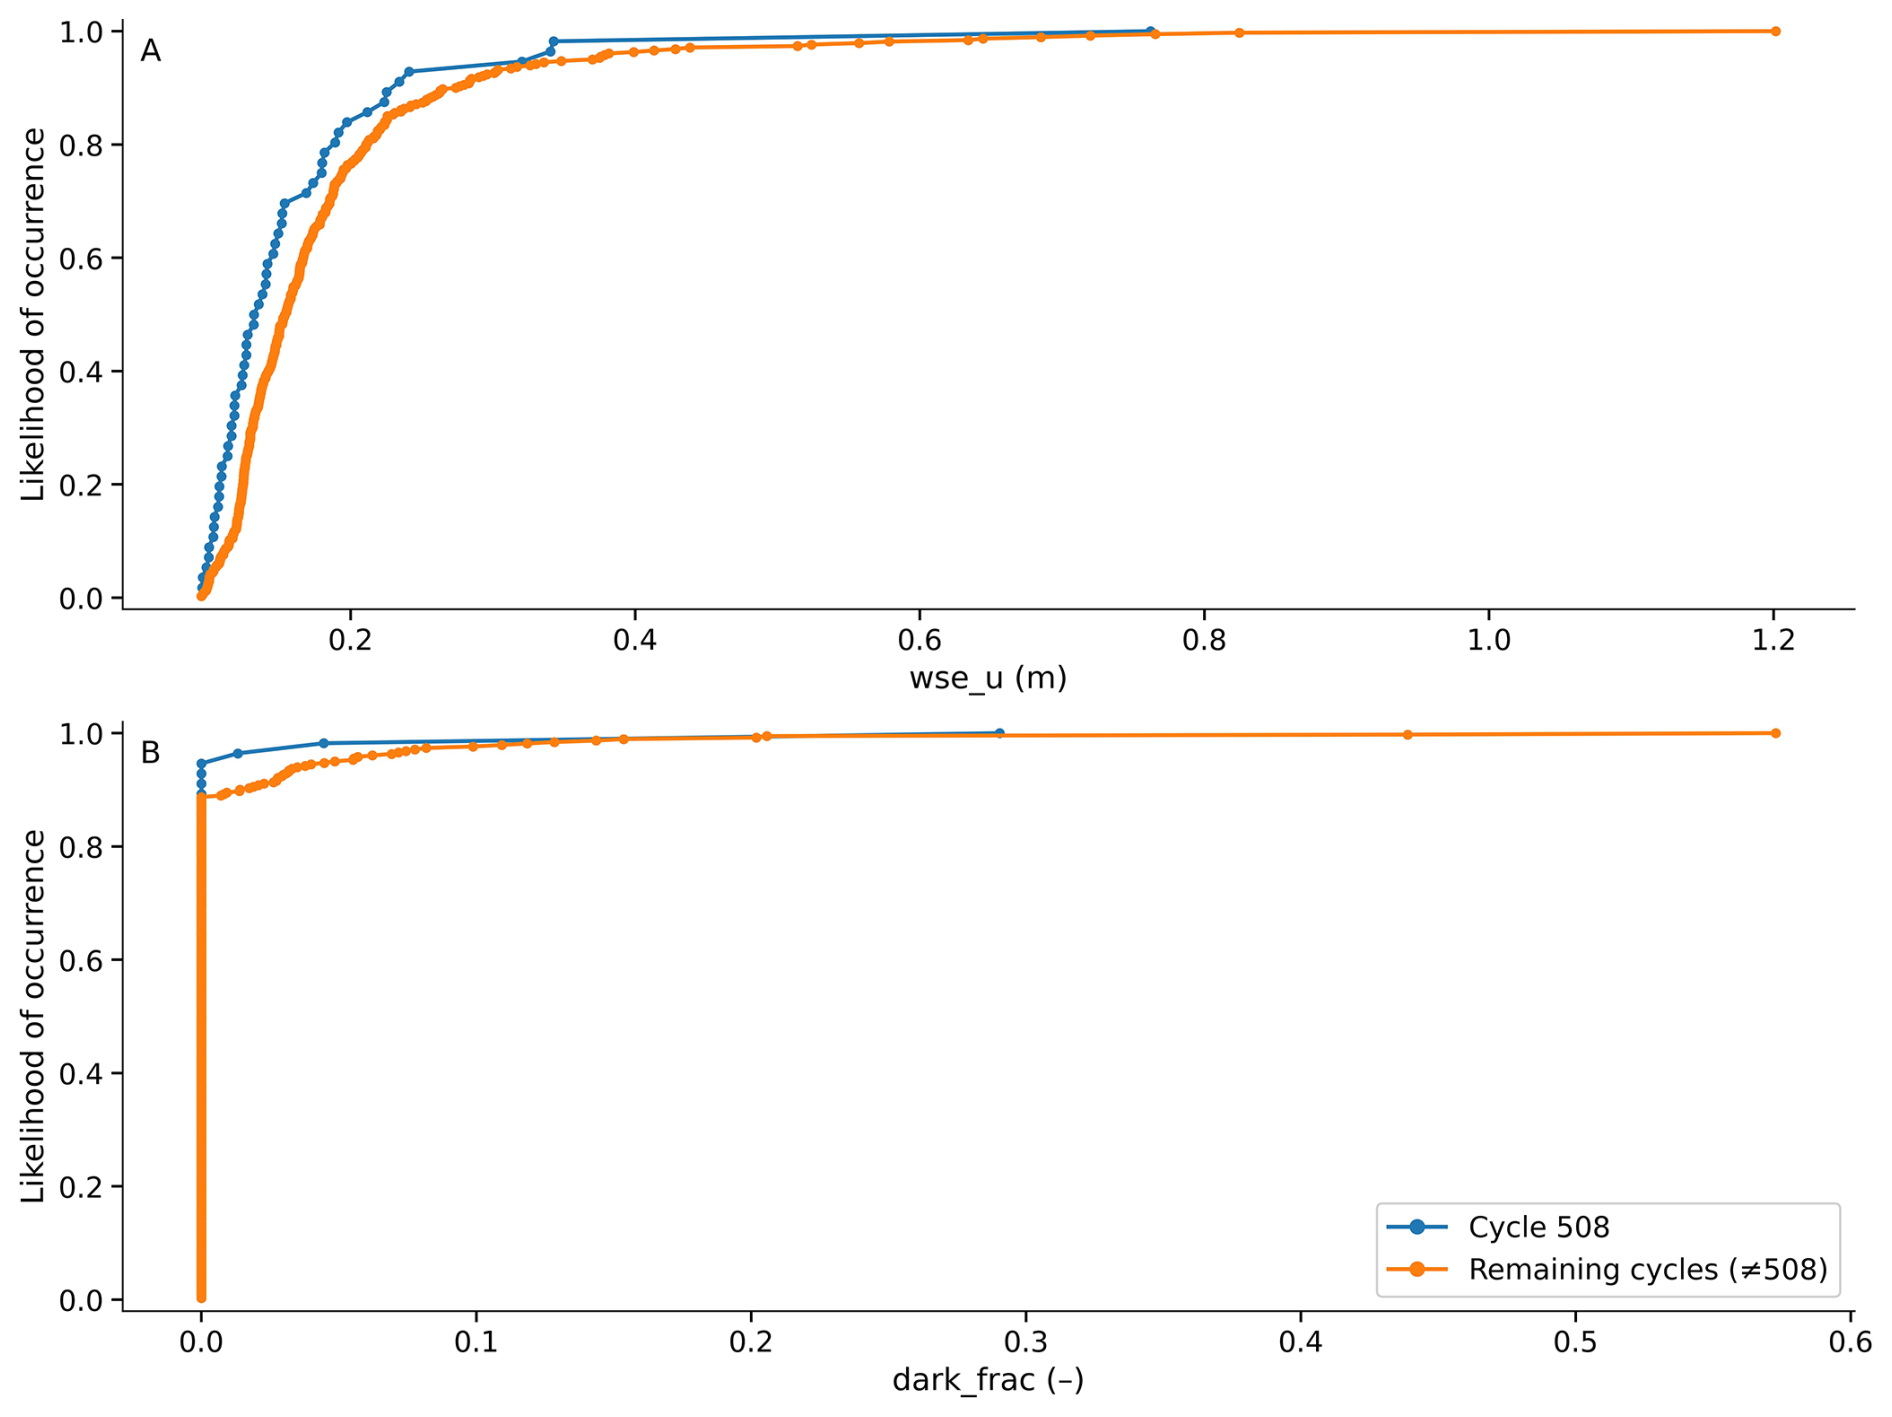
Figure 6Likelihood of occurrence of SWOT node-level quality indicators for the Du Gouffre River: (A) wse_u (m) and (B) dark_frac (–). The flood-peak acquisition (cycle 508) is compared with all remaining SWOT cycles excluding cycle 508.
During cycle 509, corresponding to the recession phase, differences between SWOT-derived WSEs and hydraulic model simulations remain limited. The bias remains low (−0.10 m) and the RMSE is 0.22 m, indicating a generally consistent behavior between the two datasets.
Cycle 510 was excluded from the analysis because all available observations had an xovr_cal_q value of 2, indicating low-quality cross-over calibration. This shows the value of using the quality indicators supplied with the data to assess their reliability prior to any comparison with a model. Beyond this automatic filtering based on quality flags, a limited manual consistency filter was applied for three cycles, and the sensitivity of the results to this additional step was explicitly assessed. For cycles affected by isolated outliers, manual filtering led to a substantial reduction in the error metrics. This marked improvement reflects the strong influence of a small number of inconsistent nodes on aggregate error statistics, highlighting the disproportionate impact that isolated outliers can have on RMSE and bias estimates. For instance, for cycle 502, the RMSE decreased from 1.29 to 0.53 m and the bias from 1.05 to 0.42 m after manual filtering. Similarly, for cycle 509, the RMSE decreased from 6.51 to 0.22 m and the bias from −5.5 to −0.10 m, while the number of retained nodes was reduced accordingly. These cases illustrate that the large pre-filtering errors were primarily driven by a few extreme outliers rather than by a systematic mismatch between SWOT observations and model simulations. In contrast, for cycle 506, where only a single node was removed, RMSE and bias remained nearly unchanged (RMSE from 0.52 to 0.50 m; bias from 0.35 to 0.33 m). These results show that the manual filtering step mainly removes a few clearly inconsistent observations that strongly inflate the error metrics, rather than artificially improving the agreement between SWOT observations and the model. The overall conclusions of the SWOT-model comparison therefore remain robust. Future work should therefore focus on establishing explicit links between SWOT quality flags and the automatic identification of outliers. Such an approach would help reduced satellite-related uncertainties, improve reproducibility, and streamline the selection of reliable WSE observations.
The pre- and post-flood cycles (503–507, and 511–514), as well as cycle 509 in the recession phase, show good agreement between the WSEs observed by SWOT and those simulated by the LISFLOOD-FP model. RMSEs are between 0.22 and 0.53 m. These findings are in line with the conclusions of Frasson et al. (2019), according to which SWOT data, despite their irregular spatio-temporal nature, can be useful for evaluating or adjusting hydraulic models, particularly when acquired after a flood event. In this sense, the study contributes to ongoing efforts to integrate satellite-derived river observations into hydraulic modelling frameworks by demonstrating their operational relevance under challenging hydrological conditions.
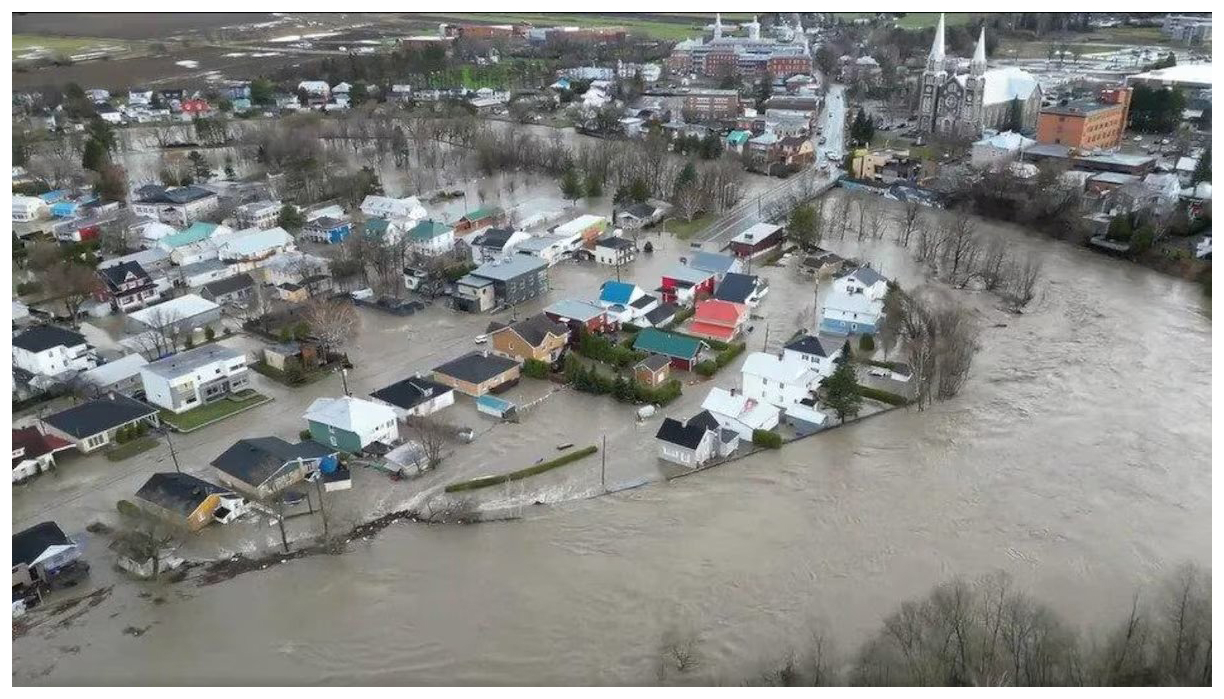
Figure A1Aerial photograph showing the extent of flooding along the Du Gouffre River in Baie-Saint-Paul, on 1 May 2023, at 18:59 (photograph courtesy of Frederick Tremblay, via Facebook).
The SWOT RiverSP products used in this study are freely available from the NASA Earthdata portal at https://www.earthdata.nasa.gov/ (last access: 4 June 2026). Hydrometric data were obtained from the Ministère de l'Environnement, de la Lutte contre les changements climatiques, de la Faune et des Parcs (MELCCFP), and tidal observations at the Saint-Joseph stion were provided by the Canadian Hydrographic Service. The LISFLOOD-FP hydraulic model was used for the simulations, and the processing scripts used in this study are available upon reasonable request from the corresponding author.
AM: designed the study, processed the SWOT and LISFLOOD-FP data, conducted the analyses, and led the writing of the manuscript. MT: supervised all aspects of the study, including the SWOT data analysis, hydraulic modelling, and manuscript preparation, and provided expert guidance in remote sensing. PB: co-supervised the study, contributed to the hydraulic modelling and data interpretation, and participated in manuscript revisions. GC: supported the LISFLOOD-FP model implementation and contributed to the processing and analysis of simulation results. GLS: provided expertise on SWOT data processing and analysis and helped with geodetic conversions. All authors reviewed and approved the final version of the manuscript.
The contact author has declared that none of the authors has any competing interests.
Publisher's note: Copernicus Publications remains neutral with regard to jurisdictional claims made in the text, published maps, institutional affiliations, or any other geographical representation in this paper. The authors bear the ultimate responsibility for providing appropriate place names. Views expressed in the text are those of the authors and do not necessarily reflect the views of the publisher.
Parts of the manuscript were translated from French to English using the DeepL translator. In addition, artificial intelligence tools (e.g. ChatGPT, OpenAI) were used to support the correction of Python code. The scientific content, analysis, and interpretation remain entirely the responsibility of the authors.
This research has been supported by the Canadian Space Agency (grant no. 24AO3SHE16).
This paper was edited by Narendra Das and reviewed by Gurjeet Singh and two anonymous referees.
Aitken, G., Beevers, L., and Christie, M. A.: Advanced Uncertainty Quantification for Flood Inundation Modelling, Water, 16, https://doi.org/10.3390/w16091309, 2024.
Altenau, E. H., Pavelsky, T. M., Durand, M. T., Yang, X., Frasson, R. P. D. M., and Bendezu, L.: The Surface Water and Ocean Topography (SWOT) Mission River Database (SWORD): A Global River Network for Satellite Data Products, Water Resour. Res., 57, e2021WR030054, https://doi.org/10.1029/2021WR030054, 2021.
Barendrecht, M. H., Viglione, A., and Blöschl, G.: A dynamic framework for flood risk, Water Secur., 1, 3–11, 2017.
Bates, P. D. and De Roo, A. P. J.: A simple raster-based model for flood inundation simulation, J. Hydrol., 236, 54–77, 2000.
Bates, P. D., Horritt, M. S., and Fewtrell, T. J.: A simple inertial formulation of the shallow water equations for efficient two-dimensional flood inundation modelling, J. Hydrol., 387, 33–45, 2010.
Bates, P. D., Pappenberger, F., and Romanowicz, R. J.: Uncertainty in Flood Inundation Modelling, in: Applied Uncertainty Analysis for Flood Risk Management, 232–269, https://doi.org/10.1142/p588, 2014.
Bessar, M. A., Choné, G., Lavoie, A., Buffin-Bélanger, T., Biron, P. M., Matte, P., and Anctil, F.: Comparative analysis of local and large-scale approaches to floodplain mapping: a case study of the Chaudière River, Can. Water Resour. J. Rev. Can. Ressour. Hydr., 46, 194–206, https://doi.org/10.1080/07011784.2021.1961610, 2021.
Biancamaria, S., Lettenmaier, D. P., and Pavelsky, T. M.: The SWOT Mission and Its Capabilities for Land Hydrology, in: Remote Sensing and Water Resources, vol. 55, edited by: Cazenave, A., Champollion, N., Benveniste, J., and Chen, J., Springer International Publishing, Cham, 117–147, https://doi.org/10.1007/978-3-319-32449-4_6, 2016.
Choné, G., Biron, P. M., Buffin-Bélanger, T., Mazgareanu, I., Neal, J. C., and Sampson, C. C.: An assessment of large-scale flood modelling based on LiDAR data, Hydrol. Process., 35, e14333, https://doi.org/10.1002/hyp.14333, 2021.
Choné, G., Biron, P., and Buffin-Bélanger, T.: Vers une cartographie générale des zones inondables Phase 3 – Évaluation des incertitudes associées à la modélisation hydraulique appliquée à large échelle pour des cours d'eau du Québec habité, Ministère de l'Environnement, de la Lutte contre les changements climatiques, de la Faune et des Parcs (MELCCFP), Québec, Canada, 130 pp., 2024.
Chow, V. T.: Determination of Hydrologic Frequency Factor, J. Hydraul. Div., 85, 93–98, https://doi.org/10.1061/JYCEAJ.0000327, 1959.
Cretaux, J.-F., Berge-Nguyen, M., Calmant, S., Jamangulova, N., Satylkanov, R., Lyard, F., Perosanz, F., Verron, J., Samine Montazem, A., and Le Guilcher, G.: Absolute calibration or validation of the altimeters on the Sentinel-3A and the Jason-3 over Lake Issykkul (Kyrgyzstan), Remote Sens., 10, 1679, 2018.
Croke, J., Fryirs, K., and Thompson, C.: Channel–floodplain connectivity during an extreme flood event: implications for sediment erosion, deposition, and delivery, Earth Surf. Process. Landf., 38, 1444–1456, https://doi.org/10.1002/esp.3430, 2013.
Desai, S.: Surface Water and Ocean Topography Mission (SWOT) Science Requirements Document, https://swot.jpl.nasa.gov/system/documents/files/2176_2176_D-61923_SRD_Rev_B_20181113.pdf (last access: 12 November 2025), 2018.
Diouf, A., Salameh, E., Sakho, I., Sow, B. A., Deloffre, J., López Solano, C., Turki, E. I., and Lafite, R.: Use of SWOT Data for Hydrodynamic Modelling in a Tropical Microtidal Estuarine System: The Case of Casamance (Senegal), Remote Sens., 17, 3252, 2025.
Domeneghetti, A., Schumann, G.-P., Frasson, R. P. M., Wei, R., Pavelsky, T. M., Castellarin, A., Brath, A., and Durand, M. T.: Characterizing water surface elevation under different flow conditions for the upcoming SWOT mission, J. Hydrol., 561, 848–861, 2018.
Domeneghetti, A., Molari, G., Tourian, M. J., Tarpanelli, A., Behnia, S., Moramarco, T., Sneeuw, N., and Brath, A.: Testing the use of single-and multi-mission satellite altimetry for the calibration of hydraulic models, Adv. Water Resour., 151, 103887, 2021.
Fisheries and Oceans Canada: Station 03057, https://www.marees.gc.ca/fr/stations/03057/, last access: 12 November 2025.
Frasson, R. P. D. M., Schumann, G. J. -P., Kettner, A. J., Brakenridge, G. R., and Krajewski, W. F.: Will the Surface Water and Ocean Topography (SWOT) Satellite Mission Observe Floods?, Geophys. Res. Lett., 46, 10435–10445, https://doi.org/10.1029/2019GL084686, 2019.
Fu, L., Pavelsky, T., Cretaux, J., Morrow, R., Farrar, J. T., Vaze, P., Sengenes, P., Vinogradova-Shiffer, N., Sylvestre-Baron, A., Picot, N., and Dibarboure, G.: The Surface Water and Ocean Topography Mission: A Breakthrough in Radar Remote Sensing of the Ocean and Land Surface Water, Geophys. Res. Lett., 51, e2023GL107652, https://doi.org/10.1029/2023GL107652, 2024.
Gouvernement du Québec, M. des A. municipales et de l'Habitation: Inondation causée par la rivière du Gouffre le 1er mai 2023: portrait des aléas en cause, Gouvernement du Québec, Québec, Canada, ISBN 978-2-550-96155-0, 2023.
Grimaldi, S., Li, Y., Pauwels, V. R. N., and Walker, J. P.: Remote Sensing-Derived Water Extent and Level to Constrain Hydraulic Flood Forecasting Models: Opportunities and Challenges, Surv. Geophys., 37, 977–1034, https://doi.org/10.1007/s10712-016-9378-y, 2016.
Horritt, M. S. and Bates, P. D.: Predicting floodplain inundation: raster-based modelling versus the finite-element approach, Hydrol. Process., 15, 825–842, https://doi.org/10.1002/hyp.188, 2001.
Huang, C., Chen, Y., Zhang, S., and Wu, J.: Detecting, Extracting, and Monitoring Surface Water From Space Using Optical Sensors: A Review, Rev. Geophys., 56, 333–360, https://doi.org/10.1029/2018RG000598, 2018.
INRAE: BaRatinAGE v3 == Software for rating curve development and uncertainty estimation, https://baratin-tools.github.io/en/ (last access: 12 November 2025), 2023.
Jiang, L., Westphal Christensen, S., and Bauer-Gottwein, P.: Calibrating 1D hydrodynamic river models in the absence of cross-section geometry using satellite observations of water surface elevation and river width, Hydrol. Earth Syst. Sci., 25, 6359–6379, https://doi.org/10.5194/hess-25-6359-2021, 2021.
Jiang, L., Nielsen, K., Andersen, O. B., and Liu, J.: SWOT Reveals Detailed Dynamics of Longitudinal River Slope in the Missouri River Basin, Geophys. Res. Lett., 52, e2025GL115953, https://doi.org/10.1029/2025GL115953, 2025.
Khakbaz, B., Imam, B., Hsu, K., and Sorooshian, S.: From lumped to distributed via semi-distributed: Calibration strategies for semi-distributed hydrologic models, J. Hydrol., 418, 61–77, 2012.
Kittel, C. M. M., Hatchard, S., Neal, J. C., Nielsen, K., Bates, P. D., and Bauer-Gottwein, P.: Hydraulic Model Calibration Using CryoSat-2 Observations in the Zambezi Catchment, Water Resour. Res., 57, e2020WR029261, https://doi.org/10.1029/2020WR029261, 2021a.
Kittel, C. M. M., Jiang, L., Tøttrup, C., and Bauer-Gottwein, P.: Sentinel-3 radar altimetry for river monitoring – a catchment-scale evaluation of satellite water surface elevation from Sentinel-3A and Sentinel-3B, Hydrol. Earth Syst. Sci., 25, 333–357, https://doi.org/10.5194/hess-25-333-2021, 2021b.
Laipelt, L., De Paiva, R. C. D., Fan, F. M., Collischonn, W., Papa, F., and Ruhoff, A.: SWOT Reveals How the 2024 Disastrous Flood in South Brazil Was Intensified by Increased Water Slope and Wind Forcing, Geophys. Res. Lett., 52, e2024GL111287, https://doi.org/10.1029/2024GL111287, 2025.
Landuyt, L., Van Wesemael, A., Schumann, G. J.-P., Hostache, R., Verhoest, N. E., and Van Coillie, F. M.: Flood mapping based on synthetic aperture radar: An assessment of established approaches, IEEE Trans. Geosci. Remote Sens., 57, 722–739, 2018.
Li, H., Zhang, J., Cai, X., Huang, H., and Wang, L.: On the capacity of ICESat-2 laser altimetry for river level retrieval: An investigation in the Ohio River basin, J. Hydrol., 626, 130277, 2023.
Maillard, P., Bercher, N., and Calmant, S.: New processing approaches on the retrieval of water levels in Envisat and SARAL radar altimetry over rivers: A case study of the São Francisco River, Brazil, Remote Sens. Environ., 156, 226–241, https://doi.org/10.1016/j.rse.2014.09.027, 2015.
Michailovsky, C. I., McEnnis, S., Berry, P. A. M., Smith, R., and Bauer-Gottwein, P.: River monitoring from satellite radar altimetry in the Zambezi River basin, Hydrol. Earth Syst. Sci., 16, 2181–2192, https://doi.org/10.5194/hess-16-2181-2012, 2012.
Ministry of the Environment, the Fight Against Climate Change, Wildlife and Parks (MELCCFP): Station 051305, https://www.cehq.gouv.qc.ca/hydrometrie/historique_donnees/fiche_station.asp?NoStation=051305, last access: 12 November 2025.
Mishra, A. K. and Coulibaly, P.: Developments in hydrometric network design: A review, Rev. Geophys., 47, 2007RG000243, https://doi.org/10.1029/2007RG000243, 2009.
Moghim, S., Gharehtoragh, M. A., and Safaie, A.: Performance of the flood models in different topographies, J. Hydrol., 620, 129446, 2023.
National Aeronautics and Space Administration (NASA): SWOT User Handbook, Document D-109532, Revision A, SWOT mission, https://swot.jpl.nasa.gov/data/ (last access: 12 November 2025), 2025.
Nielsen, K., Zakharova, E., Tarpanelli, A., Andersen, O. B., and Benveniste, J.: River levels from multi mission altimetry, a statistical approach, Remote Sens. Environ., 270, 112876, 2022.
NOAA: NOAA Partnered Guidelines for the Development of Advanced Hydrologic Prediction Service Flood Inundation Mapping, prepared by Dewberry under contract EA133C05CQ1048 (Task Order 35), National Oceanic and Atmospheric Administration (NOAA), Silver Spring, Maryland, USA, https://water.usgs.gov/water-resources/memos/memo.php?id=492 (last access: 26 June 2026), 2011.
O'Loughlin, F. E., Neal, J., Schumann, G. J. P., Beighley, E., and Bates, P. D.: A LISFLOOD-FP hydraulic model of the middle reach of the Congo, J. Hydrol., 580, 124203, https://doi.org/10.1016/j.jhydrol.2019.124203, 2020.
Pappenberger, F., Beven, K., Horritt, M., and Blazkova, S.: Uncertainty in the calibration of effective roughness parameters in HEC-RAS using inundation and downstream level observations, J. Hydrol., 302, 46–69, https://doi.org/10.1016/j.jhydrol.2004.06.036, 2005.
Patidar, G., Indu, J., and Karmakar, S.: Performance Assessment of Surface Water and Ocean Topography (SWOT) Mission for WSE Measurement Across India, Geophys. Res. Lett., 52, e2025GL115804, https://doi.org/10.1029/2025GL115804, 2025.
Peral, E., Esteban-Fernández, D., Rodríguez, E., McWatters, D., De Bleser, J.-W., Ahmed, R., Chen, A. C., Slimko, E., Somawardhana, R., and Knarr, K.: KaRIn, the Ka-band radar interferometer of the SWOT mission: Design and in-flight performance, IEEE Trans. Geosci. Remote Sens., 62, 1–27, 2024.
Shen, Y., Liu, D., Jiang, L., Yin, J., Nielsen, K., Bauer-Gottwein, P., Guo, S., and Wang, J.: On the contribution of satellite altimetry-derived water surface elevation to hydrodynamic model calibration in the han river, Remote Sens., 12, 4087, 2020.
Stuurman, C., Pottier, C., Chen, C., Fjortoft, R., Pavelsky, T., and Crétaux, J.-F.: Surface Water and Ocean Topography Project – Algorithm Theoretical Basis Document. Level 2 KaRIn High Rate River Single Pass Science Algorithm Software, Jet Propulsion Laboratory (JPL), California Institute of Technology, and CNES, Pasadena, California, USA, and Toulouse, France, https://podaac.jpl.nasa.gov/SWOT?tab=datasets-information§ions=about%2Bdata (last access: 26 June 2025), 2023.
Stuurman, C., Claire, P., Roger, F., Curtis, C., Stirling, A., and Lionel, Z.: SWOT Product Description: Level 2 KaRIn High Rate River Single Pass Vector Product, Pasadena, California, USA, and Toulouse, France, https://podaac.jpl.nasa.gov/SWOT?tab=datasets-information§ions=about%2Bdata (last access: 26 June 2025), 2025.
Sulistioadi, Y. B., Tseng, K.-H., Shum, C. K., Hidayat, H., Sumaryono, M., Suhardiman, A., Setiawan, F., and Sunarso, S.: Satellite radar altimetry for monitoring small rivers and lakes in Indonesia, Hydrol. Earth Syst. Sci., 19, 341–359, https://doi.org/10.5194/hess-19-341-2015, 2015.
Teng, J., Jakeman, A. J., Vaze, J., Croke, B. F., Dutta, D., and Kim, S.: Flood inundation modelling: A review of methods, recent advances and uncertainty analysis, Environ. Model. Softw., 90, 201–216, 2017.
Tourian, M. J., Tarpanelli, A., Elmi, O., Qin, T., Brocca, L., Moramarco, T., and Sneeuw, N.: Spatiotemporal densification of river water level time series by multimission satellite altimetry, Water Resour. Res., 52, 1140–1159, https://doi.org/10.1002/2015WR017654, 2016.
Villadsen, H., Deng, X., Andersen, O. B., Stenseng, L., Nielsen, K., and Knudsen, P.: Improved inland water levels from SAR altimetry using novel empirical and physical retrackers, J. Hydrol., 537, 234–247, https://doi.org/10.1016/j.jhydrol.2016.03.051, 2016.
Wood, M., Hostache, R., Neal, J., Wagener, T., Giustarini, L., Chini, M., Corato, G., Matgen, P., and Bates, P.: Calibration of channel depth and friction parameters in the LISFLOOD-FP hydraulic model using medium-resolution SAR data and identifiability techniques, Hydrol. Earth Syst. Sci., 20, 4983–4997, https://doi.org/10.5194/hess-20-4983-2016, 2016.
Yu, L., Zhang, H., Gong, W., and Ma, X.: Validation of mainland water level elevation products from SWOT satellite, IEEE J. Sel. Top. Appl. Earth Obs. Remote Sens., 17, 13494–13505, 2024.
Zhou, H., Liu, S., Mo, X., Hu, S., Zhang, L., Ma, J., Bandini, F., Grosen, H., and Bauer-Gottwein, P.: Calibrating a hydrodynamic model using water surface elevation determined from ICESat-2 derived cross-section and Sentinel-2 retrieved sub-pixel river width, Remote Sens. Environ., 298, 113796, 2023.