the Creative Commons Attribution 4.0 License.
the Creative Commons Attribution 4.0 License.
 | 30 Jun 2026
The September 2024 Danube flood compared to the 1899, 2002, and 2013 events: a hydrometeorological analysis in a changing climate
Peter Valent
Miriam Bertola
Juraj Parajka
Klaus Haslinger
Benedikt Bica
Georg Pistotnik
Korbinian Breinl
Gabriele Müller
Lovrenc Pavlin
Bianca Kahl
Achim Naderer
Günter Blöschl
In September 2024, an exceptional flood occurred in the Austrian Danube Basin, producing the highest discharges in parts of Lower Austria since instrumental records began. This study analyses the meteorological and hydrological drivers of the 2024 event and compares them with three historic floods with return periods of around 100 years at the Austrian Danube – 1899, 2002, and 2013 – to identify similarities, differences, and emerging trends in flood generation. Using representative station observations, reanalysis data, and hydrometric records from a dense network of river gauges, we examine atmospheric circulation, spatio-temporal rainfall patterns, runoff response, and flood-wave propagation along the Danube and its tributaries.
The 2024 flood was triggered by a quasi-stationary low-pressure system over the eastern Alps and western Hungary that produced two rainfall phases: a stratiform period in the west followed by convective extremes in the east, with local totals of 450–500 mm in five days. Although antecedent soil moisture was initially low, sustained rainfall led to rapid saturation and unusually high runoff coefficients (0.6–0.9) in central Lower Austria, where tributaries such as the Perschling and Kleine Tulln exceeded their HQ100 discharges by more than 150 %–250 %. In contrast, the main Danube and western Alpine tributaries showed only moderate responses.
The comparison with historical floods reveals a gradual shift from Alpine-controlled, basin-wide events toward regionally concentrated, convectively enhanced floods. The 2024 case highlights the increasing importance of atmospheric persistence, antecedent saturation, and tributary synchronisation in shaping flood extremes, providing new insights for adaptive flood-risk management in a changing climate.
- Article
(15580 KB) - Full-text XML
- BibTeX
- EndNote


Floods are among the most significant natural hazards in Europe, with recent decades showing notable changes in both their timing and magnitude. Large-sample analyses have identified significant trends in flood patterns, suggesting a link to climate change. For example, Blöschl et al. (2017) demonstrated that the timing of river floods in Europe has shifted over the past five decades, reflecting changing seasonality of flood-generating processes. In terms of flood magnitudes, Blöschl et al. (2019) identified distinct regional trends across Europe, with both increases and decreases in observed peak discharges attributable to climate drivers; notably, parts of Central and Western Europe have seen increases in flood extremes, while other regions have experienced declines. Recent analyses also indicate that floods in Europe tend to cluster in time, forming so-called flood-rich and flood-poor periods. Lun et al. (2020) found that “about two to three times more anomalies are detected than what would be expected by chance”, providing statistical evidence for such temporal clustering in observed records. Furthermore, the early 21st century has been characterized as an exceptionally flood-rich period by historical standards. The current period is exceptional as a flood-rich period in a warmer-than-usual climate, although other, colder periods in the past have seen even more frequent floods (Blöschl et al., 2020). These continental-scale studies highlight the influence of climatic trends on flood hazard. At the same time, local analyses reveal that heavier precipitation extremes are already translating into changed flood behaviour. In Austria, for instance, heavy rainfall has increased significantly over the last decades in line with a warmer atmosphere, and flood peaks have risen accordingly, particularly in small catchments (Haslinger et al., 2025).
Against the backdrop of climatic influences, examining individual flood events in detail remains crucial. Understanding the generation mechanisms of specific extreme floods and comparing them to past events reveal how various factors – such as atmospheric circulation, precipitation distribution, antecedent conditions or catchment characteristics – can interact to produce exceptional outcomes. The Upper Danube basin provides a rich historical context for such analysis, with several extreme floods recorded over the past centuries.
The flood of September 1899 was among the largest ever recorded in the Upper Danube Basin. Exceptional rainfall totals of over 200 mm within 48 h and up to 300 mm over the week were observed across wide parts of the northern Alps and the Danube lowlands (Lauda, 1900; Kresser, 1957). The storm covered much of Austria, with particularly high amounts in the Enns, Traun, and Kamp catchments, producing widespread inundation along the Danube. Historical analyses by Lauda (1908) confirmed its exceptional magnitude, identifying it as one of the most severe basin-wide floods since the 16th century.
The August 2002 flood was one of the most extreme hydrometeorological events in Central Europe in recent decades, simultaneously affecting large parts of the Danube and Elbe basins. Triggered by two successive rainstorms about a week apart, the event produced 250–350 mm of precipitation, leading to record flooding in northern Austrian tributaries such as the Kamp and Aist Rivers (Gutknecht et al., 2002; Ulbrich et al., 2003; Godina et al., 2005). The prolonged Vb-type cyclone saturated soils after the first storm, so that nearly all rainfall from the second phase generated direct runoff and exceptional discharge peaks along the northern tributaries and the Danube.
In June 2013, another major flood event occurred in the Danube basin, with peak discharges along the river reaching or exceeding those of 2002 and 1899 (Blöschl et al., 2013a, b). The 2013 flood stood out due to an atmospheric blocking pattern that brought four days of heavy rainfall along the northern Alps. Combined with very high antecedent soil moisture, this led to one of the largest flood volumes in the past two centuries (Blöschl et al., 2013a). The flood events of 1899, 2002 and 2013 serve as key benchmarks in the region's history of flood hazards, helping to contextualize and to evaluate whether the 2024 event is consistent with a broader shift in flood-generating processes.
The most recent extreme flood in the Upper Danube basin occurred in mid-September 2024. A prolonged hot and dry summer preceded the event, with low soil moisture across large parts of the Danube basin. These dry conditions were followed by a persistent and moisture-laden weather system in September, which brought exceptionally high rainfall accumulations over central Lower Austria and neighbouring regions, leading to extreme discharges. Smaller tributary catchments in Lower Austria were hit particularly hard, producing record flows that significantly contributed to the Danube's flood peak. This event raises the question of how its causes compare to those of the historical floods, and whether we can observe evolving patterns in flood generation, such as those linked to climate change.
Here we analyse the causal factors of the September 2024 flood, including the atmospheric conditions, precipitation characteristics, and the propagation of the flood wave, and compare these to those of the 1899, 2002, and 2013 events. By examining these four events side-by-side, we seek to highlight commonalities and differences in flood generation under varying hydrological and meteorological conditions. We additionally discuss these comparisons in relation to recent climate trends and flood risk.
The Upper Danube Basin considered in this study encompasses the Danube and its tributaries upstream of the river gauge Wildungsmauer, located about 30 km downstream of Vienna, Austria. It covers an area of about 104 000 km2, spanning parts of Germany, Austria, and a smaller portion of Switzerland. The basin consists of two main sub-basins: the Bavarian Danube (upper Danube and tributaries in ) and the Austrian Danube with its Alpine tributaries, notably the Inn–Salzach river system, as well as the Traun, Enns, Kamp, and Traisen. Further important contributors during major floods include the Ybbs and Erlauf Rivers from the northern Alpine foreland of Lower Austria, which often lie within heavy-precipitation zones during northerly flow conditions. Figure 1 provides an overview of the Austrian Danube Basin, the river network, and locations of key gauging stations (red circles) used in this study, as well as major cities and the boundary of Lower Austria (yellow line).
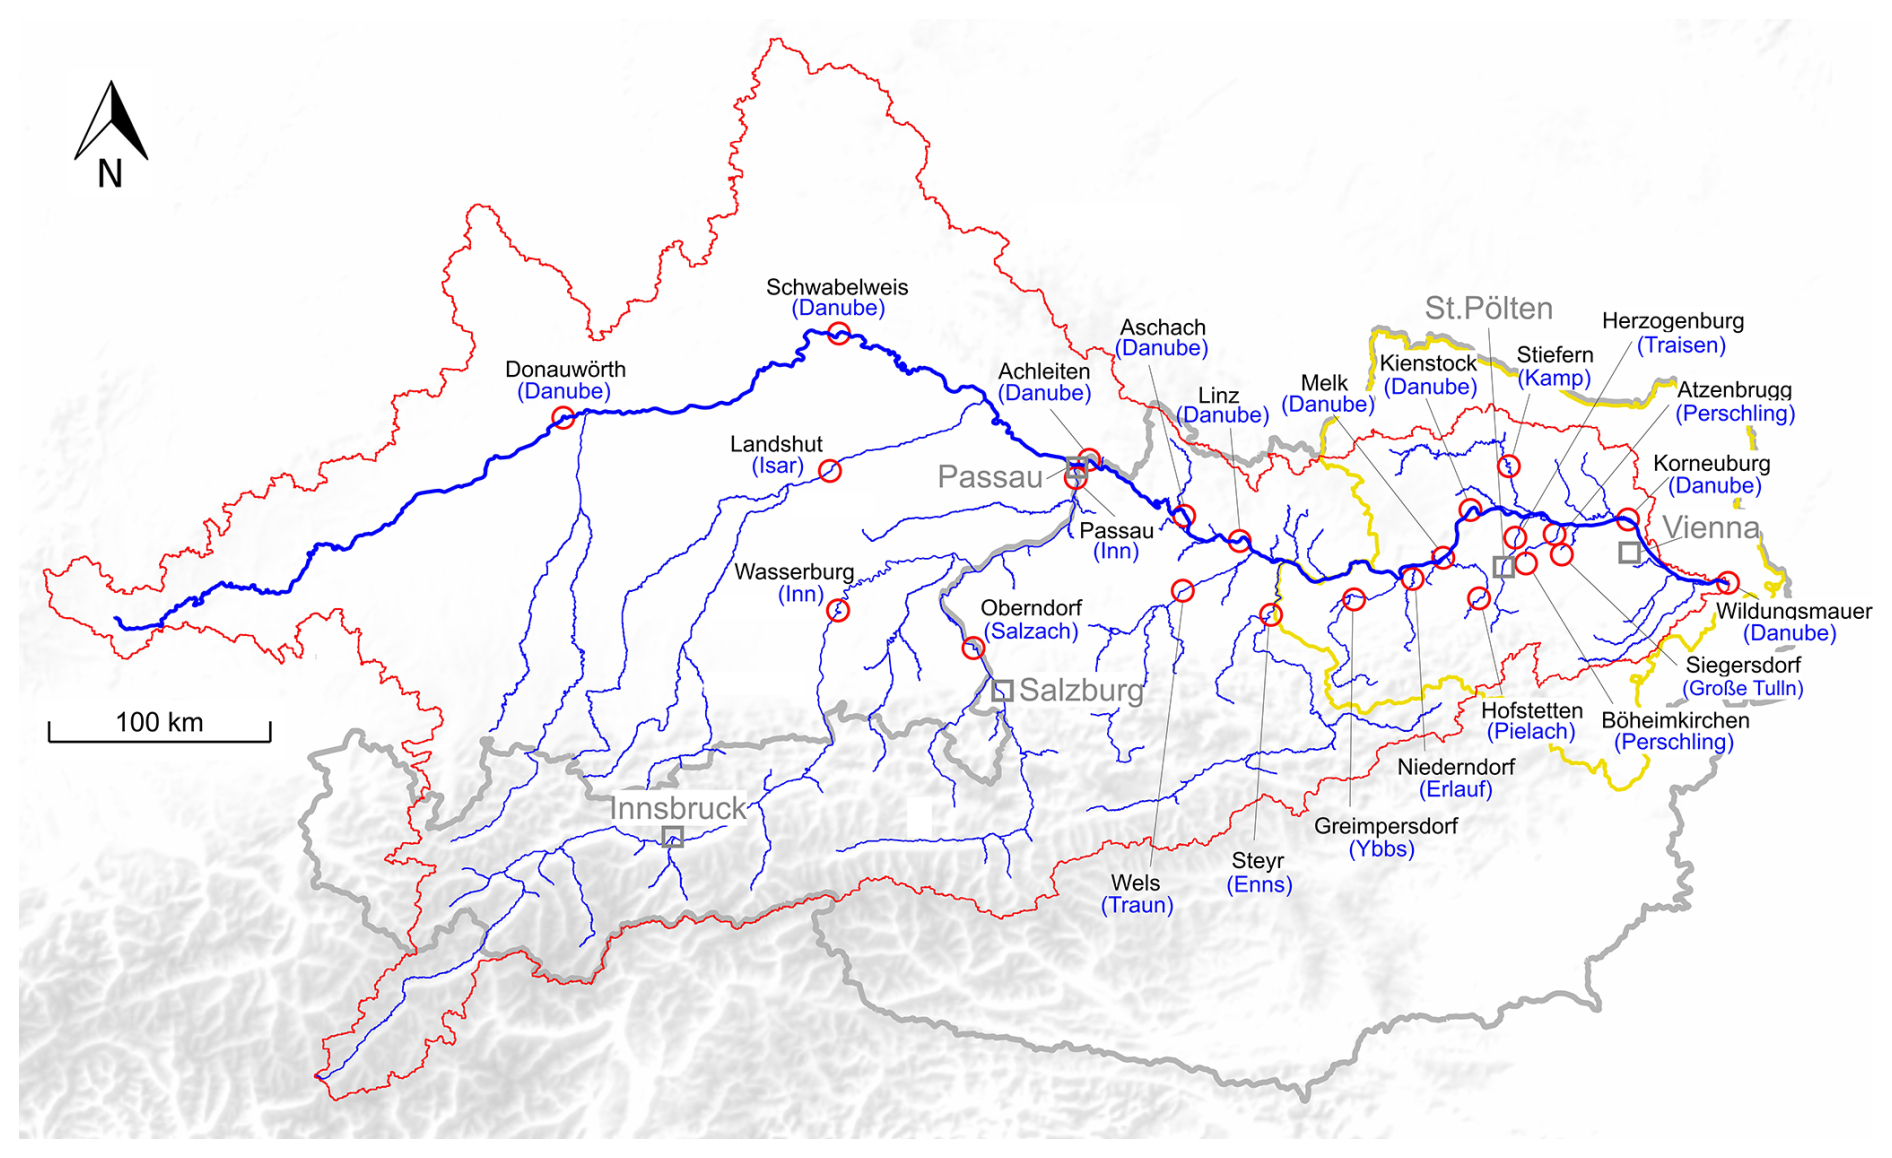
Figure 1The Danube Basin upstream of the Wildungsmauer gauge near Vienna. Red circles mark the stream gauges used in this study, and the yellow outline delineates the Lower Austrian region most affected by the September 2024 flood. The black and grey squares indicate the cities of Vienna, St. Pölten, Salzburg, Innsbruck and Passau for orientation.
The Upper Danube Basin exhibits diverse climatic and hydrological characteristics. Annual precipitation ranges from about 600–800 mm in the lowlands to over 2000 mm in the Alpine regions. Elevations range from ∼300 m in the Danube plains to over 3700 m in the Alps. This diversity leads to varying flood regimes: northern and eastern parts of the basin (e.g. Bohemian Massif, lowlands) can experience intense summer convective storms as well as long-duration rain from Atlantic fronts, whereas the Alpine parts can contribute snowmelt-driven floods in spring and severe orographic rainfall events in summer. Flood protection measures (levees, dams, retention basins) have been implemented along many tributaries and the Danube over the 20th century, which can influence flood wave propagation and peak attenuation.
Meteorological and hydrological data from the four flood events (1899, 2002, 2013, 2024) were compiled from various sources. For 2024, we use data from national weather services and hydrographic services in Austria and Germany, including high-resolution gridded precipitation analyses (the INCA system; see Haiden et al., 2011, in References) and gauge records for discharge. The 2013 and 2002 events are well-documented (e.g. Blöschl et al., 2013a; Ulbrich et al., 2003, Gutknecht et al., 2002), and we draw on published datasets for precipitation and river flows for those events. The 1899 event, being historical, is reconstructed from archival rain gauge data (about 600 stations; HZB, 1955; Lauda, 1900) and historic flood mark records (e.g. Kresser, 1957; Pekarová et al., 2013). All discharge data have been converted to consistent units and, where necessary, adjusted for changes in river regulation (e.g. the construction of levees and reservoirs since the 19th century) based on the literature.
For a thorough causal and synoptic analysis of the events presented, a wide range of synoptic charts (upper atmospheric levels and surface level, both for numerous timesteps) and contributing factors must be taken into account. Gathering this information can be highly complex or even impossible to accomplish for historical events. To keep the hydrological scope of this publication, we limit our discussion to the depiction shown in Fig. 2, which illustrates the large-scale upper-level flow pattern (absolute topography of the 500 hPa surface, contours) and the availability of precipitable water (shaded) around the estimated peak of the events: (a) 13 September 1899, (b) 12 August 2002, (c) 31 May 2013, and (d) 14 September 2024. Additional meteorological aspects will be covered by the following sections. The estimated peak times shown in Fig. 2 correspond to the timing of maximum discharge at representative Danube gauges – based on hydrograph data for recent floods and reconstructed from hydraulic modelling and archival reports for historical events. For 1899, the peak at the Vienna gauge was used as a reference point.
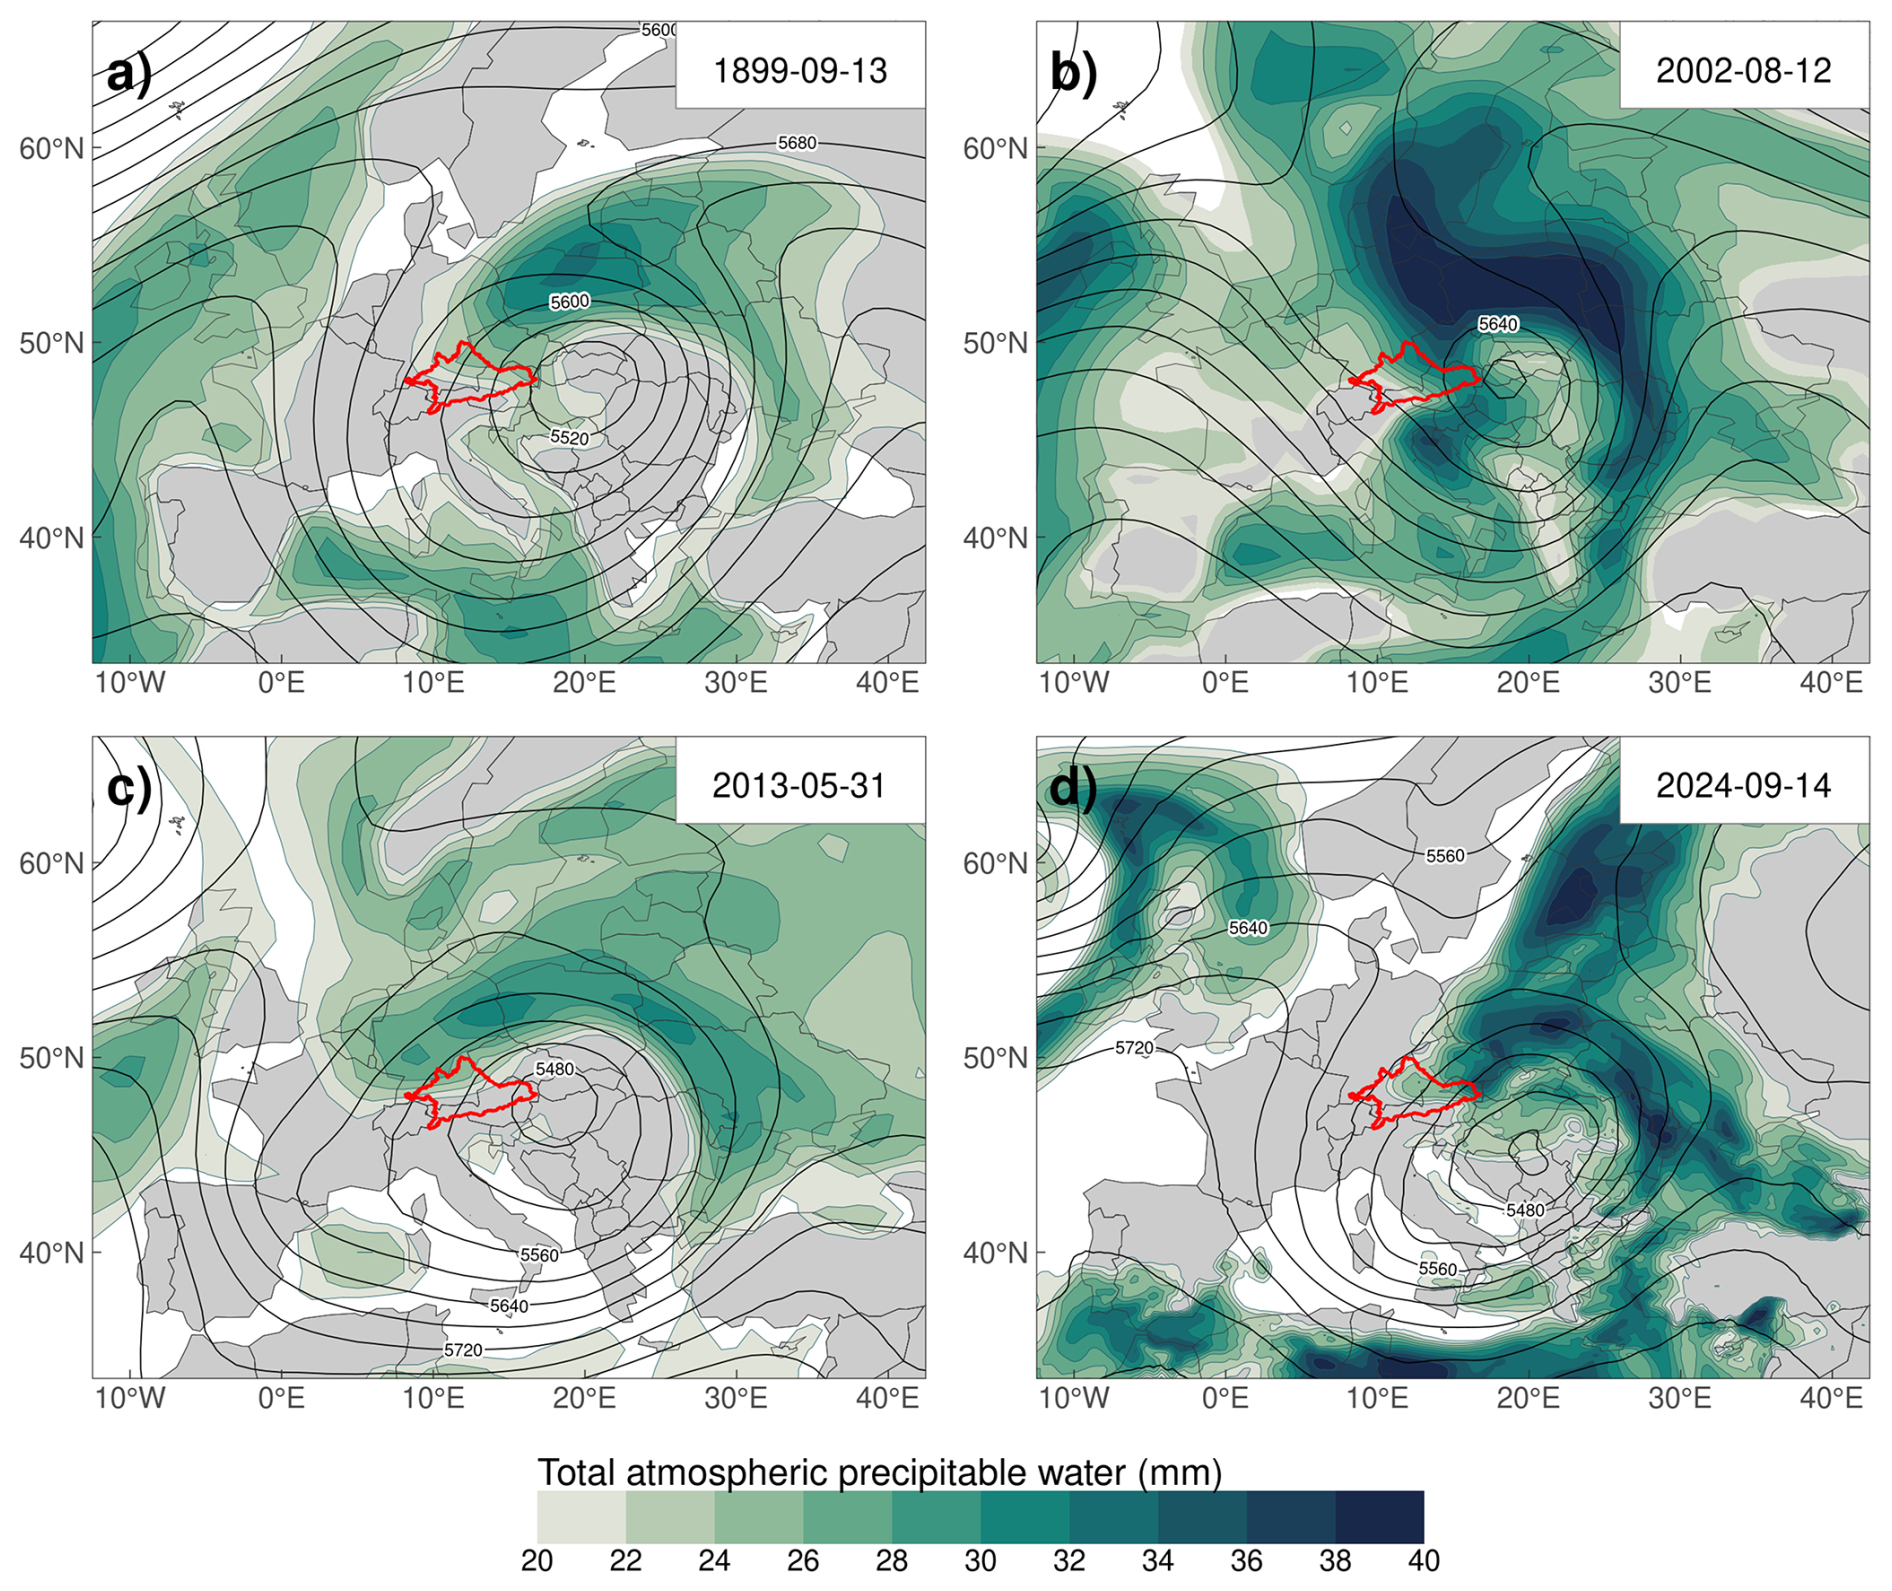
Figure 2Total atmospheric precipitable water (shaded, in mm) and absolute topography of the 500 hPa surface sea-level pressure (contours, gpm hPa) over Central Europe representing conditions close to the time of maximum discharge for four historic flood events The event was characterised by low pressure and high atmospheric moisture. (a) the September 1899 flood, (b) the August 2002 flood, (c) the June 2013 flood and, (d) the September 2024 flood. These maps illustrate the large-scale atmospheric moisture availability and circulation driving the heavy precipitation in each event. Total atmospheric precipitable water ranges on average around 18–24 mm for the summer months in Central Europe.
In the case of the September 1899 flood and the August 2002 flood, the synoptic situation was characterized by a deep upper-level low-pressure system over Central Europe which, in combination with an adequate configuration of the surface pressure field, can draw in warm, moisture-rich air from the southeast. The 2002 event was triggered by a so-called Vb cyclone track (Ulbrich et al., 2003), where a surface low moves from the northern Adriatic Sea across Hungary into Austria and the Czech Republic. Rather than moving quickly, however, the 2002 system became quasi-stationary over Central Europe for several days, which allowed for persistent extreme rainfall and upslope flow, particularly along the northern slopes of the Alps and Bohemian Massif. Similarly, the September 2024 flood was associated with a slow-moving, moisture-laden low-pressure system, but unlike 2002, it did not follow the classic Vb track. Instead, the 2024 system stalled over the eastern Alps and western Hungary, drawing continuous moisture from the Mediterranean and Black Seas and producing sustained heavy rainfall over central and eastern Austria, with surface pressures below 1000 hPa and precipitable water values exceeding 30 mm, which are significantly above seasonal averages. This persistence was likely related to a blocked large-scale circulation, a pattern that has become more frequent in a warming climate with higher atmospheric moisture availability (Blöschl et al., 2019; Haslinger et al., 2025). Such slow-moving, moisture-rich systems may therefore become increasingly likely in the future, enhancing the potential for prolonged heavy rainfall and regional flooding.
By contrast, the June 2013 flood occurred under an atmospheric blocking pattern, with a persistent high over northern Europe and a cut-off low over Central Europe directing moist Atlantic and Mediterranean air toward the eastern Alps (Blöschl et al., 2013a). This setup resulted in precipitable water values above 30 mm and several days of sustained rainfall along the northern Alpine rim. While shaped by different synoptic conditions than the 2024 event described above, the 2013 flood similarly exemplifies a persistent large-scale circulation conducive to extreme precipitation.
An important distinction among the events is the spatial focus of the atmospheric moisture. The 2013 event featured a broad plume of precipitable water spanning much of the northern Alpine region and extending well into Central Europe. The 2002 event showed a more focused corridor of high moisture northeast of the Alps, with strong inflow into Austria's northern and eastern tributaries. In contrast, the 1899 event was characterized by a compact cyclonic system centred over Central Europe, bringing moderate but widespread moisture. Although less intense than in more recent events, the system's persistence was sufficient to produce multi-day heavy rainfall. The 2024 event had an intermediate character: synoptic-scale moisture was abundant and the heaviest precipitation was confined to a narrower corridor in central Lower Austria, indicating embedded mesoscale convective enhancement. The repeated convective cell development over the same area, likely supported by orographic effects and convergence in the Alpine foreland, accounts for the highly localized and prolonged rainfall observed.
Overall, all four flood events shared large-scale atmospheric conditions that produced unusually high moisture supply and sustained heavy precipitation over multiple days. The emerging low pressure systems were rather strong synoptic systems, showing core pressure anomalies of roughly two standard deviations from the mean values for the time of the year. However, differences in pressure pattern dynamics (blocking vs. traveling cyclone), moisture source regions, and temperature regimes (influencing snow versus rain, see next section) shaped the specific characteristics and impacts of each event.
To illustrate the thermal context of the 2024 event, Fig. 3 shows the 850 hPa temperature anomalies and geopotential height over Europe for 13–16 September 2024. The anomalies, computed relative to the 1991–2020 climatology, highlight an abnormally warm air mass over North-eastern Europe (5–10 °C above average) that persisted throughout the event, while a cold-core low remained nearly stationary over vast expanses of Central Europe. Note that due to Austria's topography, the 850 hPa level corresponds to elevations above many catchments, potentially biasing local anomaly interpretation. This configuration created strong temperature contrasts and sustained atmospheric instability, favouring repeated convective development. Compared with earlier events, the 2024 anomaly was more localized and thermally stronger than in 2013, and clearly warmer than during 2002, when cooler air limited convective activity. These features are consistent with observed increases in short-duration heavy rainfall over Austria in recent decades (Haslinger et al., 2025), underscoring the role of a warmer atmosphere in amplifying moisture availability and rainfall intensity.
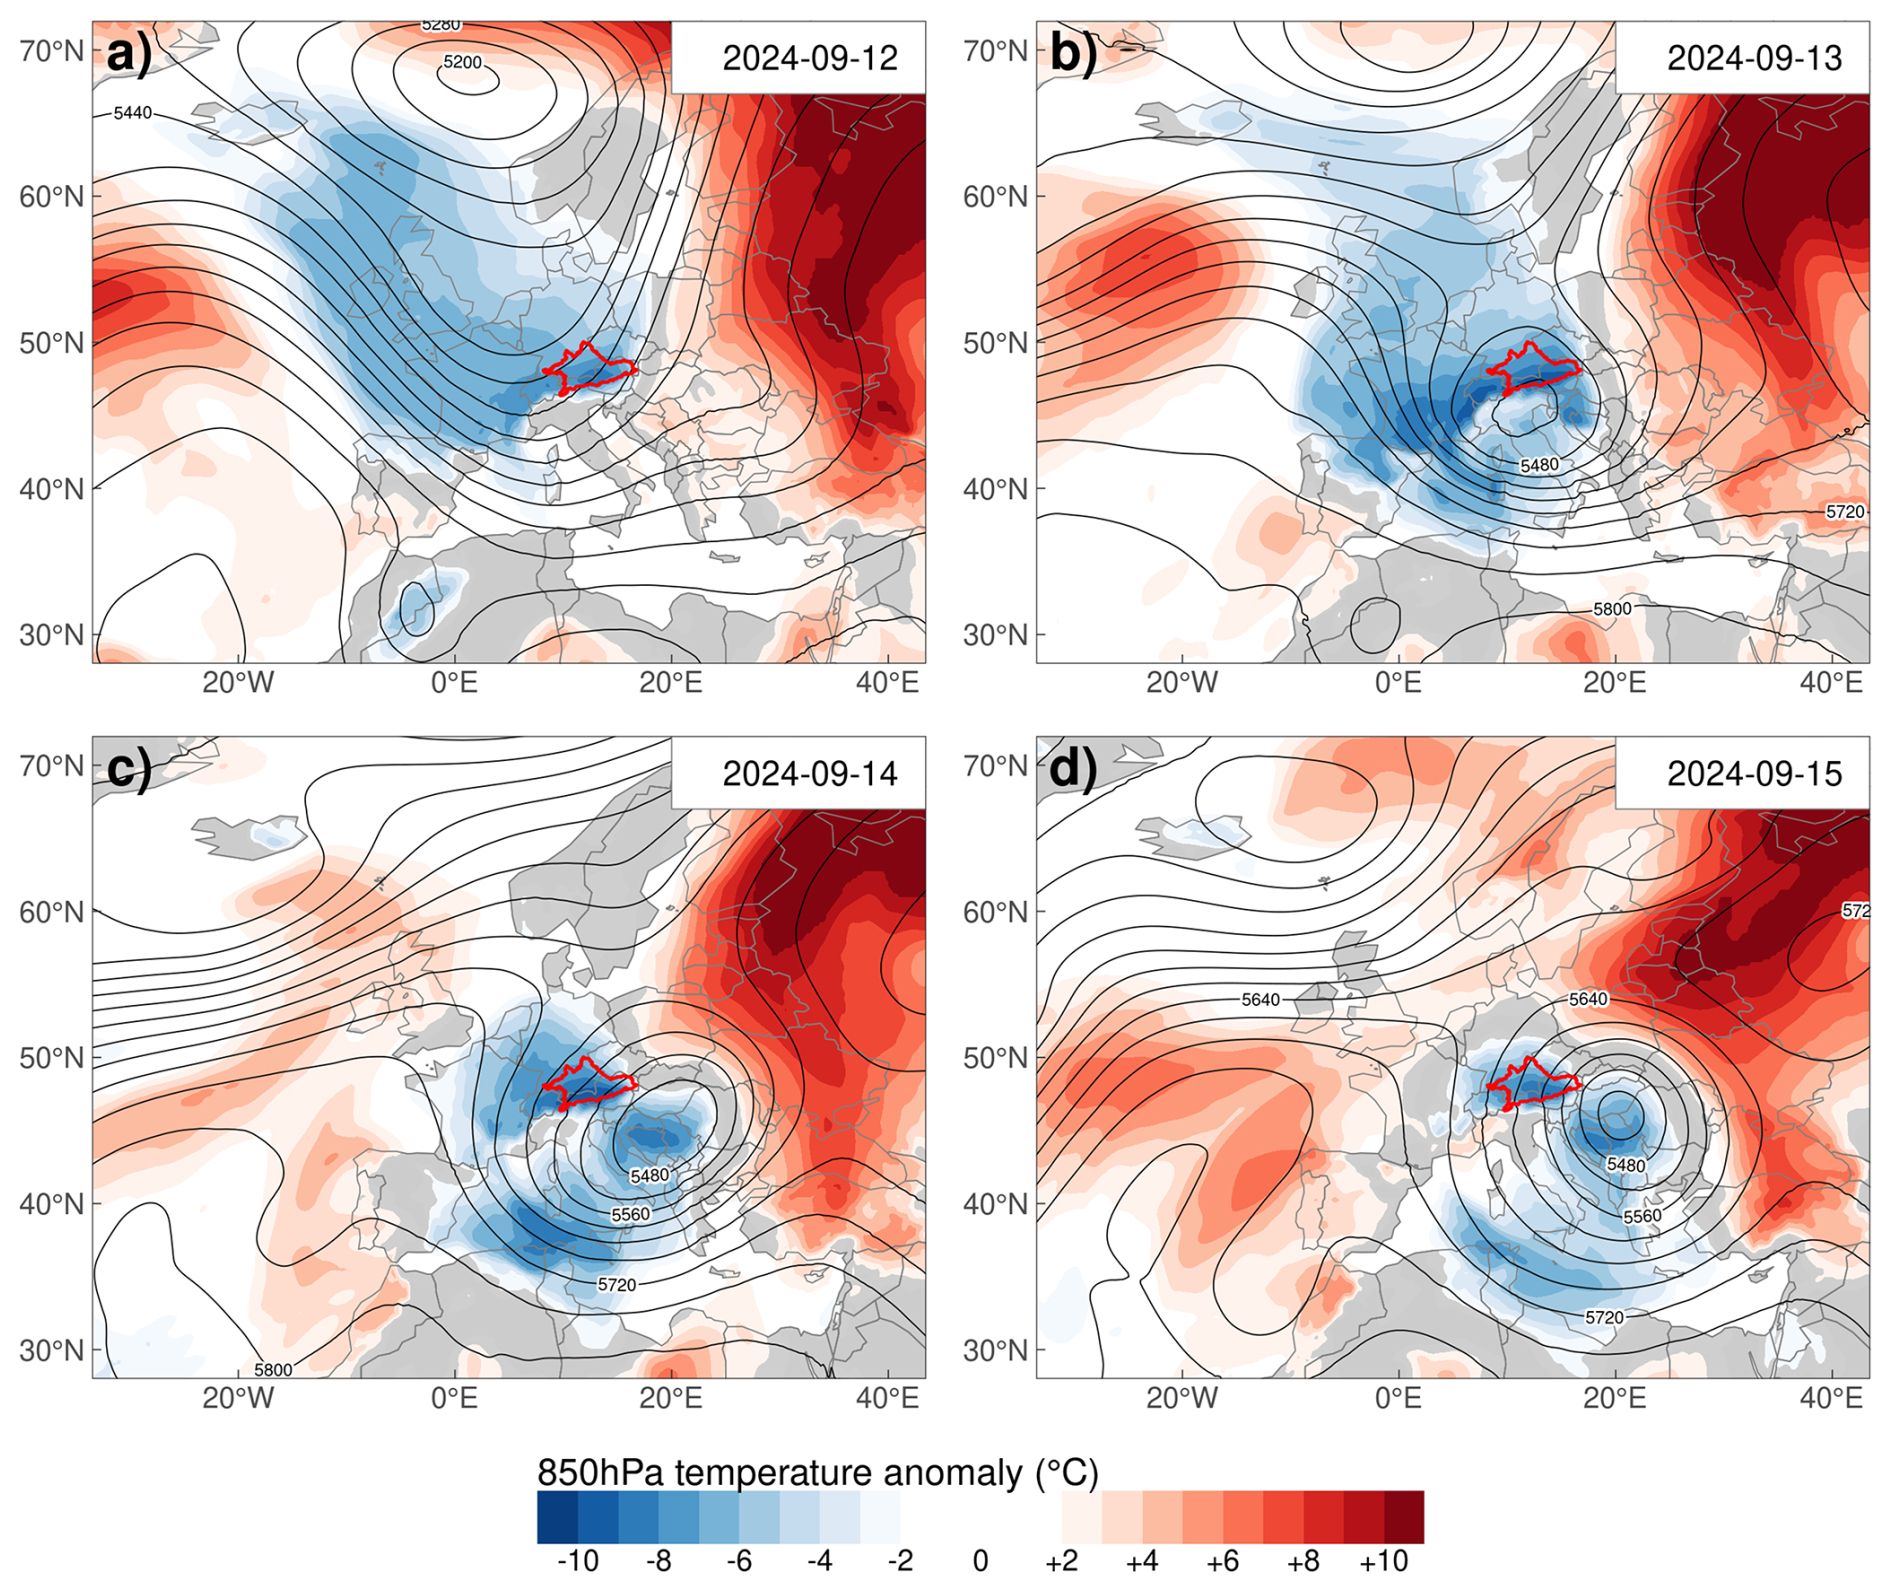
Figure 3Evolution of the 850 hPa temperature anomaly (°C) and 500 hPa geopotential height (gpm) during the September 2024 flood event over Central Europe. Panels show daily snapshots from (a) 13 September, (b) 14 September, (c) 15 September, and (d) 16 September. Blue and red shading indicates negative and positive temperature anomalies, respectively, relative to the 1991–2020 climatology.
4.1 Precipitation distribution and intensity
The accumulated precipitation over the duration of each flood event is shown in Fig. 4. These precipitation totals are given for (a) 8–14 September 1899, (b) 4–15 August 2002, (c) 29 May–4 June 2013, and (d) 12–17 September 2024. The selected periods correspond to the core rainfall phases that led to peak discharges in the respective events. The data basis for all events was the gridded rain-gauge analysis (INCA method combining gauges and radar; Haiden et al., 2011), except for the 1899 event, for which historical rain-gauge data interpolated from about 600 stations (sources: Hydrographisches Zentralbüro, 1955; Lauda, 1900) were used. The red outline in each panel indicates the Upper Danube catchment boundary. All four events were characterized by very large multi-day precipitation totals (exceeding 200–300 mm over broad areas), but there are notable differences in their patterns. The September 1899 flood event (Fig. 4a) was associated with extraordinary rainfall over a broad area of the Eastern Alps and the northern Danube region. Historical data indicate that 48 h precipitation sums exceeded 200 mm over an area of roughly 1000 km2 (Kresser, 1957). The reconstructed map shows large accumulations not only in the Alpine headwaters but also further downstream, suggesting that the storm covered much of Austria with intense rainfall over nearly a week (8–14 September 1899).
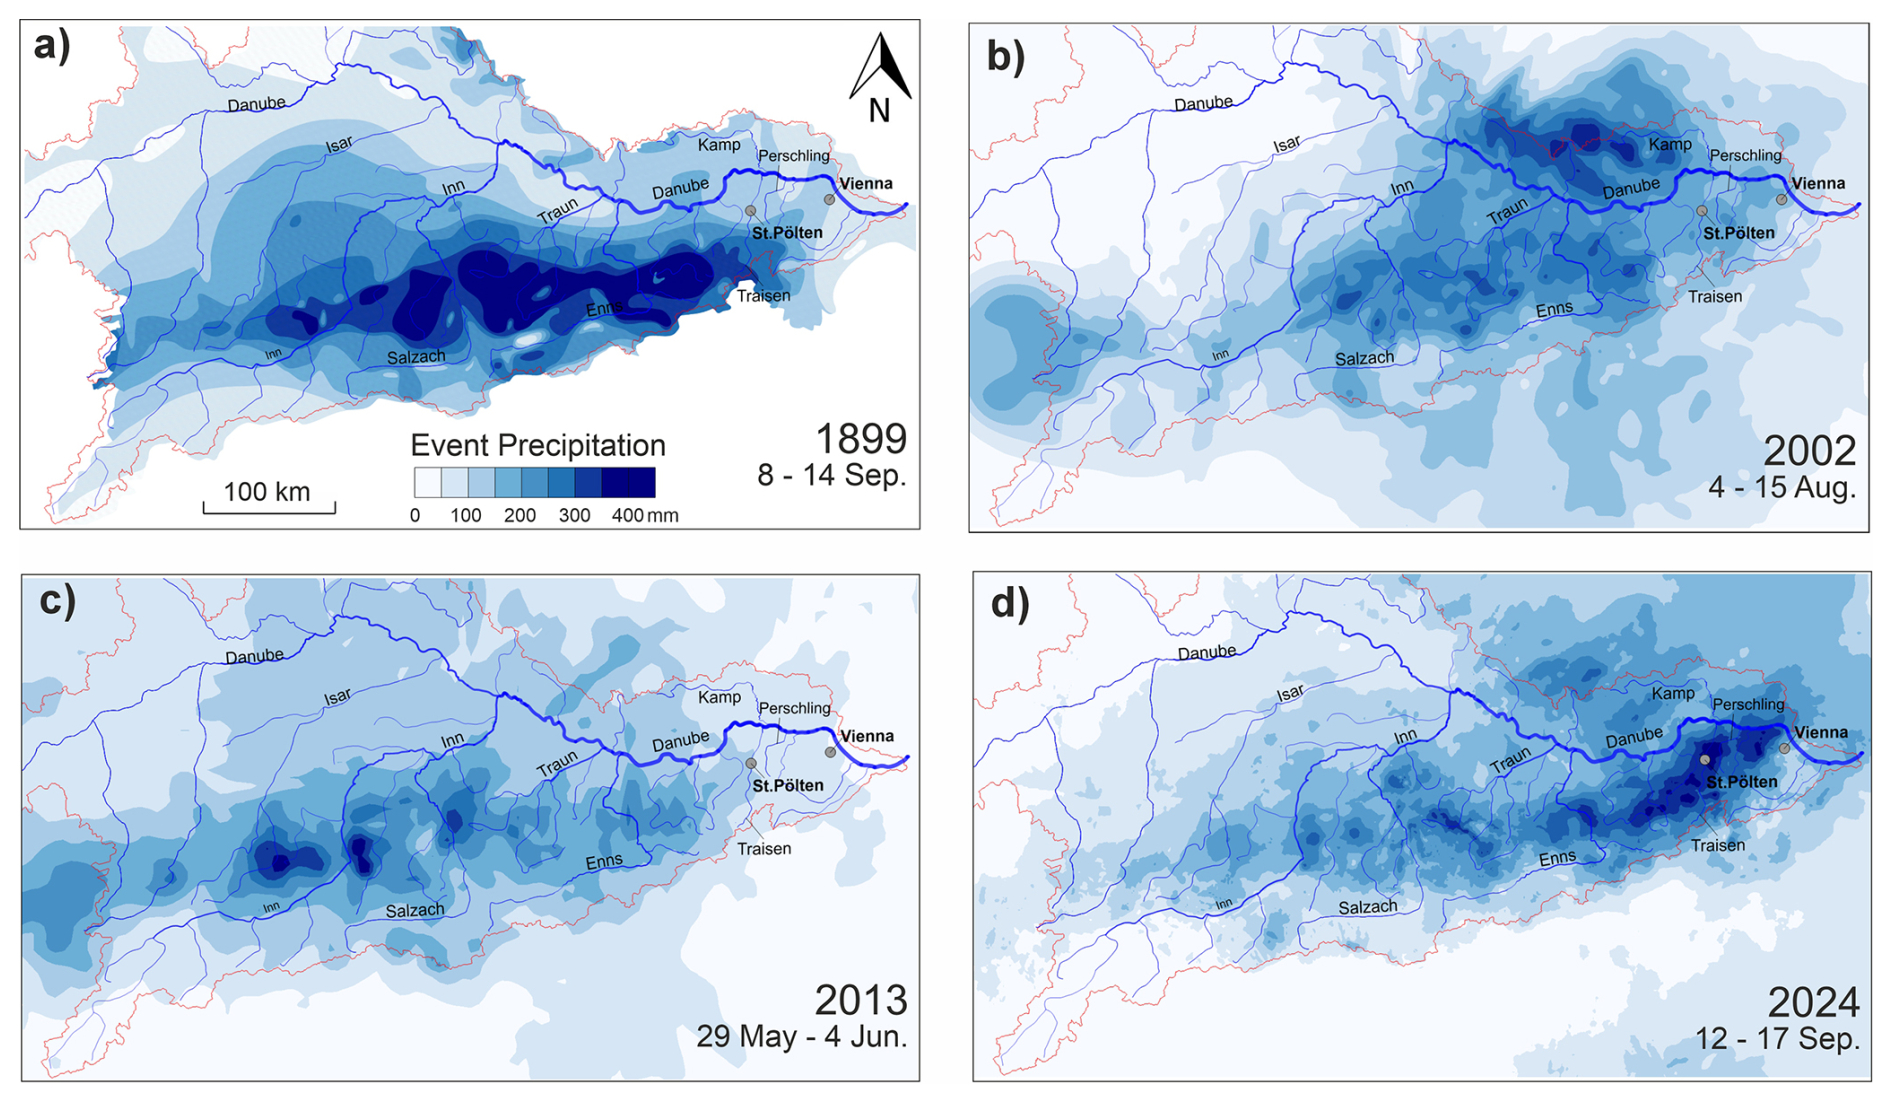
Figure 4Observed precipitation totals for the four large flood events in the Upper Danube Basin. (a) 8–14 September 1899, based on historical rain-gauge data interpolated from approximately 600 rain gauges (sources: Hydrographisches Zentralbüro, 1955; Lauda, 1900). (b) 4–15 August 2002, (c) 29 May–4 June 2013, and (d) 12–17 September 2024 are based on gridded rain-gauge analyses using the INCA method (combining rain gauges and radar; Haiden et al., 2011). The red outline indicates the Upper Danube catchment boundary upstream of the Wildungsmauer river gauge.
The August 2002 flood (Fig. 4b) had its maximum precipitation in the northeastern part of the basin. Extremely high totals (>250 mm) were recorded in the Czech Republic and in Austria's northern Waldviertel region, particularly in the catchments of tributaries such as the Kamp and Aist rivers (Gutknecht et al., 2002; Ulbrich et al., 2003). The southern and western regions received significantly less rainfall.
The June 2013 flood event (Fig. 4c) produced widespread rainfall along the northern fringe of the Alps, covering parts of Tyrol, Salzburg, and Upper Austria, with local totals exceeding 300 mm. Substantial rainfall also extended northward into Bavaria and Bohemia, resulting in a broad spatial extent of heavy precipitation across much of the Upper Danube basin (Blöschl et al., 2013a).
In contrast, the September 2024 flood (Fig. 4d) exhibited a much more concentrated precipitation pattern. The highest totals – locally up to 500 mm over five days – were recorded in central Lower Austria, roughly between St. Pölten and Vienna. This region, characterized by hilly foreland and lowland terrain rather than Alpine headwaters, includes medium-sized catchments such as the Traisen and Perschling rivers. Unlike previous major floods, notably 2013, which mainly affected Alpine headwaters, the 2024 event was exceptional because the heaviest rainfall occurred in the lowlands and foothills, outside the classical high-precipitation zones of the northern Alps. The rain persisted for five consecutive days, producing an intense and localized flood response with record flows in central Lower Austria, while the western Austrian Alps (e.g., Tyrol and Vorarlberg) and Bavaria received only moderate precipitation and did not experience extreme flooding.
Apart from the spatial accumulation, the temporal evolution of the 2024 rainfall was a critical factor. Figure 5 shows the daily precipitation maps in eastern Austria on (a) 12 September, (b) 13 September, (c) 14 September, and (d) 15 September 2024. The four maps show heavy rainfall persisted over several days, impacting roughly the same area in central Lower Austria throughout the event. On 12 September, intense rain was concentrated west of St. Pölten; by 13–14 September, the core region of maximum precipitation shifted slightly eastward and southward, affecting areas in the foothills of the Alps, including Lilienfeld and the upper Traisen valley; on 15 September, significant rainfall continued, though with slightly reduced intensity. This series of consecutive heavy rainfalls led to progressive saturation of soils and sustained high runoff. With little time for catchments to recover between pulses of rain, flood peaks compounded.
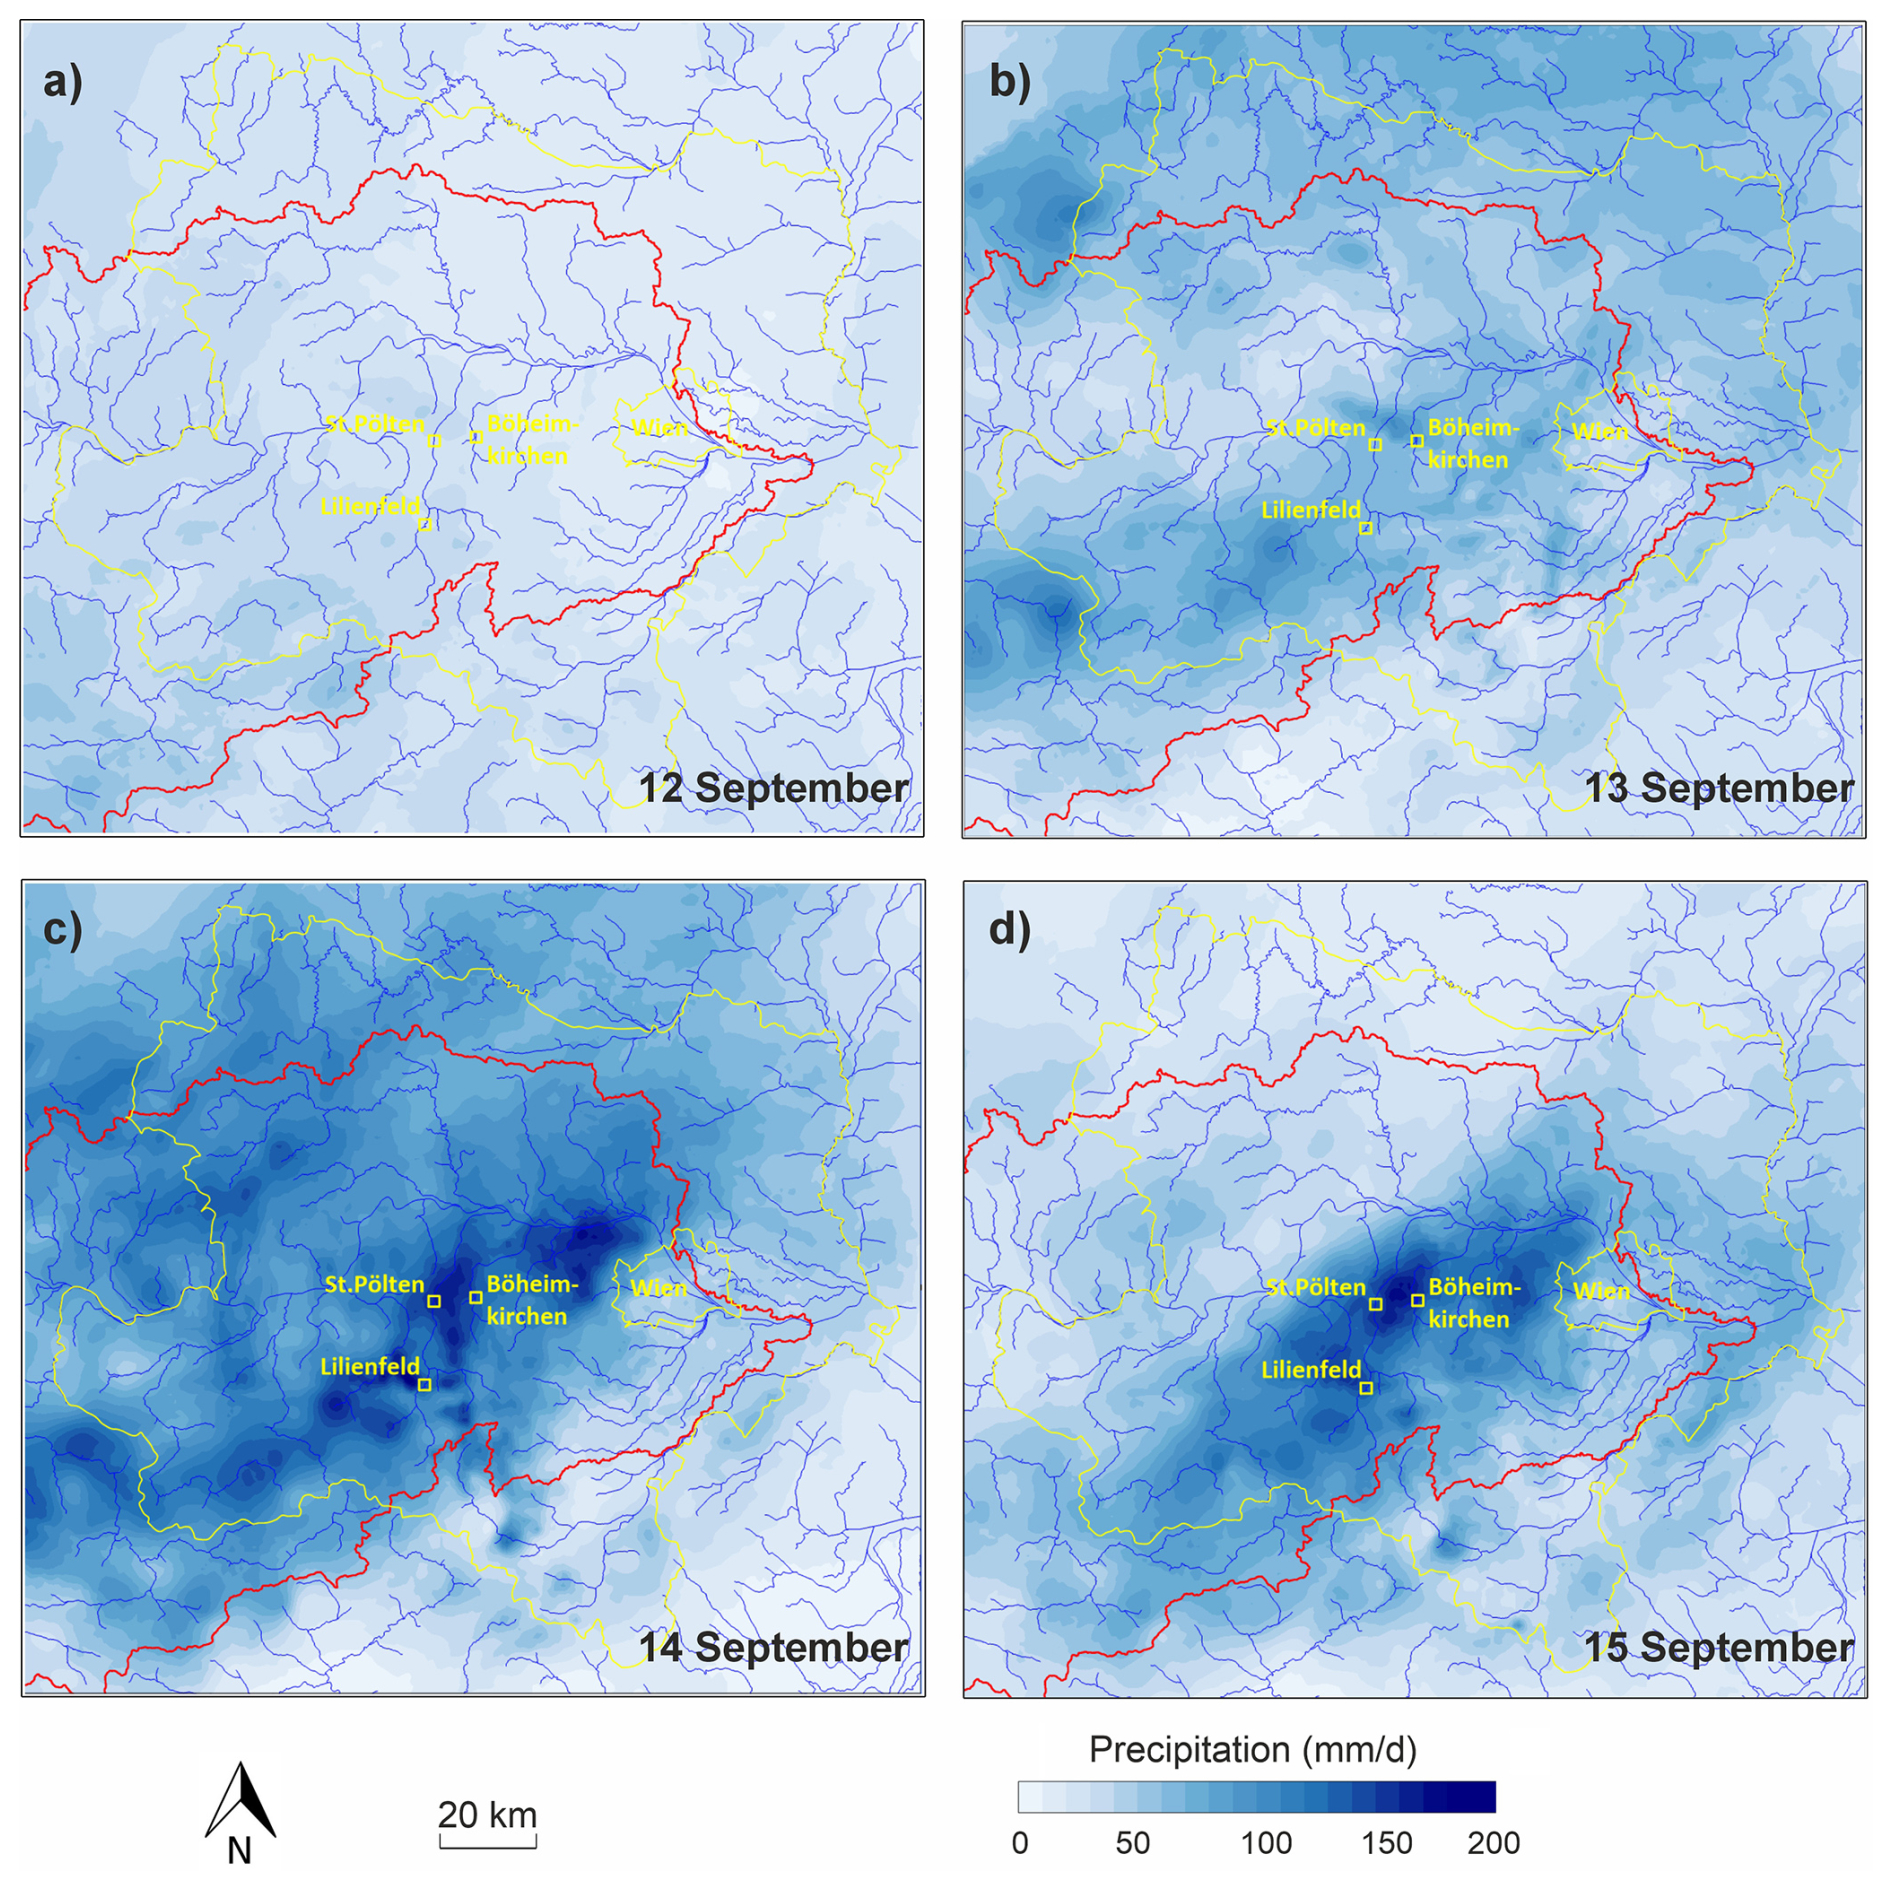
Figure 5Observed daily precipitation (24 h totals) in eastern Austria on (a) 12 September, (b) 13 September, (c) 14 September, and (d) 15 September 2024. Shown are the four core rainfall days preceding the Danube flood peak. Data are from the INCA gauge–radar analysis (Haiden et al., 2011). The red outline indicates the Upper Danube catchment. The yellow line marks the border of Lower Austria and Vienna. Yellow rectangles indicate the locations of St. Pölten, Lilienfeld, and Böheimkirchen.
4.2 Rainfall versus snowfall contribution
During cooler seasons or at higher elevations, part of the precipitation can fall as snow, temporarily storing water and reducing immediate runoff.
Among the four events, the September 1899 flood occurred late in summer, yet some reports indicate snowfall at the highest Alpine peaks due to a cold spell during the storm (HZB, 1955). The August 2002 flood developed under warm late-summer conditions, and precipitation fell entirely as rain across the Upper Danube region. In June 2013, air temperatures dropped markedly on 29–30 May, causing snowfall above about 1600 , which reduced the liquid precipitation available for direct runoff (Blöschl et al., 2013a). Finally, the September 2024 flood occurred under warm early-autumn conditions, with precipitation falling almost entirely as rain except for some snowfall in the high-elevation catchments of Tyrol and Salzburg, as discussed below.
In early September 2024, air temperatures in Austria were exceptionally high, averaging 21–22 °C in the lowlands and around 15 °C in the Alps, about 3–5 °C above the long-term mean. With the onset of heavy rainfall on 12 September, a pronounced cold-air outbreak caused temperatures to drop by roughly 12 °C nationwide and brought persistent, multi-day precipitation to eastern and central Austria (Fig. 6). This cold-air outbreak is consistent with the negative anomalies shown in Fig. 3. At the St. Pölten weather station (272 ), daily mean temperatures fell from about 21 to 8 °C, with night-time minima near 5 °C, while more than 400 mm of rain accumulated between 12 and 17 September. In the foothills of Lower Austria, mean event temperatures were around 6 °C, and Alpine gauges above 1000 recorded averages of 3–4 °C with minima close to 0 °C, indicating snowfall above roughly 1700–1800 .
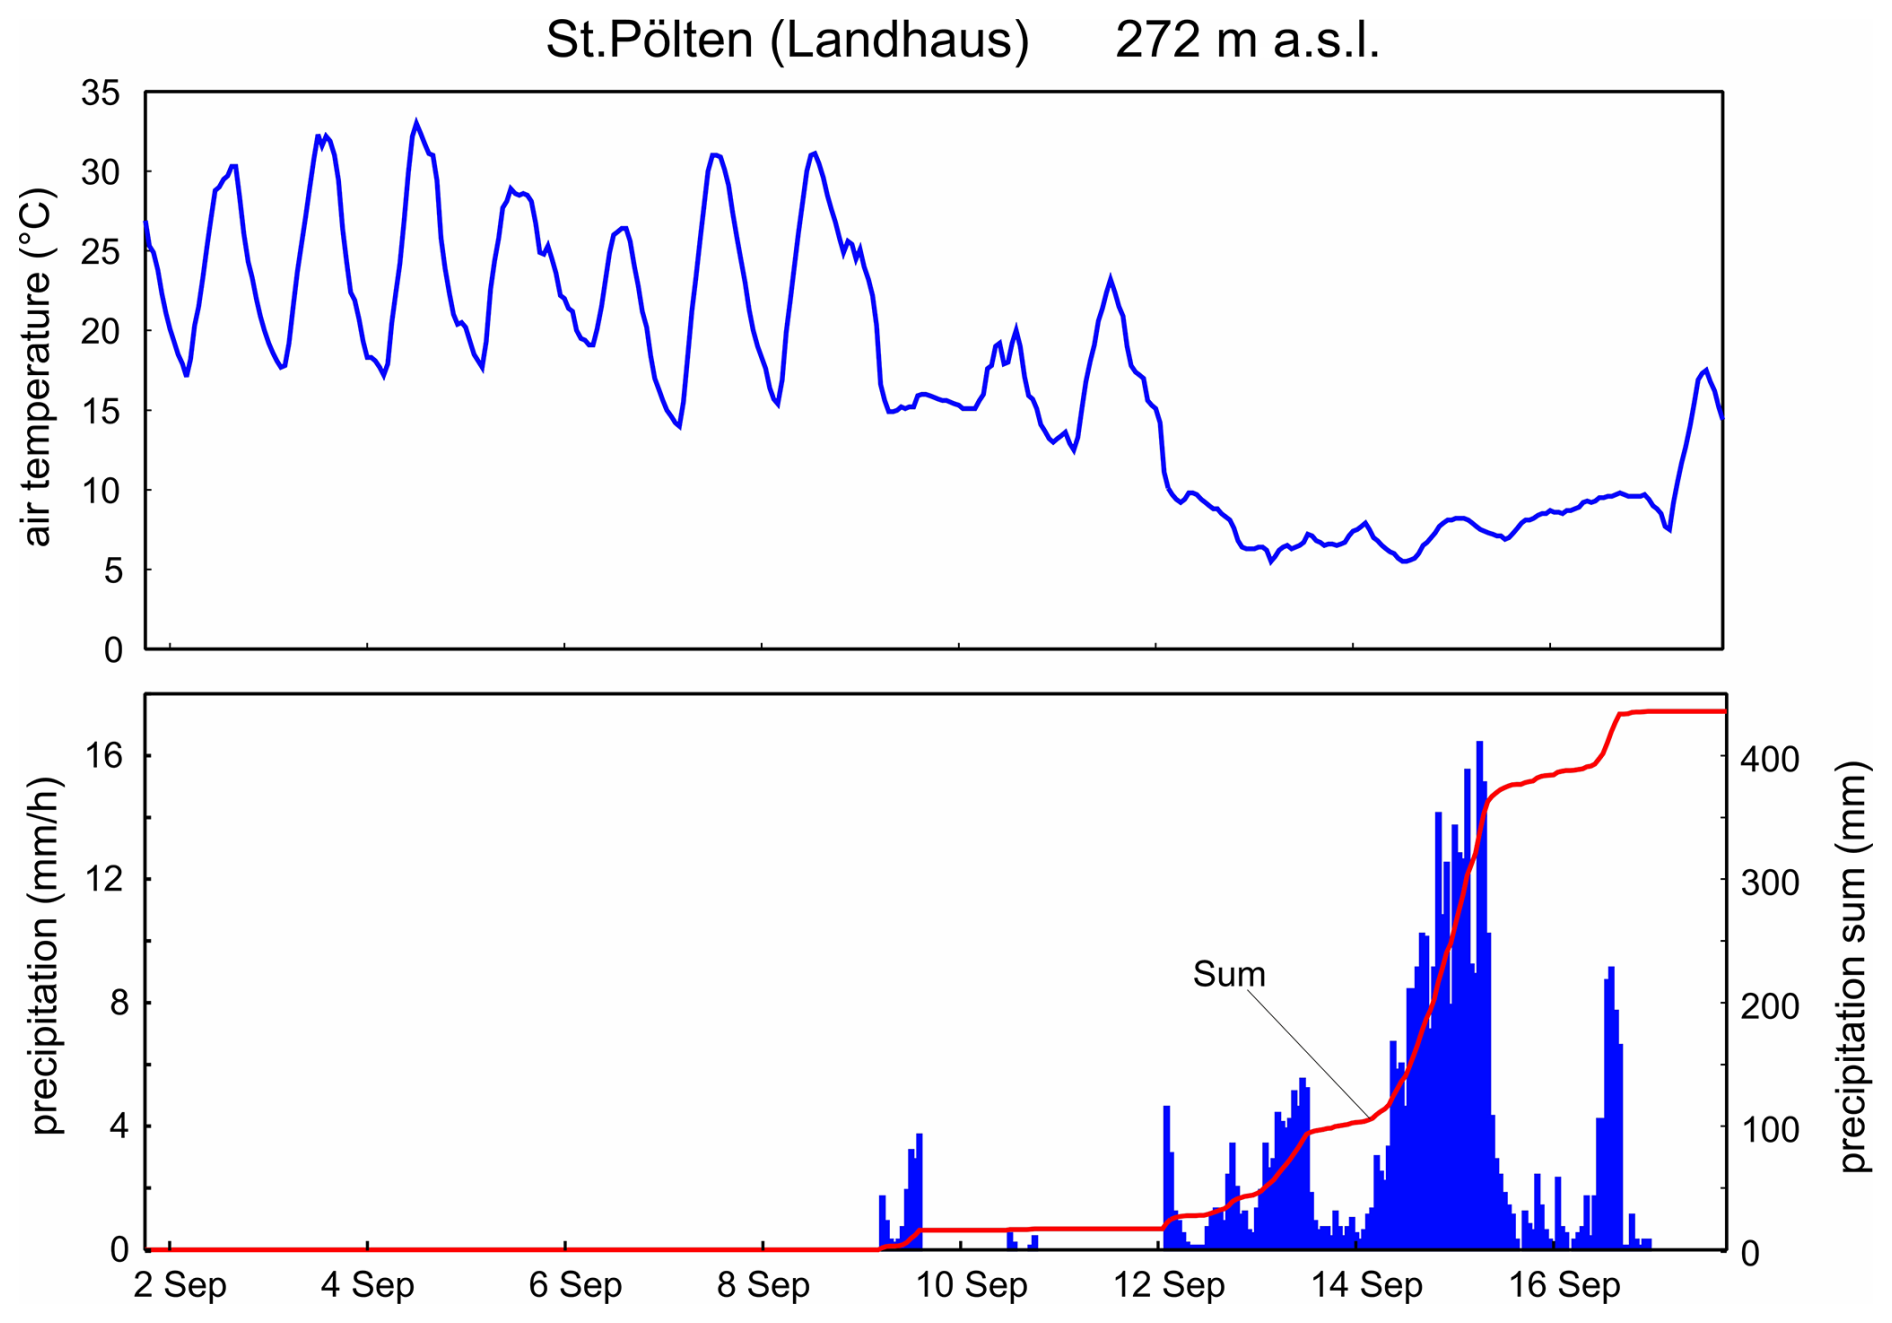
Figure 6Hourly meteorological data recorded at St. Pölten (Landhaus station, 272 ) from 2 to 17 September 2024. The upper panel shows mean hourly air temperature (°C). The lower panel shows hourly precipitation sums (mm, blue bars) and cumulative precipitation sum (mm, red line).
Figure 7 illustrates the spatial distribution of rainfall and snowfall across the Upper Danube region during the September 2024 event. In the eastern and central parts of the basin, including the Traisen–Pielach area, precipitation totals reached 350–420 mm, and virtually all fell as rain, with snowfall fractions below 1 %. Farther west, in the Enns and Salzach headwaters of Upper Austria and Salzburg, cooler air masses and higher elevations led to mixed precipitation, with 30 %–50 % of the total falling as snow – for example, around 100 mm of rain and 80 mm of snow at Admont, and about 50 mm of rain and 80 mm of snow at Mittersill. The Inn basin in Tyrol also exhibited a moderate snow component. These west–east contrasts reflect the pronounced temperature gradient during the event and explain why runoff from western Alpine tributaries was relatively moderate, while eastern tributaries such as the Traisen, Perschling, and Pielach produced intense and nearly synchronous flood peaks. In central Lower Austria, snowfall was negligible, and once soils became saturated, nearly the entire rainfall volume directly became runoff. In contrast, during the 2013 flood event, snowfall above approximately 1600 delayed runoff and attenuated flood peaks in several Alpine catchments.
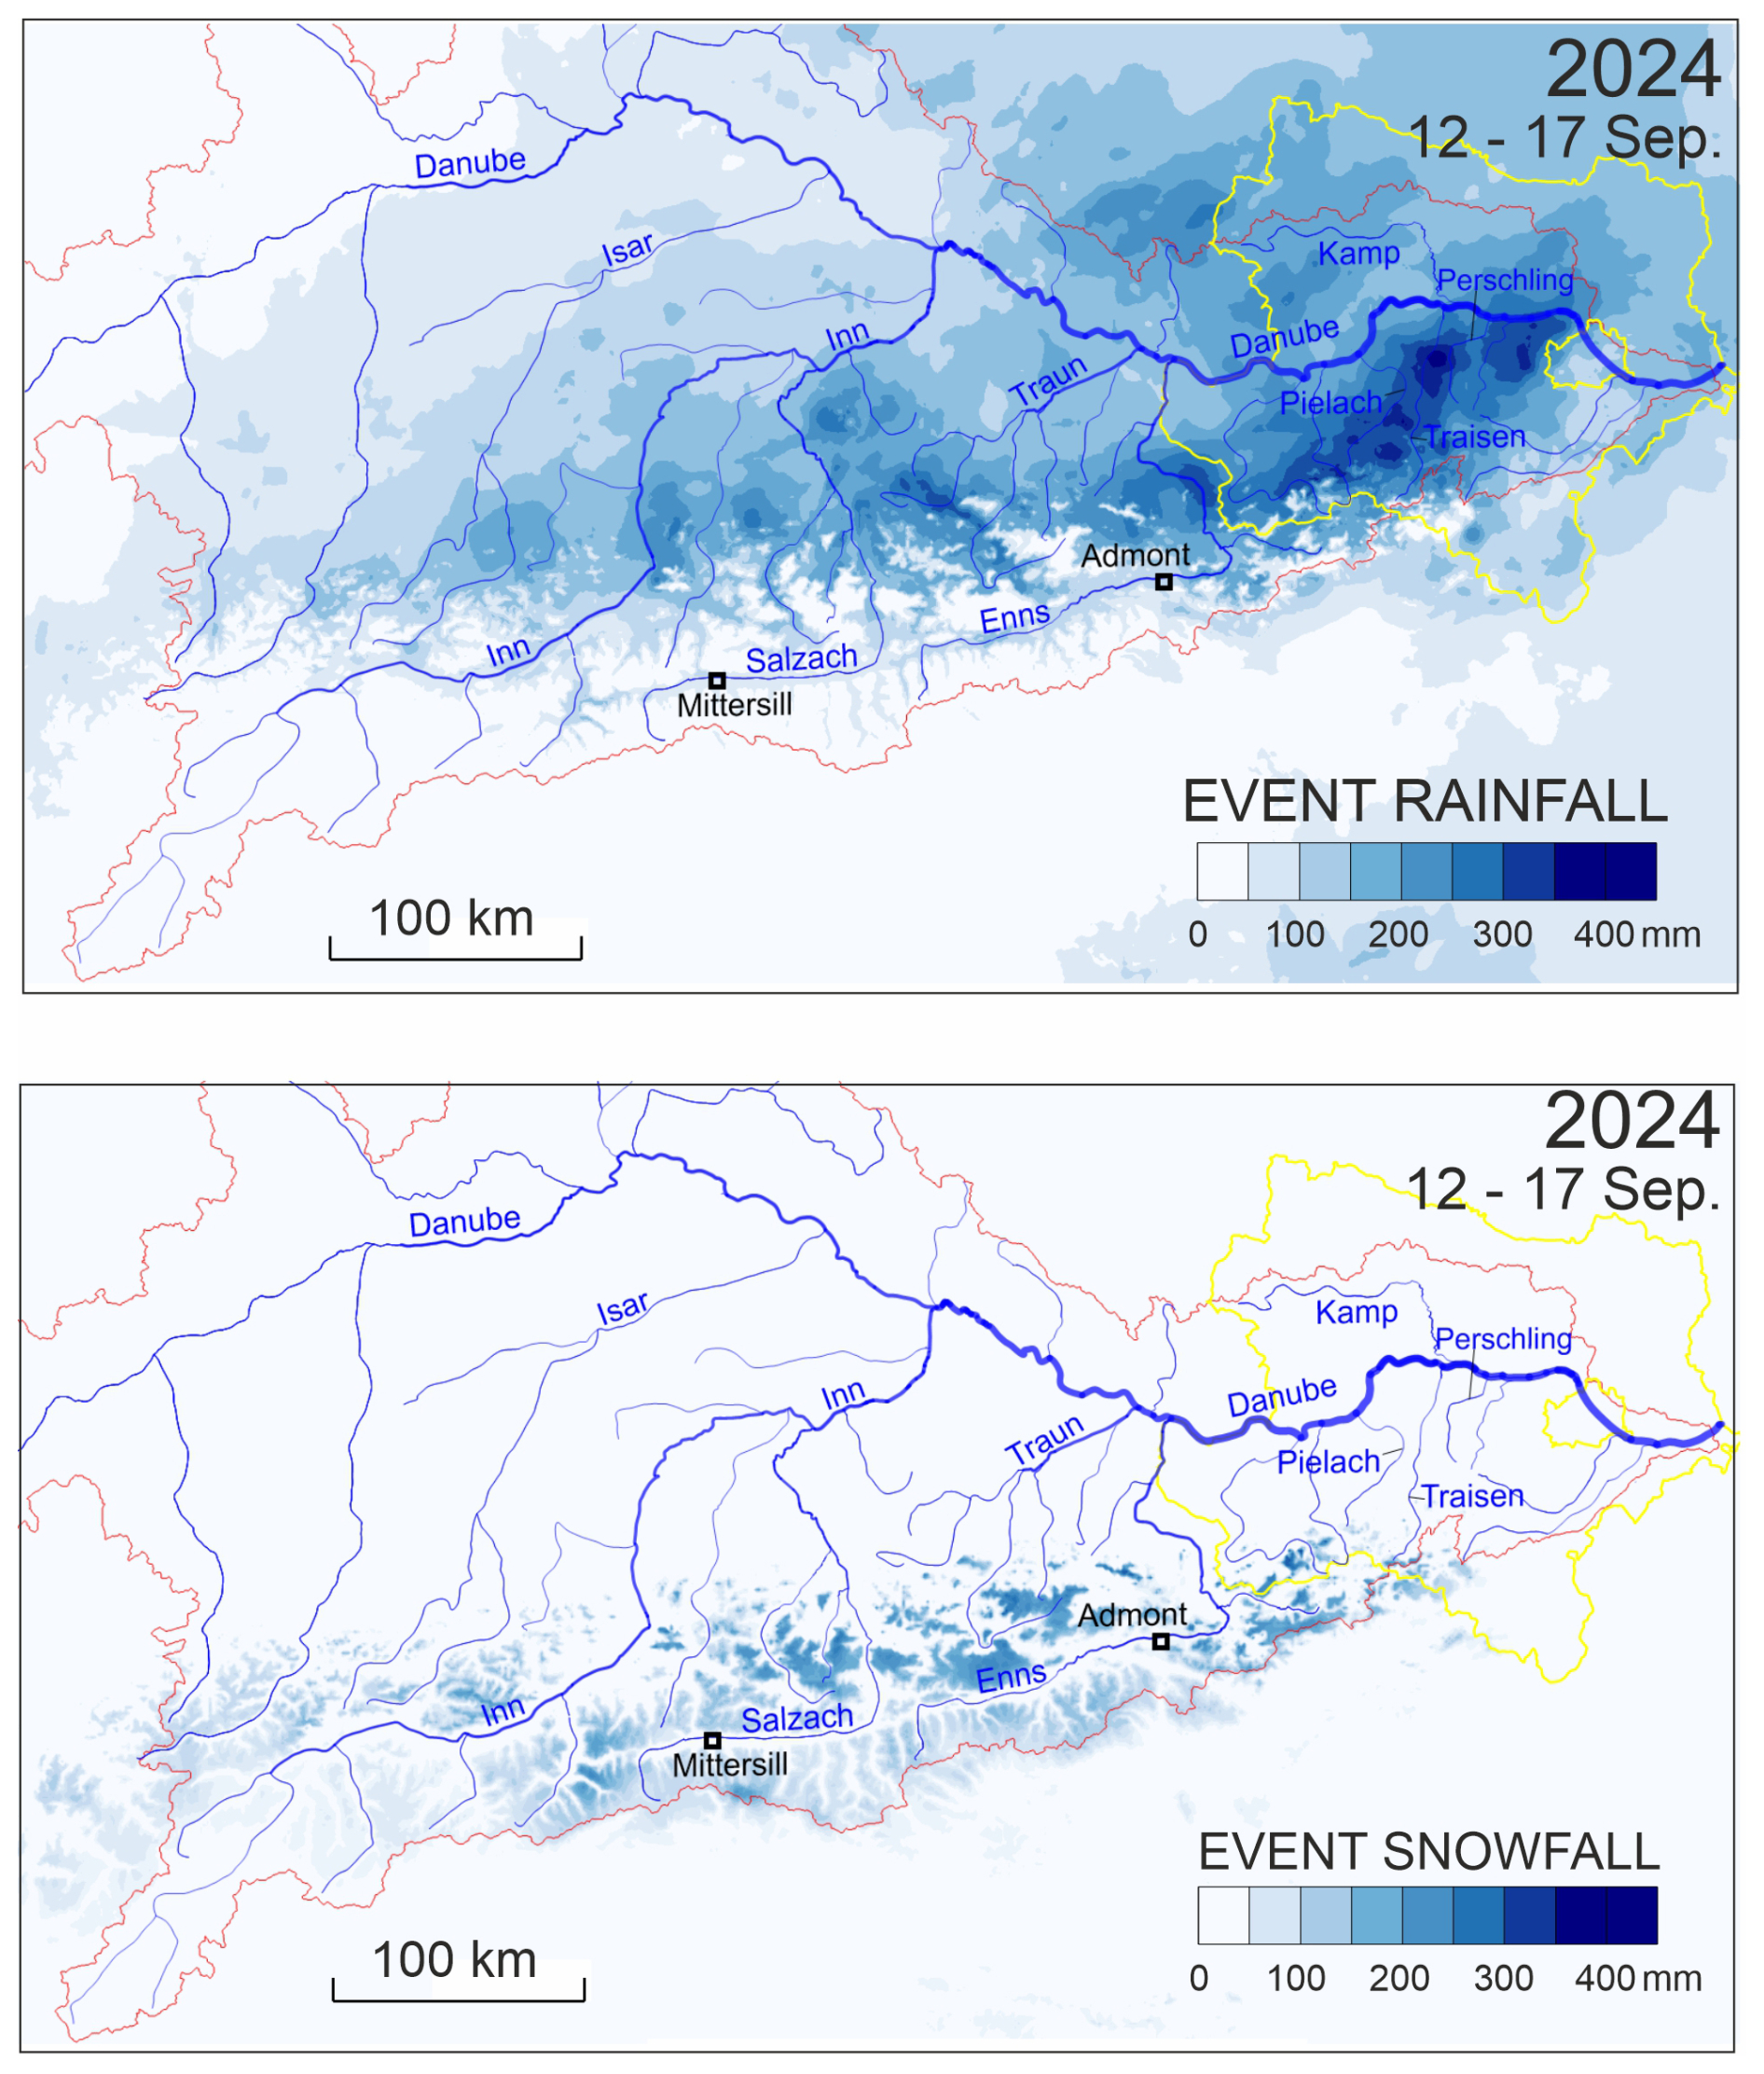
Figure 7Precipitation phase in the Danube Basin during the September 2024 event. Top: Total rainfall (liquid precipitation) from 12 September 00:00 UTC to 17 September 00:00 UTC, in mm. Bottom: Total snowfall (solid precipitation) over the same period, in mm water equivalent. Data are based on INCA analysis (Haiden et al., 2011). The red outline shows the Upper Danube catchment boundary; the yellow outline marks the border of Lower Austria and Vienna. Black rectangles indicate the locations of Mittersill and Admont.
4.3 Antecedent Conditions and Local Hydrology
The antecedent conditions prior to the four flood events were markedly different, with corresponding variations in flood generation. Prior to the 2013 flood, soil moisture was exceptionally high throughout the basin due to an unusually wet spring (Blöschl et al., 2013a), which primed the catchments for large runoff production. In 2002, antecedent soil-moisture conditions were typical for early August, with neither particularly dry nor wet conditions. The subsequent Vb-type cyclone produced two rainfall phases within a week, which together saturated soils across large parts of northern Austria. During the second phase, infiltration capacity was exhausted, leading to rapid runoff generation and two distinct flood peaks along the Danube and its tributaries, including the Traun, Enns, Krems, Aist, and Kamp. This sequence transformed average initial wetness into high runoff efficiency and widespread flooding across northern Austria (Gutknecht et al., 2002; Ulbrich et al., 2003; Komma et al., 2007).
The winter of 1898/99 and the summer preceding the 1899 flood were both notably dry, resulting in soils that were initially quite desiccated (HZB, 1955). Early runoff in 1899 may have been initially muted, as early rainfall infiltrated into the soil, addressing the soil moisture deficits. However, the sheer volume of rain in 1899 eventually surpassed that deficit, leading to a massive flood. Historical accounts suggest that the flood response in 1899, in terms of peak discharge relative to rainfall, was not substantially higher than in some smaller events (HZB, 1955), likely due to the mentioned initial losses to dry soils and storage.
For the 2024 event, antecedent soil-moisture levels in early September were low across central Lower Austria following a hot and dry summer, which had enhanced evaporation and dried out the upper soil layers. These dry conditions delayed the onset of surface runoff during the first phase of rainfall. By the third day of continuous heavy precipitation, however, soils had become saturated across large parts of the Traisen–Perschling region and adjacent catchments. According to analyses by the Hydrographic Service of Lower Austria (HD NÖ, 2024), runoff generation intensified rapidly once saturation was reached, and infiltration capacity, initially high, became quickly exhausted as rainfall persisted. These assessments are based on a systematic screening of available data sources, including operational INCA analyses, rainfall and runoff records, expert judgment, and flood documentation. While the information density varies between events, this approach enables a plausible and consistent comparison of antecedent conditions across time.
Once soils were saturated, the hydrological response in central Lower Austria was immediate and intense. In the hotspot region in central Lower Austria, rainfall totals reached about 300 mm and 250 mm, respectively, with several short-duration peaks on 14–15 September (Fig. 8, top and middle panels – rainfall intensities in St. Pölten and Lilienfeld). These convective bursts triggered abrupt runoff generation and sharp hydrograph rises in nearby catchments. In the Perschling River at Böheimkirchen (), discharge increased rapidly on 14 September and peaked overnight at around 235 m3 s−1, the highest level on record and far exceeding previous floods (Figure 8, bottom panel). In the larger Traisen catchment at Lilienfeld (∼345 km2), the hydrograph showed a broader shape with a more moderate peak. The more extreme responses occurred in the smaller catchments, where rainfall intensities were locally higher and caused flashier dynamics. Similar responses occurred in neighbouring tributaries such as the Pielach and Tulln, where simultaneous peaks reflected the combined effects of prolonged rainfall and embedded convective storms. These tributary floods coincided with the Danube flood wave in the Wachau section (between Melk and Krems), leading to near-synchronous inflows that strongly shaped the Danube hydrograph as discussed in the next section.
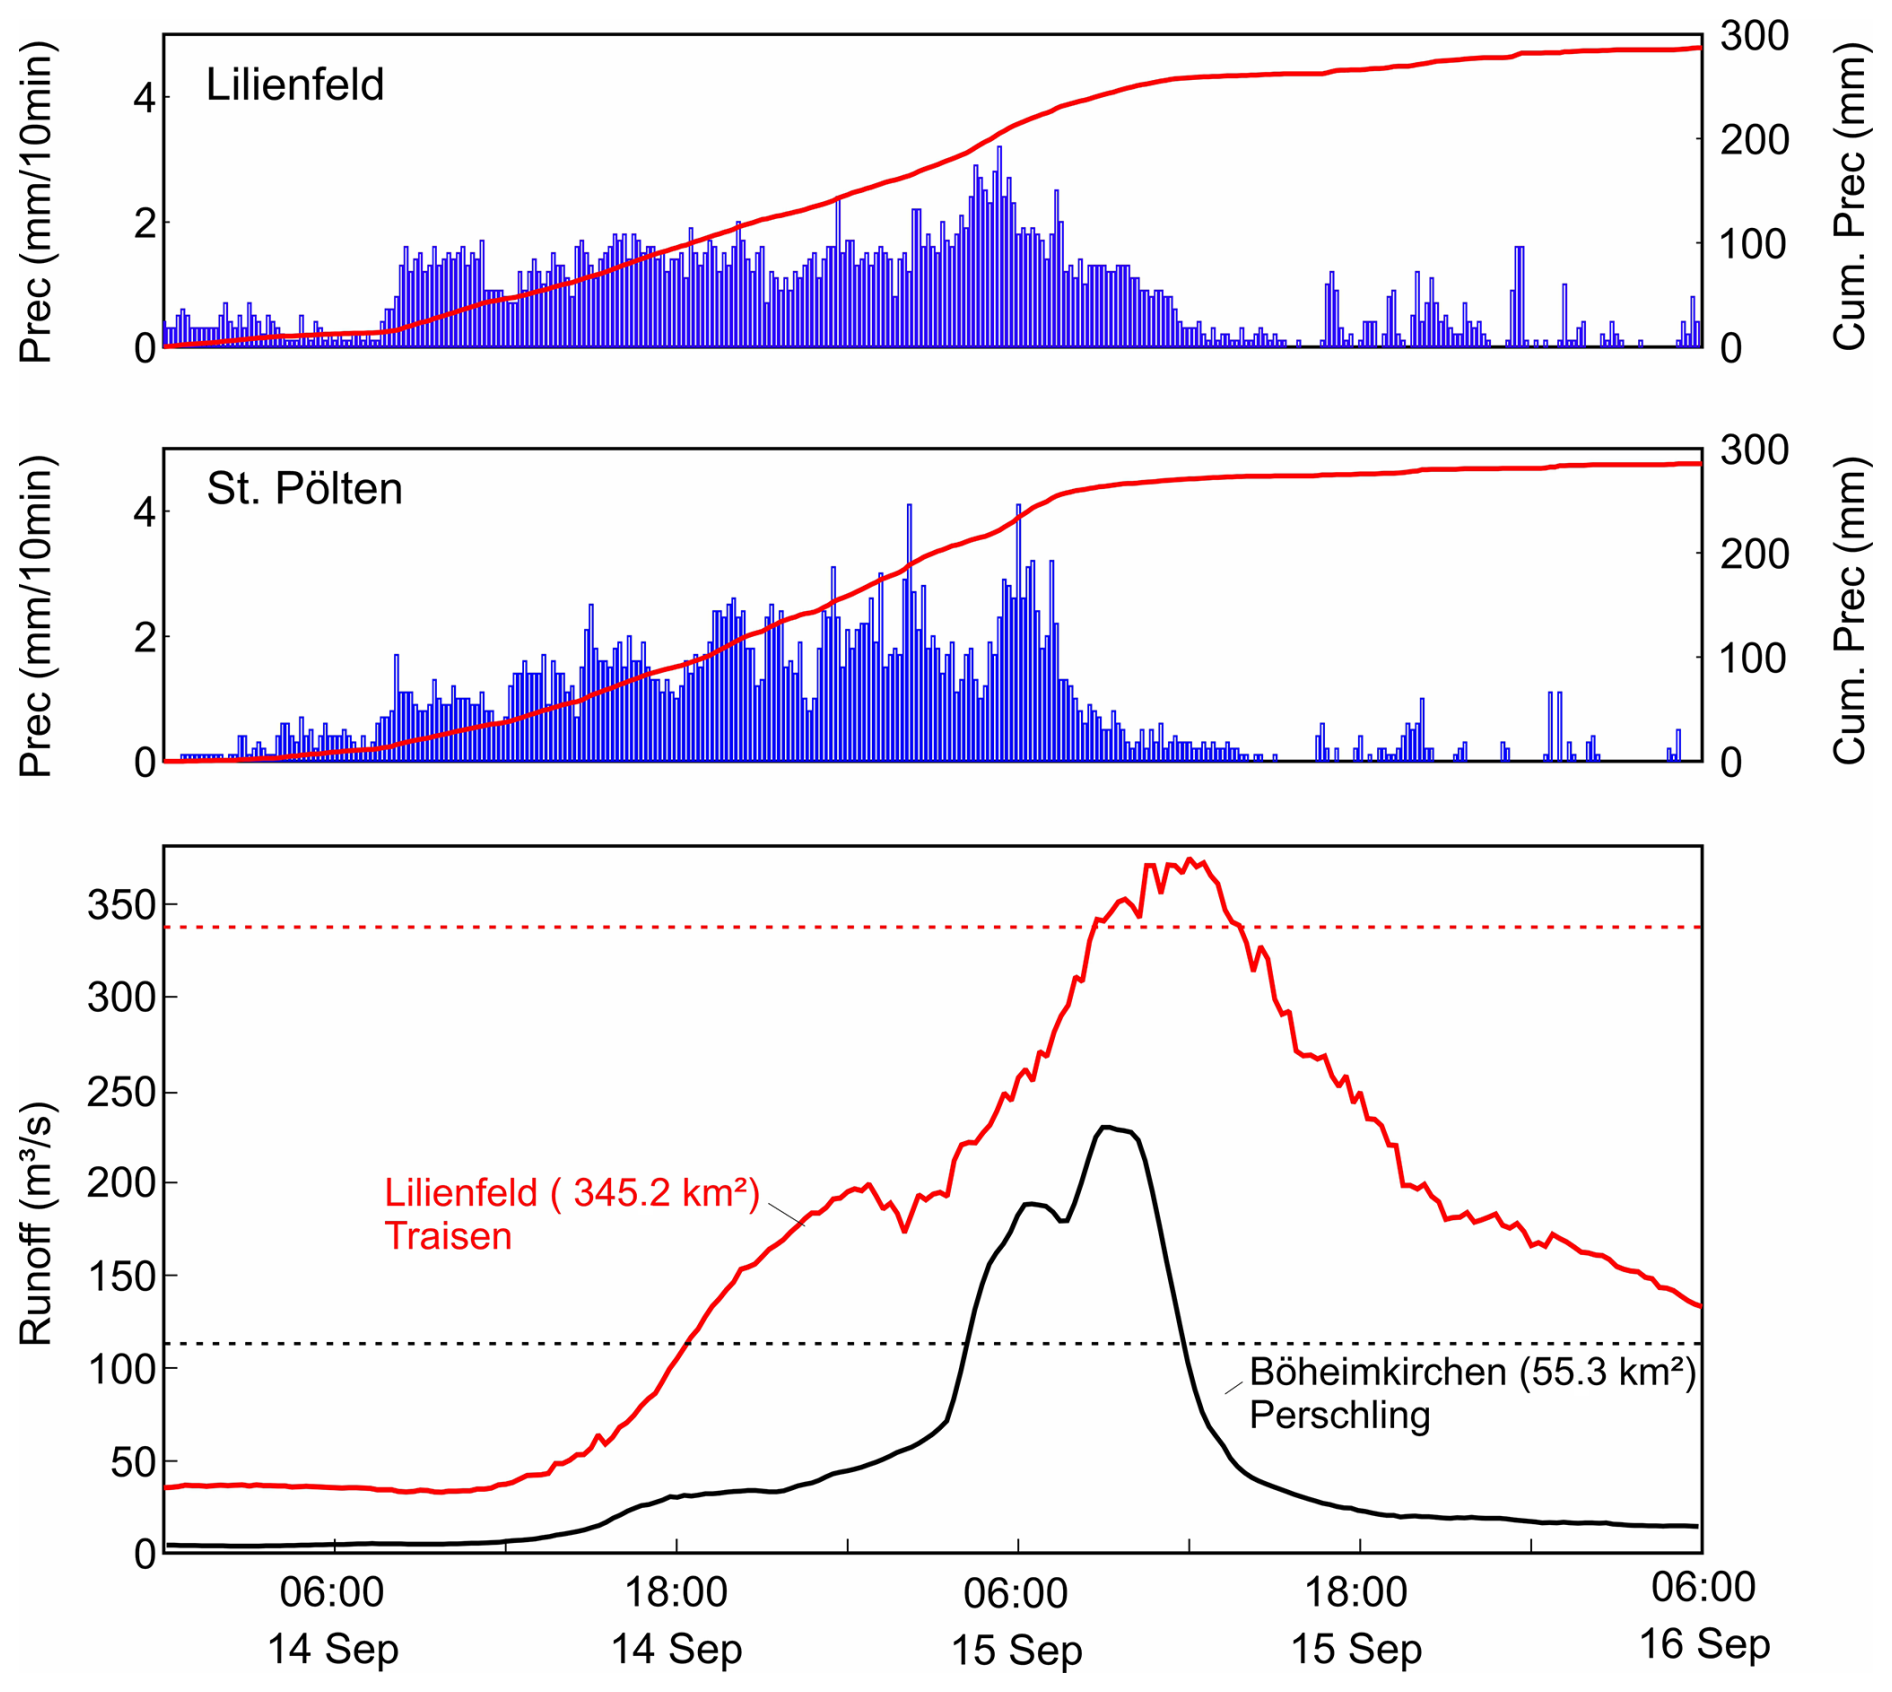
Figure 8Local precipitation and runoff during the peak of the September 2024 event. Top: 10 min precipitation at St. Pölten (Landhaus station) from 14–16 September 2024 (blue bars; red line shows cumulative precipitation). Middle: 10 min precipitation at Lilienfeld (Alpine foothills of Lower Austria) for the same period. Bottom: Discharge hydrographs of the Perschling River at Böheimkirchen (55.3 km2 catchment) and the Traisen River at Lilienfeld (345.2 km2 catchment). Dashed lines indicate HQ100 flood magnitudes for each catchment (red for Lilienfeld, black for Böheimkirchen).
The propagation of the flood wave along the Danube and its tributaries differed substantially among the four major events, depending on the timing, volume, and spatial distribution of runoff inputs. Figure 9 presents a schematic overview of the Danube river network during the September 2024 flood and illustrates the relative contributions from various tributaries. A defining feature of the 2024 event was the dominant role of tributaries in central and eastern Lower Austria – in particular the Ybbs, Pielach, Traisen, Perschling, and Gölsen Rivers – which experienced high rainfall totals and produced sharp, near-synchronous hydrograph responses between 14 and 16 September. Unlike the 2002 and 2013 floods, where the Inn, Salzach, Traun, and Enns delivered large flood waves from the western Austrian Alps, the 2024 event was characterised by only moderate upstream contributions from Germany and western Austria. This pattern was evident at the Achleiten gauge on the German–Austrian border, where the Danube reached only a 1- to 2-year flood level.
Downstream, however, the flood wave intensified rapidly through the additive effect of runoff from both mid-reach and eastern tributaries. These include the Enns and Ybbs, which attained maximum discharges of about 830 and 630 m3 s−1 respectively, followed by the Pielach, Traisen (), and Perschling (∼650 m3 s−1). Many of these tributaries exceeded HQ100 or even HQ300 thresholds, as further detailed in Fig. 13. Together, they built up the Danube peak in the Wachau region and farther downstream. Although the September 2024 flood caused severe regional impacts, its overall magnitude along the Danube remained below those of 1899, 2002, and 2013. Peak discharges at key gauges such as Kienstock, Korneuburg, and Wildungsmauer were lower, and the total flood volume was smaller owing to limited inflows from the western Alpine tributaries and partial retention of precipitation as snow in the Traun and Enns basins. Nevertheless, the event highlights the unusually high relative importance of downstream tributaries – particularly the Ybbs–Pielach–Traisen–Perschling–Tulln system – in shaping the Danube hydrograph, underscoring how localized extreme precipitation and regional synchrony can dominate flood generation even in the absence of widespread basin-scale rainfall.
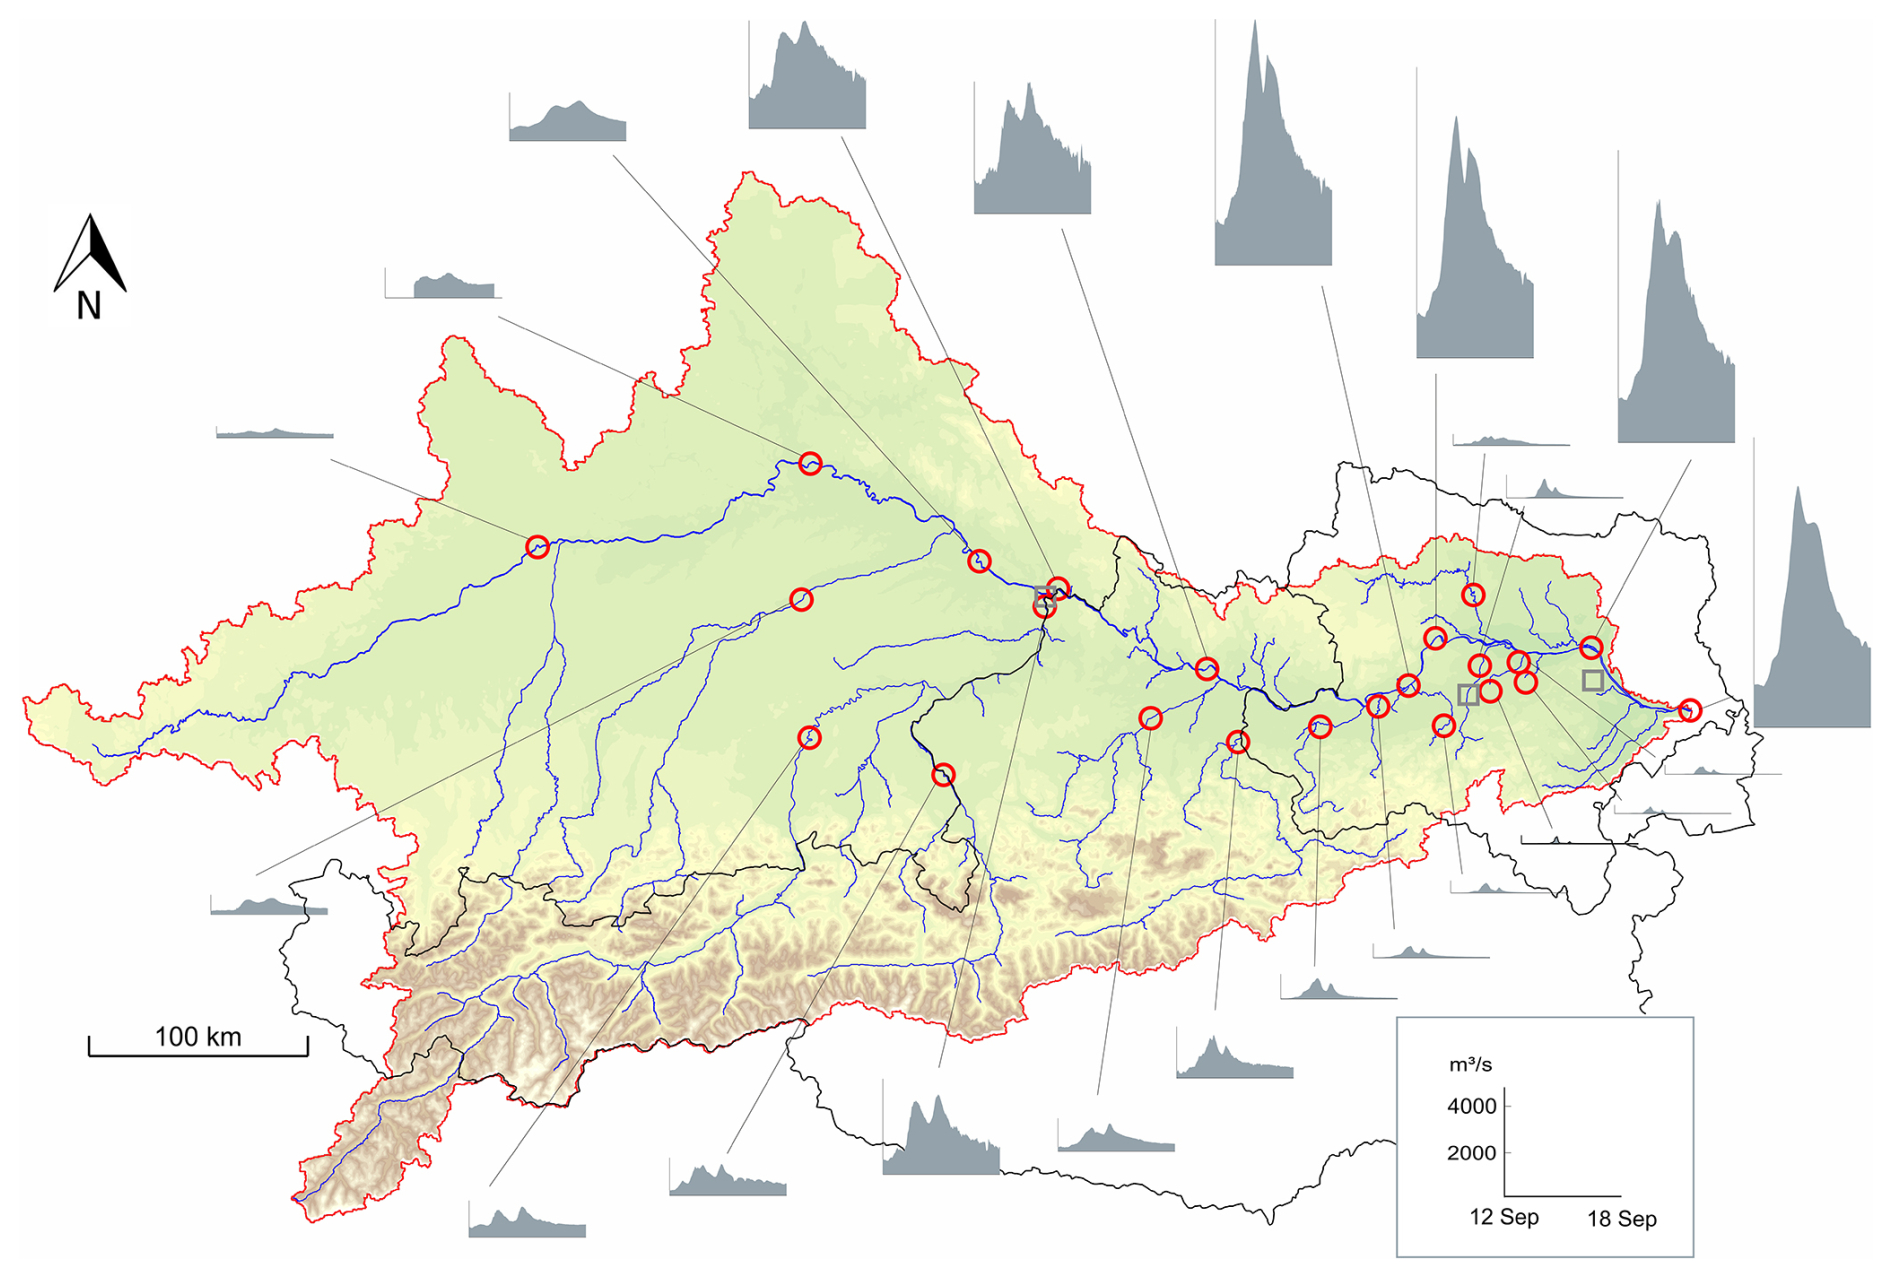
Figure 9Overview of the Upper Danube catchment and tributary hydrographs during the September 2024 flood. The map shows the river network and key gauging stations (red circles), with stylized discharge hydrographs for the period 12–18 September 2024. Black lines indicate national borders (Austria) and state boundaries (Lower Austria).
Table 1 provides a concise overview of the four benchmark floods, summarising the main atmospheric settings, precipitation characteristics, and hydrological responses that shaped their magnitude and spatial extent.
Table 1Main hydrometeorological and hydrological characteristics of the four benchmark floods (1899, 2002, 2013, and 2024) in the Austrian Danube Basin.
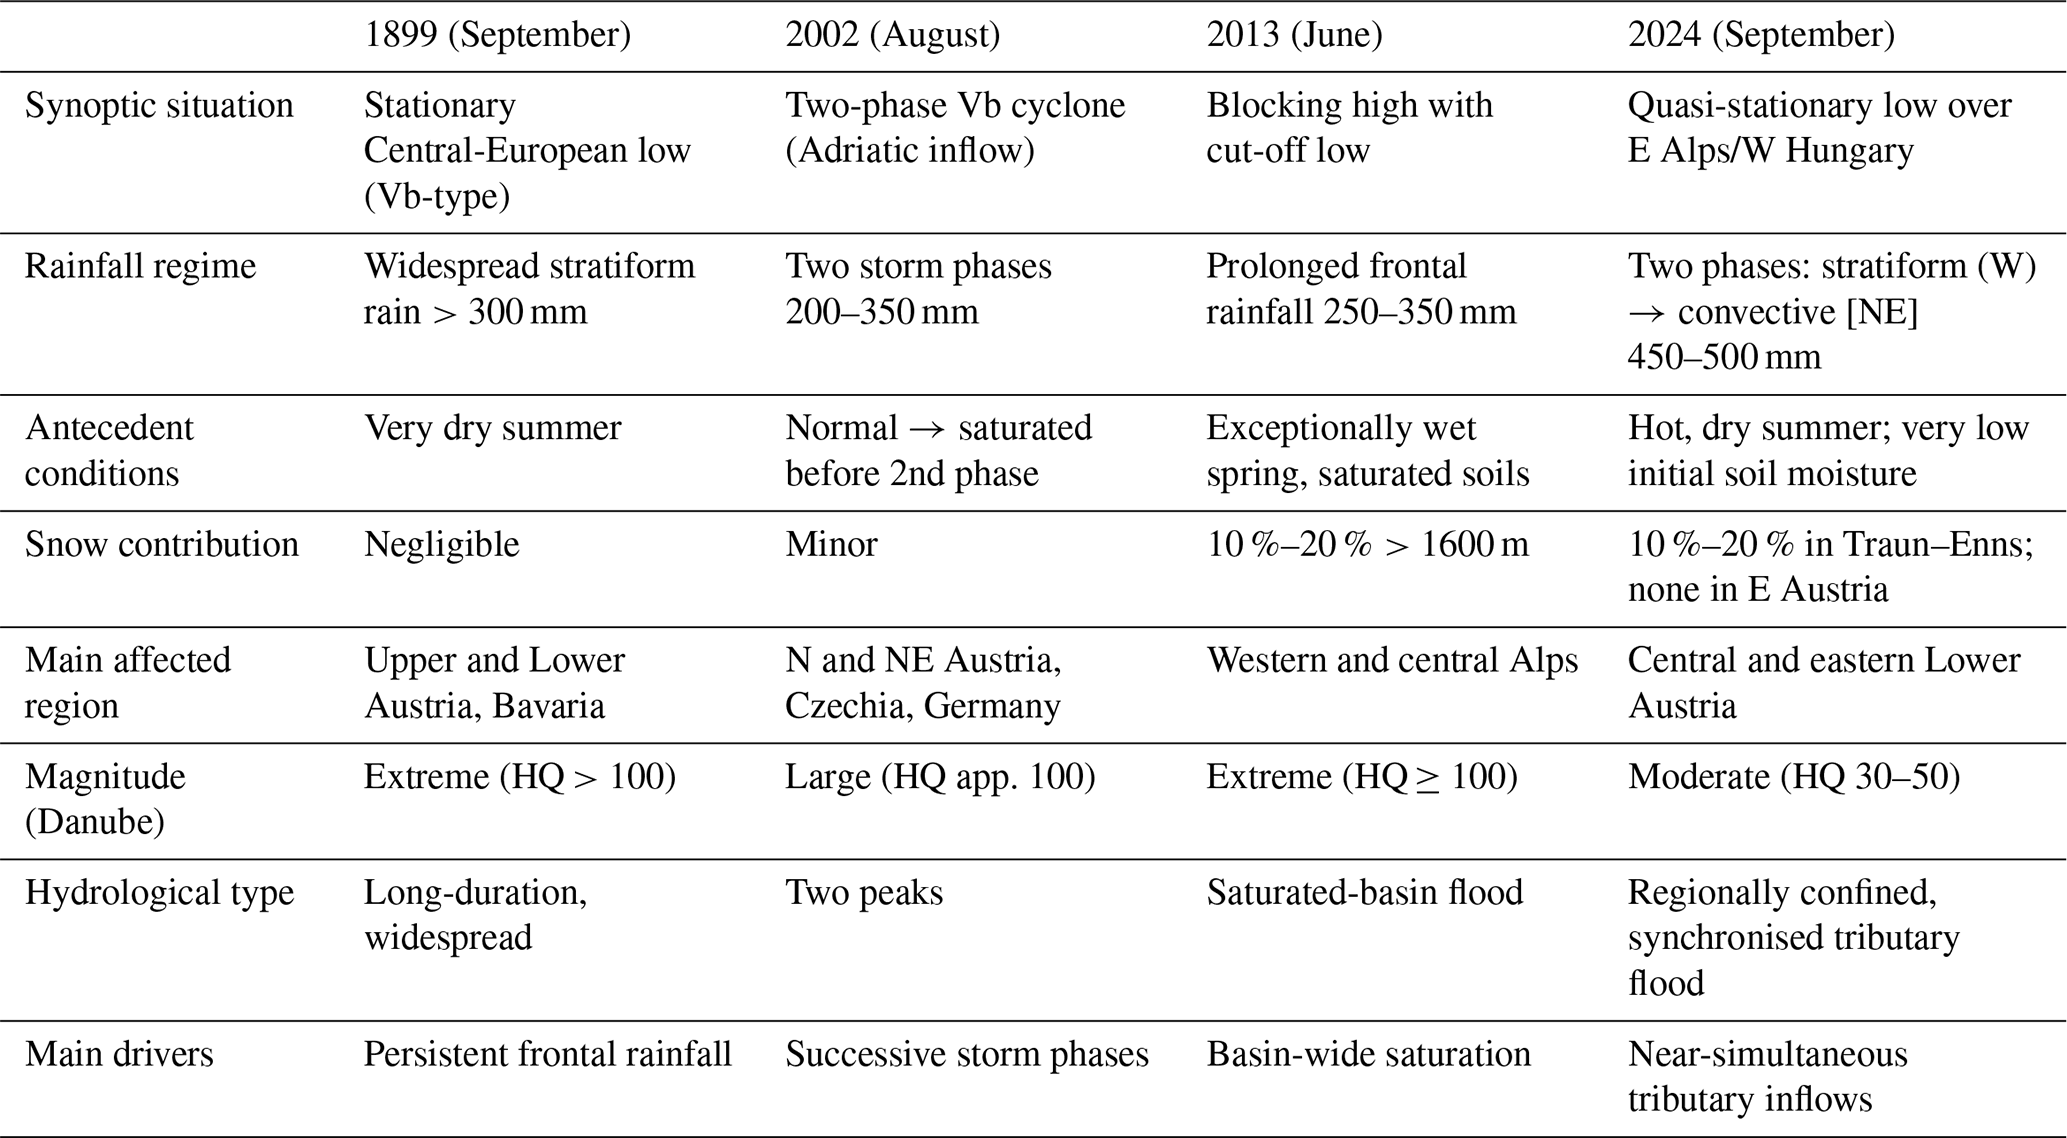
Figure 10 compares the hydrograph evolution of the 2013 and 2024 Danube floods at the gauges Achleiten, Kienstock, and Korneuburg, illustrating contrasting patterns of flood-wave translation and amplification. The 2013 event was dominated by strong upstream forcing from the Inn, Traun, and Enns, producing a broad flood wave with gradual recession and limited attenuation along the Austrian Danube. At Achleiten, near Passau, the maximum discharge of approximately 9800 m3 s−1 was followed by a nearly synchronous flood peak at Kienstock (≈11 400 m3 s−1) within about one day, reflecting the combined propagation of flood waves from the Inn and Bavarian Danube. In contrast, the 2024 flood displayed a more complex hydrograph shape at Achleiten, with a comparatively lower peak discharge (∼4370 m3 s−1) and a double-peaked structure. This form likely reflects sequential contributions from the Inn and upper Danube, with an initial pulse from local tributaries followed by delayed inputs from upstream catchments. Despite the lower upstream forcing, the flood showed pronounced amplification downstream. This amplification resulted from lateral inflow superposition, as hydrographs from several Lower Austrian tributaries were temporally aligned with the main-stream wave. At Kienstock, the 2024 flood reached about 9530 m3 s−1, demonstrating that the near-simultaneous responses of the Ybbs, Melk, Pielach, Traisen and Perschling Rivers compensated for the relatively small western Alpine contributions. By the time the wave reached Korneuburg (74 km downstream of Kienstock), the 2024 hydrograph followed a similar shape to that of 2013 but remained approximately 1000 m3 s−1 lower and featured a distinctive double peak. Overall, the figure demonstrates that the 2013 flood represents a translation-dominated, Alpine-driven wave, whereas the 2024 event typifies a locally amplified flood in which temporal synchronisation of lateral inflows governed hydrograph growth and downstream propagation along the Austrian Danube compares the hydrograph evolution of the 2013 and 2024 Danube floods at the gauges Achleiten, Kienstock, and Korneuburg, illustrating contrasting patterns of flood-wave translation and amplification. The 2013 event was dominated by strong upstream forcing from the Inn, Traun, and Enns, producing a broad flood wave with gradual recession and limited attenuation along the Austrian Danube.
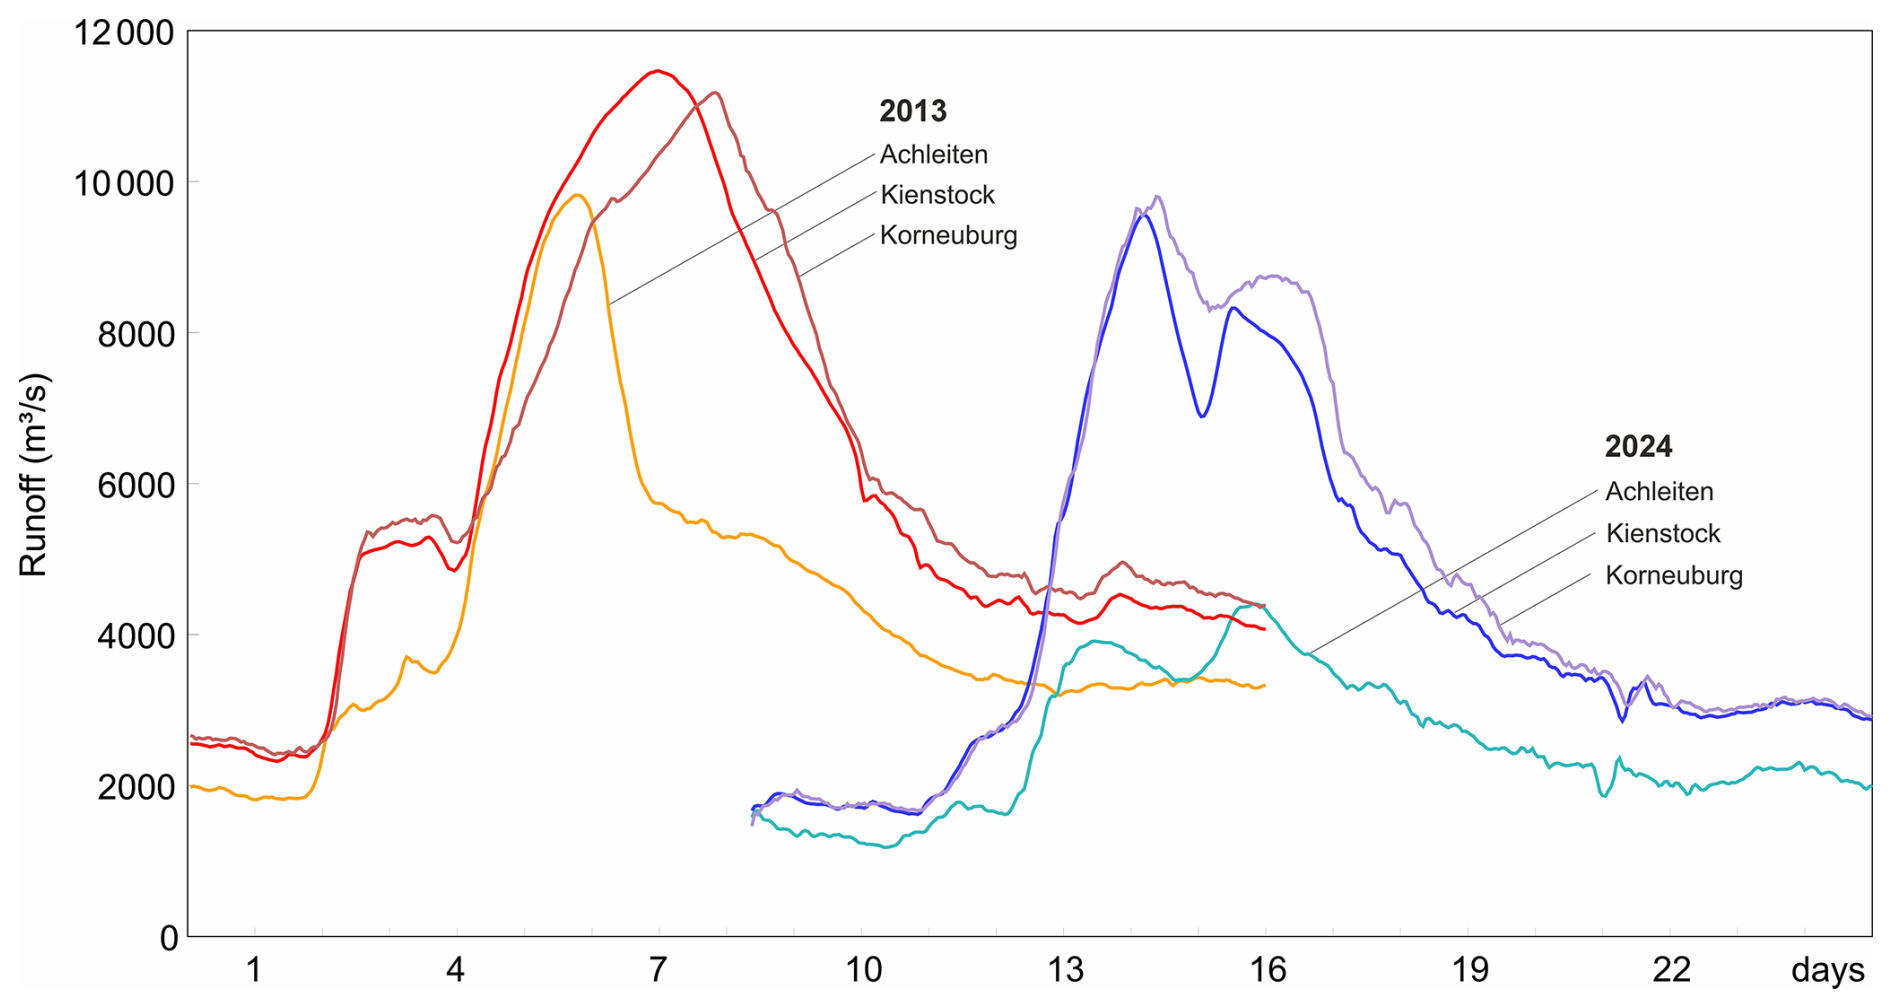
Figure 10Comparison of Danube hydrographs during the 2013 and 2024 floods at the gauging stations Achleiten, Kienstock, and Korneuburg. The river distance from Achleiten to Kienstock is approximately 208 km, and from Kienstock to Korneuburg 74 km. See also Fig. 11 for river station locations along the profile.
At Korneuburg, the 2024 hydrograph closely approached that of 2013, indicating a shift from upstream-controlled to tributary-controlled flood dynamics. Overall, the figure demonstrates that the 2013 flood represents a translation-dominated, Alpine-driven wave, whereas the 2024 event typifies a locally amplified flood in which temporal synchronisation of lateral inflows governed hydrograph growth and downstream propagation along the Austrian Danube.
The longitudinal distribution of maximum discharge (Fig. 11) highlights the spatial reorganisation of runoff contributions along the Austrian Danube during the September 2024 flood. In the upper reach between Donauwörth and Linz, the flood response was comparatively weak due to limited inflow from the western Alpine tributaries. In the Traun and Enns catchments, approximately 25 %–30 % of total precipitation occurred as snow, reducing effective rainfall and delaying runoff generation. Consequently, the Inn–Traun–Enns area produced only moderate discharges, and the upper Danube hydrograph remained well below the magnitudes observed during the 2002 and 2013 floods.
Between Linz and Melk, the Danube hydrograph steepened considerably due to lateral inflow from the Salzkammergut and Mostviertel tributaries. The Ybbs (∼830 m3 s−1), Melk (∼190 m3 s−1), and Pielach () peaked in close succession on 15 September, together contributing substantial volume. Farther downstream, the Traisen (∼790 m3 s−1), Perschling (∼650 m3 s−1), and Große Tulln (∼280 m3 s−1) added to the flood wave in a similarly synchronized manner. This pronounced temporal synchronisation of tributary hydrographs resulted in a clear downstream amplification of the main-stem flood wave. Additional but smaller inflows from the Kamp (∼360 m3 s−1), Krems (∼160 m3 s−1), and the Viennese tributaries Wienfluss (∼330 m3 s−1) and Mauerbach (∼100 m3 s−1) contributed locally but had only minor influence on the overall hydrograph shape.
Cumulatively, the Lower Austrian tributaries supplied more than 1000 m3 s−1 of additional discharge between Melk and Korneuburg, enhancing the Danube flood wave from 9530 m3 s−1 at Kienstock to 10 040 m3 s−1 at Wildungsmauer. While the sum of individual tributary peaks exceeds this net increase, this is due to the time-lagged nature of inflows and hydrological losses such as attenuation and storage effects. Locally, these processes were likely reinforced by levee failures and uncontrolled floodplain inundation, particularly along the Perschling and Traisen.
This longitudinal increase illustrates how flood amplification in 2024 was driven by coordinated tributary inflows, shifting the system dynamics from upstream wave translation toward a response dominated by mid-basin contributions. Although the 2024 maximum discharges remained 10 %–15 % below those of 2002 and 2013, the event was exceptional in its spatio-temporal coherence, illustrating a shift from western Alpine control (Inn–Traun–Enns, partially snow-dominated) toward eastern-basin synchrony among the Lower Austrian tributaries as the prevailing mechanism of flood generation along the Austrian Danube. While the conclusions are based on the analysis of four major events, this sample provides valuable insight into evolving flood dynamics. The observed shift highlights a potentially emerging pattern that merits further investigation as more data become available in future studies.
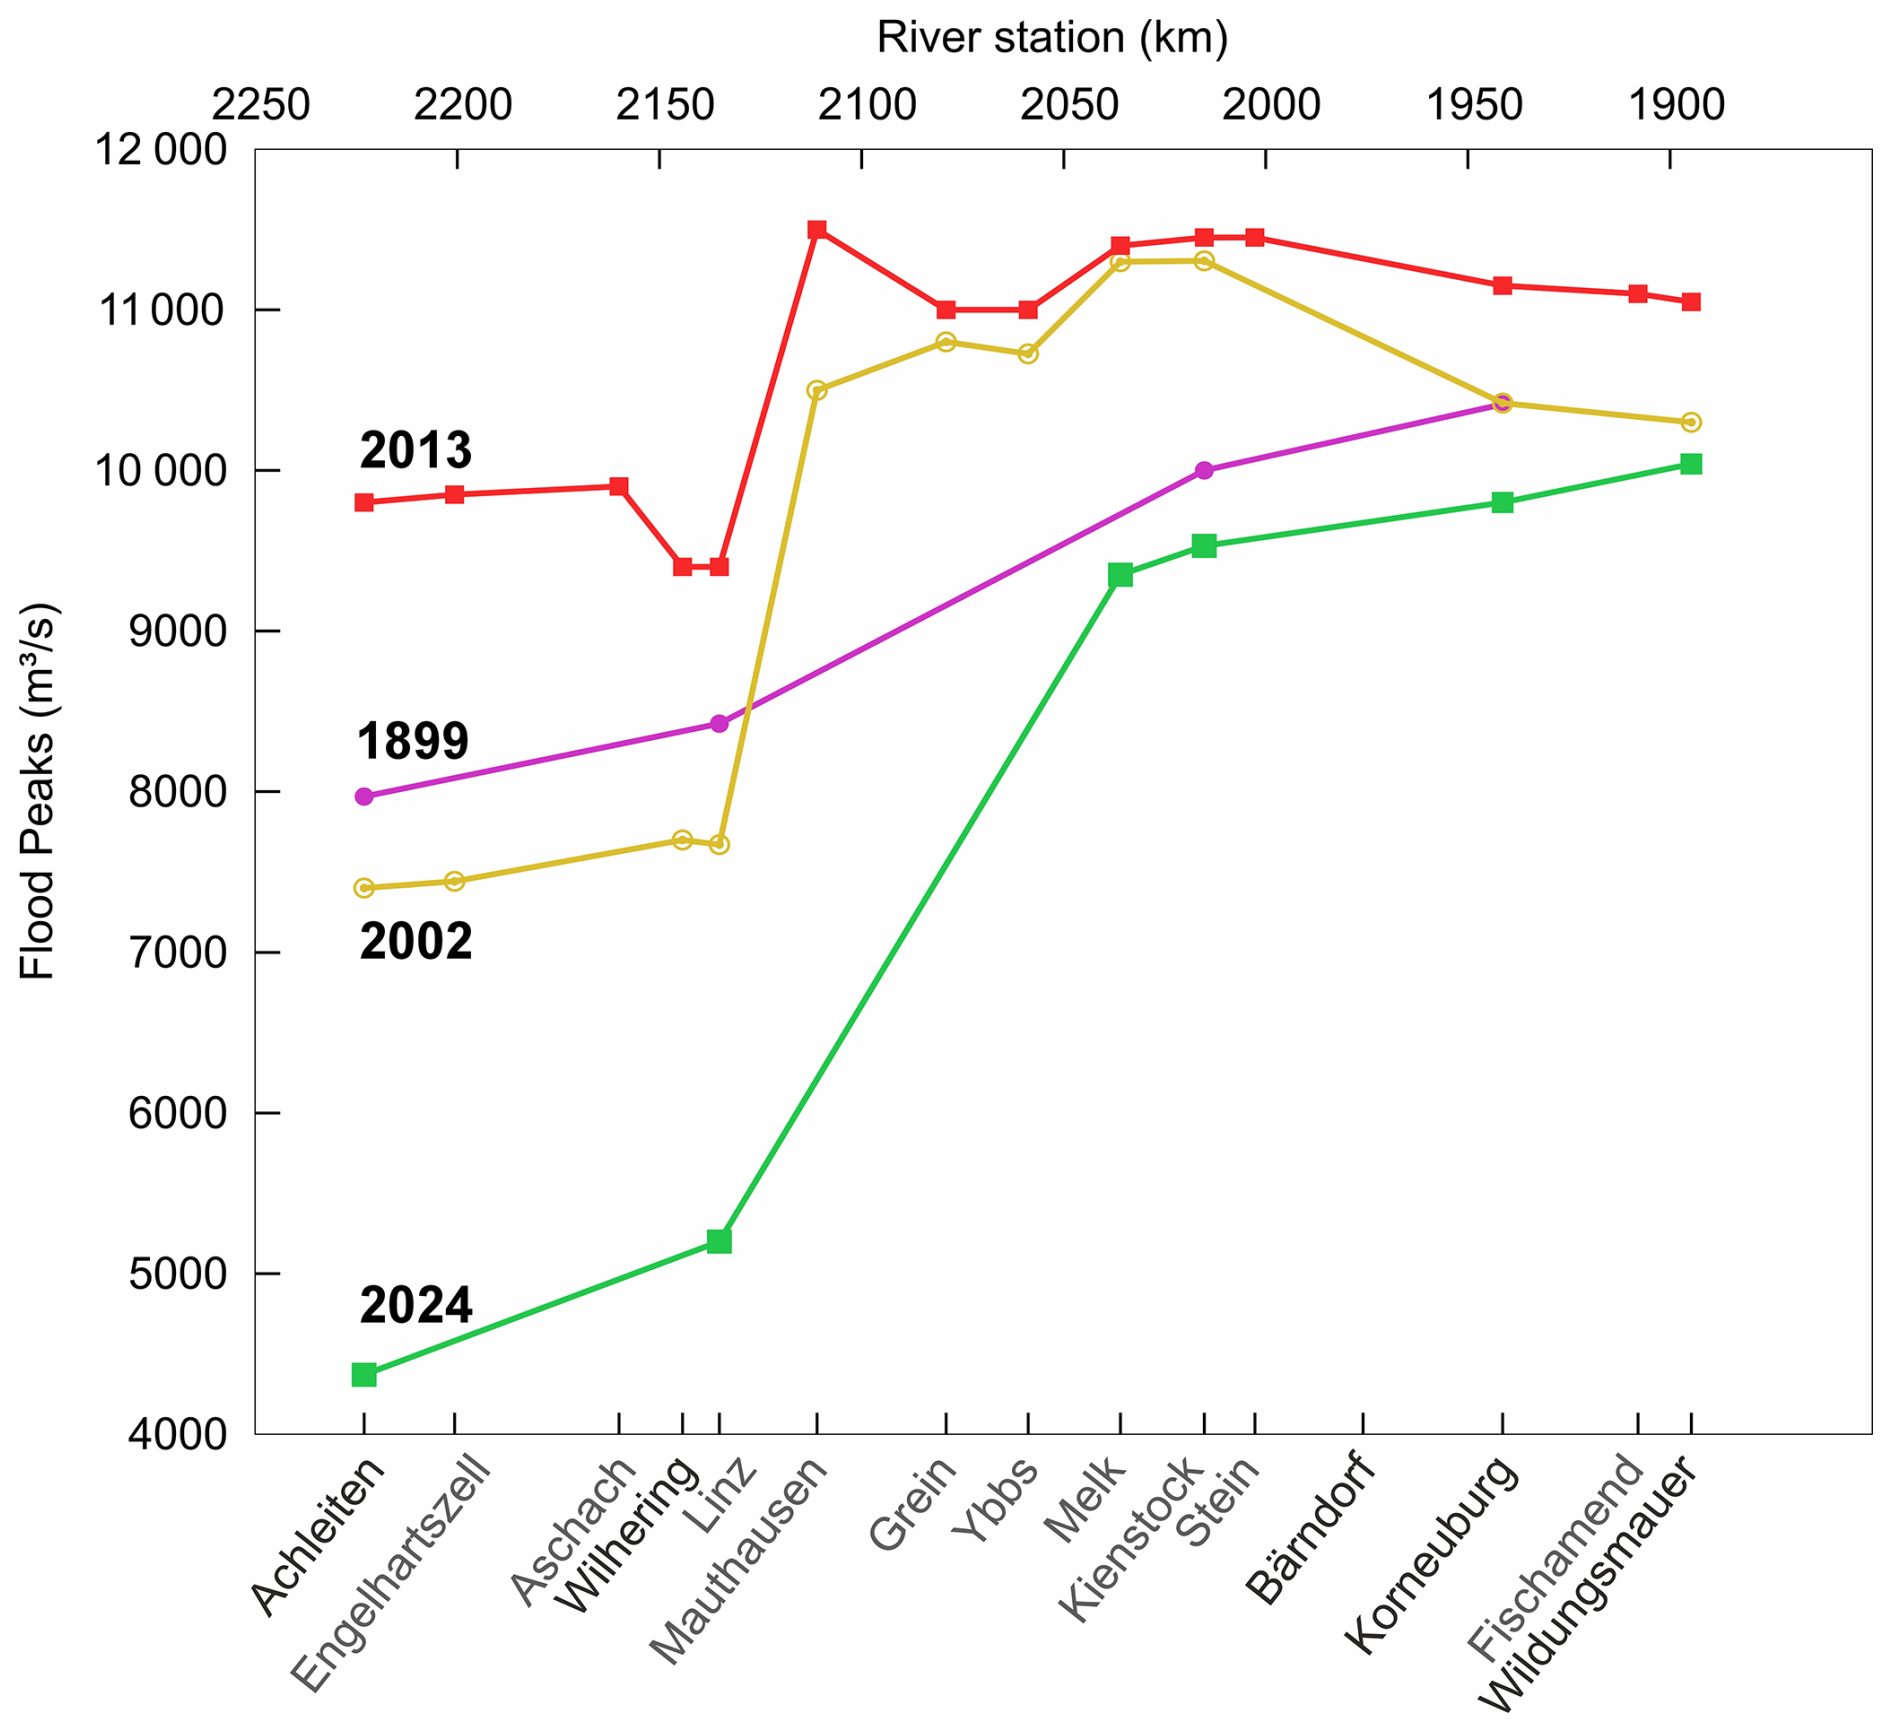
Figure 11Longitudinal profile of peak discharges along the Danube River from Passau to Wildungsmauer. The plot shows peak discharges (m3 s−1) at major stream gauges for four flood events: September 1899 (light green), August 2002 (blue), June 2013 (dark red), and September 2024 (dark green). The horizontal axis indicates stream gauges from upstream (left) to downstream (right), with river kilometres (km) along the main channel shown at the top. The vertical axis displays discharge values in m3 s−1. Stations shown here include both gauges with full hydrograph data (see Fig. 9) and locations where peak values were reconstructed from hydraulic studies or historical reports.
5.1 Flood Magnitude in a Frequency Context
Exceptional flood responses were observed in several small tributary catchments during the September 2024 event (Fig. 12). In the Perschling at Böheimkirchen (55.3 km2), the maximum discharge reached about 270 m3 s−1, more than double the HQ100 reference value (108 m3 s−1) and far above all previous observations in the instrumental record. At the Kleine Tulln at Sieghartskirchen (68.5 km2), the flood peak of roughly 200 m3 s−1 also exceeded the HQ100 threshold and ranked among the largest events recorded in the region. These extreme responses reflect the combination of high rainfall intensities and short concentration times typical of the small and medium-sized basins in central Lower Austria. In contrast, the Danube main channel exhibited a considerably more moderate response. At Korneuburg (101 537 km2), the 2024 maximum discharge of approximately 9800 m3 s−1 slightly exceeded the HQ30 threshold (9340 m3 s−1) but remained well below the HQ100 reference (10 400 m3 s−1). A similar pattern occurred at Kienstock, where the 2024 peak discharge was clearly lower than those of 2002 and 2013. As shown in Fig. 12, this contrast demonstrates the pronounced scale dependence of the 2024 flood: extreme at the tributary scale, dominated by rapid and efficient runoff generation, but moderate along the Danube, where channel and floodplain storage dampened the overall hydrograph. The observed behaviour underscores the increasing relevance of localised, high-intensity precipitation and catchment-scale synchronisation for flood hazard in eastern Austria under current climatic conditions.
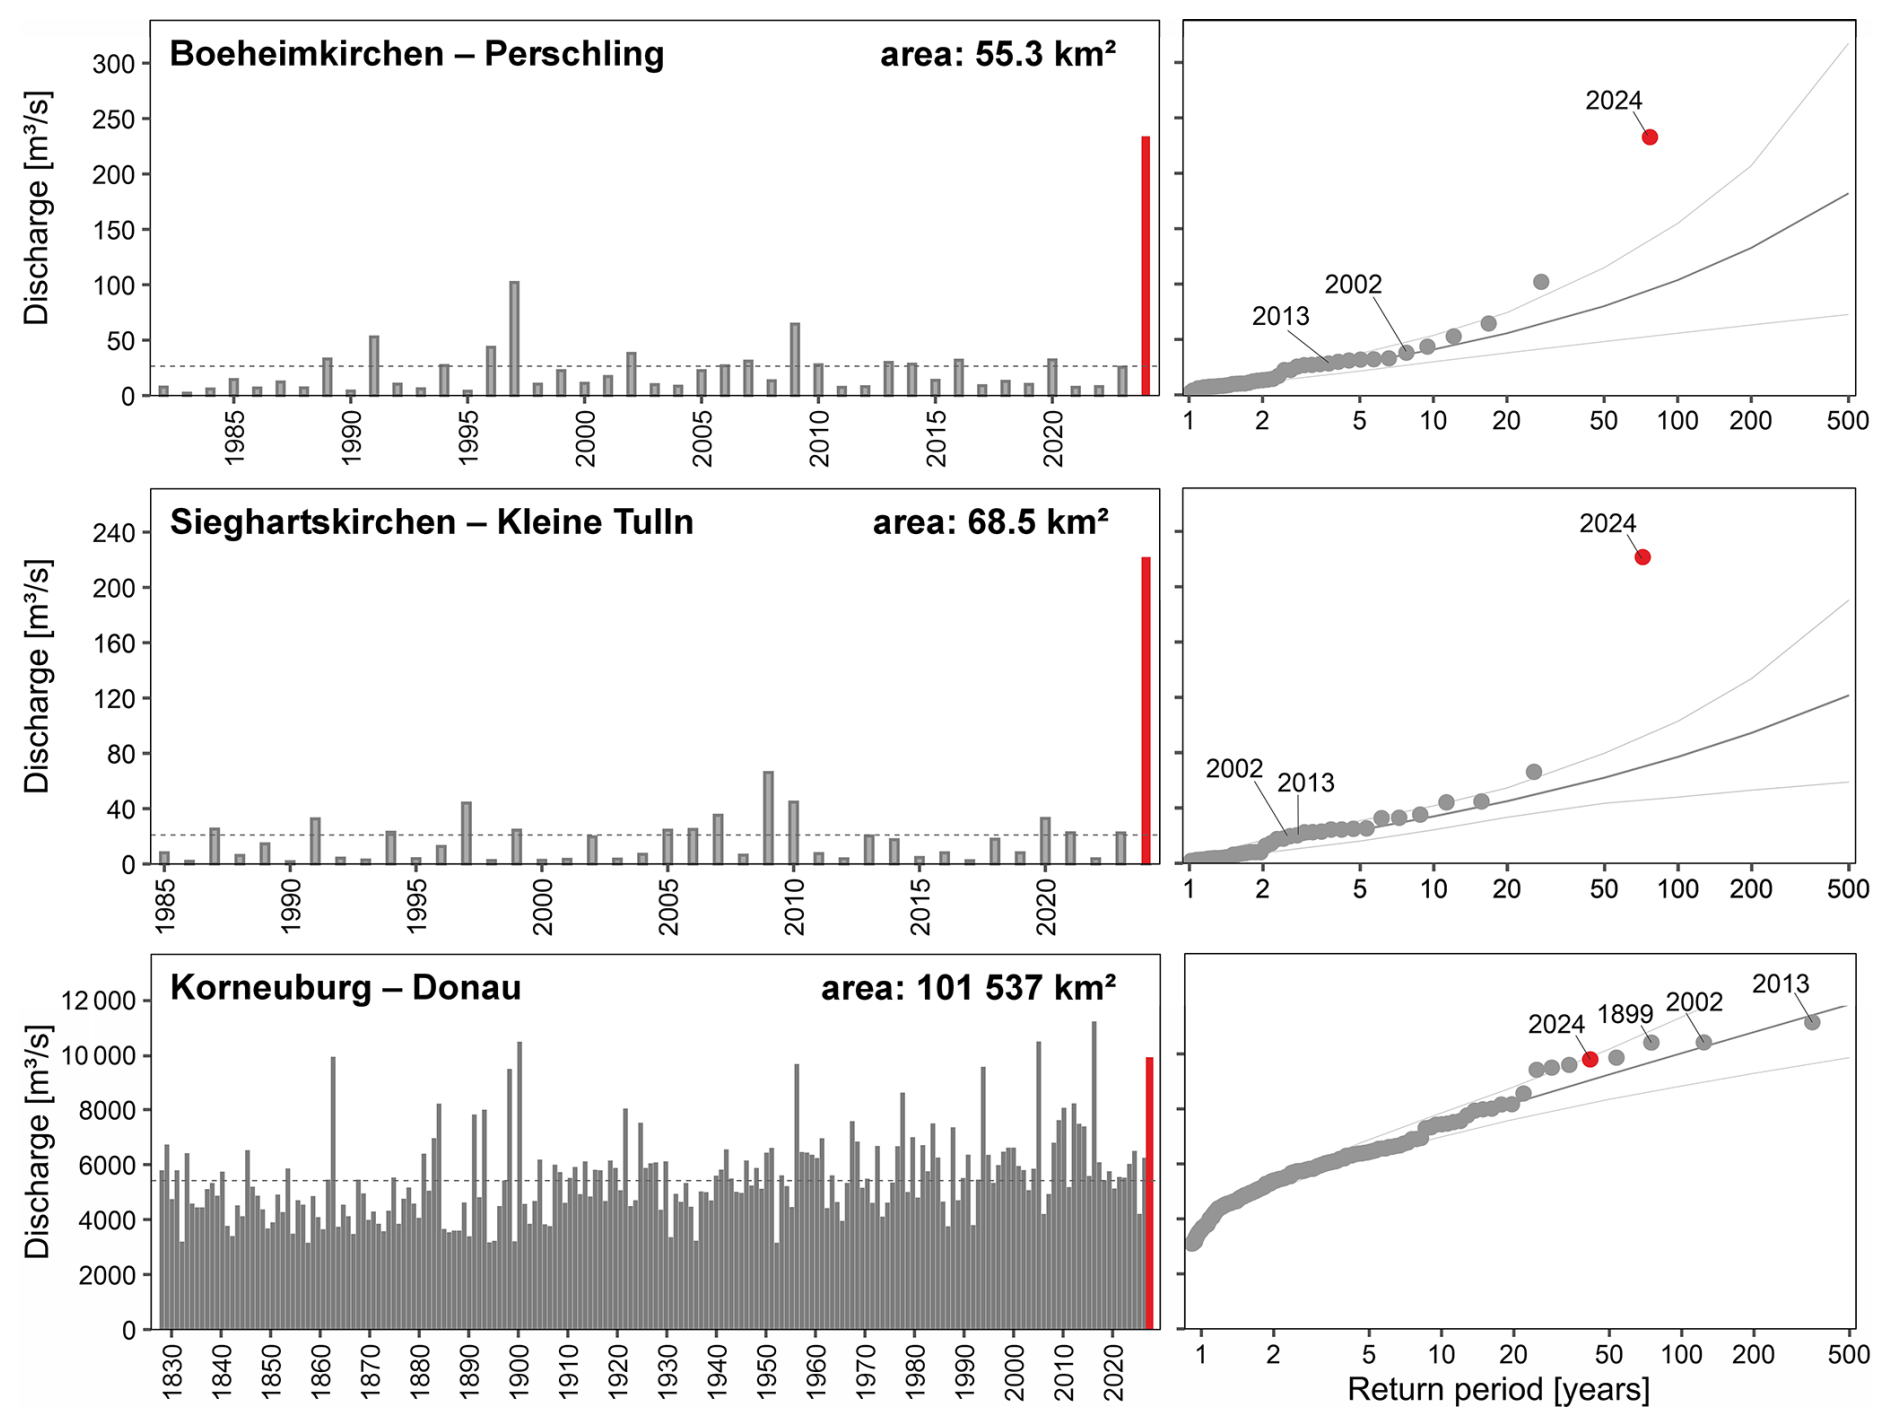
Figure 12Annual maximum discharges and flood-frequency analyses for selected stations. Top: Perschling at Böheimkirchen (55.3 km2). Middle: Kleine Tulln at Sieghartskirchen (68.5 km2). Bottom: Danube at Korneuburg (101 537 km2). Bars show annual peak discharges; dots and fitted curves indicate frequency distributions. The September 2024 flood is highlighted in red; historical reference events are shown for comparison.
Figure 13 shows the spatial variation of the September 2024 flood in terms of two hydrological indicators across Austria. The upper map displays the ratio between the observed 2024 peak discharge and the local 100-year flood (HQ100), expressed as a percentage, and the lower map shows the corresponding event runoff coefficient. The contrast across the basins is striking. In central and eastern Lower Austria, many tributaries exceeded their HQ100 values by 150 % to 270 %, indicating that the 2024 event was far outside the range of typical design floods. This cluster of extremely high ratios outlines the area that experienced the most severe flooding, especially in the Perschling, Kleine Tulln, Traisen, and Pielach catchments.
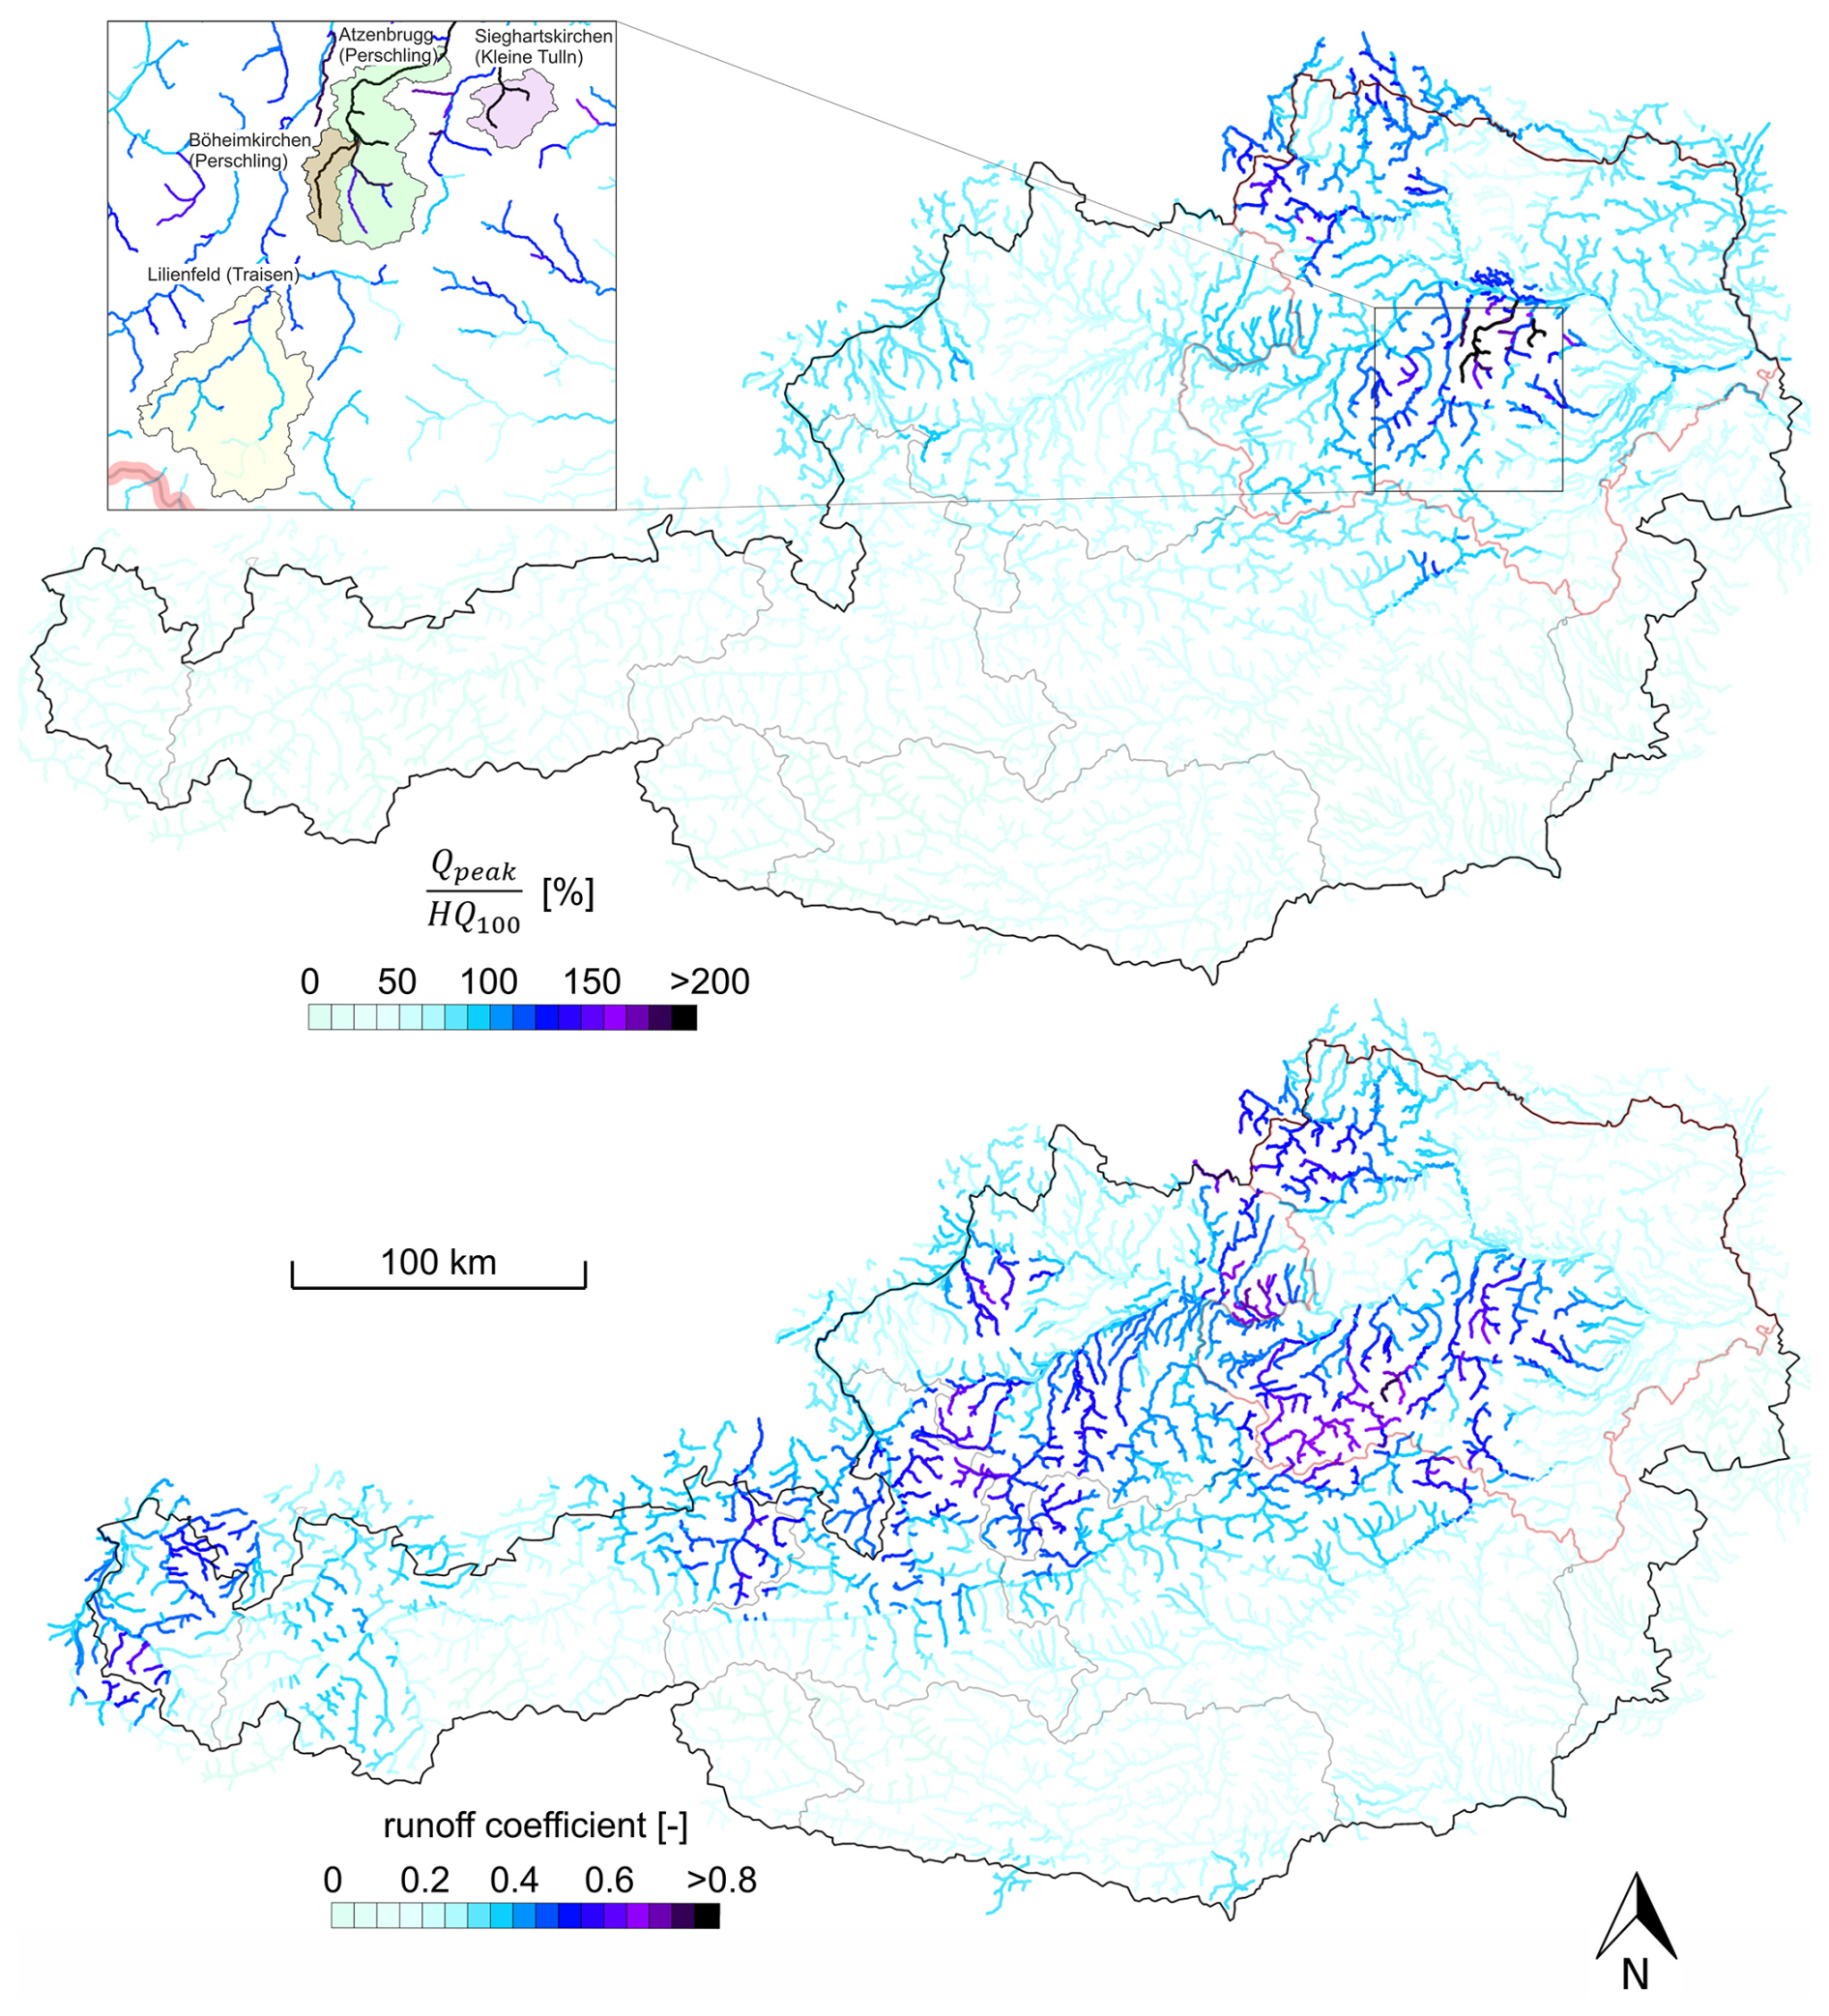
Figure 13Characteristics of the September 2024 flood event in Austria. Upper panel: Map showing the ratio of observed peak discharge (Qpeak) to the local 100 year flood discharge (HQ100), expressed as a percentage. Values greater than 100 % (darker blue colors) indicate stations where the 2024 peak discharge exceeded the HQ100 threshold. Lower panel: Map of the event runoff coefficients, defined as the ratio of runoff volume to precipitation volume in each catchment (unitless).
West of this region, the HQ100 ratios decline rapidly, and along the main Danube the 2024 peaks remained below the HQ100 threshold. The spatial distribution of runoff coefficients partially resembles the HQ exceedance pattern. The runoff coefficients were derived using INCA precipitation data and observed hydrographs, applying baseflow separation to ensure consistency across catchments. In the most affected Lower Austrian basins, event runoff coefficients reached exceptional values between about 0.6 and 0.8, showing that nearly all rainfall was converted into runoff. These values are highly unusual for central Lower Austria, where infiltration capacities are typically high and event runoff coefficients usually range between 0.1 and 0.3 (Merz and Blöschl, 2009).
By contrast, other regions with high runoff coefficients – such as the northern Alpine rim – exhibit these values more regularly due to their wetter climate, steeper slopes, and thinner soils, with typical coefficients ranging from 0.3 to 0.6. In these areas, the 2024 coefficients are consistent with past extreme events but did not translate into similarly exceptional floods due to lower rainfall intensity or more distributed rainfall over time. The maps in Fig. 13 are limited to Austrian territory, as consistent high-resolution hydro-meteorological data were only available for this region.
Overall, the 2024 event was exceptional for its combination of unusually high runoff efficiency, saturated antecedent conditions, and rainfall intensity in a region that typically exhibits low runoff coefficients. This compound effect led to flood peaks far above the HQ100 level in several Lower Austrian tributaries – an outcome rarely observed in this part of the Danube Basin.
The flood of September 2024 adds a significant new entry to the record of major floods in the Danube Basin. While previous landmark events – such as those in 1899, 2002, and 2013 – were each shaped by distinct synoptic situations, the 2024 event again illustrates that persistent, moisture-laden, and slow-moving atmospheric systems remain critical drivers of large-scale flooding in Central Europe (Hall et al., 2014; Nied et al., 2014; Kemter et al., 2020). In contrast to the Vb-type cyclone of 2002 (Ulbrich et al., 2003) or the blocking weather pattern of 2013, characterised by a stationary cut-off low over Central Europe (Blöschl et al., 2013a), the 2024 event was associated with a quasi-stationary low-pressure system anchored over the eastern Alps and western Hungary. This configuration enabled the sustained advection of subtropical moisture and produced multi-day rainfall totals far exceeding climatological norms (Haslinger et al., 2025; Hofstätter et al., 2018).
This atmospheric setup led to a persistent inflow of moisture and created favourable conditions for repeated convective development. Despite a dry summer and initially low soil moisture levels, the intensity and duration of the rainfall were sufficient to rapidly saturate soils, triggering very high runoff coefficients across much of Lower Austria. This demonstrates the non-linear relationship between antecedent conditions and flood response: dry soils can delay runoff initiation, but once the saturation threshold is exceeded, high runoff coefficients can be expected under convectively enhanced rainfall (Berghuijs et al., 2016).
The hydrological response in 2024 was strongly influenced by the spatial organisation of rainfall and the timing of tributary inflows. While the 2013 flood was dominated by inflows from the Alpine and Bavarian tributaries, with near-synchronous peaks of the Inn and Danube at Passau (Blöschl et al., 2013a), the 2024 flood was primarily driven by extreme discharges from rivers in Lower Austria. The near-simultaneous responses of the Traisen, Pielach, Perschling, and other right-bank tributaries with the main Danube flood wave at Kienstock caused a pronounced mid-basin amplification of discharge. Such synchronisation of tributary peaks is particularly relevant for neighbouring small- to medium-sized catchments, where the timing of peak inflows can align more easily due to similar response times. However, in this case, the spatial extent and persistence of the rainfall led to simultaneous contributions even from larger catchments such as the Ybbs and Traisen, suggesting that this type of synchronisation may also affect larger basins under certain conditions. Such processes may become more likely in a warmer climate if quasi-stationary lows – like that of September 2024 – occur more frequently, leading to spatial and temporal superposition of flood waves (Hall et al., 2014; Pinter et al., 2006; Bertola et al., 2021). Future studies should examine this potential systematically using regional climate projections and large-sample hydrological modelling (Slater et al., 2021).
Although no single event can be attributed solely to anthropogenic climate change, the 2024 flood exhibits several features consistent with recent hydroclimatic trends: record-breaking rainfall intensities and enhanced runoff from convective storms (Haslinger et al., 2025; Púčik et al., 2017), as well as a reduced influence of snowfall due to elevated temperatures. These characteristics align with projections of a more vigorous hydrological cycle and an increasing prevalence of convectively driven floods in Central Europe (Brunner et al., 2021; Hall et al., 2014; Merz et al., 2012). Nevertheless, historical analogues such as the 1899 flood – occurring under markedly cooler conditions – demonstrate that natural, internally generated climate variability can also produce hydrometeorological extremes of comparable magnitude. Internal variability refers to the spontaneous, unforced fluctuations in large-scale circulation and ocean–atmosphere coupling that modulate the regional hydroclimate on interannual to multidecadal scales (Deser et al., 2012; Hawkins and Sutton, 2009; Fischer et al., 2014). Such variability, interacting with long-term anthropogenic forcing, can temporarily enhance or suppress flood occurrence in river systems such as the Danube Basin. The clustering of major floods since 2000 (e.g. 2002, 2013, 2024) may thus reflect both an emerging flood-active regime and phases of enhanced internal variability superimposed on the warming trend, possibly linked to shifts in atmospheric circulation and moisture transport (Kundzewicz et al., 2013; Blöschl et al., 2020).
In conclusion, the September 2024 flood illustrates how atmospheric persistence, evolving antecedent conditions, and spatial runoff synchrony can combine to produce high-impact hydrological extremes. While its characteristics underscore the growing complexity of flood generation under changing climatic and hydrological conditions, they also reaffirm the continued relevance of established hazard-assessment frameworks. The so-called “static” design approaches – regularly updated to integrate new data and revised frequency estimates – remain an essential foundation for flood-risk management (Prudhomme et al., 2010). Rather than replacing these methods, future strategies should extend and complement them through multi-pillar approaches that combine event-based process analyses, compound-hazard perspectives, and adaptive risk governance (Montanari and Koutsoyiannis, 2014; Thieken et al., 2016). Recognising that floods of this type will continue to occur periodically under similar atmospheric conditions, such approaches are essential for enhancing resilience to both climatic change and natural variability.
Meteorological and hydrological data used in this study were provided by Geosphere Austria and Hydrography Austria. Additional data and revised gauge analyses were supplied by the Office of the Provincial Government of Lower Austria and viadonau – Österreichische Wasserstraßen-Gesellschaft mbH. The datasets are available upon request or through official online repositories, including the Geosphere Austria Data Hub and the Austrian eHYD data portal.
Jürgen Komma designed the study and wrote the paper. Peter Valent, Miriam Bertola and Juraj Parajka contributed to data analysis and helped with the figures. Klaus Haslinger, Benedikt Bica and Georg Pistotnik provided the meteorological interpretation (Sect. 3). Korbinian Breinl, Gabriele Müller, Lovrenc Pavlin, Bianca Kahl und Achim Naderer contributed to hydrological analyses (catchment scale and danube runoff). Günter Blöschl supervised the work. All authors discussed the results and contributed to the final manuscript.
At least one of the (co-)authors is a member of the editorial board of Hydrology and Earth System Sciences. The peer-review process was guided by an independent editor, and the authors also have no other competing interests to declare.
Publisher's note: Copernicus Publications remains neutral with regard to jurisdictional claims made in the text, published maps, institutional affiliations, or any other geographical representation in this paper. The authors bear the ultimate responsibility for providing appropriate place names. Views expressed in the text are those of the authors and do not necessarily reflect the views of the publisher.
The authors gratefully acknowledge the provision of meteorological and hydrological data by Geosphere Austria, the Austrian Hydrographic Services, and viadonau – Österreichische Wasserstraßen-Gesellschaft mbH. We further thank the Office of the Provincial Government of Lower Austria, for supplying additional datasets and revised gauge data. Their support and collaboration were essential for the comprehensive evaluation of the 2024 Danube flood.
This paper was edited by Nadav Peleg and reviewed by three anonymous referees.
Berghuijs, W. R., Woods, R. A., Hutton, C. J., and Sivapalan, M.: Dominant flood generating mechanisms across the United States, Geophys. Res. Lett., 43, 4382–4390, https://doi.org/10.1002/2016GL068070, 2016.
Bertola, M., Viglione, A., Lun, D., Hall, J., and Blöschl, G.: Flood trends in Europe: are changes in small and big floods different?, Hydrol. Earth Syst. Sci., 24, 1805–1822, https://doi.org/10.5194/hess-24-1805-2020, 2020.
Blöschl, G., Nester, T., Komma, J., Parajka, J., and Perdigão, R. A. P.: The June 2013 flood in the Upper Danube Basin, and comparisons with the 2002, 1954 and 1899 floods, Hydrol. Earth Syst. Sci., 17, 5197–5212, https://doi.org/10.5194/hess-17-5197-2013, 2013a.
Blöschl, G., Nester, T., Komma, J., Parajka, J., and Perdigão, R. A. P.: Das Juni-Hochwasser 2013 – Analyse und Konsequenzen für das Hochwasserrisikomanagement, Österr. Ing.-Archit.-Z., 158, 141–152, 2013b (in German).
Blöschl, G., Hall, J., Parajka, J., Perdigão, R. A. P., Merz, B., Arheimer, B., Aronica, G. T., Bilibashi, A., Bonacci, O., Borga, M., Čanjevac, I., Castellarin, A., Chirico, G. B., Claps, P., Fiala, K., Frolova, N., Gorbachova, L., Gül, A., Hannaford, J., Harrigan, S., Kireeva, M., Kiss, A., Kjeldsen, T. R., Kohnová, S., Koskela, J. J., Ledvinka, O., Macdonald, N., Mavrova-Guirguinova, M., Mediero, L., Merz, R., Molnar, P., Montanari, A., Murphy, C., Osuch, M., Ovcharuk, V., Radevski, I., Rogger, M., Salinas, J. L., Sauquet, E., Šraj, M., Szolgay, J., Viglione, A., Volpi, E., Wilson, D., Zaimi, K., and Živković, N.: Changing climate shifts timing of European floods, Science, 357, 588–590, https://doi.org/10.1126/science.aan2506, 2017.
Blöschl, G., Hall, J., Viglione, A., Perdigão, R. A. P., Parajka, J., Merz, B., and Lun, D.: Changing climate both increases and decreases European river floods, Nature, 573, 108–111, https://doi.org/10.1038/s41586-019-1495-6, 2019.
Blöschl, G., Kiss, A., Viglione, A., Barriendos, M., Böhm, O., Brázdil, R., Coeur, D., Demarée, G., Llasat, M. C., Macdonald, N., Retsö, D., Roald, L., Schmocker-Fackel, P., Amorim, I., Bělínová, M., Benito, G., Bertolin, C., Camuffo, D., Cornel, D., Doktor, R., Elleder, L., Enzi, S., Garcia, J. C., Glaser, R., Hall, J., Haslinger, K., Hofstätter, M., Komma, J., Limanówka, D., Lun, D., Panin, A., Parajka, J., Petrić, H., Rodrigo, F. S., Rohr, C., Schönbein, J., Schulte, L., Silva, L. P., Toonen, W. H. J., Valent, P., Waser, J., and Wetter, O.: Current European flood-rich period exceptional compared with past 500 years, Nature, 583, 560–566, https://doi.org/10.1038/s41586-020-2478-3, 2020.
Brunner, M. I., Slater, L. J., Tallaksen, L. M., and Clark, M. P.: Challenges in modelling and predicting floods and droughts: A review, Earth-Sci. Rev., 8, e1520, https://doi.org/10.1002/wat2.1520, 2021.
Deser, C., Phillips, A. S., Bourdette, V., and Teng, H.: Uncertainty in climate change projections: the role of internal variability, Clim. Dynam., 38, 527–546, https://doi.org/10.1007/s00382-010-0977-x, 2012.
Fischer, E. M., Sedláček, J., Hawkins, E., and Knutti, R.: Models agree on forced response pattern of precipitation and temperature extremes, Geophys. Res. Lett., 41, 8554–8562, https://doi.org/10.1002/2014GL062018, 2014.
Godina, R., Nöstl, A., Gutknecht, D., and Kresser, W.: August floods 2002 – flood risk management and lessons learned in Austria, in: Floods, from Defence to Management (Proc. 3rd Int. Symp. on Flood Defence, Nijmegen, 25–27 May 2005), edited by: van Alphen, J., van Beek, E., and Taal, M., Taylor & Francis/Balkema, Leiden, ISBN 978-0-415-39119-1, 2005.
Gupta, H. V., Perrin, C., Blöschl, G., Montanari, A., Kumar, R., Clark, M., and Andréassian, V.: Large-sample hydrology: a need to balance depth with breadth, Hydrol. Earth Syst. Sci., 18, 463–477, https://doi.org/10.5194/hess-18-463-2014, 2014.
Gutknecht, D., Reszler, C., and Blöschl, G.: Das Katastrophenhochwasser vom 7. August 2002 am Kamp – eine erste Einschätzung, Elektrotech. Inftech., 119, 411–413, 2002 (in German).
Haiden, T., Kann, A., Wittmann, C., Pistotnik, G., Bica, B., and Gruber, C.: The Integrated Nowcasting through Comprehensive Analysis (INCA) system and its validation over the Eastern Alpine region, Weather Forecast., 26, 166–183, https://doi.org/10.1175/2010WAF2222451.1, 2011.
Hall, J., Arheimer, B., Borga, M., Brázdil, R., Claps, P., Kiss, A., Kjeldsen, T. R., Kriaučiūnienė, J., Kundzewicz, Z. W., Lang, M., Llasat, M. C., Macdonald, N., McIntyre, N., Mediero, L., Merz, B., Merz, R., Molnar, P., Montanari, A., Neuhold, C., Parajka, J., Perdigão, R. A. P., Plavcová, L., Rogger, M., Salinas, J. L., Sauquet, E., Schär, C., Szolgay, J., Viglione, A., and Blöschl, G.: Understanding flood regime changes in Europe: a state-of-the-art assessment, Hydrol. Earth Syst. Sci., 18, 2735–2772, https://doi.org/10.5194/hess-18-2735-2014, 2014.
Haslinger, K., Breinl, K., Pavlin, L., Pistotnik, G., Bertola, M., Olefs, M., Greilinger, M., Schöner, W., and Blöschl, G.: Increasing hourly heavy rainfall in Austria reflected in flood changes, Nature, 639, 667–672, https://doi.org/10.1038/s41586-025-08647-2, 2025.
Hawkins, E. and Sutton, R.: The potential to narrow uncertainty in regional climate predictions, B. Am. Meteorol. Soc., 90, 1095–1107, https://doi.org/10.1175/2009BAMS2607.1, 2009.
Hofstätter, M., Lexer, A., Homann, M., and Blöschl, G.: Large-scale heavy precipitation over central Europe and the role of atmospheric cyclone track types, Int. J. Climatol., 38, https://doi.org/10.1002/joc.5386, 2018.
Hydrographischer Dienst Niederösterreich (HD NÖ): Vorläufige Analyse des Hochwassers September 2024 – Messdaten und erste hydrologische Einschätzung, Amt der NÖ Landesregierung, Abteilung Wasserwirtschaft, St. Pölten, 12 pp., https://www.noe.gv.at/noe/Wasser/Vorlaeufige_Analyse_Hochwasser_Sept2024_Hydro_web.pdf, last access: 16 December 2025.
Hydrographisches Zentralbüro (HZB): Das Juli-Hochwasser 1954 im österreichischen Donaugebiet, Technical report, Hydrographisches Zentralbüro, Beiträge zur Hydrographie Österreichs, Heft 29, held at the Austrian National Library (ÖNB), Vienna, Austria, 1955 (in German).
Kemter, M., Merz, B., Marwan, N., Vorogushyn, S., and Blöschl, G.: Joint trends in flood magnitudes and spatial extents across Europe, Geophys. Res. Lett., 47, e2020GL087464, https://doi.org/10.1029/2020GL087464, 2020.
Komma, J., Reszler, C., Blöschl, G., and Haiden, T.: Ensemble prediction of floods – catchment non-linearity and forecast probabilities, Nat. Hazards Earth Syst. Sci., 7, 431–444, https://doi.org/10.5194/nhess-7-431-2007, 2007.
Kresser, W.: Die Hochwässer der Donau, Schriftenreihe des Österr. Wasserwirtschaftsverbandes, Vienna, Austria, ISBN 978-3-7091-3531-0, 1957 (in German).
Kundzewicz, Z. W., Pińskwar, I., and Brakenridge, G. R.: Large floods in Europe, 1985–2009, Hydrolog. Sci. J., 58, 1–7, https://doi.org/10.1080/02626667.2012.745082, 2013.
Lauda, E.: Die Hochwasserkatastrophe des Jahres 1899 im österreichischen Donaugebiete, Beiträge zur Hydrographie Österreichs, Heft IV, k.k. Hydrographisches Centralbureau, Vienna, 1900 (in German).
Lauda, K.: Die Hochwasser vom 22. bis 25. September 1899 an der Donau und ihren Nebenflüssen, Mitteilungen der k.k. Zentralanstalt für Meteorologie und Geodynamik, 38, 1–44, 1908.
Lun, D., Fischer, S., Viglione, A., and Blöschl, G.: Detecting flood-rich and flood-poor periods in annual peak discharges across Europe, Water Resour. Res., 56, e2019WR026575, https://doi.org/10.1029/2019WR026575, 2020.
Merz, B., Vorogushyn, S., Uhlemann, S., Delgado, J., and Hundecha, Y.: HESS Opinions “More efforts and scientific rigour are needed to attribute trends in flood time series”, Hydrol. Earth Syst. Sci., 16, 1379–1387, https://doi.org/10.5194/hess-16-1379-2012, 2012.
Merz, R. and Blöschl, G.: A regional analysis of event runoff coefficients with respect to climate and catchment characteristics in Austria, Water Resour. Res., 45, W01405, https://doi.org/10.1029/2008WR007163, 2009.
Montanari, A. and Koutsoyiannis, D.: Modeling and mitigating natural hazards: Stationarity is immortal!, Water Resour. Res., 50, 9748–9756, https://doi.org/10.1002/2014WR016092, 2014.
Nied, M., Pardowitz, T., Nissen, K., Ulbrich, U., Hundecha, Y., and Merz, B.: On the relationship between hydro-meteorological patterns and flood types, J. Hydrol., 519, 3249–3262, https://doi.org/10.1016/j.jhydrol.2014.09.089, 2014.
Pekarová, P., Halmová, D., Bacová-Mitková, V., Miklánek, P., Pekár, J., and Škoda, P.: Historic flood marks and flood frequency analysis of the Danube River at Bratislava, Slovakia, J. Hydrol. Hydromech., 61, 326–333, https://doi.org/10.2478/johh-2013-0041, 2013.
Pinter, N., van der Ploeg, R. R., Schweigert, P., and Hoefer, G.: Flood magnification on the River Rhine, Hydrol. Process., 20, 147–164, https://doi.org/10.1002/hyp.5908, 2006.
Prudhomme, C., Wilby, R. L., Crooks, S., Kay, A. L., and Reynard, N. S.: Scenario-neutral approach to climate change impact studies: application to flood risk, J. Hydrol., 390, 198–209, https://doi.org/10.1016/j.jhydrol.2010.06.043, 2010.
Púčik, T., Groenemeijer, P., Rädler, A. T., Tijssen, L., Nikulin, G., Prein, A. F., van Meijgaard, E., Fealy, R., Jacob, D., and Teichmann, C.: Future changes in European severe convection environments in a regional climate model ensemble, J. Climate, 30, 6771–6794, https://doi.org/10.1175/JCLI-D-16-0777.1, 2017.
Thieken, A. H., Kienzler, S., Kreibich, H., Kuhlicke, C., Kunz, M., Mühr, B., Müller, M., Otto, A., Petrow, T., Pisi, S., and Schröter, K.: Review of the flood risk management system in Germany after the major flood in 2013, Ecol. Soc., 21, 51, https://doi.org/10.5751/ES-08547-210251, 2016.
Ulbrich, U., Brücher, T., Fink, A. H., Leckebusch, G. C., Krüger, A., and Pinto, J. G.: The Central European floods of August 2002: Part 1 – Rainfall periods and flood development, Weather, 58, 371–377, https://doi.org/10.1256/wea.61.03A, 2003.
- Abstract
- Introduction
- Study area and data
- Large-Scale Atmospheric Conditions
- Local meteorological conditions: precipitation and snowfall
- Flood Wave Propagation and Confluence Effects
- Discussion and Conclusions
- Data availability
- Author contributions
- Competing interests
- Disclaimer
- Acknowledgements
- Review statement
- References