the Creative Commons Attribution 4.0 License.
the Creative Commons Attribution 4.0 License.
 | 12 Jun 2026
Decoding multicomponent hydrochemical anomalies: a synergistic detection model for earthquake forecasting
Weiye Shao
Ying Li
Xiaocheng Zhou
Zhi Chen
Huajiao Liu
Zhaofei Liu
Chang Lu
Yuwen Wang
Zhaojun Zeng
Yun Wang
Hongyi He
Shaohui Fan
The intersection of the Xiaojiang Fault and the Red River Fault at the southeastern margin of the Tibetan Plateau experiences intense tectonic activity, where repeated earthquakes cause variations in thermal spring hydrochemistry. This study applies Bayesian change point analysis and develops a multicomponent synergistic anomaly detection model, using monitoring data from the Qujiang (5 years, 2019–2024) and Wana (2.5 years, 2021–2024) springs in this region to facilitate the real-time forecasting of the timing for M≥4 earthquakes. A 45-day response time threshold is established as the optimal period for capturing hydrochemical precursors in this region. With parameters optimized for individual components based on their distinct geochemical responses to seismic stress, the model features adaptive alarm criteria that ensure reliable real-time detection and enhanced adaptability. At the Qujiang site, the model achieved 21 effective alarms for 22 earthquake events with 1 miss and 8 false alarms, yielding a probability of detection (POD) of 0.95 and a threat score (TS) of 0.70. At the Wana site, the model generated 10 accurate alarms for 12 events with 2 misses and 5 false alarms, resulting in a POD of 0.83 and a TS of 0.59. The model identified pre-earthquake anomalies in Na+, Ca2+, Cl−, SO, δD, and δ18O, with TS ≥0.50. These components can serve as sensitive indicators for strong earthquake forecasting. The multicomponent synergistic alarm mechanism overcomes the limitations of single-parameter methods, where the number of hydrochemical components with synchronous anomalies serves as a reliable criterion for forecasting. A higher count of anomalous components typically correlates with larger earthquake magnitudes or shorter epicentral distances. This model has the potential to be applied to thermal spring monitoring across diverse active tectonic regions through targeted parameter optimisation, offering a valuable reference for earthquake forecasting.
- Article
(7960 KB) - Full-text XML
-
Supplement
(2059 KB) - BibTeX
- EndNote


Earthquake forecasting, a frontier in geosciences, relies on detecting sensitive and reliable precursor anomalies (Chen, 2009; Pritchard et al., 2020). Although several geophysical methods (e.g., seismology, geomagnetism) are extensively employed in this field (An et al., 2020; Chen and Zhu, 2020; Nayak et al., 2024), hydrochemical methods that monitor subsurface fluids exhibit unique advantages for short-term and imminent forecasting (Li et al., 2023). Because of their ease of migration and incompressibility, subsurface fluids respond rapidly to variations in dynamic crustal stress during earthquake preparation. These responses often induce considerable variations in the physical and chemical properties of the fluids, such as their ion concentrations and isotopic ratios (Lee et al., 2017; Gori and Barberio, 2022; Tian et al., 2023; Skelton et al., 2024). Moreover, subsurface fluids can transmit deep geological signals to the surface, via thermal springs, making them valuable targets for monitoring precursor anomalies. Currently, earthquake-related anomalies in subsurface fluids are prevalently observed across numerous spatial and temporal scales. These include hydrological anomalies such as water temperature, water level, and flow rate (Shi et al., 2015; Lee et al., 2017; Petitta et al., 2018; Di Matteo et al., 2020; Du et al., 2023), hydrogeochemical anomalies such as major elements, trace elements, and stable isotopes (Ide et al., 2020; Nakagawa et al., 2020; Barbieri et al., 2021; Wang et al., 2021; Zhang et al., 2021; Yan et al., 2022), and gas geochemical anomalies such as radon, helium, and carbon dioxide (Chaudhuri et al., 2011; Fu et al., 2017; Woith et al., 2020; Zhao et al., 2021; Zhou et al., 2021). Although some fluid precursor anomalies have displayed predictive value, many are still identified only via retrospective analysis after earthquakes. Moreover, continuous fluid monitoring data often reflect integrated signals from multiple sources, including seismic activity, environmental variability, and human-induced influences (Martinelli, 2020). The isolation of true seismic precursor anomalies from such intricate datasets remains a major challenge in current earthquake forecasting research.
In the analyses of large-scale fluid monitoring data, traditional anomaly detection methods typically depend on manually defined fixed thresholds to identify fluctuations. Techniques such as trend analysis and standard deviation methods offer clear advantages in capturing prominent anomalies (Ingebritsen and Manga, 2014; Yan et al., 2018). However, in practice, fluid monitoring data often integrate superimposed signals from both tectonic and non-tectonic sources and exhibit complex nonlinear fluctuations. These characteristics exhibit notable limitations for conventional statistical approaches in effectively determining fluid precursor anomalies (Yan et al., 2021). Machine learning-based anomaly detection algorithms provide novel insights for earthquake forecasting by revealing hidden precursor signals within vast volumes of monitoring data (Li et al., 2022, 2023). In recent years, algorithms such as artificial neural networks, long short-term memory networks, and random forests have been mostly applied to anomaly detection in individual indicators, such as water levels and radon concentrations, markedly enhancing detection accuracy and sensitivity (Tareen et al., 2019; Haider et al., 2021; Feng et al., 2022; Zhang et al., 2025). However, single-indicator measurements are easily affected by meteorological, tidal, and other environmental factors. Although regression models and similar techniques have been used to correct these interferences, challenges remain in effectively distinguishing non-seismic anomalies (Woith, 2015; Soldati et al., 2020). Moreover, single-indicator analysis does not leverage the synergistic relationships among multiple indicators, thus restricting its ability to improve the reliability of anomaly identification.
Thermal springs are natural discharge outlets for deep-circulating groundwater, offering distinct advantages for hydrogeochemical monitoring. The hydrochemical components (e.g., Na+, Cl−, SO of thermal springs tend to exhibit greater stability against short-term environmental fluctuations (e.g., temperature, short-term rainfall) than near-surface cold water systems, alongside deep circulation depth, rapid upward migration and limited susceptibility to anthropogenic influence (Luo et al., 2023; Yakupoğlu et al., 2025). These features help minimise non-seismic noise and enable a more accurate reflection of hydrogeological changes during earthquake preparation (Martinelli, 2020; Tian et al., 2024). Numerous studies have reported diverse geochemical behaviors among hydrochemical components, which depict notable differences in their response magnitude, quantity, patterns, and timing to tectonic stress variations throughout the earthquake preparation process (Li et al., 2021; Yan et al., 2022; Tian et al., 2023). Therefore, applying anomaly detection algorithms to evaluate the abnormal response characteristics of individual hydrochemical components and integrating multiple components to raise the anomaly identification accuracy may represent a promising technical approach for precursor recognition. Current research on hydrochemical anomaly detection algorithms remains in an exploratory stage (Castellana and Biagi, 2008). Existing studies have demonstrated the effectiveness of widely implemented machine learning algorithms (e.g., Isolation Forest, Local Outlier Factor, and Autoencoder) in detecting abnormal periods in hydrochemical data while also emphasising the need for scenario-specific optimisation of crucial indicators (Zhu et al., 2024). However, there is an urgent need to investigate the synergistic anomaly response patterns among hydrochemical components and to identify sensitive indicators for reliable forecasting of strong earthquakes.
This study focuses on the tectonically active region at the intersection of the Xiaojiang Fault (XJF) and the Red River Fault (RRF) on the southeastern margin of the Tibetan Plateau. The anomaly detection algorithm originally developed by Piersanti et al. (2016) for radon time series was adapted for real-time multicomponent hydrochemical analysis in thermal springs within the study region. By integrating the continuous monitoring data of hydrochemical ions and hydrogen–oxygen isotopes with earthquake catalogues and applying Bayesian change point (BCP) analysis, this study optimised parameters for specific components and created a multicomponent synergistic anomaly detection model. This model supports anomaly detection in both long-term time series and real-time earthquake forecasting across different time scales. The primary objectives of this study are summarised as follows: (1) to evaluate the applicability and performance of the algorithm in analysing hydrochemical time series; (2) to determine effective hydrochemical indicators for forecasting strong earthquakes in the study area; and (3) to assess the feasibility of the multicomponent synergistic anomaly detection model and explore the relationship between hydrochemical variations and seismic activity by examining the number of components with synchronous anomalies.
The southeastern Tibetan Plateau underwent sustained rotation and southeastward extrusion, driven by the collision-induced uplift and deformation between the Indian and Eurasian plates. The rotation and extrusion effects have resulted in the formation of an active tectonic region characterised by large-scale strike-slip fault systems and the presence of intracontinental microplates (Tapponnier et al., 1982; Yin and Harrison, 2000; Xu et al., 2011) (Fig. 1). Among these structures, the XJF and RRF serve as essential strike-slip boundaries, playing critical roles in the tectonic evolution and material extrusion of the southeastern Tibetan Plateau (Zhang et al., 2003; Tong et al., 2015). The intersection area of the XJF and RRF serves as the frontal zone accommodating the extrusion of the Sichuan–Yunnan Block (SYB). The XJF is blocked by the Indochina Block (ICB) and has not yet propagated southward through the RRF, which makes the intersection area the primary zone of stress accumulation, where there is an ongoing dextral compressional motion of the SYB (Wen et al., 2022; Li et al., 2024; Shao et al., 2024). The deeply incised XJF and RRF, along with secondary faults such as the Qujiang Fault (QJF) and Shiping–Jianshui Fault (SJF) in this region, act as conduits for deep-circulating thermal waters and the exchange of seismic information, with thermal springs commonly observed along these faults. This area experiences prolonged stress accumulation and intense tectonic deformation, accompanied by historical moderate to strong seismic activity (Wen et al., 2008), making it a critical zone for earthquake hazard monitoring. Consequently, this region is an ideal setting for investigating how variations in hydrochemical compositions respond to seismic activity.
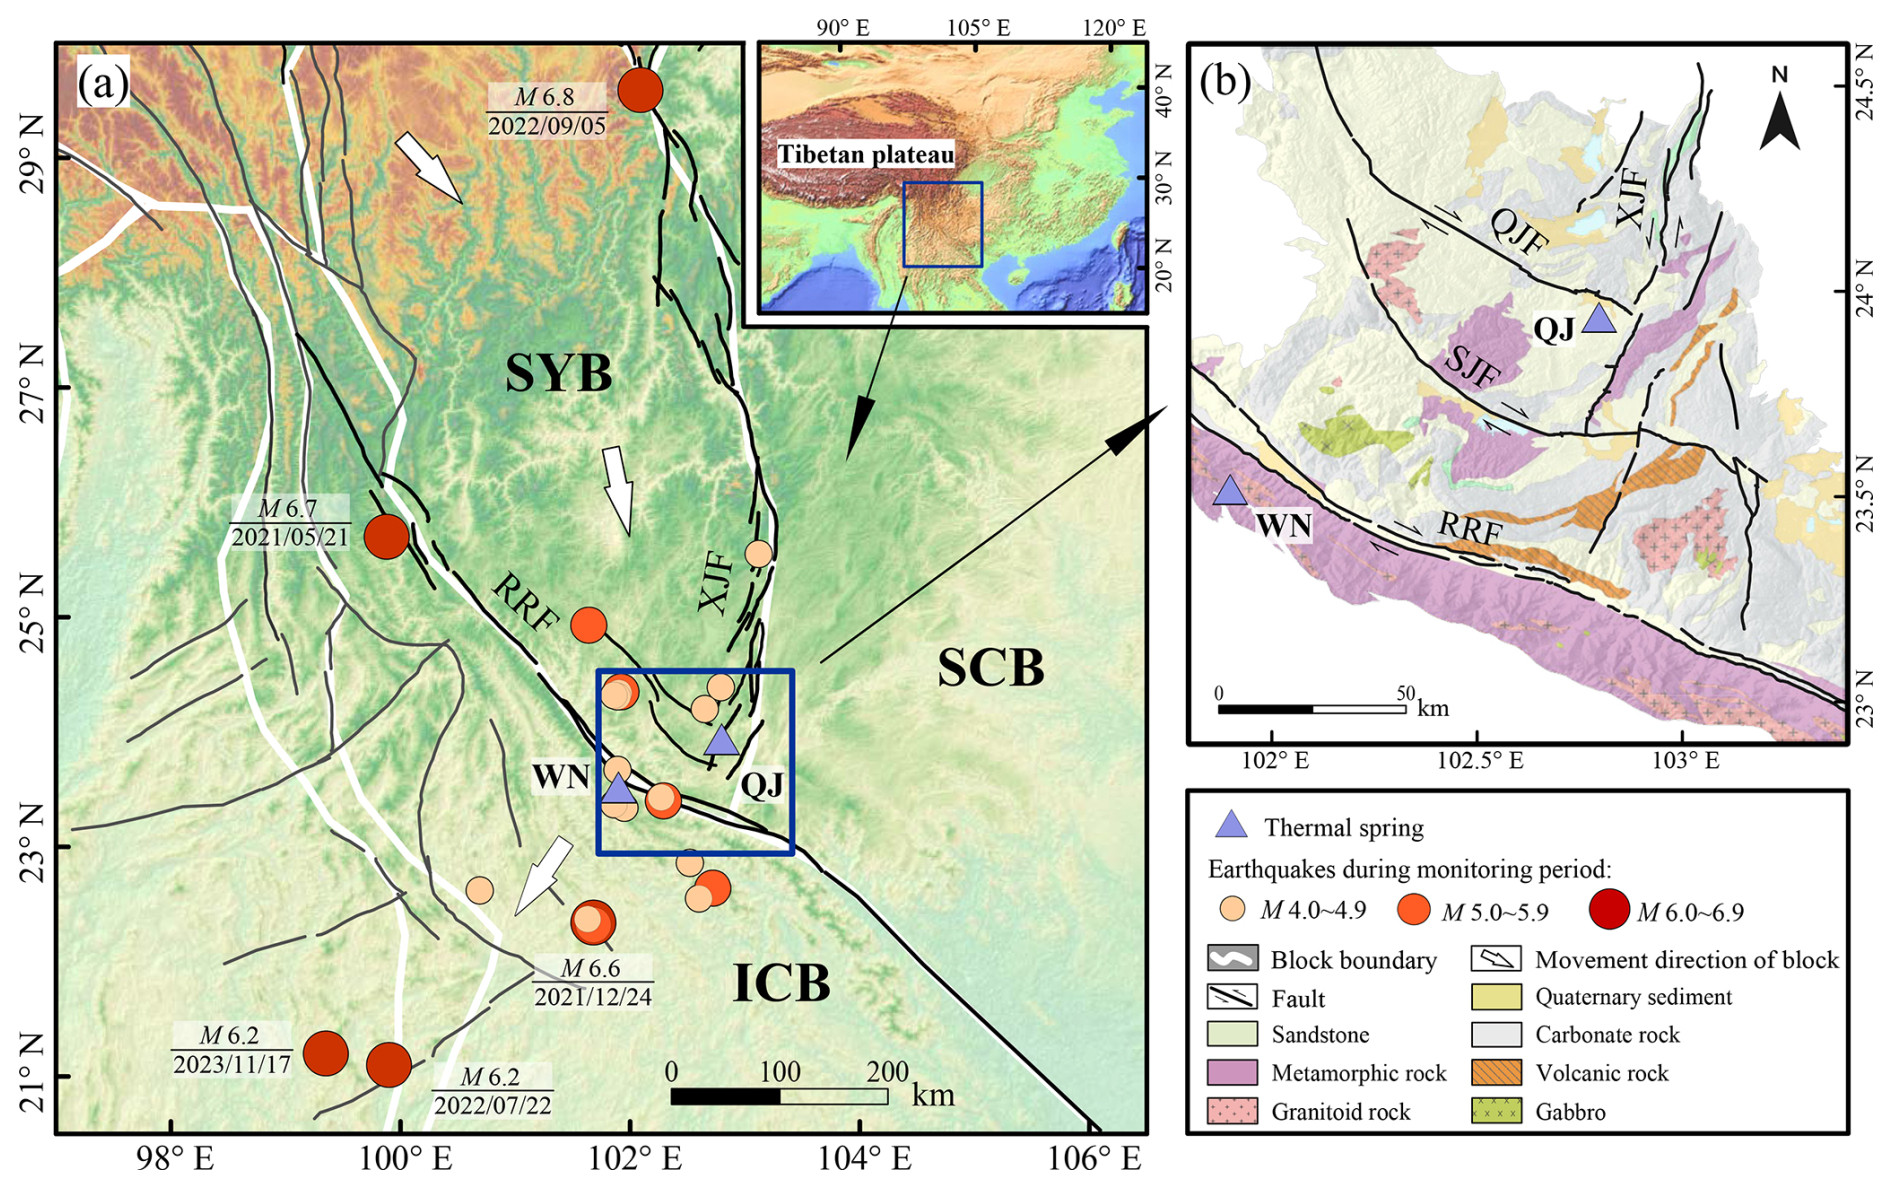
Figure 1(a) Simplified tectonic map of the southeastern margin of the Tibetan Plateau, presenting the distribution of M≥4 earthquakes during the thermal spring monitoring period. (b) Locations of continuously monitored thermal spring sites, fault distribution, and the geological map at the intersection of the Xiaojiang Fault (XJF) and Red River Fault (RRF). Earthquake catalogues are obtained from the China National Earthquake Data Center (https://data.earthquake.cn/, last access: 7 August 2024). The tectonic divisions and active faults are sourced from Deng et al. (2002), and the geological map is adapted from Ma et al. (2002). SYB: Sichuan–Yunnan Block; ICB: Indochina Block; SCB: South China Block; QJF: Qujiang Fault; SJF: Shiping–Jianshui Fault.
This study employs continuous hydrochemical monitoring at two high-temperature springs, namely Qujiang (QJ) and Wana (WN), located at crucial tectonic sites within the research area (Fig. 1b). QJ is situated at the intersection of the XJF and the QJF, with sandstone as the predominant country rock. QJ is positioned at a critical location where the sinistral slip rate of the XJF decreases sharply from 8–11 to approximately 4 mm a−1 after crossing the QJF (Wen et al., 2011; Wang et al., 2014). WN, located along the RRF, is hosted by gneiss and mylonite and lies within a stress concentration zone, where the SYB experiences southwestward deflection, compressing the RRF (Schoenbohm et al., 2006; Li et al., 2019; Wen et al., 2022). The two hot springs are situated along the boundary faults that regulate the regional tectonic pattern, and their hydrochemical variations may serve as sensitive indicators of changes in the earthquake preparation state within the intersection area.
3.1 Thermal spring monitoring data
The monitoring period for the QJ spring spanned from 1 June 2019 to 21 May 2024 (approximately 5 years), while the WN spring was monitored from 3 October 2021 to 21 May 2024 (approximately 2.5 years). A synchronous monitoring of hydrogen and oxygen isotopes was conducted at both springs between 1 January 2023 and 21 February 2024. Water temperature, pH, electrical conductivity (EC) and hydrochemical components for the thermal springs were measured every three days. Rainfall data were collected through continuous in situ monitoring using an RTP-II tri-element meteorological instrument with a resolution of 0.1 mm. Before collecting the thermal water samples, high-density polyethene (HDPE) bottles were thoroughly rinsed thrice with deionised water and twice with the thermal water. Water samples were then filtered through 0.45 µm micropore membranes and stored in HDPE bottles. Samples intended for cation analysis were acidified with high-purity nitric acid. During collection, care was taken to prevent the introduction of air bubbles, and the samples were immediately sealed hermetically to preserve them.
The concentrations of major ions (Na+, K+, Ca2+, Mg2+, Li+, F−, Cl−, SO, Br−, NO) were analysed using a Thermo Scientific Dionex Aquion IC system equipped with an AS40 autosampler, which had a detection limit of 0.01 mg L−1. HCO and CO concentrations were determined via standard titration procedures using a ZDJ-3D potentiometric titrator with 0.05 mol L−1 HCl. δD and δ18O values were determined using a Picarro L2140-i water isotope analyser, with precisions of 0.015 ‰ and 0.05 ‰, respectively. All analyses were conducted at the Key Laboratory of the Institute of Earthquake Forecasting, China Earthquake Administration. The monitoring data are detailed in the database of Shao (2025). To ensure data accuracy, cation–anion electrical balance (EB) tests were performed for each sample as a quality control measure, with all EB kept within ±5 %. Data that fulfilled this criterion were included in the subsequent analysis. The EB (Appelo and Postma, 2005) is calculated as below:
where ∑mc represents the sum of cation concentrations (in milliequivalents per liter, meq L−1), and ∑ma represents the sum of anion concentrations.
3.2 Earthquake data collection and processing
The anomaly detection model developed in this study aimed to forecast earthquakes with M≥4 by determining pre-earthquake anomalous signals. To identify earthquakes that might affect hydrochemical component variations while excluding those unrelated to precursors, and to establish a precise correlation between variations in hydrochemical components and seismic activity, an earthquake screening method based on the earthquake preparation zone radius (R, km) formula (Dobrovolsky et al., 1979) was employed:
where M represents the earthquake magnitude. Based on long-term observations of 27 radon-involved earthquake cases in China between 1997 and 2020, 9 widely applied prediction methods were evaluated. The findings demonstrated that Dobrovolsky's formula achieved the highest applicability rate, reaching 96.30 % (Li et al., 2023). Its practical utility is further confirmed by recent studies in complex tectonic settings (Yakupoğlu et al., 2025), establishing it as an empirically robust and widely adopted reference scale for selecting potentially correlated earthquake events (Li et al., 2023; Seminsky and Seminsky, 2024; Zhu et al., 2024).
Earthquakes were selected as study events based on the criterion that the epicentral distance (Δ) from the thermal spring monitoring sites did not exceed R (Fig. 1a). The QJ site was within the preparation zones of 22 earthquakes with M≥4 during its monitoring period (1 June 2019–21 May 2024), whereas the WN site was within the preparation zones of 12 earthquakes with M≥4 during its observation period (3 October 2021–21 May 2024) (Table S1). All earthquakes had focal depths ranging from 8 to 16 km, and were classified as shallow-focus events. The earthquake catalogue was obtained from the National Earthquake Data Center of China (http://data.earthquake.cn, last access: 7 August 2024).
Seismic moment (M0), which directly reflects fault geometry parameters and the rigidity of the surrounding medium, accurately quantifies earthquake rupture processes and the mechanical energy released during the event. Compared with magnitude scales, the seismic moment is more suitable for analysing the seismic impact on hydrochemical component changes in thermal springs. The commonly used empirical formula for estimating seismic moment based on magnitude (Hanks and Kanamori, 1979) is expressed as follows:
Stress attenuates with increasing epicentral distance during the earthquake preparation process, directly influencing the development of thermal water seepage pathways and the intensity of water–rock interactions (Wang and Manga, 2010; Ingebritsen and Manga, 2019). To account for distance-related effects, the seismic moment requires correction using the following empirical formula (Piersanti et al., 2016):
where ω is the weighting factor to modulate the relative contribution of distant and local earthquakes to the observed hydrochemical variations. A sensitivity analysis was performed by testing multiple values of ω (including 0, 0.5, 1, 1.5, 2, 2.5, and 3). It was observed that the cross-correlations peak (the methodology for which is presented in Sect. 3.3.2) consistently emerged within the same lag range across all ω values. Among these, the cross-correlations for ω=0, 0.5, and 1 were relatively significant and exhibited minimal differences (Fig. S1). Considering the physical interpretability, in this study, ω takes the value of 1.
3.3 Hydrochemical component time series
The geochemical behaviours of different components in thermal spring water exhibit significant variations, with each element displaying distinct characteristics with respect to anomaly amplitude, temporal evolution, and precursor response sensitivity. Regulated by unique hydrogeological conditions, the hydrochemical variations of each thermal spring also display spatial differences in response to tectonic activity. To effectively extract anomalous signals, the anomaly responses of different components and springs in the study area are compared, and the algorithm's generalisability across springs is validated. This study establishes independent time series for each component at different springs (Figs. 2 and S2).
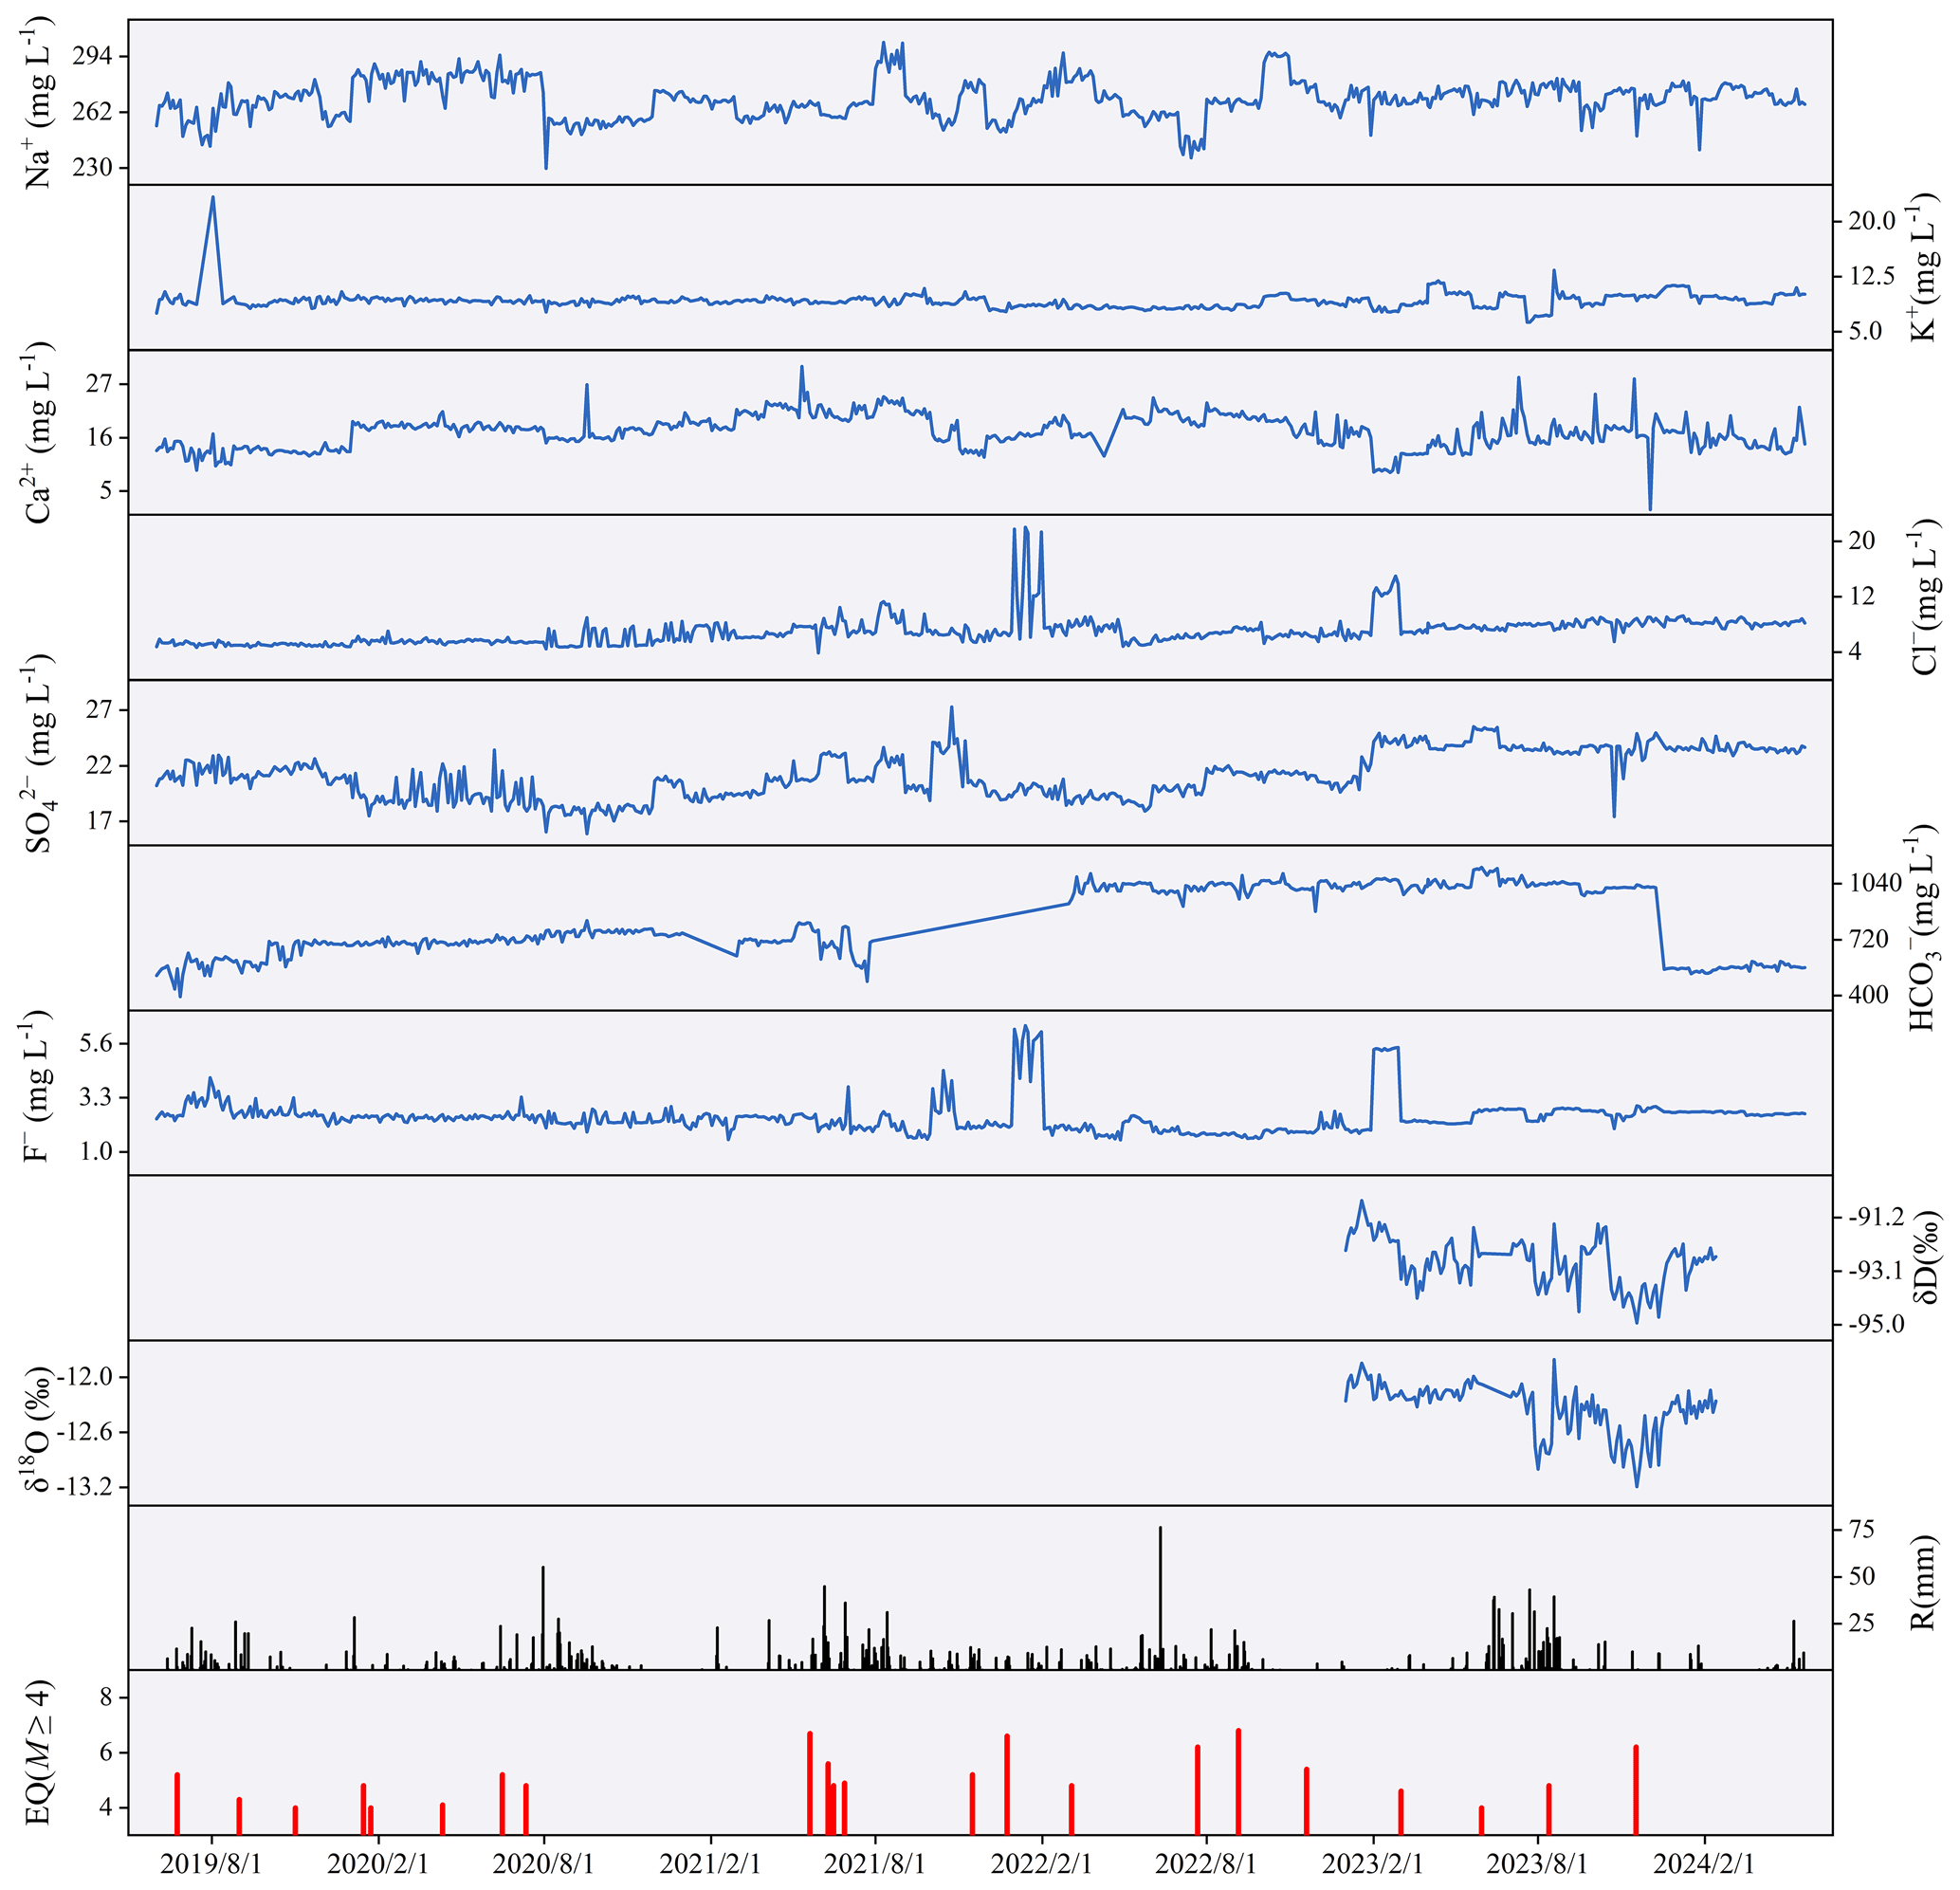
Figure 2Time series of hydrochemical components (Na+, K+, Ca2+, Cl−, SO, HCO, F−, δD, and δ18O), alongside corresponding rainfall and earthquake events for Qujiang spring.
3.3.1 Data evaluation and noise removal
The dynamic variations in thermal spring ion concentrations are crucial for identifying seismic precursors. When observed data show minimal fluctuations or remain consistently below detection limits over extended periods, it becomes challenging to effectively extract hydrogeochemical anomaly signals before an earthquake. Long-term monitoring reveals that concentrations of Mg2+, Br−, and NO are extremely low and remain consistently below instrumental detection limits, without temporal fluctuations, which thus limits their value for tracking seismic precursors. Consequently, Na+, K+, Ca2+, Cl−, SO, HCO, F−, δD, and δ18O have been selected for earthquake anomaly identification due to their consistent continuity and reliable data characteristics.
The thermal spring water in the study area originates from atmospheric precipitation recharge. It circulates deeply through faults, is heated by geothermal energy, and then discharges at the surface, with its hydrochemical composition primarily determined by the lithology of the surrounding rocks (Shao et al., 2024). Due to the deep-circulation nature of this hydrothermal system, ambient temperature and atmospheric pressure at the spring outlet exert a relatively minor effect on the hydrochemistry. However, rainfall serves not only as the primary water source but also accelerates groundwater circulation, fosters shallow infiltration, and mixes with thermal waters (Taylor et al., 2012; Hosono et al., 2020; Colman et al., 2021). This process can potentially obscure deep-seated earthquake preparatory signals carried by the thermal spring. The comparative analysis of hydrochemical and meteorological data (Fig. S3) reveals that rainfall is the dominant interfering factor, accompanied by a partial decrease in ion concentrations following events. In contrast, as shown in Fig. S3, the significant seasonal fluctuations in ambient temperature and atmospheric pressure do not induce corresponding periodic variations in the hydrochemical concentrations. Consequently, this study focuses on assessing the potential perturbations induced by rainfall on thermal spring hydrochemistry. Unlike temperature and pressure, rainfall causes pulsed disturbances, typically manifesting as intermittent spikes followed by extended periods of zero values in rainfall data. Previous studies usually employ a 14-day moving average to filter out such interference, a method that has been established as effective in geochemical analysis (Piersanti et al., 2016; Fu et al., 2017; Zhao et al., 2021). To suppress high-frequency noise from short-term environmental disturbances such as rainfall while preserving mid- to low-frequency tectonic signals, a 15-day backward moving average is applied to process the 3-day resolution hydrochemistry data:
where MA(t) is the 15-day moving average at day t, and Dr(i) is the daily raw data on day i.
3.3.2 Correlation analysis
The influence of rainfall on the hydrochemical dynamics of thermal springs may exhibit a lag effect, while hydrochemical precursor anomalies induced during earthquake preparation processes typically precede earthquake events. These two mechanisms exhibit a significant temporal phase difference in their perturbations to hydrochemical components. In this study, the cross-correlation function is applied to quantitatively analyse the temporal offset between the impacts of rainfall and seismic activity on thermal spring hydrochemistry. This study aims to identify the maximum correlation time offset between rainfall-hydrochemistry and precursory anomaly-main shock events by calculating correlation coefficients at varying lag times. The cross-correlation function (Chatfield, 1975; Brockwell and Davis, 1991) is represented as follows:
where x and y are two time series, and represent their sample means, N is the series length, and k is the lag. The lag k denotes the time shift, where k > 0 indicates y lags x, and k < 0 indicates x lags y. Considering the seasonal effects of rainfall and the reliability of seismic precursor response times, k is set within a range of −45 to 45 days.
In the cross-correlation analysis, the denoised hydrochemical component time series (processed using a 15-day moving average) are correlated with both the rainfall time series and the distance-corrected M0 time series. This analysis aims to evaluate the effectiveness of the moving average method in filtering out rainfall-induced interference by assessing the correlation intensity between the denoised hydrochemical time series and rainfall. Meanwhile, the analysis verifies the potential temporal linkages between the denoised hydrochemical components and regional seismic moment release.
3.4 Detection algorithms
3.4.1 BCP analysis
Assuming that the denoised hydrochemical component time series exhibit stable statistical characteristics. Since earthquake events are stochastic and hydrochemical anomalies (i.e., change points) emerge during the pre-earthquake period without a known rupture time, continuous hydrochemical monitoring data exhibit non-stationary variations. Therefore, the BCP analysis is applied to effectively extract anomalous signals from these component time series and determine the timing of their appearance, thereby verifying their correspondence with earthquakes for earthquake forecasting.
The BCP algorithm, initially developed for Earth's climate systems (Ruggieri, 2012), is applied here to the 15-day moving average time series of all hydrochemical component concentrations from QJ and WN. The analysis produces Bayesian predictive model curves, change point locations, and posterior probabilities for each component. The posterior probabilities represent the likelihood of change point occurrences in the predictive models, with probability peaks implying the most likely timings of change points.
3.4.2 Anomaly detection model
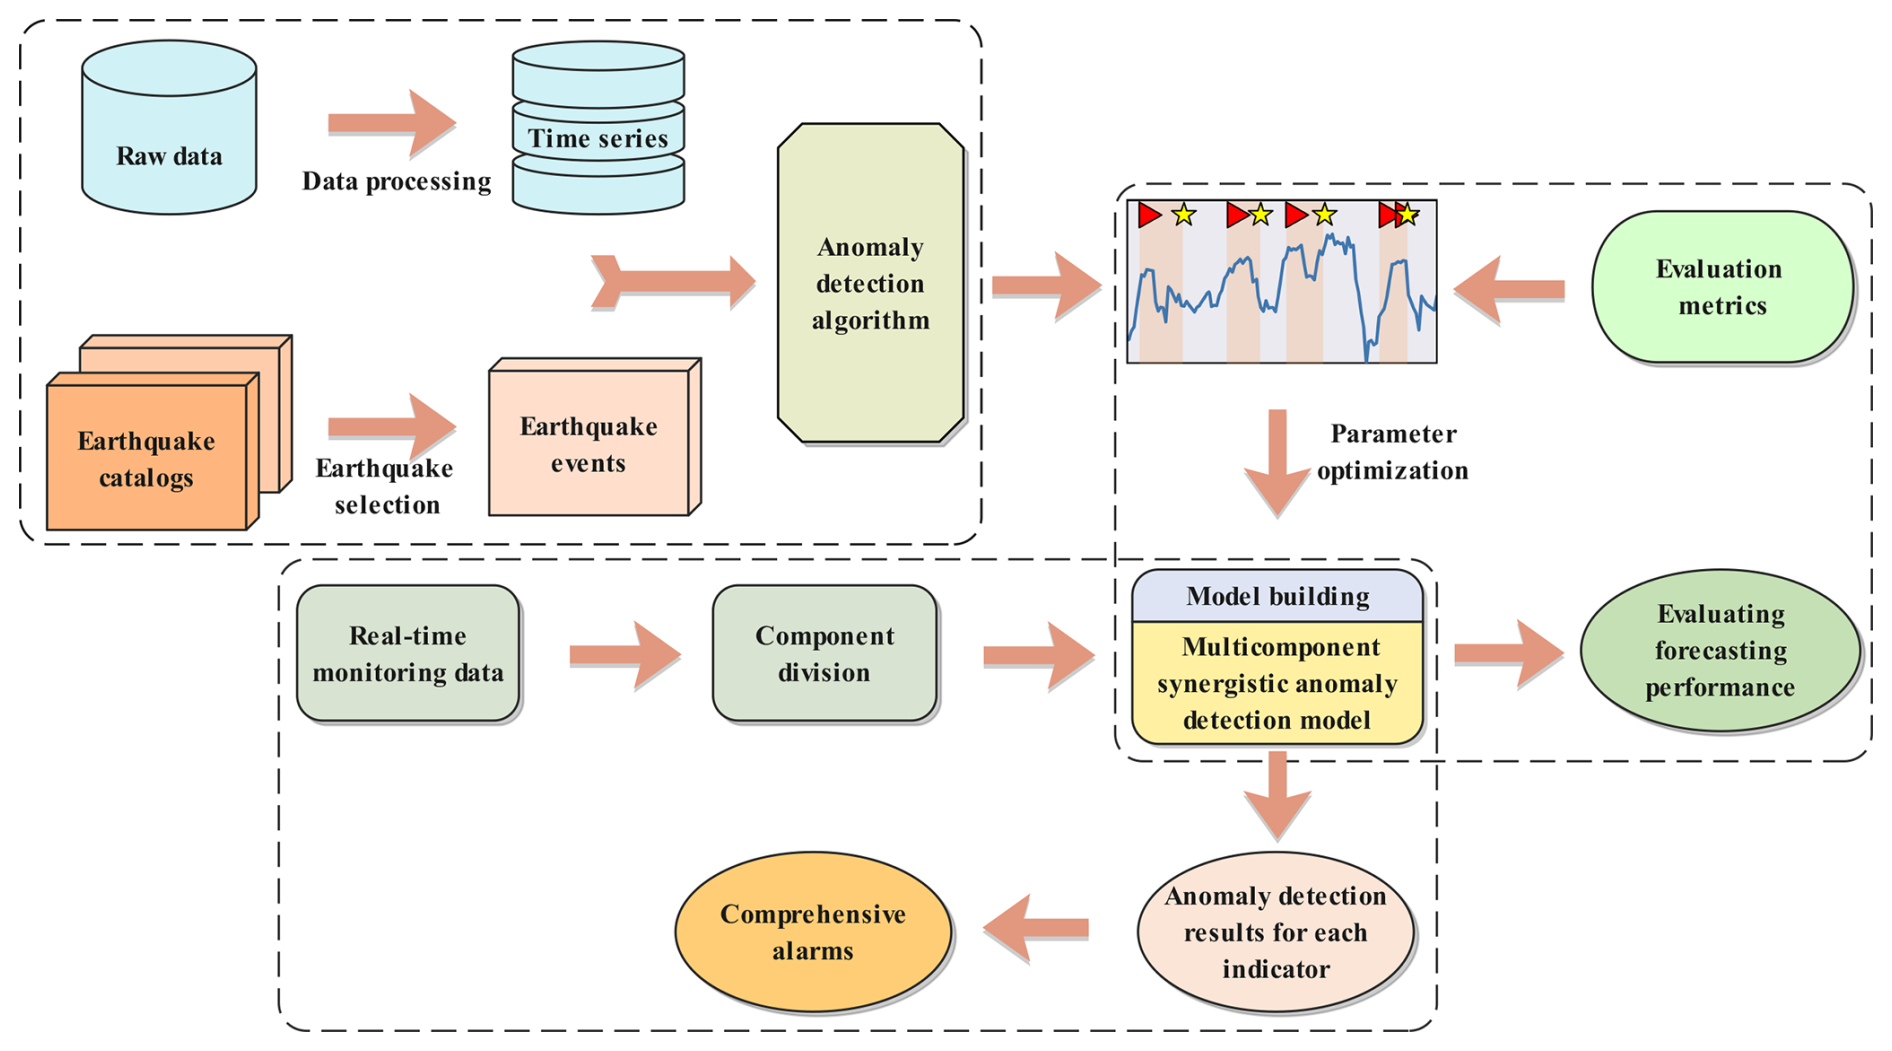
Based on the change points identified by the BCP analysis across various components to guide and optimize key parameters, this study enhances the real-time anomaly detection algorithm for soil radon concentration time series (Piersanti et al., 2016; Soldati et al., 2020) and applies it to hydrochemical multicomponent time series (Na+, Cl−, SO, δD, δ18O, etc.). The objective is to establish an anomaly detection model within a multi-parameter feature space to explore potential correlations between variations in hydrochemical components and major earthquakes. This study optimizes the algorithmic workflow by retrospectively analyzing data in reverse-chronological order to establish dynamic thresholds, enabling real-time forecasting. In this work, evaluation metrics for parameter optimisation are introduced and a seismic response time threshold parameter, which accounts for local geological conditions is incorporated. The detection model processes hydrochemical component time series and confirms earthquake catalogues, fitting optimal parameters based on the evaluation metrics to generate the best anomaly detection parameter combinations for each component. The optimised model performs online, point-by-point data processing for real-time monitoring. When real-time hydrochemical data deviates from the threshold, the model triggers an alarm to predict earthquakes, increasing forecasting accuracy through multicomponent collaboration (Fig. 3). The model improves in three ways: (1) the model incorporates a multi-parameter collaborative verification mechanism that reduces environmental noise interference; (2) the model identifies components with superior anomaly detection performance; and (3) the model analyses anomaly intensity based on the number of components detecting anomalies for the same earthquake, thereby improving detection accuracy and reducing false positives and missed alarms.
The improved detection algorithm (Fig. 4) is described as follows: real-time monitoring data for each component are loaded on day i. An alarm is triggered on day i if the daily value on day i− p2 exceeds p1 times the 15-day moving average on day i− p2 −1, and simultaneously, the 15-day moving average on day i surpasses p3 times that on day i− p2. This alarm is considered a successful early alarm if an M≥4 earthquake occurs within i+Tth. Following an earthquake, the algorithm enters a threshold adjustment period to suppress redundant false alarms caused by ongoing post-earthquake anomalies. During this period of p5∧M days (where M is the magnitude), the parameters are updated to p1 p4 × p1 and p3 p4 × p3. The functional form p5∧M is adopted based on an exponential relationship between earthquake magnitude and geochemistry anomaly duration (Fleischer and Mogro-Campero, 1985; Rikitake, 1988; Elmaghraby and Lotfy, 2009). Treating the base p5 as a tunable parameter allows the algorithm to dynamically optimize this duration for specific regional data. If subsequent earthquakes occur within this period, the adjustment period is recalculated based on the maximum magnitude of the subsequent earthquakes. If no M≥4 earthquakes occur during this period, parameters p1 and p3 automatically revert to their initial values. The algorithm incorporates five adjustable parameters (p1–p5) and a seismic response time threshold (Tth), with p1, p3, and Tth being key parameters.
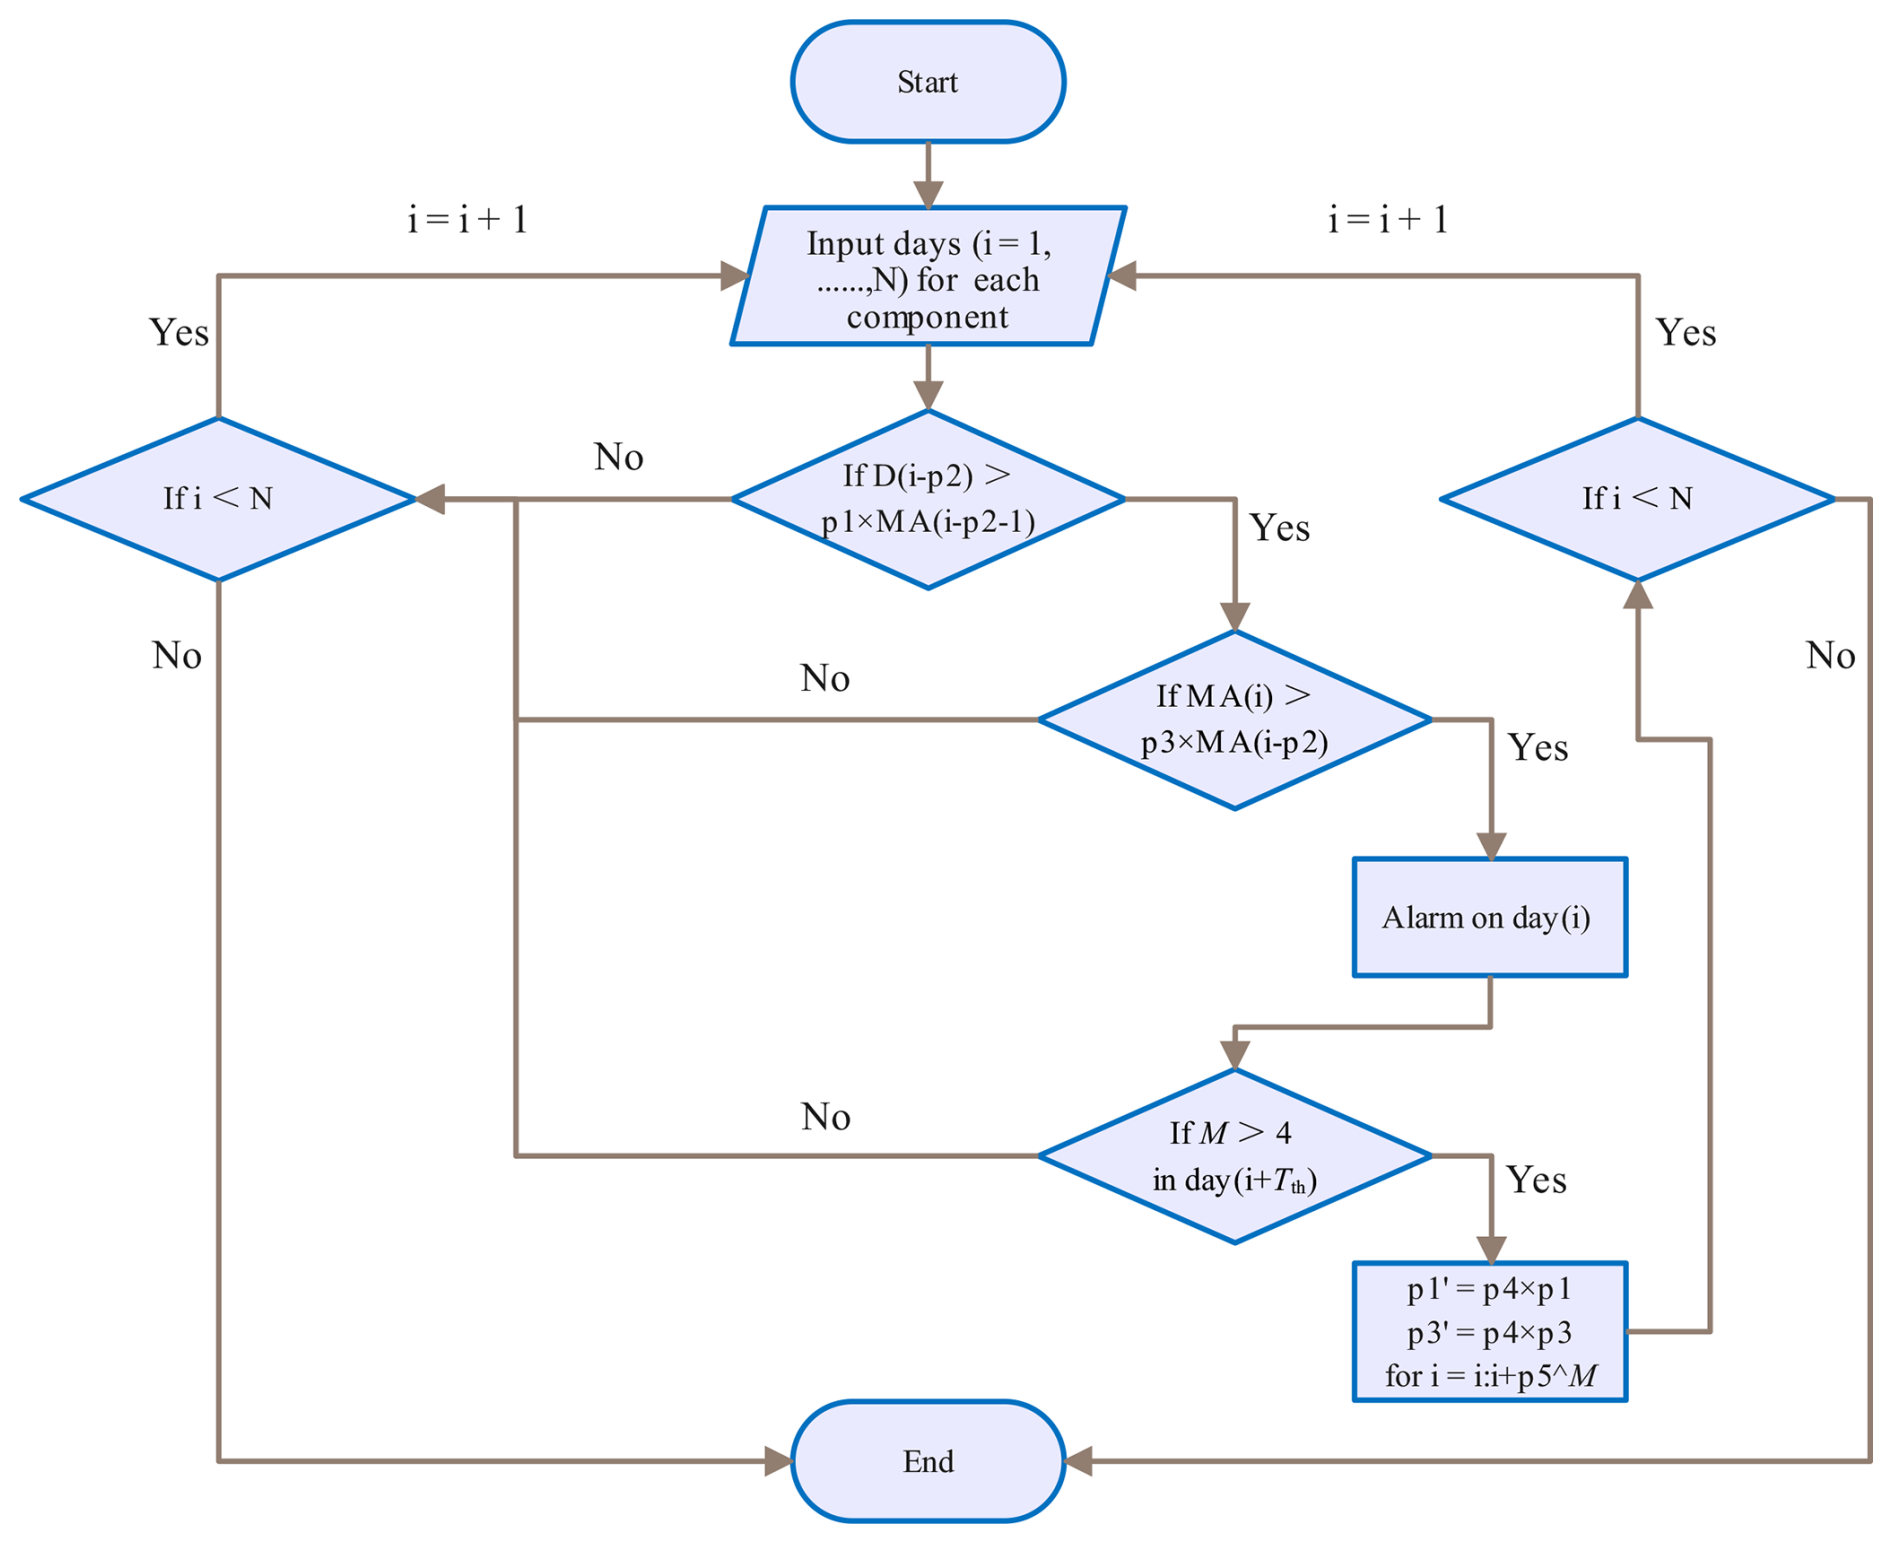
Figure 4Flow chart of anomaly detection algorithm (modified based on Piersanti et al., 2016). D and MA are the daily value and the 15-day moving average of each hydrochemical component time series, respectively.
When thermal water is subjected to external disturbances (e.g., contamination or anthropogenic inputs), particularly the dissolution of a single compound, variations in hydrochemical ion concentrations generally follow the charge balance principle, often inducing synchronous changes in paired cations and anions. To minimise the impact of uncertain interference and improve program efficiency, reliable alarm signals should be defined by concurrent alarms from at least three hydrochemical components. The intensity of the anomaly increases with the number of components triggering simultaneous alarms.
3.4.3 Evaluation metrics
To evaluate the model's performance in identifying low-probability earthquake events within imbalanced datasets, four quantitative metrics are applied based on the number of correct alarms (NA), false alarms (NB), and missed alarms (NC):
False alarm rate (FAR): Measures the proportion of incorrect alarms relative to the total number of alarms issued.
Missed alarm rate (MAR): Quantifies the risk of undetected seismic events.
Probability of detection (POD): Assesses the model's sensitivity in identifying actual events.
Threat score (TS): A comprehensive accuracy index that integrates NA, NB, and NC to provide a holistic evaluation of forecasting performance.
4.1 Hydrochemistry
The average water temperature at QJ is approximately 60 °C, with a pH of 7.5 and an EC of 1148 µS cm−1, while WN has a higher temperature of 80 °C, a pH of 7.9, and a lower EC of 579 µS cm−1. Both QJ (sandstone) and WN (mylonite, gneiss, etc.) exhibit similar hydrochemical types (HCO3-Na), due to the comparable lithology of the surrounding rocks. The δ18O values at QJ range from −13.19 ‰ to −11.81 ‰, while the δD values range from −94.93 ‰ to −90.59 ‰. At WN, the δ18O values range from −13.22 ‰ to −12.01 ‰, and the δD values range from −91.26 ‰ to −88.09 ‰. The narrow fluctuation range of stable isotopes in both thermal springs, coupled with their proximity to the local and global meteoric water lines (Fig. S4), indicates that the thermal spring water originates from atmospheric precipitation. Overall, the two springs exhibit similar hydrochemical characteristics, which minimises the impact of compositional differences on the evaluation of algorithm effectiveness across the different springs. For detailed hydrochemical ion concentrations and isotope values, please refer to the supplementary materials.
4.2 Hydrochemical responses
The cross-correlation analysis findings (Fig. 5) show that after the 15-day moving average treatment, the correlation (blue dotted lines) between rainfall and hydrochemical components are reduced to a weak level (within ±0.2). This result indicates that the moving average treatment effectively mitigates rainfall-induced noise. To validate the robustness of the denoising process, the results obtained from the moving average were compared with those derived from Fast Fourier Transform low-pass filtering and wavelet-based denoising techniques (Fig. S5). The approximately consistent outcomes across all methods confirm the suitability of the moving average approach for suppressing high-frequency noise. Furthermore, this method is better suited to the model's real-time anomaly detection framework. Notably, Na+, Ca2+, and δ18O exhibit minor response peaks at lags of 18–30 days, suggesting that these components remain continuously affected by rainwater infiltration within 15–30 days after precipitation. Similarly, the correlations between the distance-corrected M0 and the denoised hydrochemical component time series (red dotted lines) remain low (around ±0.2). However, K+, Ca2+, Cl−, SO, F−, δD, and δ18O exhibit weak response peaks at lags of −39 to −12 days, with varying peak directions for each component. This observation suggests that seismic activity (12–39 days before seismic moment release) may influence hydrochemical components, causing their concentrations to fluctuate (either increasing, decreasing, or remaining stable) due to different geochemical mechanisms.
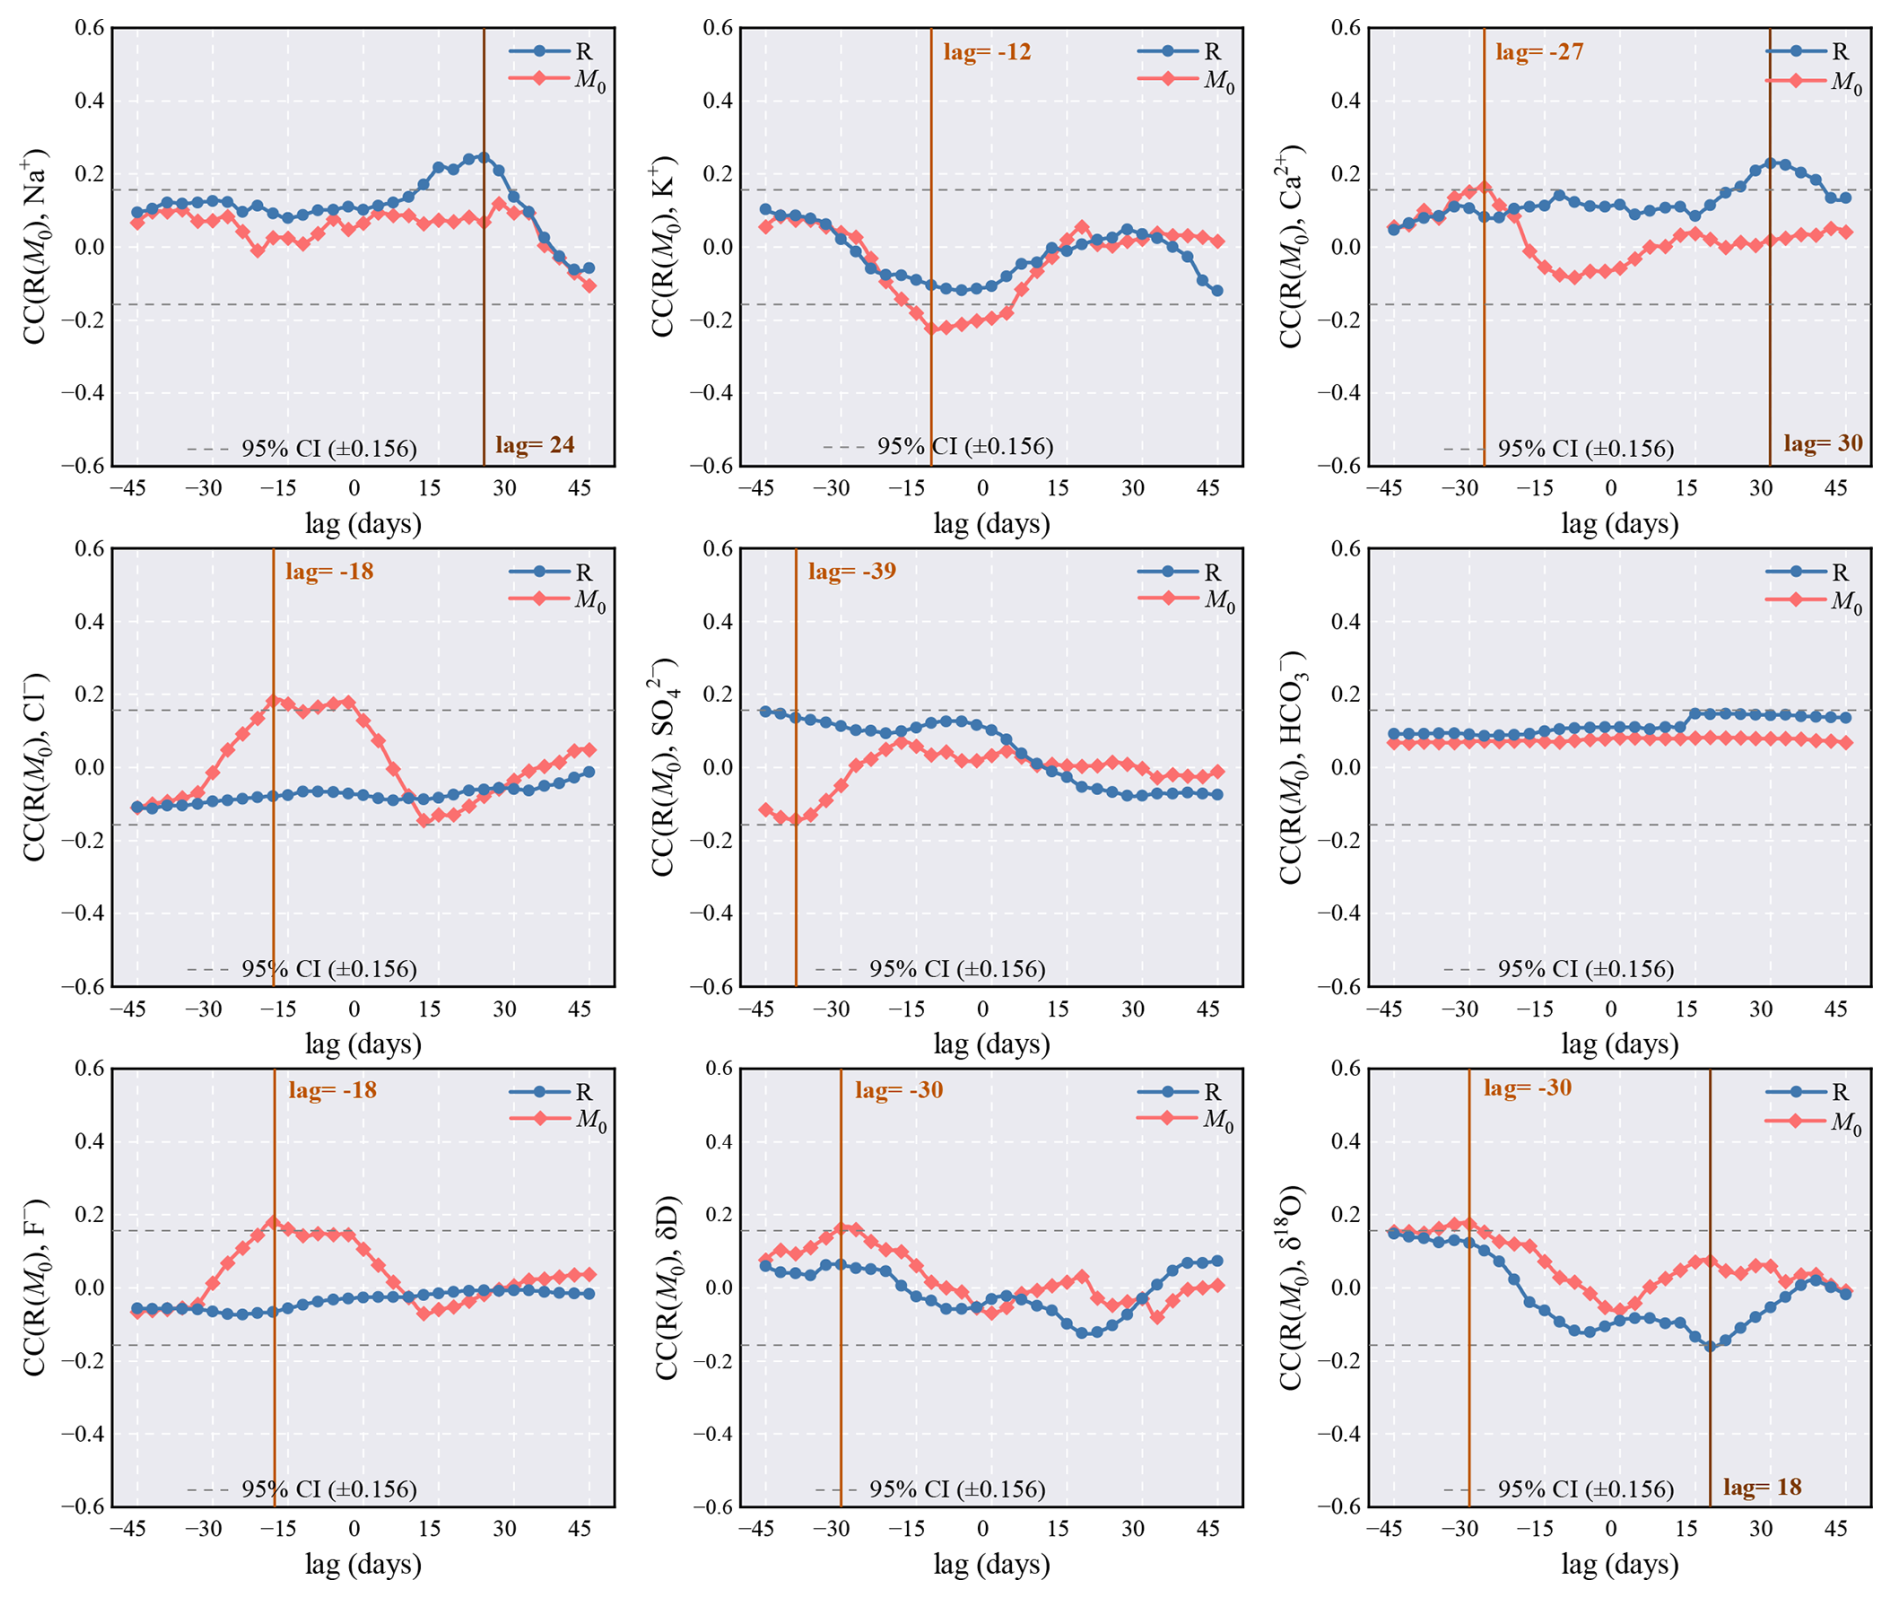
Figure 5Cross-correlation function analysis of the 15-day moving average time series of hydrochemical components during stable isotope monitoring, with rainfall and distance-corrected seismic moment.
4.3 BCP detection of pre-earthquake anomalies
Cross-correlation analysis revealed the hydrochemical responses preceding seismic moment release, while BCP analysis further captured these anomalous signals and identified their timing. The results show that change points are successfully detected in all component time series from both thermal springs (Fig. 6). Consistent with geological precursor studies, where low-probability signals are often retained due to the weak intensity of hydrochemical anomalies. For example, before the M4.6 earthquake on 3 March 2023, the posterior probability for a Ca2+ change point at QJ was 0.20 at 20 days before the earthquake, while SO exhibited a posterior probability of 0.19 at 28 days before the earthquake. Similarly, before the M5.2 earthquake on 16 November 2021, Cl− at WN showed posterior probabilities for change points of 0.15 and 0.51 at 3 and 17 days before the earthquake, respectively. Notably, most change points are identified within 45 days preceding the earthquakes. This observation suggests that component concentration changes are sensitive to earthquake preparation processes and occur before earthquakes, which provides critical empirical support for anomaly detection algorithm models.
Notably, the timing and posterior probabilities of change points exhibit significant uncertainty, reflecting the complexity of factors influencing variations in hydrochemical components. These factors include inhomogeneity in stress accumulation, the structural complexity of fault and aquifer systems, modulation by deep gas degassing, and the mixing effects of multi-source fluids (Skelton et al., 2014; Kim et al., 2019; Hosono et al., 2020). In particular, the variable dominance of different mechanisms (e.g., water-rock interaction and fluid mixing) in different earthquake cases leads to inconsistent timing and intensity of hydrochemical anomalies, thereby causing uncertainty in BCP-detected change points. Among these complex factors, well-established mechanisms like water-rock interaction and fluid mixing can effectively explain several detected anomalies. For instance, the rise in Na+ concentrations before earthquake may result from a switchover to nonstoichiometric dissolution of analcime at fresh rock surface with preferential release of Na+ into groundwater (Andrén et al., 2016). Similarly, the increase in δ18O before the M6.6 Tottori earthquake in southwestern Japan has been attributed to enhanced water–rock interaction due to rock strain during the earthquake preparation process (Onda et al., 2018). Furthermore, the mixing of fluids with significantly different isotopic and hydrochemical compositions can cause variations in δD, δ18O, and ion concentrations. Previous studies in Iceland have reported pre-earthquake increases in Na+ concentration, δD, and δ18O due to mixing with different groundwater (Skelton et al., 2014, 2024). A similar phenomenon is observed in the elevated EC and ion concentrations preceding the Mw5.0 Mudanya earthquake in western Turkey (Yakupoğlu et al., 2025).
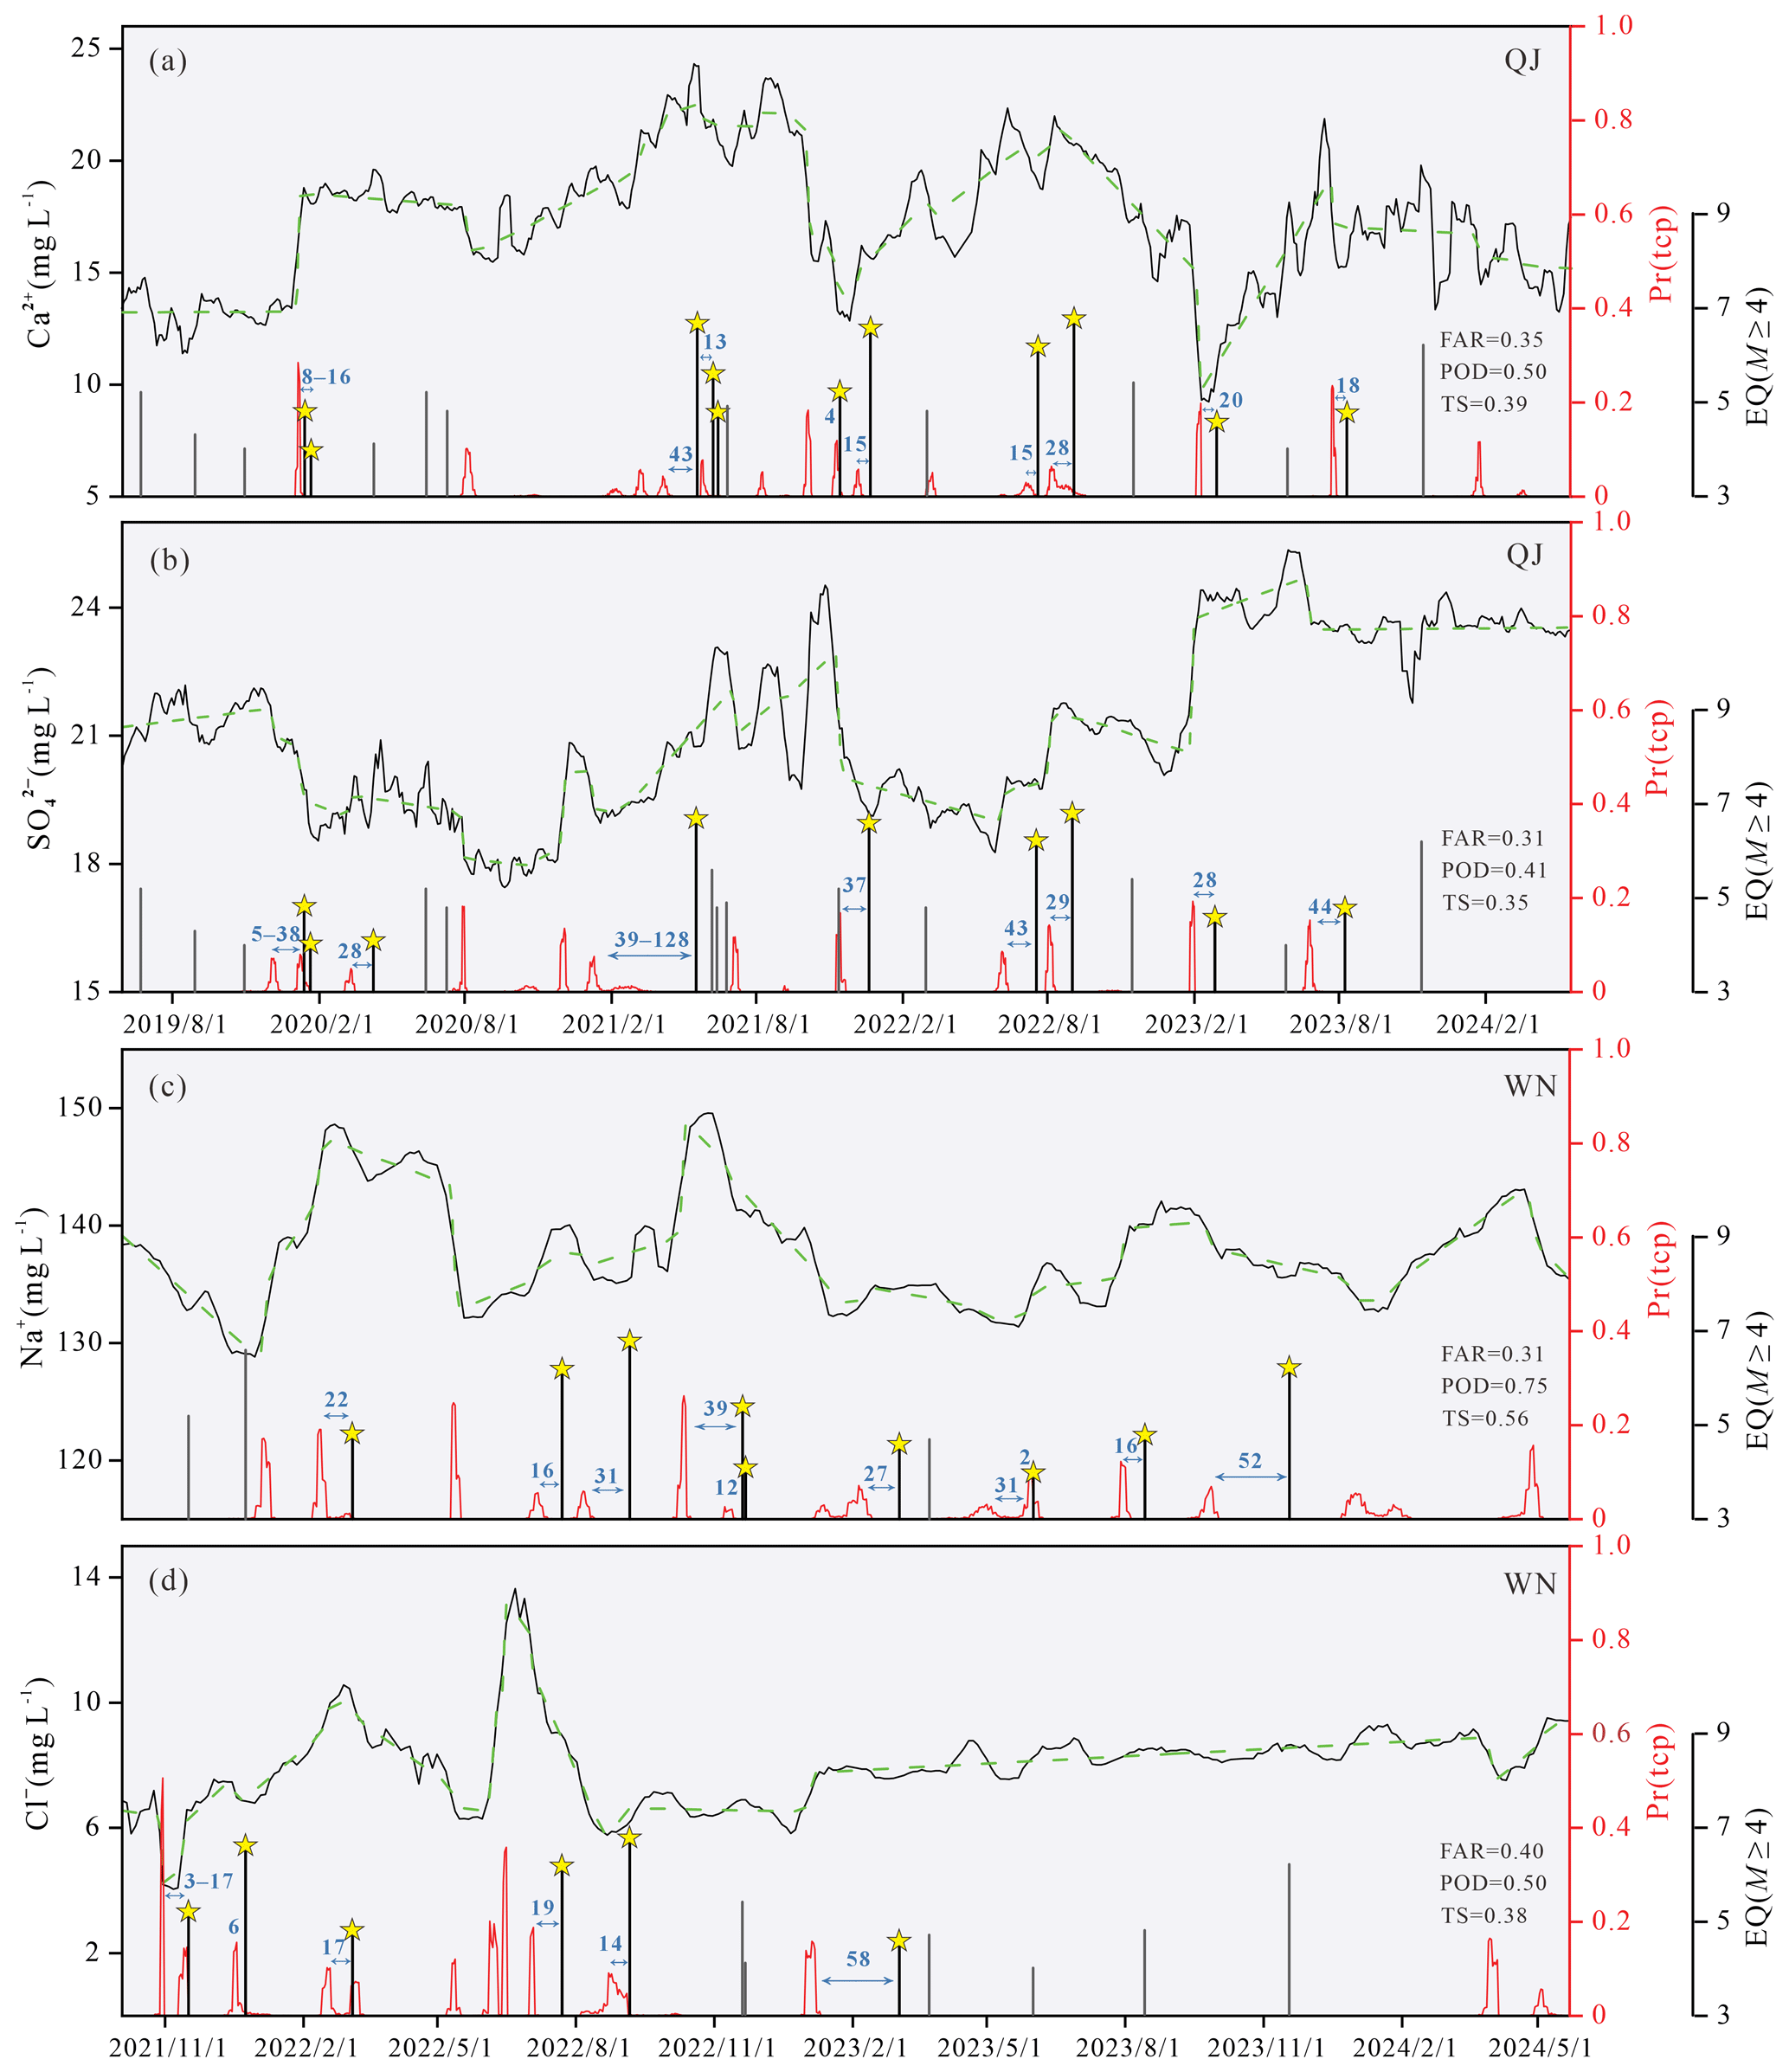
Figure 6Anomaly detection results from the Bayesian change point (BCP) analysis applied to hydrochemical component time series. The black solid line represents the component concentration after 15-day moving average. The green dashed line indicates the forecasting model of the BCP algorithm. The red solid line shows the posterior probability of change points. Yellow stars mark earthquake events. Black and gray vertical bars indicate detected and missed earthquakes, respectively. The false alarm rate (FAR), probability of detection (POD), and threat score (TS) are evaluation metrics.
Compared with the Na+ detection results at WN, the Cl− time series produces two false positives for 2022 and misses three earthquakes for 2023 (Fig. 6c, d). This result suggests that the analysis requires a longer time series and is highly sensitive to previous distribution settings. Larger-amplitude component changes often overshadow smaller-amplitude variations, which makes the latter difficult to detect and more prone to missed detections or false positives. In addition, most BCP methods have a fundamental limitation: they inherently perform retrospective analysis on complete time series. Specifically, identifying a change point at time ti relies on data collected after ti (t>ti), making real-time, forward earthquake forecasting unfeasible with short-term data sequences (Piersanti et al., 2016). According to the BCP analysis results, change-point detection for earthquake forecasting should be viewed as a supplementary approach for anomaly detection model to locate anomaly timing, guide parameter optimization, and conduct comparative verification.
4.4 Model parameters
4.4.1 Seismic response time threshold
The anomaly detection model in this study establishes forecasting rules based on the temporal correlation between precursor anomalies and earthquake events. The seismic response time threshold (Tth) plays a crucial role in determining both forecasting performance and practical value. Tth is defined as the maximum allowable time interval between anomaly detection and earthquake occurrence. This threshold is a critical parameter that strikes a balance between accuracy and timeliness. Increasing Tth expands the monitoring window and captures more potentially correlated abnormal signals, but it considerably reduces the time resolution of forecasting. Conversely, decreasing Tth enhances temporal precision but may risk omitting valid precursor signals owing to shorter observation periods.
To improve the accuracy of the anomaly detection model in predicting earthquake timing, the nonlinear effects of Tth on predictive performance are systematically explored via an incremental increase of Tth from 5 to 70 days in 5-day steps. This increase determines key inflection points across multiple hydrochemical components during threshold optimisation (Fig. S6). As Tth increases from 5 to 45 days, the model performance improves considerably, with both TS and POD rising rapidly, while FAR gradually decreases. This improvement results from the extended monitoring windows, which more effectively capture the association between anomalies and seismic activities. Notably, the evaluation metrics reveal a turning point at the 45-day threshold. Beyond 45 days, the trends in TS, POD, and FAR plateaus, show minimal variations. This result is consistent with the finding that maximum cross-correlations between M0 and hydrochemical components (Cl−, SO, and δD) occur within 45 days before the earthquake (Fig. 5) and that BCP analysis detects most change points emerging within 45 days of pre-earthquake events (Fig. 6). Collectively, these results jointly define 45 days as the optimal response time threshold for hydrochemical precursors to seismic activities in the study region.
4.4.2 Free parameters
The parameter optimisation process involves quantitatively aligning observed hydrochemical data with seismic precursor anomalies. Among the five adjustable parameters (p1–p5) in the detection model, the key regulatory parameters p1 and p3 represent multiples of the sliding window values. This study emphasises on p1 and p3 to examine the impact of optimising these parameters on the performance of the anomaly detection model. The parameter ranges were based on specific seismological rationale, operational framework of model, and empirical performance limits. Specifically, the lower bound is a logical prerequisite for identifying positive anomalies, while the upper bound was determined through iterative testing. For optimisation involving ion concentration data, the model applies parameter values ranging from 1.00 to 1.20 in steps of 0.01. For optimisation involving isotopic data, which exhibit minor fluctuations, the model applies parameter values ranging from 0.985 to 1.015, with a step increment of 0.001. The model's performance is then evaluated using TS, which is employed as the primary metric due to its comprehensive integration of NA, NB, and NC, making it particularly suitable for evaluating model performance on imbalanced data. Figure 7 shows the variations in the TS under different values of p1 and p3. When p1 and p3 are small, the model becomes overly sensitive to background noise, resulting in the detection of more non-seismic signals. This effect leads to an increase in the FAR and a decrease in TS. TS improves with the rise in p1 and p3. However, when the parameters become excessively large, surpassing the actual seismic anomaly thresholds, the MAR rises sharply, which causes TS to drop below 0.35. The optimal parameter combinations for each hydrochemical component are identified at the TS peak inflection points (marked by yellow circles). The results for all evaluation metrics under varying parameters (p1 and p3) for Na+ at QJ and for SO at WN are provided in Tables S2 and S3, respectively. These sensitivity analyses demonstrate a stable model performance, confirming its robustness against parameter uncertainty. According to this method, the complete set of model parameters for all hydrochemical components at QJ and WN is provided in Table S4.
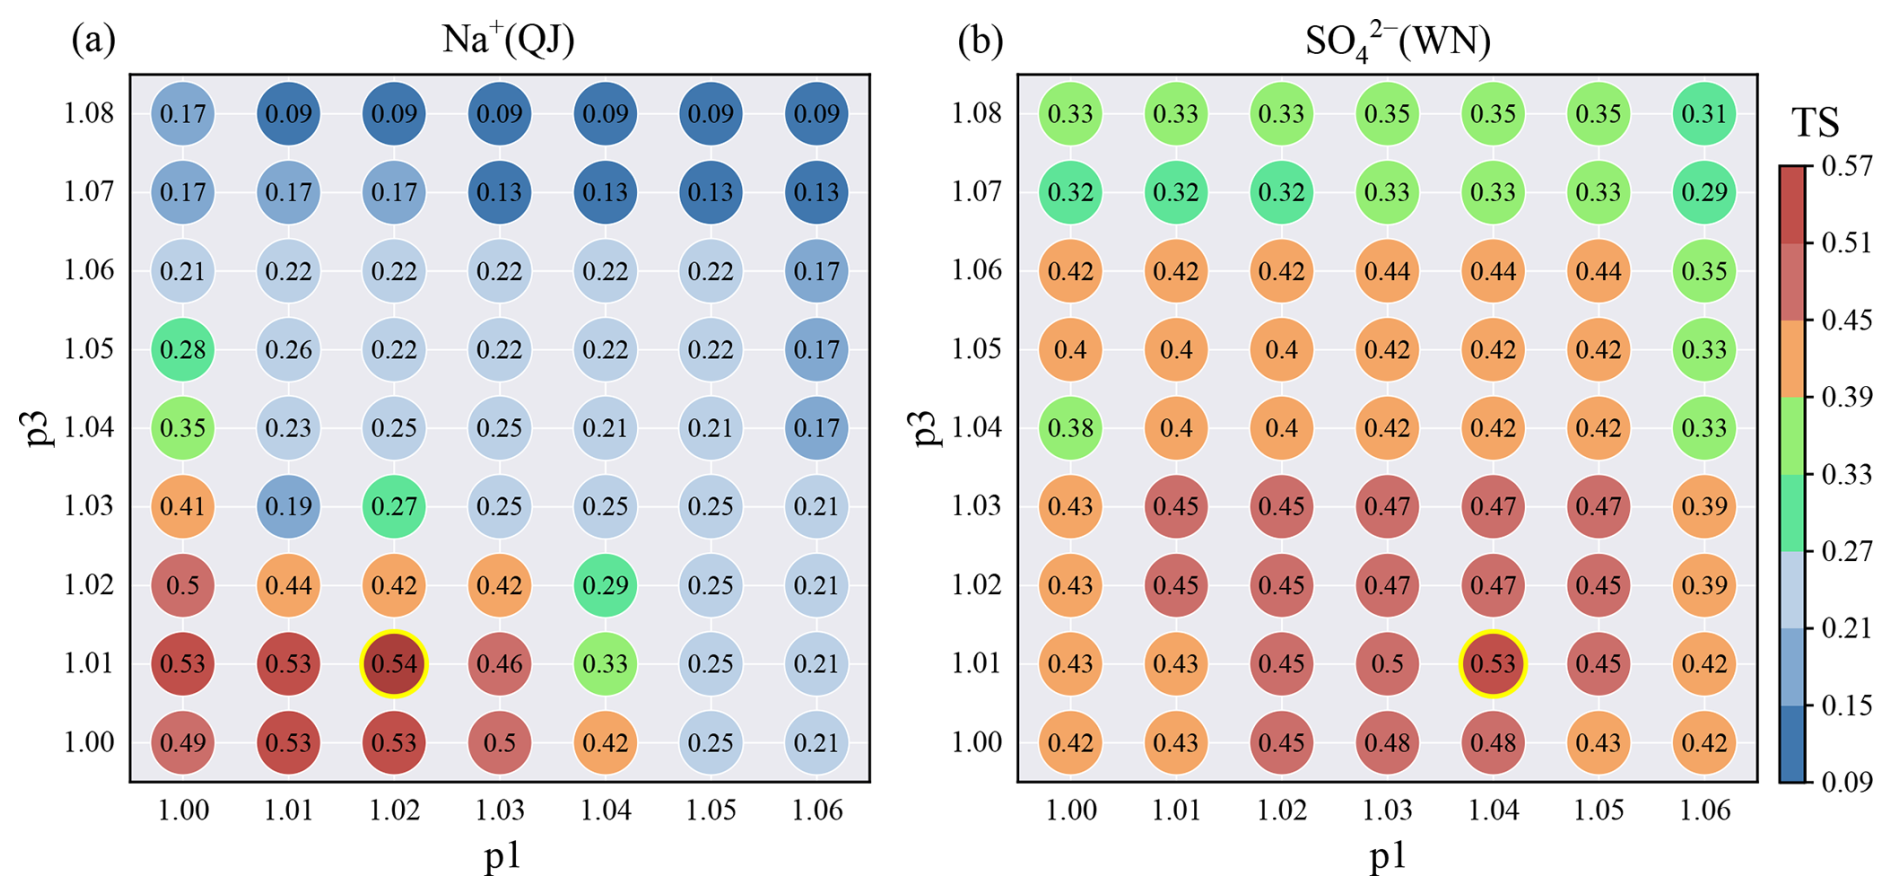
Figure 7Effect of parameters on model performance. TS varies with changes in p1 and p3 (the main free parameters p1 and p3 are used as examples). The yellow circle highlights the TS value corresponding to the optimal combination of p1 and p3.
The parameter optimisation results reveal notable differences in the optimal p1 and p3 combinations for different hydrochemical components. Hydrochemical anomalies preceding earthquakes in many regions are typically caused by the combined action of multiple mechanisms (Skelton et al., 2014; Kim et al., 2019; Hosono and Masaki, 2020). Furthermore, due to significant variations in the geochemical behavior of different hydrochemical components, components within the same thermal spring often exhibit diverse response patterns to the same earthquake. These patterns may include asynchronous variations (increase/decrease/stability) and considerable discrepancies in the magnitude of change (Shi et al., 2020; Wang et al., 2021; Tian et al., 2023). Therefore, optimising parameter combinations to create customised anomaly detection models for specific hydrochemical components at designated observation points is the critical approach in this study to enhance the model's ability to detect seismic precursor information.
4.5 Evaluation of forecasting performance
Figures 8 and 9 present the 15-day moving average time series of hydrochemical components, anomaly detection results, and earthquake events for the anomaly detection model at QJ and WN. For each component, the model successfully identifies varying numbers of pre-earthquake anomalies and triggered alarms. The model activates comprehensive alarms when anomalies are detected in three or more components simultaneously. Based on the sensitivity analysis results presented in Table S5, requiring three or more anomalous components was identified as the preferred criterion for balancing the POD and the FAR. Furthermore, this choice is hydrochemically justified by its ability to suppress random dual-component interferences stemming from a single source, as discussed previously, thereby leading to the highest TS among all tested numbers of components. As detailed in Table S6, the 1,000-iteration bootstrap resampling results provide a robust evaluation of each individual component's performance alongside the comprehensive alarm (DA). This analysis demonstrates that even at the lower bound of the 95 % confidence interval (CI), the model maintains a reliable detection capability. At QJ, the model provided 21 effective alarms for 22 earthquake events (POD = 0.95, 95 % CI: 0.85 ∼ 1.00), with 8 false alarms (FAR = 0.28, 95 % CI: 0.10 ∼ 0.45), and a TS of 0.70 with a 95 % CI of 0.53 ∼ 0.87. At WN, the model generated 10 accurate alarms for 12 events (POD = 0.83, 95 % CI: 0.60 ∼ 1.00), 5 false alarms (FAR = 0.33, 95 % CI: 0.12 ∼ 0.60), and a TS of 0.59 with a 95 % CI of 0.35 ∼ 0.82. To further evaluate the robustness of these results and exclude potential overfitting, the model performance was compared against a stochastic baseline model through 1,000 Monte Carlo iterations (Fig. S7). The actual TS values for QJ (0.70) and WN (0.59) are significantly higher than the mean null TS (0.39 and 0.41, respectively), with p-values of p < 0.001 for QJ and p = 0.025 for WN. This statistical evidence confirms that the model's forecasting performance is statistically significant and demonstrably superior to random chance. Although the obtained FAR remains relatively high, which is a common challenge in earthquake anomaly detection that prioritises detection sensitivity, the TS provides a comprehensive metric that balances both POD and FAR. Compared with the internal single-component anomaly detection results from our model, the multicomponent synergistic alarm results exhibit higher TS values (Figs. 8, 9, 10). Their CIs are relatively narrower than those of individual components (Table S6), indicating that the synergistic approach effectively enhances the stability and reduces the uncertainty. The multicomponent synergy mitigates the effects of geochemical behavior differences among components, reduces environmental interference on individual ions/ion pairs, and consequently enhances the accuracy of the anomaly detection model. These results indicate the practical value of the multicomponent model for anomaly identification, though its practical application would benefit from integration with other geophysical, geodetic, and geological data to further reduce the false alarm burden. The results from the anomaly detection model and BCP analysis are mutually corroborative; however, the anomaly detection model exhibits superior sensitivity in processing nonlinear time series data. Taking QJ as an example, the model achieves POD values of 0.70 and 0.59 for Ca2+ and SO detection results, respectively (Figs. 5 and 8), representing significant improvements over the BCP analysis results (0.50 and 0.41). The model also can accurately detect subtle anomalies that the BCP analysis may miss.
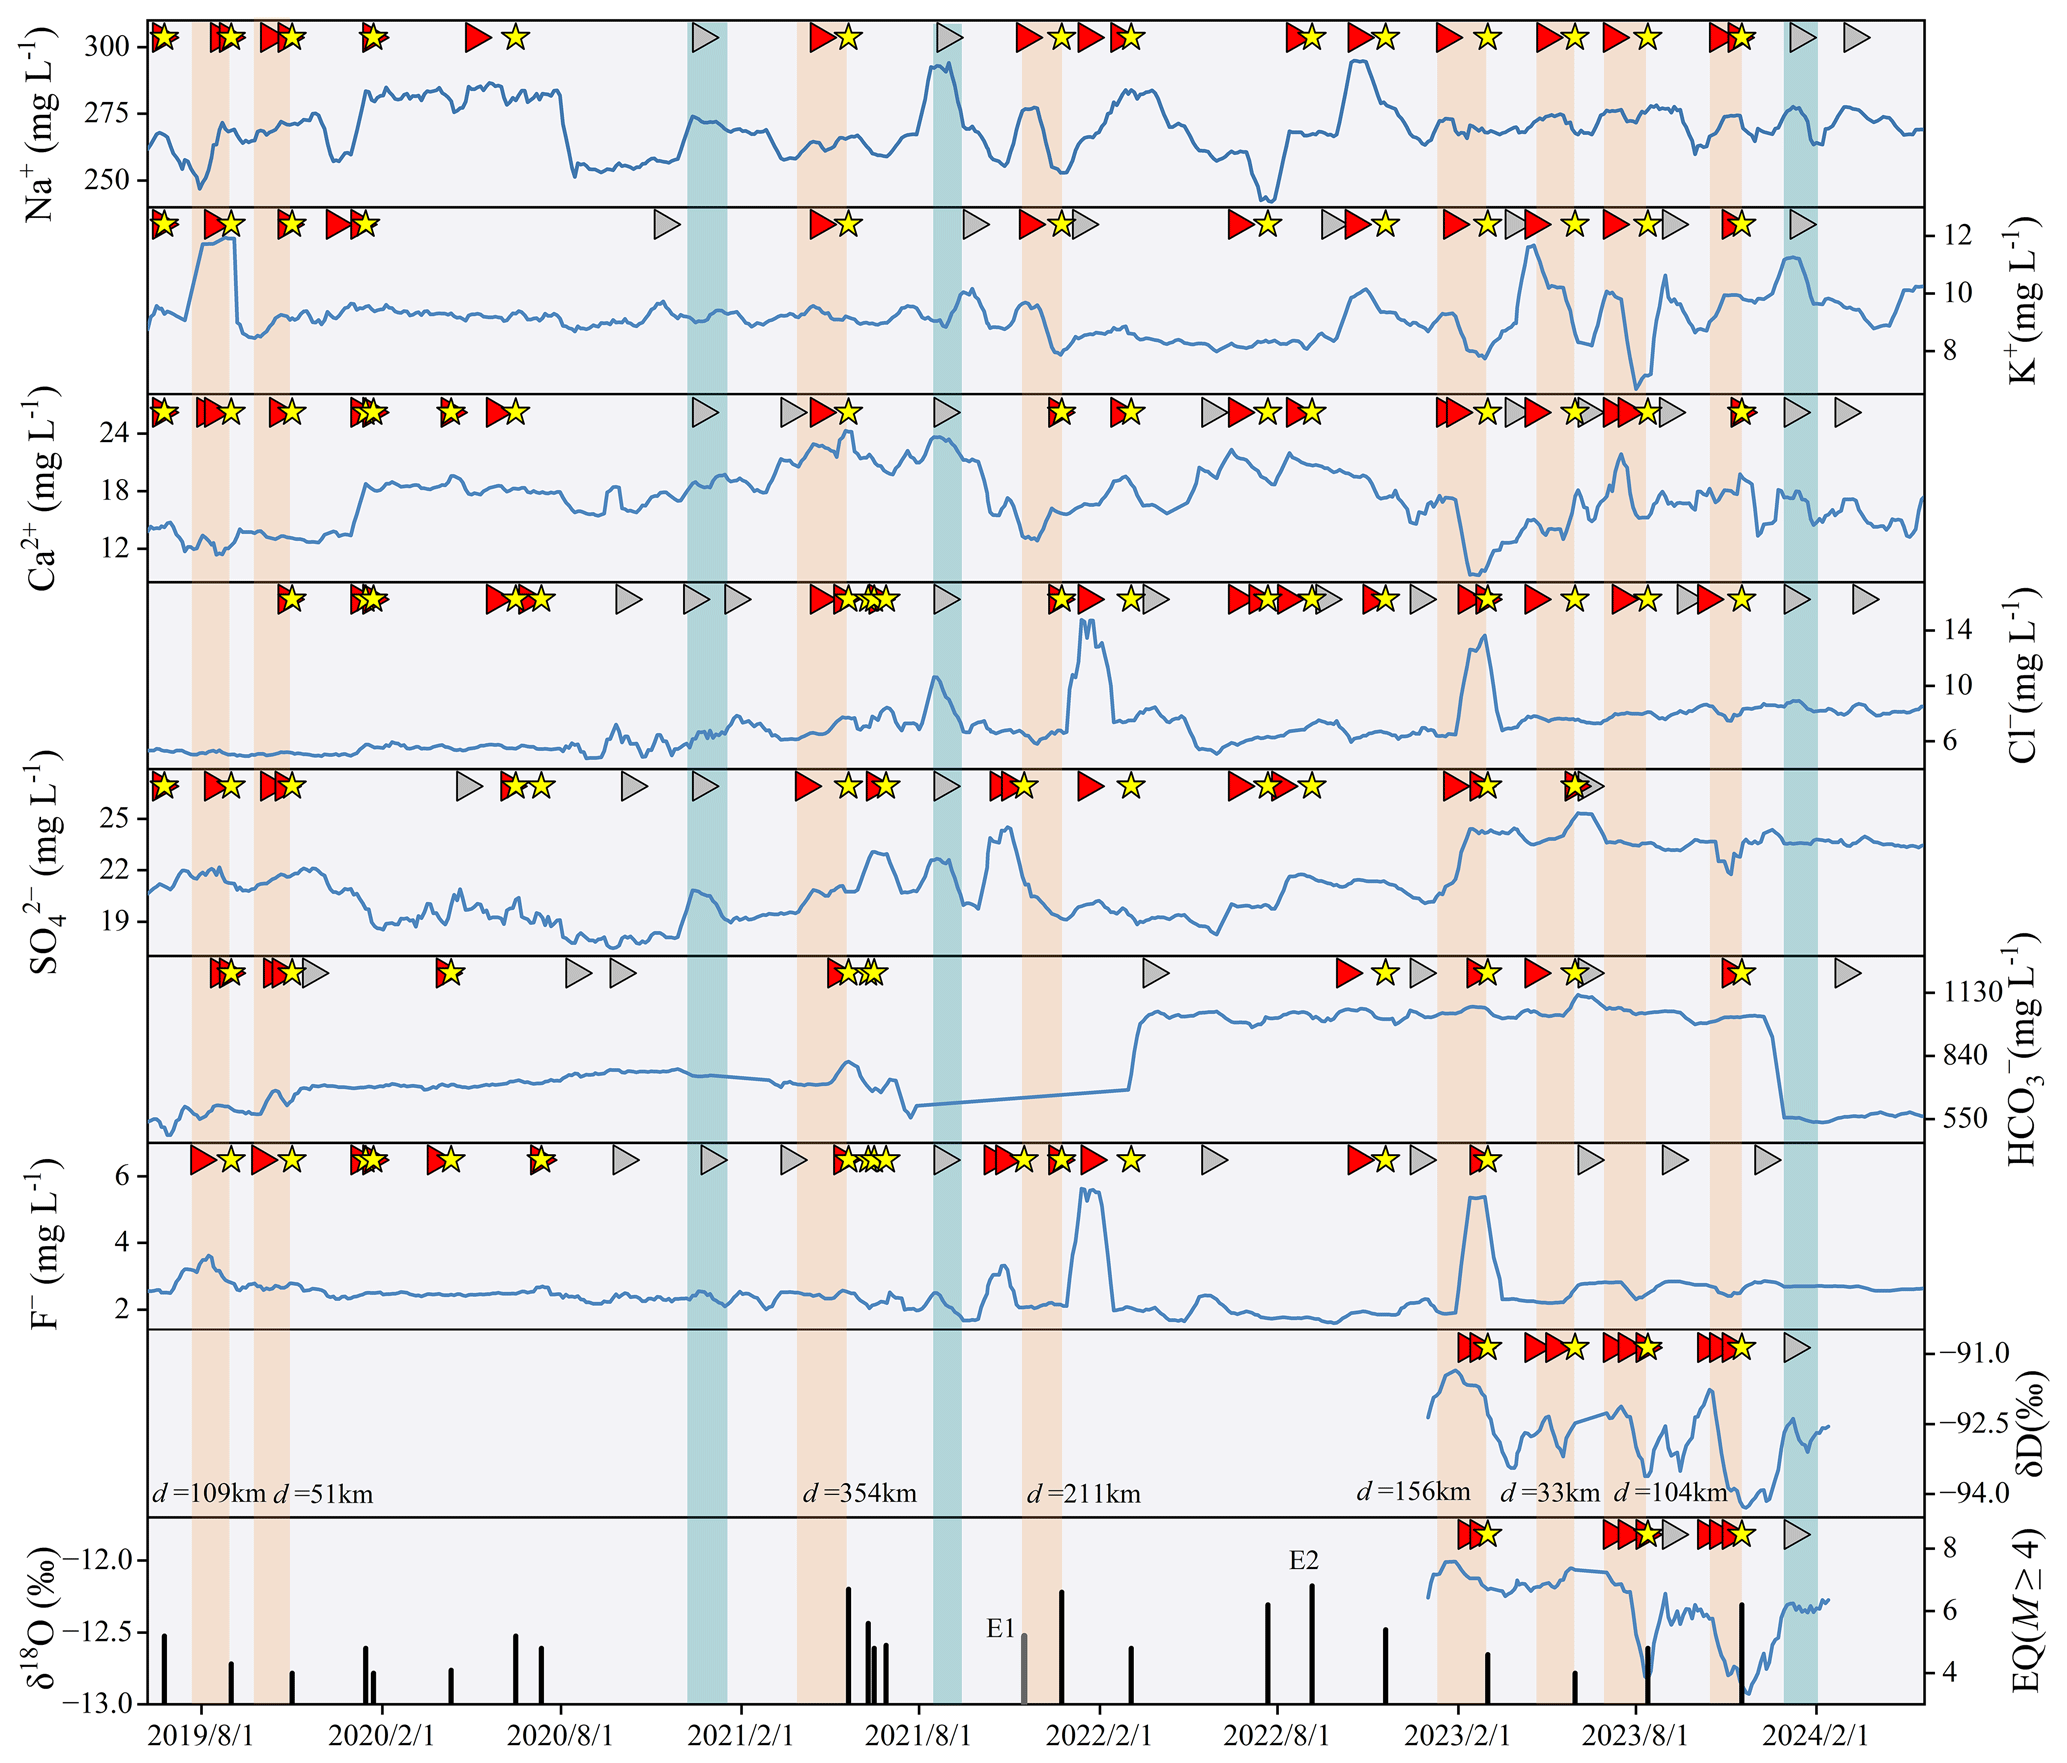
Figure 8Results of the anomaly detection model applied to hydrochemical component time series from Qujiang spring. The blue curve represents the hydrochemical component time series after a 15-day moving average. Red and gray triangles indicate accurate alarms and false alarms, respectively. Yellow stars mark successfully reported earthquakes. Black and gray vertical bars depict detected and missed earthquakes based on the algorithm's comprehensive alarm (triggered by ≥3 components), respectively. Orange-red boxes highlight synchronous successful alarms triggered by six or more components. Grayish-blue boxes mark synchronous false alarms triggered by five or more components.
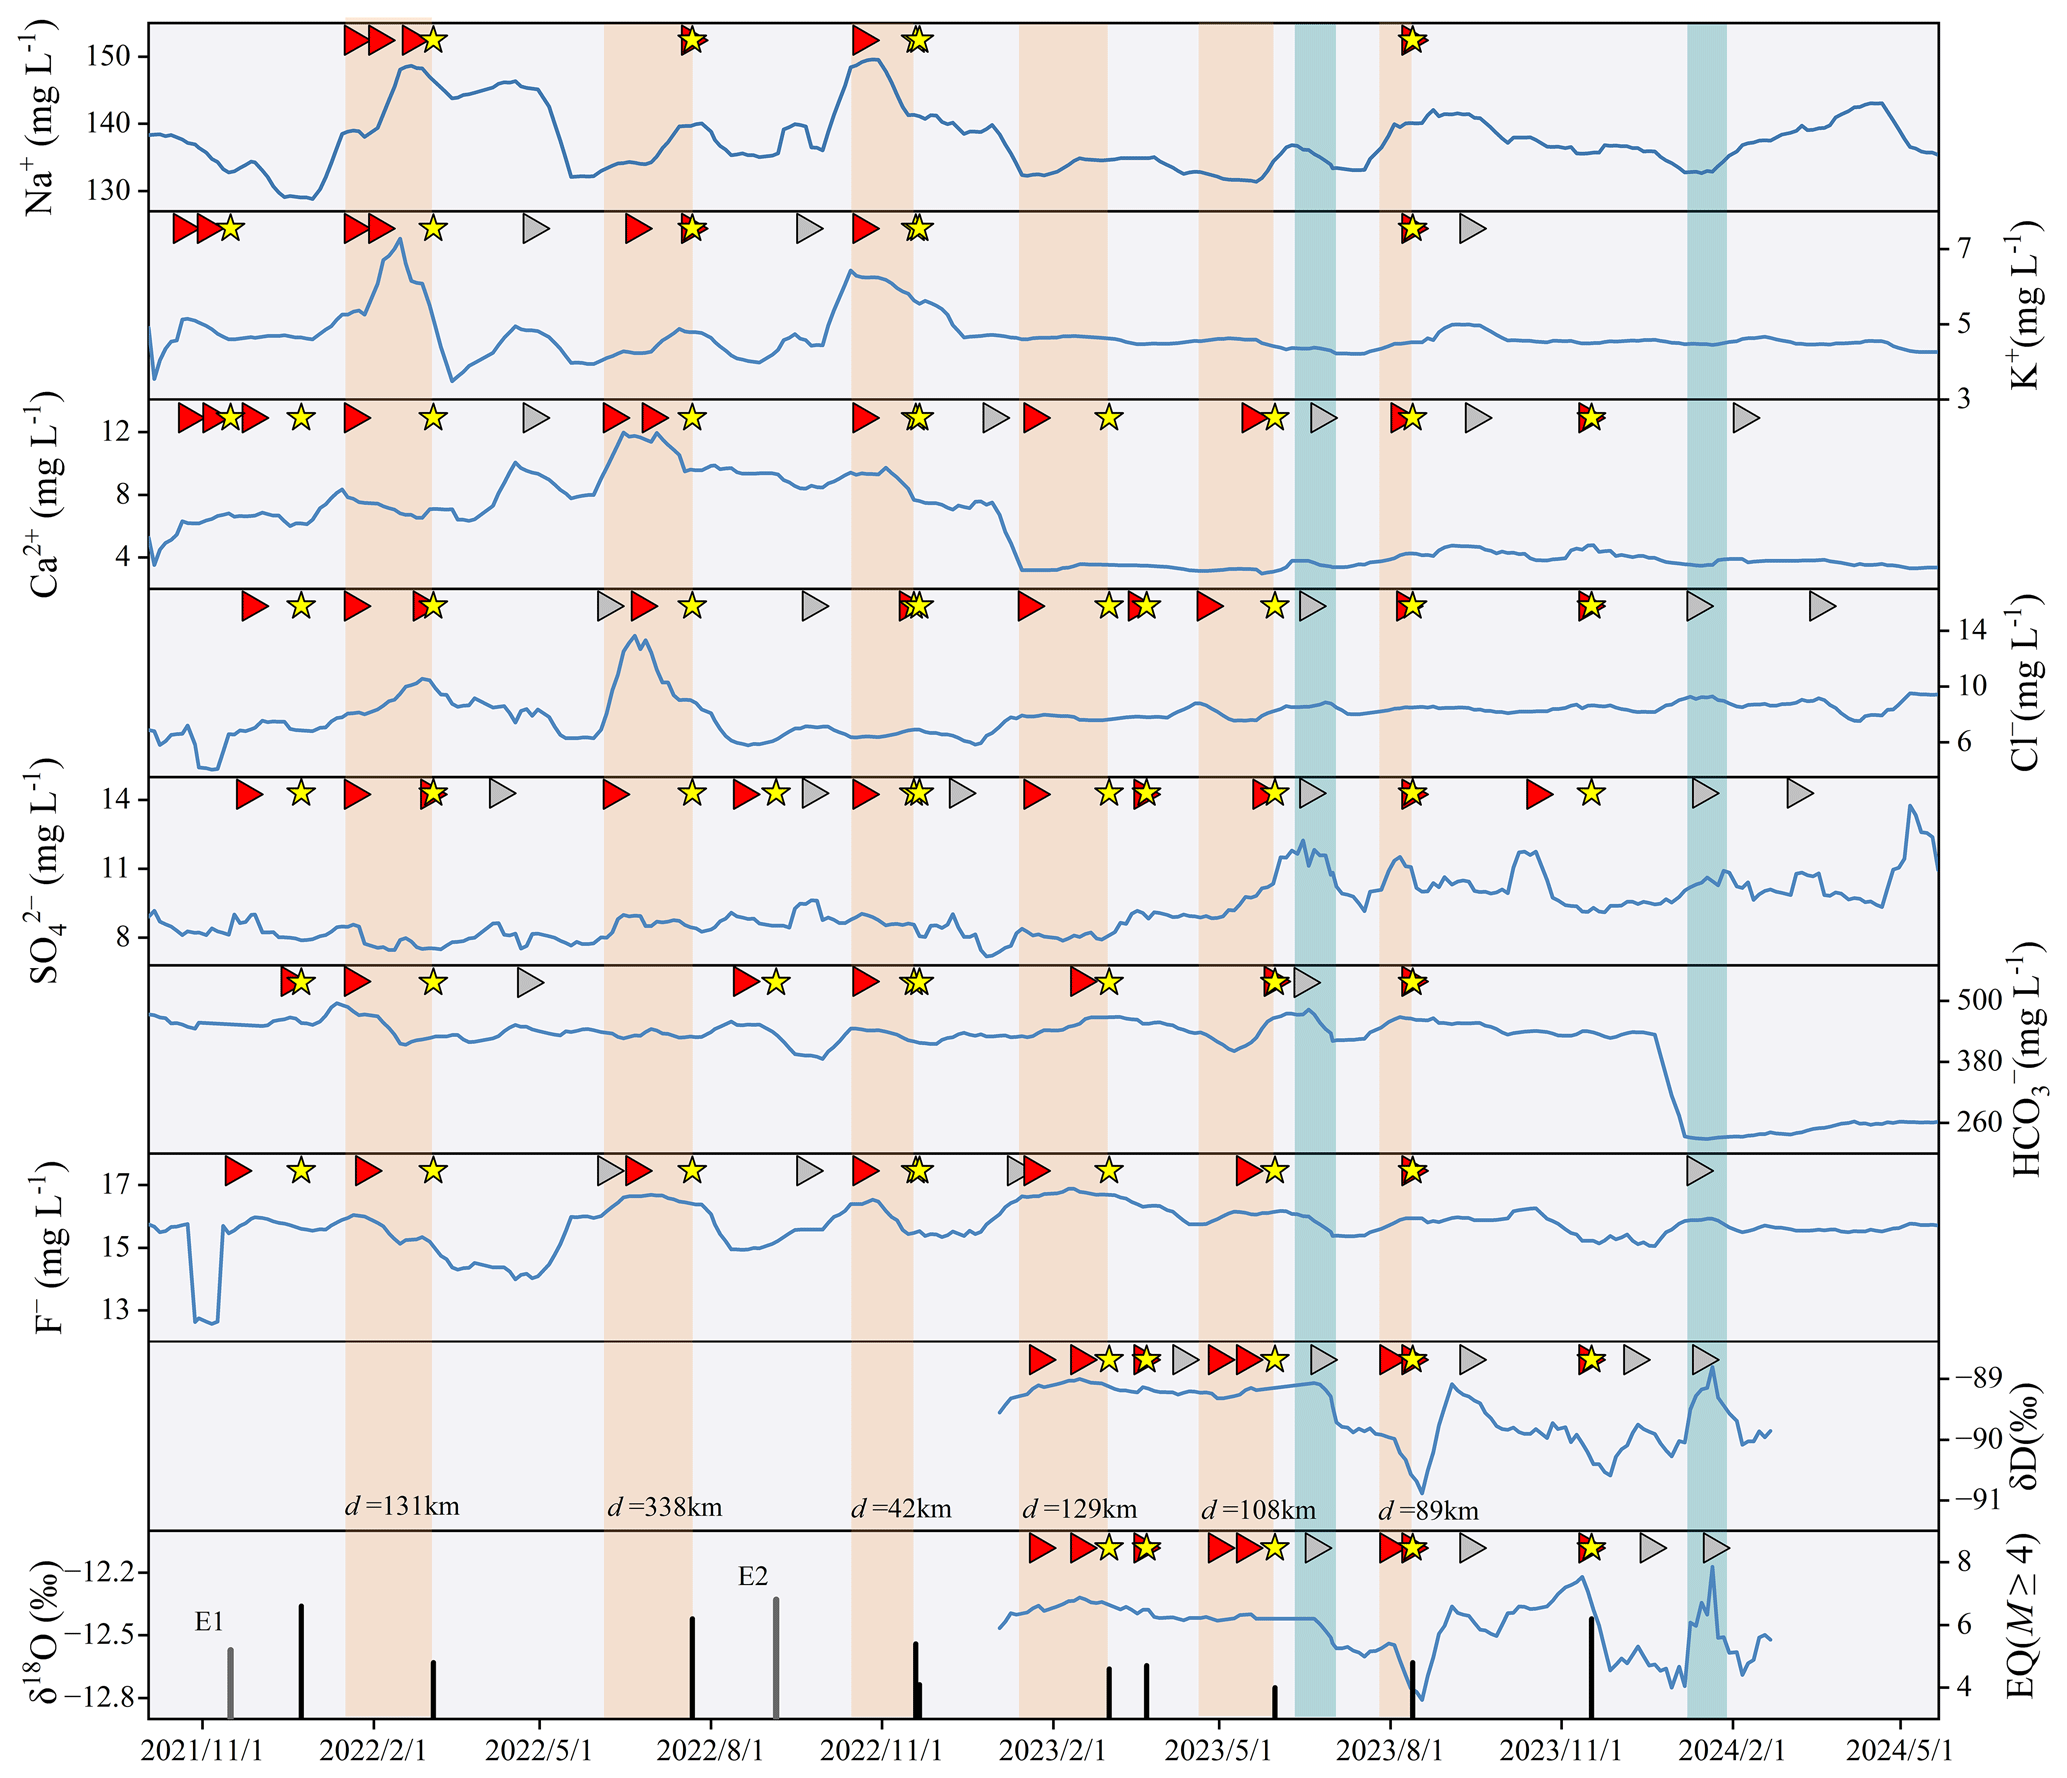
Figure 9Results of the anomaly detection model applied to hydrochemical component time series from Wana spring. The same notes as above for Fig. 8.
Owing to variations in the geochemical behaviors of hydrochemical components, their response direction and magnitudes to earthquakes differ. The direction of anomalous variations (increase/decrease) is crucial for understanding the response mechanisms and improving event identification. A detailed statistical analysis of the anomaly directions for components across the two hot springs was performed (Table S7). The results reveal that certain pre-seismic anomalies manifest as intense bidirectional fluctuations. However, a definitive criterion to define a “dominant direction” for such oscillatory signals is lacking. Initial statistical results indicate that the frequency of anomalous increases (57 % ∼ 77 %) is higher than that of decreases for most ions (e.g., Na+, Cl−, SO). While these findings provide tentative support for the assumption that “increases” possess a stronger correlation with seismic events (Skelton et al., 2014, 2024; Yakupoğlu et al., 2025), the current sample size and statistical depth remain exploratory. Additionally, as observed regarding δD and δ18O, statistics indicate that these components exhibit a higher frequency of decreases (60 % ∼ 75 %), and change directions can vary across different components for the same earthquake event. Such divergence among different components suggests that a simplistic, unidirectional criterion might overlook vital precursor information. Based on these findings, the existing detection model is primarily oriented toward identifying sustained positive anomalies (increases), while also accounting for recovery phases following a decline (i.e., the increase following a decrease). Nevertheless, effectively incorporating these specific directional variations into earthquake forecasting remains a challenge at this stage.
Given these complexities and the lack of academic consensus on response mechanisms, this study evaluates the forecasting efficacy of individual components through the anomaly detection model to identify the effective indicators for the study area. A comparison of the TS values of each component's alarm results in QJ and WN (Fig. 10) reveals that in the two thermal springs of the study area, the TS values for Na+, Ca2+, Cl−, SO, δD, and δ18O detection (around 0.50) are relatively high. This observation suggests that these components can serve as sensitive indicators for strong earthquake forecasting in the study area. In general, QJ in the study area exhibits a more sensitive response to earthquakes. In addition, the anomalies are categorised into multiple consecutive anomalies and single anomalies (Figs. 8 and 9). This phenomenon is more pronounced in the stable isotope time series, likely because isotopic changes are more sensitive and tend to trigger multiple alarm signals before an earthquake. The higher sensitivity of δD and δ18O may be attributed to the fact that stable water isotopes are more conservative than hydrochemical ions, meaning they typically track water sources and mixing without being significantly affected by short-term water-rock interactions (Skelton et al., 2014, 2024; Su et al., 2025). The hydrochemical ions are easily altered by short-term chemical processes, such as dissolution or precipitation, cation exchange, adsorption or desorption, and redox reactions, making their signals more complex.
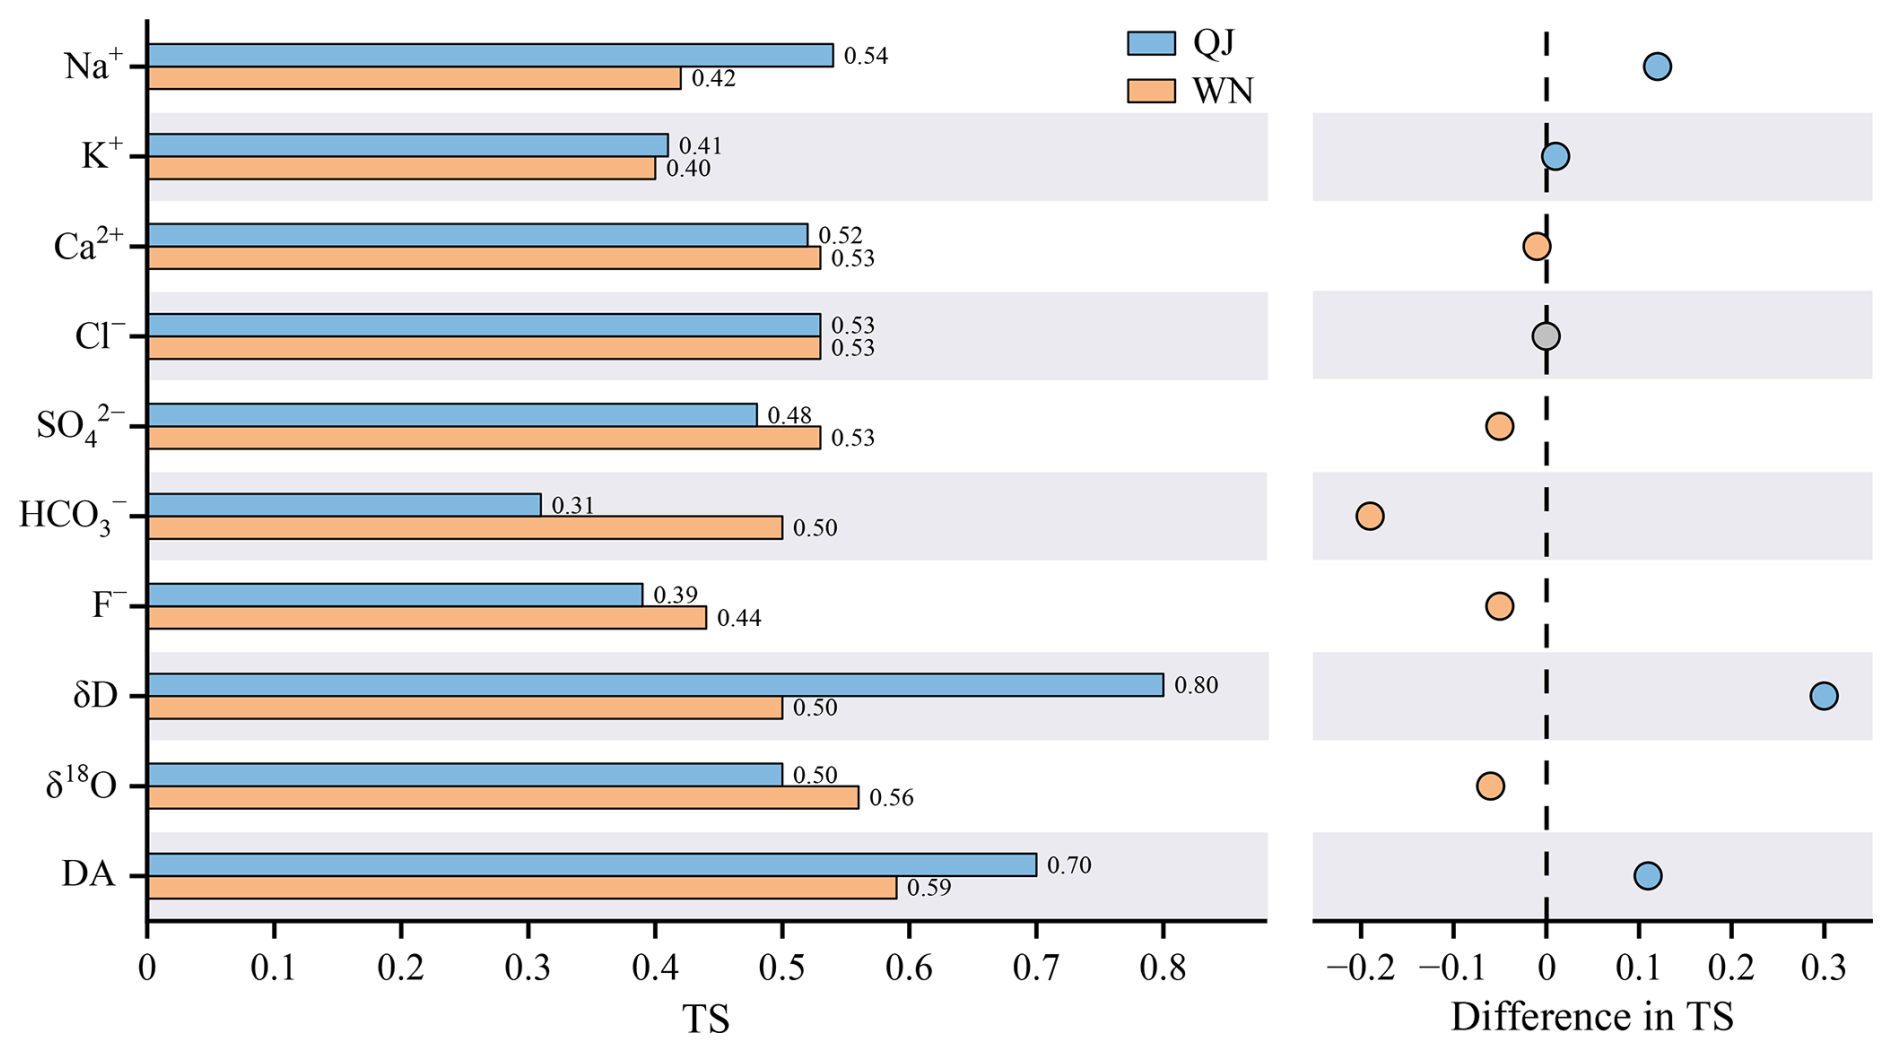
Figure 10TS values of anomaly detection model results for hydrochemical components. DA denotes comprehensive alarms triggered by the model.
Among the earthquakes for which the earthquake preparation zone covers both thermal springs, only two earthquakes (represented by gray vertical bars in Figs. 8 and 9) fail to induce multicomponent anomalies before the earthquake. Earthquake E1 causes no synchronous anomalies at either spring, suggesting that E1 has a limited impact on regional tectonic activity. For E2 (epicentral distance km), WN shows no alarm response, while QJ reacts effectively. This discrepancy is likely related to WN's location on the eastern boundary of the SYB, where stress accumulation mainly affects QJ, which is also located on the eastern border. The muted response in WN is likely attributed to the blocking effects of the RRF (Li et al., 2024; Shao et al., 2024). The similar abnormal response sensitivity of different springs to the same earthquake demonstrates regional-scale hydrochemical impacts from earthquake preparation and confirms the stable and reliable performance of the anomaly detection model.
In Figs. 8 and 9, the orange-red boxes represent model results of successfully predicted earthquakes, identified through synchronised anomalies in six or more hydrochemical components. The width of the boxes, which indicates the interval between the appearance of anomalies and earthquake occurrence, shows no clear correlation with magnitude or epicentral distance. This observation highlights the complex dynamic mechanisms and regional structural differences that are involved in the earthquake preparation process. The geochemical anomalies often arise from the combined effects of multiple mechanisms, such as fluid mixing following aquifer breaching or fresh mineral surface exposure during micro fracturing, resulting in increased concentrations of hydrochemical component (Thomas, 1988). Spatially, the number of hydrochemical components (Y) exhibiting synchronous anomalies correlates with earthquake magnitude and epicentral distance (Fig. 11). Earthquakes that induce synchronous anomalies in six or more hydrochemical components have epicentral distances of less than 150 km for earthquakes with magnitudes less than 6.0 (M<6.0), while this distance extends to approximately 400 km for earthquakes with magnitudes greater than or equal to 6.0 (M≥6.0). Among these significant events (Y≥6), a robust linear correlation exists between magnitude and distance (n=9, R=0.85, P=0.004). This correlation provides a quantitative basis for seismic risk assessment, allowing for the estimation of a potential earthquake's minimum magnitude or its maximum likely distance based on observed hydrochemical precursors. Although it is difficult to quantify the exact impact of magnitude and distance on the number of components exhibiting synchronous anomalies, as magnitude increases or distance decreases, the number of components with synchronous anomalies detected by the model tends to increase. Especially, the result reveals a distinct delineation in trend at the M=6.0 threshold. For earthquakes where M<6.0, the number of anomalous components is primarily sensitive to epicentral distance; shorter distances yield a higher count of synchronous anomalous components due to proximity to the stress-release center. For earthquakes where M≥6.0, magnitude appears to be a more dominant driver than distance, although limited data renders this a preliminary trend rather than a statistically significant finding. This is potentially due to high-energy release triggering regional-scale crustal stress perturbations that induce hydrochemical anomalies even at remote distances. The overall findings align with the positive correlation between the scale of earthquake energy release and the number of anomalies, as confirmed by the hydrochemical monitoring results (Li et al., 2022). Therefore, a significant relationship is present between the temporal variation of hydrochemical components and earthquakes in the study region. The number of components exhibiting synchronous anomalies can be used as an effective criterion for forecasting, with higher count of anomalous components generally corresponding to larger earthquake magnitudes or shorter epicentral distances.
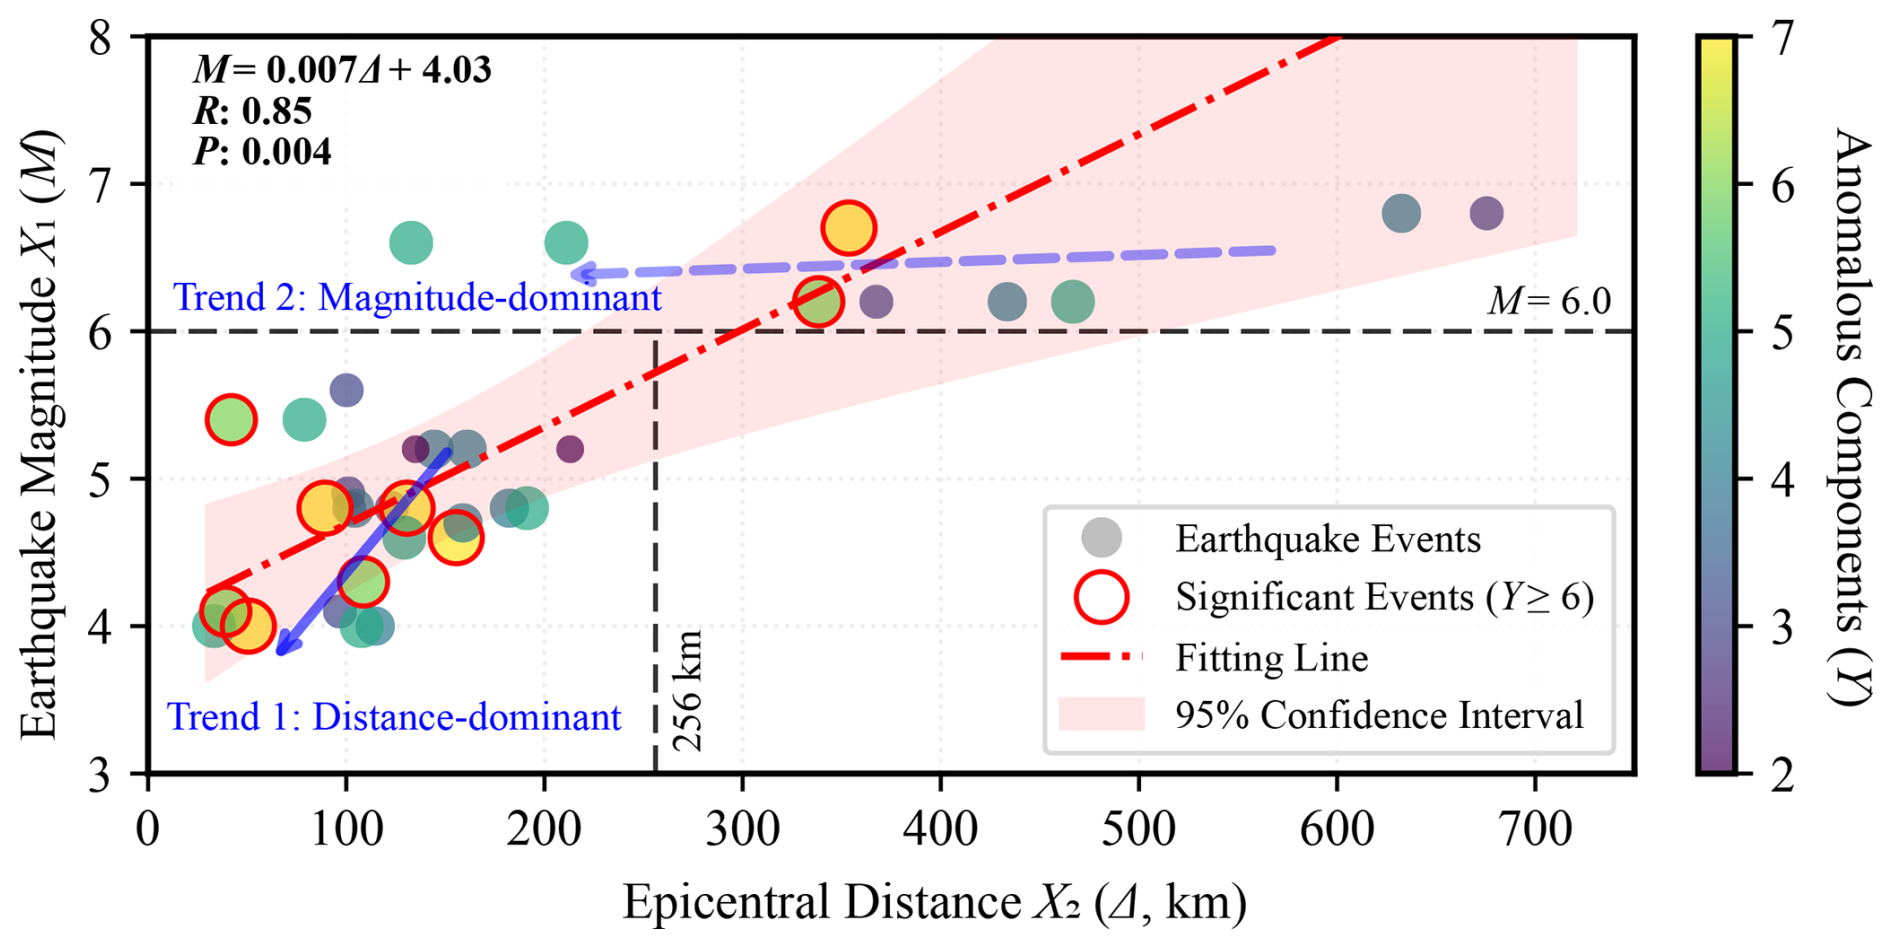
Figure 11Relationship between the number of synchronous anomalous hydrochemical components, earthquake magnitude, and epicentral distance.
Furthermore, this study reveals that hot springs closer to the epicentre tend to exhibit a greater number of components with synchronous anomalies during the same earthquake. Pre-earthquake hydrochemical anomalies generally manifest on a regional scale, which means different thermal springs can not only validate each other in terms of anomaly timing for forecasting purposes but also help identify the closest springs to the epicentre based on the number of synchronous anomalous components. This approach helps define potential earthquake preparation zones. According to this approach, a dense thermal spring monitoring network provides more opportunities for spatial earthquake forecasting.
4.6 Limitations and prospects
This study focuses on evaluating the performance of anomaly detection models in predicting the timing of earthquakes with magnitudes ≥4. One potential cause of false alarms could be anomalous fluctuations in hydrochemical components triggered by seismic activities with magnitudes <4 in areas near thermal springs. Four days after the second synchronised false alarm involving five components (Fig. 8, grayish-blue boxes), an M2.6 earthquake occurred 3 km from QJ. This occurrence suggests that high-frequency false alarms may not solely result from non-seismic fluid anomalies, but could also reflect the model's limited ability to distinguish anomalies caused by microseisms. According to this finding, it is recommended to establish observation station networks and optimise algorithms to enable hierarchical alarm systems. Approximately 30 days after the last synchronized false alarms at the two thermal springs (Figs. 8 and 9), an M4.1 earthquake occurred outside the expected preparation zone. This highlights another key limitation: the current algorithm relies on an effective and widely used isotropic underground structure assumption, which restricts model's adaptability to account for directional tectonic complexities and spatial heterogeneity.
Despite these constraints, the multicomponent anomaly detection model developed here demonstrates robust performance, achieving a POD exceeding 83 % and a TS ranging from 59 % to 70 %. Within the field of geochemical forecasting, these results are comparable to the positive predictive values of 62 % to 85 % derived from the statistical analysis reported by Skelton et al. (2024) in Iceland. While that study utilized the oscillatory behaviors of δD and δ18O, and deuterium excess to trace groundwater mixing associated with crustal dilation and fracture mineralization before earthquakes, the current approach seeks to complement these isotopic insights by integrating them with multiple major ions. Synchronous fluctuations in ion concentrations can provide additional anomaly signals when isotopic shifts are subtle, reflecting a wider range of water-rock interaction processes. The model results also align with the 70 % POD and R-score of 0.6 described by Zhu et al. (2024) in the southeast coastal region of China, where ion ratios and PCA indicators were combined with the best-performing LOF algorithm to identify outliers. In contrast, the present model focuses on refining anomaly identification performance and classifying anomaly intensity by assessing the number of components with synchronous anomalies across multiple components. By leveraging the differentiated responses of various components to crustal stress, this synergistic analysis significantly enhances the identification of subtle pre-earthquake signals. Mechanistically, this multi-indicator integration provides a more objective reflection of pre-earthquake stress changes and fluid mixing processes, while offering certain advantages in reducing environmental interference, consistent with the tectonic stress drivers discussed by Yakupoğlu et al. (2025).
Although the specific parameters in this study are local, the underlying method framework could be transferable when specific selection criteria for monitoring sites are met. Monitoring stations should be situated in active tectonic regions, such as western Türkiye (Yakupoğlu et al., 2025), or even at major fault intersections, such as XJF and RRF intersection zone (Shao et al., 2024). Priority should be given to thermal springs with high discharge temperatures, as such temperatures typically indicate deep circulation and their hydrochemical components may carry deep-seated information while minimizing interference from meteoric water. Furthermore, the hydrogeochemical background of the spring should be clearly defined to distinguish its hydrogeochemical characteristics from shallow water bodies and to facilitate the monitoring of fluid mixing processes. Springs with a long observation duration, where historical earthquakes have induced data oscillations, should be prioritized. According to findings in Iceland (Skelton et al., 2024), these oscillatory signals originate from the physical coupling of crustal dilation and fracture mineralization, representing a reliable geochemical signature during the stress build-up phase. Preference is also given to springs with bubbling gases to expand gas-chemical observations. Additionally, sites that could incorporate specific crustal deformation-sensitive isotopic monitoring indicators are ideal, such as He isotopes in the Noto Peninsula (Kagoshima et al., 2025) or H-O-C isotopes in the Xianshuihe fault (Yu et al., 2026). In such cases, the implementation of differentiated weighting based on indicator sensitivity offers potential for further refining the precision of anomaly detection. The model can be practically applied to platforms such as the China Seismic Experimental Site (CSES) and the European Plate Observing System (EPOS), where the future of earthquake forecasting benefits from multiple-method synergy. For instance, cross-validating hydrochemical anomalies with b-value evaluation (Chang et al., 2025) or ionospheric TEC (Baselga, 2024) establishes a robust, multi-layered verification process. Within this hierarchical system, broad-scale geophysical tools effectively flag regional risks. Conversely, site-specific, multicomponent hydrochemical model provides the confirmation necessary for small-scale, short-term forecasting.
A multicomponent synergistic anomaly detection model is developed using five years of continuous hydrochemical monitoring data to enable real-time forecasting of M≥4 earthquakes in the study area. Model parameters are optimised for each component, and their impact on anomaly detection performance is evaluated to identify applicable hydrochemical indicators for strong earthquake forecasting. The multicomponent synergistic anomaly detection findings reveal a clear connection between hydrochemical variations and seismic activity, offering valuable insights, and establishing a new paradigm for precursor identification in earthquake forecasting. The main findings are summarised as follows:
A 45-day response time threshold for hydrochemical components to M≥4 earthquakes is established as the optimal period for capturing hydrochemical precursors for short-term earthquake forecasting in the study region. Parameters are optimised for individual components based on their distinct geochemical responses to seismic stress, significantly enhancing the model's performance and adaptability.
The anomaly detection model features adaptive alarm criteria and demonstrates reliable real-time anomaly detection capabilities, yielding a POD of 0.95 and a TS of 0.70 at the QJ site, whereas the WN site maintains a POD of 0.83 and a TS of 0.59. It also displays similar anomaly detection results across different springs in response to the same earthquake. The model identifies Na+, Ca2+, Cl−, SO, δD, and δ18O as effective indicators for earthquake forecasting, all of which exhibit outliers before earthquakes, with TS above 0.50 at the individual indicator level. Among these, δD and δ18O exhibit higher sensitivity to seismic activity, characterized by multiple consecutive anomalies pre-ceding an earthquake.
The newly proposed multicomponent synergistic alarm mechanism for hydrochemistry overcomes the limitations of single-parameter methods and substantially improves the model's overall performance in earthquake forecasting. The number of hydrochemical components with synchronous anomalies provides a reliable criterion for forecasting, with higher count of anomalous components typically correlating to larger earthquake magnitudes or shorter epicentral distances. A dense thermal spring monitoring network can facilitate cross-verification across multiple sites for time-based forecasting and offer enhanced capabilities for spatial forecasting.
The continuous monitoring data from thermal springs can be found at Mendeley Data, Version 1 (https://doi.org/10.17632/xkd75cyfmb.1, Shao, 2025).
The supplement related to this article is available online at https://doi.org/10.5194/hess-30-3575-2026-supplement.
WS: conceptualization, formal analysis, investigation, methodology, software, validation, visualization, writing original draft. YL: conceptualization, funding acquisition, methodology, project administration, supervision, review and editing. XZ: data curation, funding acquisition, investigation, project administration, resources. ZC: supervision, validation. HL: methodology, software. ZL: visualization, review and editing. CL: supervision, review and editing. YW: data curation, resources, validation. ZZ: data curation, resources, validation. YW: investigation, supervision. HH: visualization, review and editing. SF: investigation.
The contact author has declared that none of the authors has any competing interests.
Publisher's note: Copernicus Publications remains neutral with regard to jurisdictional claims made in the text, published maps, institutional affiliations, or any other geographical representation in this paper. The authors bear the ultimate responsibility for providing appropriate place names. Views expressed in the text are those of the authors and do not necessarily reflect the views of the publisher.
We would like to thank the editor Heng Dai and the four anonymous reviewers for their constructive comments, Aimin Li for programming assistance, Pan Xiong for helpful discussions, and all personnel involved in long-term sampling and analysis.
This work was jointly supported by National Natural Science Foundation of China (grant nos. 42373067 and 42073063), Special Fund of the Institute of Earthquake Forecasting, China Earthquake Administration (grant no. CEAIEF20230301), Deep Earth Probe and Mineral Resources Exploration National Science and Technology Major Project (grant no. 2024ZD1000503), China Seismic Experimental Site, National Major Science and Technology Infrastructure project (grant no. 2022-000052-74-01-000068), This work is a contribution to IGCP Project 724.
This paper was edited by Heng Dai and reviewed by four anonymous referees.
An, Z., Zhan, Y., Fan, Y., Chen, Q., and Liu, J.: Investigation of the characteristics of geoelectric field earthquake precursors: a case study of the Pingliang observation station, China, Ann. Geophys., 63, PA545, https://doi.org/10.4401/ag-7982, 2020.
Andrén, M., Stockmann, G., Skelton, A., Sturkell, E., Mörth, C. M., Guðrúnardóttir, H. R., Keller, N. S., Odling, N., Dahrén, B., Broman, C., Balic-Zunic, T., Hjartarson, H., Siegmund, H., Freund, F., and Kockum, I.: Coupling between mineral reactions, chemical changes in groundwater, and earthquakes in Iceland, J. Geophys. Res. Solid Earth, 121, 2315–2337, https://doi.org/10.1002/2015jb012614, 2016.
Appelo, C.A.J. and Postma, D.: Geochemistry, Groundwater and Pollution (2nd ed.), A.A. Balkema Publishers, Leiden, 17 pp., ISBN 04-1536-421-3, 2005.
Barbieri, M., Franchini, S., Barberio, M. D., Billi, A., Boschetti, T., Giansante, L., Gori, F., Jonsson, S., Petitta, M., Skelton, A., and Stockmann, G.: Changes in groundwater trace element concentrations before seismic and volcanic activities in Iceland during 2010–2018, Sci. Total Environ., 793, 148635, https://doi.org/10.1016/j.scitotenv.2021.148635, 2021.
Baselga, S.: Artificial Intelligence for Earthquake Prediction: A Preliminary System Based on Periodically Trained Neural Networks Using Ionospheric Anomalies, Appl. Sci., 14, 10895, https://doi.org/10.3390/app142310859, 2024.
Brockwell, P. J. and Davis, R. A.: Time Series: Theory and Methods (Second Edition), Springer-Verlag, New York, 407 pp., ISBN978-1-4419-0319-8, 1991.
Castellana, L. and Biagi, P.: Detection of hydrogeochemical seismic precursors by a statistical learning model, Nat. Hazards Earth Syst. Sci., 8, 1207–1216, 2008.
Chang, Y., Wang, R., Han, P., Wang, J., Miao, M., Zeng, Z., Wu, W., Jiang, C., Meng, L., Shi, H., and Hattori, K.: b-Value Evaluation and Applications to Seismic Hazard Assessment, Entropy, 27, 958. https://doi.org/10.3390/e27090958, 2025.
Chatfield, C.: The Analysis of Time Series: Theory and Practice, Chapman and Hall, New York, 173 pp., ISBN 978-0-412-14180-5, 1975.
Chaudhuri, H., Bari, W., Iqbal, N., Bhandari, R. K., Ghose, D., Sen, P., and Sinha, B.: Long range gas-geochemical anomalies of a remote earthquake recorded simultaneously at distant monitoring stations in India, Geochem. J., 45, 137–156, 2011.
Chen, J. and Zhu, S.: Spatial and temporal b-value precursors preceding the 2008 Wenchuan, China, earthquake (Mw = 7.9): implications for earthquake prediction, Geomat. Nat. Hazards Risk, 11, 1196–1211, https://doi.org/10.1080/19475705.2020.1784297, 2020.
Chen, Y.: Earthquake prediction: Retrospect and prospect, Sci. China Earth Sci., 39, 1633–1658, 2009 (in Chinese).
Colman, D. R., Lindsay, M. R., Harnish, A., Bilbrey, E. M., Amenabar, M. J., Selensky, M. J., Fecteau, K. M., Debes II, R. V., Stott, M. B., Shock, E. L., and Boyd, E. S.: Seasonal hydrologic and geologic forcing drive hot spring geochemistry and microbial biodiversity, Environ. Microbiol., 23, 4034–4053, https://doi.org/10.1111/1462-2920.15617, 2021.
Deng, Q., Zhang, P., Ran, Y., Yang, X., Min, W., and Chu, Q.: Basic characteristics of active tectonics of China (in Chinese), Sci. China Earth Sci., 32, 1020–1030 and 1057, 2002.
Di Matteo, L., Dragoni, W., Azzaro, S., Pauselli, C., Porreca, M., Bellina, G., and Cardaci, W.: Effects of earthquakes on the discharge of groundwater systems: The case of the 2016 seismic sequence in the Central Apennines, Italy, J. Hydrol., 583, https://doi.org/10.1016/j.jhydrol.2019.124509, 2020.
Dobrovolsky, I., Zubkov, S., and Miachkin, V.: Estimation of the size of earthquake preparation zones, Pure Appl. Geophys., 117, 1025–1044, 1979.
Du, G., Su, S., Chang, X., Ren, H., Huo, Z., and Zhang, X.: Hydrogeochemical characteristics and genesis of Hongshuilantang Hot Spring and its water temperature anomalies during the Rushan earthquake swarm in Eastern China, Front. Earth Sci., 10, https://doi.org/10.3389/feart.2022.1088240, 2023.
Elmaghraby, E. K. and Lotfy, Y. A.: Differentiation between earthquake radon anomalies and those arising from nuclear activities, Appl. Radiat. Isot., 67, 208–211, https://doi.org/10.1016/j.apradiso.2008.07.003, 2009.
Feng, X., Zhong, J., Yan, R., Zhou, Z., Tian, L., Zhao, J., and Yuan, Z.: Groundwater Radon Precursor Anomalies Identification by EMD-LSTM Model, Water, 14, https://doi.org/10.3390/w14010069, 2022.
Fleischer, L. F. and Mogro-Campero, A.: Association of subsurface radon changes in Alaska and the northeastern United States with earthquakes, Geochim. Cosmochim. Acta., 49, 1061–1071, https://doi.org/10.1016/0016-7037(85)90319-9, 1985.
Fu, C., Yang, T., Tsai, M., Lee, L., Liu, T., Walia, V., Chen, C., Chang, W., Kumar, A., and Lai, T.: Exploring the relationship between soil degassing and seismic activity by continuous radon monitoring in the Longitudinal Valley of eastern Taiwan, Chem. Geol., 469, 163–175, https://doi.org/10.1016/j.chemgeo.2016.12.042, 2017.
Gori, F. and Barberio, M. D.: Hydrogeochemical changes before and during the 2019 Benevento seismic swarm in central-southern Italy, J. Hydrol., 604, https://doi.org/10.1016/j.jhydrol.2021.127250, 2022.
Haider, T., Barkat, A., Hayat, U., Ali, A., Awais, M., Alam, A., Rehman, K., and Shah, M. A.: Identification of radon anomalies induced by earthquake activity using intelligent systems, J. Geochem. Explor., 222, https://doi.org/10.1016/j.gexplo.2020.106709, 2021.
Hanks, T. C. and Kanamori, H.: A moment magnitude scale, J. Geophys. Res. Solid Earth, 84, 2348–2350, https://doi.org/10.1029/JB084iB05p02348, 1979.
Hosono, T. and Masaki, Y.: Post-seismic hydrochemical changes in regional groundwater flow systems in response to the 2016 Mw7.0 Kumamoto earthquake, J. Hydrol., 580, https://doi.org/10.1016/j.jhydrol.2019.124340, 2020.
Hosono, T., Yamada, C., Manga, M., Wang, C. Y., and Tanimizu, M.: Stable isotopes show that earthquakes enhance permeability and release water from mountains, Nat. Commun., 11, 2776, https://doi.org/10.1038/s41467-020-16604-y, 2020.
Ide, K., Hosono, T., Kagabu, M., Fukamizu, K., Tokunaga, T., and Shimada, J.: Changes of groundwater flow systems after the 2016 Mw7.0 Kumamoto earthquake deduced by stable isotopic and CFC-12 compositions of natural springs, J. Hydrol., 583, https://doi.org/10.1016/j.jhydrol.2020.124551, 2020.
Ingebritsen, S. E. and Manga, M.: Hydrogeochemical precursors, Nat. Geosci., 7, 697–698, https://doi.org/10.1038/ngeo2261, 2014.
Ingebritsen, S. E. and Manga, M.: Earthquake Hydrogeology, Water Resour. Res., 55, 5212–5216, https://doi.org/10.1029/2019wr025341, 2019.
Kagoshima, T., Sano, Y., Takahata, N., Kawamoto, Y., Shibata, T., Li, Y., Morishita, T., Hiramatsu, Y., and Nakajima, J.: Helium isotope anomaly in groundwater prior to the 2024 Noto Peninsula earthquake, Nat. Comm., 16, 10414. https://doi.org/10.1038/s41467-025-65717-9, 2025.
Kim, J., Lee, J., Petitta, M., Kim, H., Kaown, D., Park, I., Lee, S., and Lee, K.: Groundwater system responses to the 2016 ML5.8 Gyeongju earthquake, South Korea, J. Hydrol., 576, 150–163, https://doi.org/10.1016/j.jhydrol.2019.06.044, 2019.
Lee, S., Cheong, J., Park, Y., Ha, K., Kim, Y., Kim, S., and Hamm, S.: Groundwater level changes on Jeju Island associated with the Kumamoto and Gyeongju earthquakes, Geomat. Nat. Hazards Risk, 8, 1783–1791, https://doi.org/10.1080/19475705.2017.1387181, 2017.
Li, C., Zhou, X., Yan, Y., Ouyang, S., and Liu, F.: Hydrogeochemical Characteristics of Hot Springs and Their Short-Term Seismic Precursor Anomalies along the Xiaojiang Fault Zone, Southeast Tibet Plateau, Water, 13, https://doi.org/10.3390/w13192638, 2021.
Li, Y., Liu, M., Li, Y., and Chen, L.: Active crustal deformation in southeastern Tibetan Plateau: The kinematics and dynamics, Earth Planet. Sci. Lett., 523, https://doi.org/10.1016/j.epsl.2019.07.010, 2019.
Li, Y., Chen, Z., Hu, L., Su, S., Zheng, C., Liu, Z., Lu, C., Zhao, Y., Liu, J., He, H., Sun, F., Xu, C., Zhou, X., Du, J., Xu, S., and Zheng, G.: Advances in seismic fluid geochemistry and its application in earthquake forecasing, Chin. Sci. Bull., 67, 1404–1420, https://doi.org/10.1360/TB-2021-0955, 2022 (in Chinese with English abstract).
Li, Y., Fang, Z., Zhang, C., Li, J., Bao, Z., Zhang, X., Liu, Z., Zhou, X., Chen, Z., and Du, J.: Research progress and prospect of seismic fluid geochemistry in short-imminent earthquake prediction, Seismol. Geol., 45, 593–621, https://doi.org/10.3969/j.issn.0253-4967.2023.03.001, 2023 (in Chinese with English abstract).
Li, Y., Gao, Y., Tian, J., and Wang, Q.: Rayleigh phase velocity and azimuthal anisotropy from high dense seismic arrays reveal strong control of block boundary faults on crustal material migration in SW China, J. Asian Earth Sci., 276, https://doi.org/10.1016/j.jseaes.2024.106337, 2024.
Luo, Z., Zhou, X., He, M., Liang, J., Li, J., Dong, J., Tian, J., Yan, Y., Li, Y., Liu, F., Ouyang, S., Liu, K., Yao, B., Wang, Y., and Zeng, Z.: Earthquakes evoked by lower crustal flow: Evidence from hot spring geochemistry in Lijiang-Xiaojinhe fault, J. Hydrol., 619, https://doi.org/10.1016/j.jhydrol.2023.129334, 2023.
Ma, L., Qiao, X., Min, L., Fan, B., and Ding, X.: Geological Atlas of China, Geology Press, Beijing, 1–348, ISBN: 9787116021921, 2002 (in Chinese).
Martinelli, G.: Previous, Current, and Future Trends in Research into Earthquake Precursors in Geofluids, Geosciences, 10, https://doi.org/10.3390/geosciences10050189, 2020.
Nakagawa, K., Yu, Z., Berndtsson, R., and Hosono, T.: Temporal characteristics of groundwater chemistry affected by the 2016 Kumamoto earthquake using self-organizing maps, J. Hydrol., 582, https://doi.org/10.1016/j.jhydrol.2019.124519, 2020.
Nayak, K., Romero-Andrade, R., Sharma, G., López-Urías, C., Trejo-Soto, M. E., and Vidal-Vega, A. I.: Evaluating Ionospheric Total Electron Content (TEC) Variations as Precursors to Seismic Activity: Insights from the 2024 Noto Peninsula and Nichinan Earthquakes of Japan, Atmosphere, 15, 1492, https://doi.org/10.3390/atmos15121492, 2024.
Onda, S., Sano, Y., Takahata, N., Kagoshima, T., Miyajima, T., Shibata, T., Pinti, D. L., Lan, T., Kim, N. K., and Kusakabe, M.: Groundwater oxygen isotope anomaly before the M6.6 Tottori earthquake in Southwest Japan, Sci. Rep., 8, 4800. https://doi.org/10.1038/s41598-018-23303-8, 2018.
Petitta, M., Mastrorillo, L., Preziosi, E., Banzato, F., Barberio, M. D., Billi, A., Cambi, C., De Luca, G., Di Carlo, G., Di Curzio, D., Di Salvo, C., Nanni, T., Palpacelli, S., Rusi, S., Saroli, M., Tallini, M., Tazioli, A., Valigi, D., Vivalda, P., and Doglioni, C.: Water-table and discharge changes associated with the 2016–2017 seismic sequence in central Italy: hydrogeological data and a conceptual model for fractured carbonate aquifers, Hydrogeol. J., 26, 1009–1026, https://doi.org/10.1007/s10040-017-1717-7, 2018.
Piersanti, A., Cannelli, V., and Galli, G.: The Pollino 2012 seismic sequence: clues from continuous radon monitoring, Solid Earth, 7, 1303–1316, https://doi.org/10.5194/se-7-1303-2016, 2016.
Pritchard, M. E., Allen, R. M., Becker, T. W., Behn, M. D., Brodsky, E. E., Bürgmann, R., Ebinger, C., Freymueller, J. T., Gerstenberger, M., Haines, B., Kaneko, Y., Jacobsen, S. D., Lindsey, N., McGuire, J. J., Page, M., Ruiz, S., Tolstoy, M., Wallace, L., Walter, W. R., Wilcock, W., and Vincent, H.: New Opportunities to Study Earthquake Precursors, Seismol. Res. Lett., 91, 2444–2447, https://doi.org/10.1785/0220200089, 2020.
Rikitake, T.: Earthquake prediction: an empirical approach, Tectonophysics, 148, 19–210, https://doi.org/10.1016/0040-1951(88)90128-x, 1988.
Ruggieri, E.: A Bayesian approach to detecting change points in climatic records, Int. J. Climatol., 33, 520–528, https://doi.org/10.1002/joc.3447, 2012.
Schoenbohm, L. M., Burchfiel, B. C., Liangzhong, C., and Jiyun, Y.: Miocene to present activity along the Red River fault, China, in the context of continental extrusion, upper-crustal rotation, and lower-crustal flow, Geol. Soc. Am. Bull., 118, 672–688, https://doi.org/10.1130/b25816.1, 2006.
Seminsky, A. K. and Seminsky, K. Z.: Time-dependent variations of groundwater radon: Insights from a twelve-year study in the Baikal region, East Siberia, Russia, J. Environ. Radioact., 278, 107509, https://doi.org/10.1016/j.jenvrad.2024.107509, 2024.
Shao, W.: Continuous monitoring data from thermal springs, Mendeley Data V1 [data set], https://doi.org/10.17632/xkd75cyfmb.1, 2025.
Shao, W., Liu, Z., Li, Y., Chen, Z., Lu, C., Zhao, C., Wang, Y., Li, Q., Gao, Z., Luo, Y., Ran, H., and Fan, S.: Geochemical Characteristics of Thermal Springs and Insights Into the Intersection Between the Xiaojiang Fault and the Red River Fault, Southeastern Tibet Plateau, Geochem. Geophys. Geosystems, 25, https://doi.org/10.1029/2023gc011431, 2024.
Shi, Z., Wang, G., Manga, M., and Wang, C.: Mechanism of co-seismic water level change following four great earthquakes-insights from co-seismic responses throughout the Chinese mainland, Earth Planet. Sci. Lett., 430, 66–74, https://doi.org/10.1016/j.epsl.2015.08.012, 2015.
Shi, Z., Zhang, H., and Wang, G.: Groundwater trace elements change induced by M5.0 earthquake in Yunnan, J. Hydrol., 581, https://doi.org/10.1016/j.jhydrol.2019.124424, 2020.
Skelton, A., Andrén, M., Kristmannsdóttir, H., Stockmann, G., Mörth, C. M., Sveinbjörnsdóttir, Á., Jónsson, S., Sturkell, E., Guðrúnardóttir, H. R., Hjartarson, H., Siegmund, H., and Kockum, I.: Changes in groundwater chemistry before two consecutive earthquakes in Iceland, Nat. Geosci., 7, 752–756, https://doi.org/10.1038/ngeo2250, 2014.
Skelton, A., Sturkell, E., Mörth, C.-M., Stockmann, G., Jónsson, S., Stefansson, A., Liljedahl-Claesson, L., Wästeby, N., Andrén, M., Tollefsen, E., Gunnarsson Robin, J., Keller, N., Geirsson, H., Hjartarson, H., and Kockum, I.: Towards a method for forecasting earthquakes in Iceland using changes in groundwater chemistry, Commun. Earth Environ., 5, https://doi.org/10.1038/s43247-024-01852-3, 2024.
Soldati, G., Cannelli, V., and Piersanti, A.: Monitoring soil radon during the 2016-2017 central Italy sequence in light of seismicity, Sci. Rep., 10, 13137, https://doi.org/10.1038/s41598-020-69821-2, 2020.
Su, S., Lu, C., Li, Y., Zhou, X., Yang, M., Liu, Z., and Ren, J.: Chemical and isotopic variations of geothermal water record the enhanced water-rock interactions after seismicity in the western capital region of China, Appl. Geochem., 194, https://doi.org/10.1016/j.apgeochem.2025.106592, 2025.
Tapponnier, P., Peltzer, G., Le Dain, A. Y., Armijo, R., and Cobbold, P.: Propagating extrusion tectonics in Asia: New insights from simple experiments with plasticine, Geology, 10, https://doi.org/10.1130/0091-7613(1982)10, 1982.
Tareen, A. D. K., Asim, K. M., Kearfott, K. J., Rafique, M., Nadeem, M. S. A., Iqbal, T., and Rahman, S. U.: Automated anomalous behaviour detection in soil radon gas prior to earthquakes using computational intelligence techniques, J. Environ. Radioact., 203, 48–54, https://doi.org/10.1016/j.jenvrad.2019.03.003, 2019.
Taylor, R. G., Todd, M. C., Kongola, L., Maurice, L., Nahozya, E., Sanga, H., and MacDonald, A. M.: Evidence of the dependence of groundwater resources on extreme rainfall in East Africa, Nat. Clim. Change, 3, 374–378, https://doi.org/10.1038/nclimate1731, 2012.
Thomas, D.: Geochemical precursors to seismic activity, Pure Appl. Geophys., 126, 241–266, 1988.
Tian, J., Zhou, X., Yan, Y., He, M., Li, J., Dong, J., Liu, F., Ouyang, S., Li, Y., Tian, L., Wang, Y., Huang, T., and Pang, Z.: Earthquake-induced impulsive release of water in the fractured aquifer system: Insights from the long-term hydrochemical monitoring of hot springs in the Southeast Tibetan Plateau, Appl. Geochem., 148, https://doi.org/10.1016/j.apgeochem.2022.105553, 2023.
Tian, J., Zhu, R., Ju, C., Tian, L., and Zhou, X.: Research progress on chemical change of hot spring water in earthquake monitoring and prediction, Earthquake, 44, 97–115, https://doi.org/10.12196/j.issn.1000-3274.2024.04.007, 2024 (in Chinese with English abstract).
Tong, Y., Yang, Z., Wang, H., Gao, L., An, C., Zhang, X., and Xu, Y.: The Cenozoic rotational extrusion of the Chuan Dian Fragment: New paleomagnetic results from Paleogene red-beds on the southeastern edge of the Tibetan Plateau, Tectonophysics, 658, 46–60, https://doi.org/10.1016/j.tecto.2015.07.007, 2015.
Wang, B., Zhou, X., Zhou, Y., Yan, Y., Li, Y., Ouyang, S., Liu, F., and Zhong, J.: Hydrogeochemistry and Precursory Anomalies in Thermal Springs of Fujian (Southeastern China) Associated with Earthquakes in the Taiwan Strait, Water, 13, https://doi.org/10.3390/w13243523, 2021.
Wang, C. Y. and Manga, M.: Hydrologic responses to earthquakes and a general metric, Geofluids, 10, 206–216, https://doi.org/10.1111/j.1468-8123.2009.00270.x, 2010.
Wang, Y., Zhang, B., Hou, J., and Xu, X.: Structure and tectonic geomorphology of the Qujiang fault at the intersection of the Ailao Shan–Red River fault and the Xianshuihe–Xiaojiang fault system, China, Tectonophysics, 634, 156–170, https://doi.org/10.1016/j.tecto.2014.07.031, 2014.
Wen, X., Ma, S., Xu, X., and He, Y.: Historical pattern and behavior of earthquake ruptures along the eastern boundary of the Sichuan-Yunnan faulted-block, southwestern China, Phys. Earth Planet. Inter., 168, 16–36, https://doi.org/10.1016/j.pepi.2008.04.013, 2008.
Wen, X., Du, F., Long, F., Fan, J., and Zhu, H.: Tectonic dynamics and correlation of major earthquake sequences of the Xiaojiang and Qujiang-Shiping fault systems, Yunnan, China, Sci. China Earth Sci., 54, 1563–1575, https://doi.org/10.1007/s11430-011-4231-0, 2011.
Wen, X., Ma, S., Fang, L., Liang, M., Du, F., Long, F., and Zhao, X.: Complex structural fault system and distributed deformation across the Big Bend of the Red River fault, Yunnan, China, Phys. Earth Planet. Inter., 333, https://doi.org/10.1016/j.pepi.2022.106942, 2022.
Woith, H.: Radon earthquake precursor: A short review, Eur. Phys. J.: Spec. Top., 224(4), 611–627, https://doi.org/10.1140/epjst/e2015-02395-9, 2015.
Woith, H., Daskalopoulou, K., Zimmer, M., Fischer, T., Vlček, J., Trubač, J., Rosberg, J. E., Vylita, T., and Dahm, T.: Multi-Level Gas Monitoring: A New Approach in Earthquake Research, Front. Earth Sci., 8, https://doi.org/10.3389/feart.2020.585733, 2020.
Xu, Z., Li, H., Tang, Z., Qi, X., Li, H., and Cai, Z.: The transformation of the terrain structures of the Tibet Plateau through large-scale strike-slip faults, Acta Petrol. Sin., 27, 3157–3170, 2011 (in Chinese with English abstract).
Yakupoğlu, N., Sabuncu, A., Erbil, C., Kırkan, E., Çetin, H., and İnan, S.: Pre-earthquake hydrogeochemical anomalies in spring waters: two distinctive cases from western Türkiye, J. Hydrol., 662, https://doi.org/10.1016/j.jhydrol.2025.133920, 2025.
Yan, R., Tian, L., Wang, G., Zhong, J., Liu, J., and Zhou, Z.: Review and statistically characteristic analysis of underground fluid anomalies prior to the 2008Wenchuan MS8.0 earthquake, Chinese J. Geophys., 61, 1907–1921, https://doi.org/10.6038/cjg2018M0162, 2018 (in Chinese with English abstract).
Yan, X., Shi, Z., Wang, G., Zhang, H., and Bi, E.: Detection of possible hydrological precursor anomalies using long short-term memory: A case study of the 1996 Lijiang earthquake, J. Hydrol., 599, https://doi.org/10.1016/j.jhydrol.2021.126369, 2021.
Yan, Y., Zhou, X., Liao, L., Tian, J., Li, Y., Shi, Z., Liu, F., and Ouyang, S.: Hydrogeochemical Characteristic of Geothermal Water and Precursory Anomalies along the Xianshuihe Fault Zone, Southwestern China, Water, 14, https://doi.org/10.3390/w14040550, 2022.
Yin, A. and Harrison, T. M.: Geologic evolution of the Himalayan-Tibetan orogen, Annu. Rev. Earth Planet. Sci., 28, 211–280, https://doi.org/10.1146/annurev.earth.28.1.211, 2000.
Yu, Y., Song, H., Liang, J., Liu, X., Luo, Z., Zhao, J., Li, Z., and Xu, J.: The evidence of H-O-C isotopes in response to earthquake and the precursor anomaly index: A case study of geothermal fluids in the Xianshuihe fault, Geothermics, 134, https://doi.org/10.1016/j.geothermics.2025.103491, 2026.
Zhang, L., Guo, L., Zhou, X., Yang, Y., Shi, D., and Liu, Y.: Temporal variations in stable isotopes and synchronous earthquake-related changes in hot springs, J. Hydrol., 599, https://doi.org/10.1016/j.jhydrol.2021.126316, 2021.
Zhang, P., Deng, Q., Zhang, G., Ma, J., Gan, W., Min, W., Mao, F., and Wang, Q.: The strong earthquake activities and active tectonic blocks in China mainland, Sci. China Earth Sci., 33, 12–20, 2003 (in Chinese).
Zhang, W., Li, M., Yang, Y., Rui, X., Lu, M., and Lan, S.: Implications of groundwater level changes before near field earthquakes and its influencing factors - several earthquakes in the vicinity of the Longmenshan-Anninghe fault as an example, Front. Earth Sci., 13, https://doi.org/10.3389/feart.2025.1541346, 2025.
Zhao, Y., Liu, Z., Li, Y., Hu, L., Chen, Z., Sun, F., and Lu, C.: A case study of 10 years groundwater radon monitoring along the eastern margin of the Tibetan Plateau and in its adjacent regions: Implications for earthquake surveillance, Appl. Geochem., 131, https://doi.org/10.1016/j.apgeochem.2021.105014, 2021.
Zhou, X., Yan, Y., Fang, W., Wang, W., Shi, H., and Li, P.: Short-Term Seismic Precursor Anomalies of Hydrogen Concentration in Luojishan Hot Spring Bubbling Gas, Eastern Tibetan Plateau, Front. Earth Sci., 8, https://doi.org/10.3389/feart.2020.586279, 2021.
Zhu, R., Yang, F., Zhou, X., Tian, J., Zhang, Y., He, M., Li, J., Dong, J., and Li, Y.: Anomaly Detection Using Machine Learning in Hydrochemical Data From Hot Springs: Implications for Earthquake Prediction, Water Resour. Res., 60, https://doi.org/10.1029/2023wr034748, 2024.